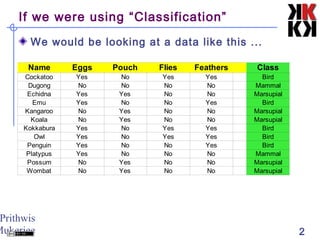
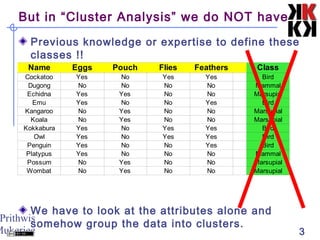
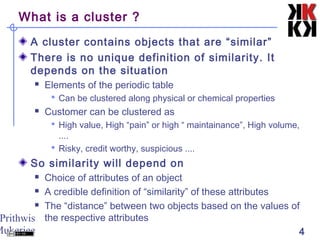
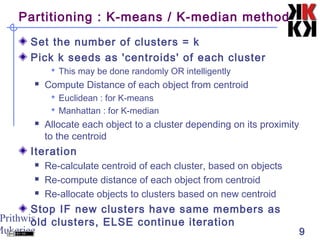
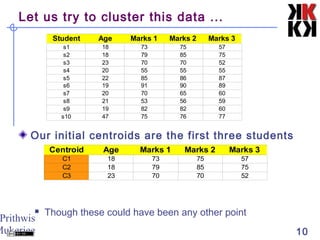
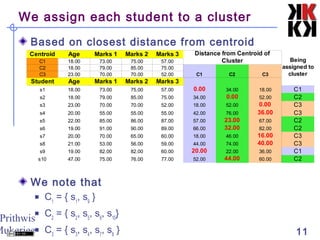
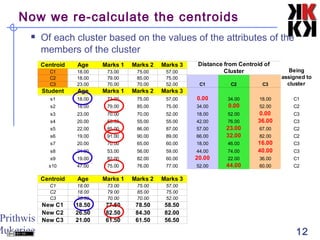
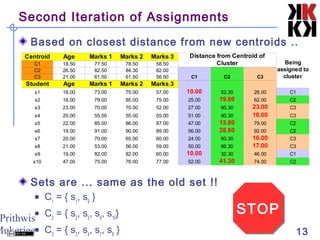
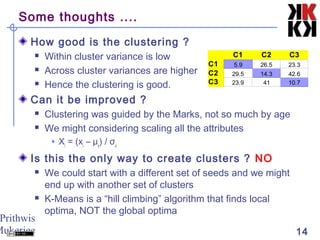
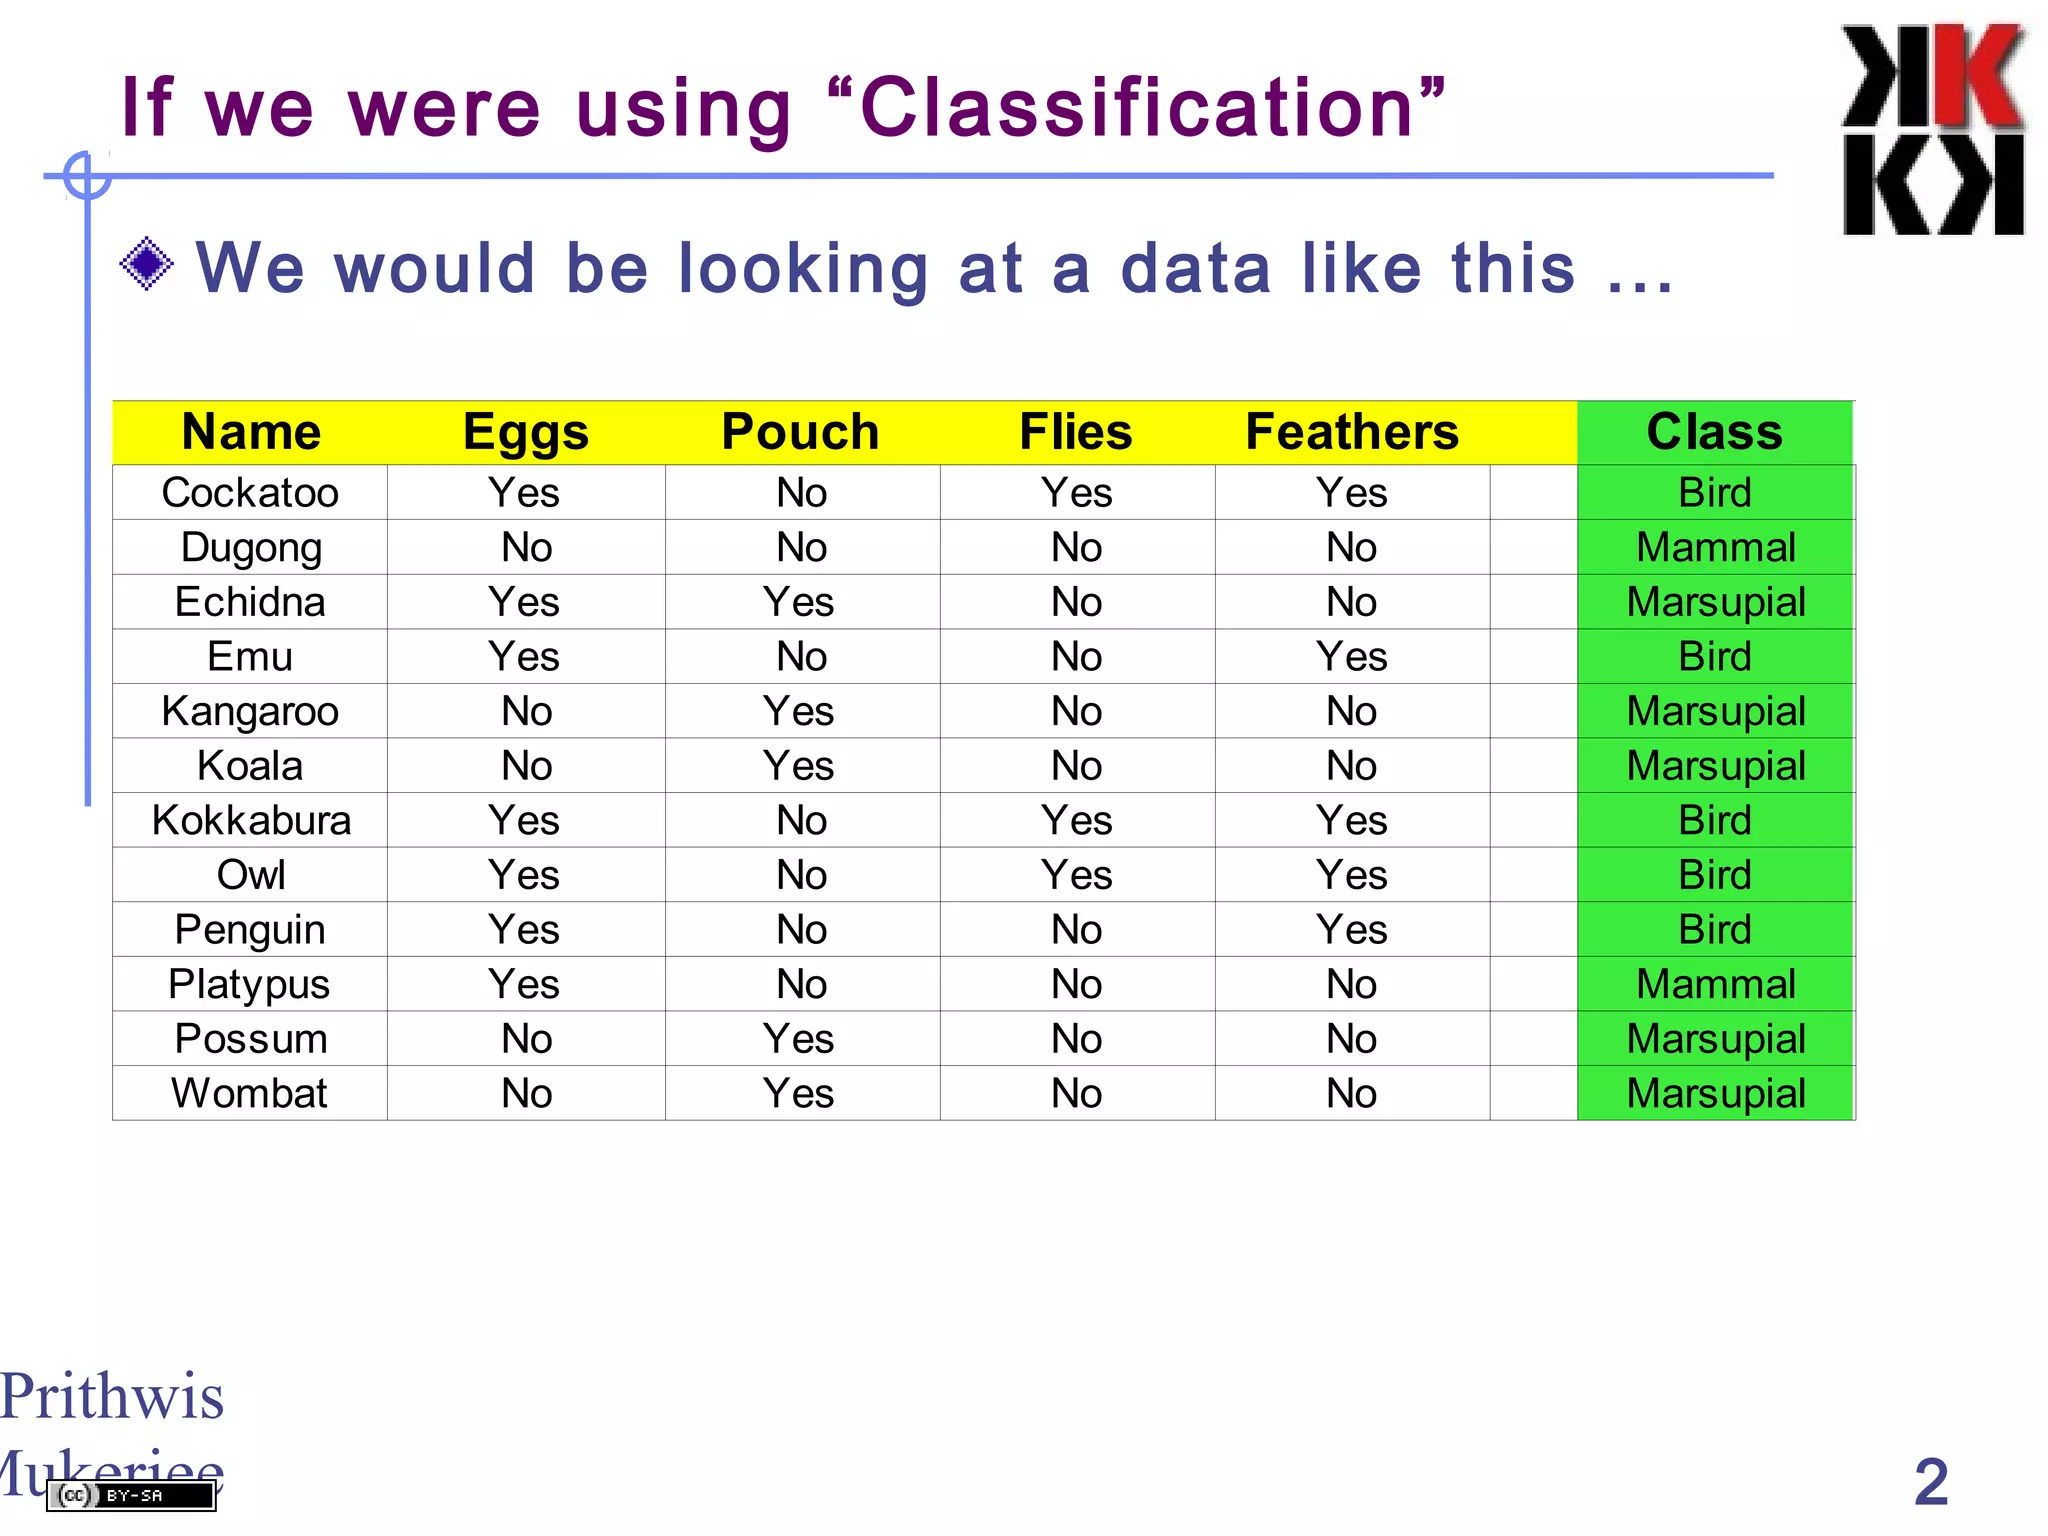
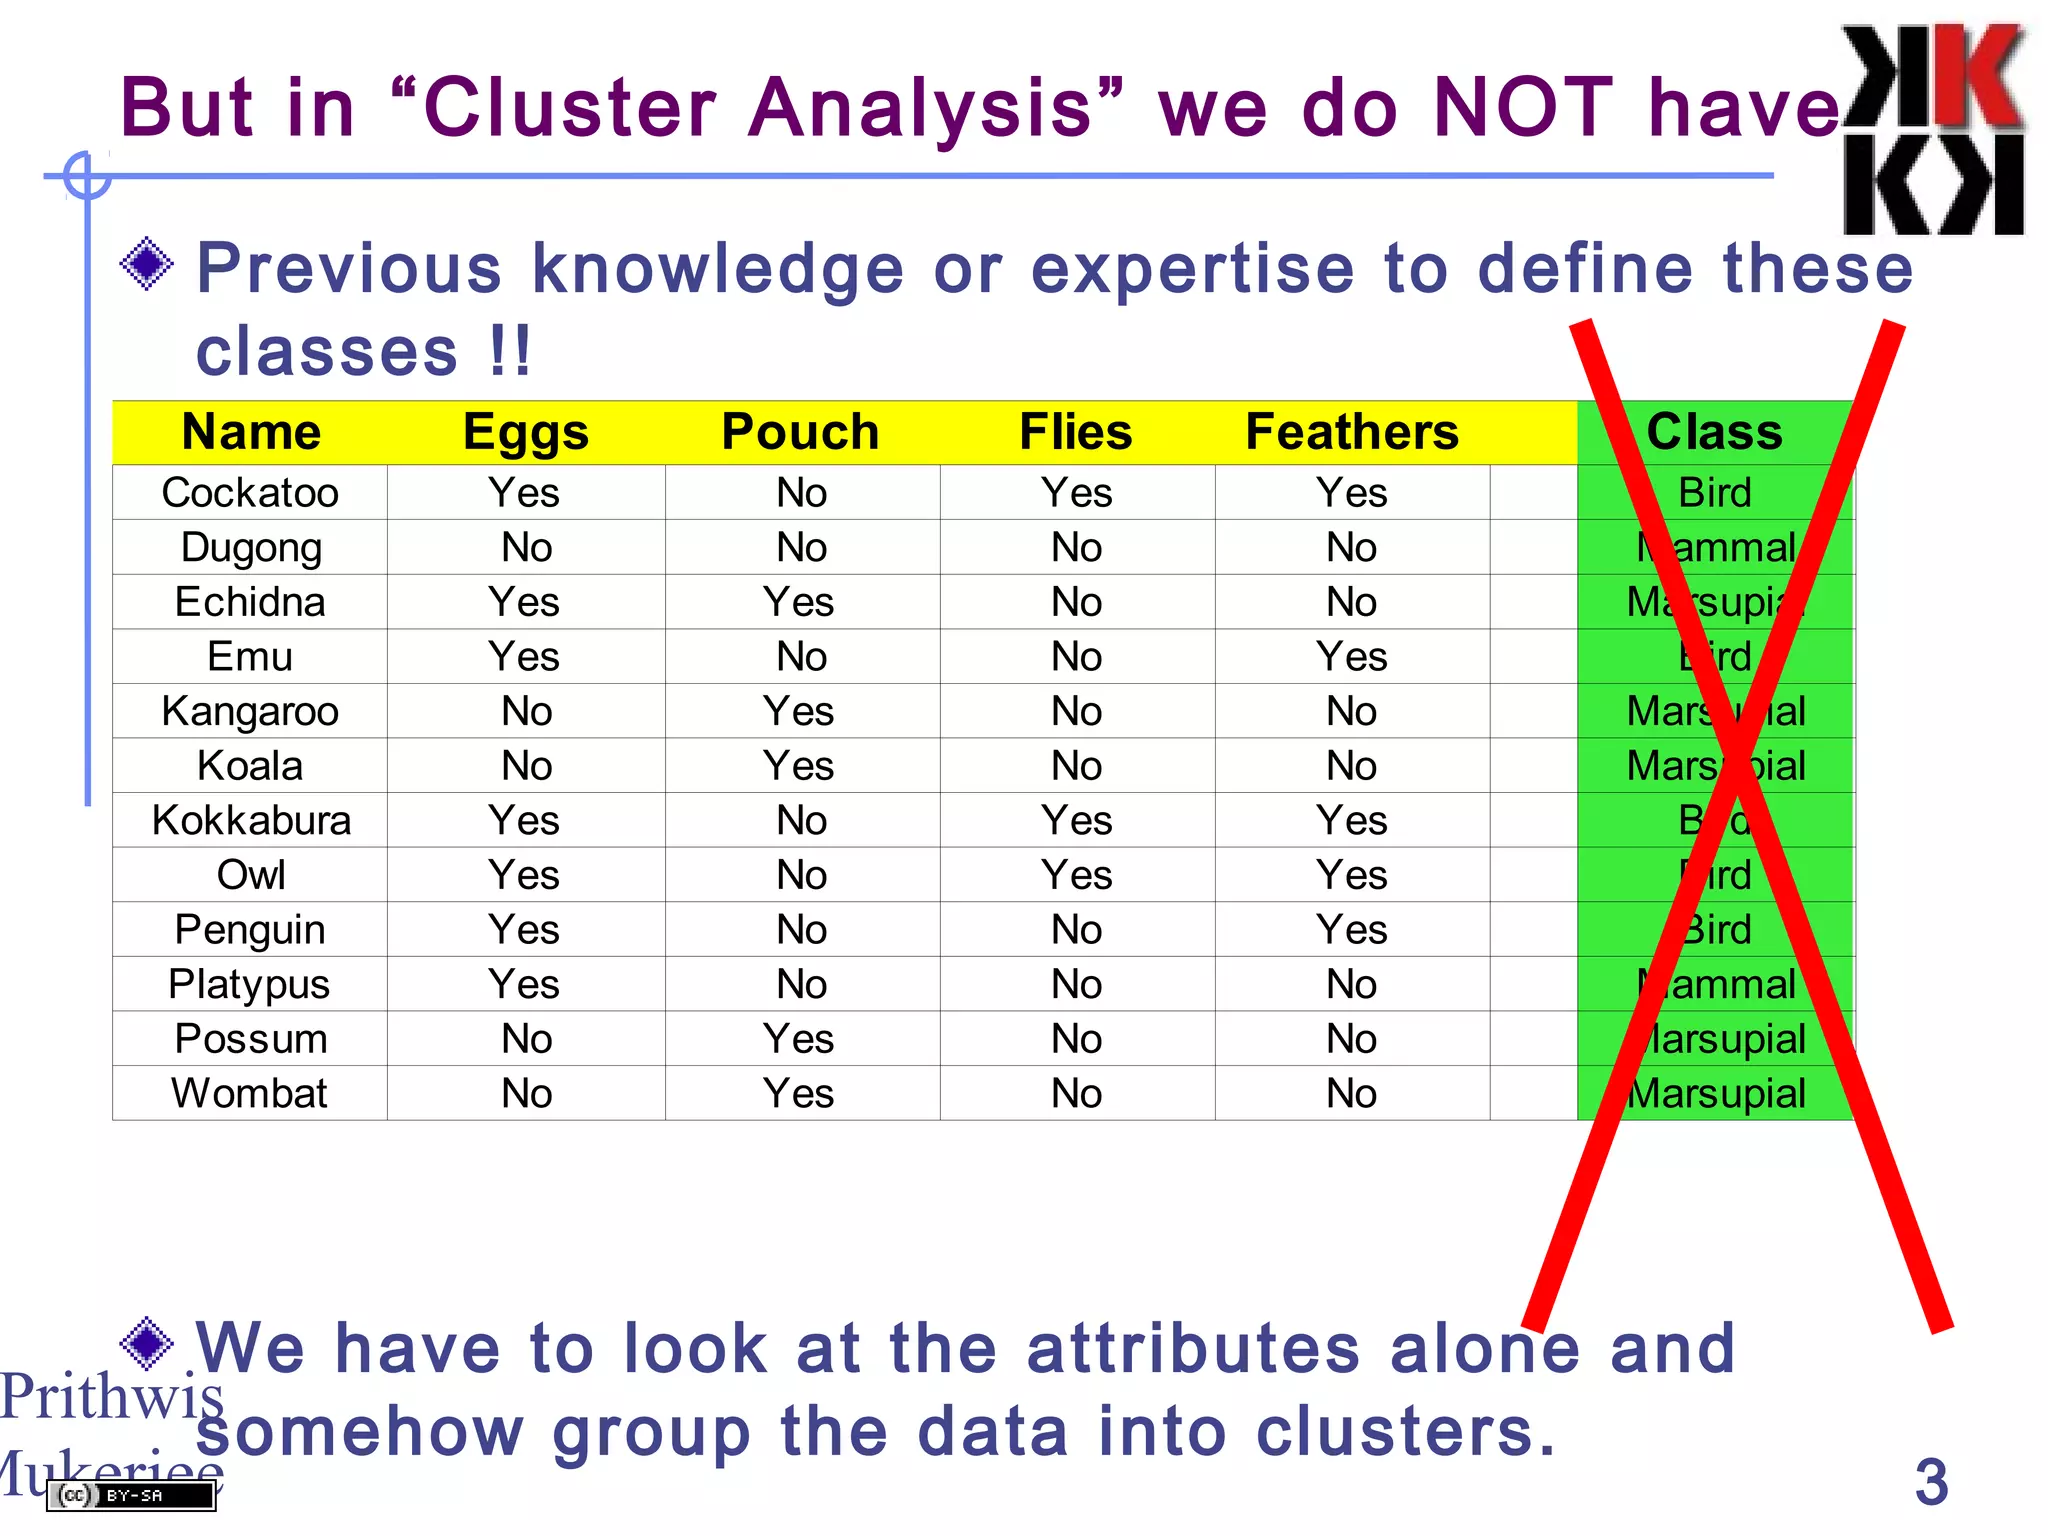
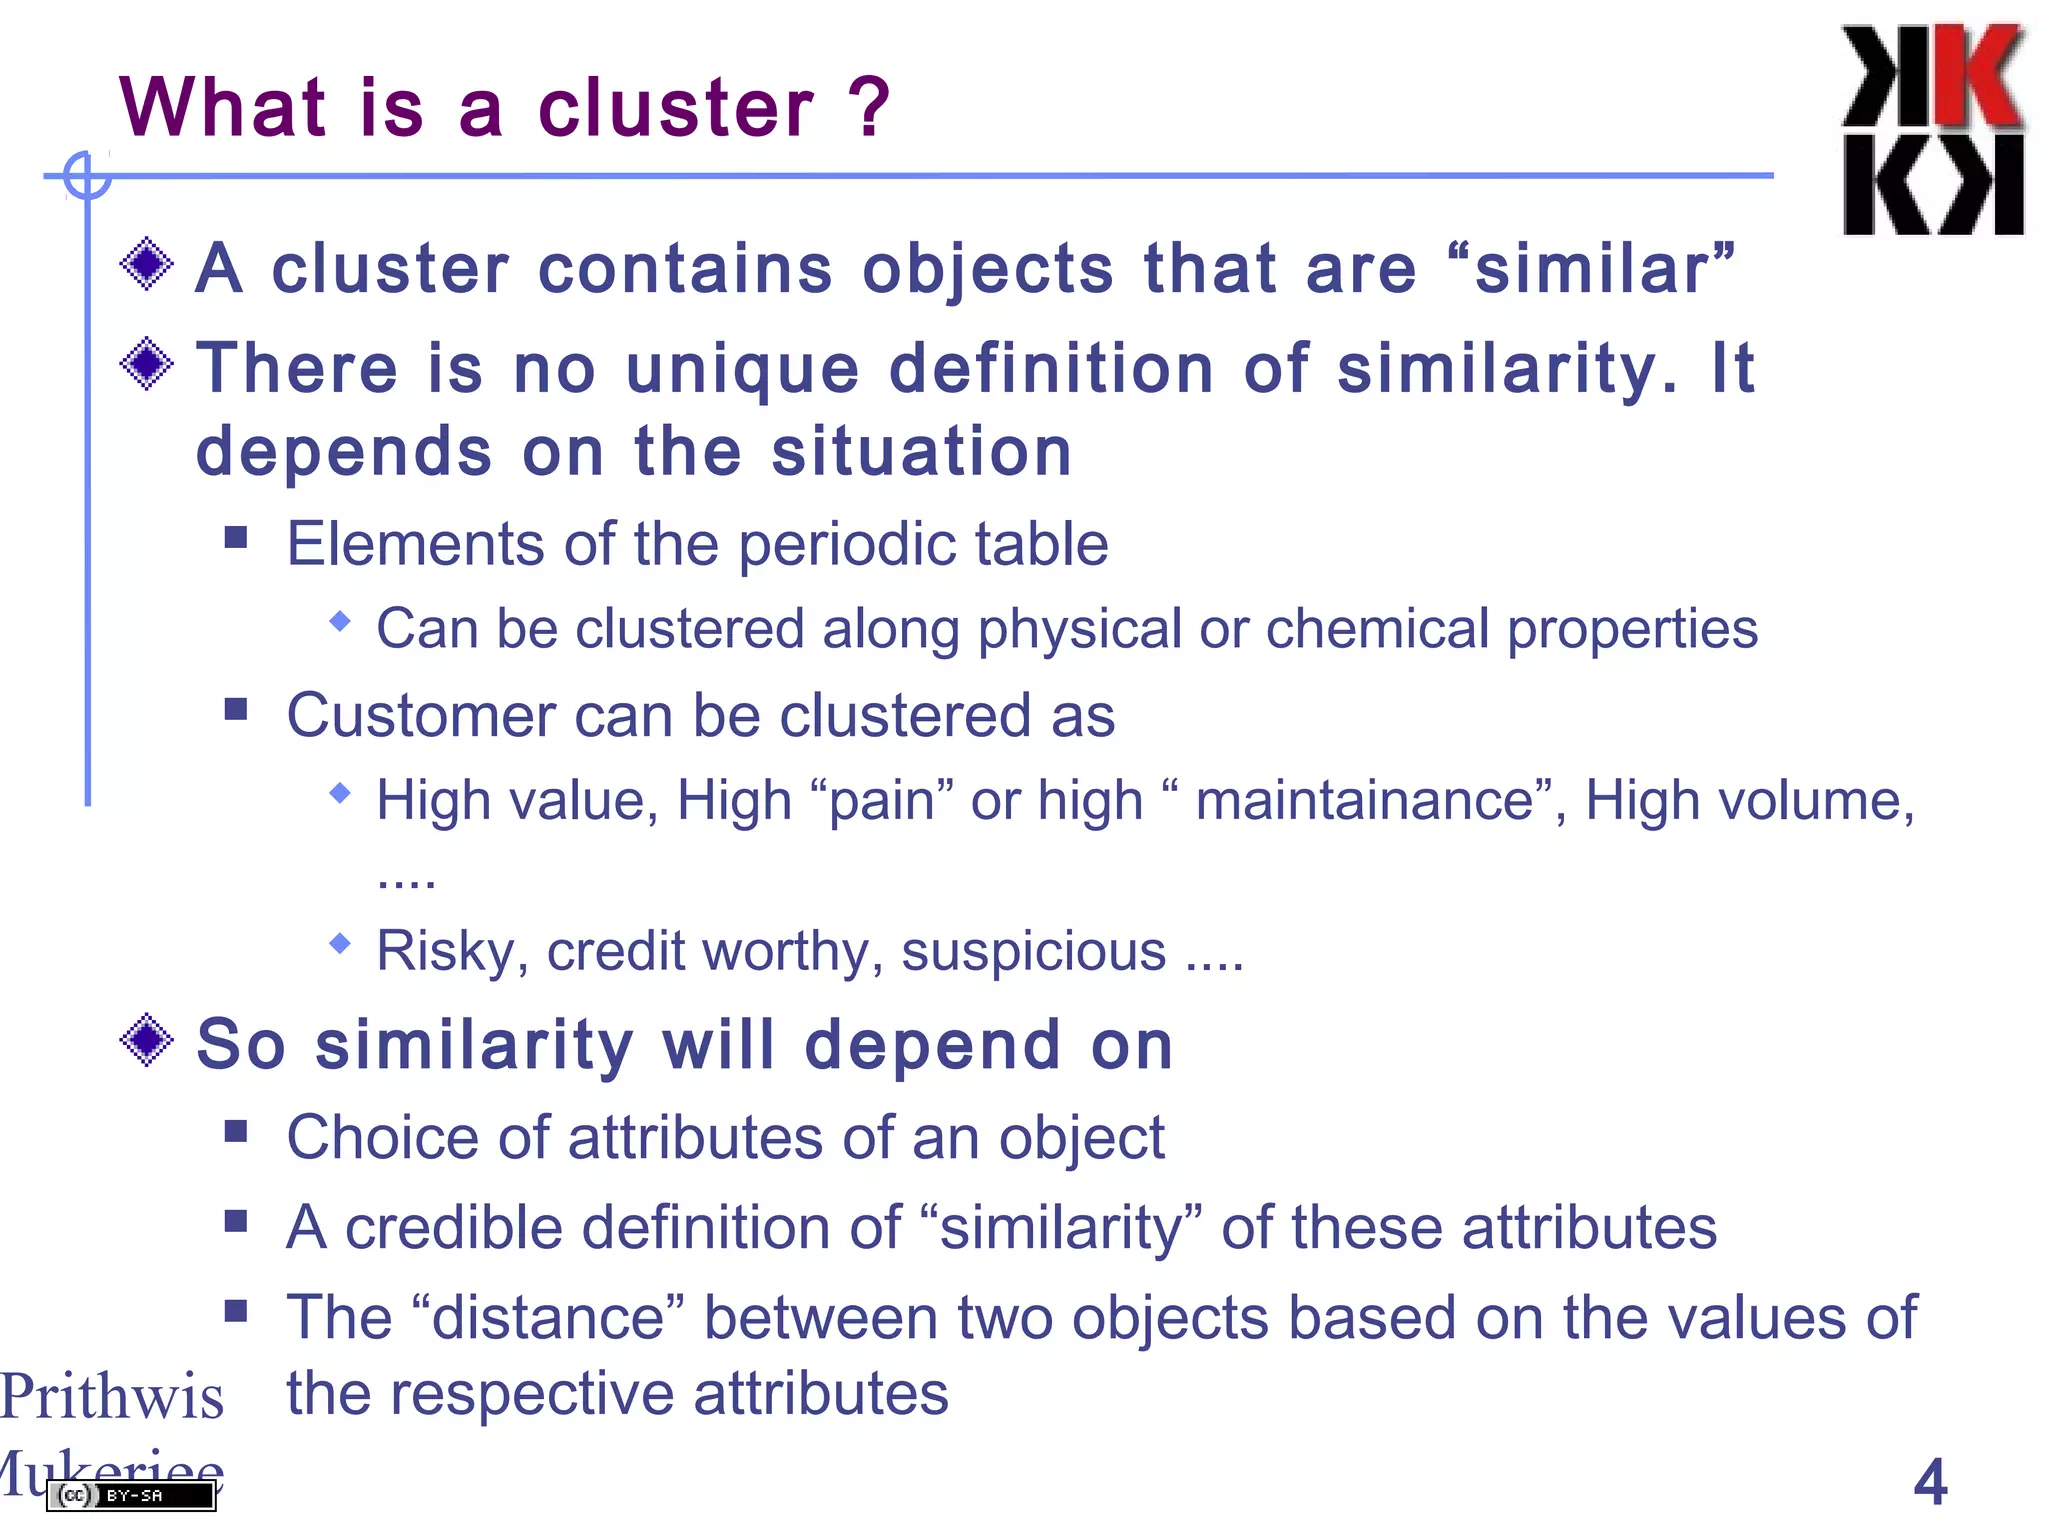
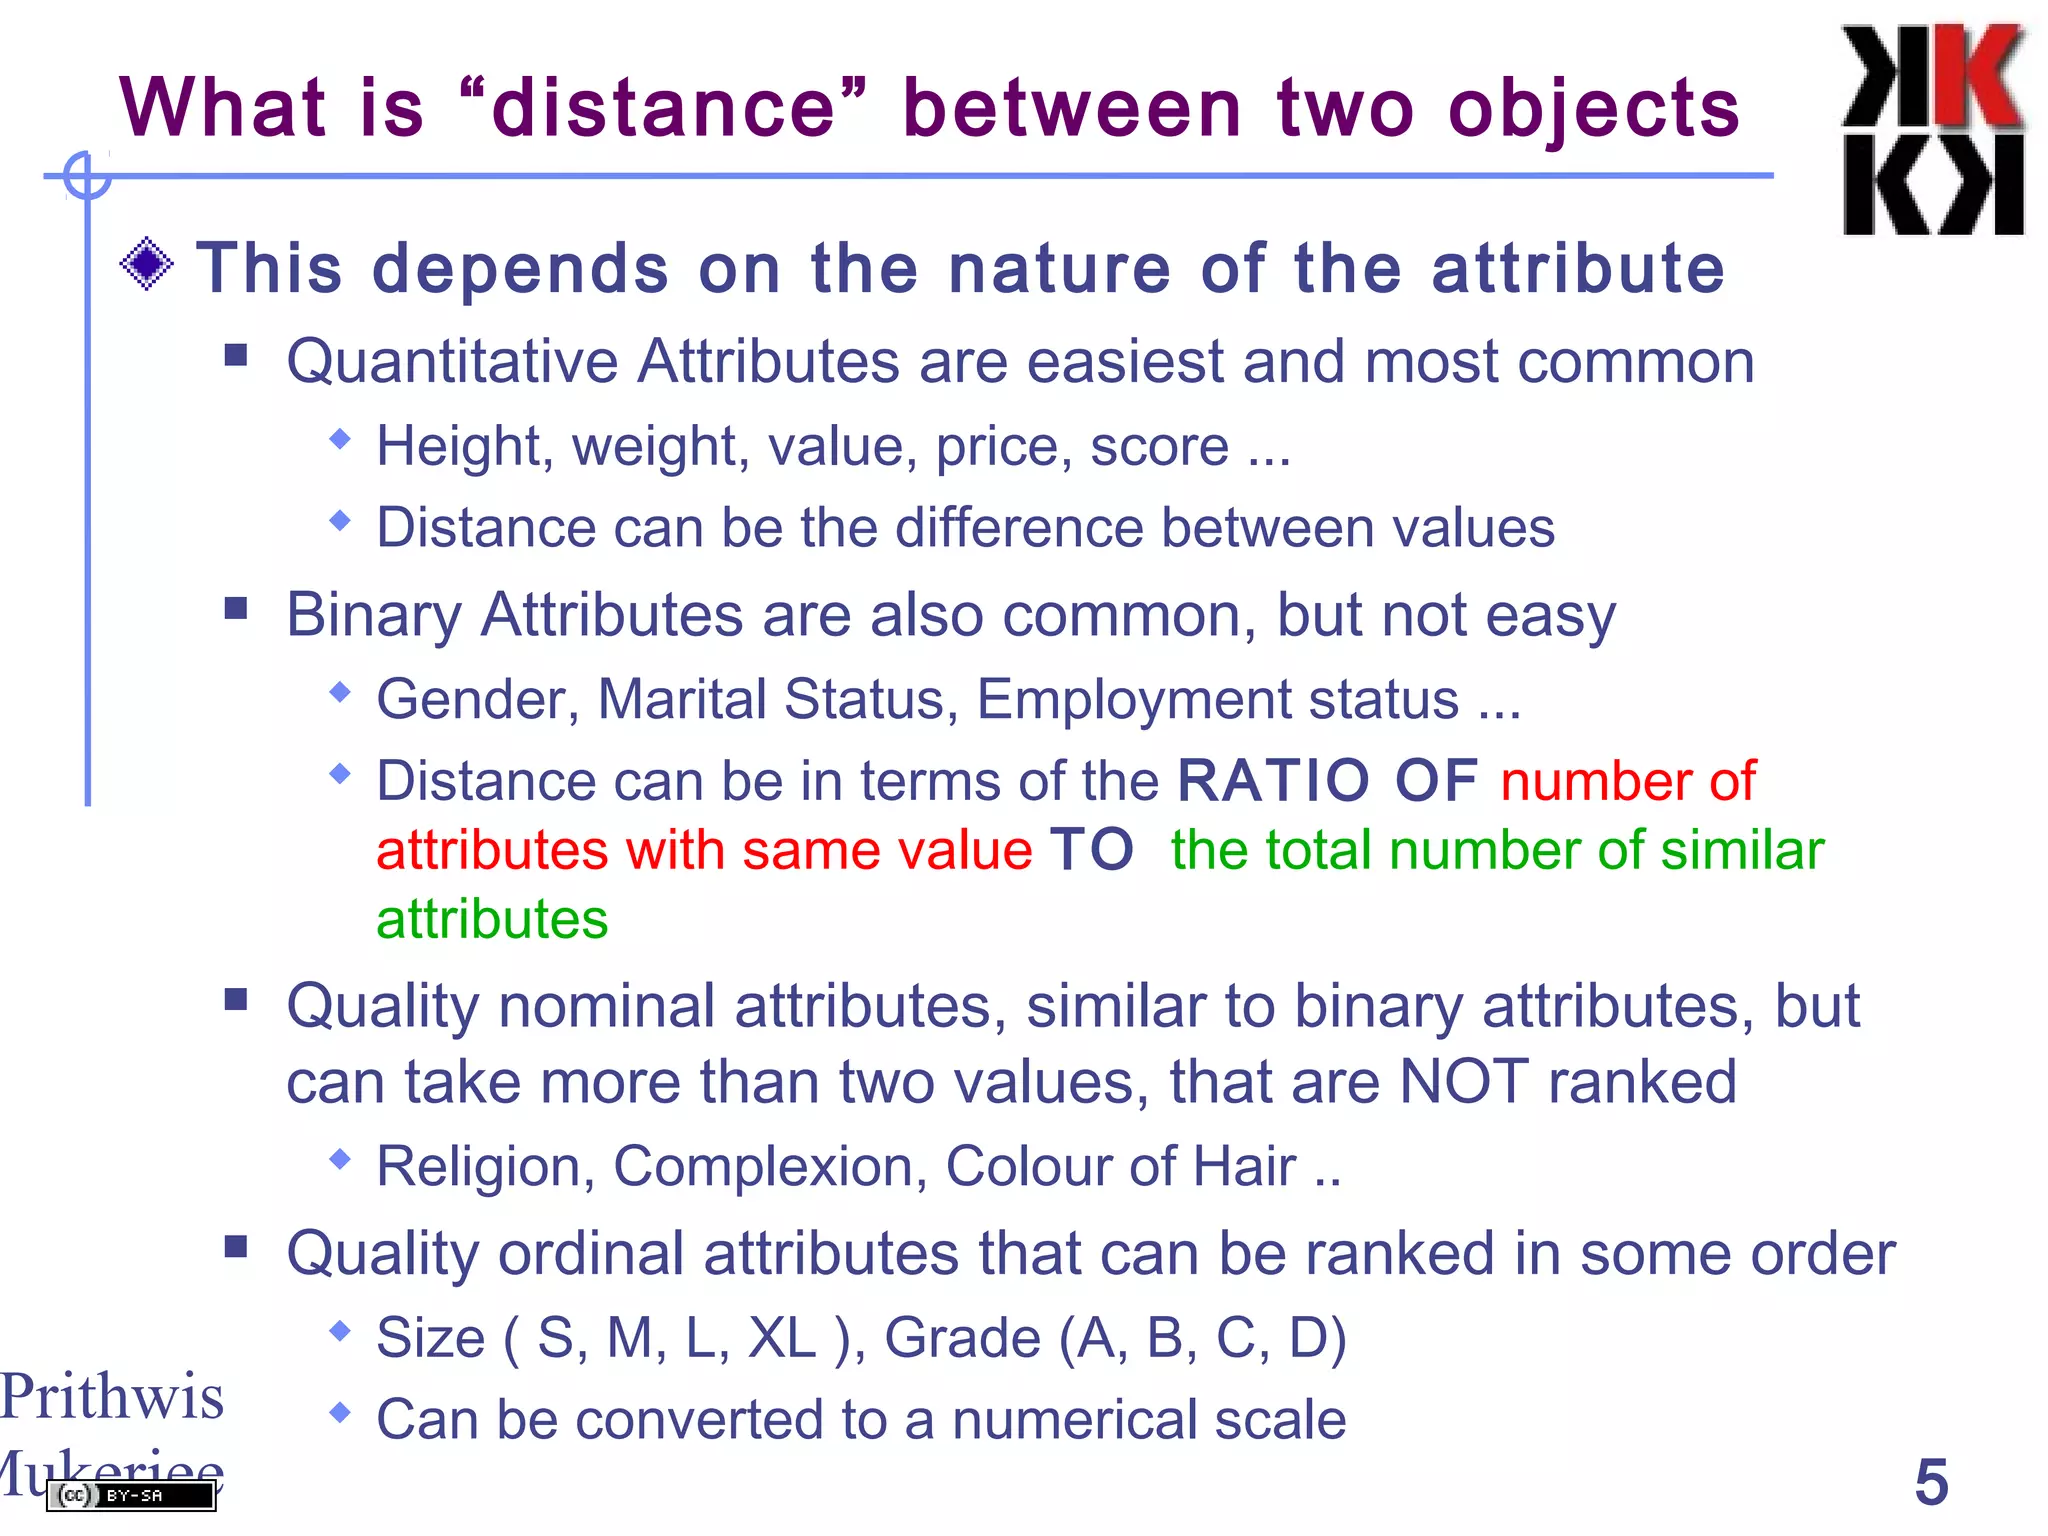
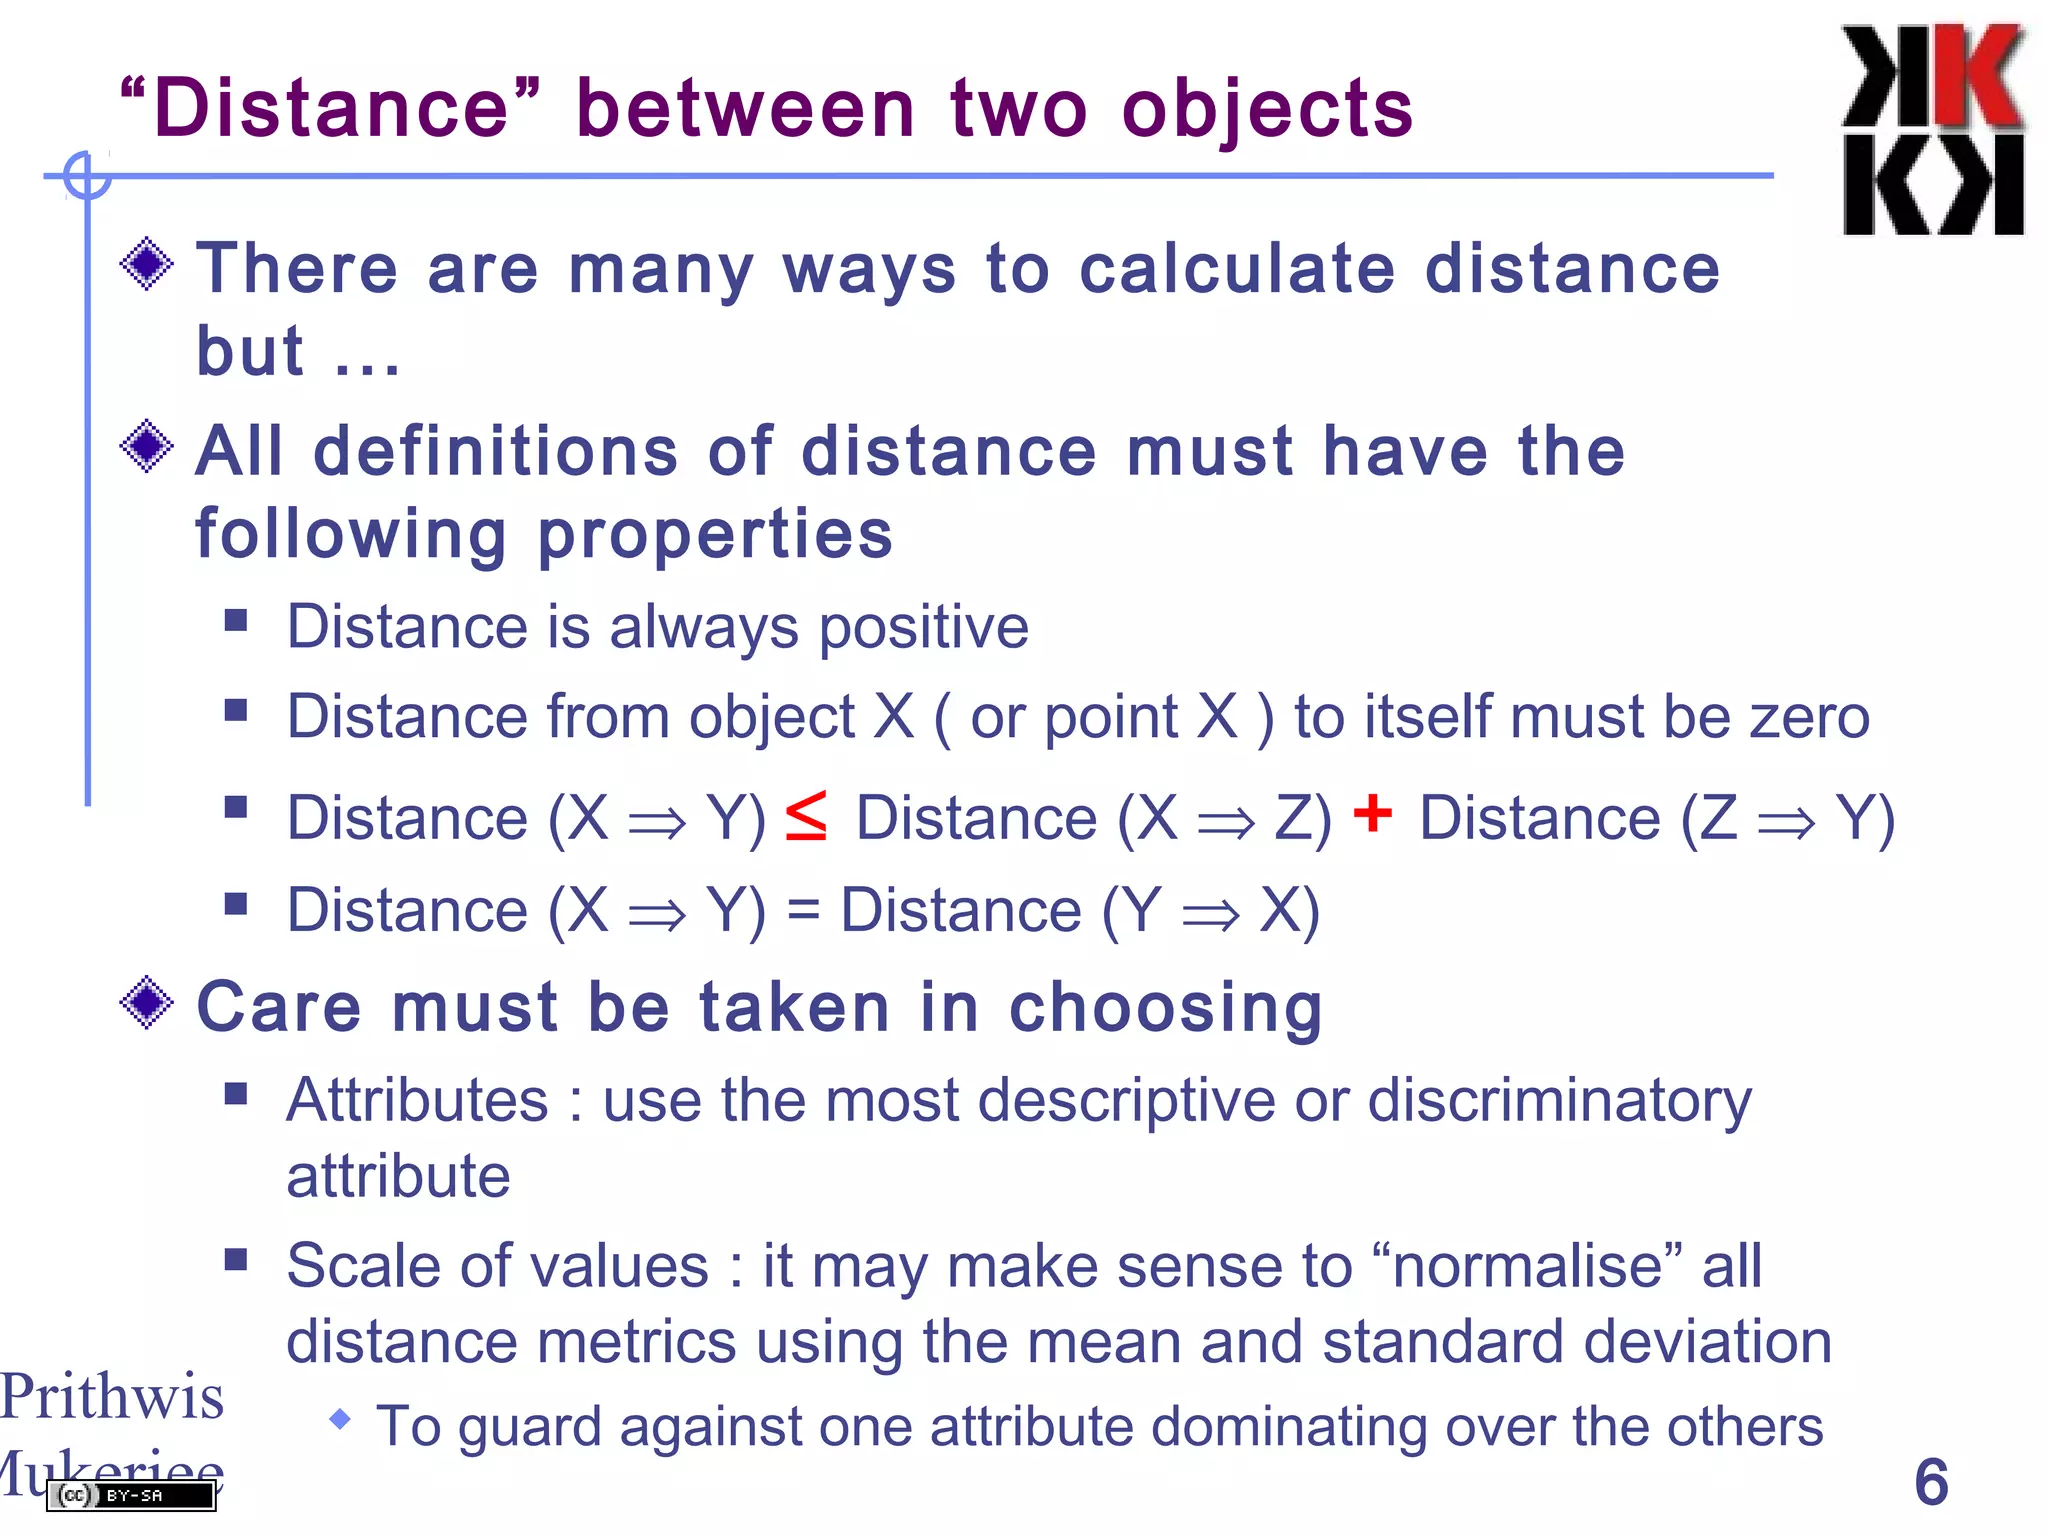
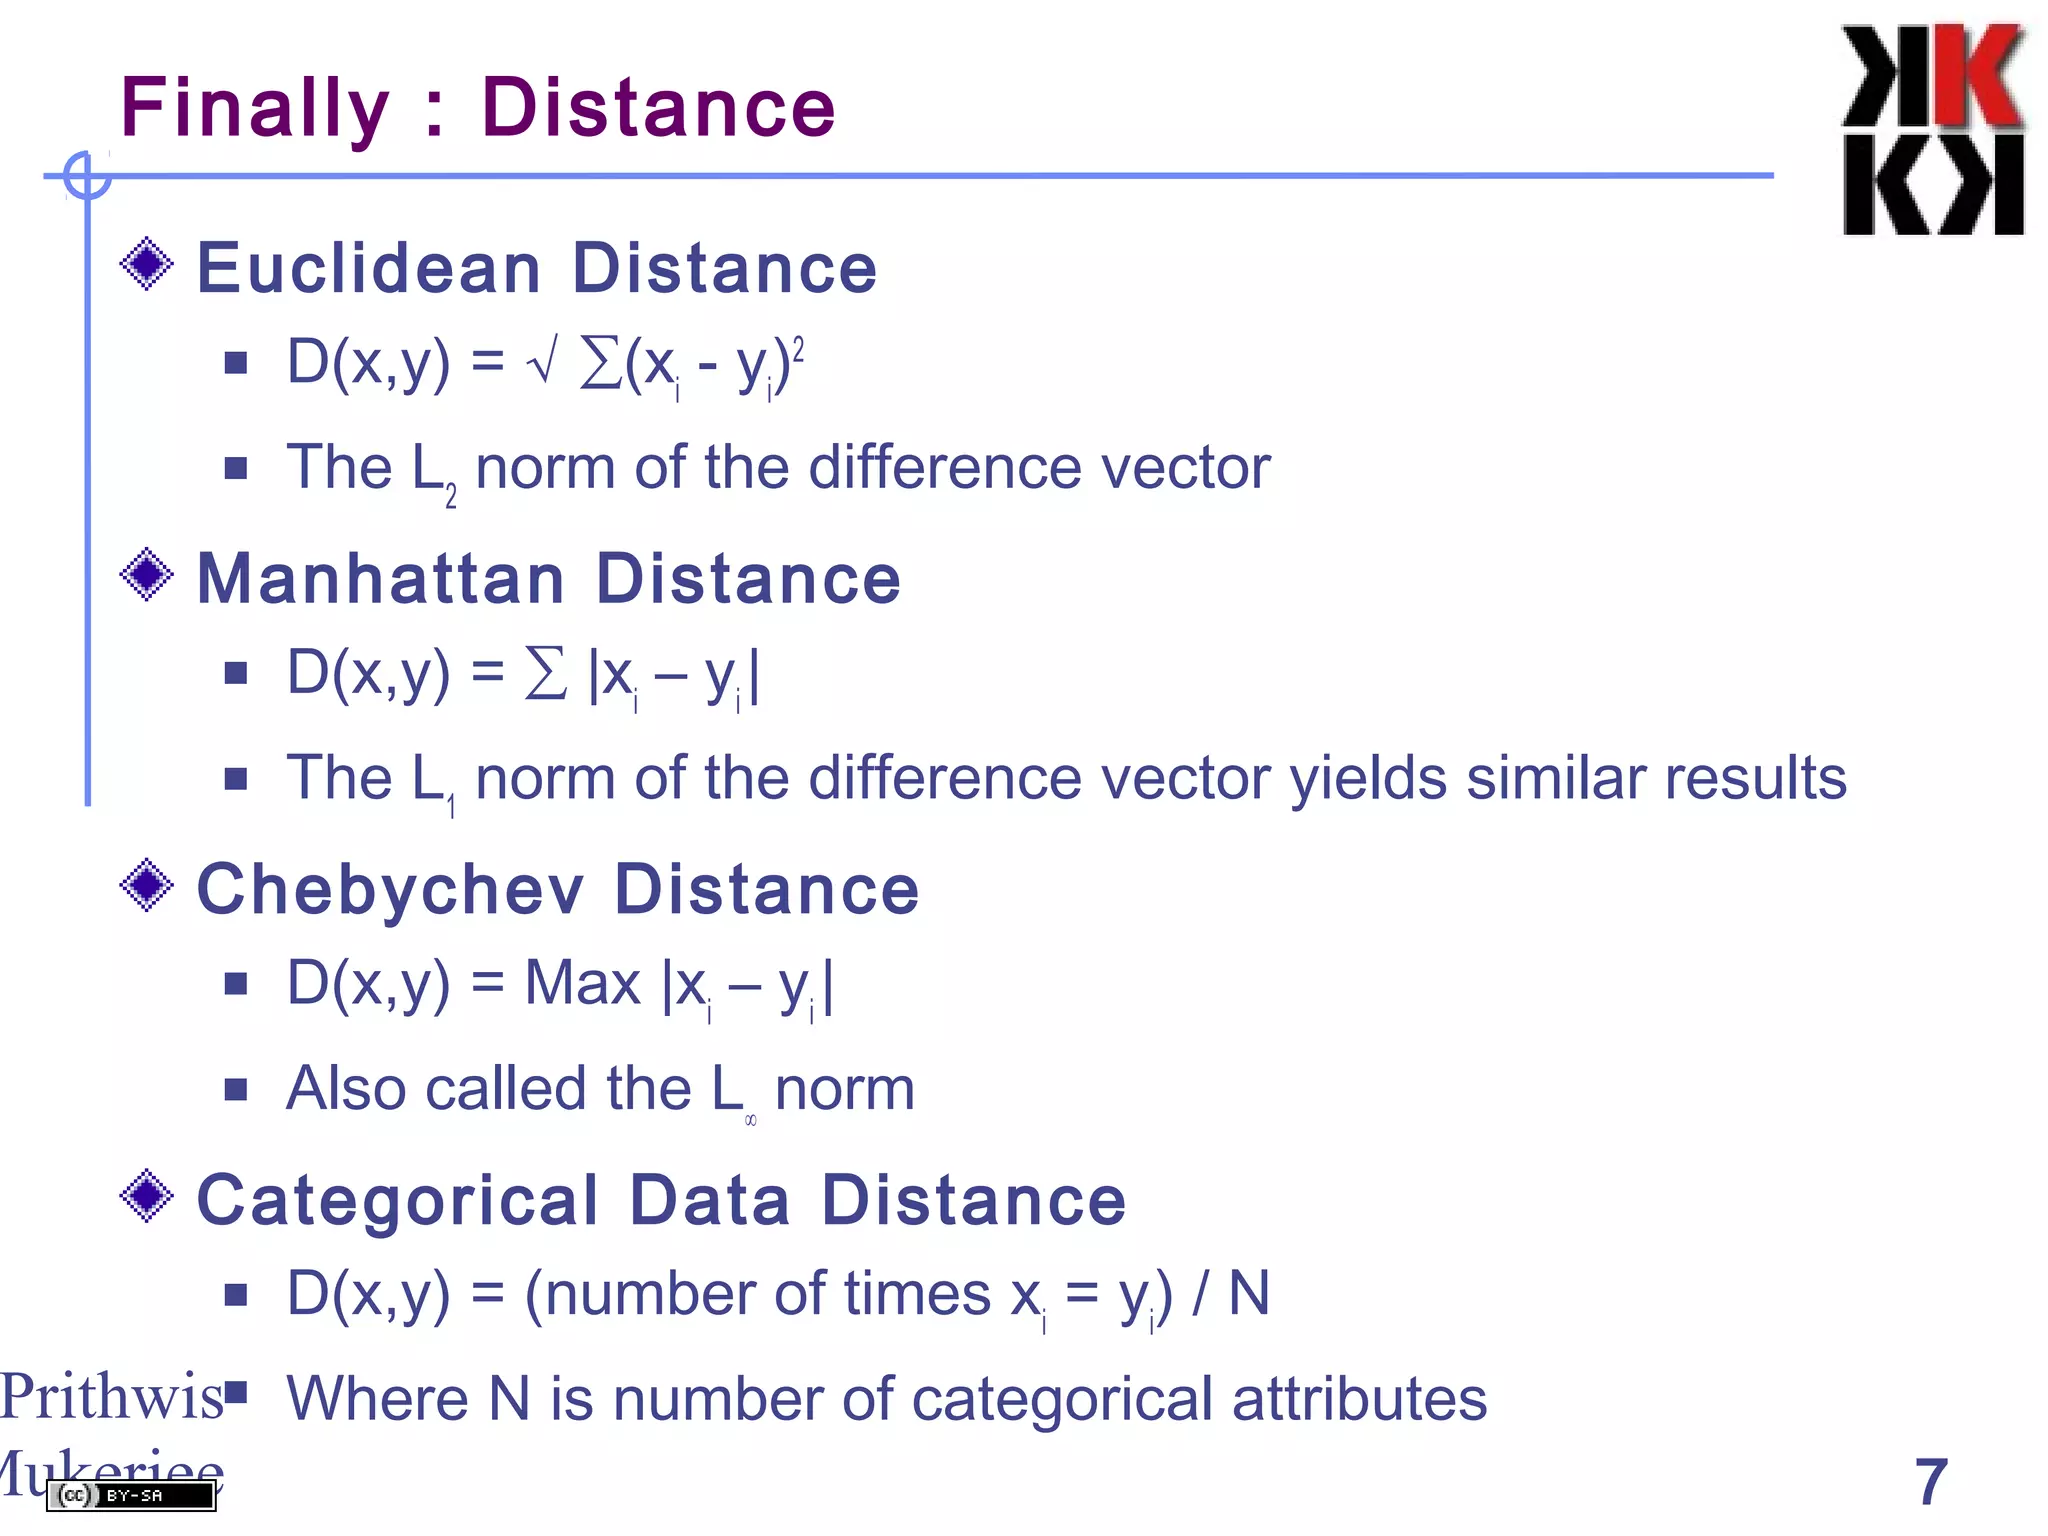
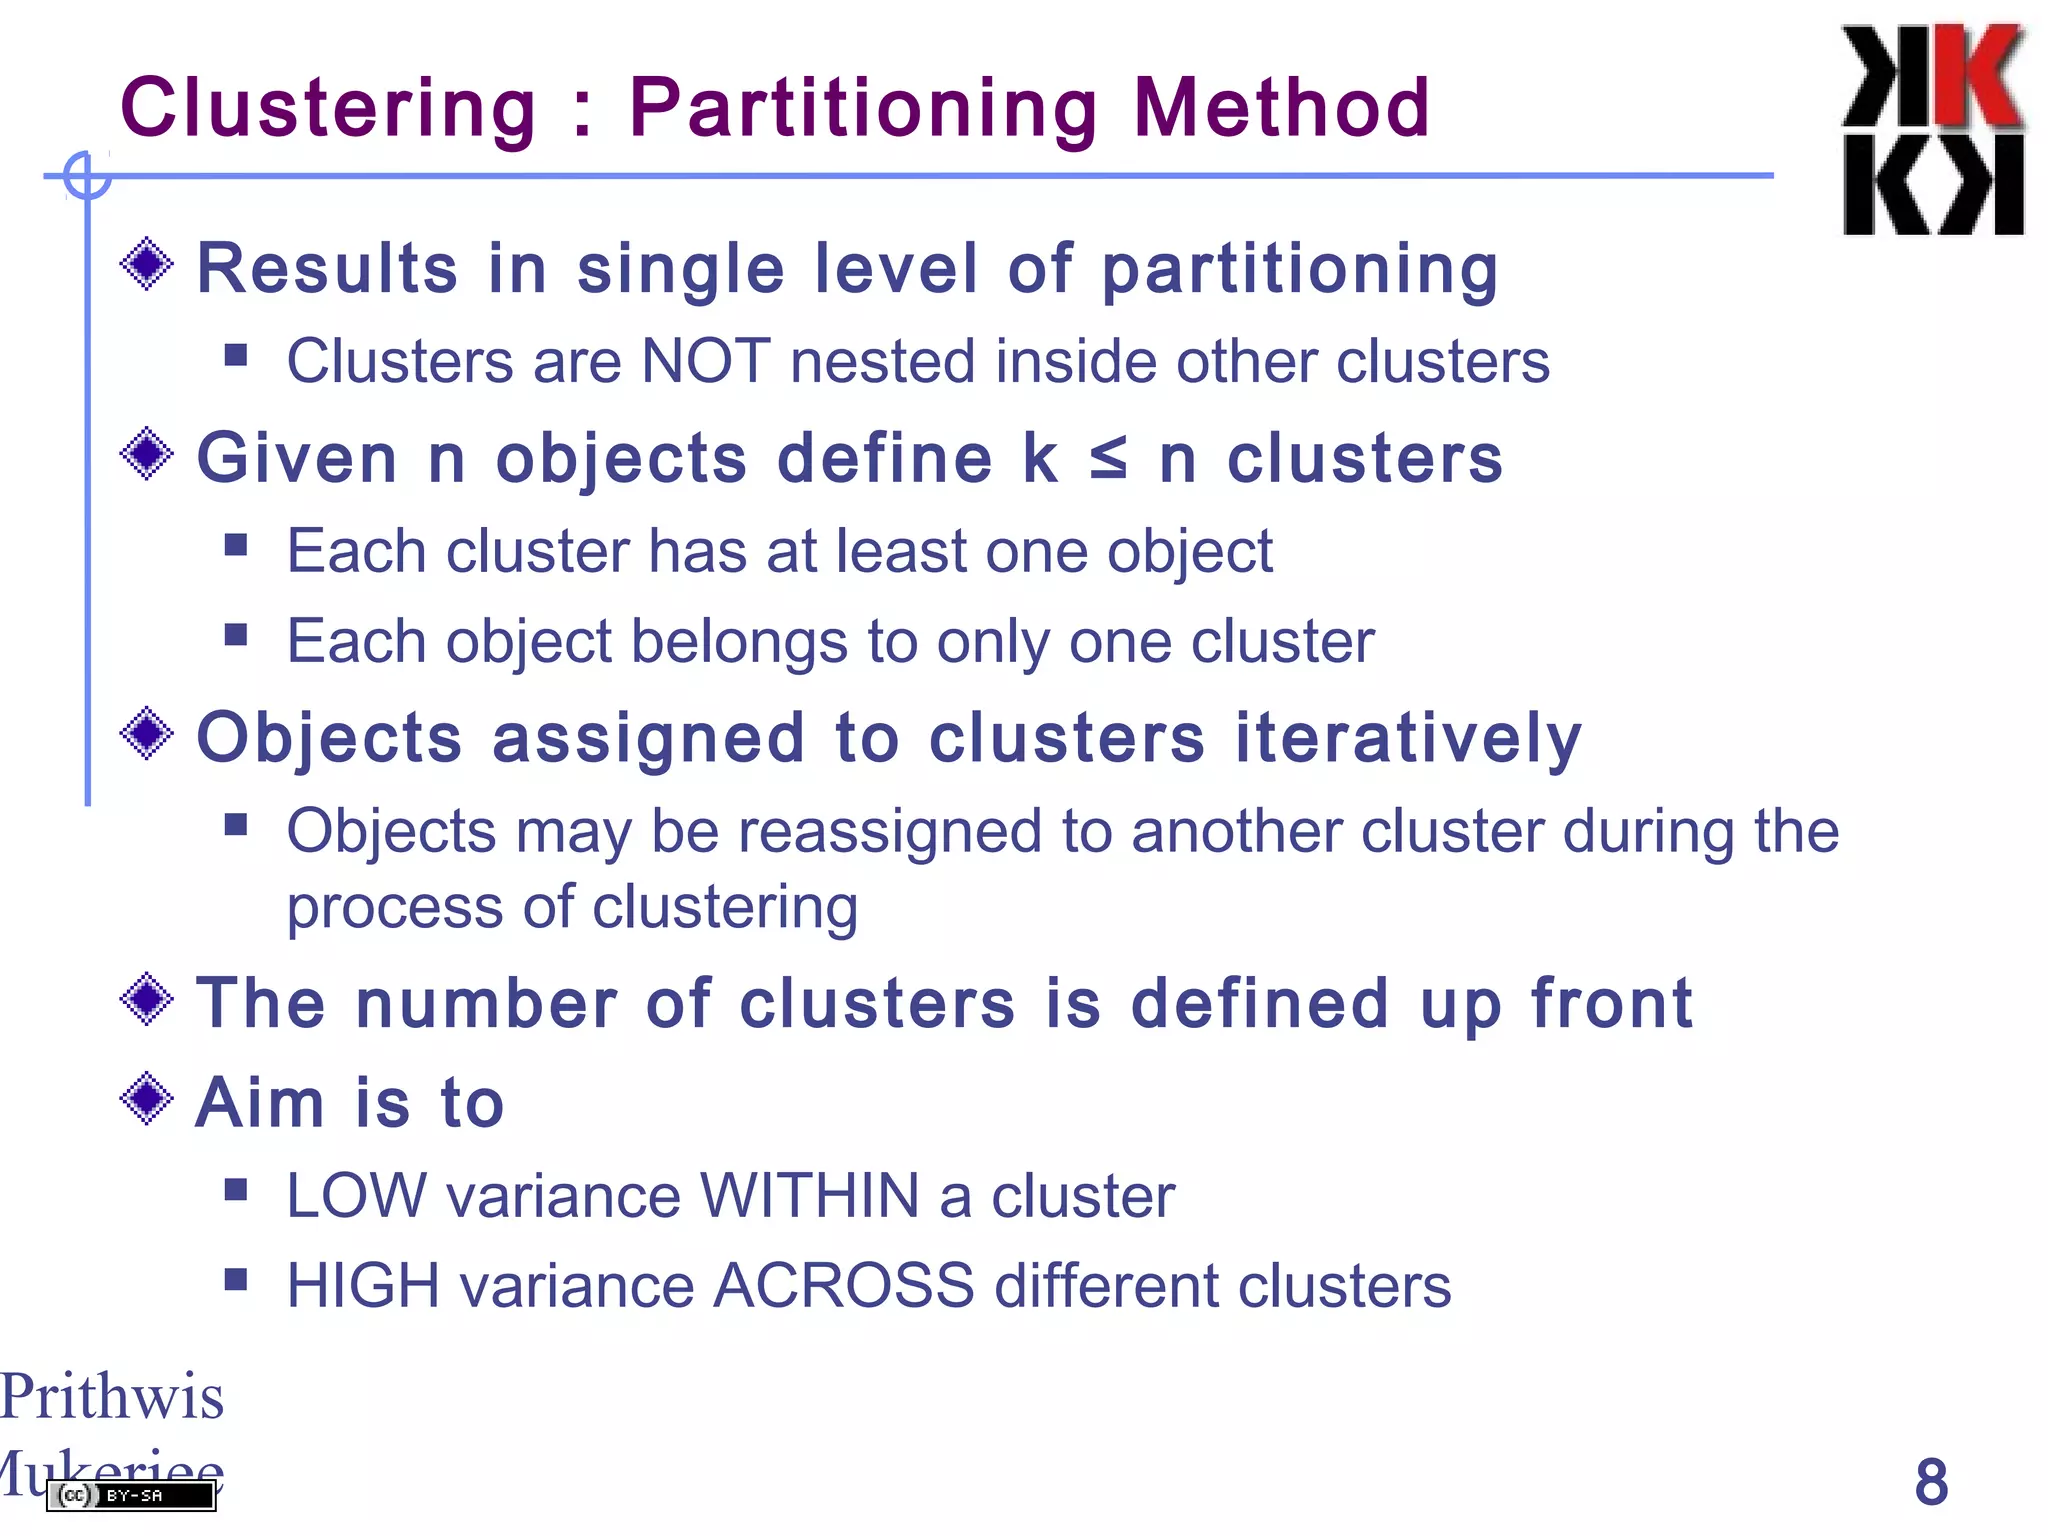
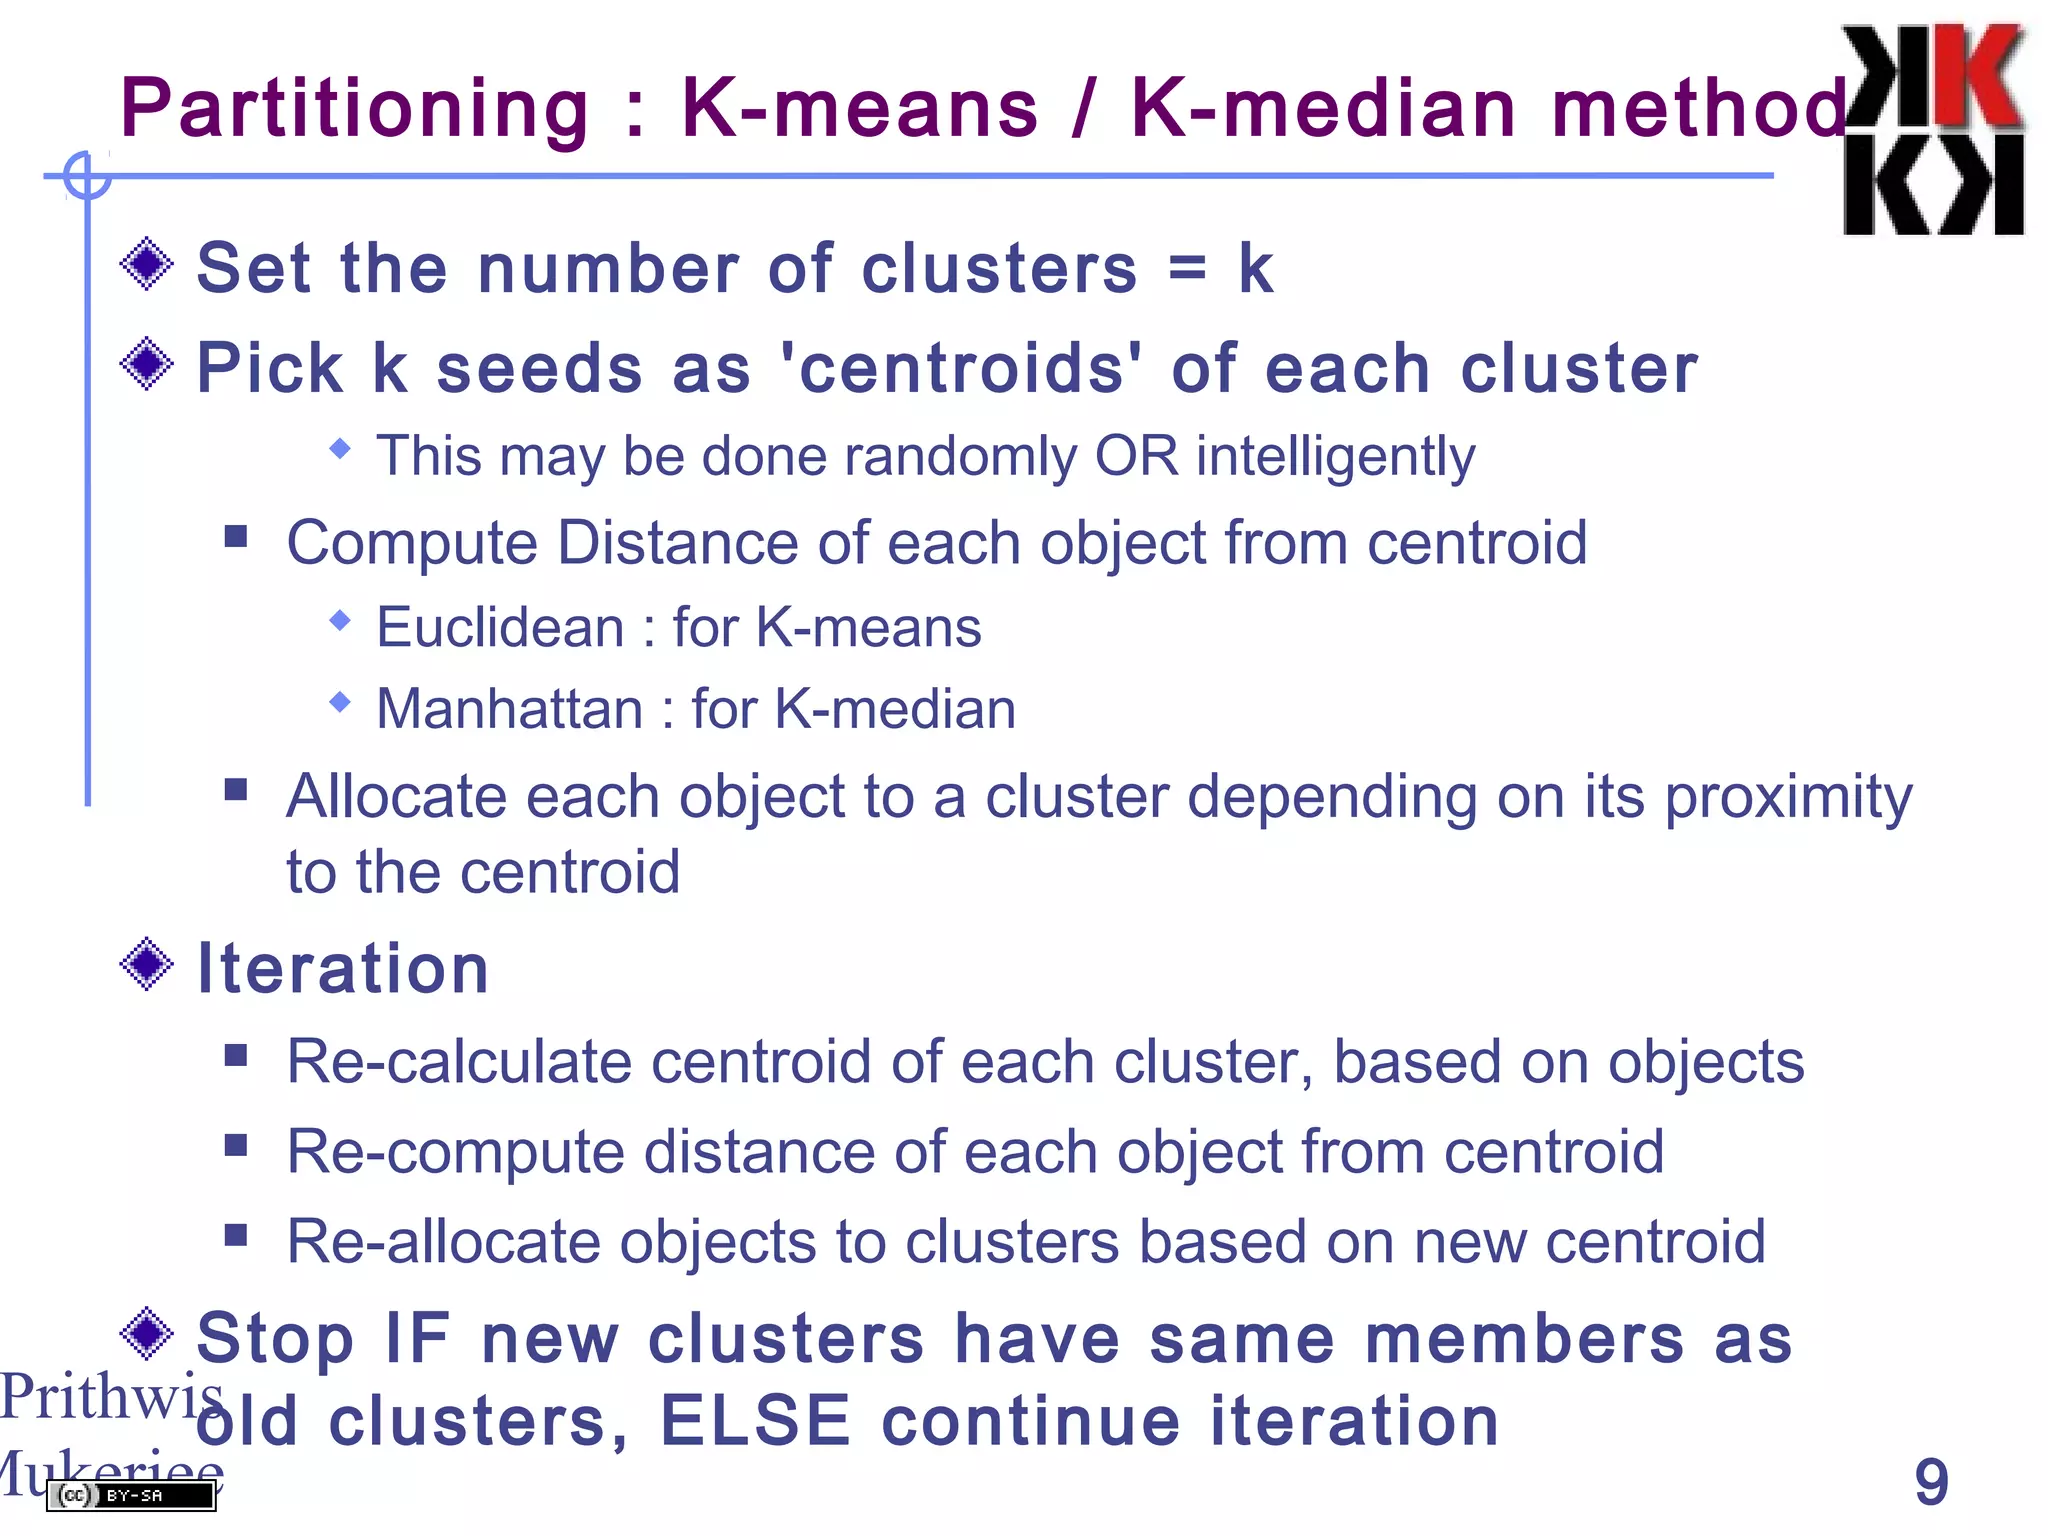
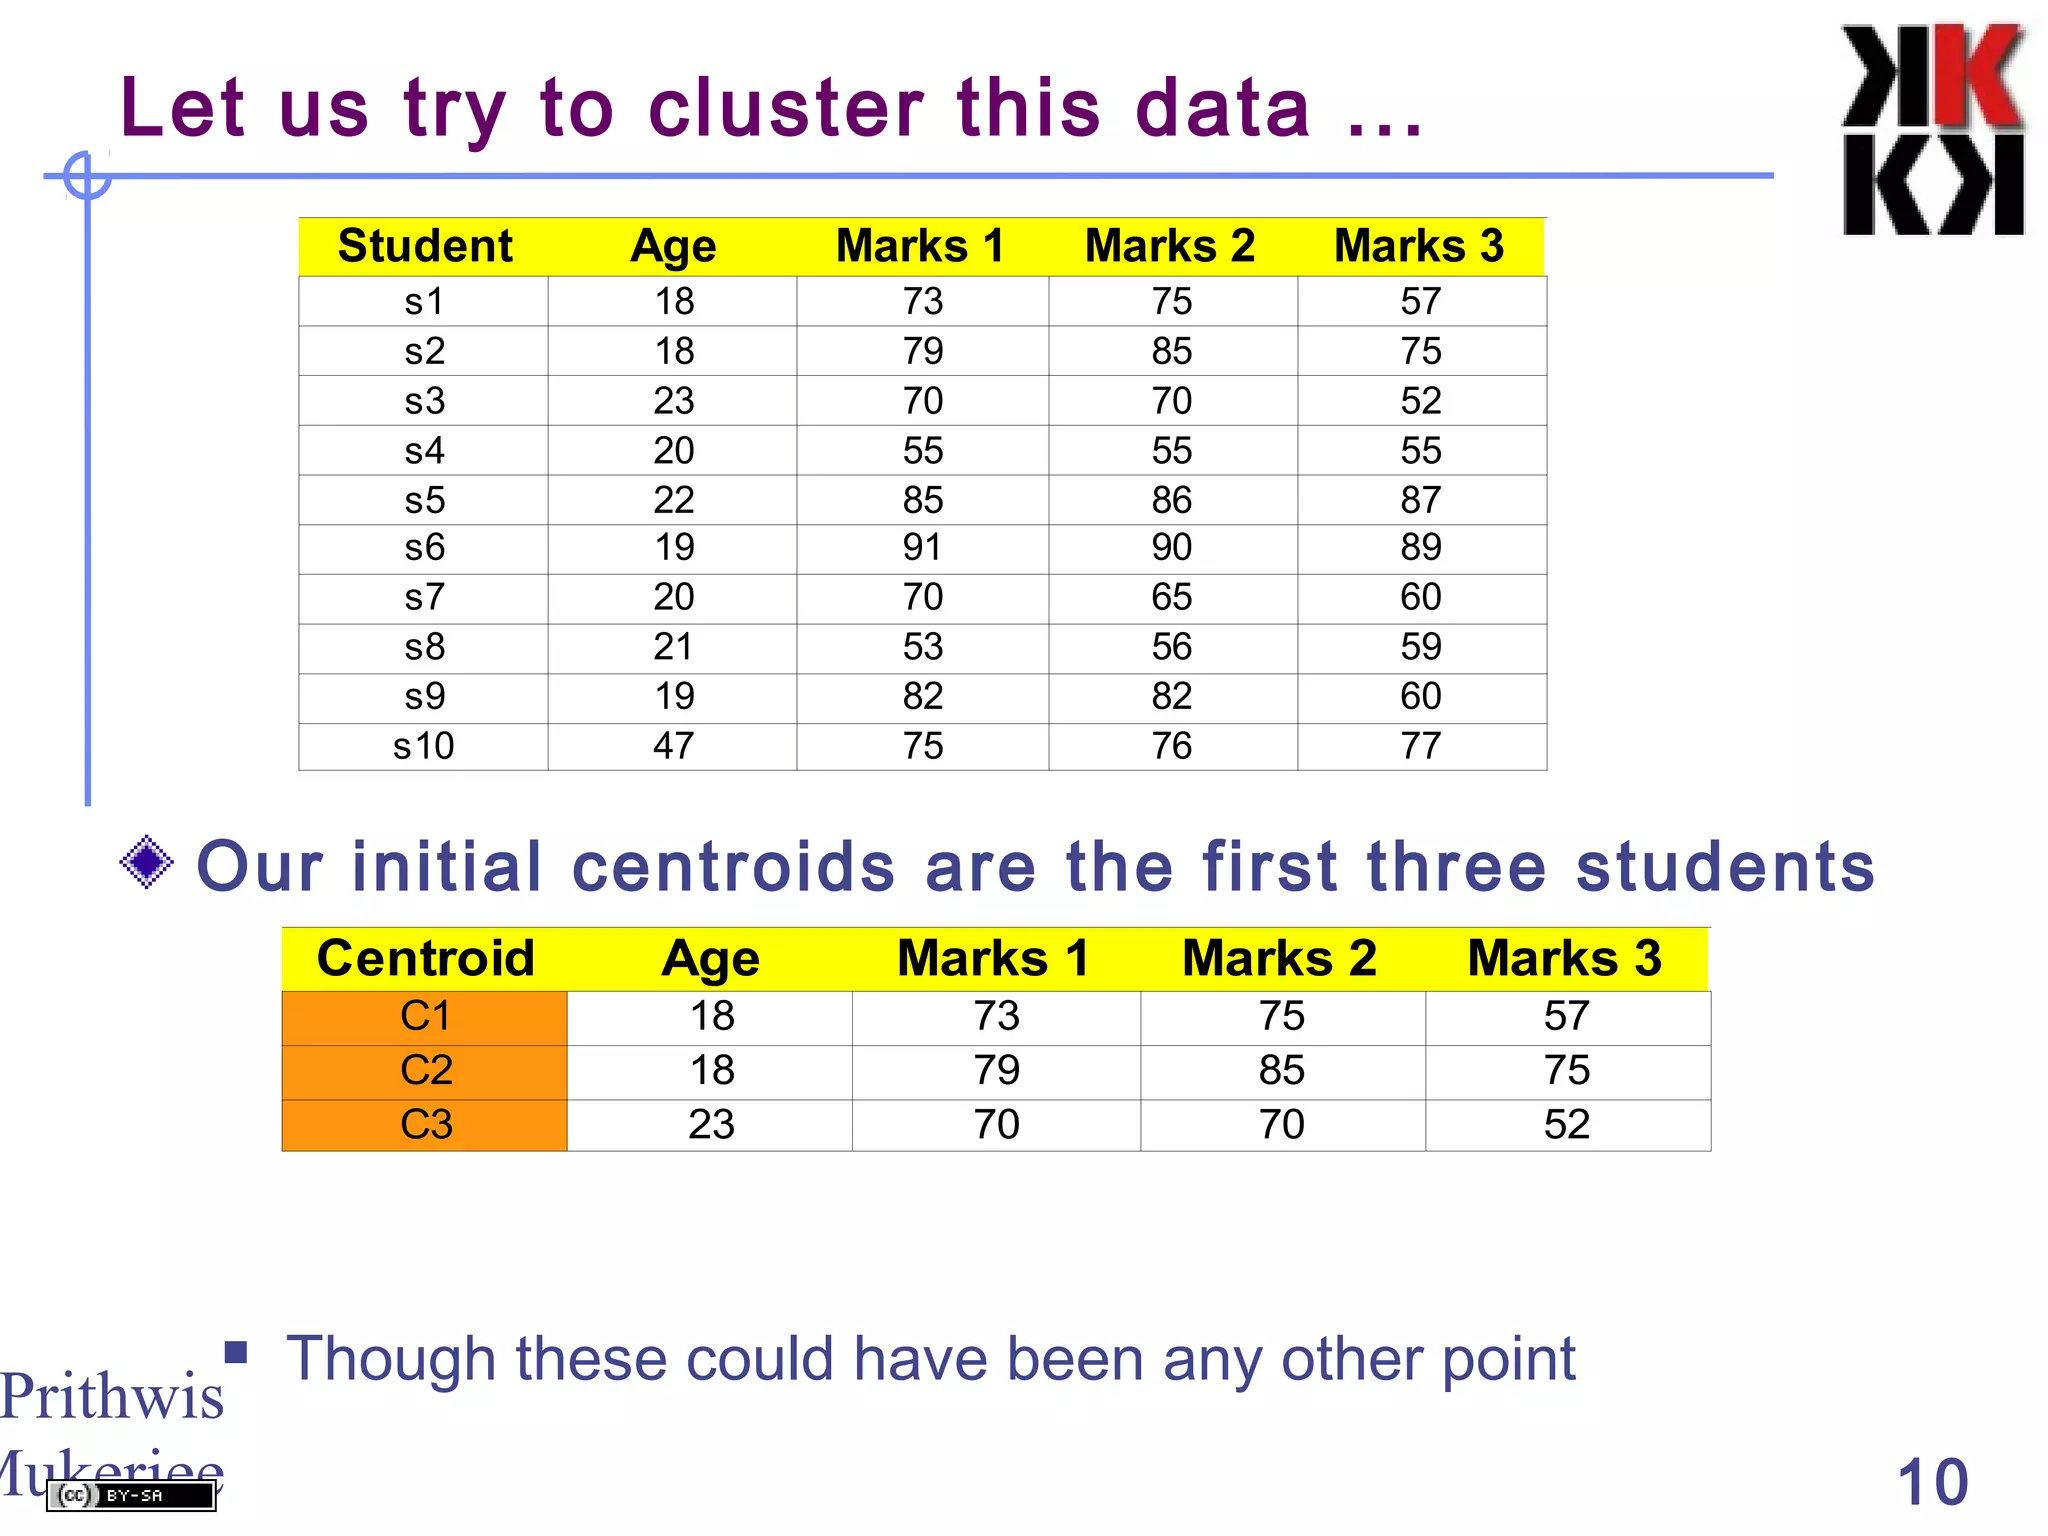
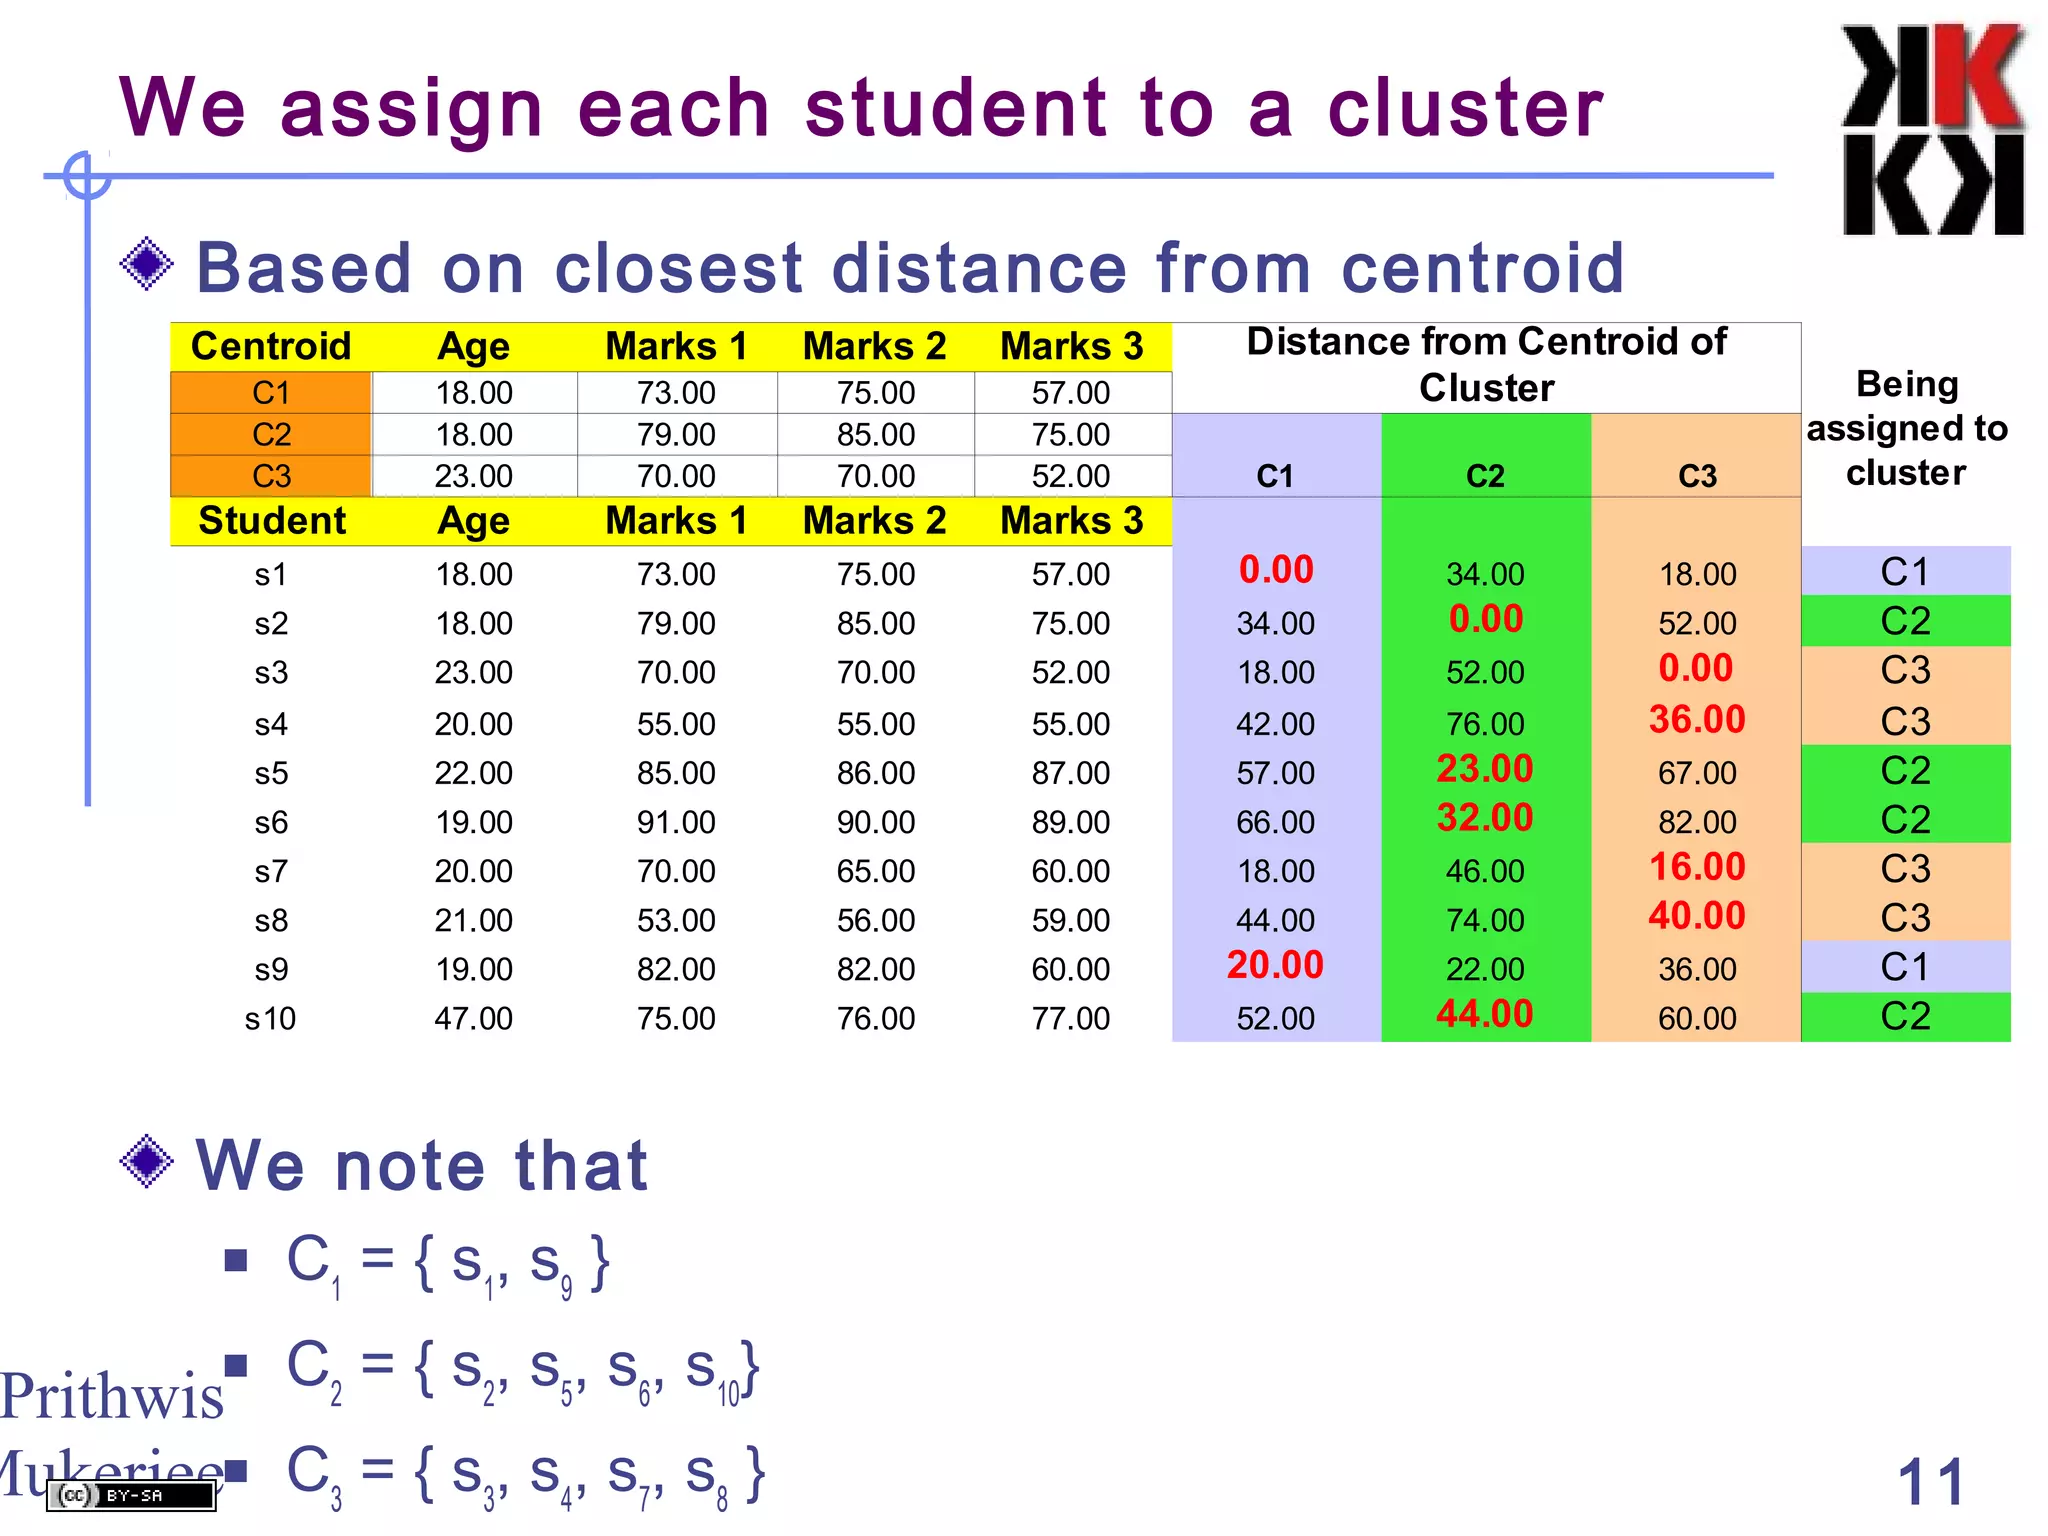
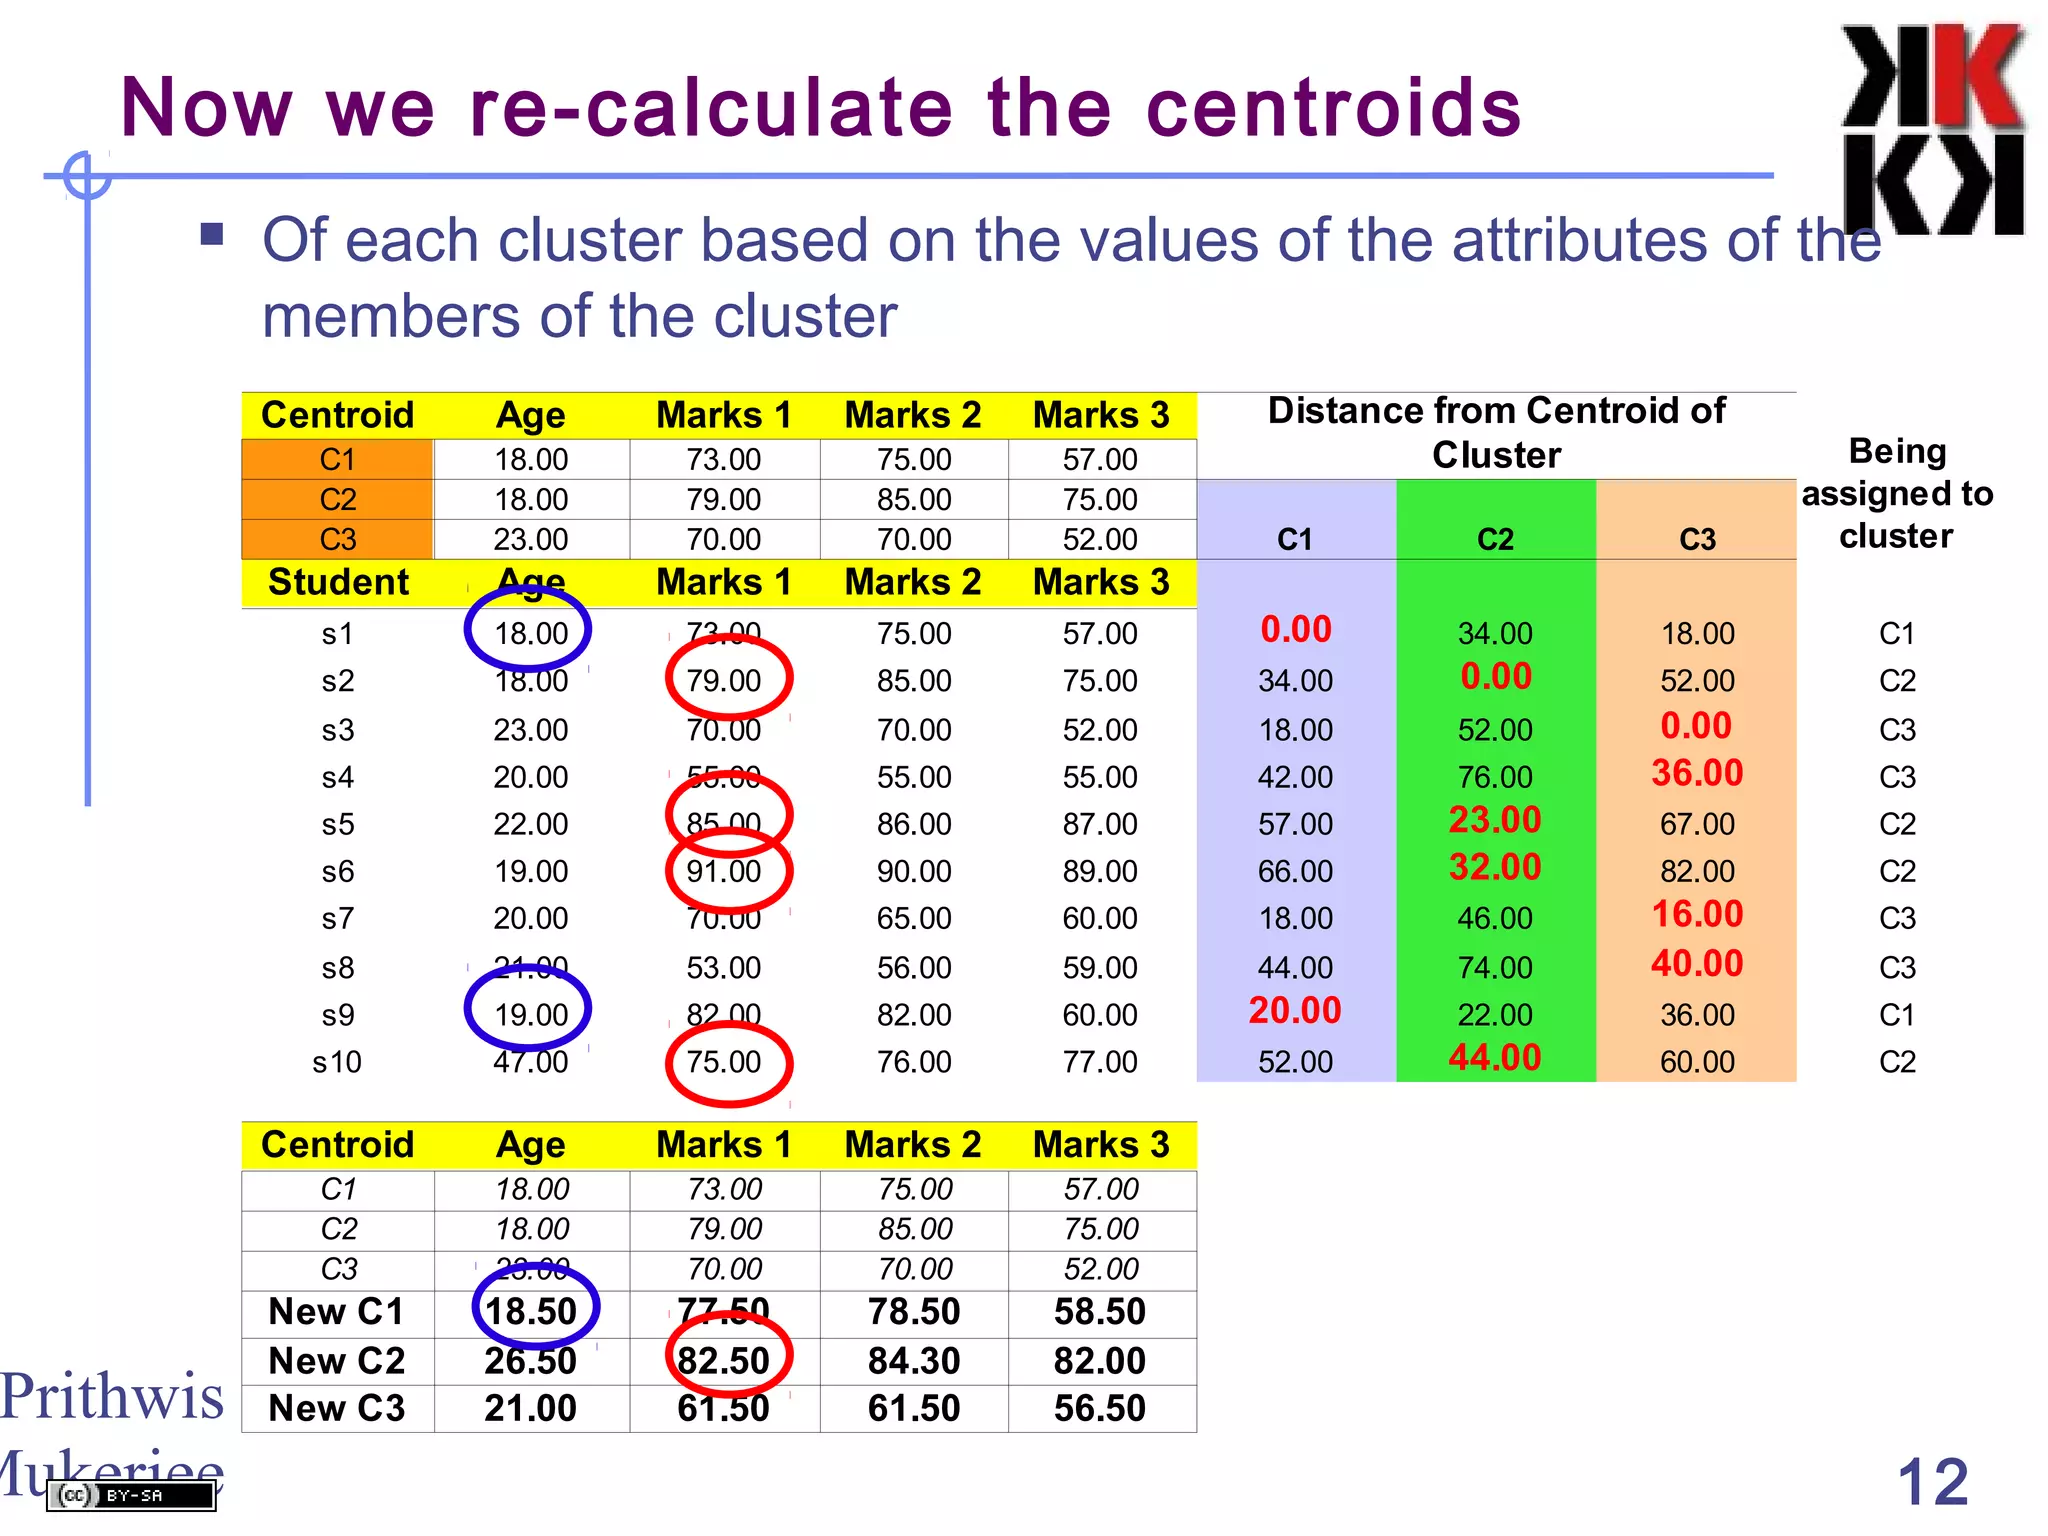
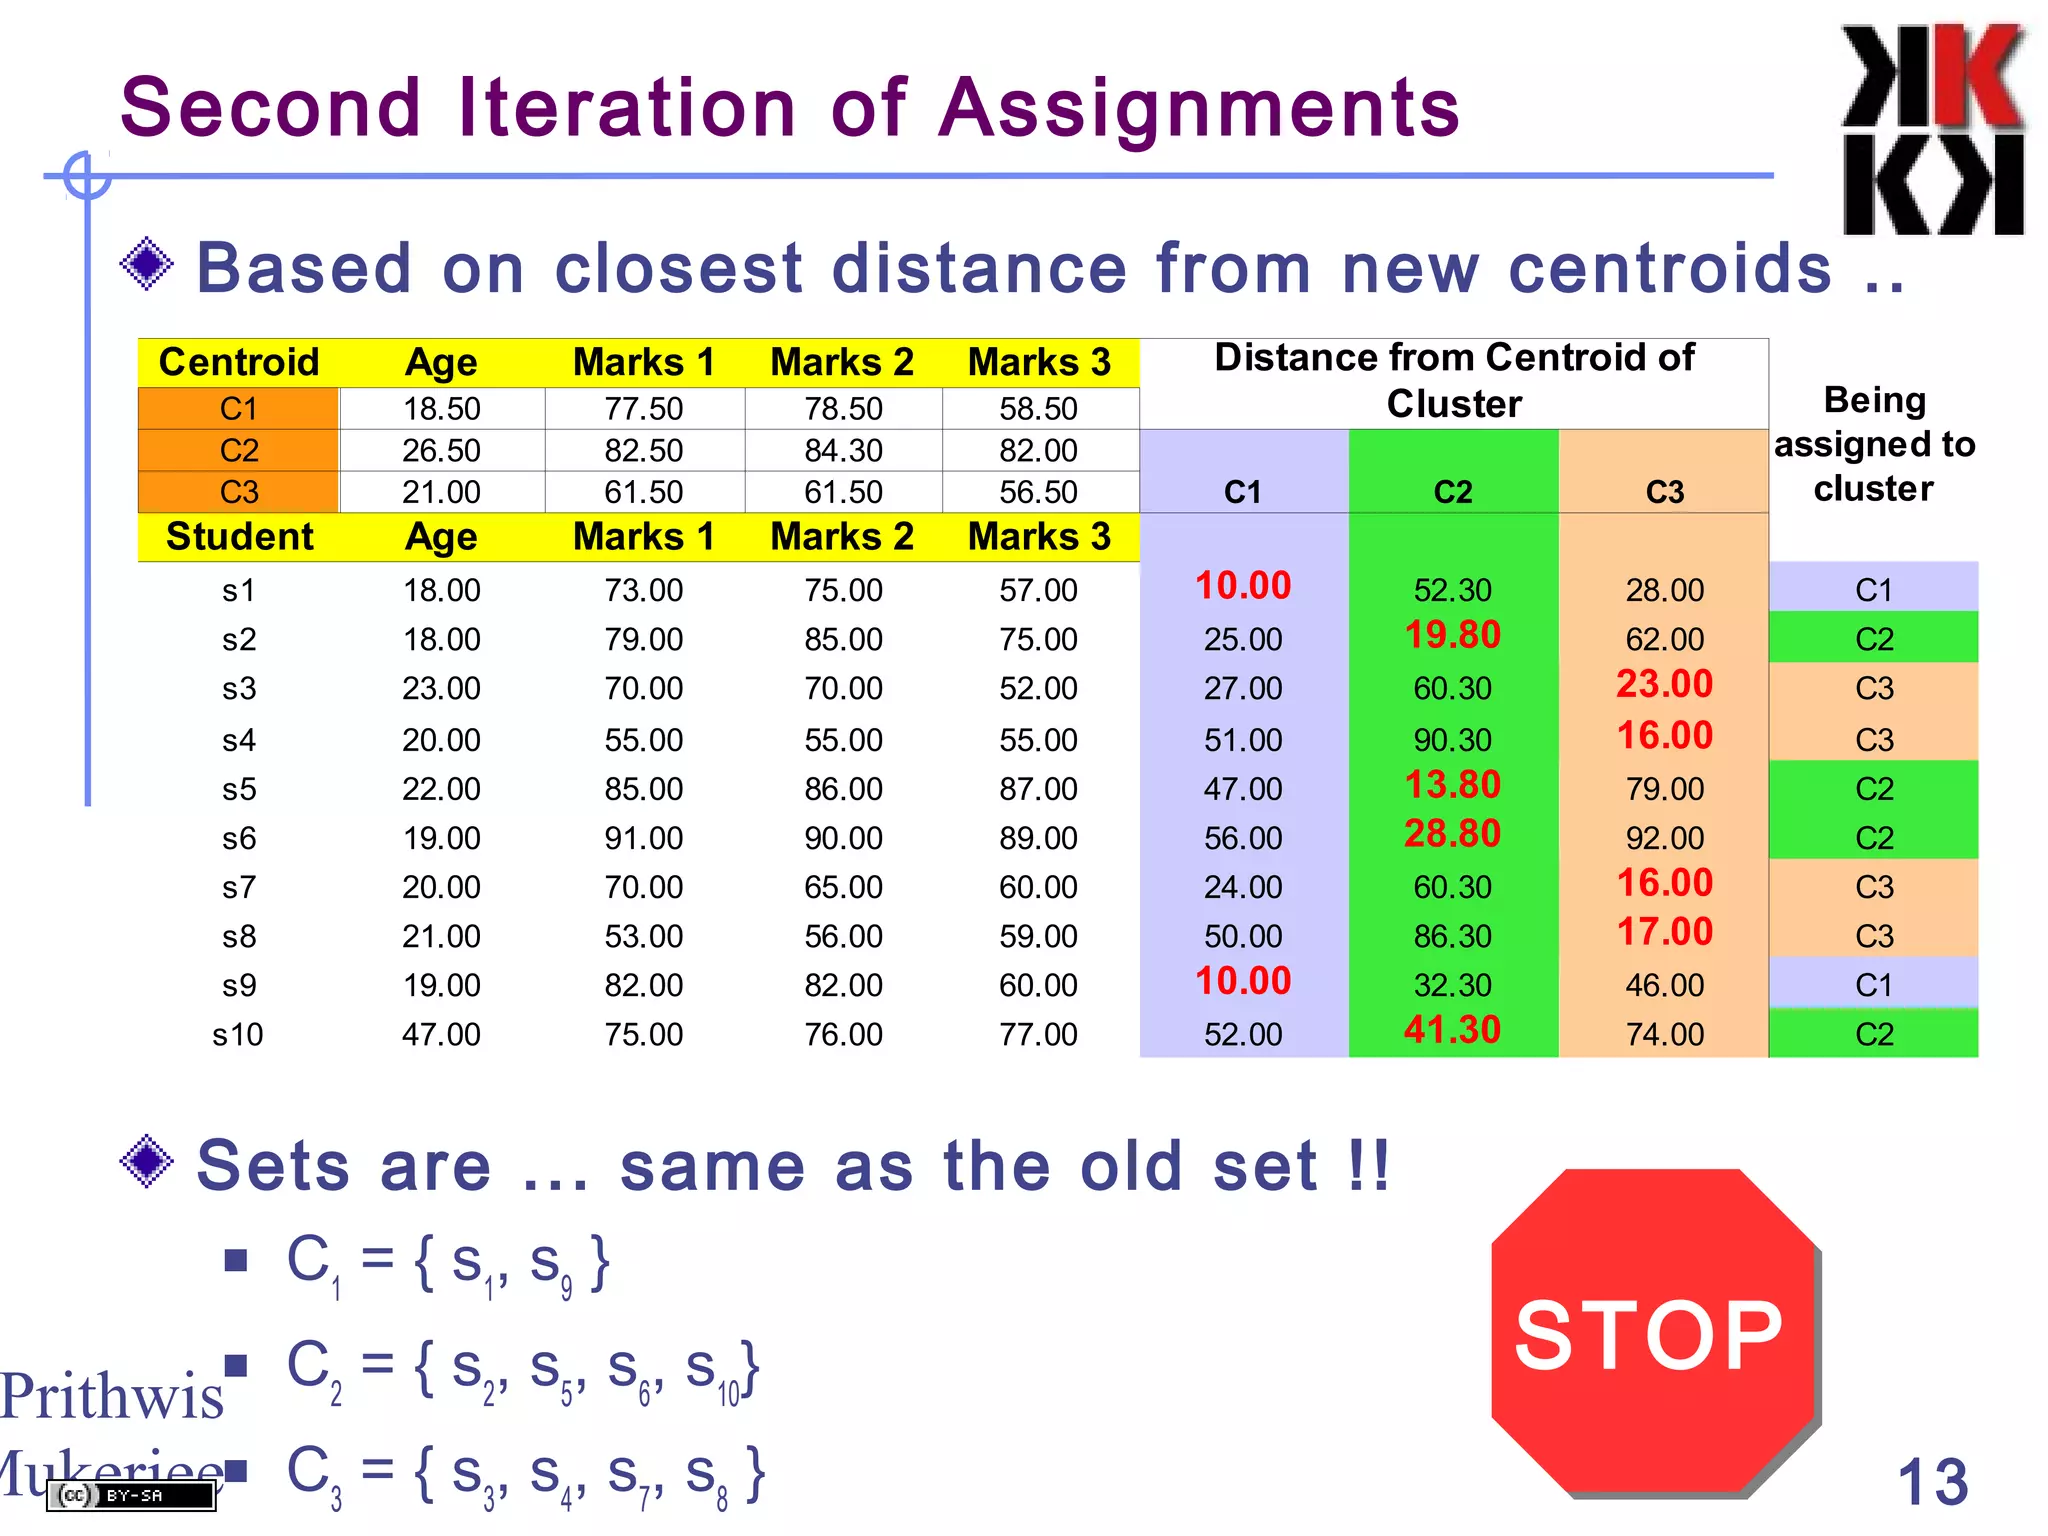
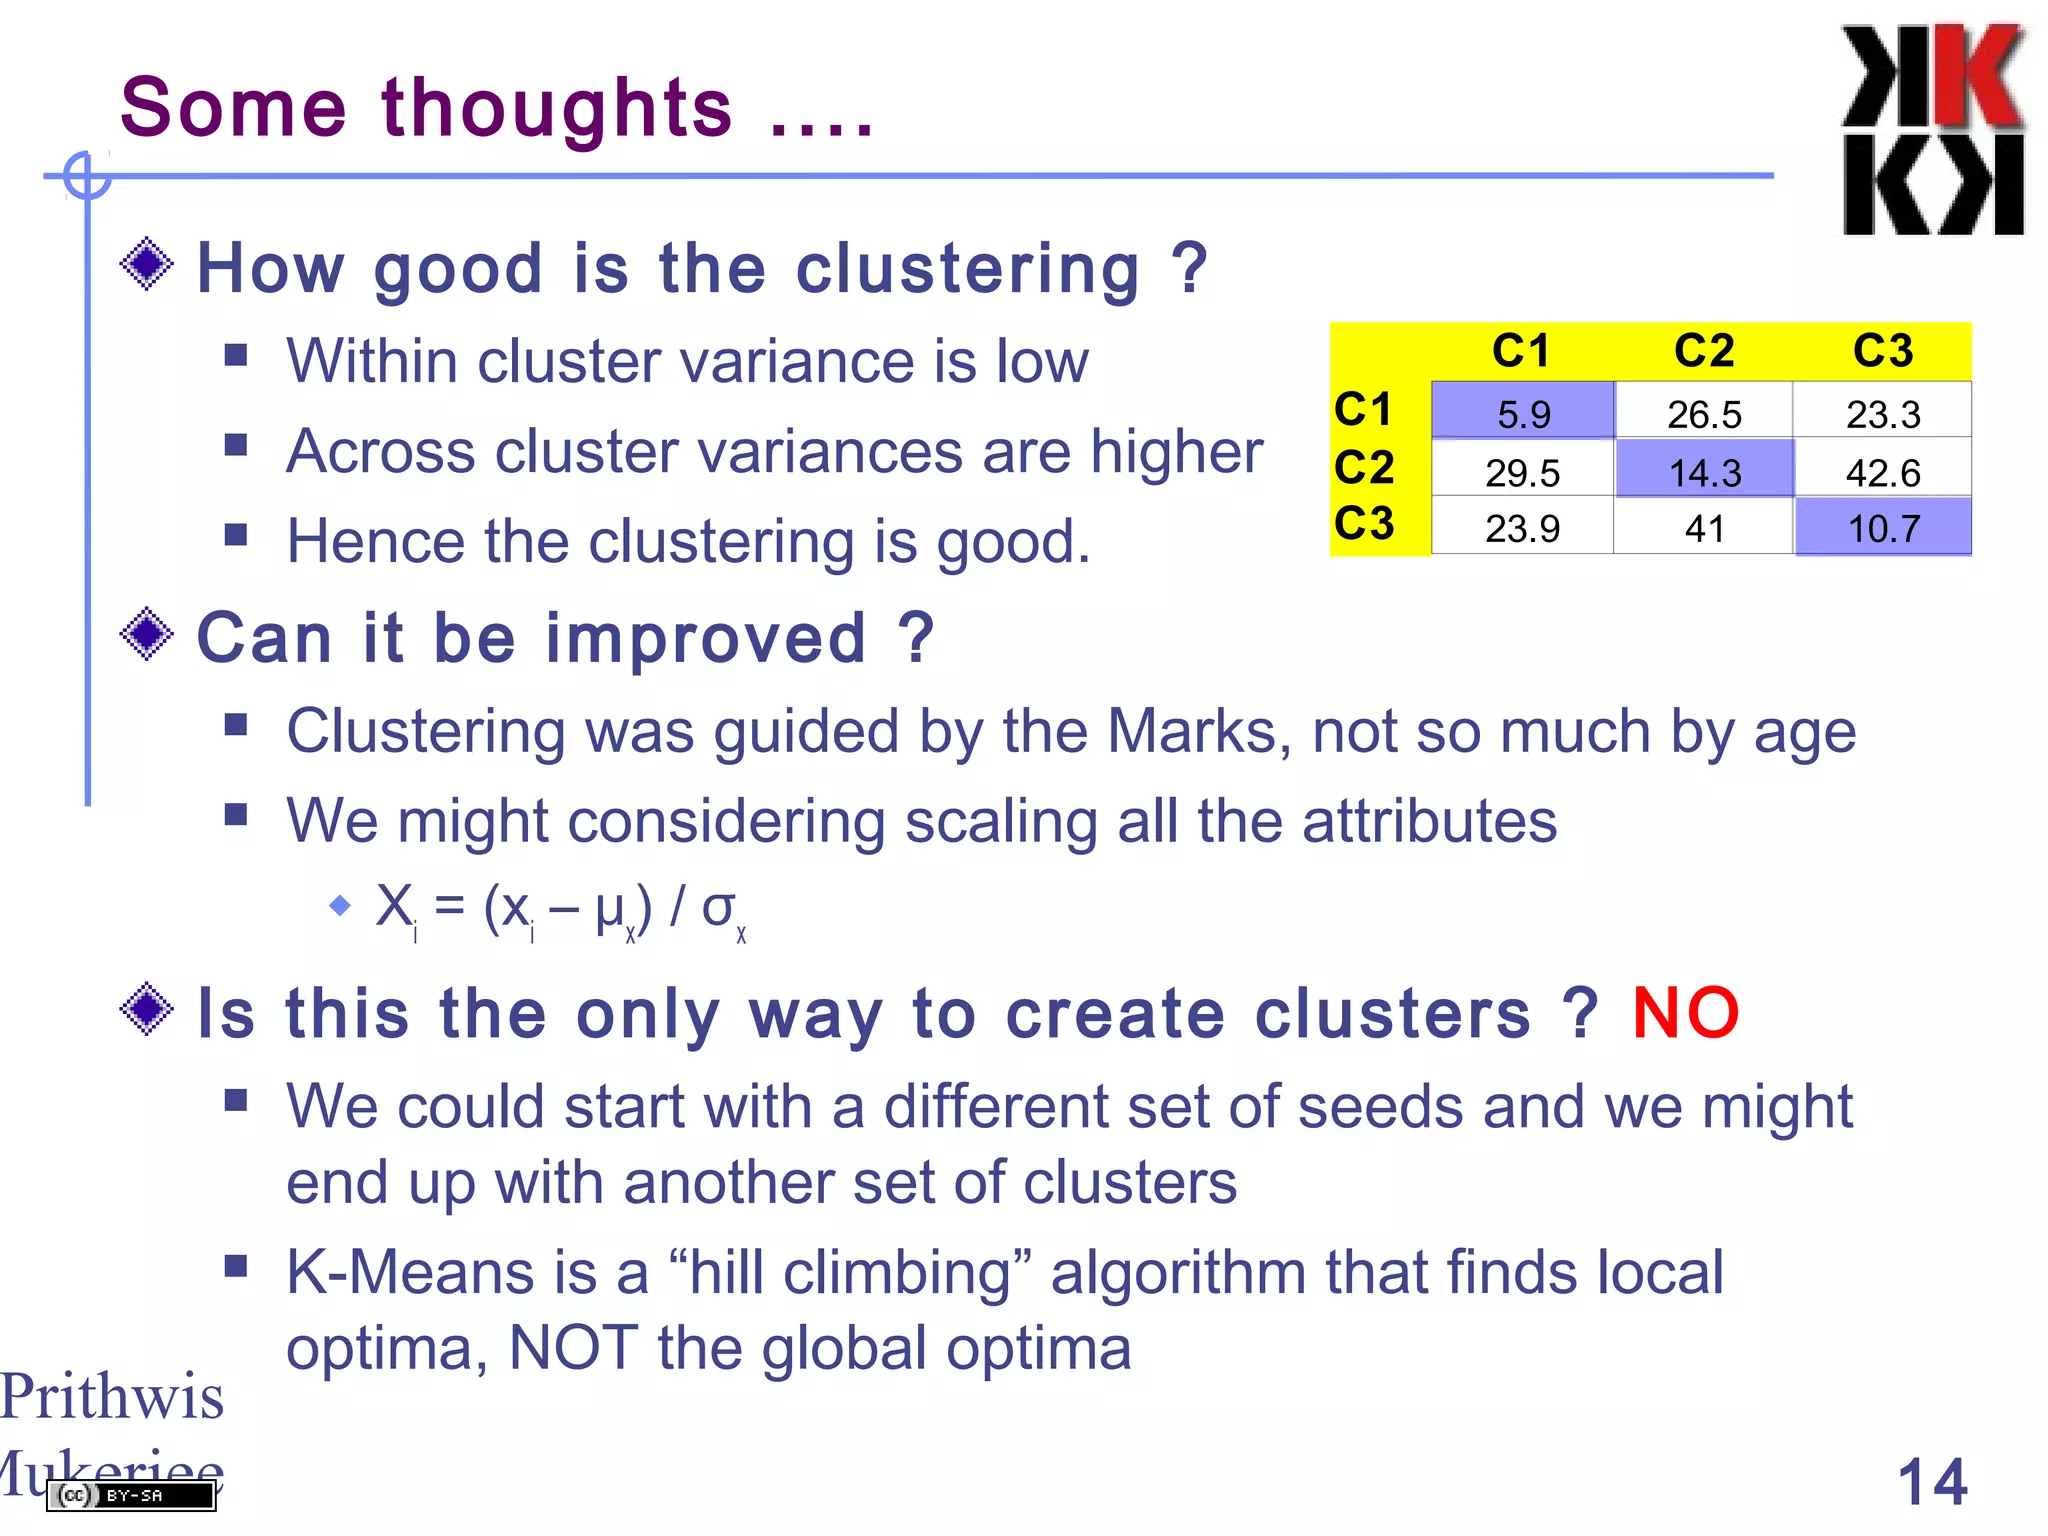
KEMBAR78
Data mining clustering-2009-v0 | PPT
Data Mining
Cluster Analysis
Prithwis Mukerjee, Ph.D.
Prithwis
Mukerjee 2
If we were using “Classification”
Name Eggs Pouch Flies Feathers Class
Cockatoo Yes No Yes Yes Bird
Dugong No No No No Mammal
Echidna Yes Yes No No Marsupial
Emu Yes No No Yes Bird
Kangaroo No Yes No No Marsupial
Koala No Yes No No Marsupial
Kokkabura Yes No Yes Yes Bird
Owl Yes No Yes Yes Bird
Penguin Yes No No Yes Bird
Platypus Yes No No No Mammal
Possum No Yes No No Marsupial
Wombat No Yes No No Marsupial
We would be looking at a data like this ...
Prithwis
Mukerjee 3
But in “Cluster Analysis” we do NOT have
Name Eggs Pouch Flies Feathers Class
Cockatoo Yes No Yes Yes Bird
No No No No Mammal
Yes Yes No No Marsupial
Emu Yes No No Yes Bird
Kangaroo No Yes No No Marsupial
Koala No Yes No No Marsupial
Yes No Yes Yes Bird
Owl Yes No Yes Yes Bird
Penguin Yes No No Yes Bird
Platypus Yes No No No Mammal
Possum No Yes No No Marsupial
Wombat No Yes No No Marsupial
Dugong
Echidna
Kokkabura
Previous knowledge or expertise to define these
classes !!
We have to look at the attributes alone and
somehow group the data into clusters.
Prithwis
Mukerjee 4
What is a cluster ?
A cluster contains objects that are “similar”
There is no unique definition of similarity. It
depends on the situation
 Elements of the periodic table
 Can be clustered along physical or chemical properties
 Customer can be clustered as
 High value, High “pain” or high “ maintainance”, High volume,
....
 Risky, credit worthy, suspicious ....
So similarity will depend on
 Choice of attributes of an object
 A credible definition of “similarity” of these attributes
 The “distance” between two objects based on the values of
the respective attributes
Prithwis
Mukerjee 5
What is “distance” between two objects
This depends on the nature of the attribute
 Quantitative Attributes are easiest and most common
 Height, weight, value, price, score ...
 Distance can be the difference between values
 Binary Attributes are also common, but not easy
 Gender, Marital Status, Employment status ...
 Distance can be in terms of the RATIO OF number of
attributes with same value TO the total number of similar
attributes
 Quality nominal attributes, similar to binary attributes, but
can take more than two values, that are NOT ranked
 Religion, Complexion, Colour of Hair ..
 Quality ordinal attributes that can be ranked in some order
 Size ( S, M, L, XL ), Grade (A, B, C, D)
 Can be converted to a numerical scale
Prithwis
Mukerjee 6
“Distance” between two objects
There are many ways to calculate distance
but ...
All definitions of distance must have the
following properties
 Distance is always positive
 Distance from object X ( or point X ) to itself must be zero
 Distance (X ⇒ Y) ≤ Distance (X ⇒ Z) + Distance (Z ⇒ Y)
 Distance (X ⇒ Y) = Distance (Y ⇒ X)
Care must be taken in choosing
 Attributes : use the most descriptive or discriminatory
attribute
 Scale of values : it may make sense to “normalise” all
distance metrics using the mean and standard deviation
 To guard against one attribute dominating over the others
Prithwis
Mukerjee 7
Finally : Distance
Euclidean Distance
 D(x,y) = √ ∑(xi
- yi
)2
 The L2
norm of the difference vector
Manhattan Distance
 D(x,y) = ∑ |xi
– yi
|
 The L1
norm of the difference vector yields similar results
Chebychev Distance
 D(x,y) = Max |xi
– yi
|
 Also called the L∞
norm
Categorical Data Distance
 D(x,y) = (number of times xi
= yi
) / N
 Where N is number of categorical attributes
Prithwis
Mukerjee 8
Clustering : Partitioning Method
Results in single level of partitioning
 Clusters are NOT nested inside other clusters
Given n objects define k ≤ n clusters
 Each cluster has at least one object
 Each object belongs to only one cluster
Objects assigned to clusters iteratively
 Objects may be reassigned to another cluster during the
process of clustering
The number of clusters is defined up front
Aim is to
 LOW variance WITHIN a cluster
 HIGH variance ACROSS different clusters
Prithwis
Mukerjee 9
Partitioning : K-means / K-median method
Set the number of clusters = k
Pick k seeds as 'centroids' of each cluster
 This may be done randomly OR intelligently
 Compute Distance of each object from centroid
 Euclidean : for K-means
 Manhattan : for K-median
 Allocate each object to a cluster depending on its proximity
to the centroid
Iteration
 Re-calculate centroid of each cluster, based on objects
 Re-compute distance of each object from centroid
 Re-allocate objects to clusters based on new centroid
Stop IF new clusters have same members as
old clusters, ELSE continue iteration
Prithwis
Mukerjee 10
Let us try to cluster this data ...
Our initial centroids are the first three students
 Though these could have been any other point
Student Age Marks 1 Marks 2 Marks 3
s1 18 73 75 57
s2 18 79 85 75
s3 23 70 70 52
s4 20 55 55 55
s5 22 85 86 87
s6 19 91 90 89
s7 20 70 65 60
s8 21 53 56 59
s9 19 82 82 60
s10 47 75 76 77
Centroid Age Marks 1 Marks 2 Marks 3
C1 18 73 75 57
C2 18 79 85 75
C3 23 70 70 52
Prithwis
Mukerjee 11
We assign each student to a cluster
Based on closest distance from centroid
We note that
 C1
= { s1
, s9
}
 C2
= { s2
, s5
, s6
, s10
}
 C3
= { s3
, s4
, s7
, s8
}
Centroid Age Marks 1 Marks 2 Marks 3
C1 18.00 73.00 75.00 57.00
C2 18.00 79.00 85.00 75.00
C3 23.00 70.00 70.00 52.00 C1 C2 C3
Student Age Marks 1 Marks 2 Marks 3
s1 18.00 73.00 75.00 57.00 0.00 34.00 18.00 C1
s2 18.00 79.00 85.00 75.00 34.00 0.00 52.00 C2
s3 23.00 70.00 70.00 52.00 18.00 52.00 0.00 C3
s4 20.00 55.00 55.00 55.00 42.00 76.00 36.00 C3
s5 22.00 85.00 86.00 87.00 57.00 23.00 67.00 C2
s6 19.00 91.00 90.00 89.00 66.00 32.00 82.00 C2
s7 20.00 70.00 65.00 60.00 18.00 46.00 16.00 C3
s8 21.00 53.00 56.00 59.00 44.00 74.00 40.00 C3
s9 19.00 82.00 82.00 60.00 20.00 22.00 36.00 C1
s10 47.00 75.00 76.00 77.00 52.00 44.00 60.00 C2
Distance from Centroid of
Cluster Being
assigned to
cluster
Prithwis
Mukerjee 12
Now we re-calculate the centroids
 Of each cluster based on the values of the attributes of the
members of the cluster
Centroid Age Marks 1 Marks 2 Marks 3
C1 18.00 73.00 75.00 57.00
C2 18.00 79.00 85.00 75.00
C3 23.00 70.00 70.00 52.00 C1 C2 C3
Student Age Marks 1 Marks 2 Marks 3
s1 18.00 73.00 75.00 57.00 0.00 34.00 18.00 C1
s2 18.00 79.00 85.00 75.00 34.00 0.00 52.00 C2
s3 23.00 70.00 70.00 52.00 18.00 52.00 0.00 C3
s4 20.00 55.00 55.00 55.00 42.00 76.00 36.00 C3
s5 22.00 85.00 86.00 87.00 57.00 23.00 67.00 C2
s6 19.00 91.00 90.00 89.00 66.00 32.00 82.00 C2
s7 20.00 70.00 65.00 60.00 18.00 46.00 16.00 C3
s8 21.00 53.00 56.00 59.00 44.00 74.00 40.00 C3
s9 19.00 82.00 82.00 60.00 20.00 22.00 36.00 C1
s10 47.00 75.00 76.00 77.00 52.00 44.00 60.00 C2
Centroid Age Marks 1 Marks 2 Marks 3
C1 18.00 73.00 75.00 57.00
C2 18.00 79.00 85.00 75.00
C3 23.00 70.00 70.00 52.00
New C1 18.50 77.50 78.50 58.50
New C2 26.50 82.50 84.30 82.00
New C3 21.00 61.50 61.50 56.50
Distance from Centroid of
Cluster Being
assigned to
cluster
Prithwis
Mukerjee 13
Second Iteration of Assignments
Based on closest distance from new centroids ..
Sets are ... same as the old set !!
 C1
= { s1
, s9
}
 C2
= { s2
, s5
, s6
, s10
}
 C3
= { s3
, s4
, s7
, s8
}
Centroid Age Marks 1 Marks 2 Marks 3
C1 18.50 77.50 78.50 58.50
C2 26.50 82.50 84.30 82.00
C3 21.00 61.50 61.50 56.50 C1 C2 C3
Student Age Marks 1 Marks 2 Marks 3
s1 18.00 73.00 75.00 57.00 10.00 52.30 28.00 C1
s2 18.00 79.00 85.00 75.00 25.00 19.80 62.00 C2
s3 23.00 70.00 70.00 52.00 27.00 60.30 23.00 C3
s4 20.00 55.00 55.00 55.00 51.00 90.30 16.00 C3
s5 22.00 85.00 86.00 87.00 47.00 13.80 79.00 C2
s6 19.00 91.00 90.00 89.00 56.00 28.80 92.00 C2
s7 20.00 70.00 65.00 60.00 24.00 60.30 16.00 C3
s8 21.00 53.00 56.00 59.00 50.00 86.30 17.00 C3
s9 19.00 82.00 82.00 60.00 10.00 32.30 46.00 C1
s10 47.00 75.00 76.00 77.00 52.00 41.30 74.00 C2
Distance from Centroid of
Cluster Being
assigned to
cluster
STOPSTOP
Prithwis
Mukerjee 14
Some thoughts ....
How good is the clustering ?
 Within cluster variance is low
 Across cluster variances are higher
 Hence the clustering is good.
Can it be improved ?
 Clustering was guided by the Marks, not so much by age
 We might considering scaling all the attributes
 Xi
= (xi
– μx
) / σx
Is this the only way to create clusters ? NO
 We could start with a different set of seeds and we might
end up with another set of clusters
 K-Means is a “hill climbing” algorithm that finds local
optima, NOT the global optima
C1 C2 C3
C1 5.9 26.5 23.3
C2 29.5 14.3 42.6
C3 23.9 41 10.7

Data mining clustering-2009-v0

  • 1.
  • 2.
    Prithwis Mukerjee 2 If wewere using “Classification” Name Eggs Pouch Flies Feathers Class Cockatoo Yes No Yes Yes Bird Dugong No No No No Mammal Echidna Yes Yes No No Marsupial Emu Yes No No Yes Bird Kangaroo No Yes No No Marsupial Koala No Yes No No Marsupial Kokkabura Yes No Yes Yes Bird Owl Yes No Yes Yes Bird Penguin Yes No No Yes Bird Platypus Yes No No No Mammal Possum No Yes No No Marsupial Wombat No Yes No No Marsupial We would be looking at a data like this ...
  • 3.
    Prithwis Mukerjee 3 But in“Cluster Analysis” we do NOT have Name Eggs Pouch Flies Feathers Class Cockatoo Yes No Yes Yes Bird No No No No Mammal Yes Yes No No Marsupial Emu Yes No No Yes Bird Kangaroo No Yes No No Marsupial Koala No Yes No No Marsupial Yes No Yes Yes Bird Owl Yes No Yes Yes Bird Penguin Yes No No Yes Bird Platypus Yes No No No Mammal Possum No Yes No No Marsupial Wombat No Yes No No Marsupial Dugong Echidna Kokkabura Previous knowledge or expertise to define these classes !! We have to look at the attributes alone and somehow group the data into clusters.
  • 4.
    Prithwis Mukerjee 4 What isa cluster ? A cluster contains objects that are “similar” There is no unique definition of similarity. It depends on the situation  Elements of the periodic table  Can be clustered along physical or chemical properties  Customer can be clustered as  High value, High “pain” or high “ maintainance”, High volume, ....  Risky, credit worthy, suspicious .... So similarity will depend on  Choice of attributes of an object  A credible definition of “similarity” of these attributes  The “distance” between two objects based on the values of the respective attributes
  • 5.
    Prithwis Mukerjee 5 What is“distance” between two objects This depends on the nature of the attribute  Quantitative Attributes are easiest and most common  Height, weight, value, price, score ...  Distance can be the difference between values  Binary Attributes are also common, but not easy  Gender, Marital Status, Employment status ...  Distance can be in terms of the RATIO OF number of attributes with same value TO the total number of similar attributes  Quality nominal attributes, similar to binary attributes, but can take more than two values, that are NOT ranked  Religion, Complexion, Colour of Hair ..  Quality ordinal attributes that can be ranked in some order  Size ( S, M, L, XL ), Grade (A, B, C, D)  Can be converted to a numerical scale
  • 6.
    Prithwis Mukerjee 6 “Distance” betweentwo objects There are many ways to calculate distance but ... All definitions of distance must have the following properties  Distance is always positive  Distance from object X ( or point X ) to itself must be zero  Distance (X ⇒ Y) ≤ Distance (X ⇒ Z) + Distance (Z ⇒ Y)  Distance (X ⇒ Y) = Distance (Y ⇒ X) Care must be taken in choosing  Attributes : use the most descriptive or discriminatory attribute  Scale of values : it may make sense to “normalise” all distance metrics using the mean and standard deviation  To guard against one attribute dominating over the others
  • 7.
    Prithwis Mukerjee 7 Finally :Distance Euclidean Distance  D(x,y) = √ ∑(xi - yi )2  The L2 norm of the difference vector Manhattan Distance  D(x,y) = ∑ |xi – yi |  The L1 norm of the difference vector yields similar results Chebychev Distance  D(x,y) = Max |xi – yi |  Also called the L∞ norm Categorical Data Distance  D(x,y) = (number of times xi = yi ) / N  Where N is number of categorical attributes
  • 8.
    Prithwis Mukerjee 8 Clustering :Partitioning Method Results in single level of partitioning  Clusters are NOT nested inside other clusters Given n objects define k ≤ n clusters  Each cluster has at least one object  Each object belongs to only one cluster Objects assigned to clusters iteratively  Objects may be reassigned to another cluster during the process of clustering The number of clusters is defined up front Aim is to  LOW variance WITHIN a cluster  HIGH variance ACROSS different clusters
  • 9.
    Prithwis Mukerjee 9 Partitioning :K-means / K-median method Set the number of clusters = k Pick k seeds as 'centroids' of each cluster  This may be done randomly OR intelligently  Compute Distance of each object from centroid  Euclidean : for K-means  Manhattan : for K-median  Allocate each object to a cluster depending on its proximity to the centroid Iteration  Re-calculate centroid of each cluster, based on objects  Re-compute distance of each object from centroid  Re-allocate objects to clusters based on new centroid Stop IF new clusters have same members as old clusters, ELSE continue iteration
  • 10.
    Prithwis Mukerjee 10 Let ustry to cluster this data ... Our initial centroids are the first three students  Though these could have been any other point Student Age Marks 1 Marks 2 Marks 3 s1 18 73 75 57 s2 18 79 85 75 s3 23 70 70 52 s4 20 55 55 55 s5 22 85 86 87 s6 19 91 90 89 s7 20 70 65 60 s8 21 53 56 59 s9 19 82 82 60 s10 47 75 76 77 Centroid Age Marks 1 Marks 2 Marks 3 C1 18 73 75 57 C2 18 79 85 75 C3 23 70 70 52
  • 11.
    Prithwis Mukerjee 11 We assigneach student to a cluster Based on closest distance from centroid We note that  C1 = { s1 , s9 }  C2 = { s2 , s5 , s6 , s10 }  C3 = { s3 , s4 , s7 , s8 } Centroid Age Marks 1 Marks 2 Marks 3 C1 18.00 73.00 75.00 57.00 C2 18.00 79.00 85.00 75.00 C3 23.00 70.00 70.00 52.00 C1 C2 C3 Student Age Marks 1 Marks 2 Marks 3 s1 18.00 73.00 75.00 57.00 0.00 34.00 18.00 C1 s2 18.00 79.00 85.00 75.00 34.00 0.00 52.00 C2 s3 23.00 70.00 70.00 52.00 18.00 52.00 0.00 C3 s4 20.00 55.00 55.00 55.00 42.00 76.00 36.00 C3 s5 22.00 85.00 86.00 87.00 57.00 23.00 67.00 C2 s6 19.00 91.00 90.00 89.00 66.00 32.00 82.00 C2 s7 20.00 70.00 65.00 60.00 18.00 46.00 16.00 C3 s8 21.00 53.00 56.00 59.00 44.00 74.00 40.00 C3 s9 19.00 82.00 82.00 60.00 20.00 22.00 36.00 C1 s10 47.00 75.00 76.00 77.00 52.00 44.00 60.00 C2 Distance from Centroid of Cluster Being assigned to cluster
  • 12.
    Prithwis Mukerjee 12 Now were-calculate the centroids  Of each cluster based on the values of the attributes of the members of the cluster Centroid Age Marks 1 Marks 2 Marks 3 C1 18.00 73.00 75.00 57.00 C2 18.00 79.00 85.00 75.00 C3 23.00 70.00 70.00 52.00 C1 C2 C3 Student Age Marks 1 Marks 2 Marks 3 s1 18.00 73.00 75.00 57.00 0.00 34.00 18.00 C1 s2 18.00 79.00 85.00 75.00 34.00 0.00 52.00 C2 s3 23.00 70.00 70.00 52.00 18.00 52.00 0.00 C3 s4 20.00 55.00 55.00 55.00 42.00 76.00 36.00 C3 s5 22.00 85.00 86.00 87.00 57.00 23.00 67.00 C2 s6 19.00 91.00 90.00 89.00 66.00 32.00 82.00 C2 s7 20.00 70.00 65.00 60.00 18.00 46.00 16.00 C3 s8 21.00 53.00 56.00 59.00 44.00 74.00 40.00 C3 s9 19.00 82.00 82.00 60.00 20.00 22.00 36.00 C1 s10 47.00 75.00 76.00 77.00 52.00 44.00 60.00 C2 Centroid Age Marks 1 Marks 2 Marks 3 C1 18.00 73.00 75.00 57.00 C2 18.00 79.00 85.00 75.00 C3 23.00 70.00 70.00 52.00 New C1 18.50 77.50 78.50 58.50 New C2 26.50 82.50 84.30 82.00 New C3 21.00 61.50 61.50 56.50 Distance from Centroid of Cluster Being assigned to cluster
  • 13.
    Prithwis Mukerjee 13 Second Iterationof Assignments Based on closest distance from new centroids .. Sets are ... same as the old set !!  C1 = { s1 , s9 }  C2 = { s2 , s5 , s6 , s10 }  C3 = { s3 , s4 , s7 , s8 } Centroid Age Marks 1 Marks 2 Marks 3 C1 18.50 77.50 78.50 58.50 C2 26.50 82.50 84.30 82.00 C3 21.00 61.50 61.50 56.50 C1 C2 C3 Student Age Marks 1 Marks 2 Marks 3 s1 18.00 73.00 75.00 57.00 10.00 52.30 28.00 C1 s2 18.00 79.00 85.00 75.00 25.00 19.80 62.00 C2 s3 23.00 70.00 70.00 52.00 27.00 60.30 23.00 C3 s4 20.00 55.00 55.00 55.00 51.00 90.30 16.00 C3 s5 22.00 85.00 86.00 87.00 47.00 13.80 79.00 C2 s6 19.00 91.00 90.00 89.00 56.00 28.80 92.00 C2 s7 20.00 70.00 65.00 60.00 24.00 60.30 16.00 C3 s8 21.00 53.00 56.00 59.00 50.00 86.30 17.00 C3 s9 19.00 82.00 82.00 60.00 10.00 32.30 46.00 C1 s10 47.00 75.00 76.00 77.00 52.00 41.30 74.00 C2 Distance from Centroid of Cluster Being assigned to cluster STOPSTOP
  • 14.
    Prithwis Mukerjee 14 Some thoughts.... How good is the clustering ?  Within cluster variance is low  Across cluster variances are higher  Hence the clustering is good. Can it be improved ?  Clustering was guided by the Marks, not so much by age  We might considering scaling all the attributes  Xi = (xi – μx ) / σx Is this the only way to create clusters ? NO  We could start with a different set of seeds and we might end up with another set of clusters  K-Means is a “hill climbing” algorithm that finds local optima, NOT the global optima C1 C2 C3 C1 5.9 26.5 23.3 C2 29.5 14.3 42.6 C3 23.9 41 10.7