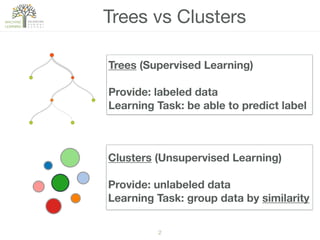
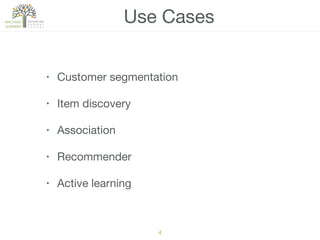
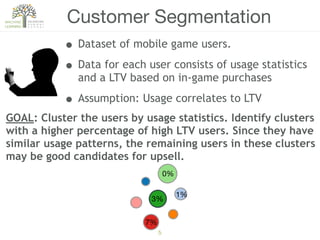
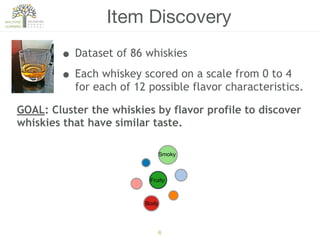
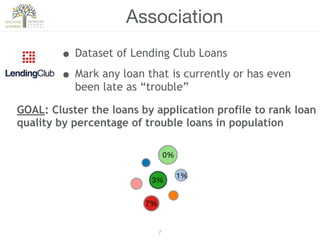
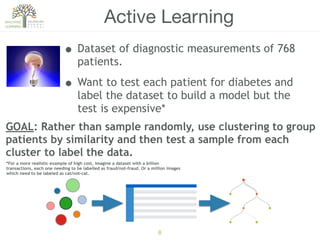
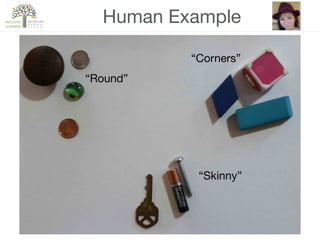
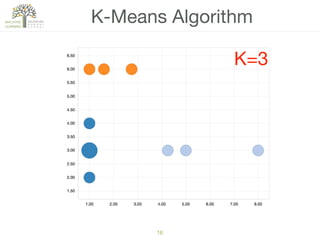
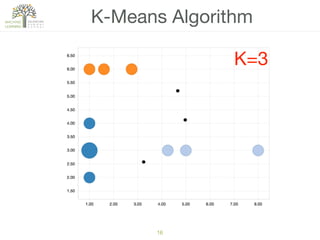
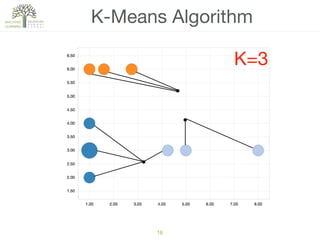
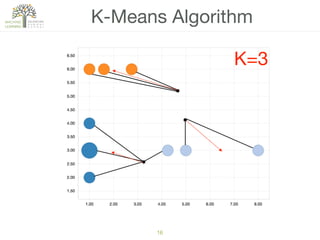
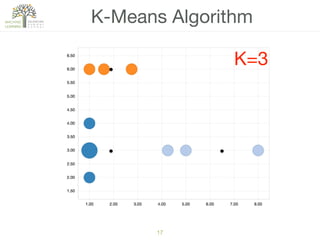
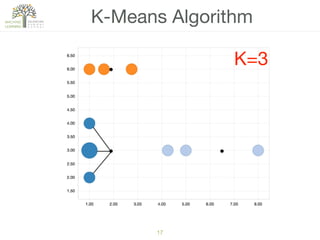
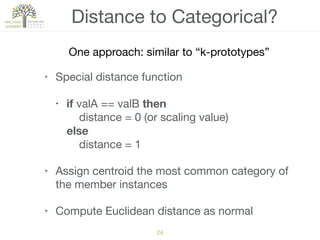
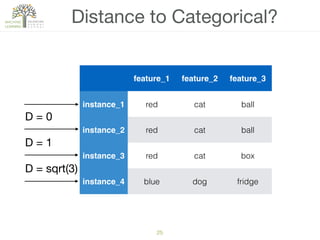
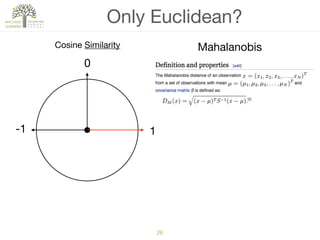
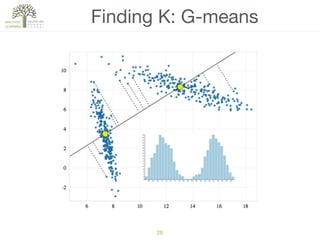
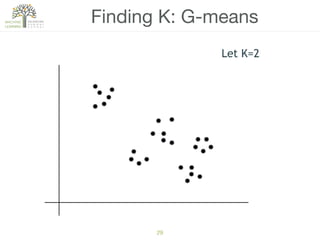
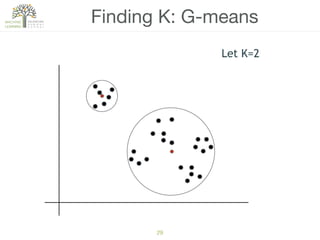
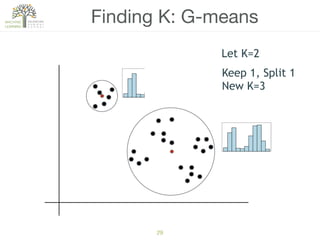
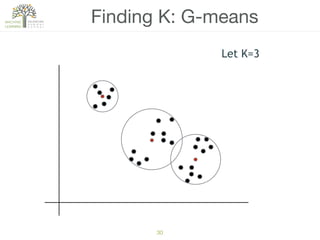
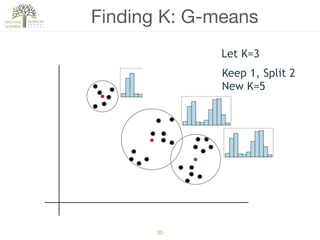
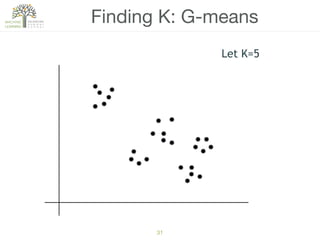
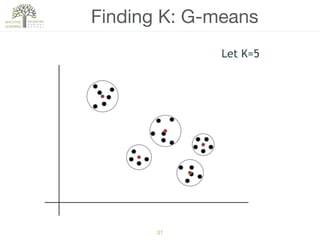
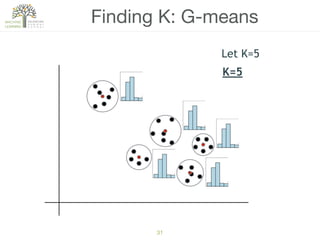
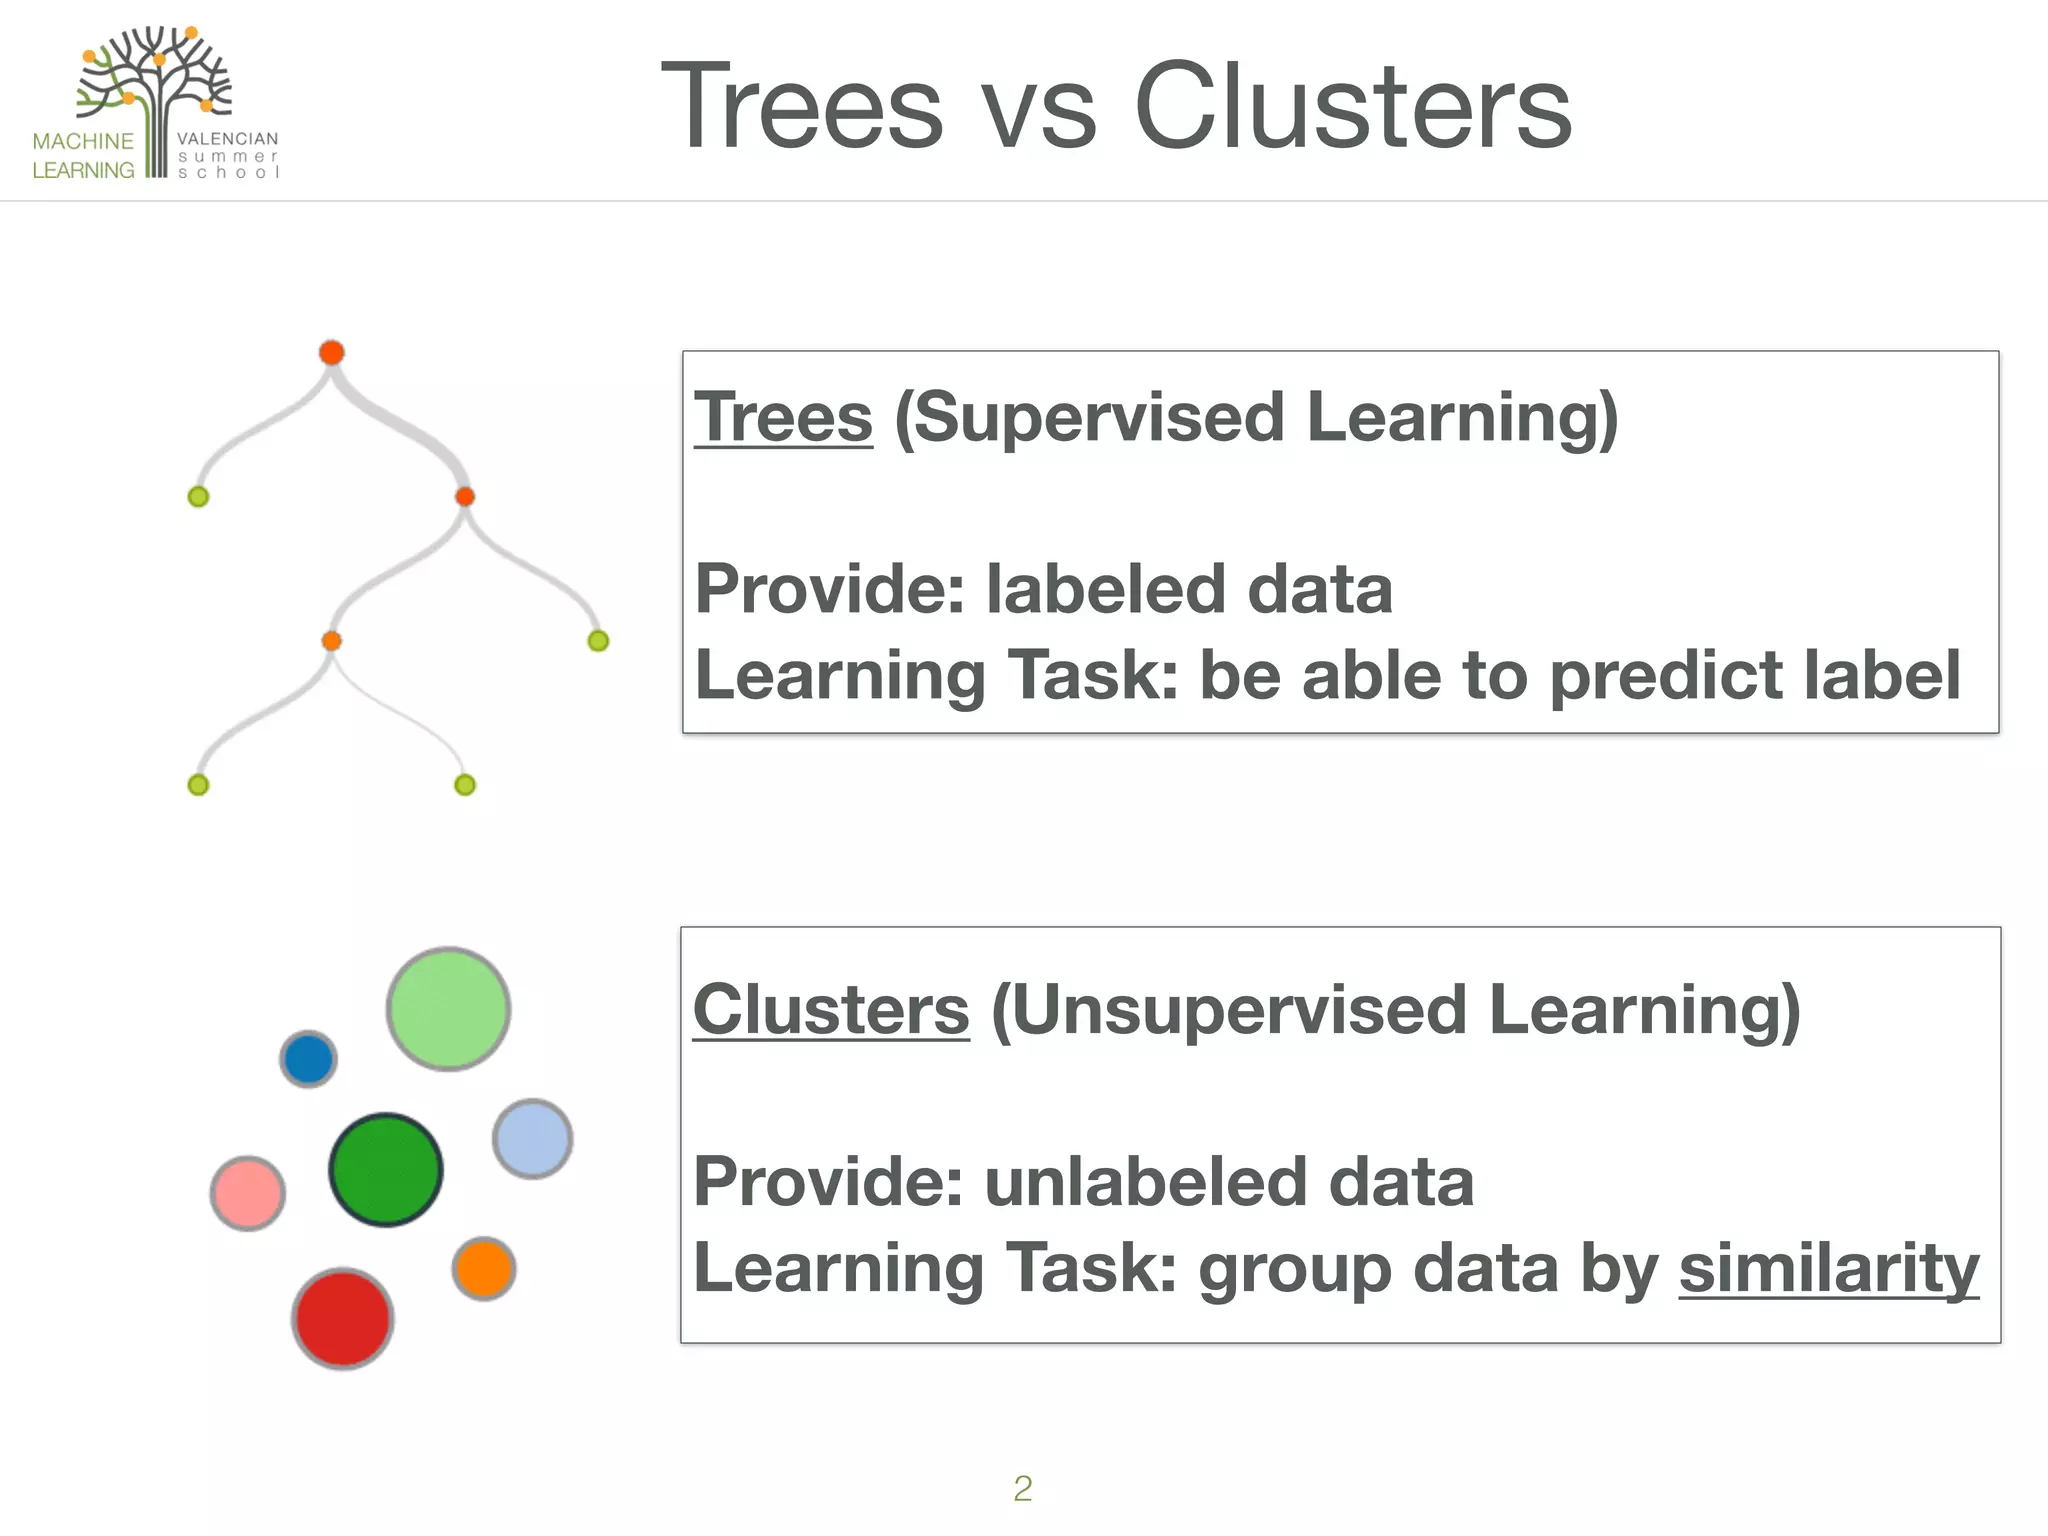
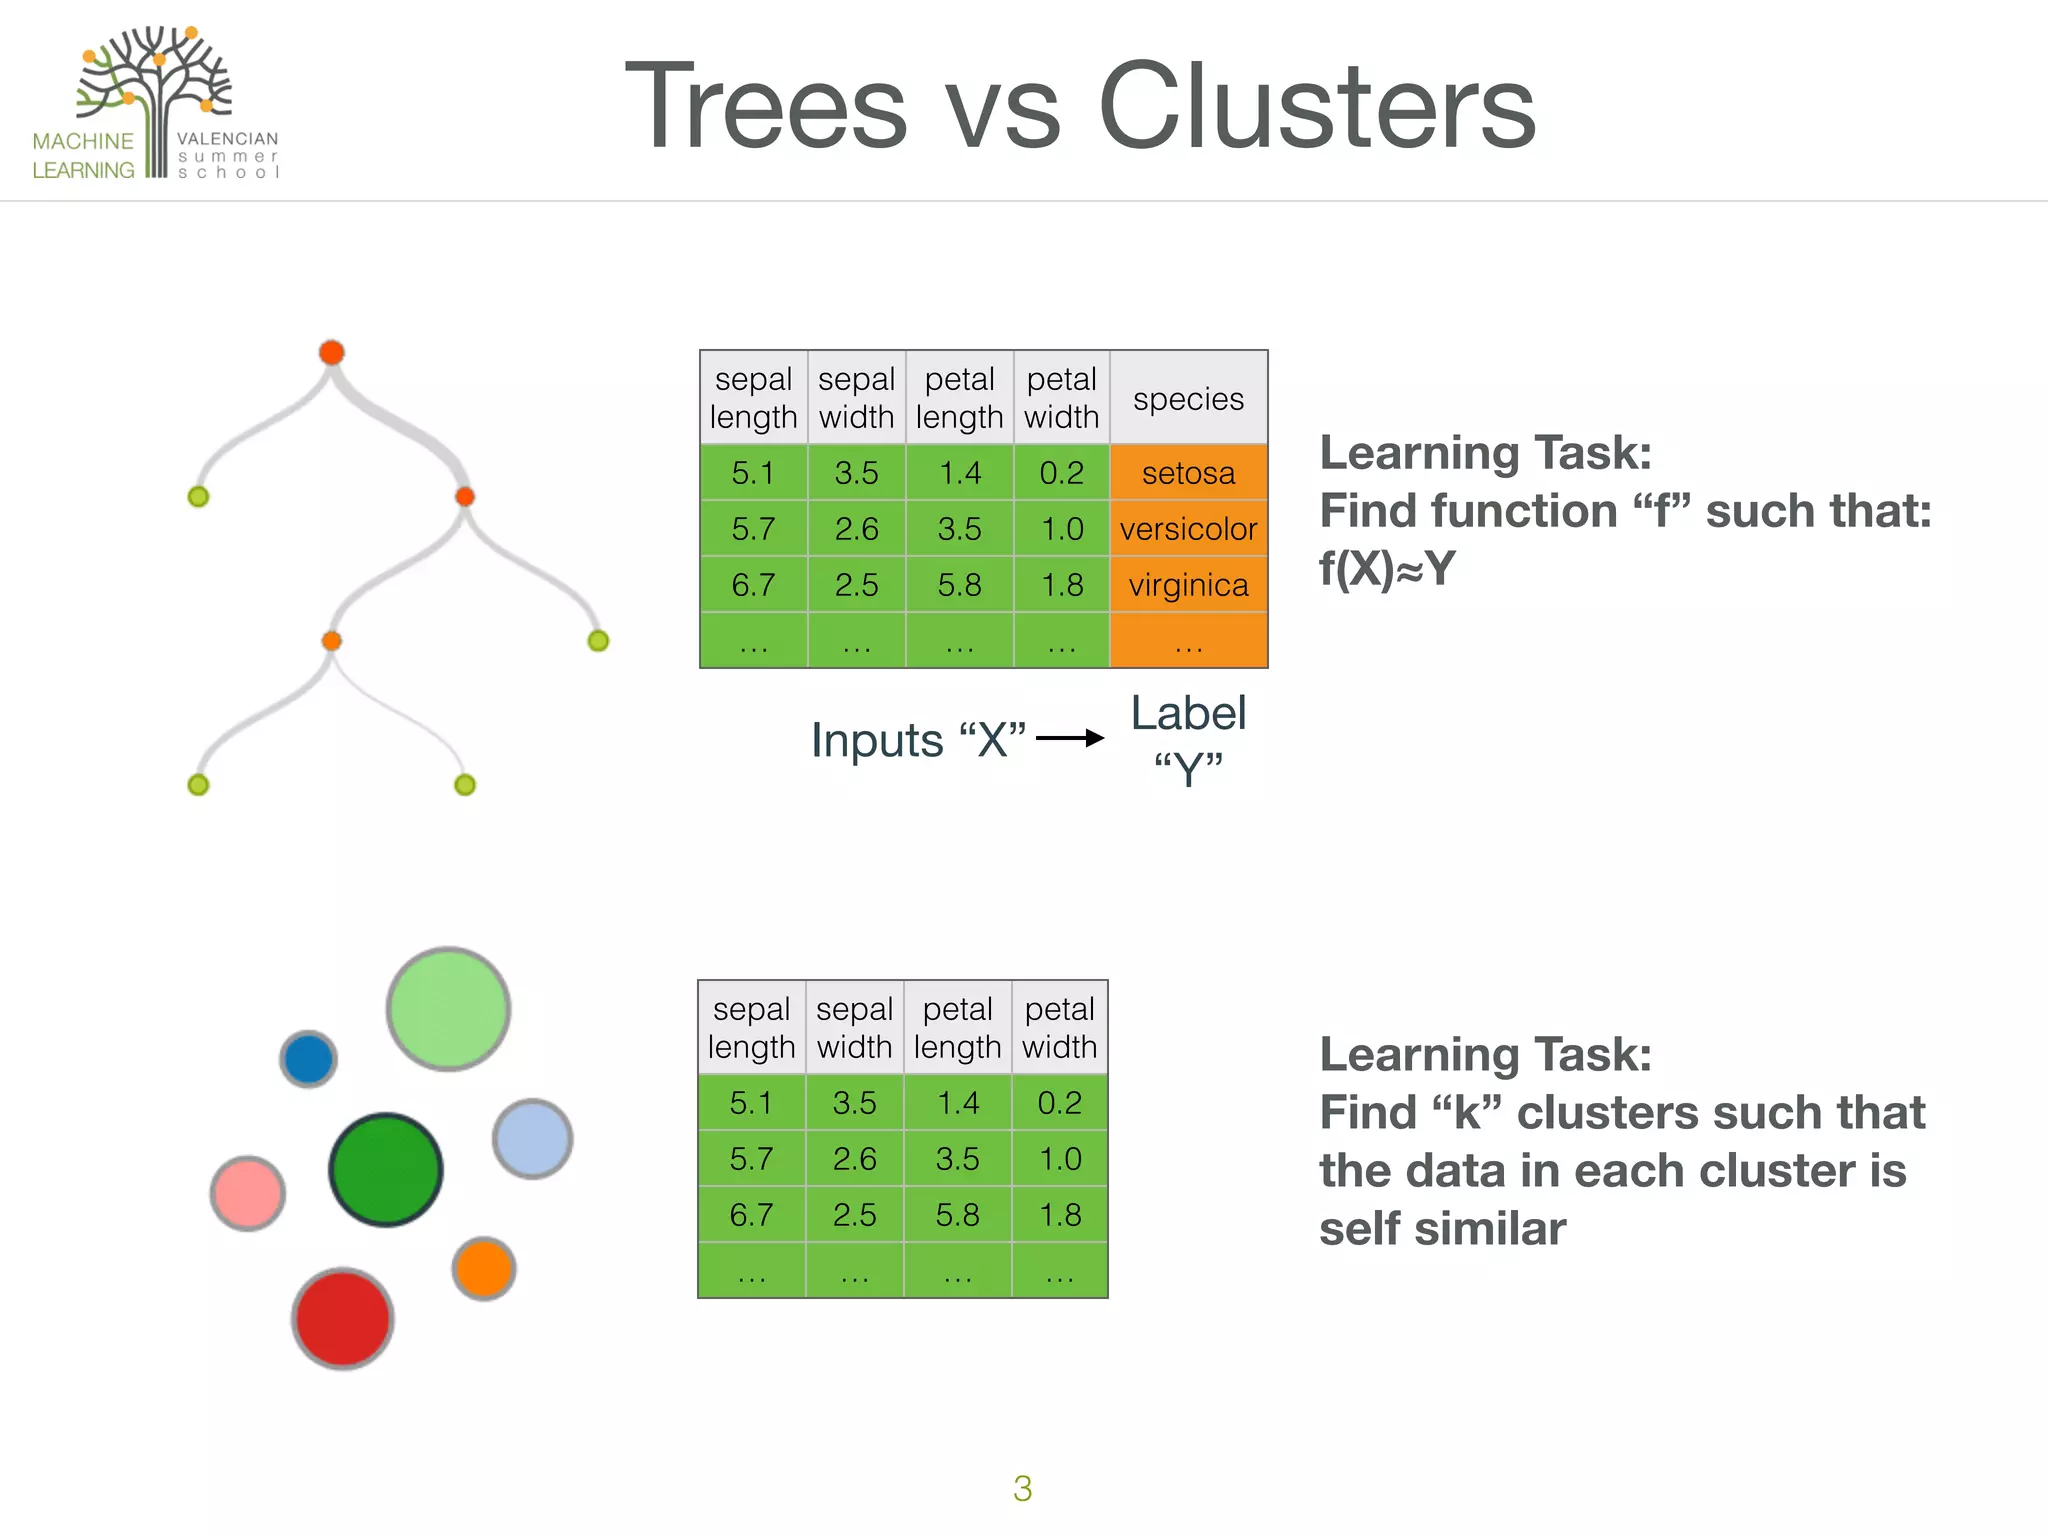
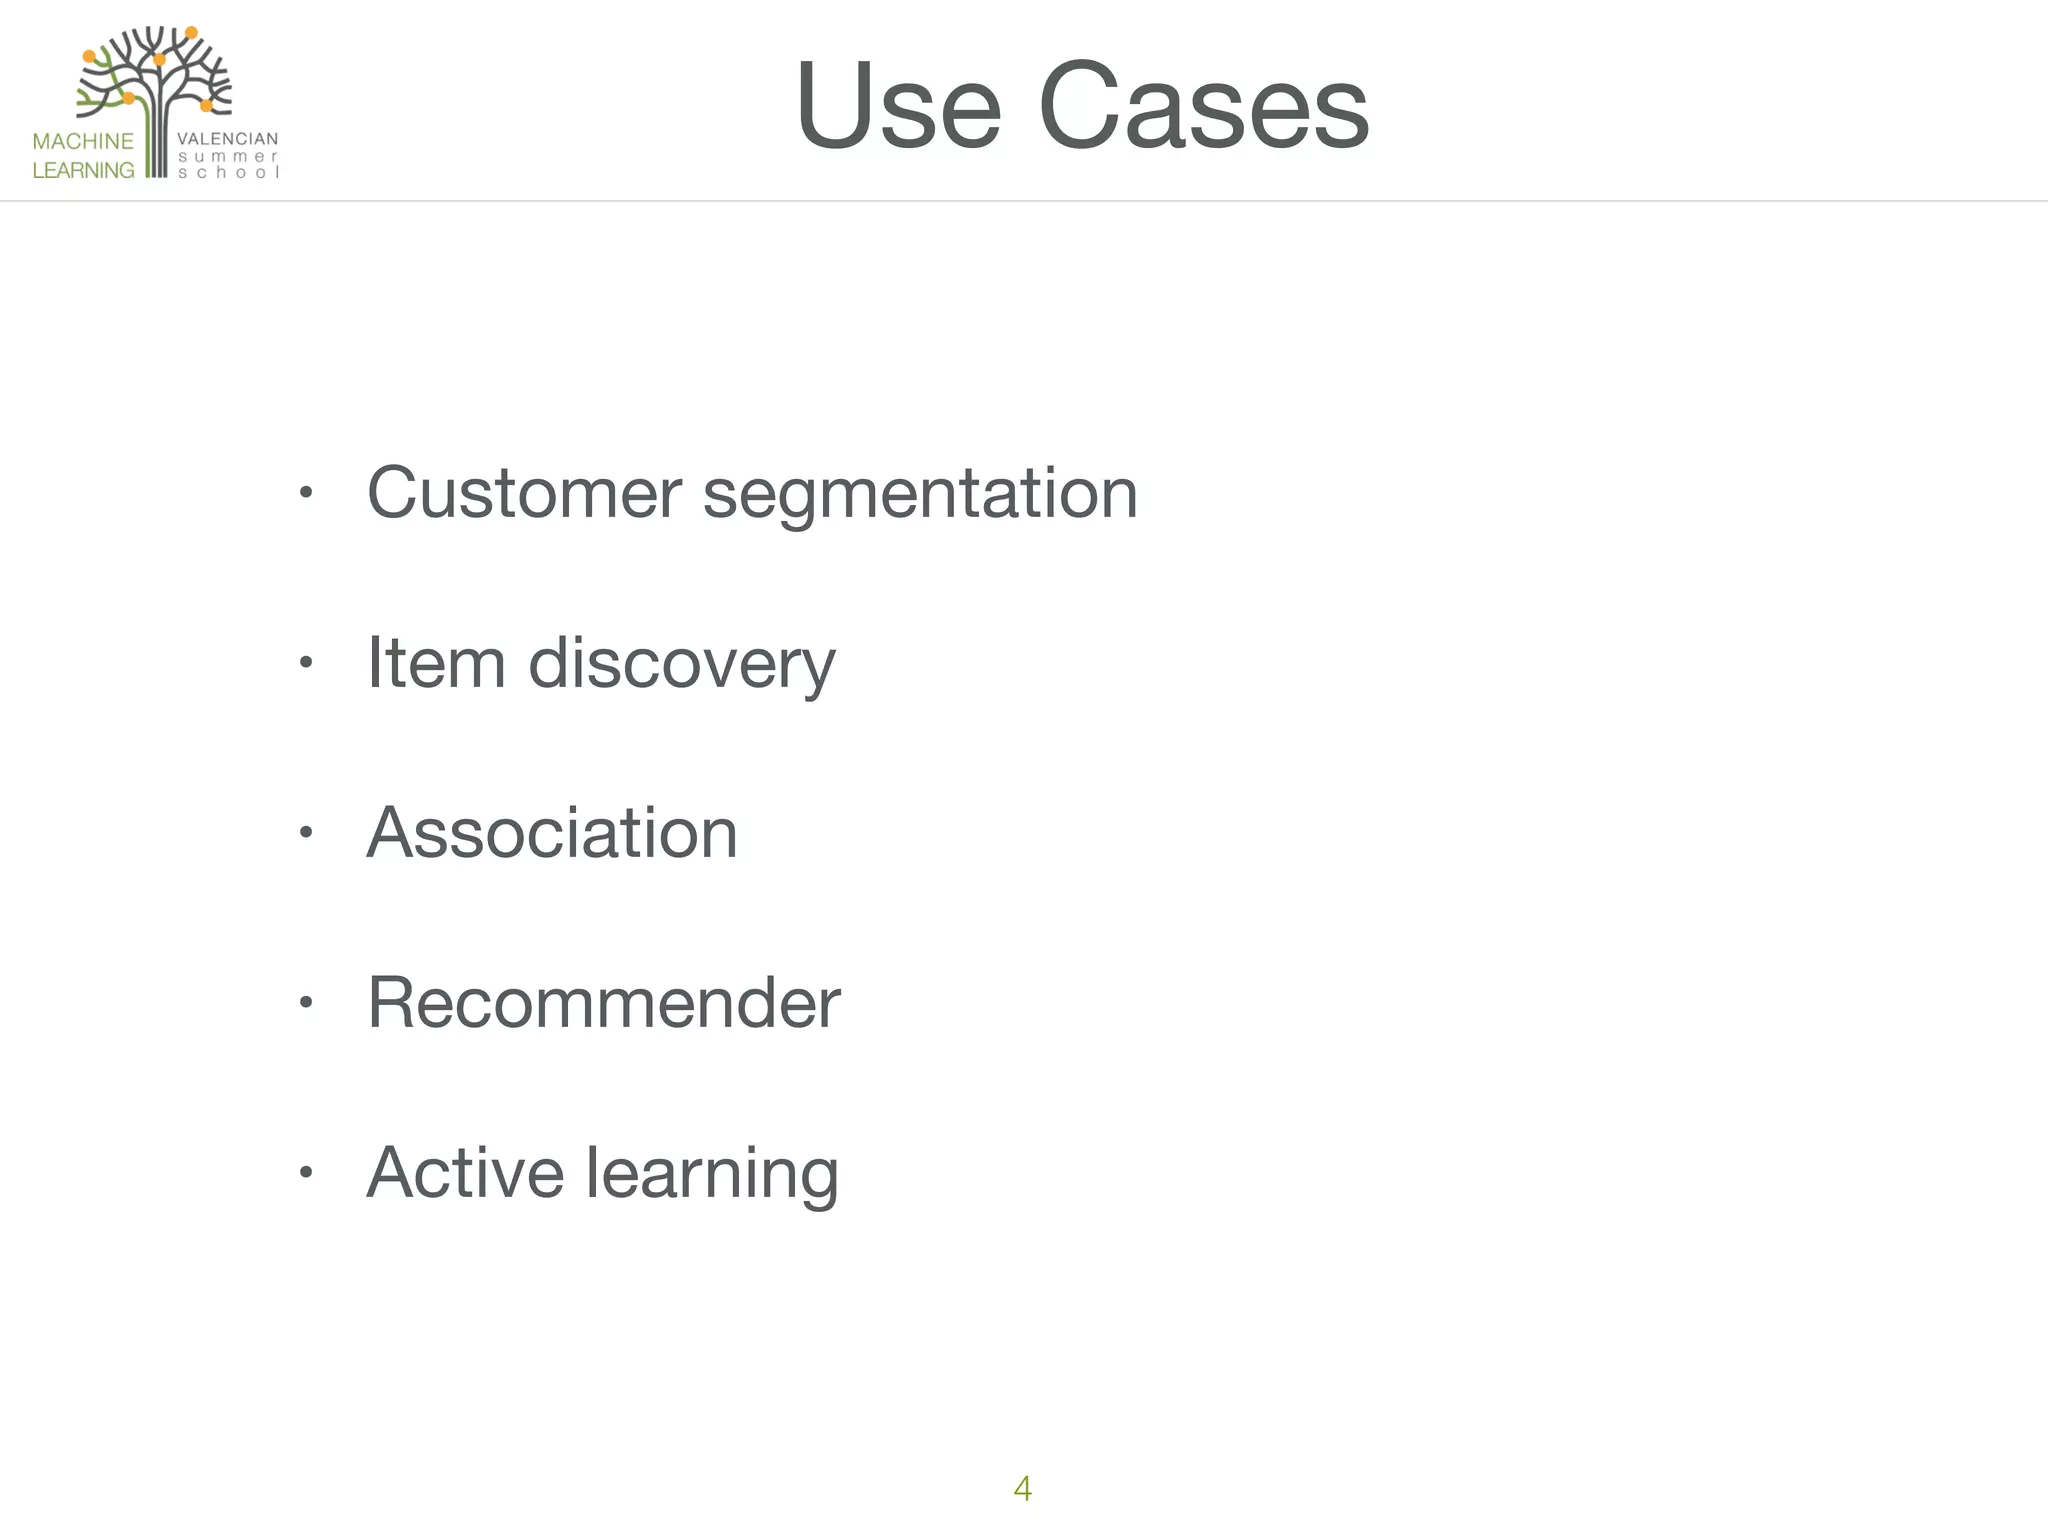
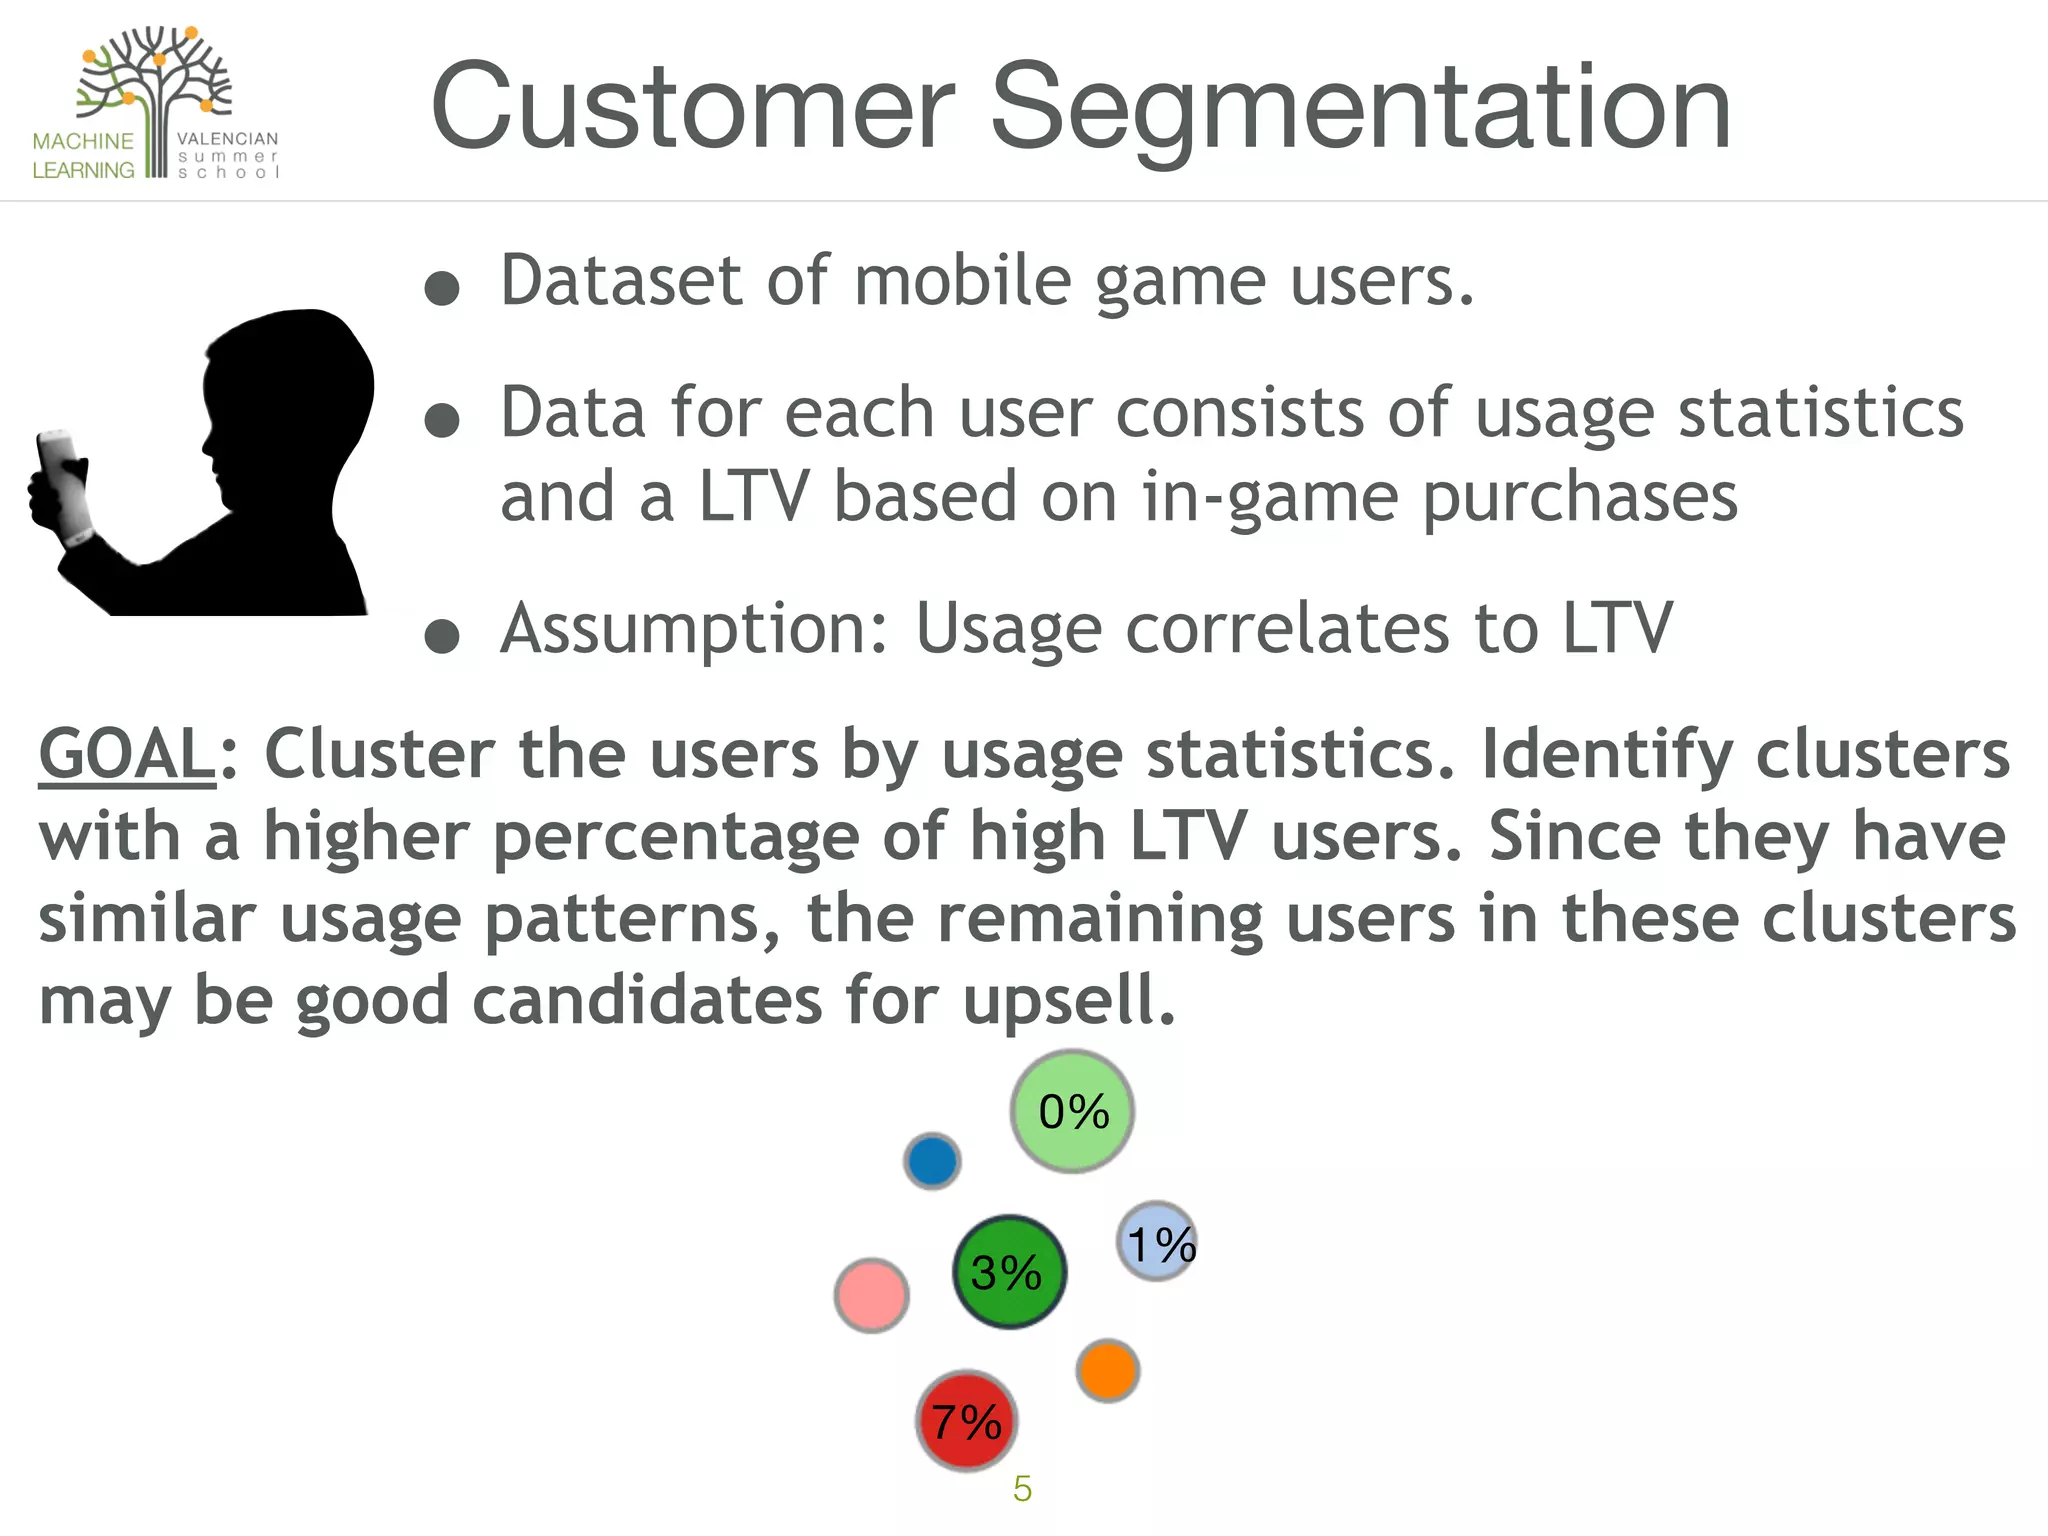
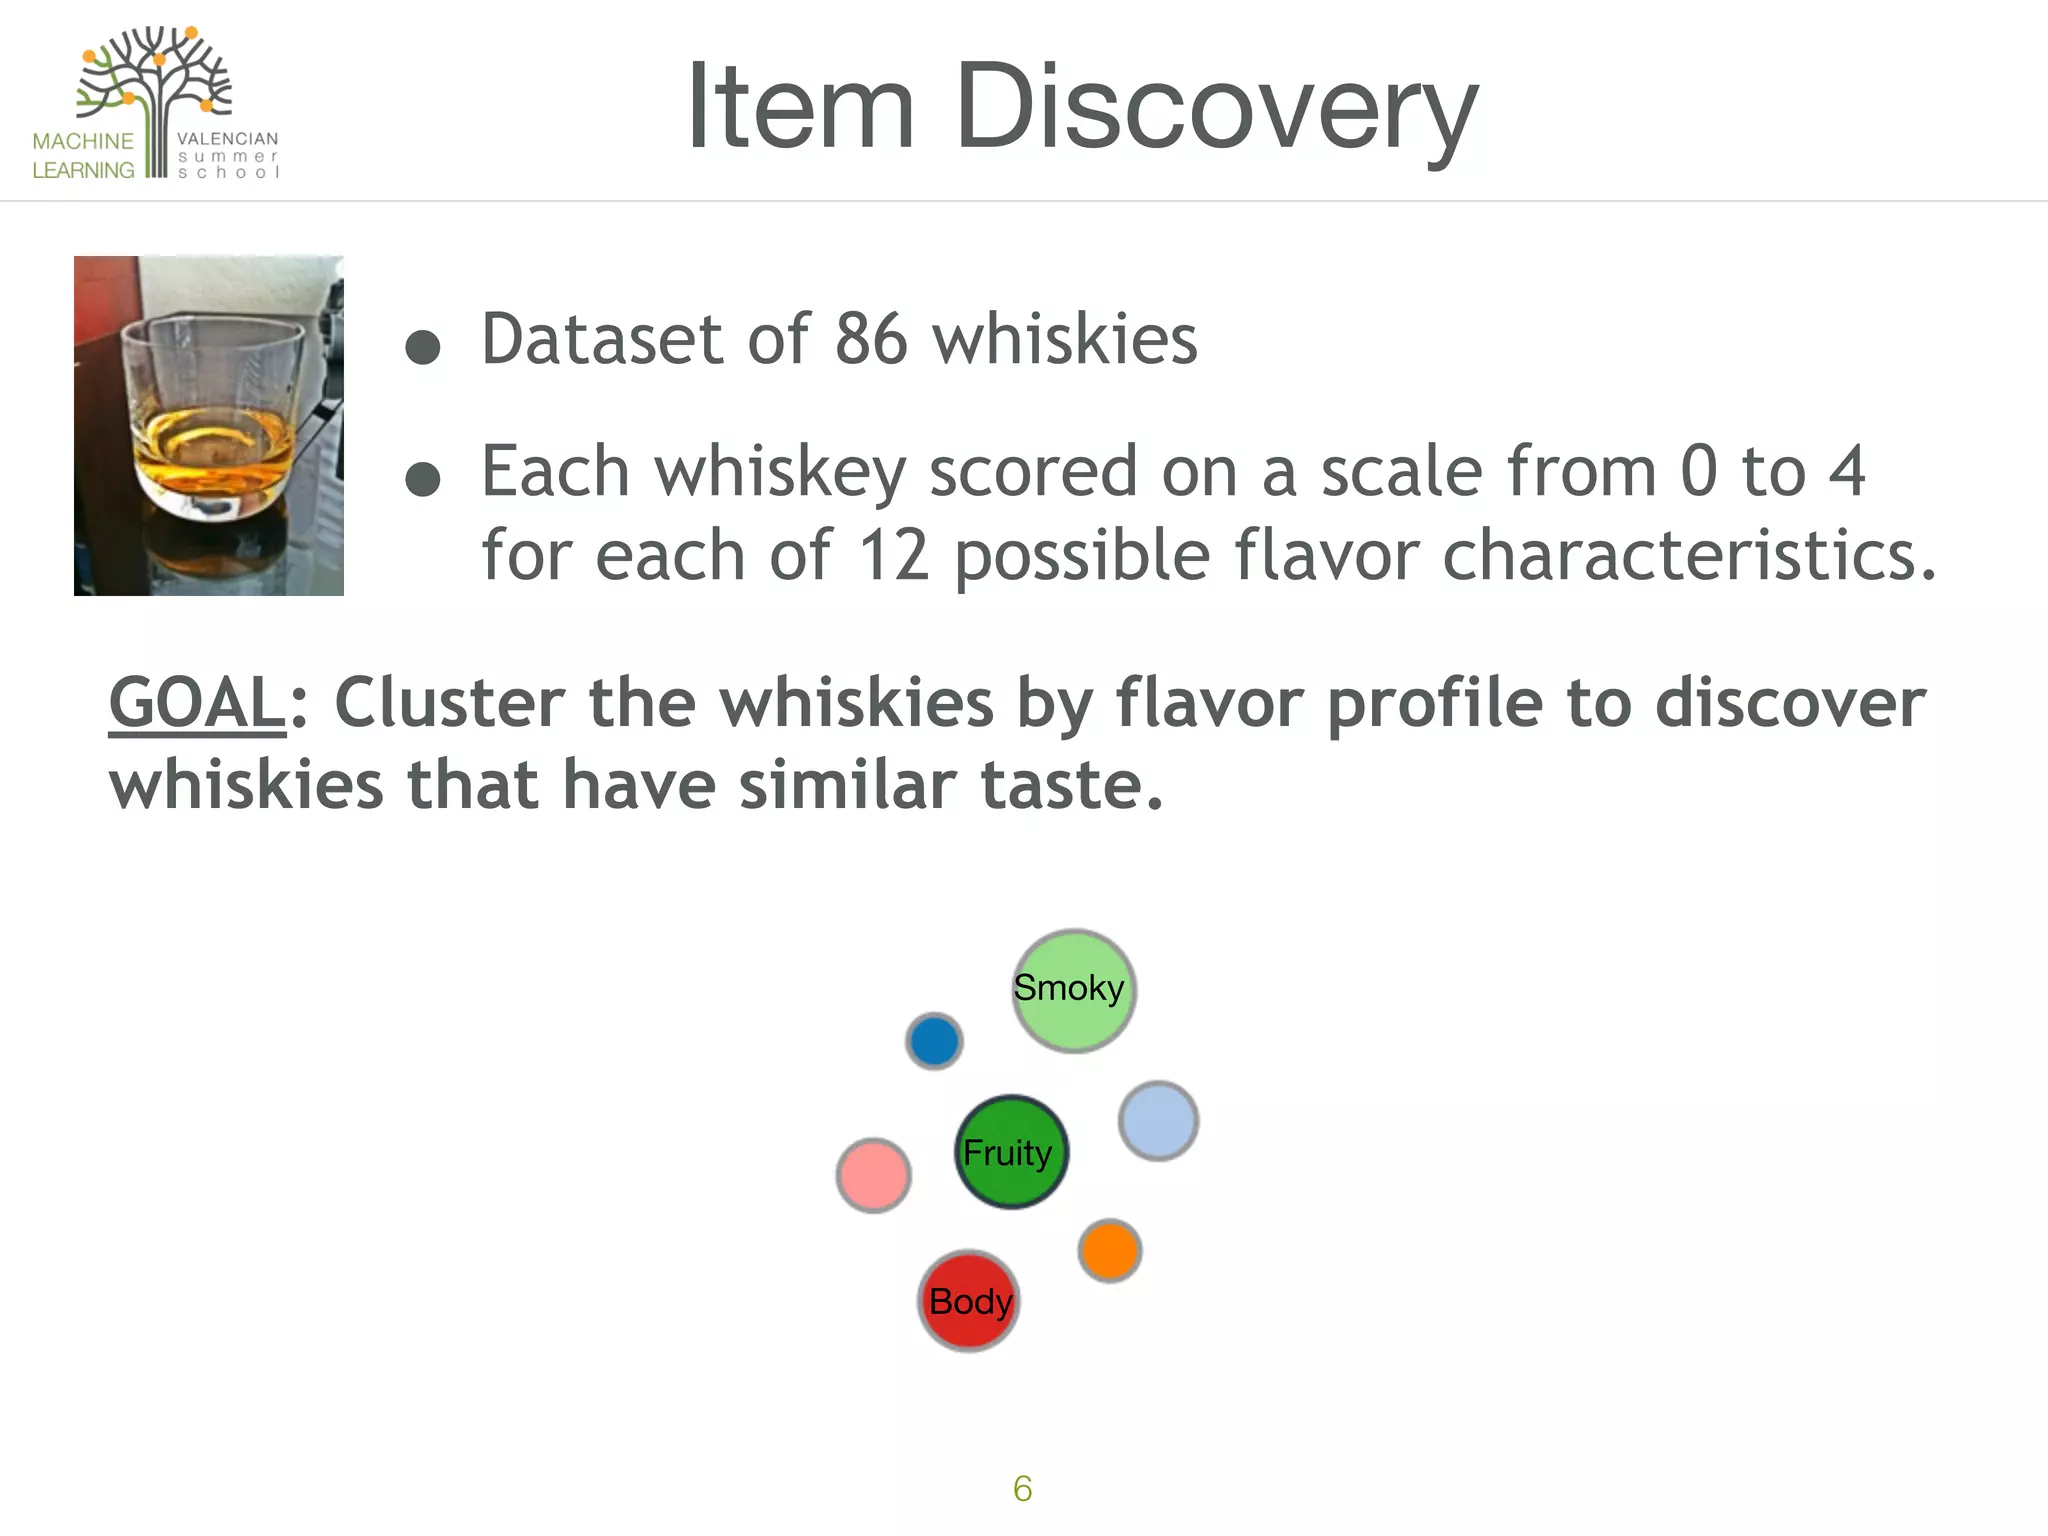
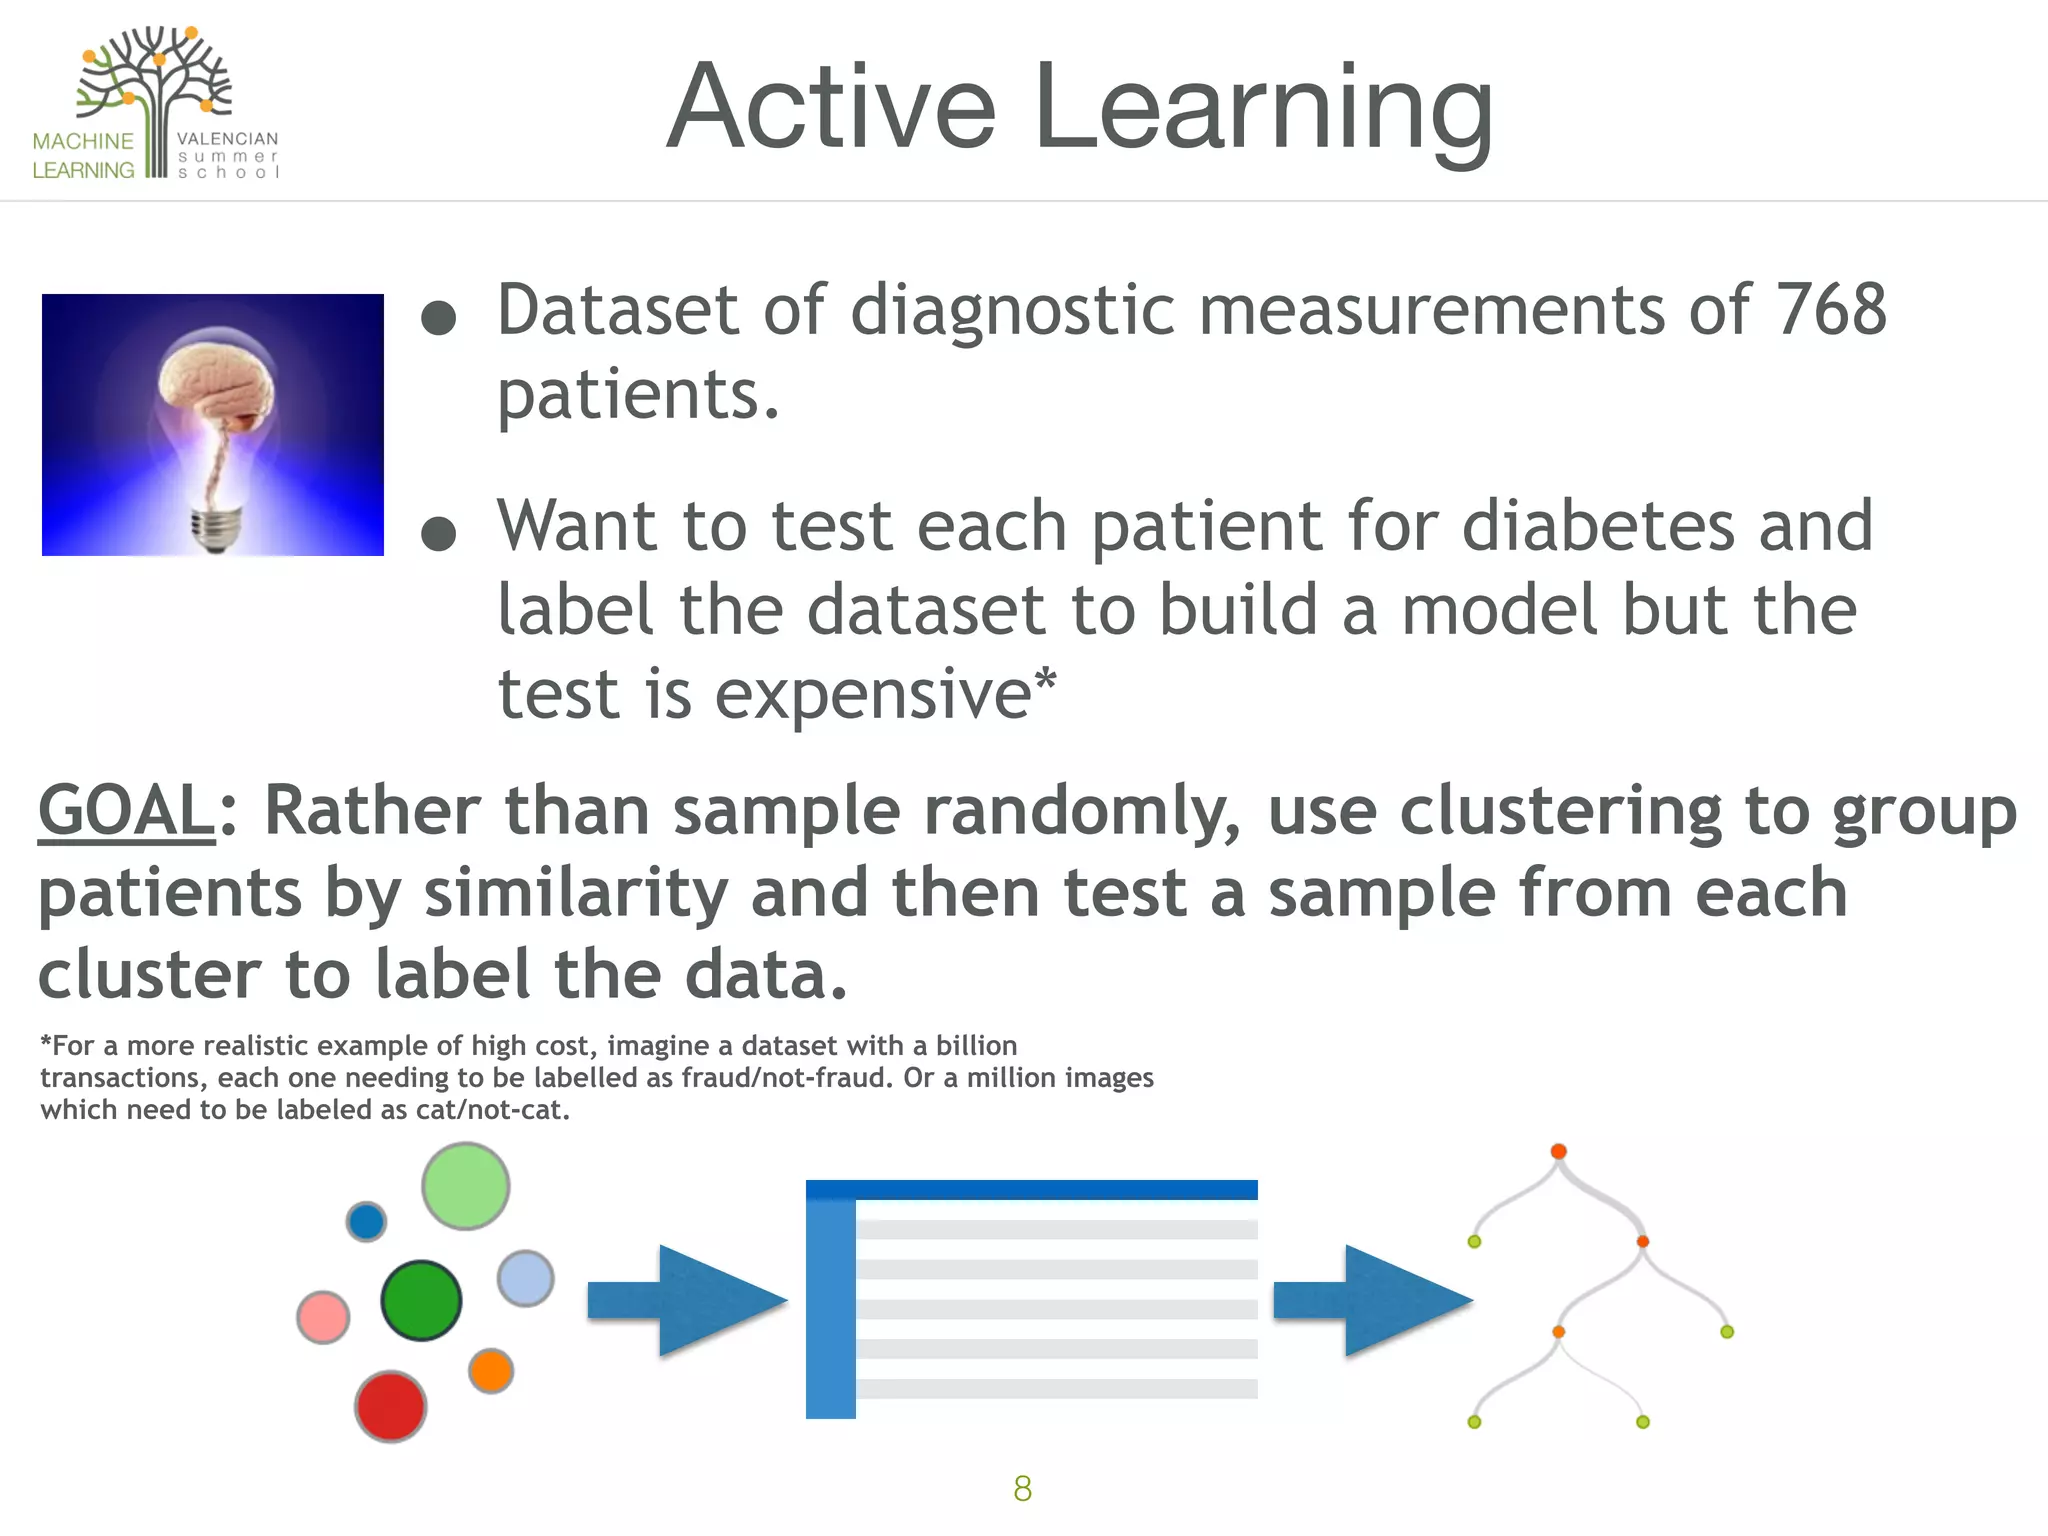
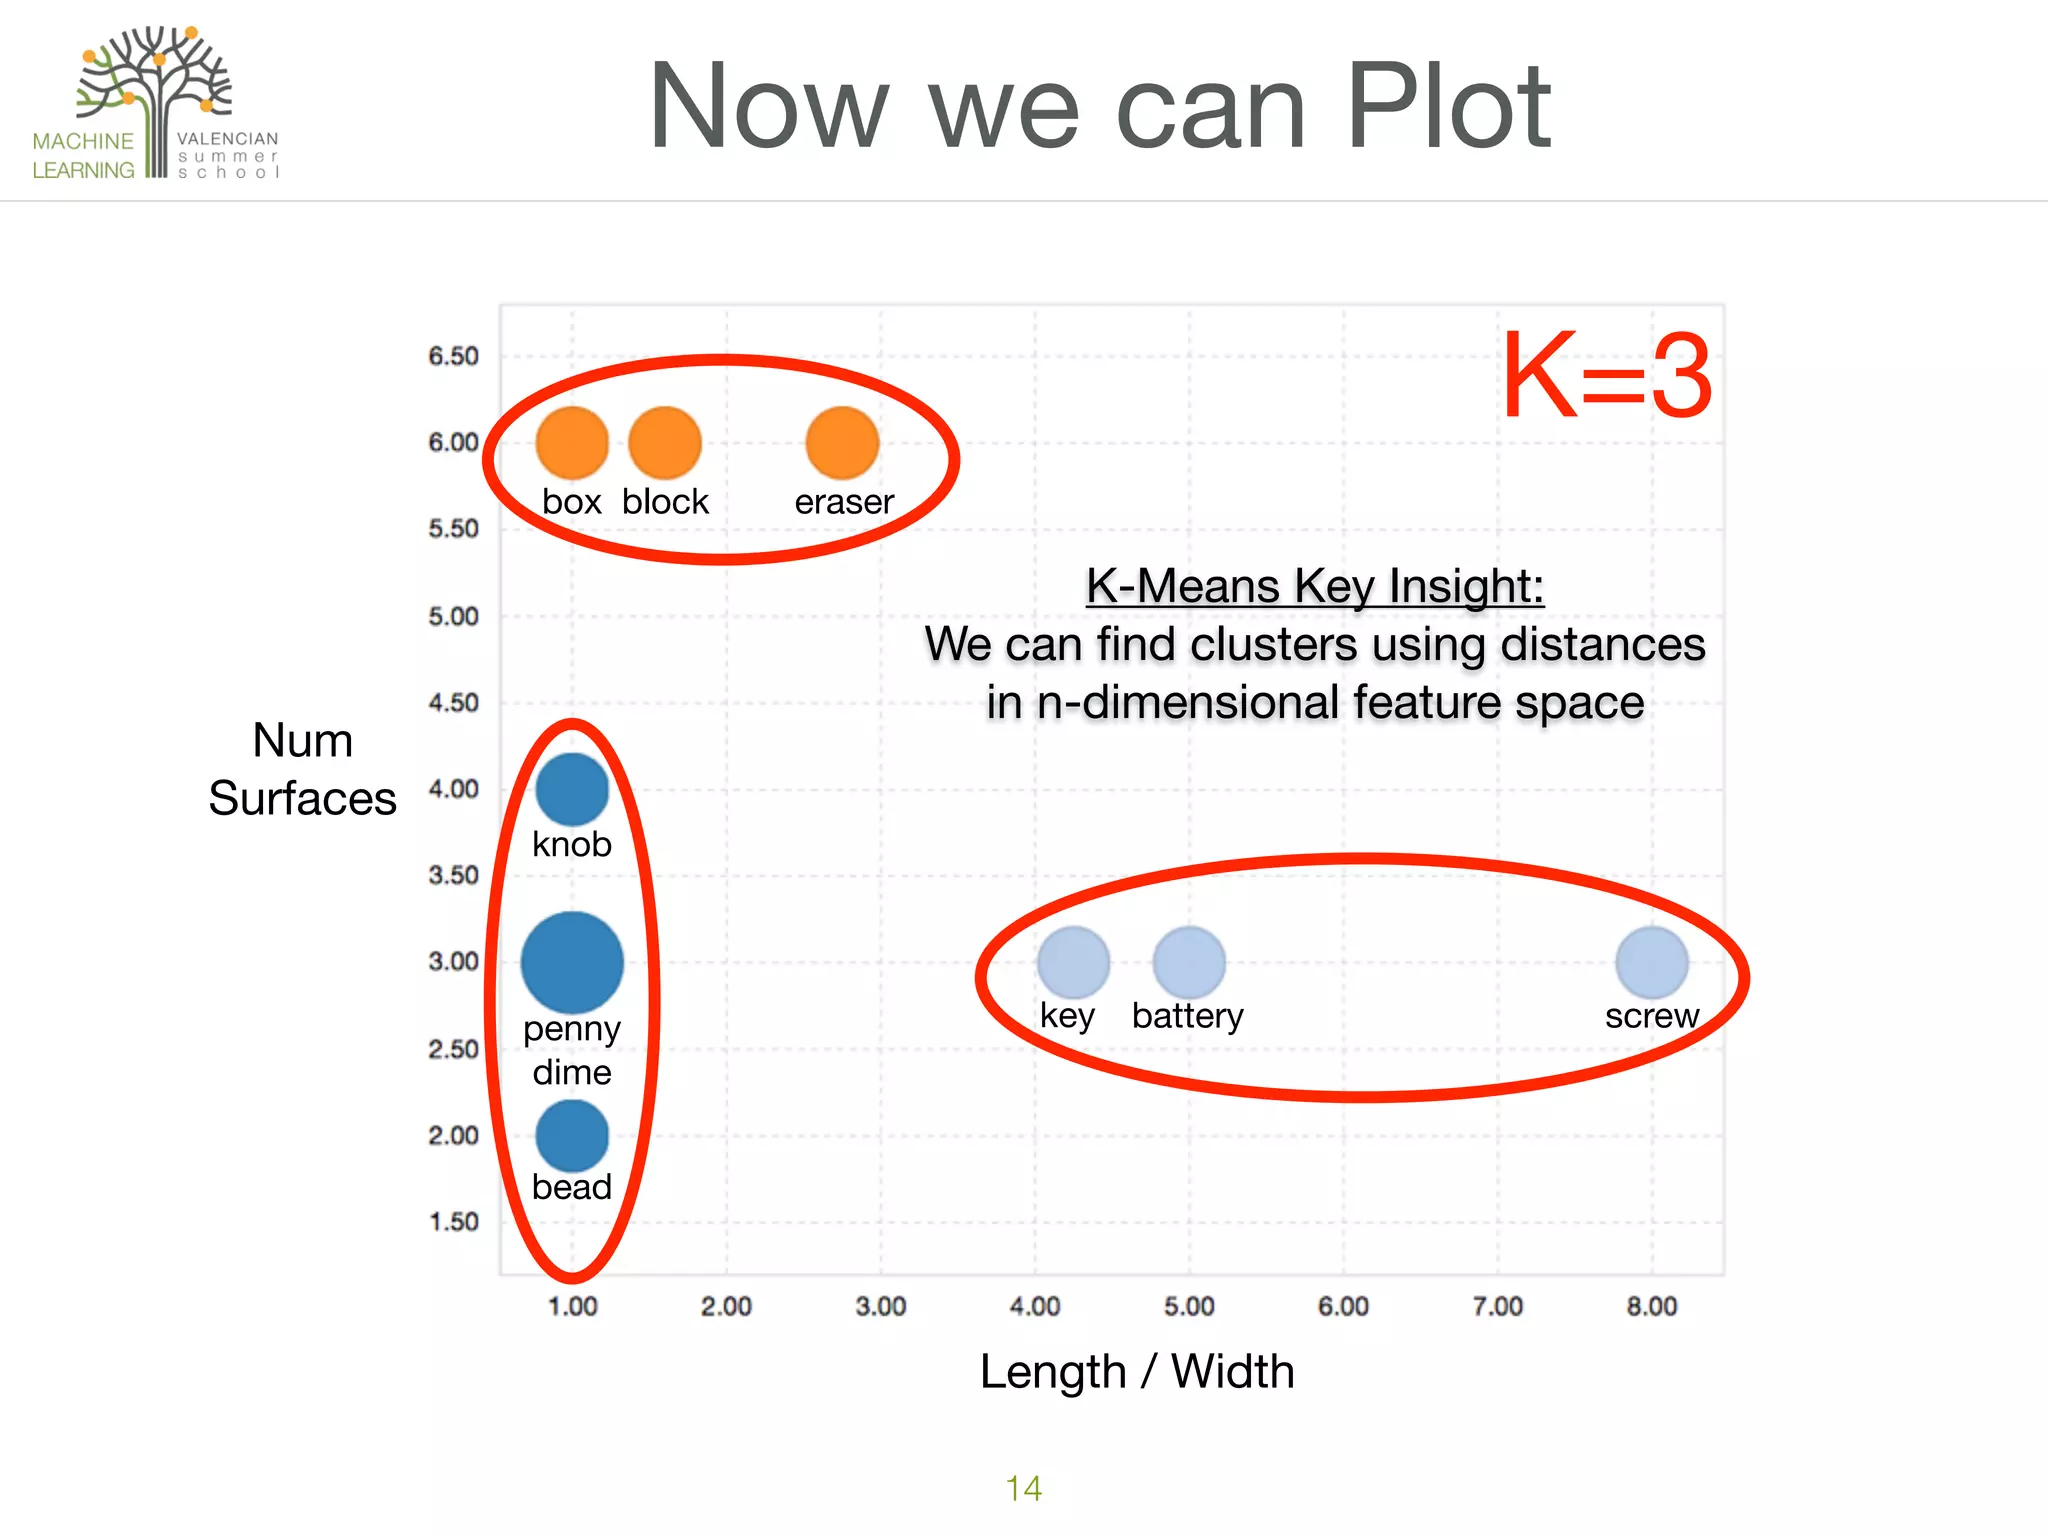
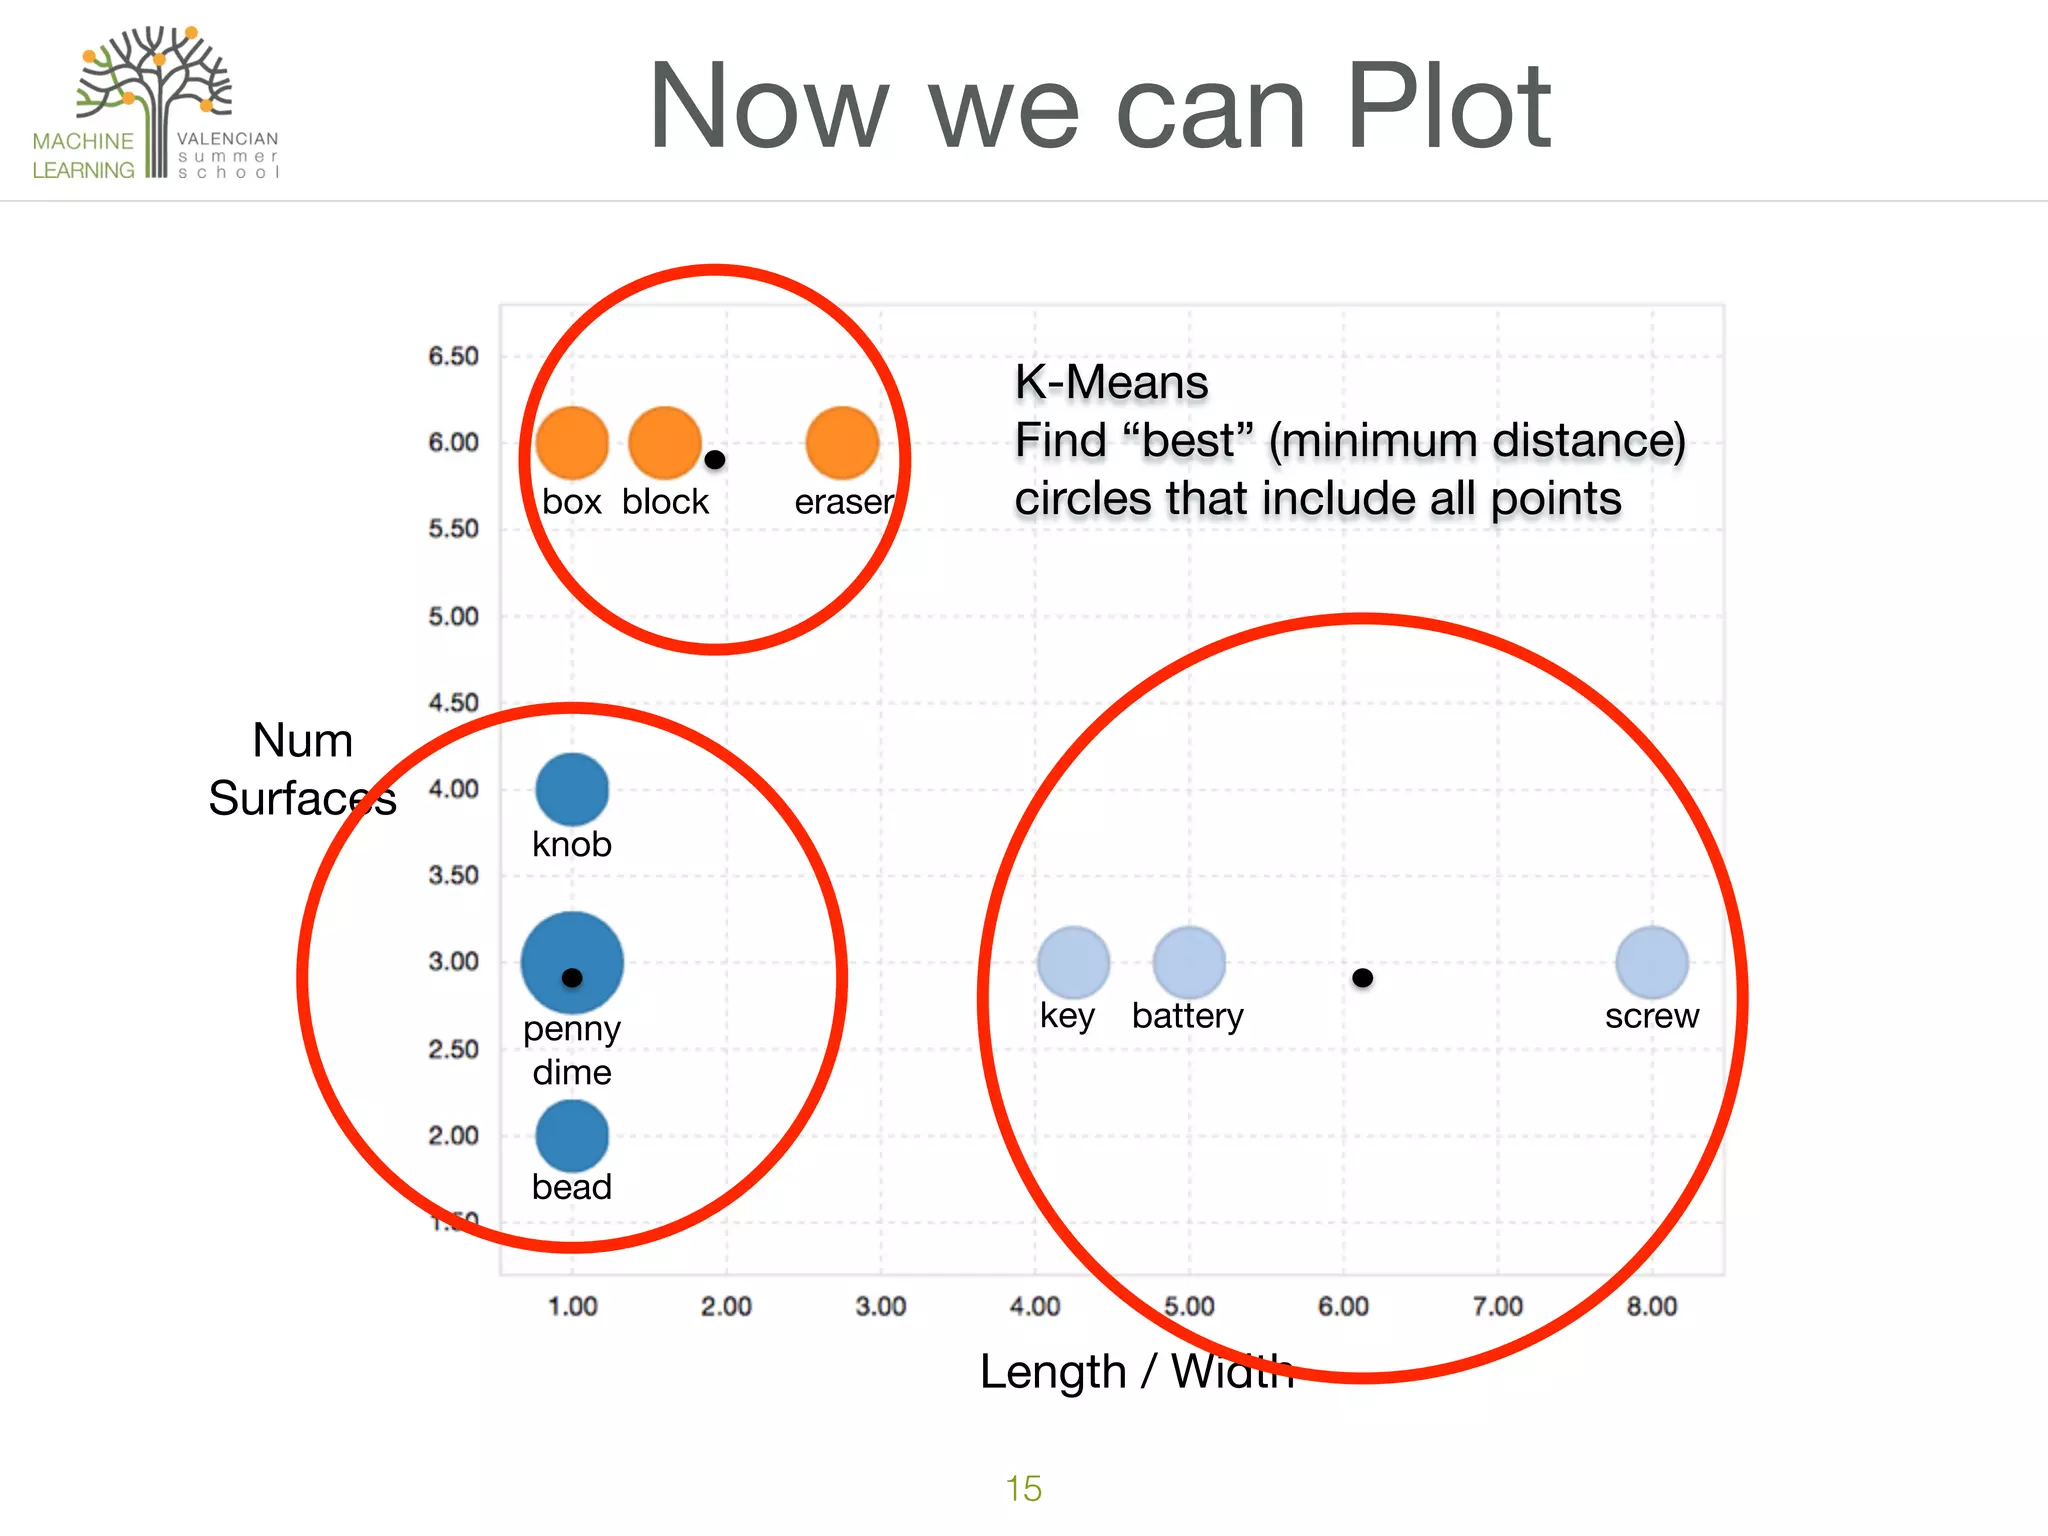
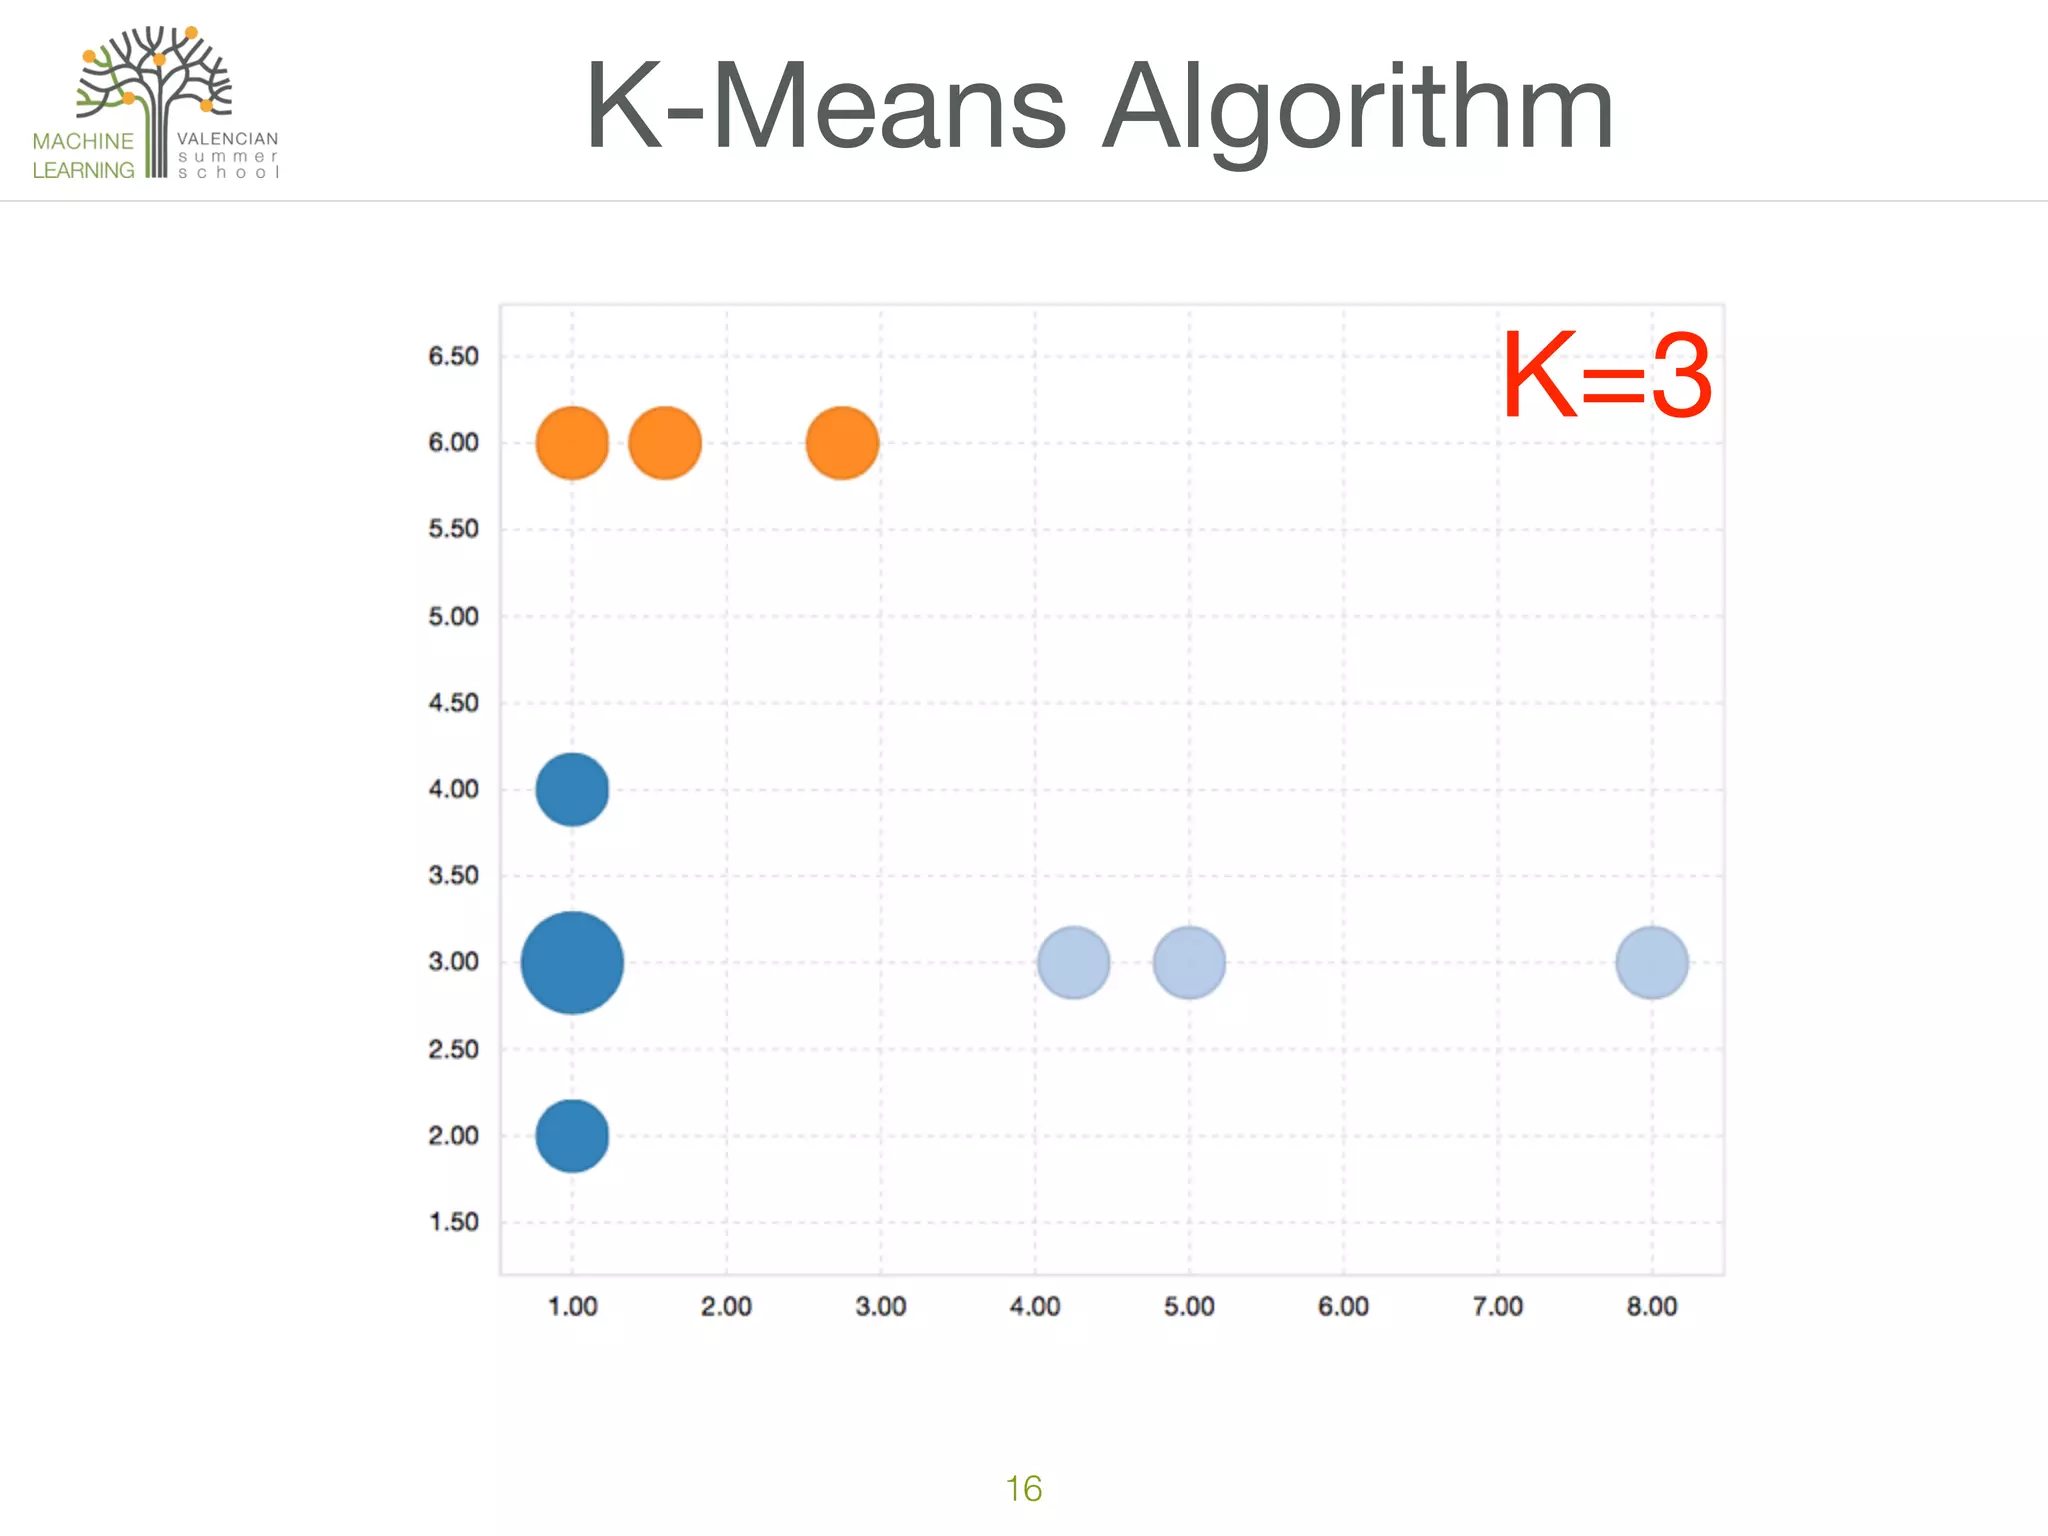
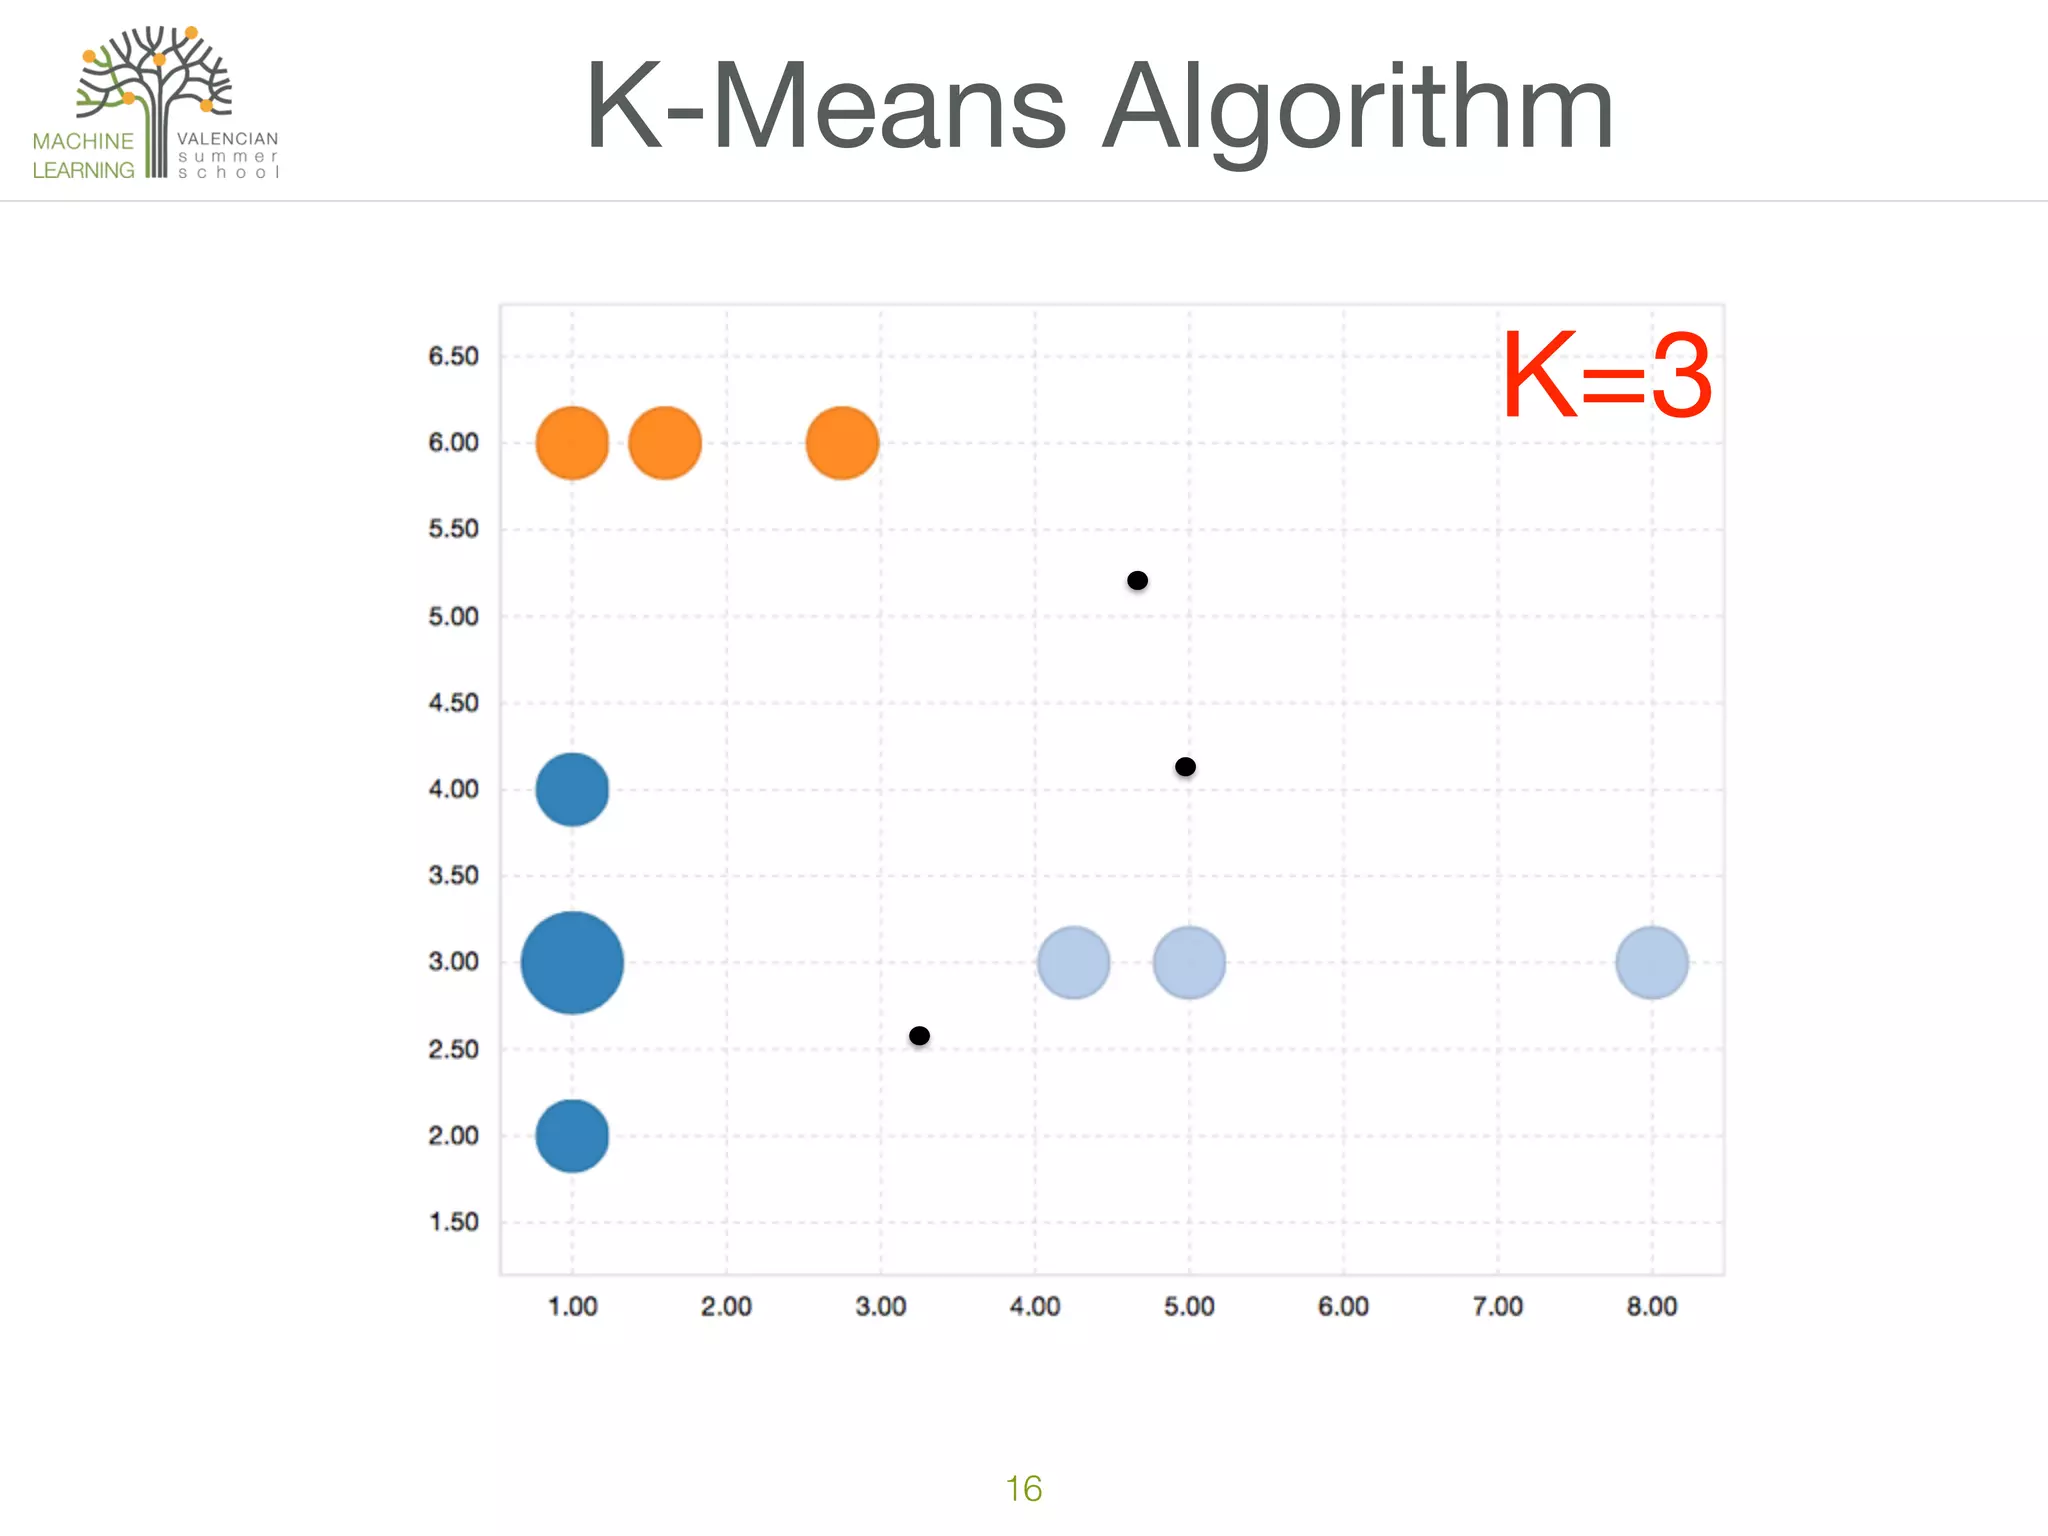
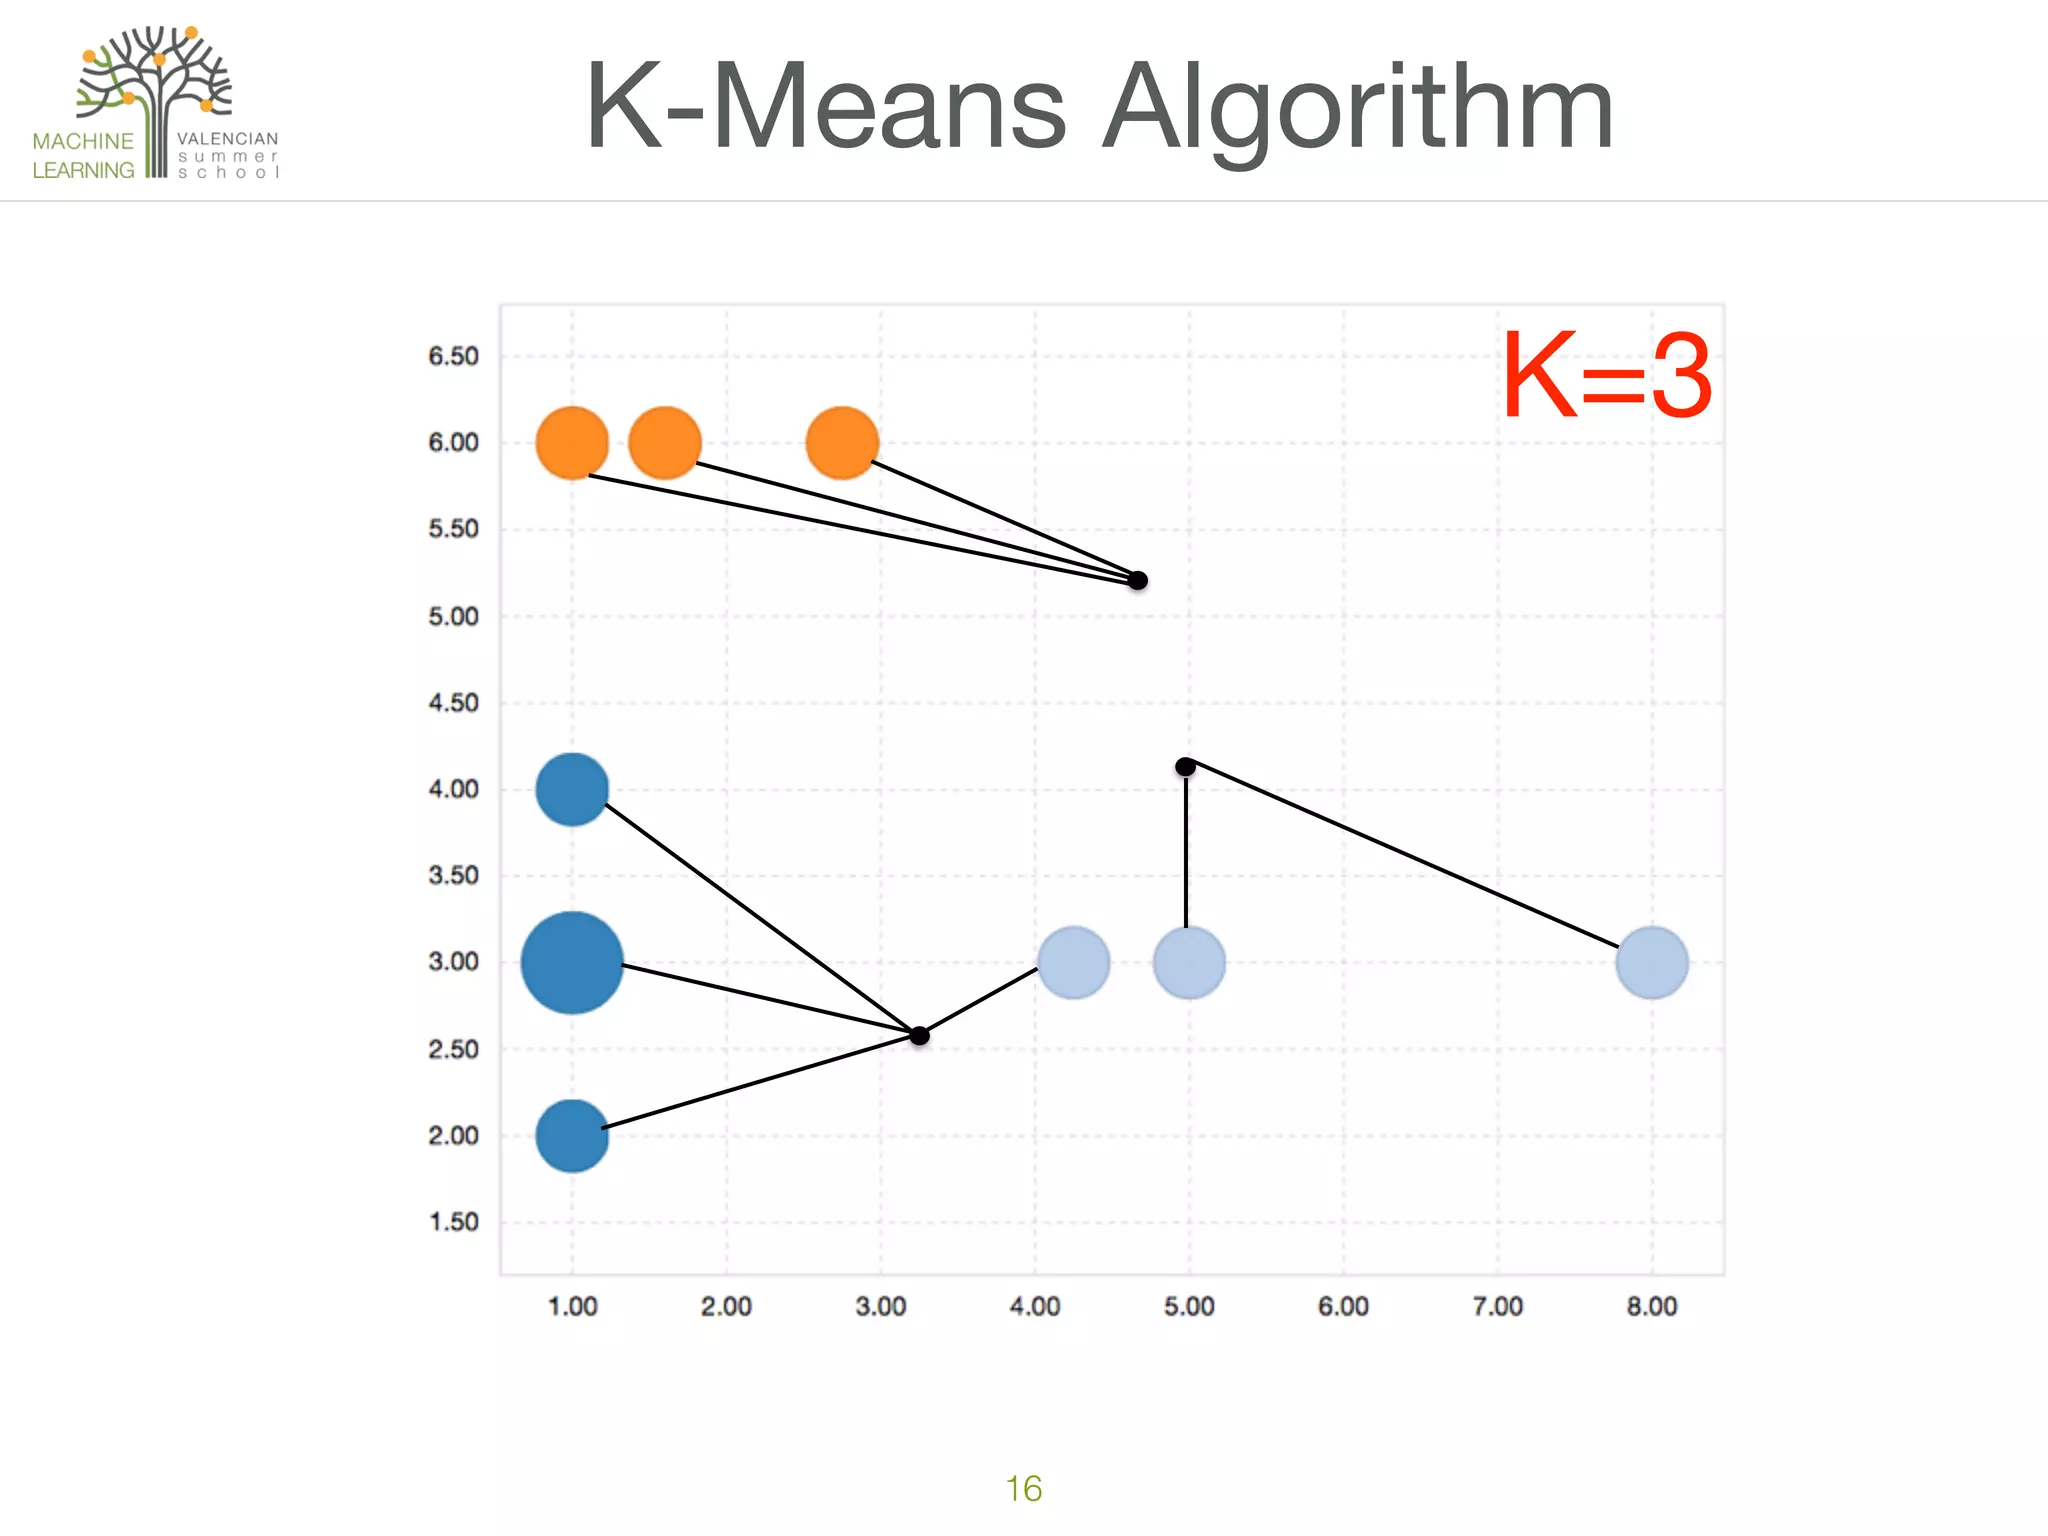
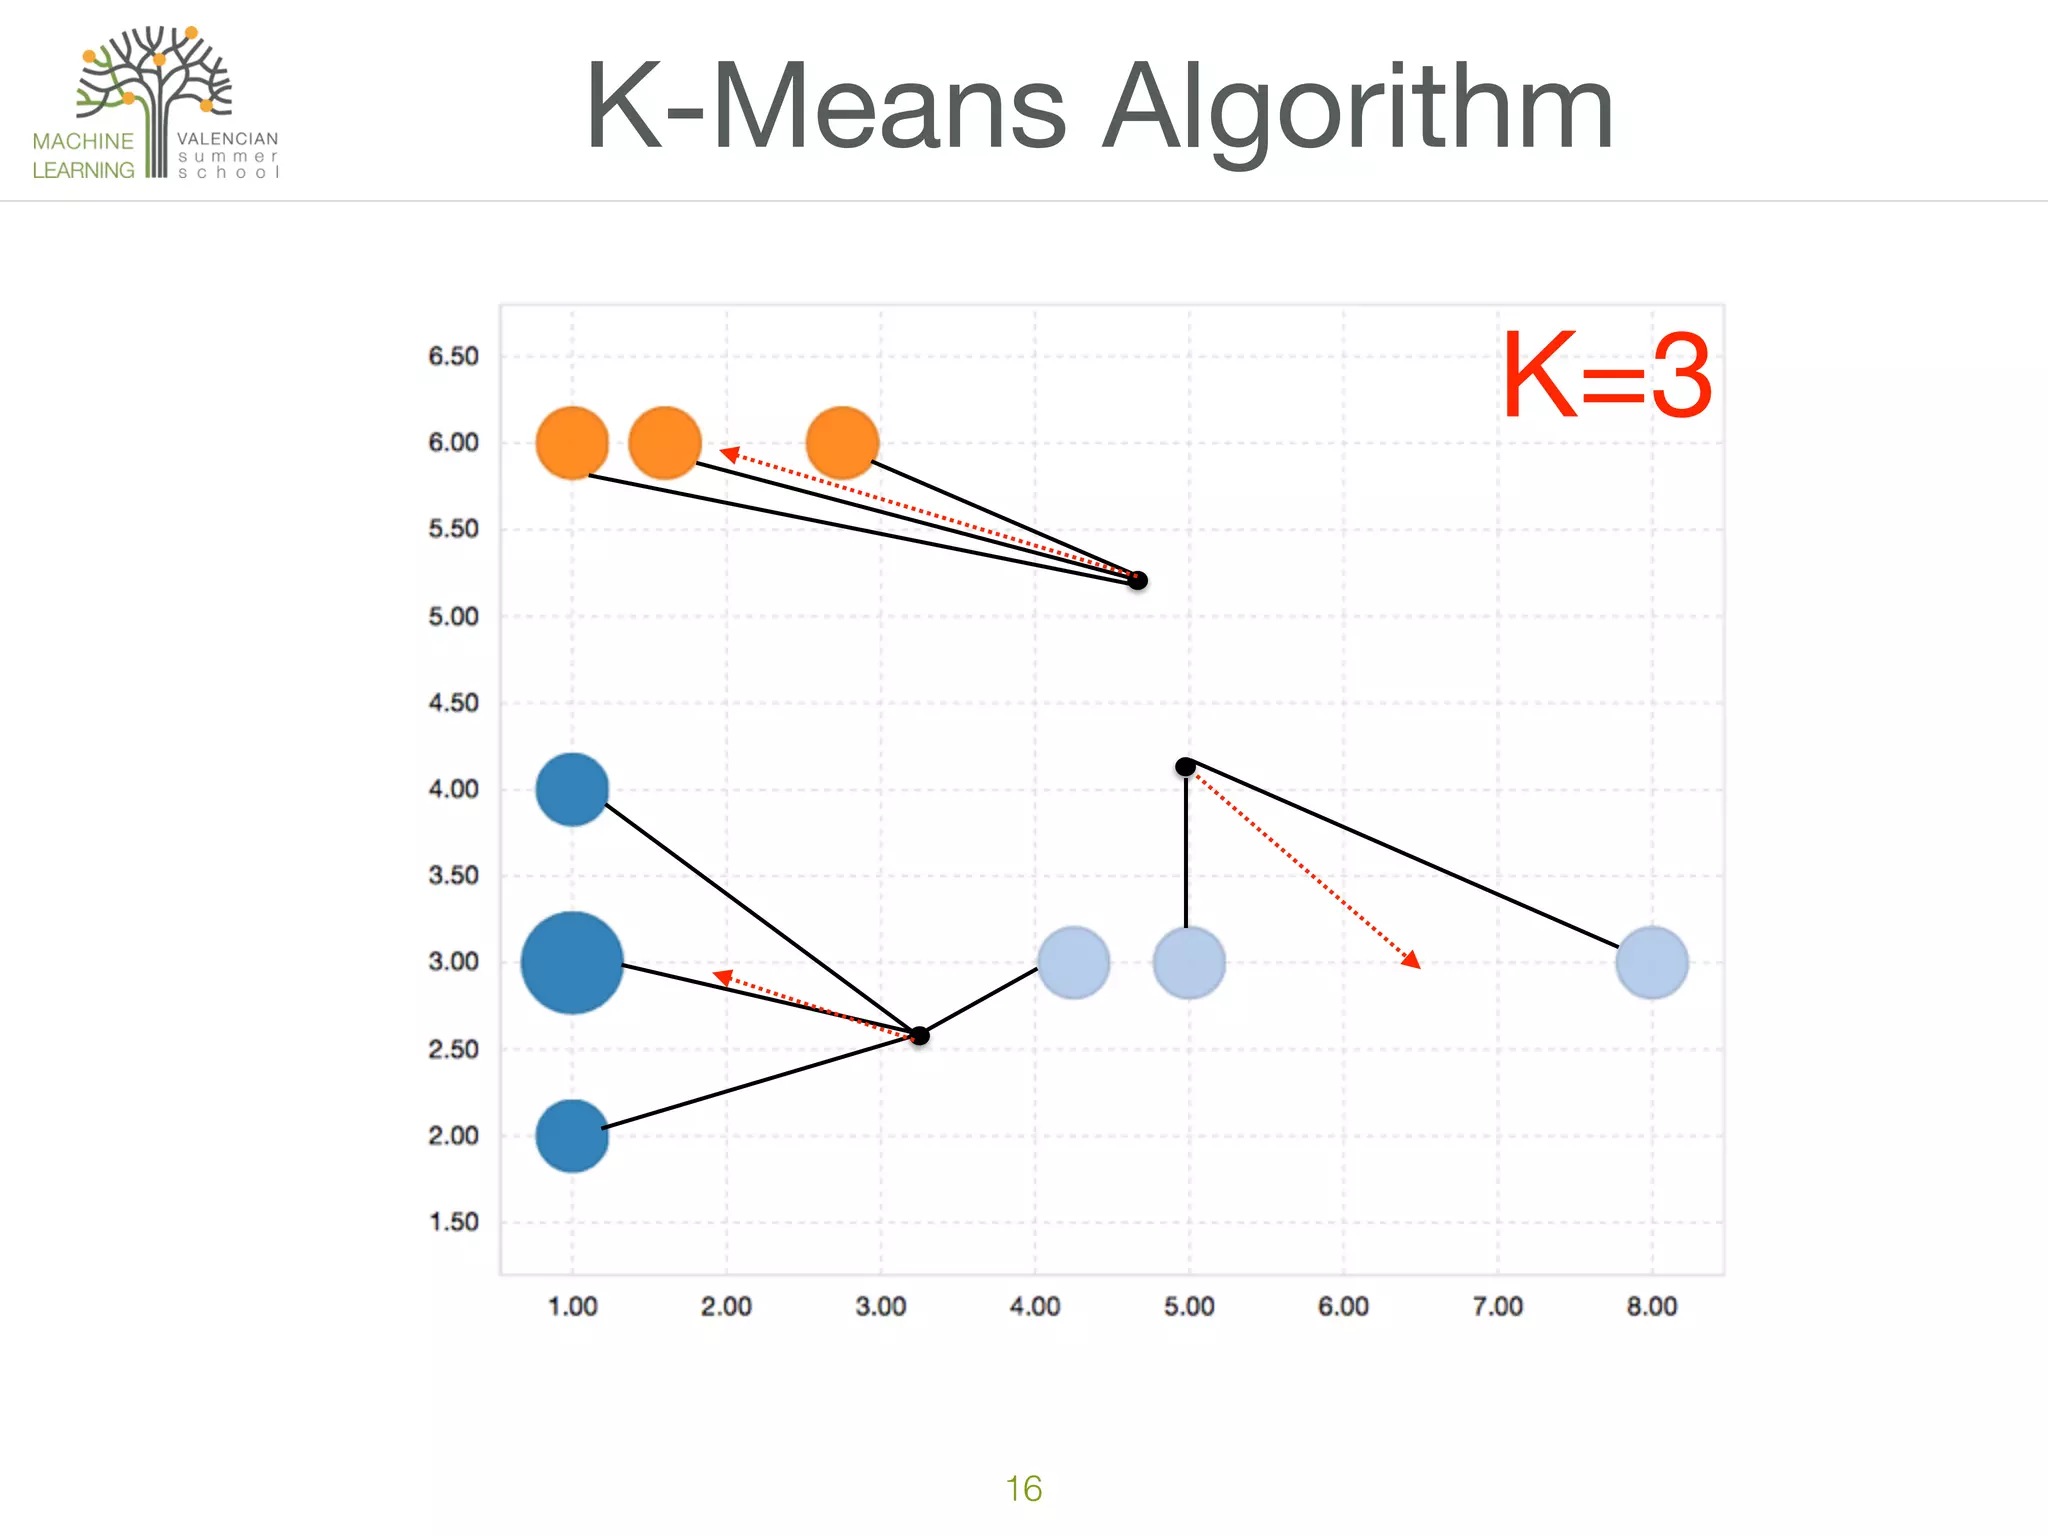
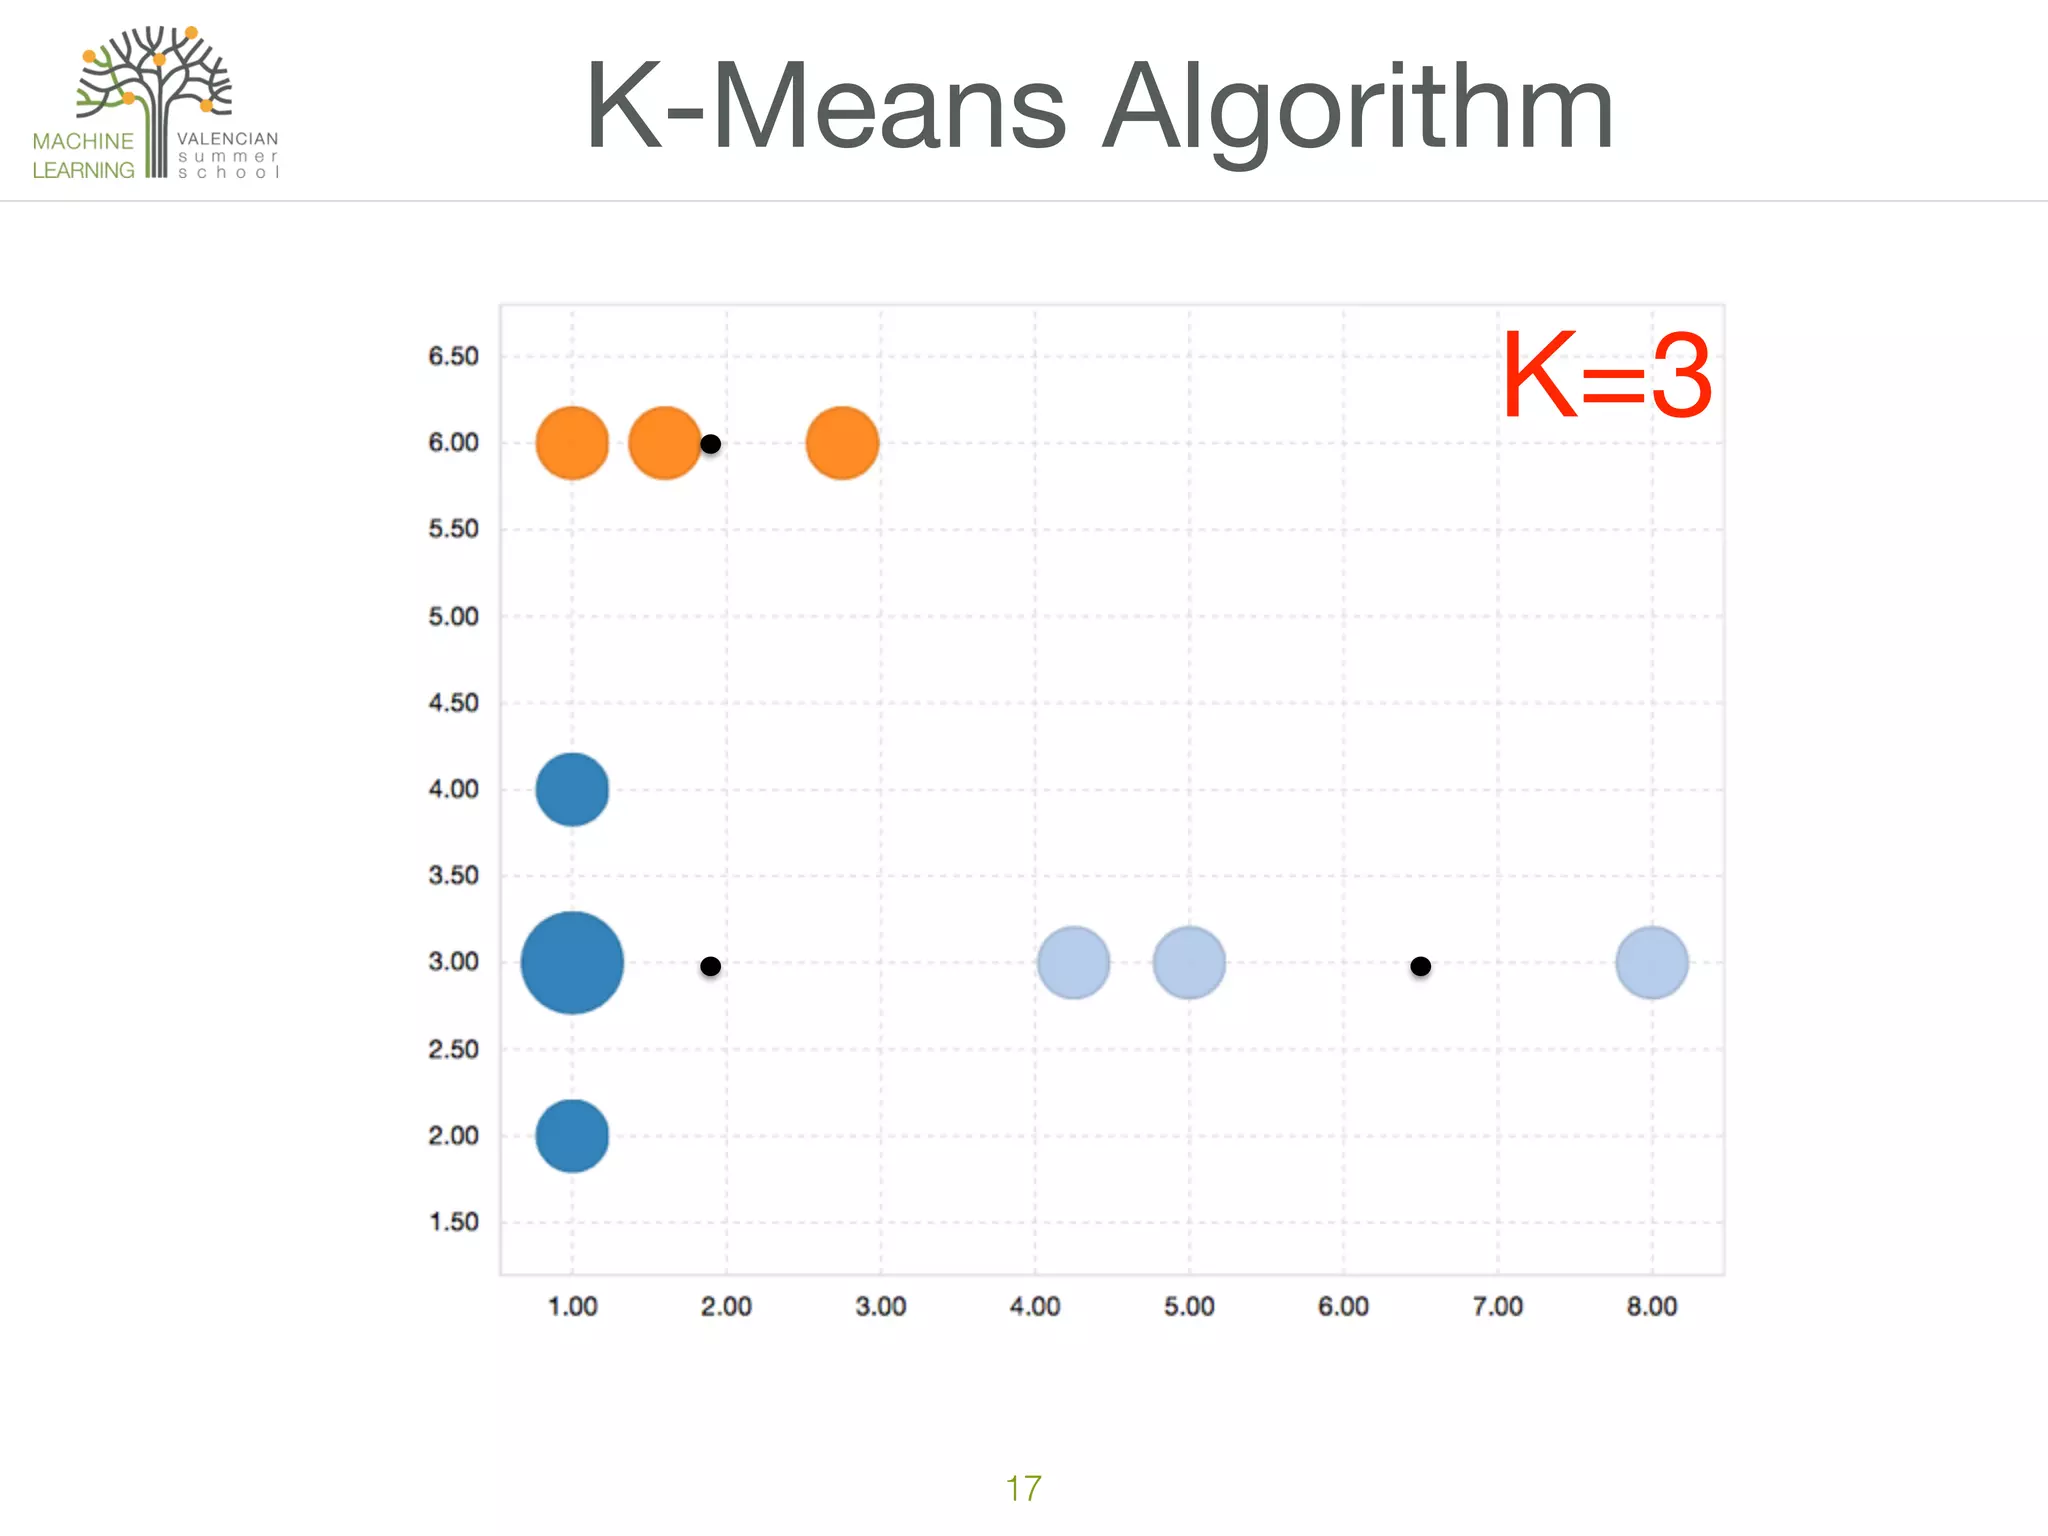
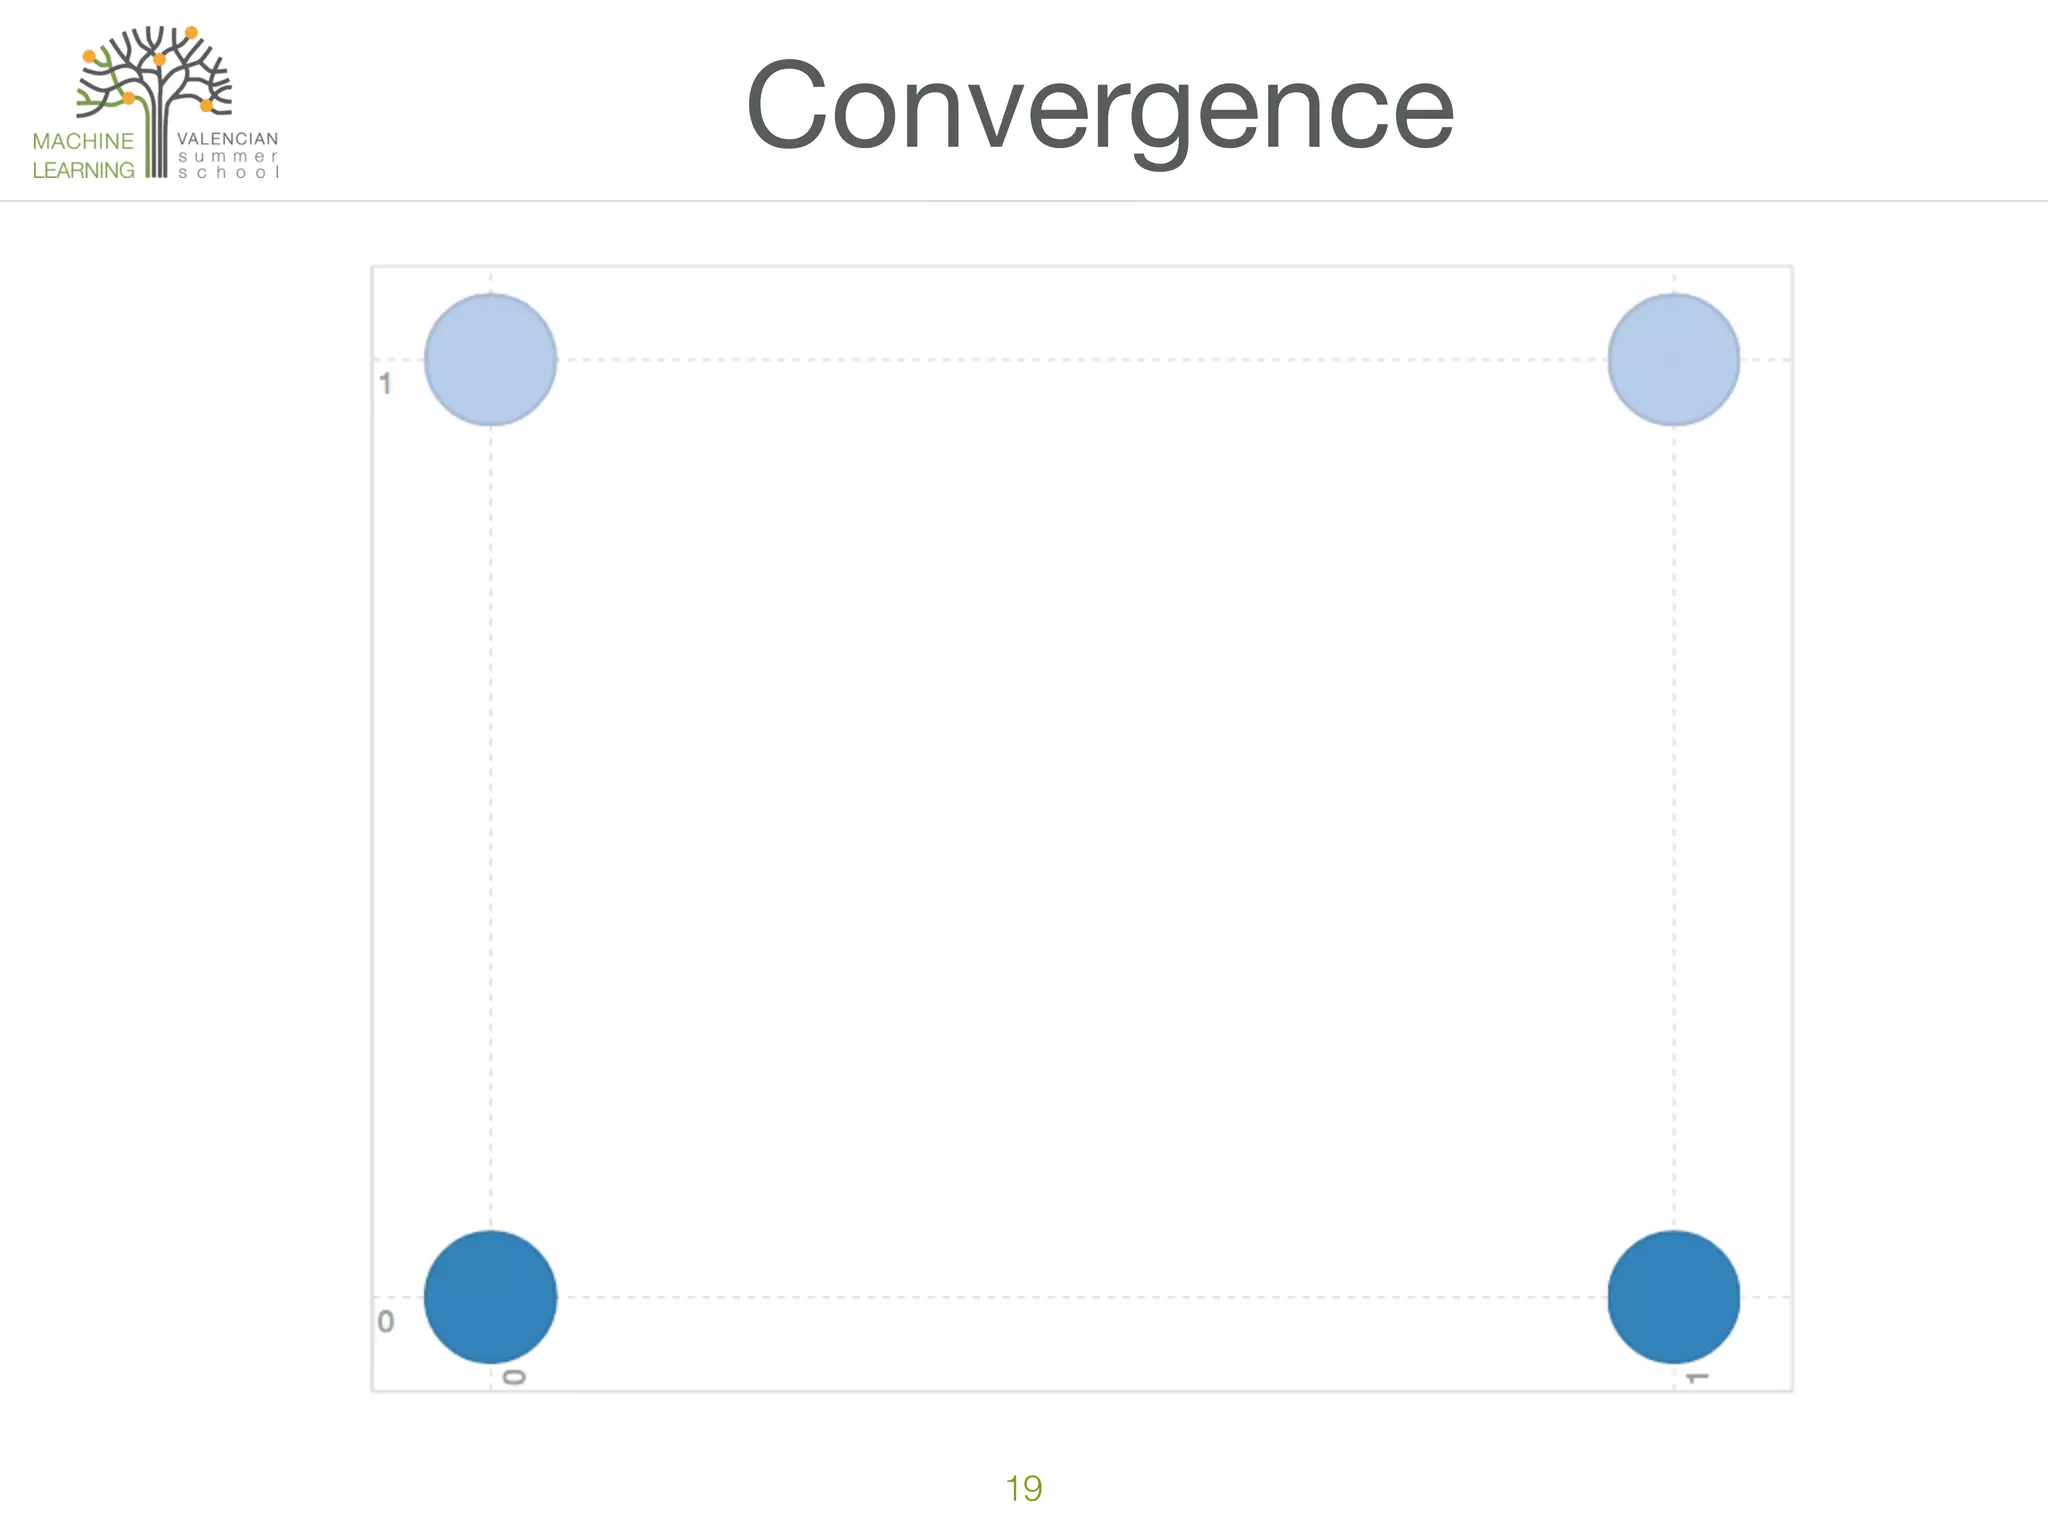
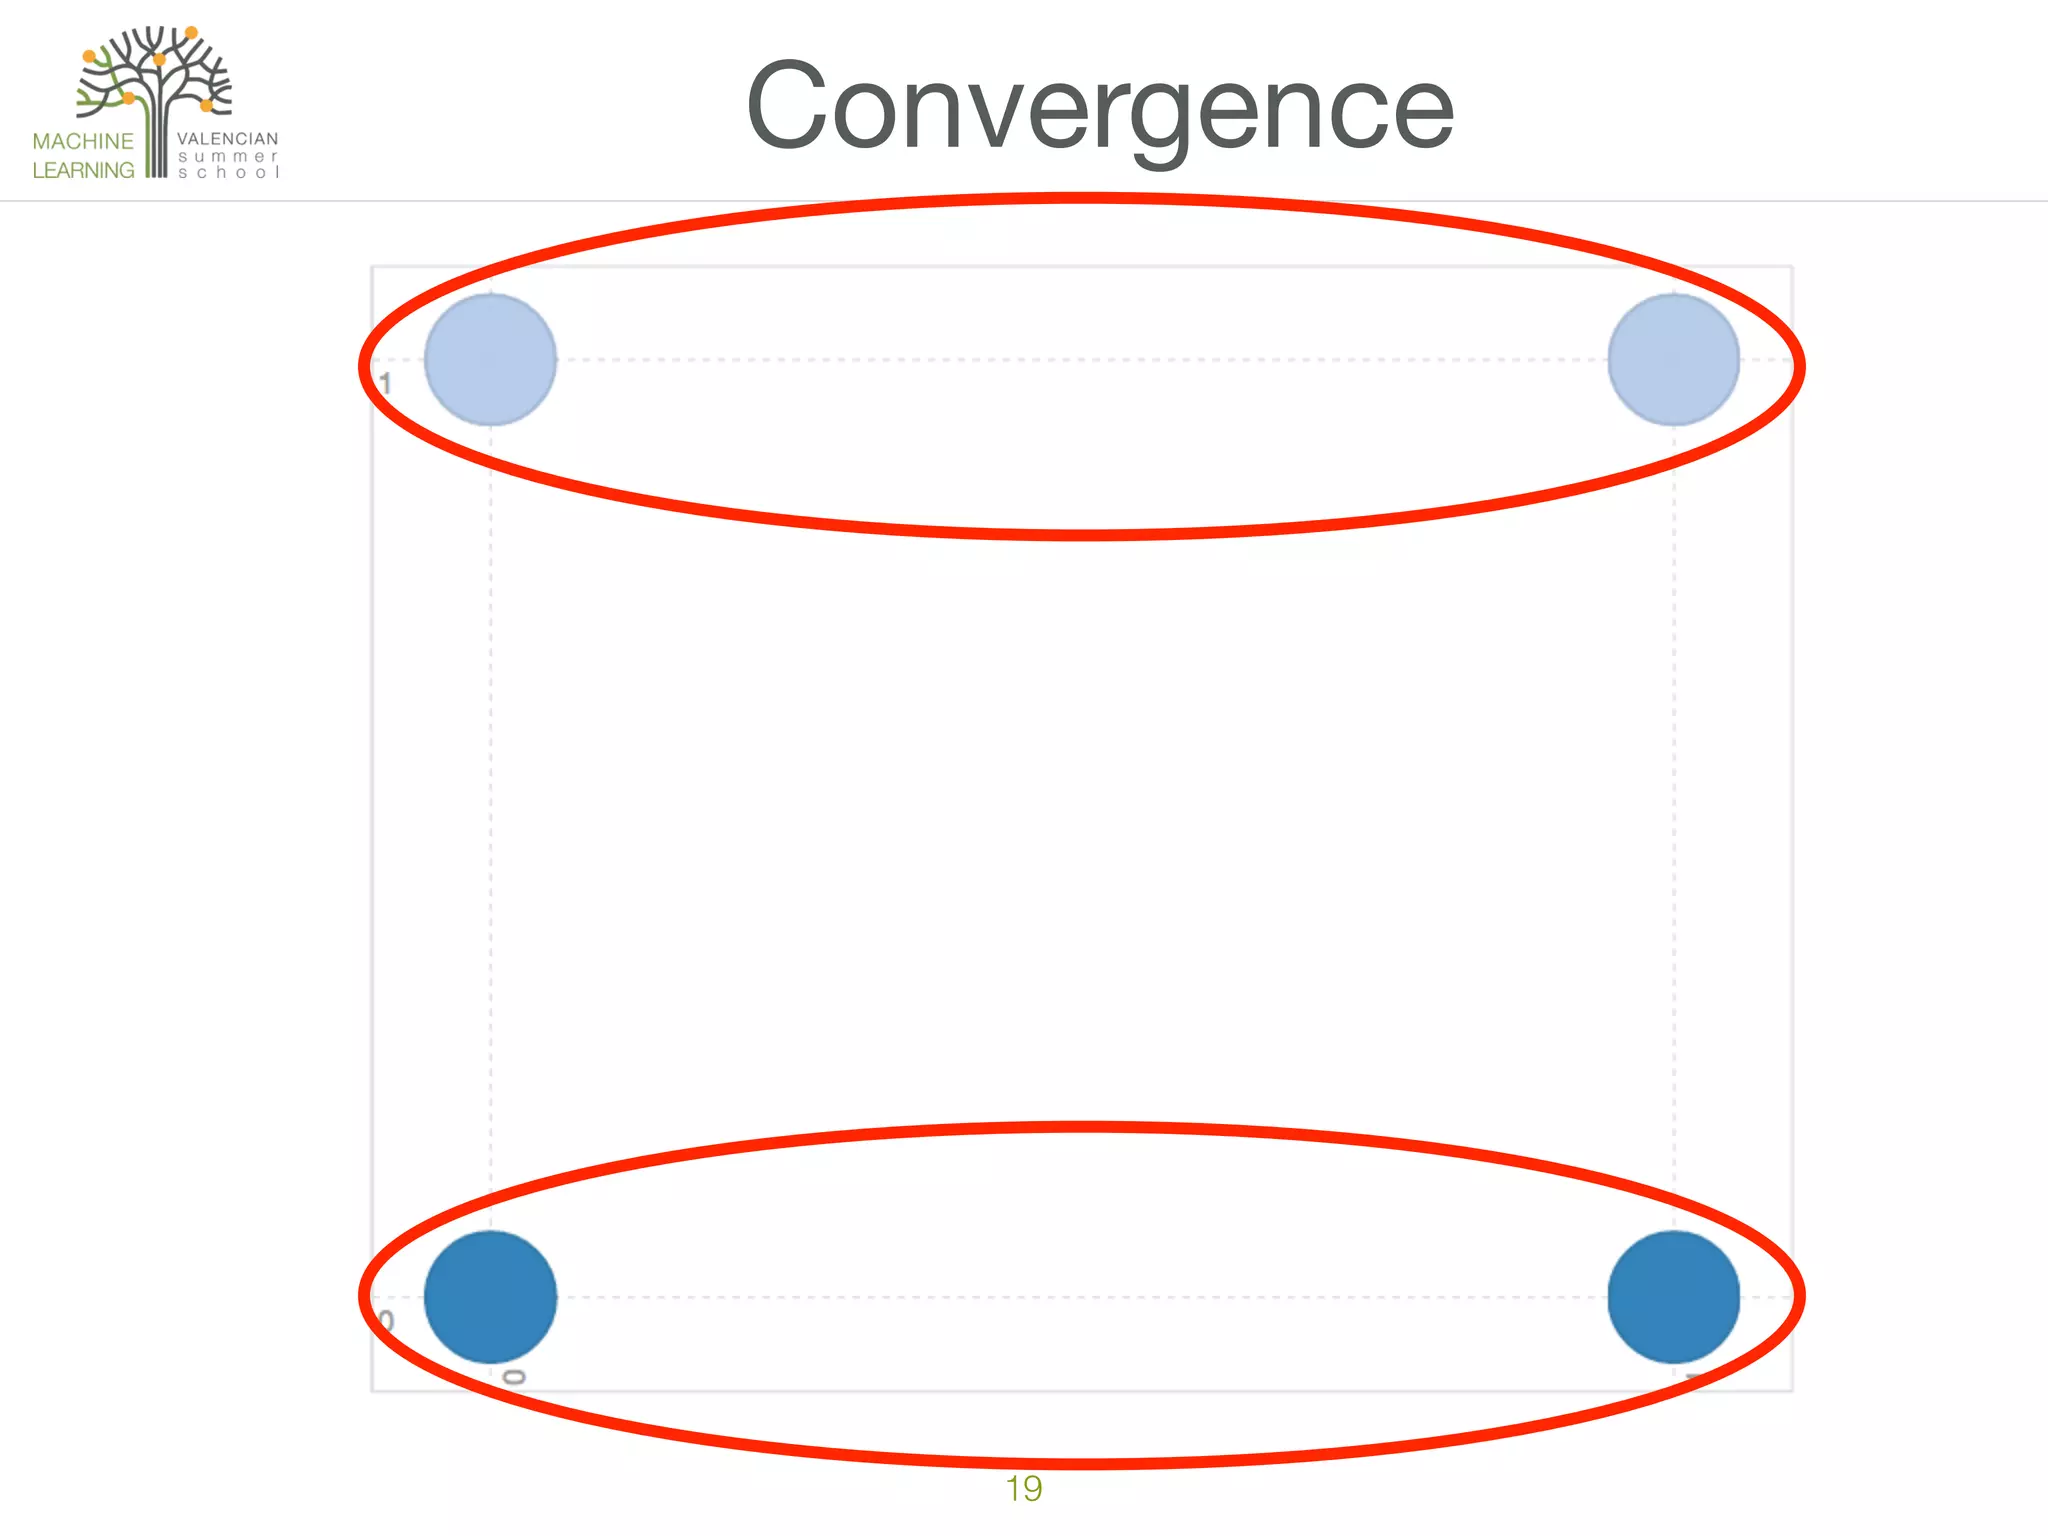
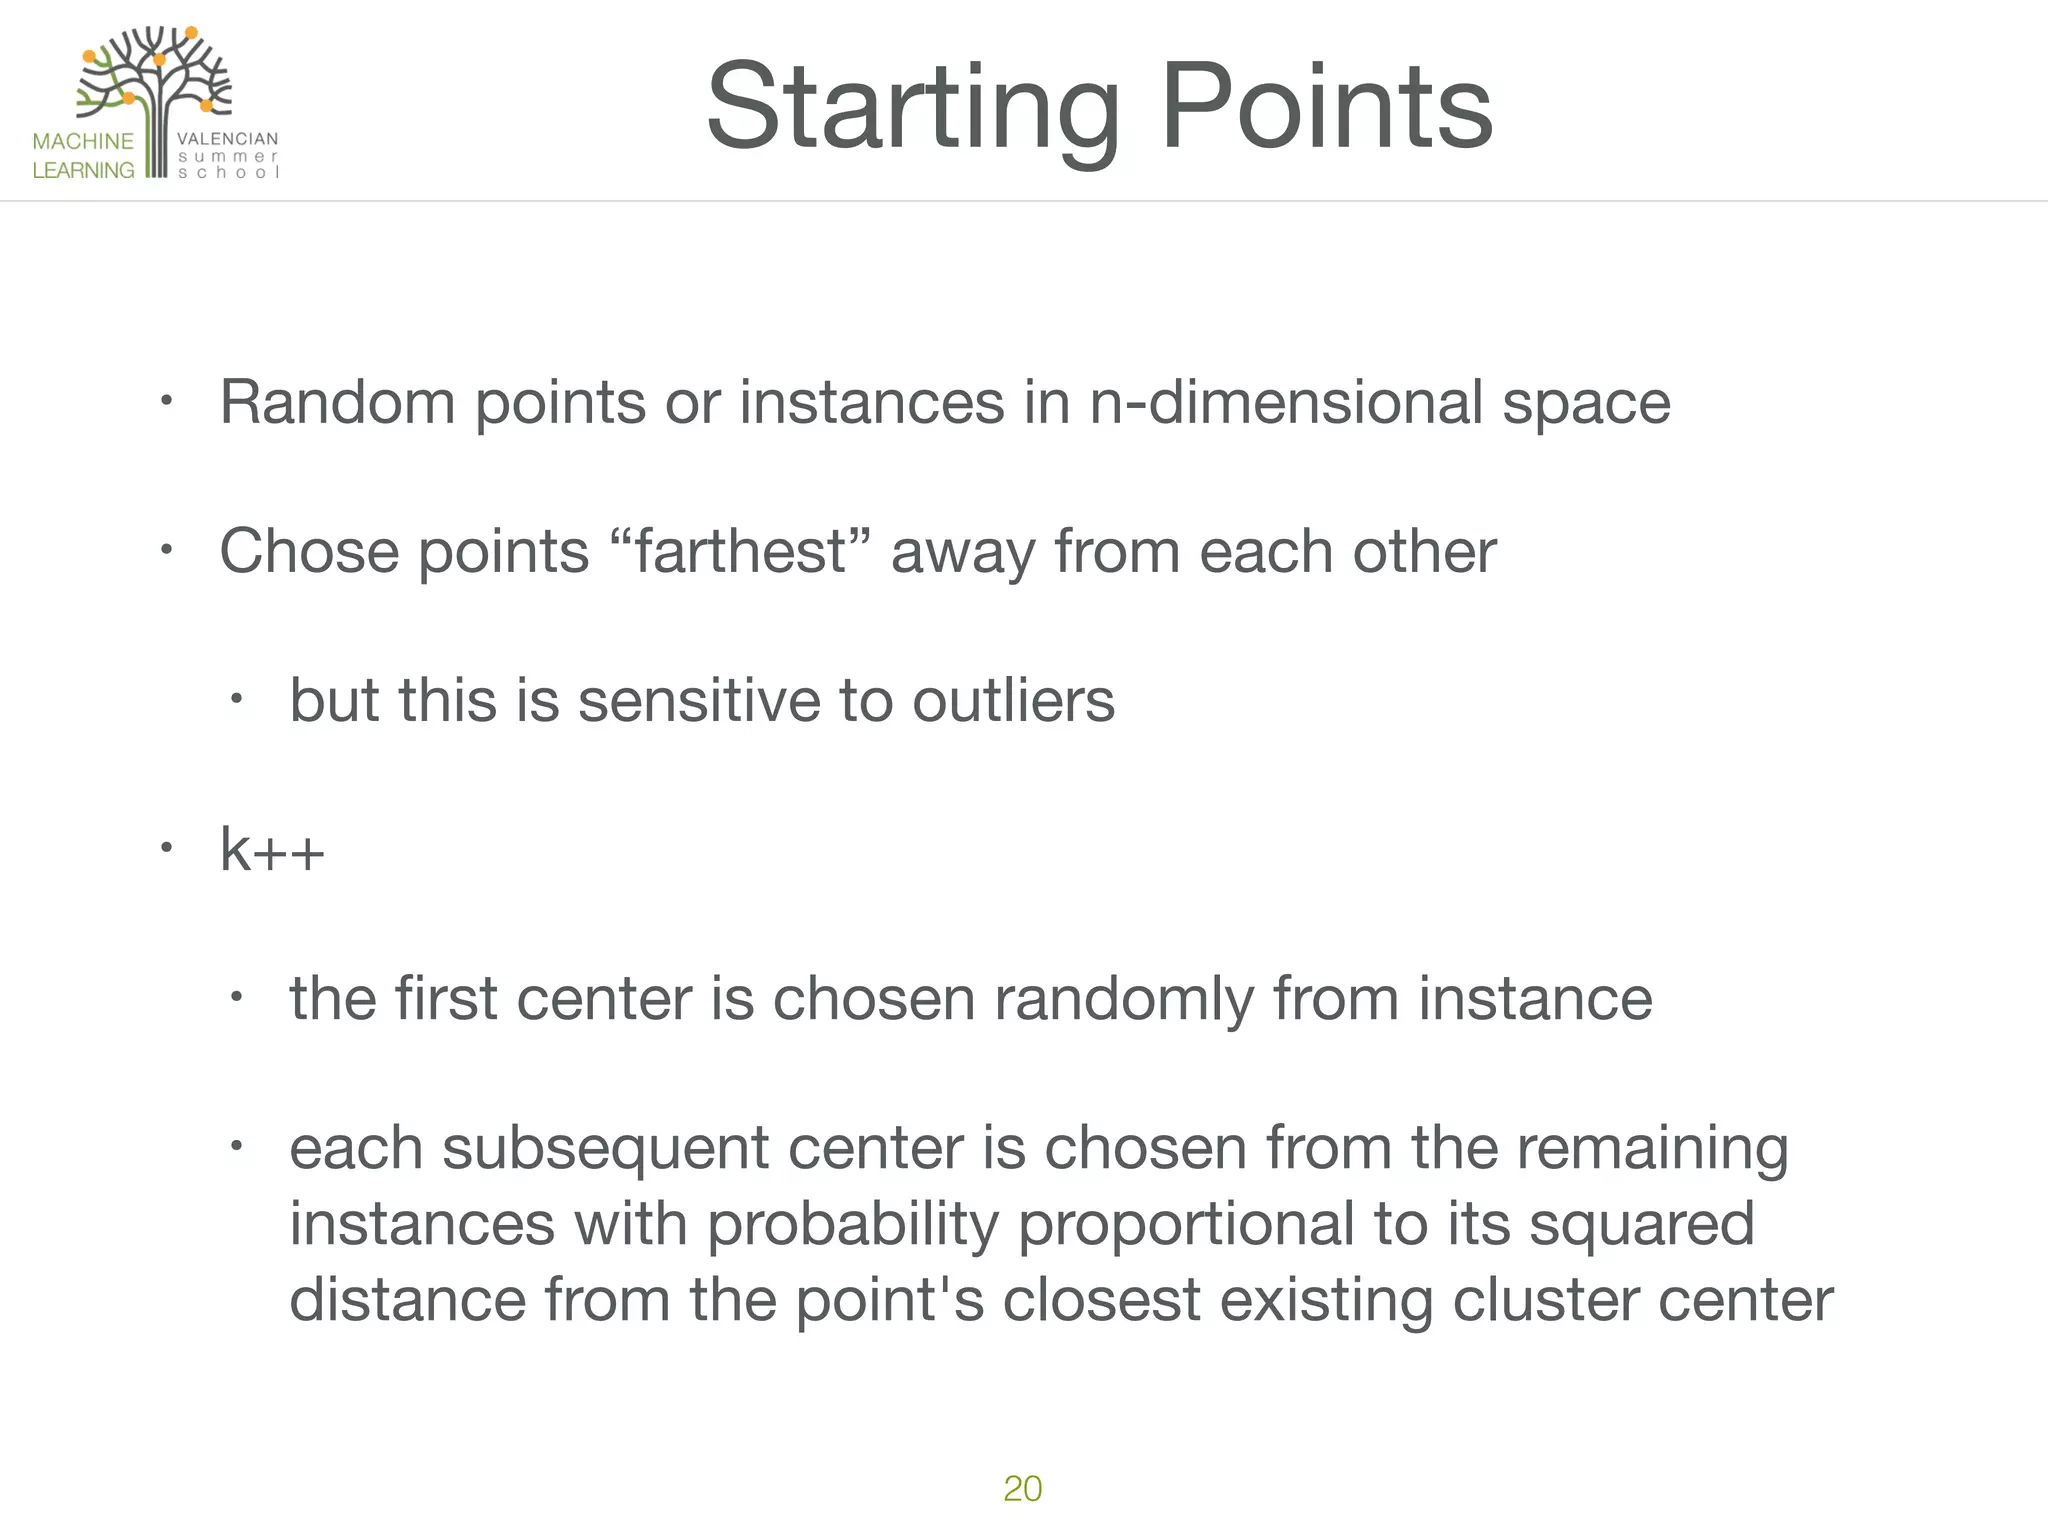
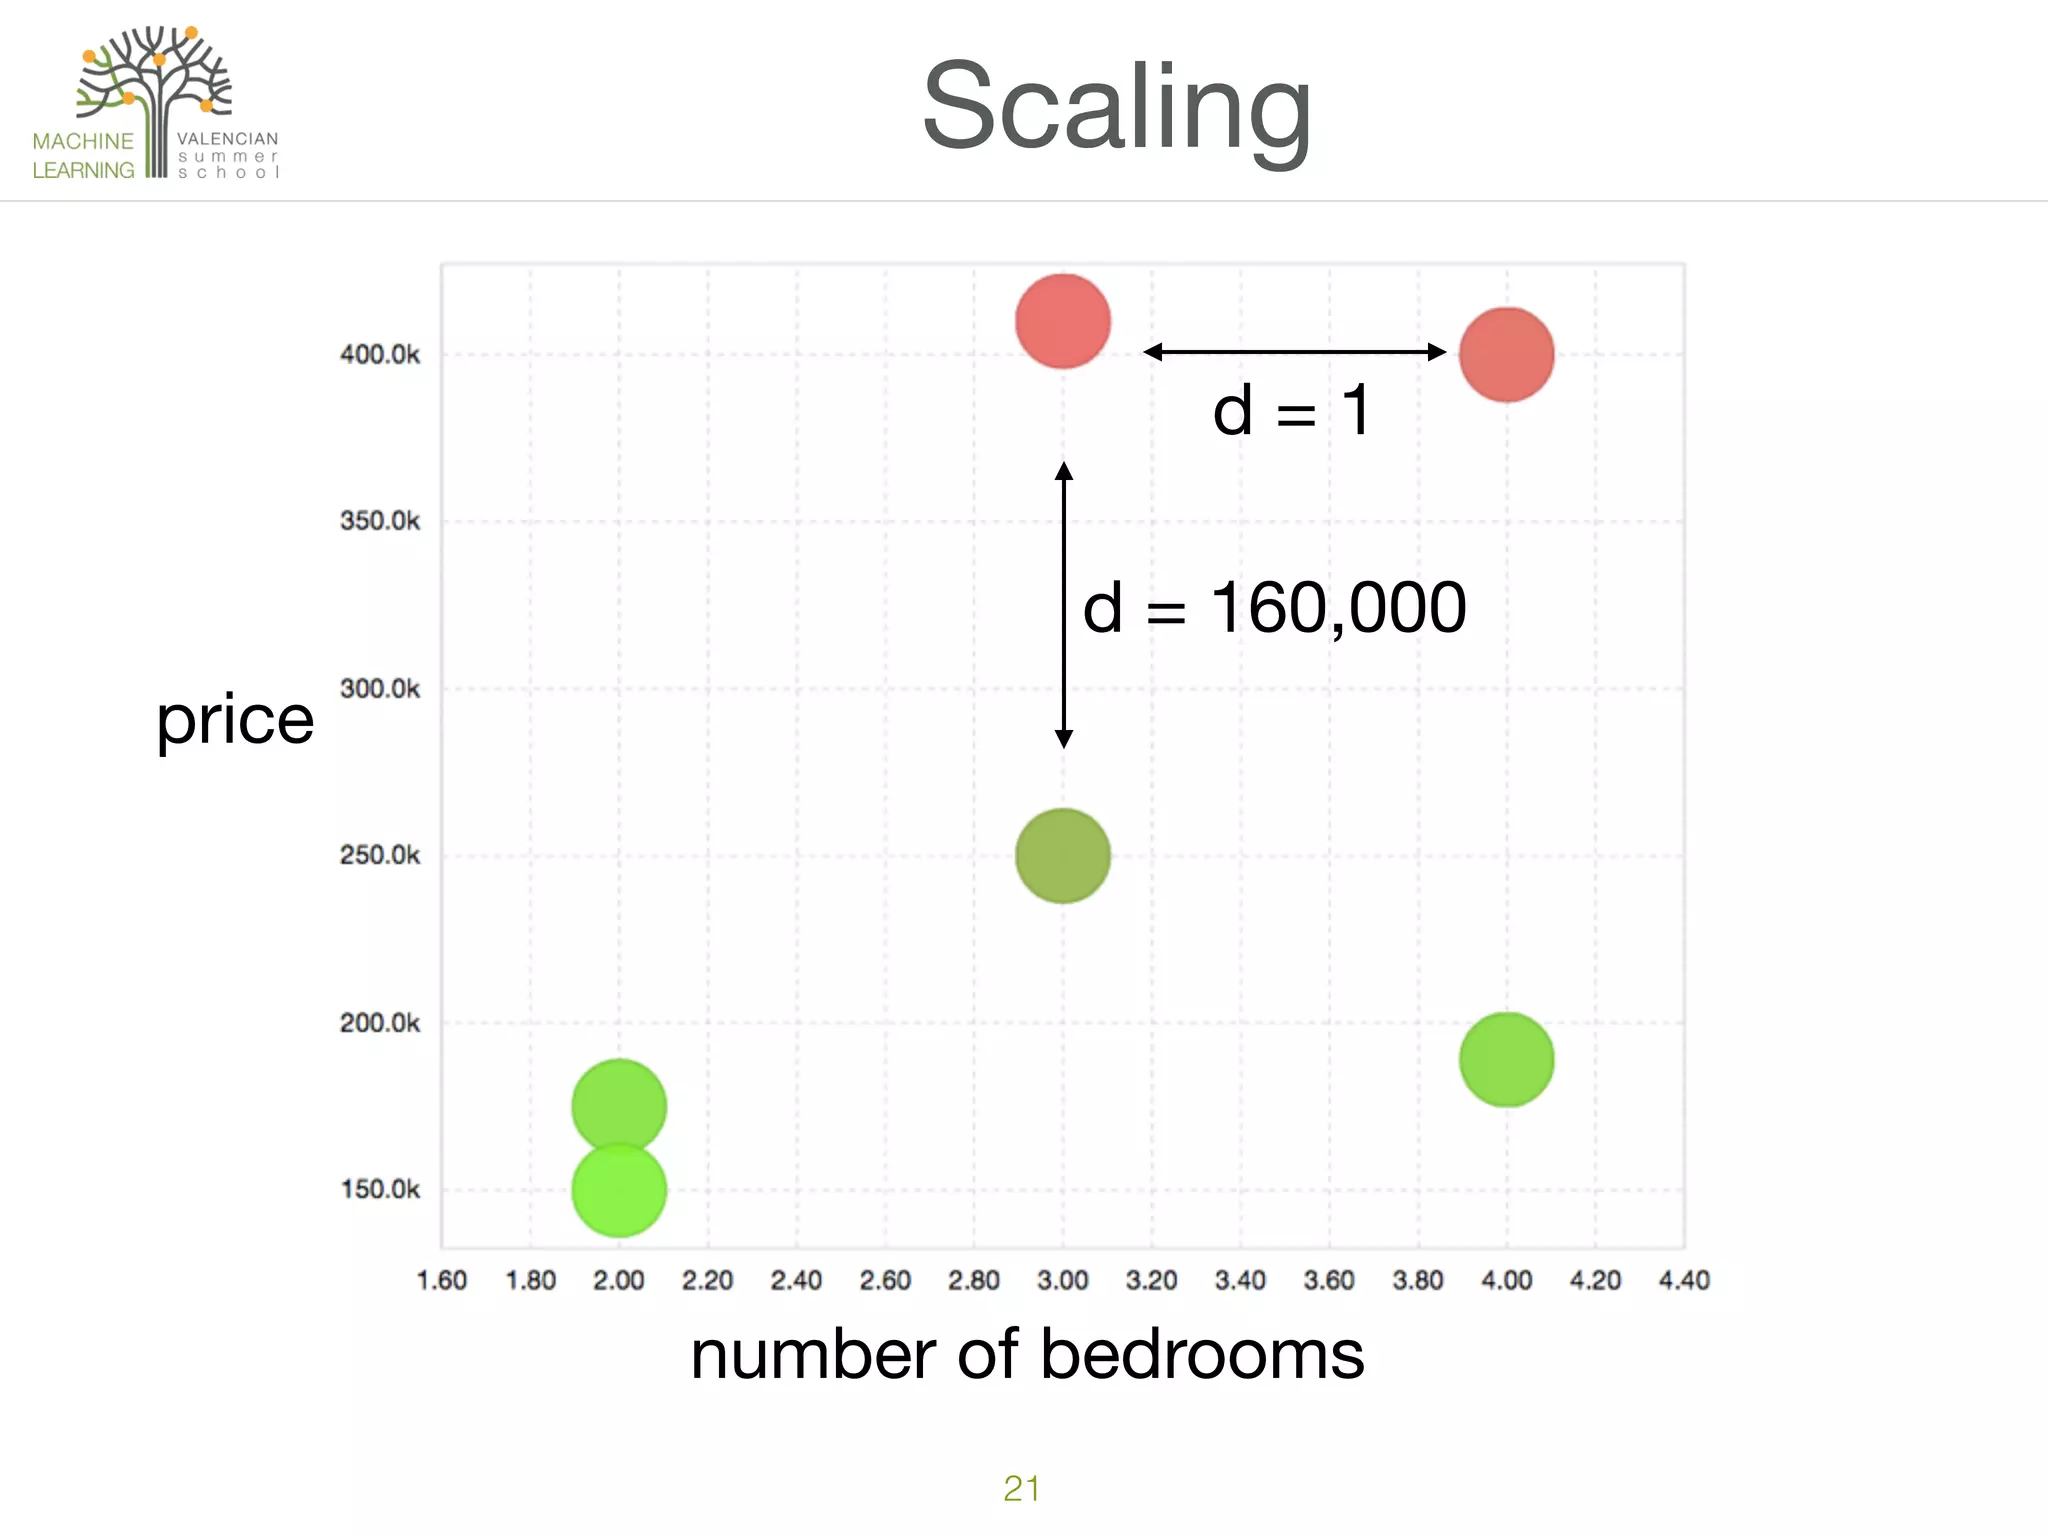
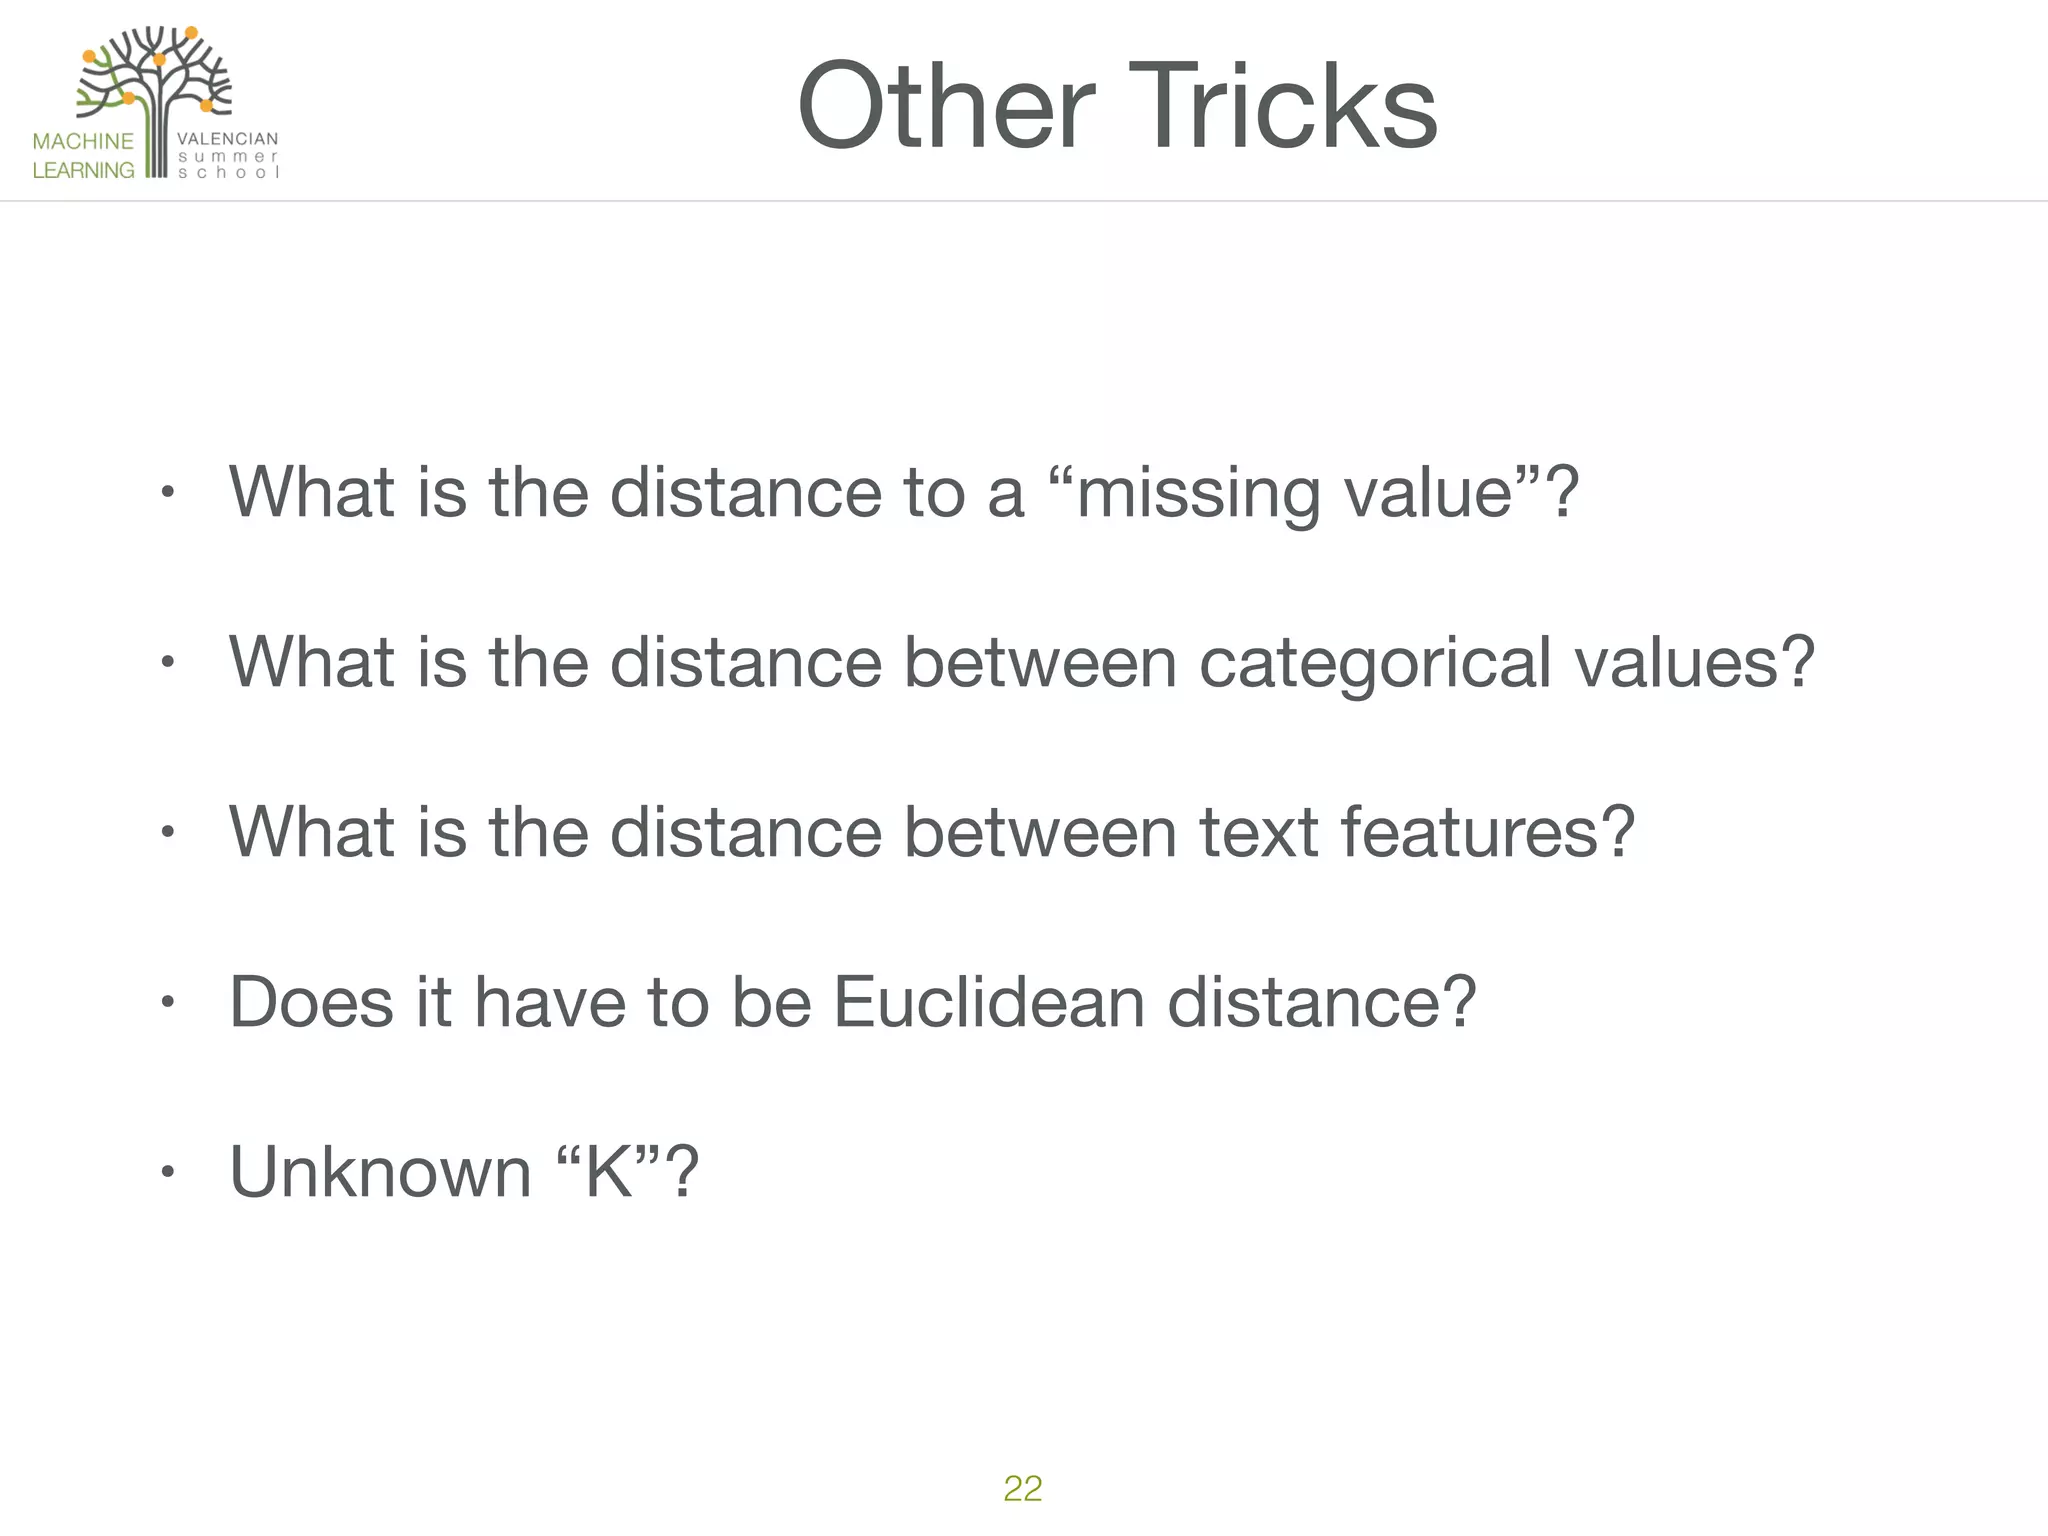
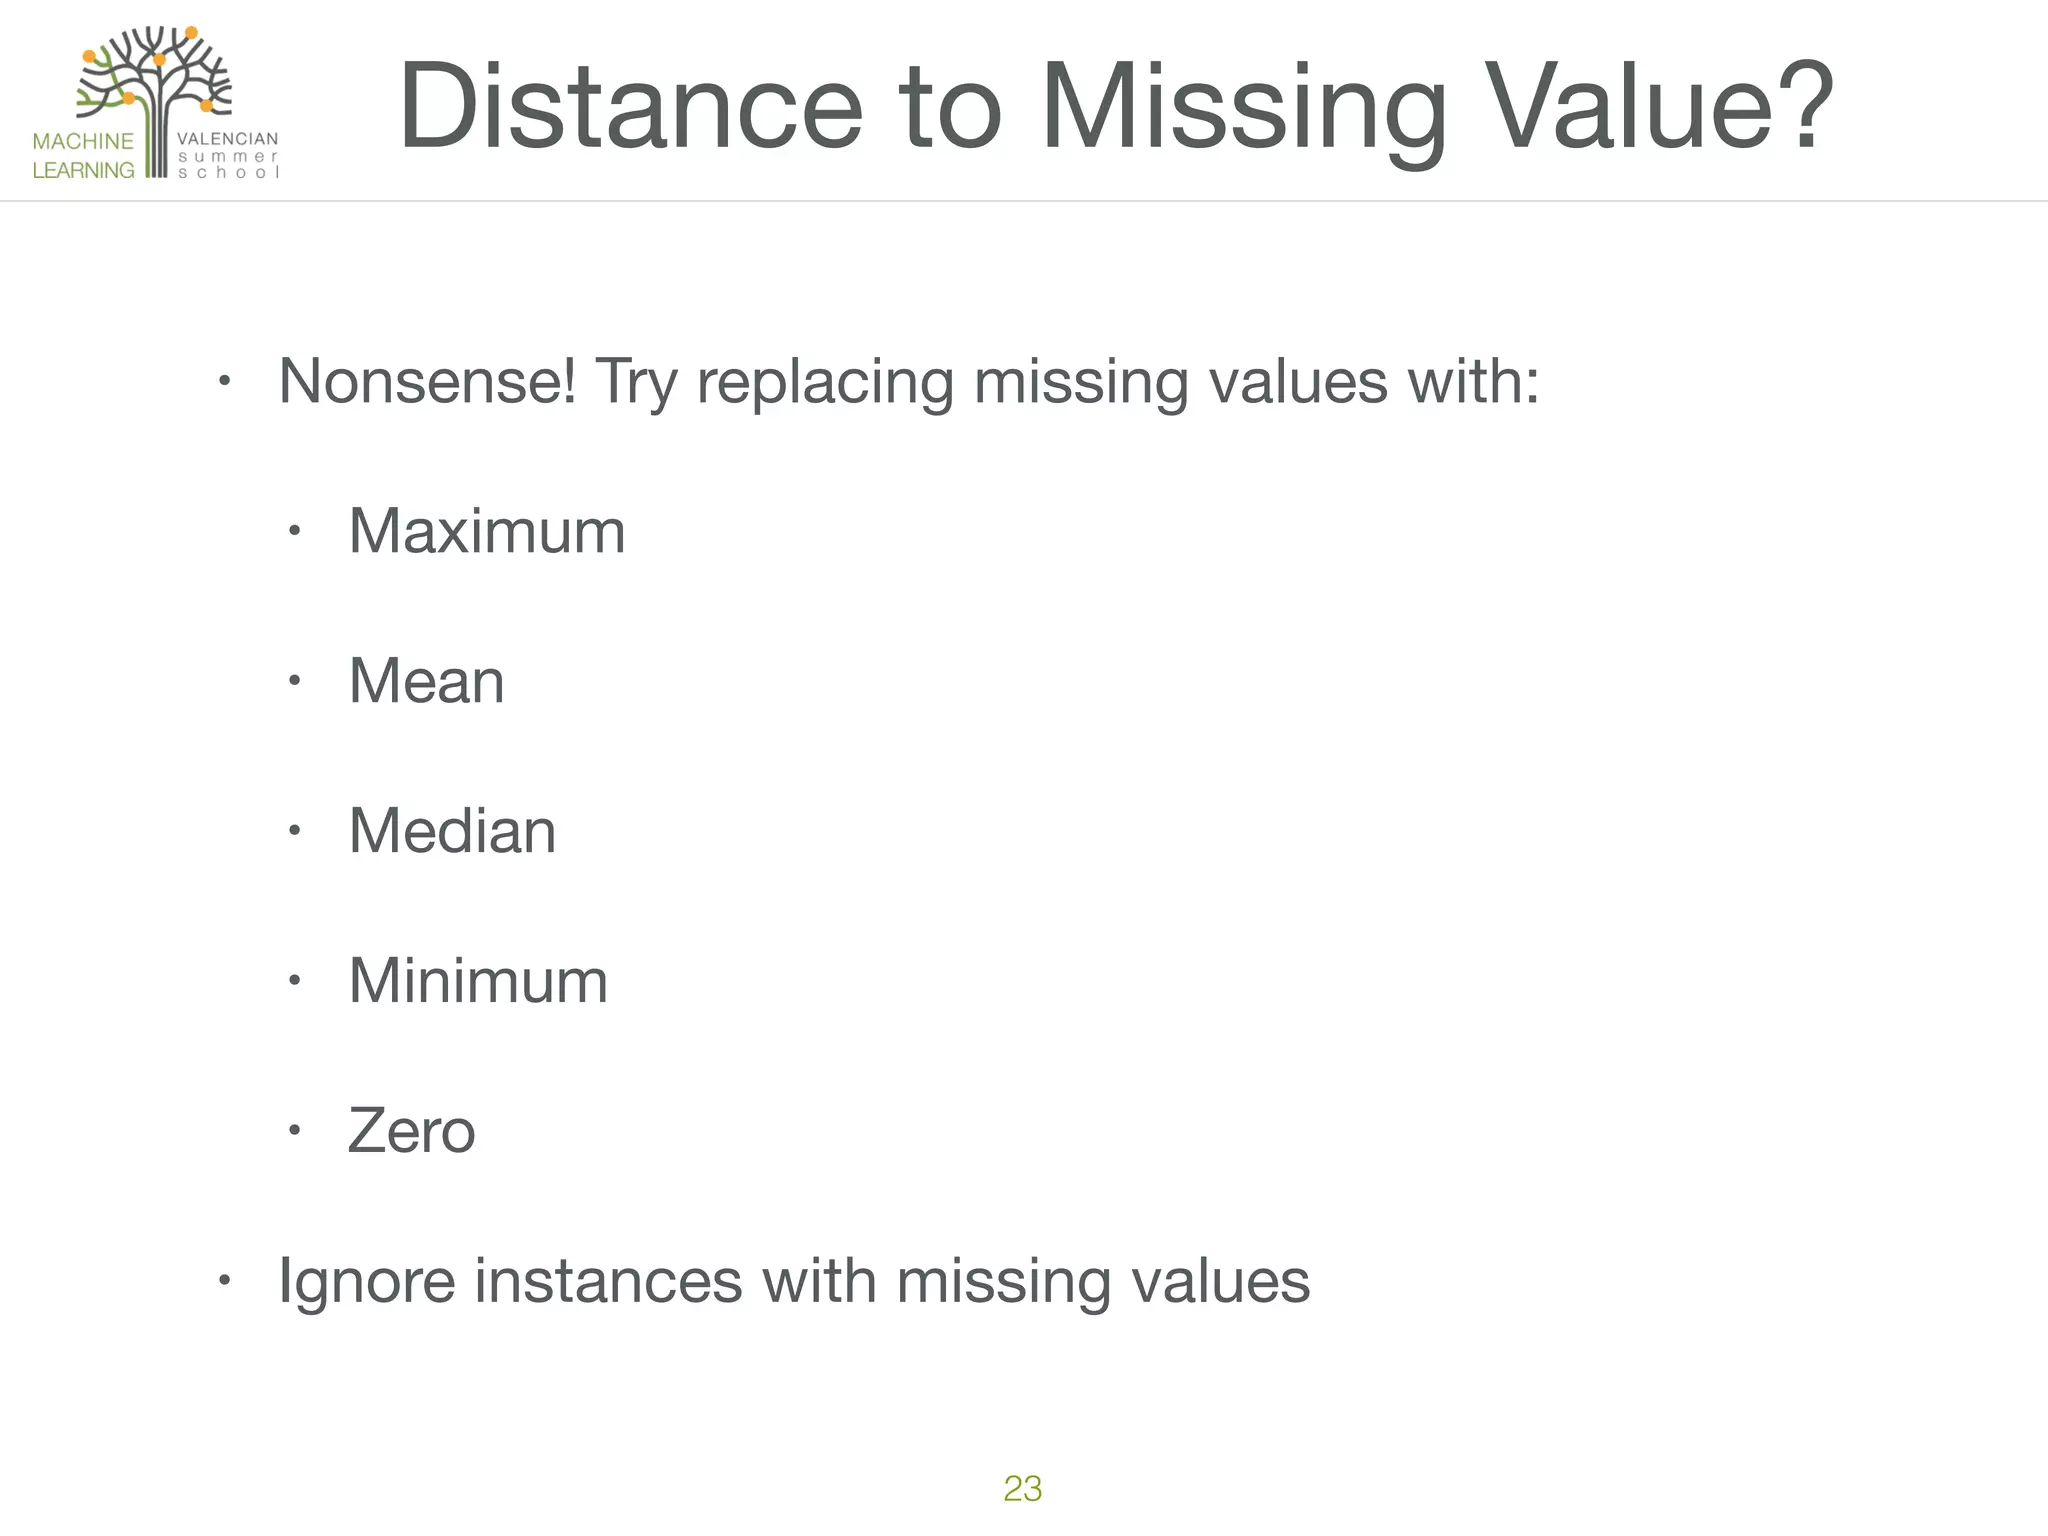
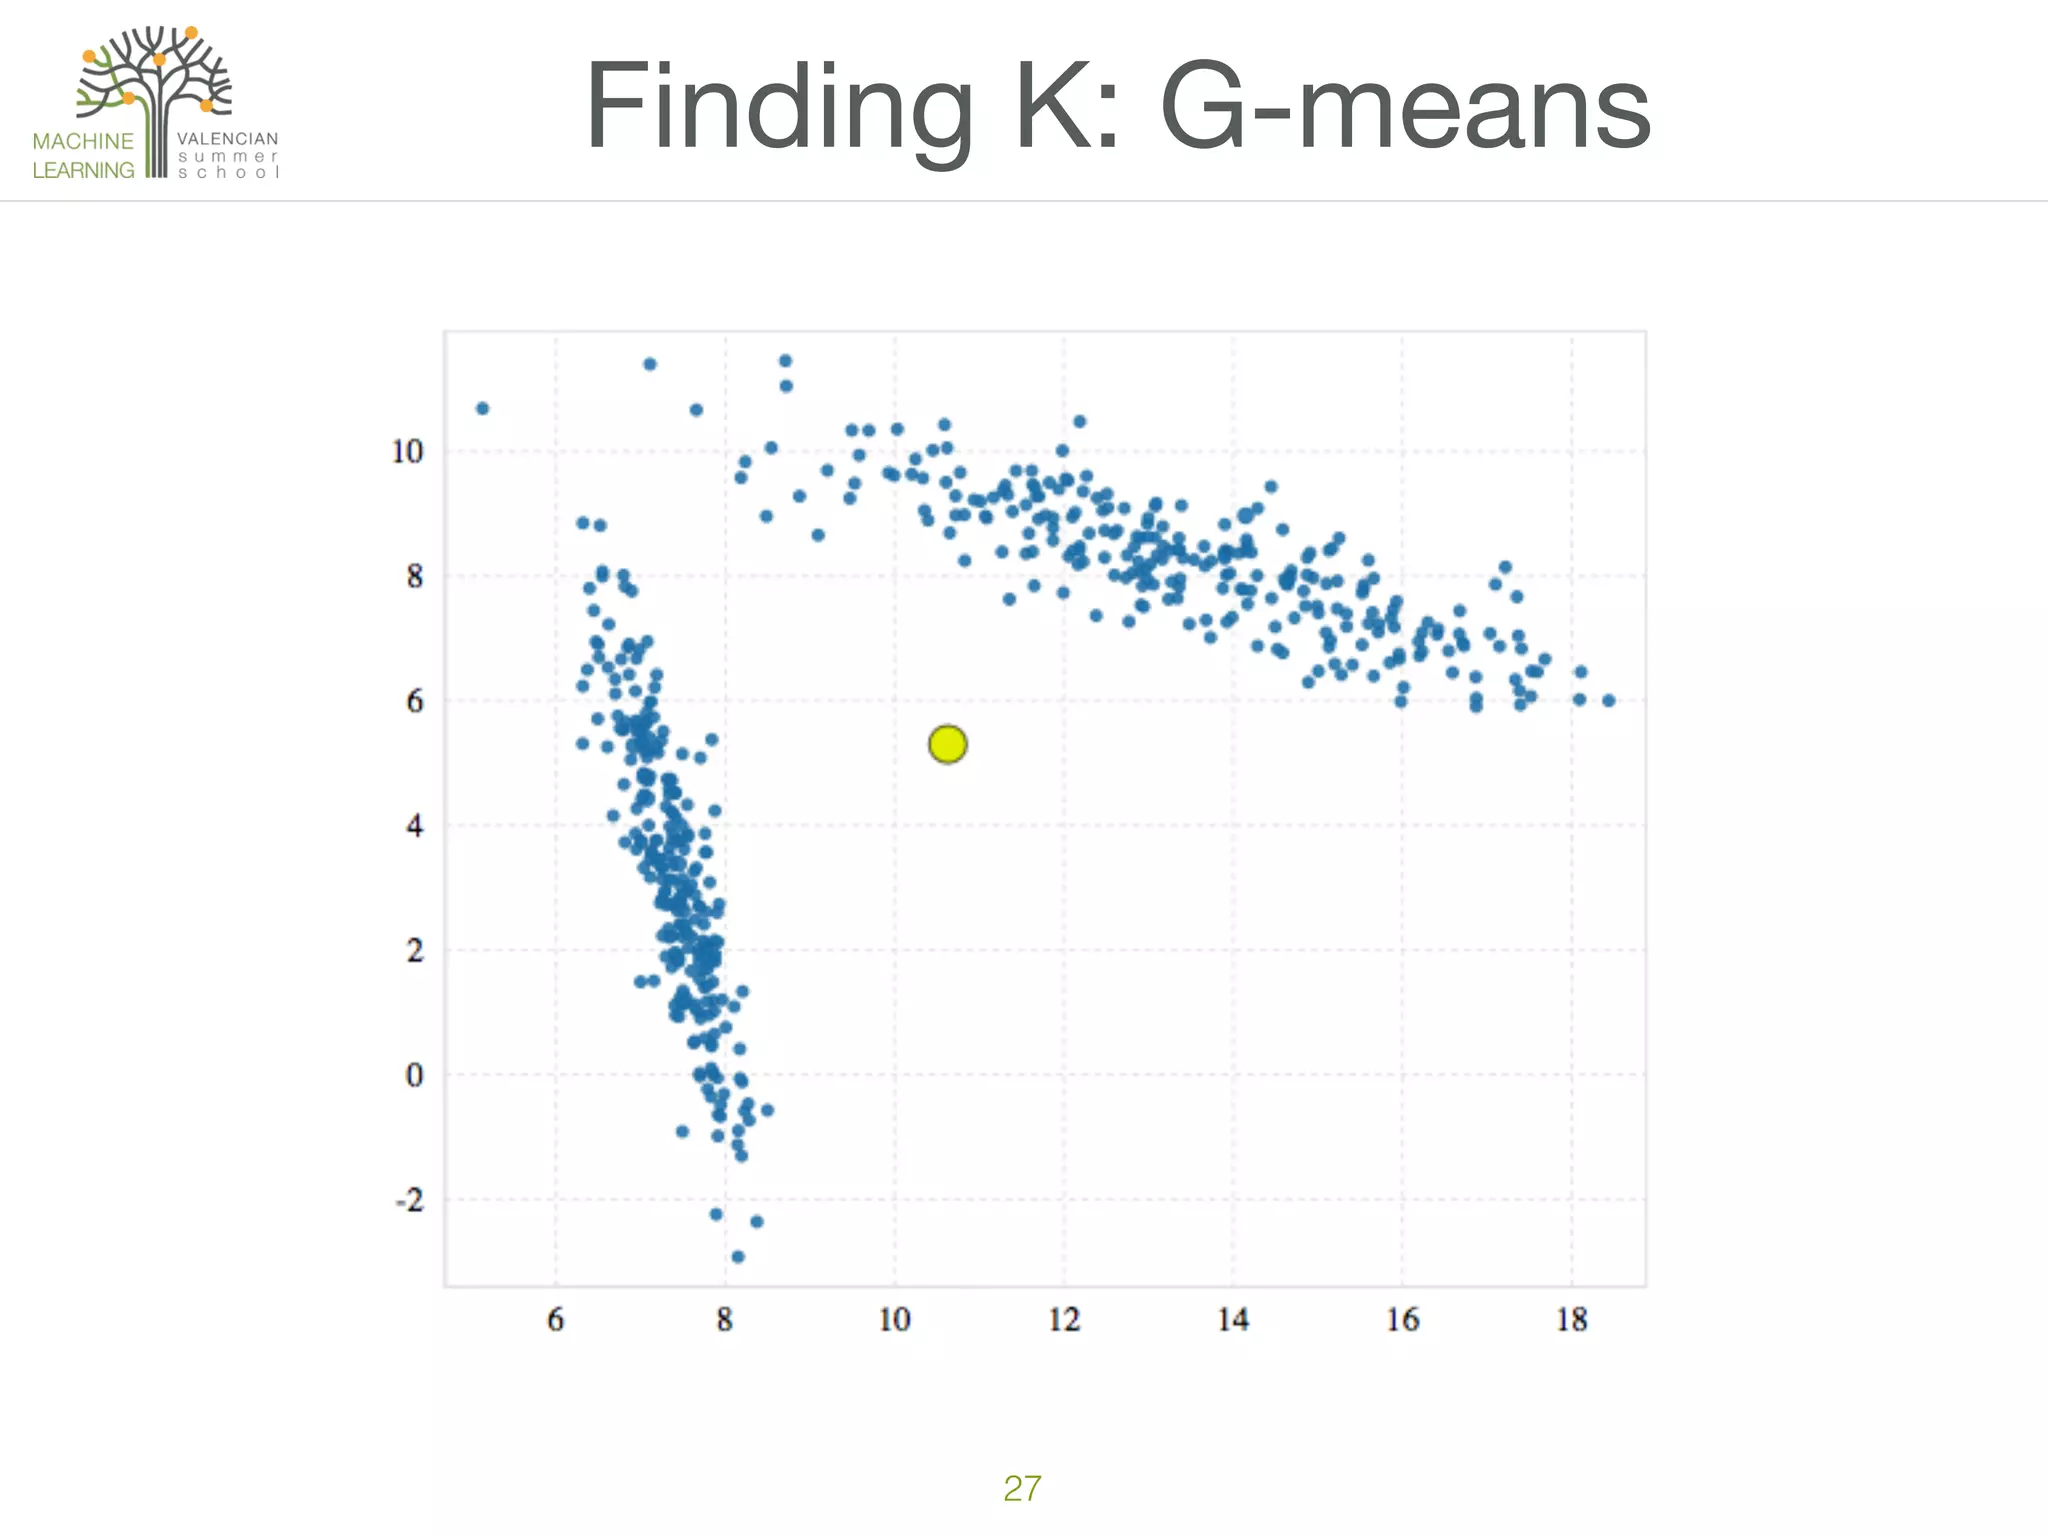
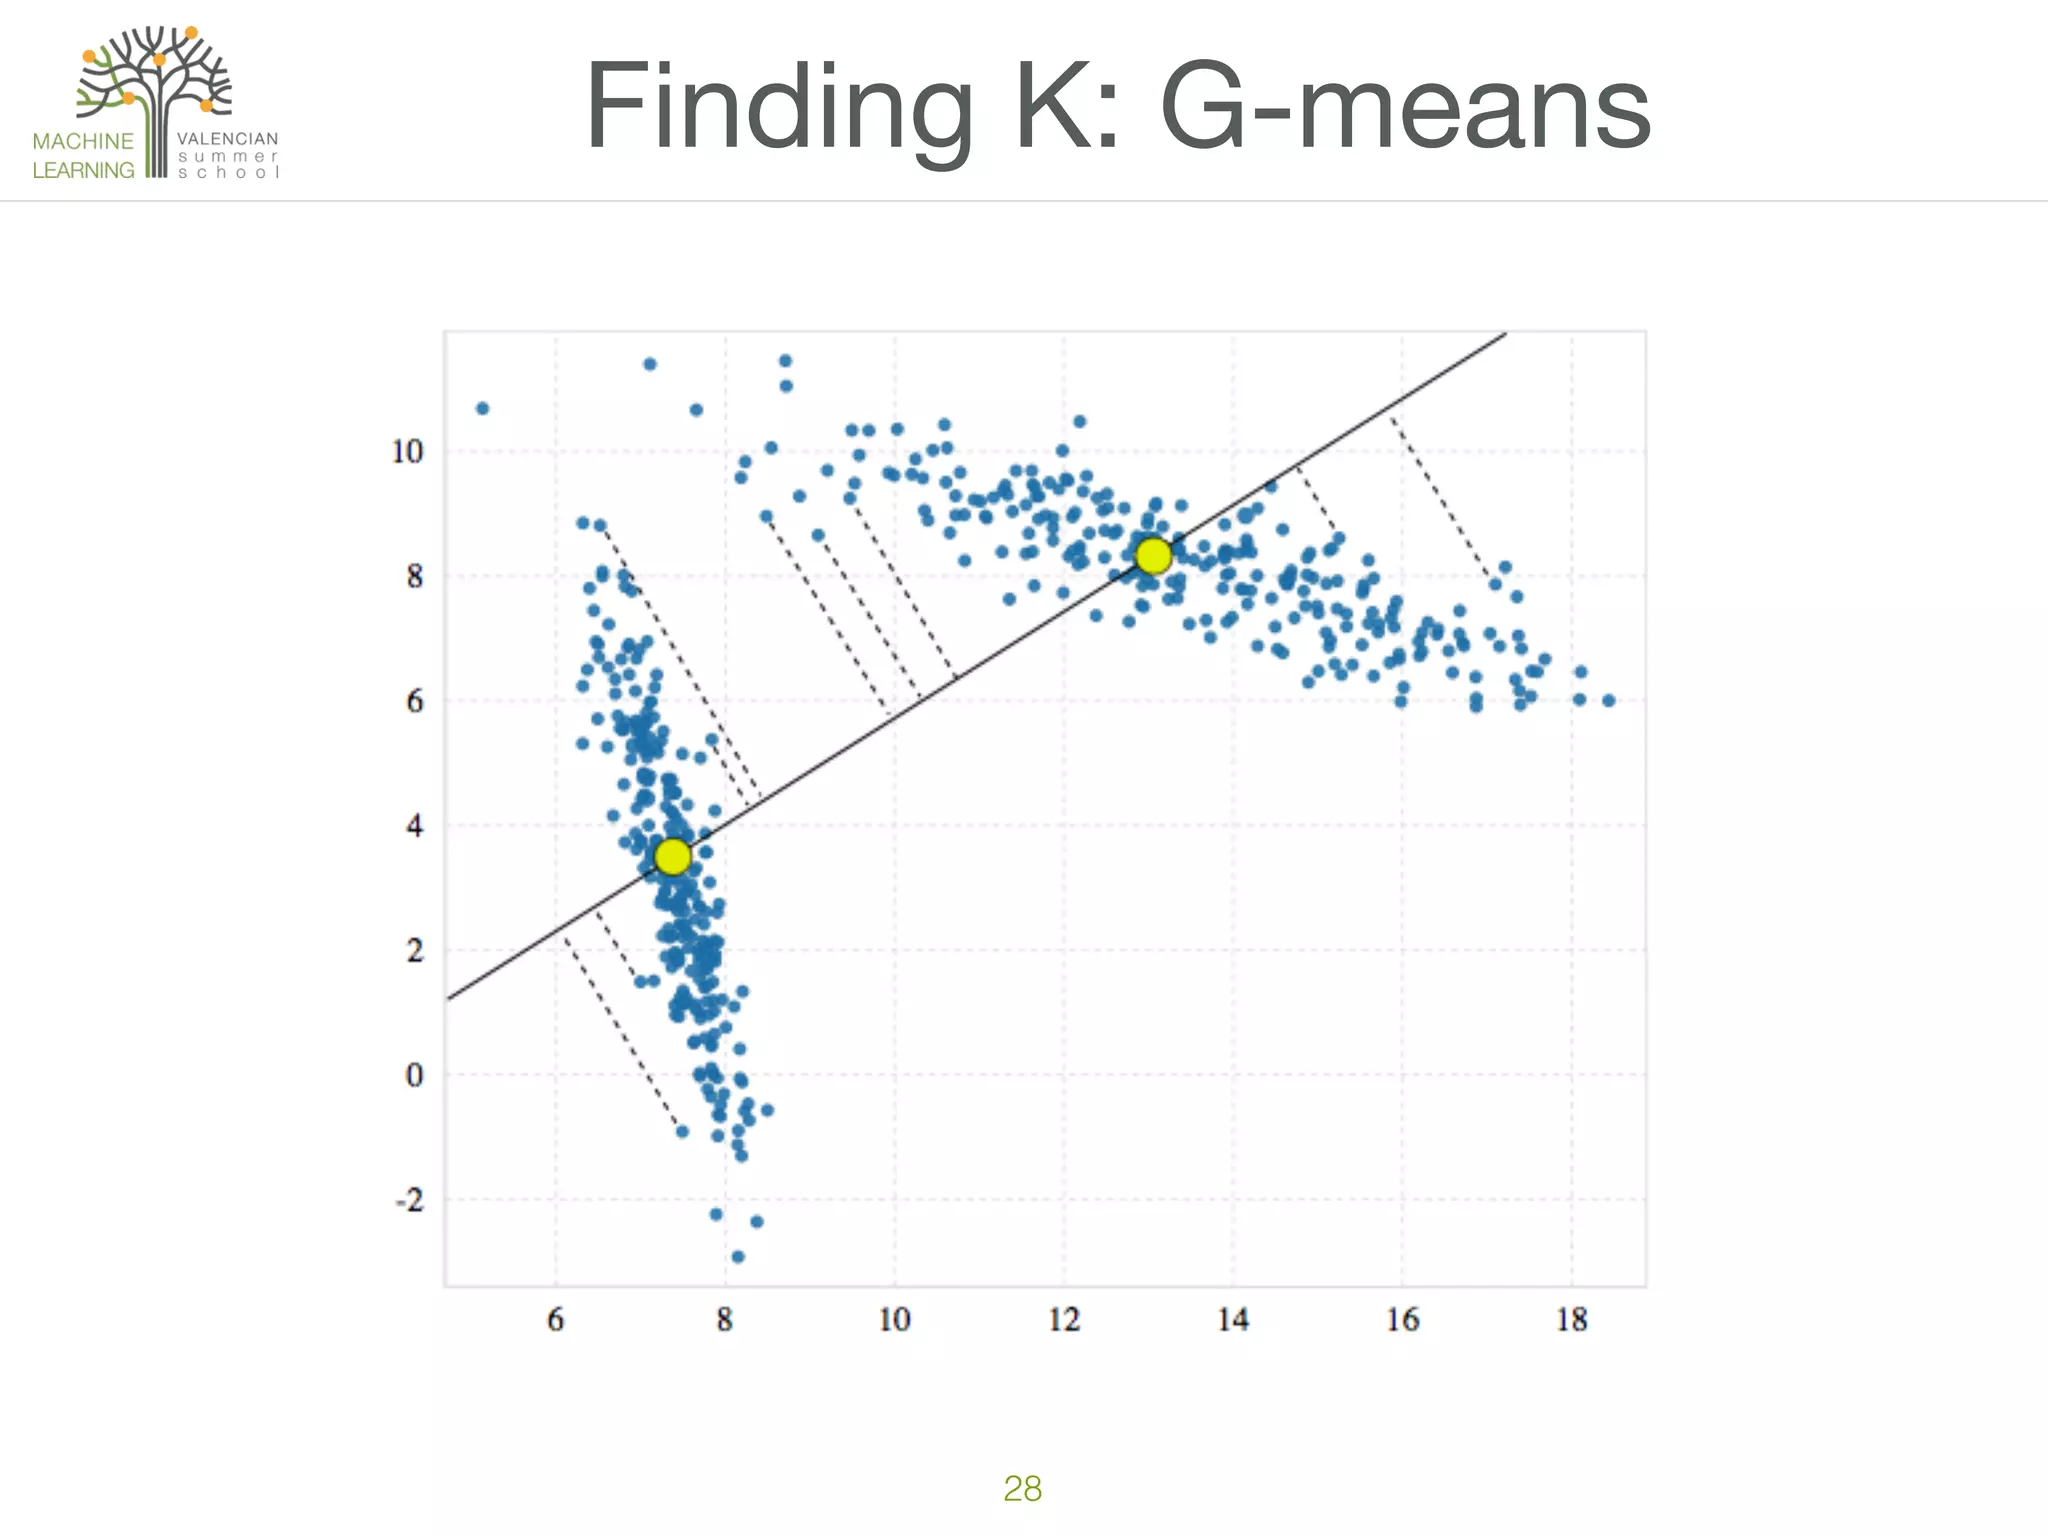
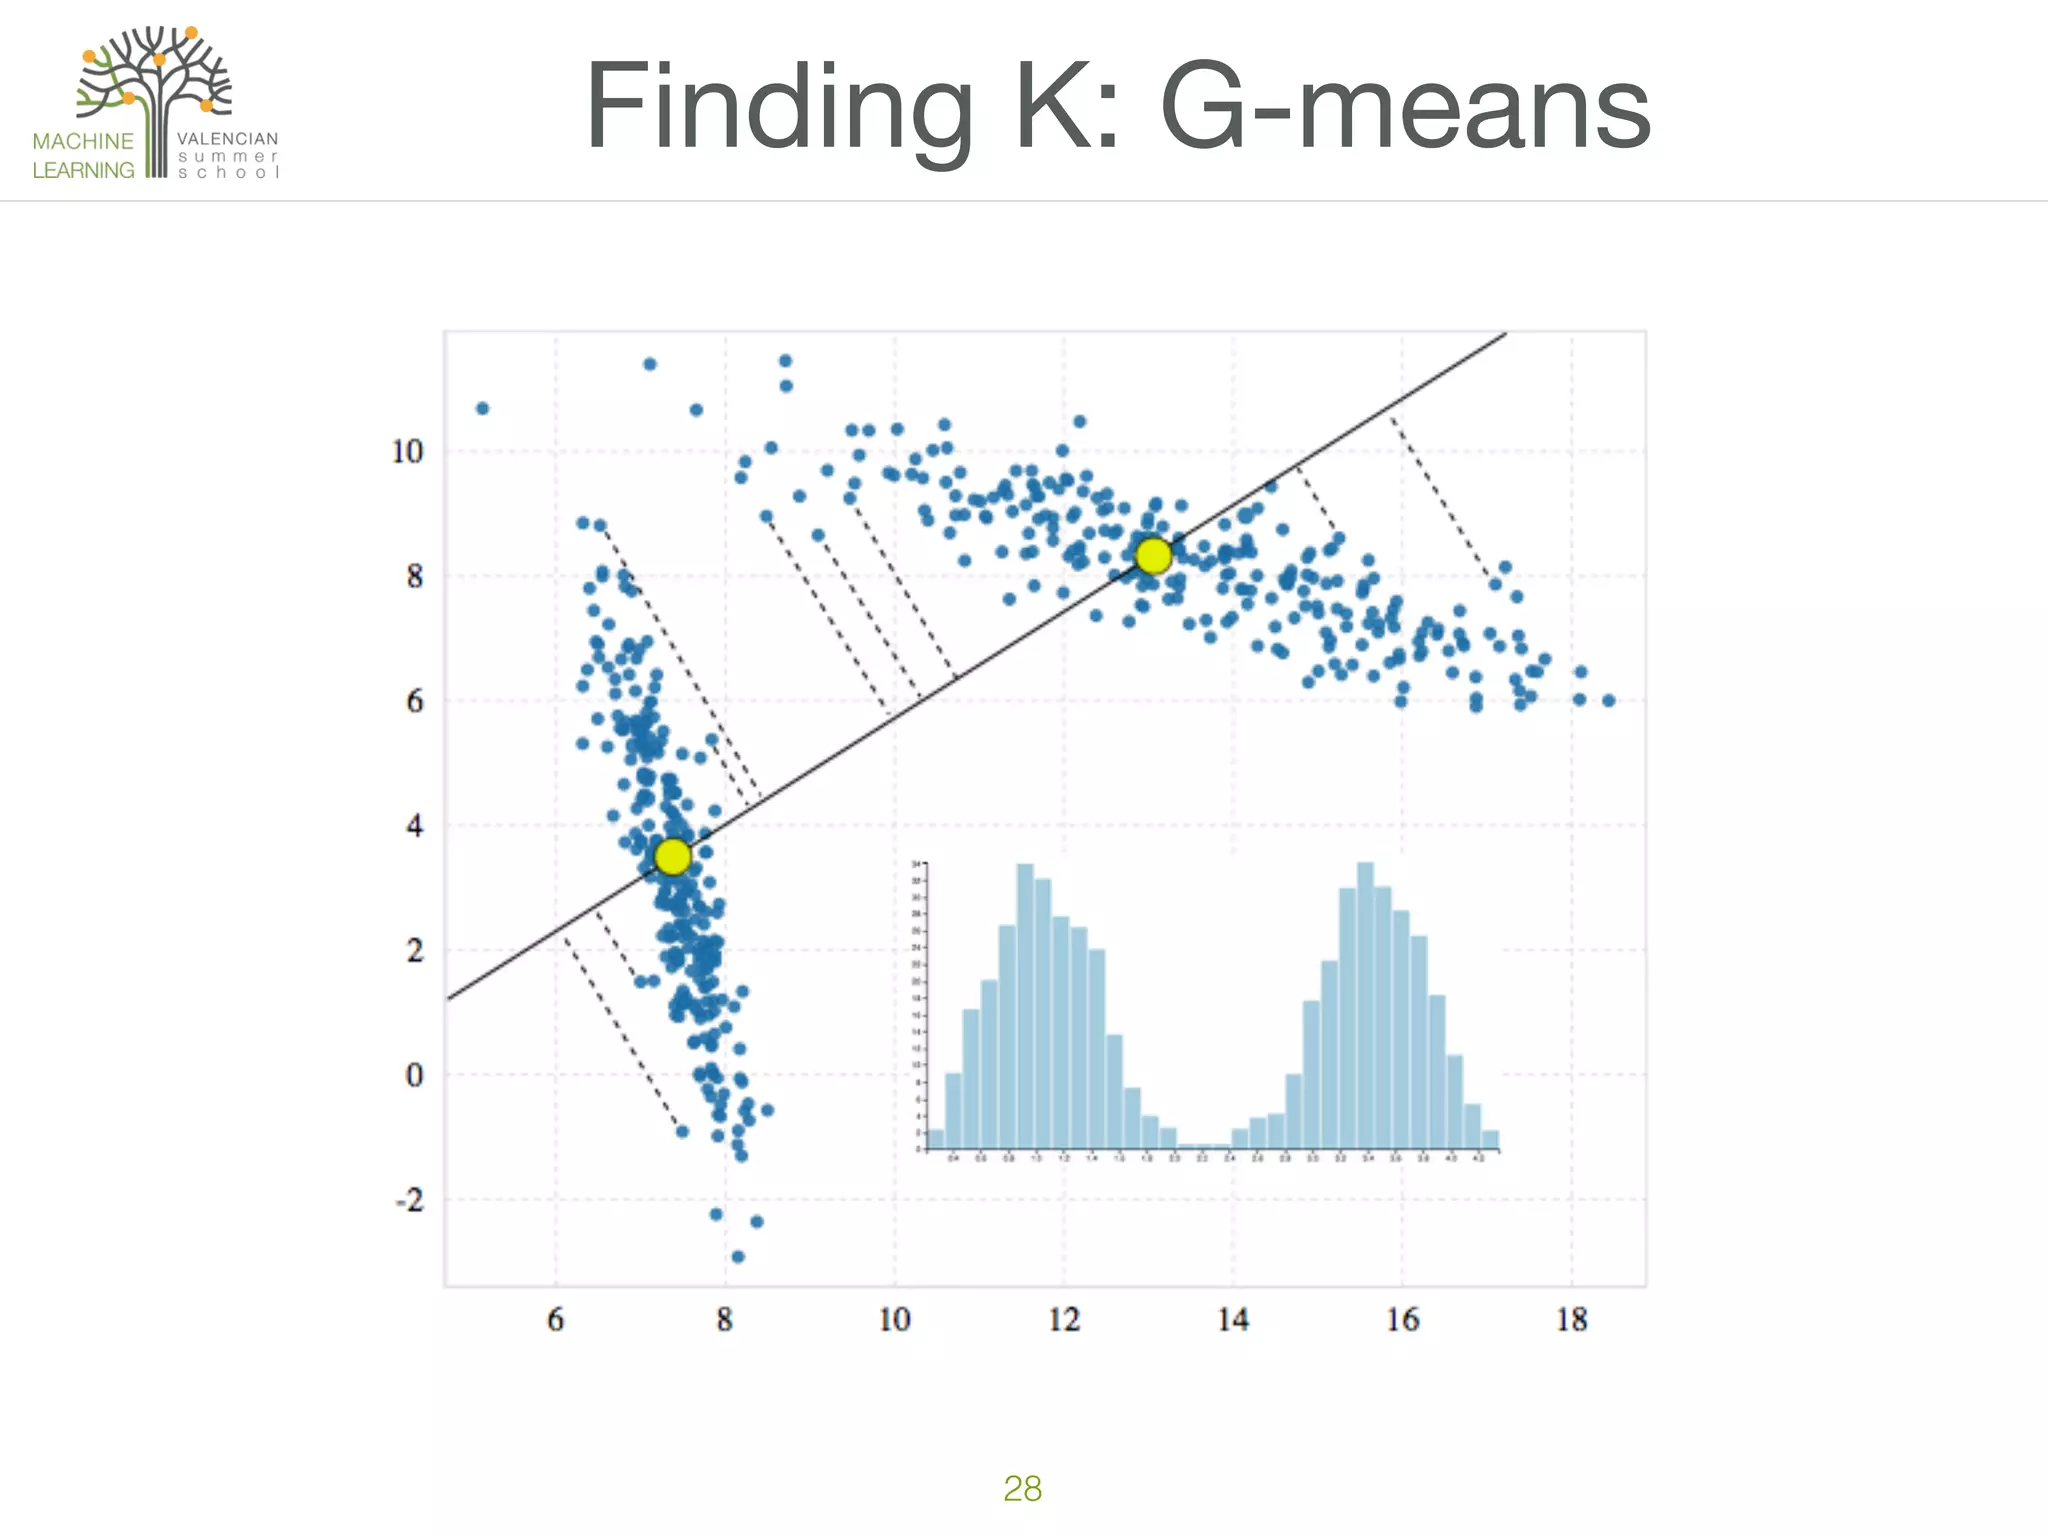
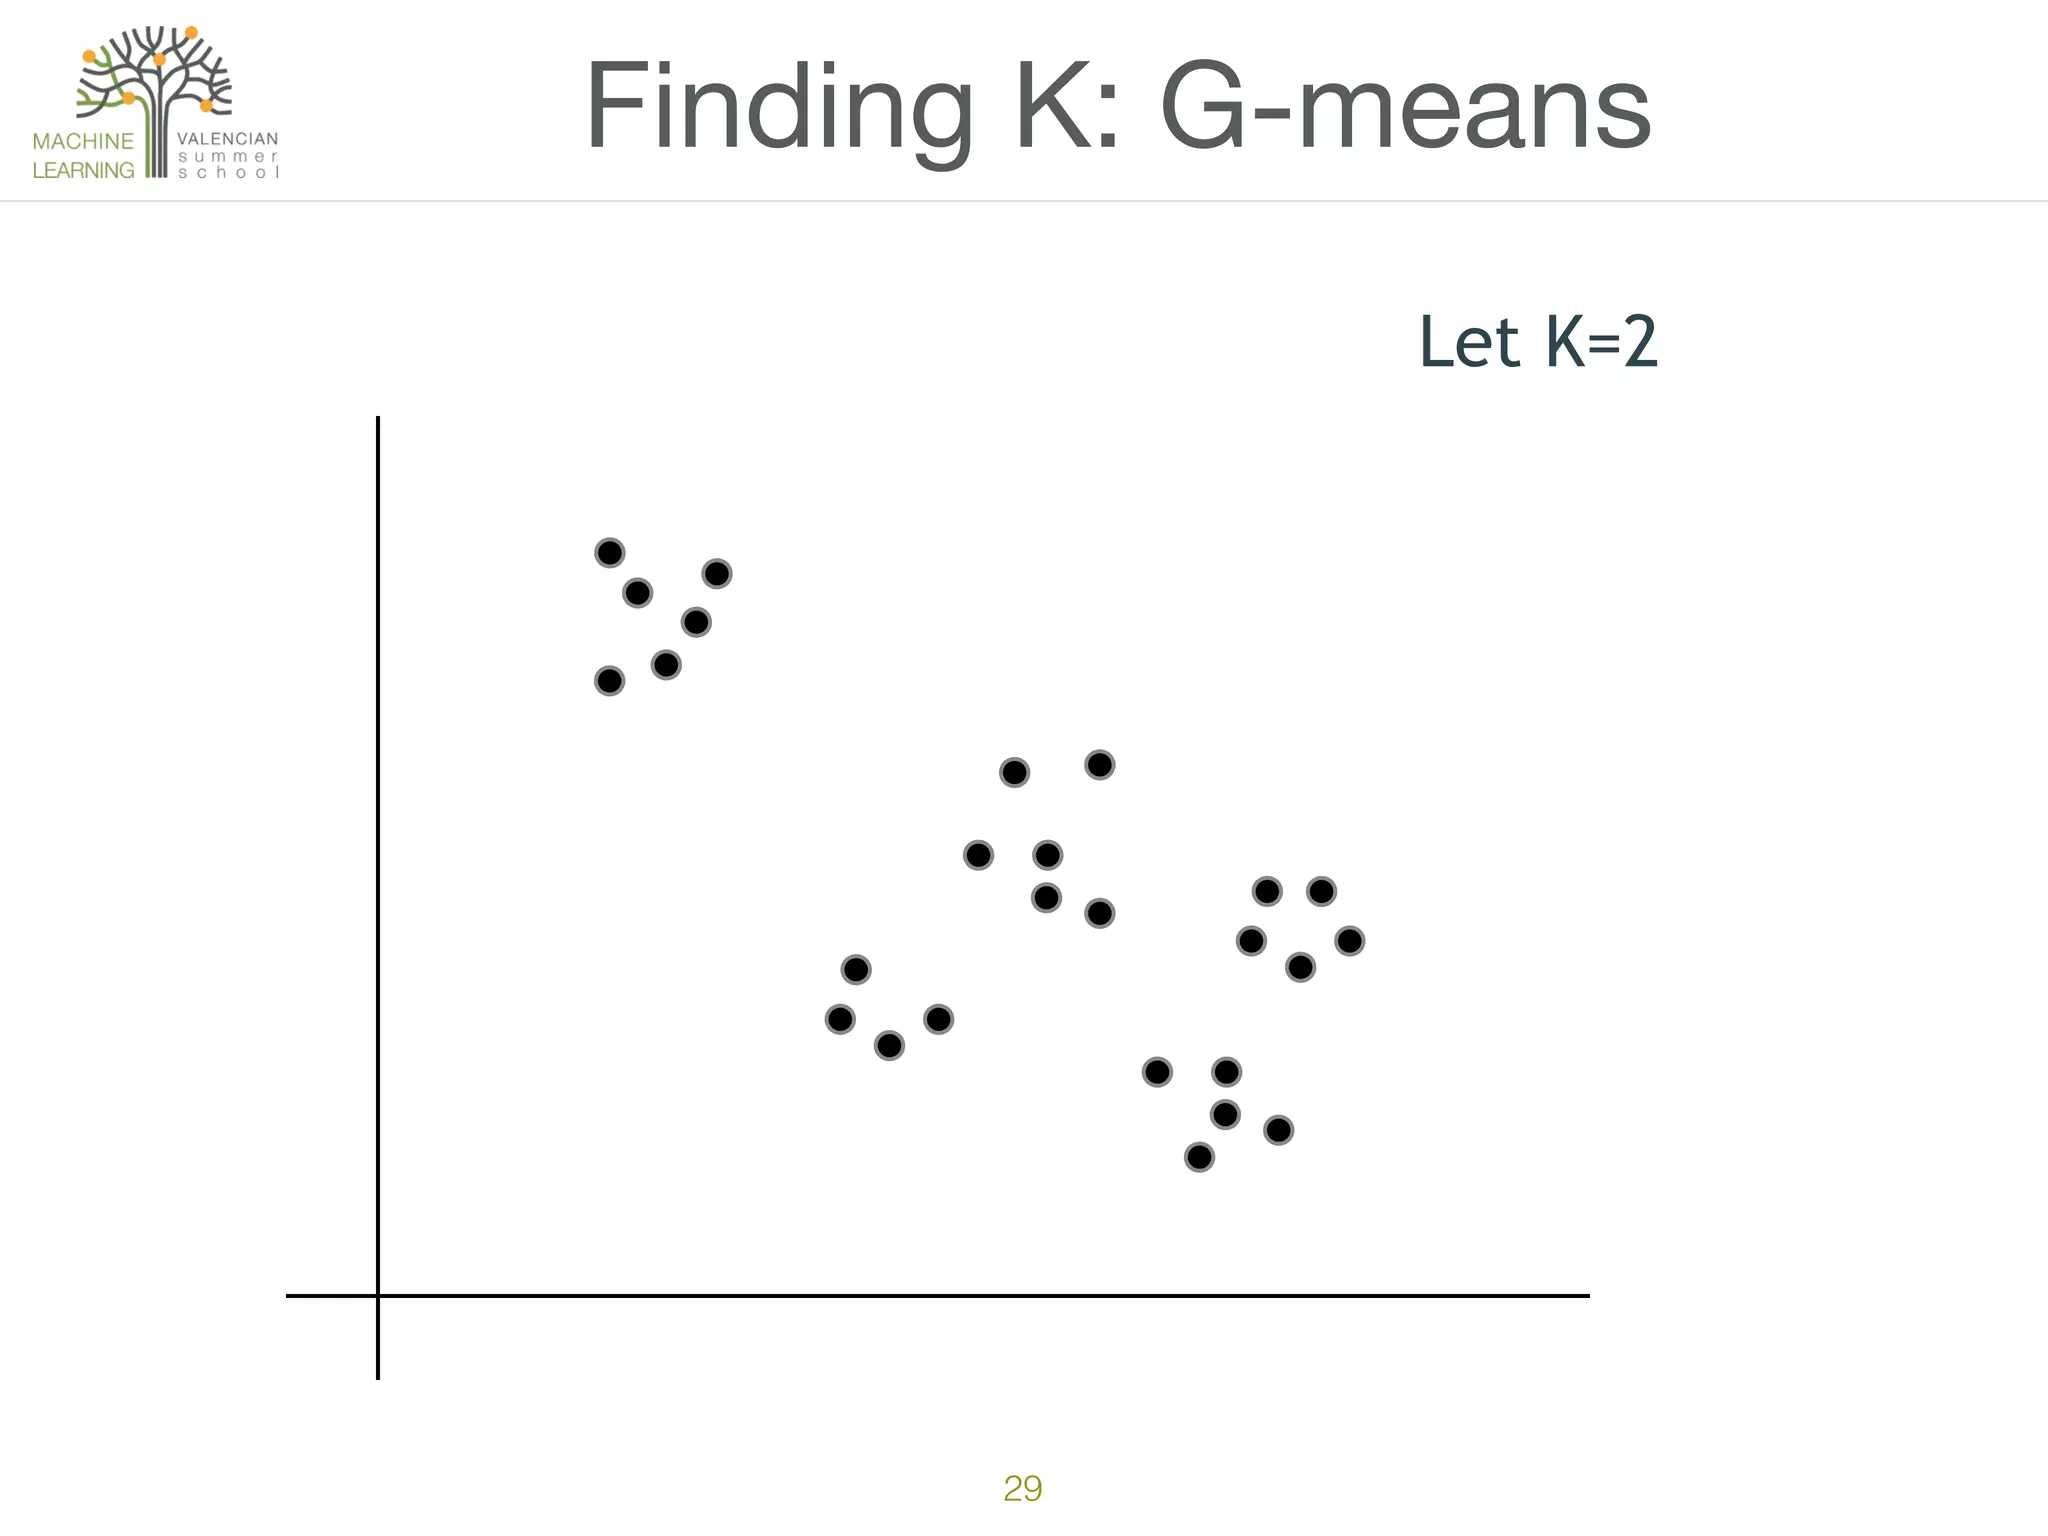
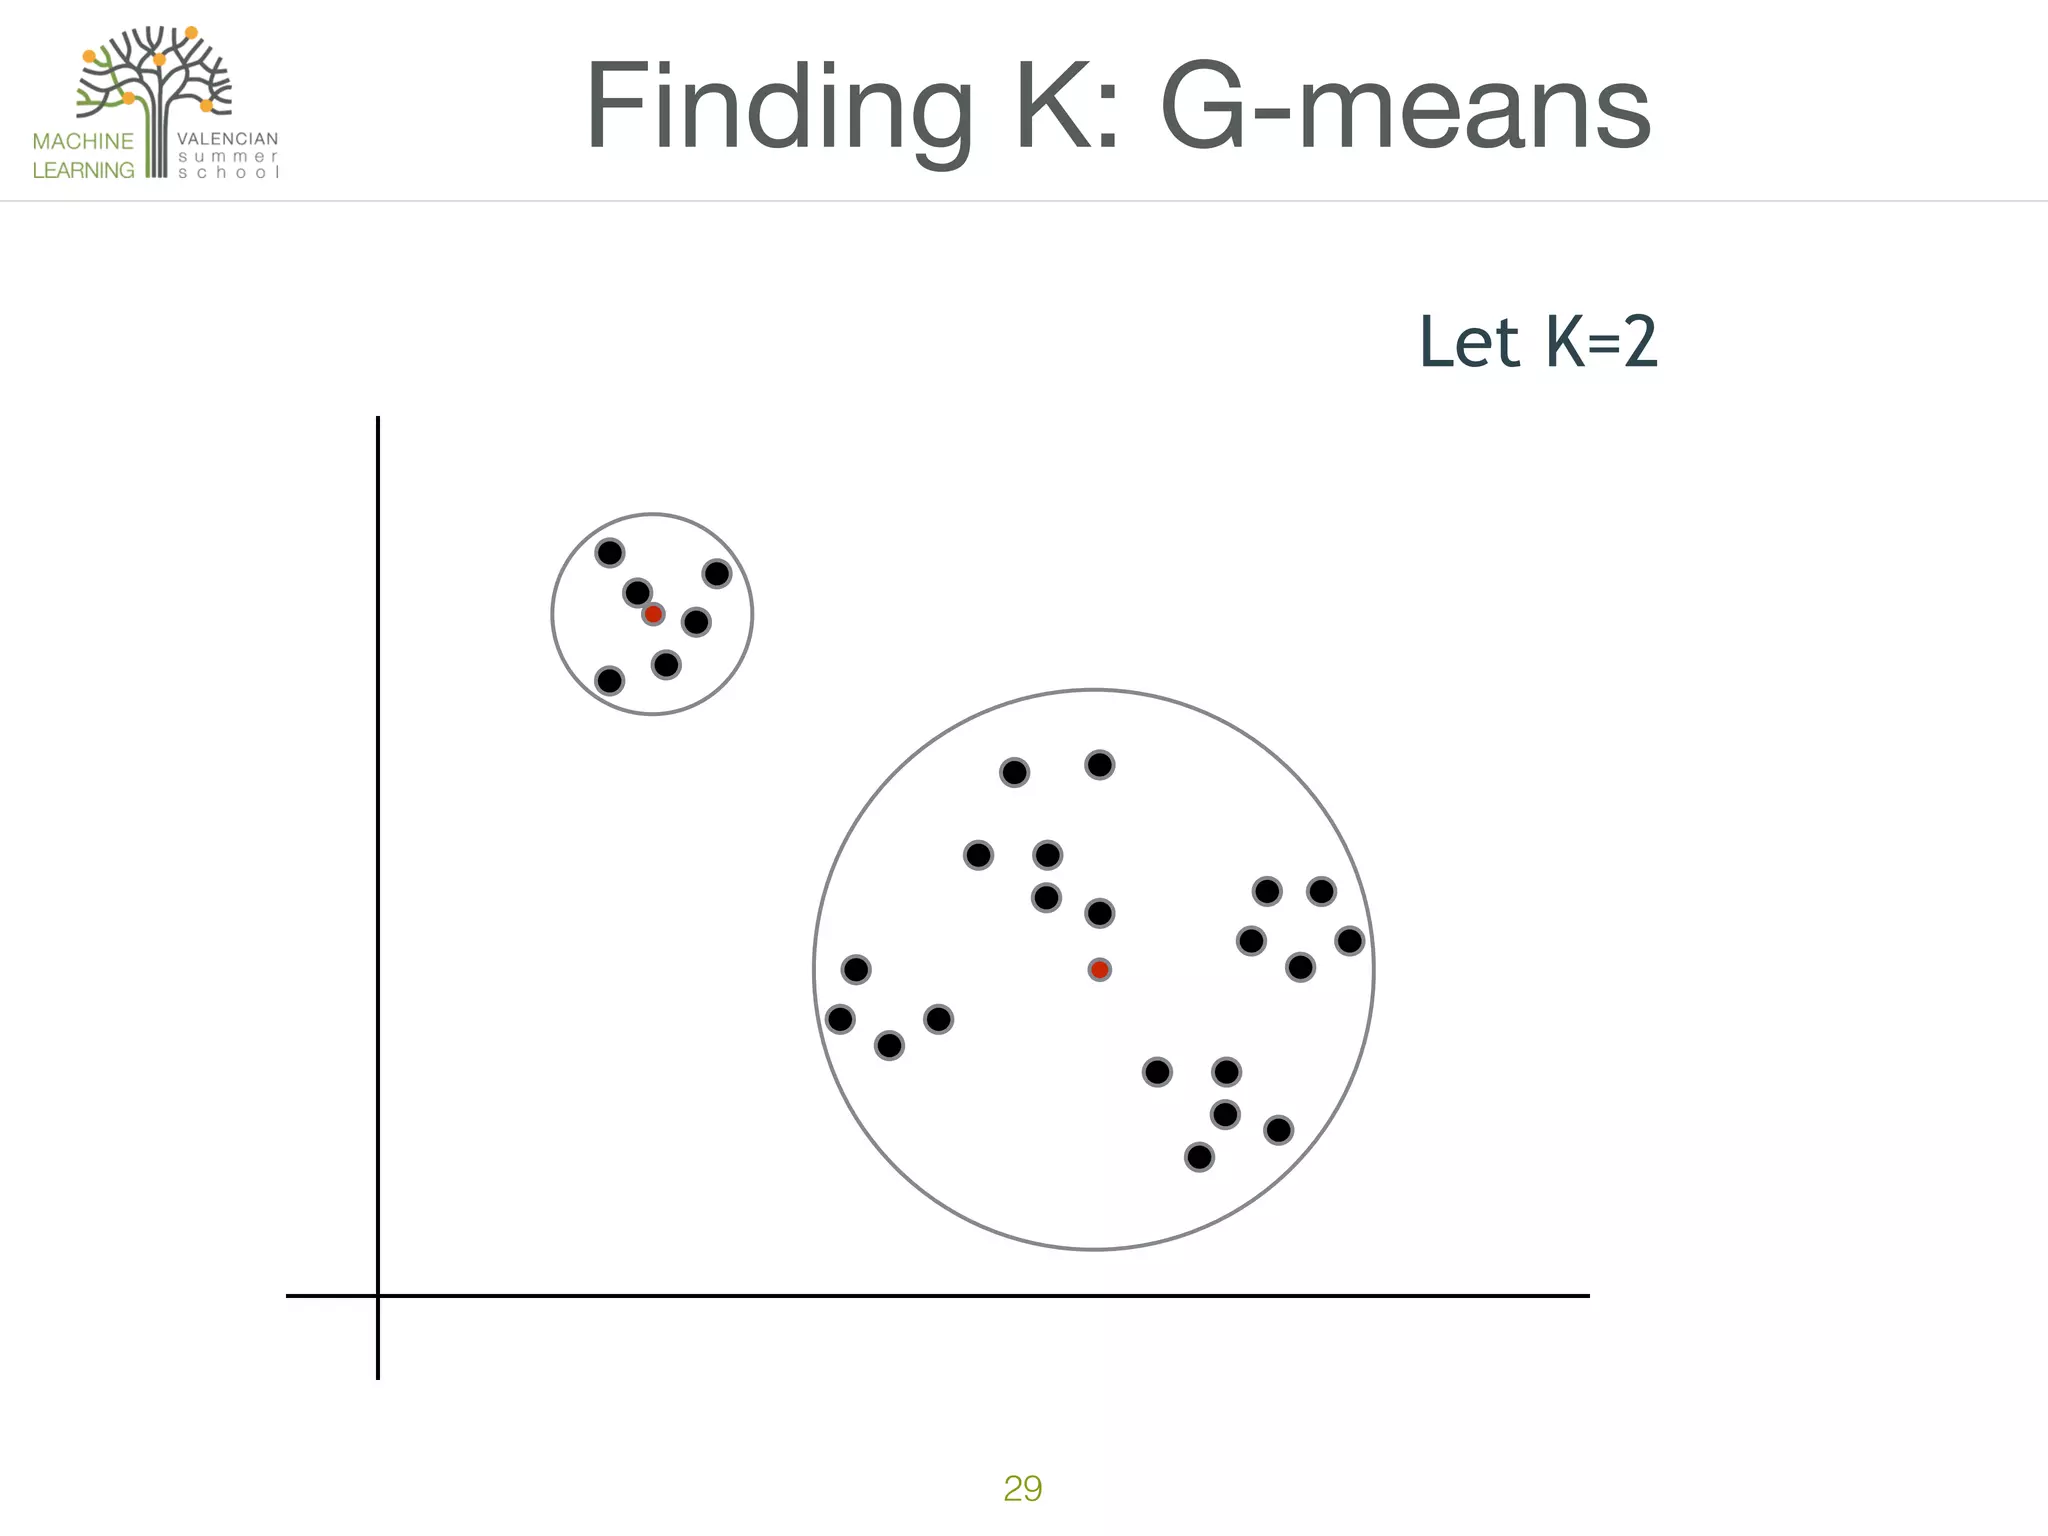
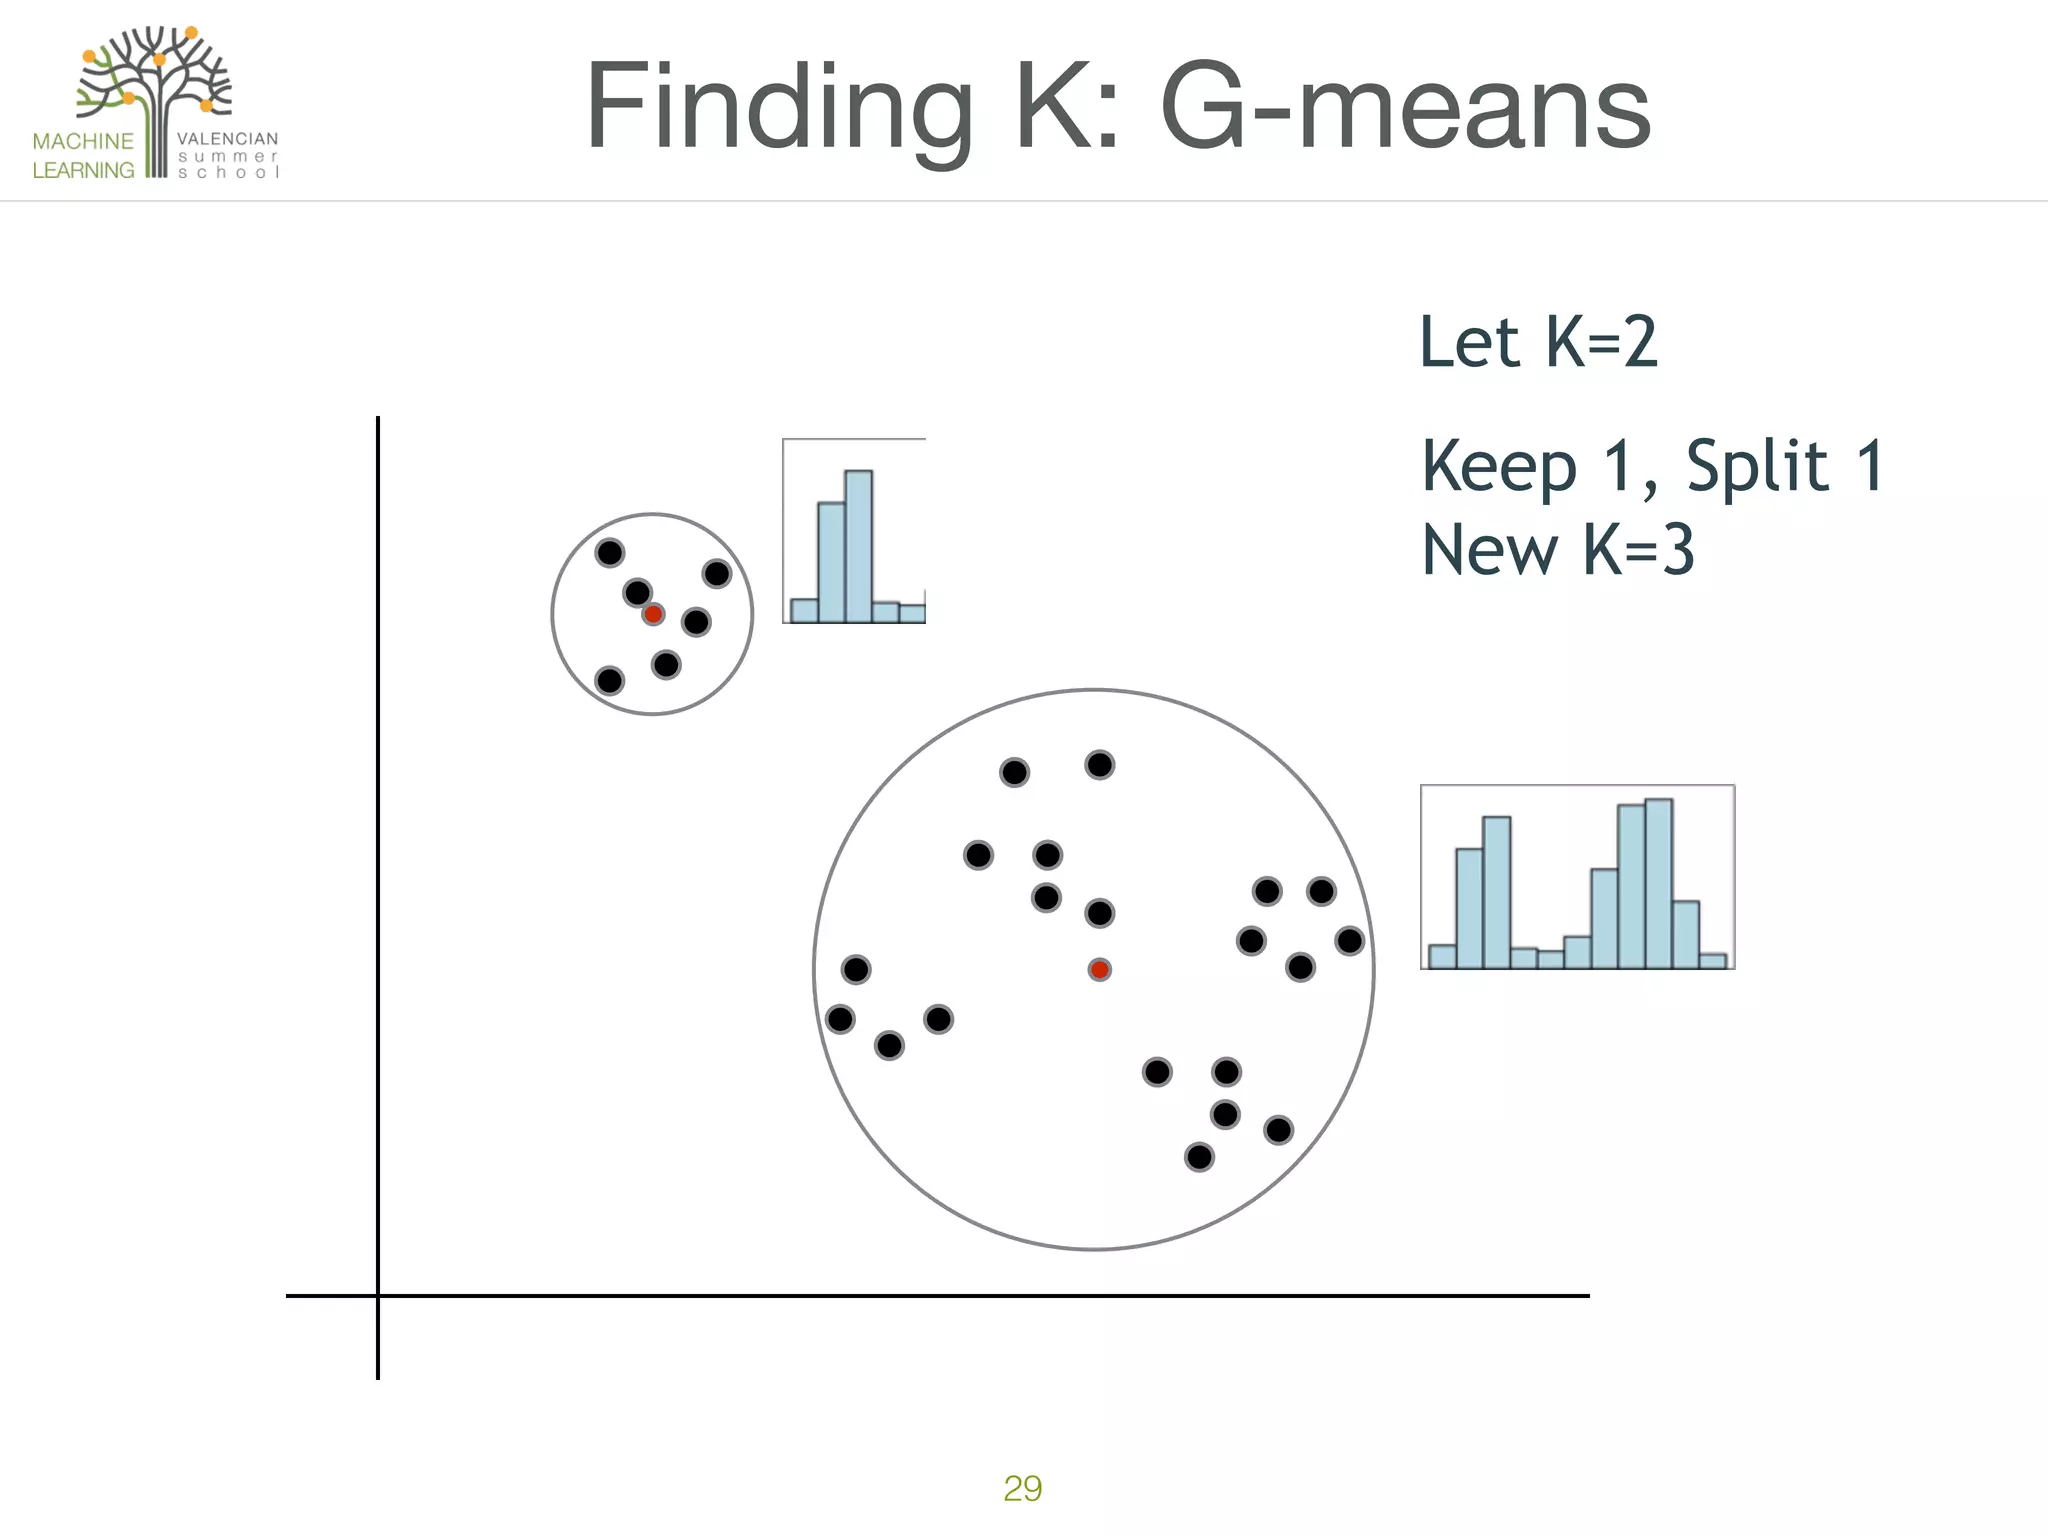
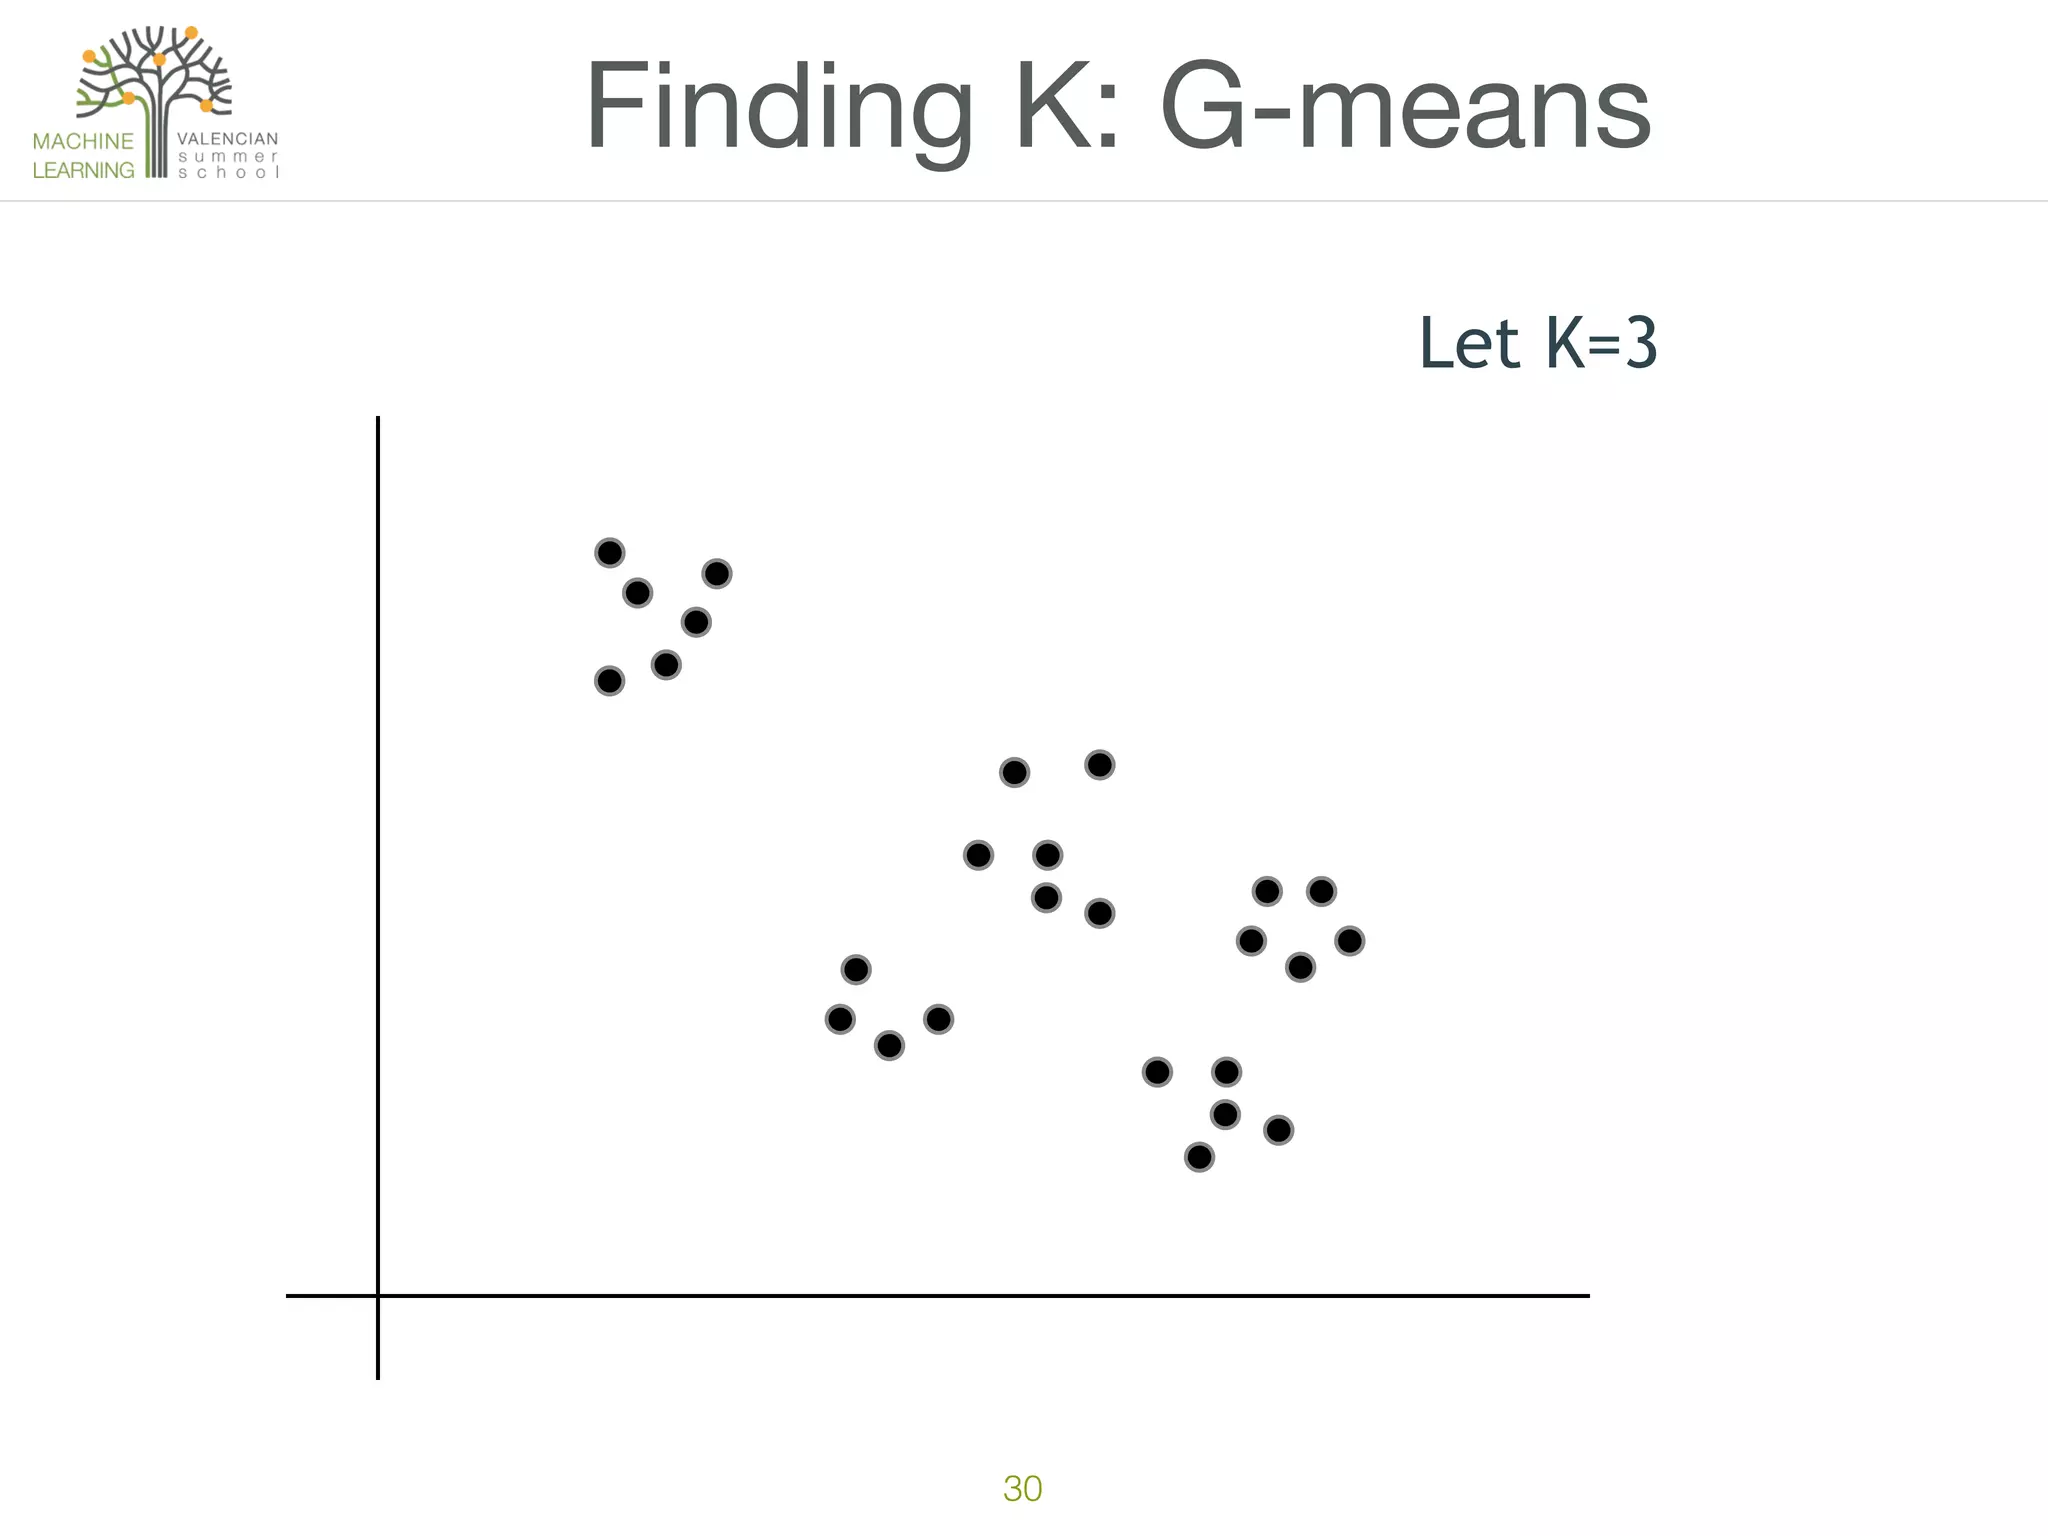
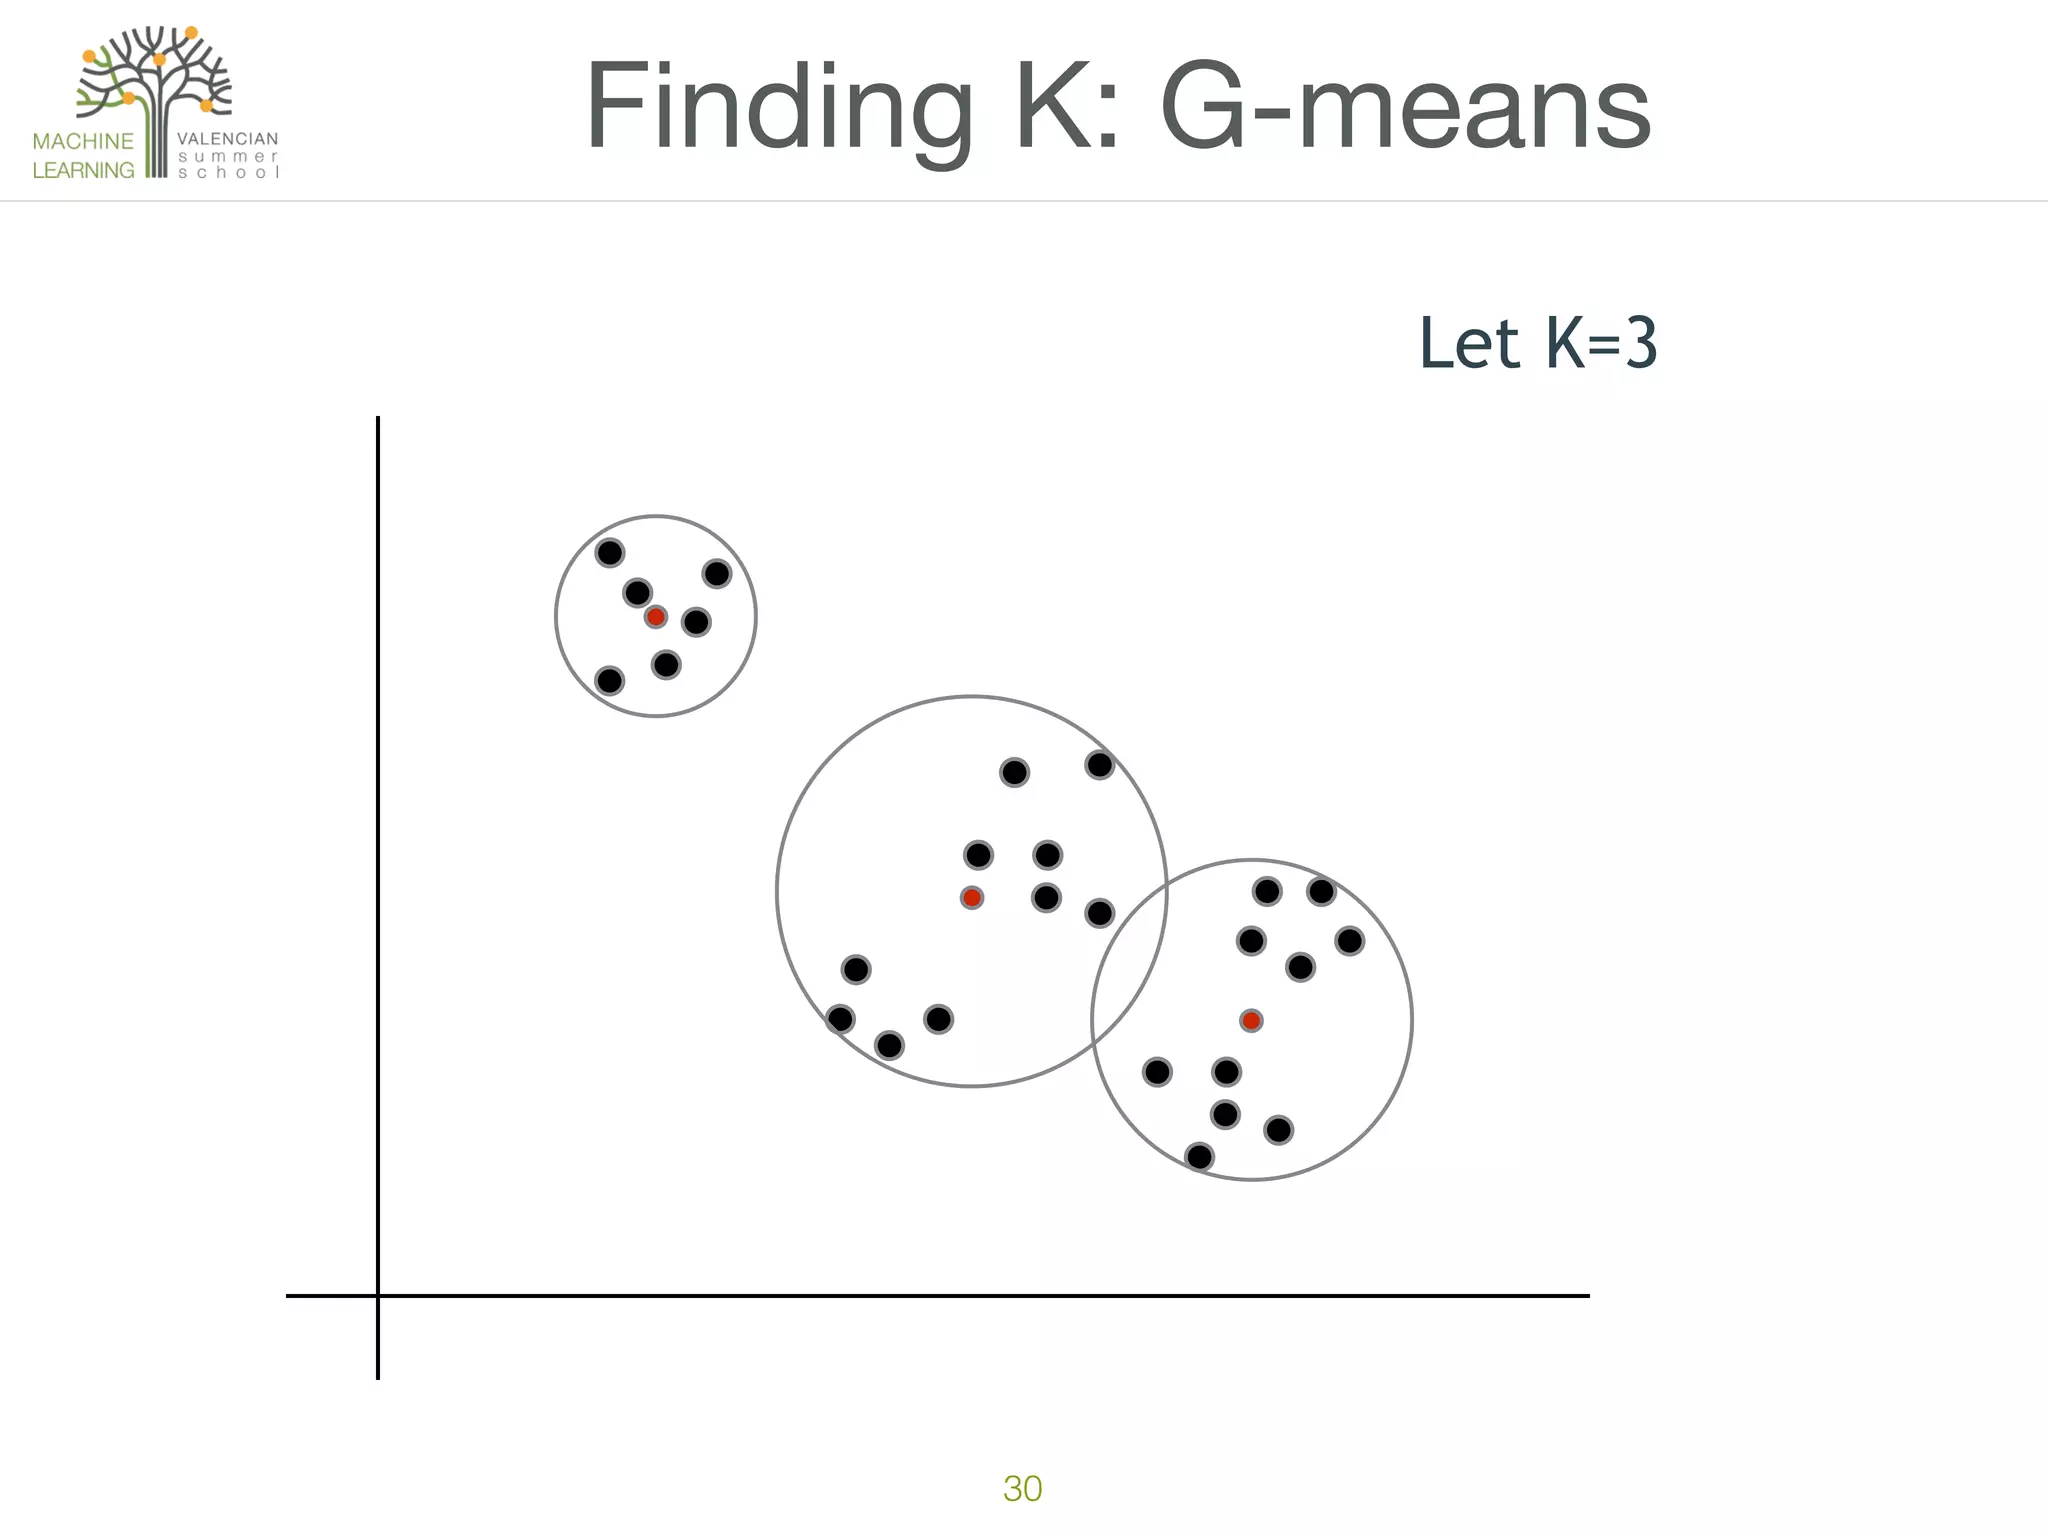
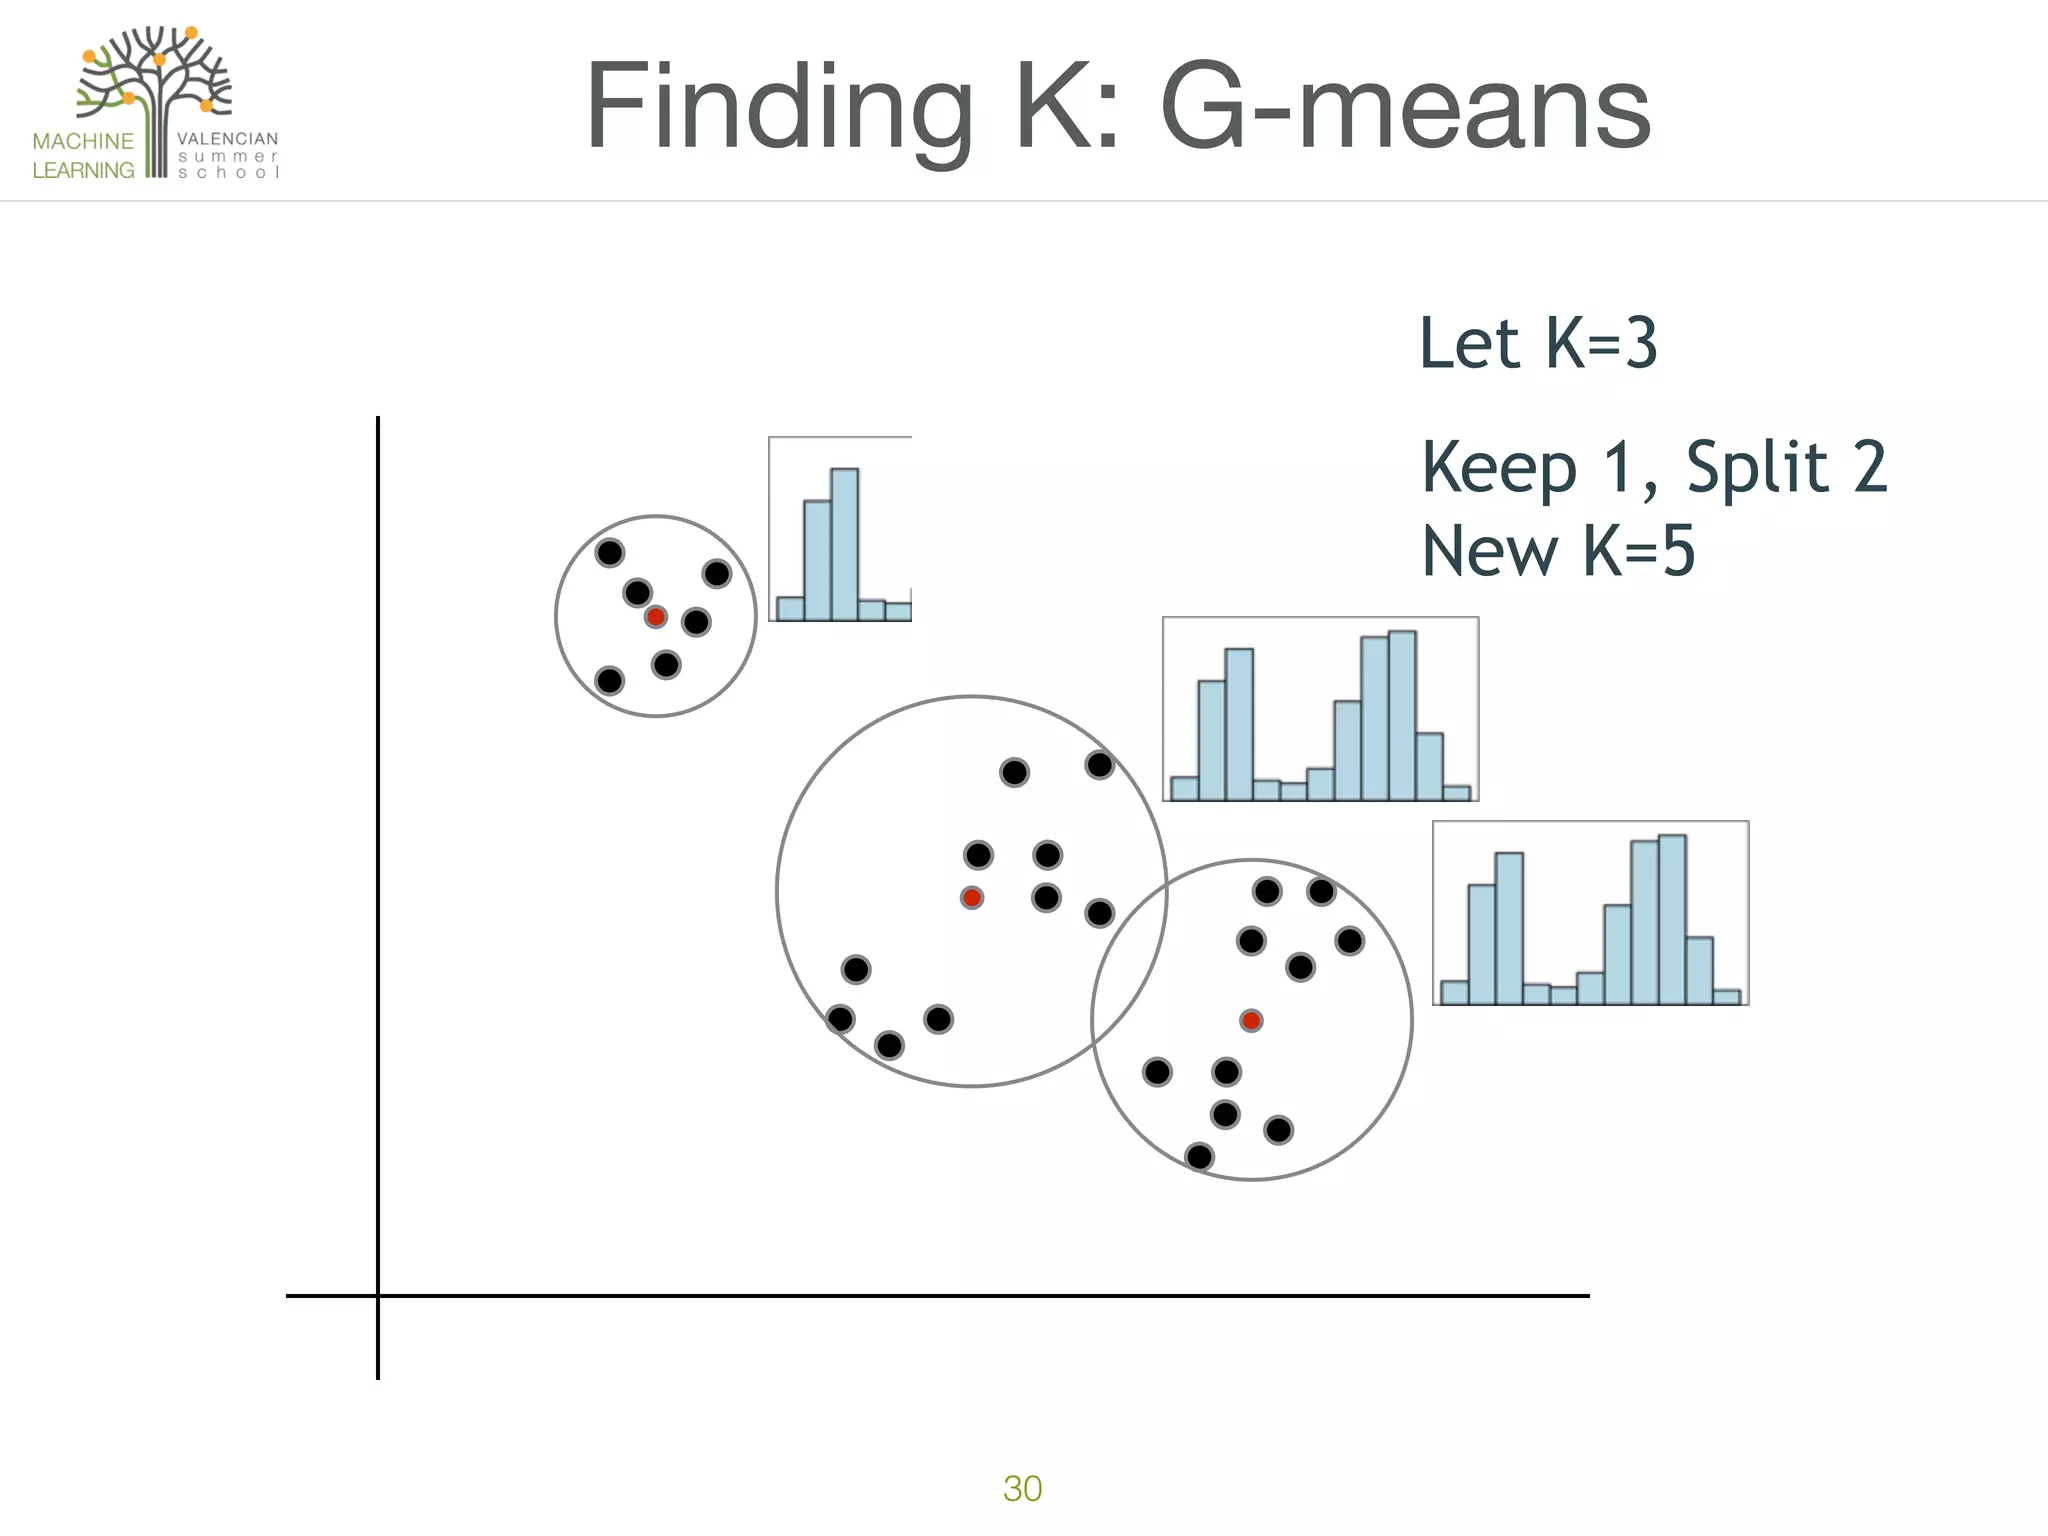
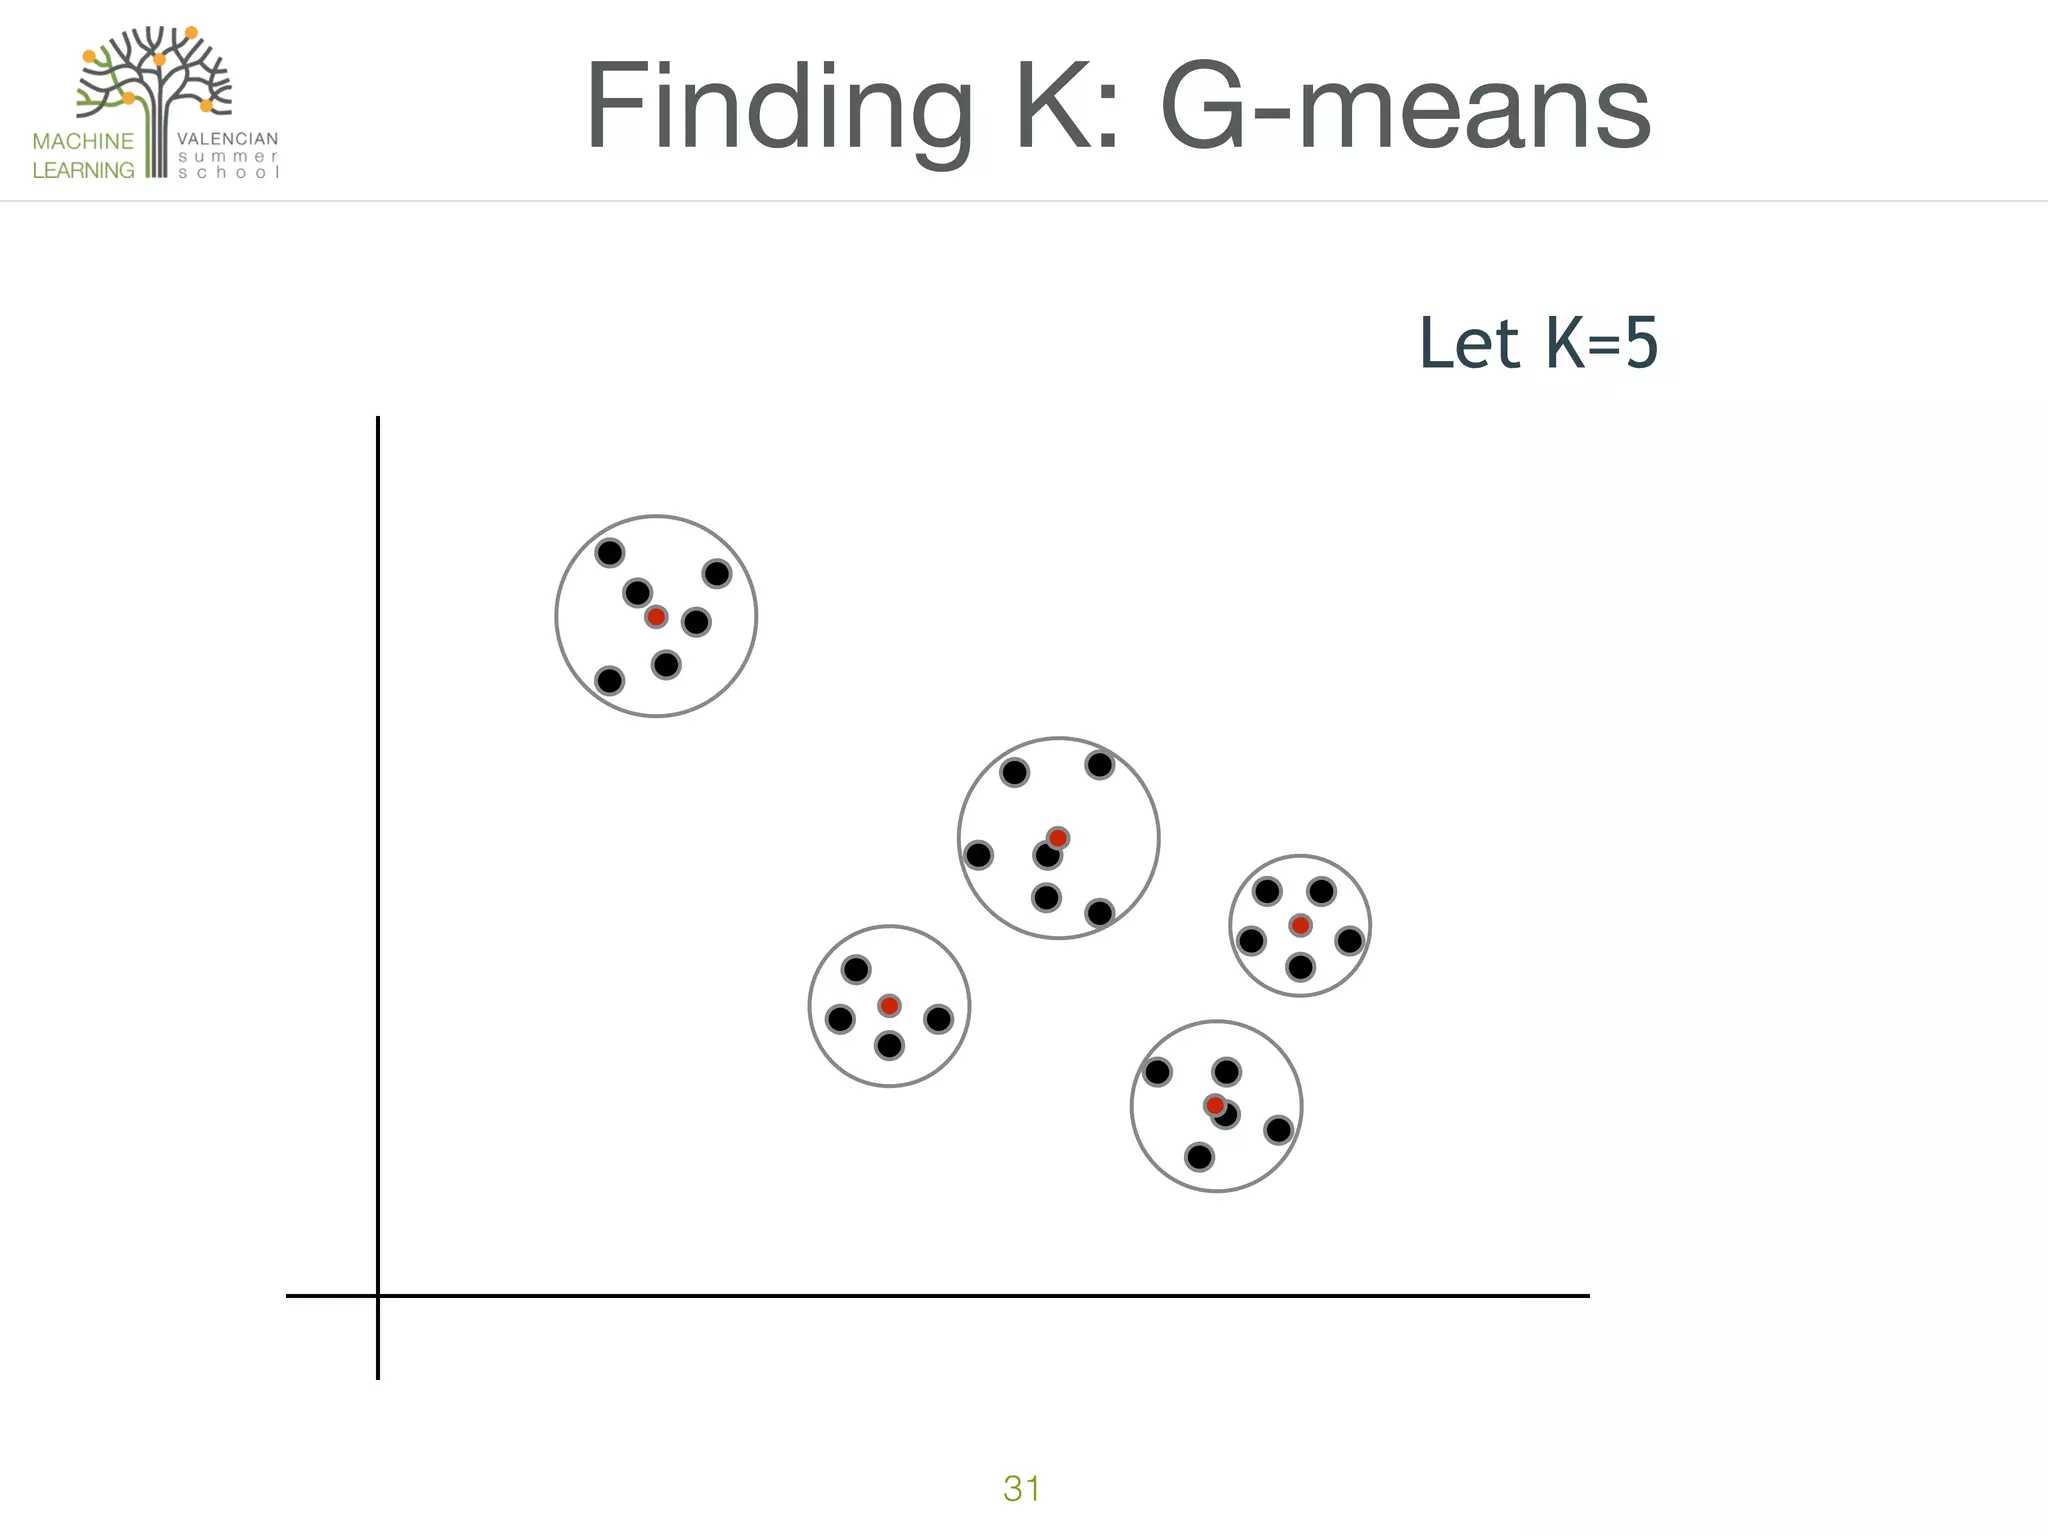
KEMBAR78
L13. Cluster Analysis | PDF
Cluster Analysis
Poul Petersen
BigML
2
Trees vs Clusters
Trees (Supervised Learning)
Provide: labeled data
Learning Task: be able to predict label
Clusters (Unsupervised Learning)
Provide: unlabeled data
Learning Task: group data by similarity
3
Trees vs Clusters
sepal
length
sepal
width
petal
length
petal
width
species
5.1 3.5 1.4 0.2 setosa
5.7 2.6 3.5 1.0 versicolor
6.7 2.5 5.8 1.8 virginica
… … … … …
sepal
length
sepal
width
petal
length
petal
width
5.1 3.5 1.4 0.2
5.7 2.6 3.5 1.0
6.7 2.5 5.8 1.8
… … … …
Learning Task:
Find function “f” such that:
f(X)≈Y
Learning Task:
Find “k” clusters such that
the data in each cluster is
self similar
Inputs “X”
Label 

“Y”
4
• Customer segmentation

• Item discovery

• Association

• Recommender

• Active learning
Use Cases
5
Customer Segmentation
GOAL: Cluster the users by usage statistics. Identify clusters
with a higher percentage of high LTV users. Since they have
similar usage patterns, the remaining users in these clusters
may be good candidates for upsell.
• Dataset of mobile game users.
• Data for each user consists of usage statistics
and a LTV based on in-game purchases
• Assumption: Usage correlates to LTV
5
0%
3%
7%
1%
6
Item Discovery
• Dataset of 86 whiskies
• Each whiskey scored on a scale from 0 to 4
for each of 12 possible flavor characteristics.
GOAL: Cluster the whiskies by flavor profile to discover
whiskies that have similar taste.
Smoky
Fruity
Body
7
Association
• Dataset of Lending Club Loans
• Mark any loan that is currently or has even
been late as “trouble”
GOAL: Cluster the loans by application profile to rank loan
quality by percentage of trouble loans in population
0%
3%
7%
1%
8
Active Learning
GOAL: Rather than sample randomly, use clustering to group
patients by similarity and then test a sample from each
cluster to label the data.
• Dataset of diagnostic measurements of 768
patients.
• Want to test each patient for diabetes and
label the dataset to build a model but the
test is expensive*
*For a more realistic example of high cost, imagine a dataset with a billion
transactions, each one needing to be labelled as fraud/not-fraud. Or a million images
which need to be labeled as cat/not-cat.
2323
9
Human Example
K=3
10
Human Example
“Round”
“Skinny”
“Corners”
11
Human Example
• Human used prior knowledge to select possible
features that separated the objects.
• “round”, “skinny”, “edges”, “hard”, etc
• Items were then separated based on the chosen
features
• Separation quality was then tested to ensure:
• met criteria of K=3
• groups were sufficiently “distant”
• no crossover
12
Learning from Humans
• Length/Width
• greater than 1 => “skinny”
• equal to 1 => “round”
• less than 1 => invert
• Number of Surfaces
• distinct surfaces require “edges” which have corners
• easier to count
Create features that capture these object differences
13
Feature Engineering
Object Length / Width Num Surfaces
penny 1 3
dime 1 3
knob 1 4
eraser 2.75 6
box 1 6
block 1.6 6
screw 8 3
battery 5 3
key 4.25 3
bead 1 2
14
Now we can Plot
K=3
Num

Surfaces
Length / Width
box block eraser
knob
penny

dime
bead
key battery screw
K-Means Key Insight:

We can find clusters using distances

in n-dimensional feature space
15
Now we can Plot
Num

Surfaces
Length / Width
box block eraser
knob
penny

dime
bead
key battery screw
K-Means

Find “best” (minimum distance)

circles that include all points
16
K-Means Algorithm
K=3
16
K-Means Algorithm
K=3
16
K-Means Algorithm
K=3
16
K-Means Algorithm
K=3
17
K-Means Algorithm
K=3
17
K-Means Algorithm
K=3
18
Features Matter!
Metal Other
Wood
19
Convergence
19
Convergence
19
Convergence
Convergence guaranteed

but not necessarily unique

Starting points important (K++)
20
Starting Points
• Random points or instances in n-dimensional space

• Chose points “farthest” away from each other

• but this is sensitive to outliers 

• k++

• the first center is chosen randomly from instance

• each subsequent center is chosen from the remaining
instances with probability proportional to its squared
distance from the point's closest existing cluster center
21
Scaling
price
number of bedrooms
d = 160,000
d = 1
22
Other Tricks
• What is the distance to a “missing value”?

• What is the distance between categorical values?

• What is the distance between text features?

• Does it have to be Euclidean distance?

• Unknown “K”?
23
Distance to Missing Value?
• Nonsense! Try replacing missing values with:

• Maximum

• Mean

• Median

• Minimum

• Zero

• Ignore instances with missing values
24
Distance to Categorical?
• Special distance function

• if valA == valB then

distance = 0 (or scaling value) 

else 

distance = 1

• Assign centroid the most common category of
the member instances

• Compute Euclidean distance as normal
One approach: similar to “k-prototypes”
25
Distance to Categorical?
feature_1 feature_2 feature_3
instance_1 red cat ball
instance_2 red cat ball
instance_3 red cat box
instance_4 blue dog fridge
D = 0
D = 1
D = sqrt(3)
26
Only Euclidean?
1
MahalanobisCosine Similarity
0
-1
27
Finding K: G-means
28
Finding K: G-means
28
Finding K: G-means
29
Finding K: G-means
Let K=2
29
Finding K: G-means
Let K=2
29
Finding K: G-means
Let K=2
Keep 1, Split 1
New K=3
30
Finding K: G-means
Let K=3
30
Finding K: G-means
Let K=3
30
Finding K: G-means
Let K=3
Keep 1, Split 2
New K=5
31
Finding K: G-means
Let K=5
31
Finding K: G-means
Let K=5
31
Finding K: G-means
Let K=5
K=5

L13. Cluster Analysis