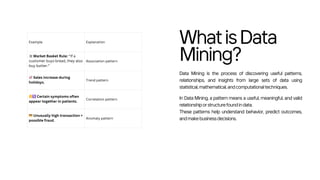
Example Explanation
🛒Market BasketRule: “If a
customer buys bread, they also
buy butter.”
Association pattern
📈Sales increase during
holidays.
Trend pattern
👩⚕️Certain symptoms often
appear together in patients.
Correlation pattern
💳Unusually high transaction =
possible fraud.
Anomaly pattern
WhatisData
Mining?
Data Mining is the process of discovering useful patterns,
relationships, and insights from large sets of data using
statistical,mathematical,andcomputationaltechniques.
In Data Mining, a pattern means a useful, meaningful, and valid
relationshiporstructurefoundindata.
These patterns help understand behavior, predict outcomes,
andmakebusinessdecisions.
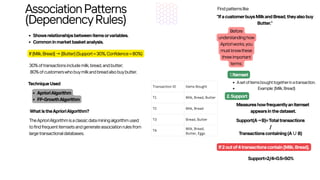
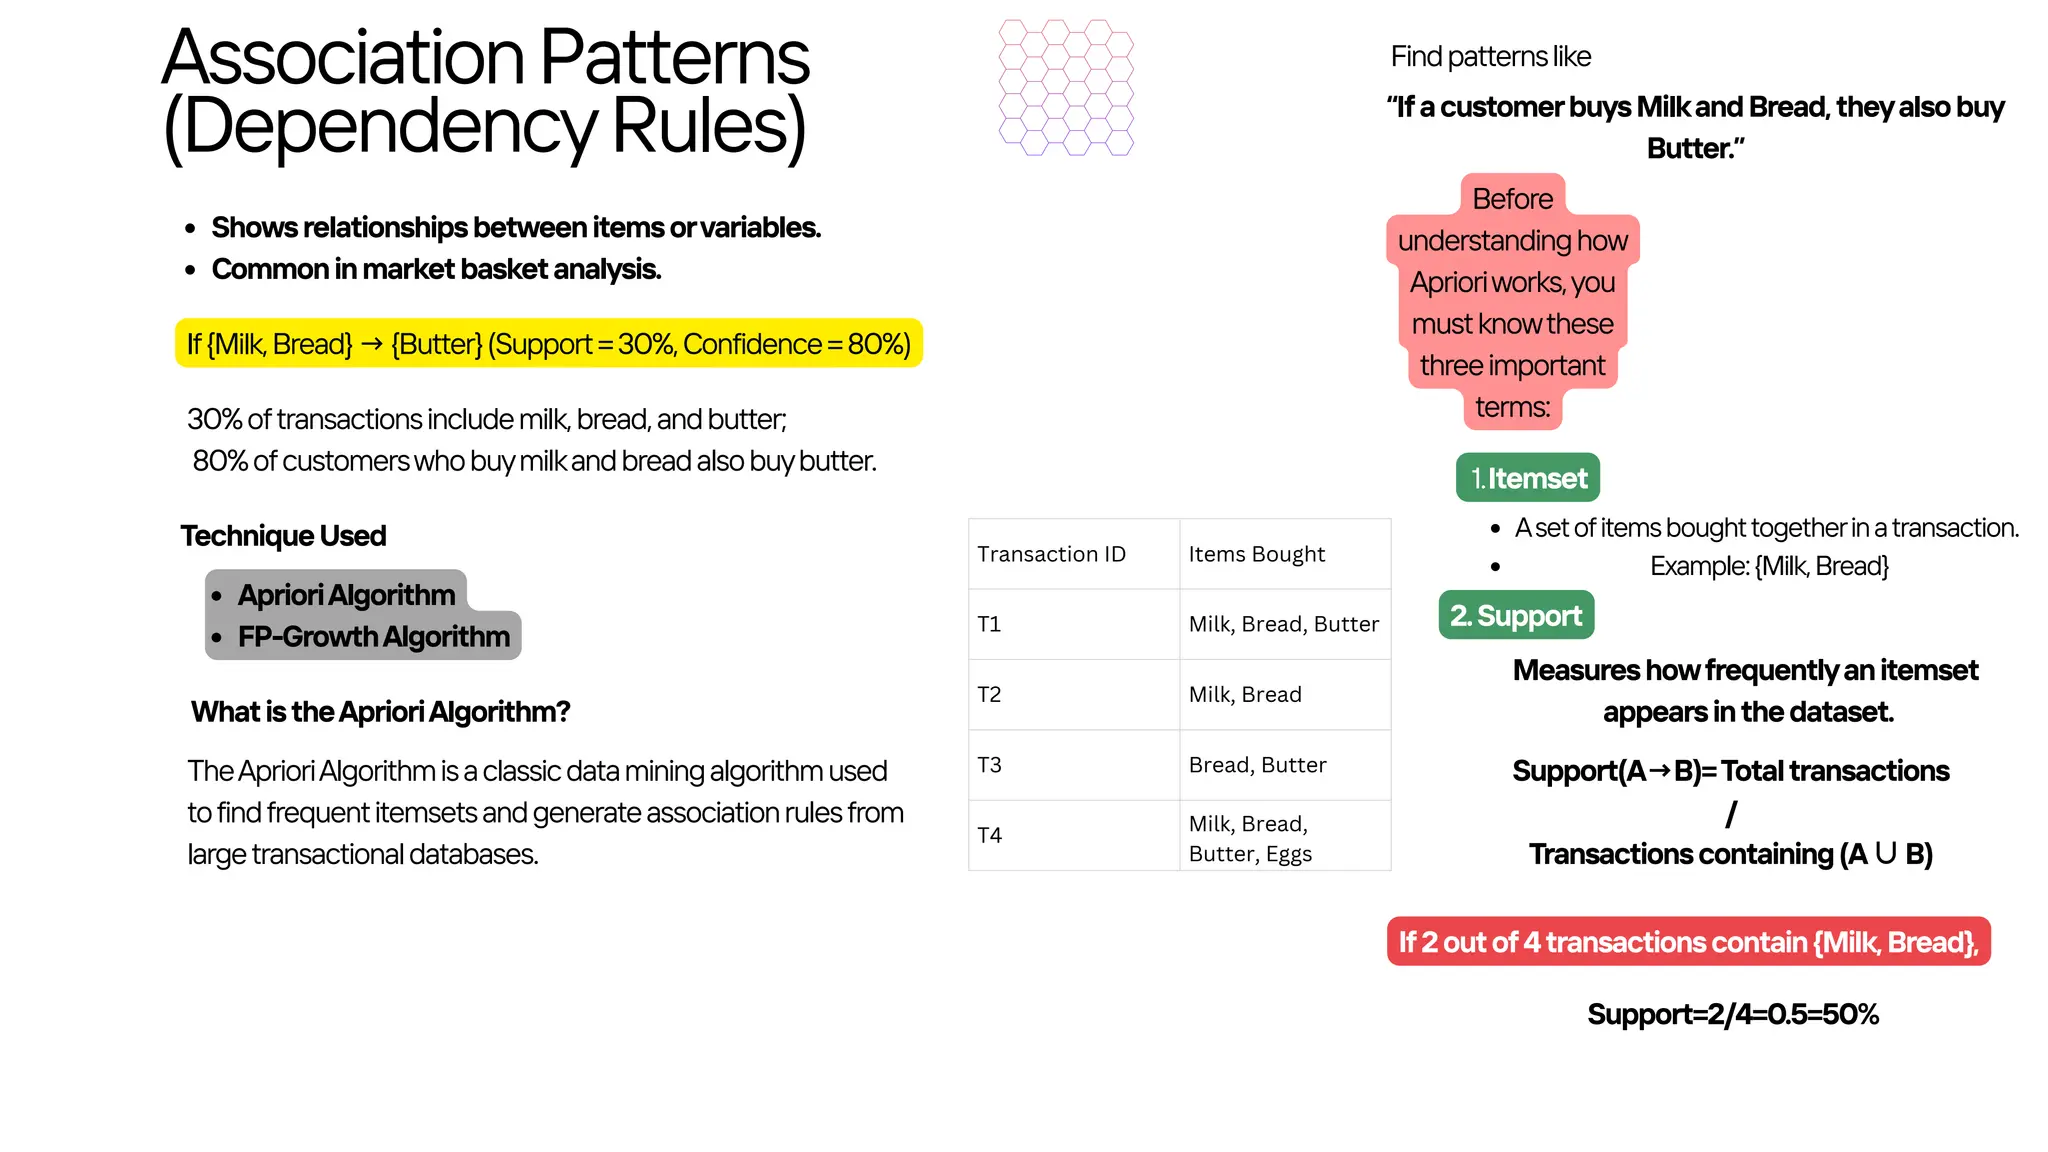
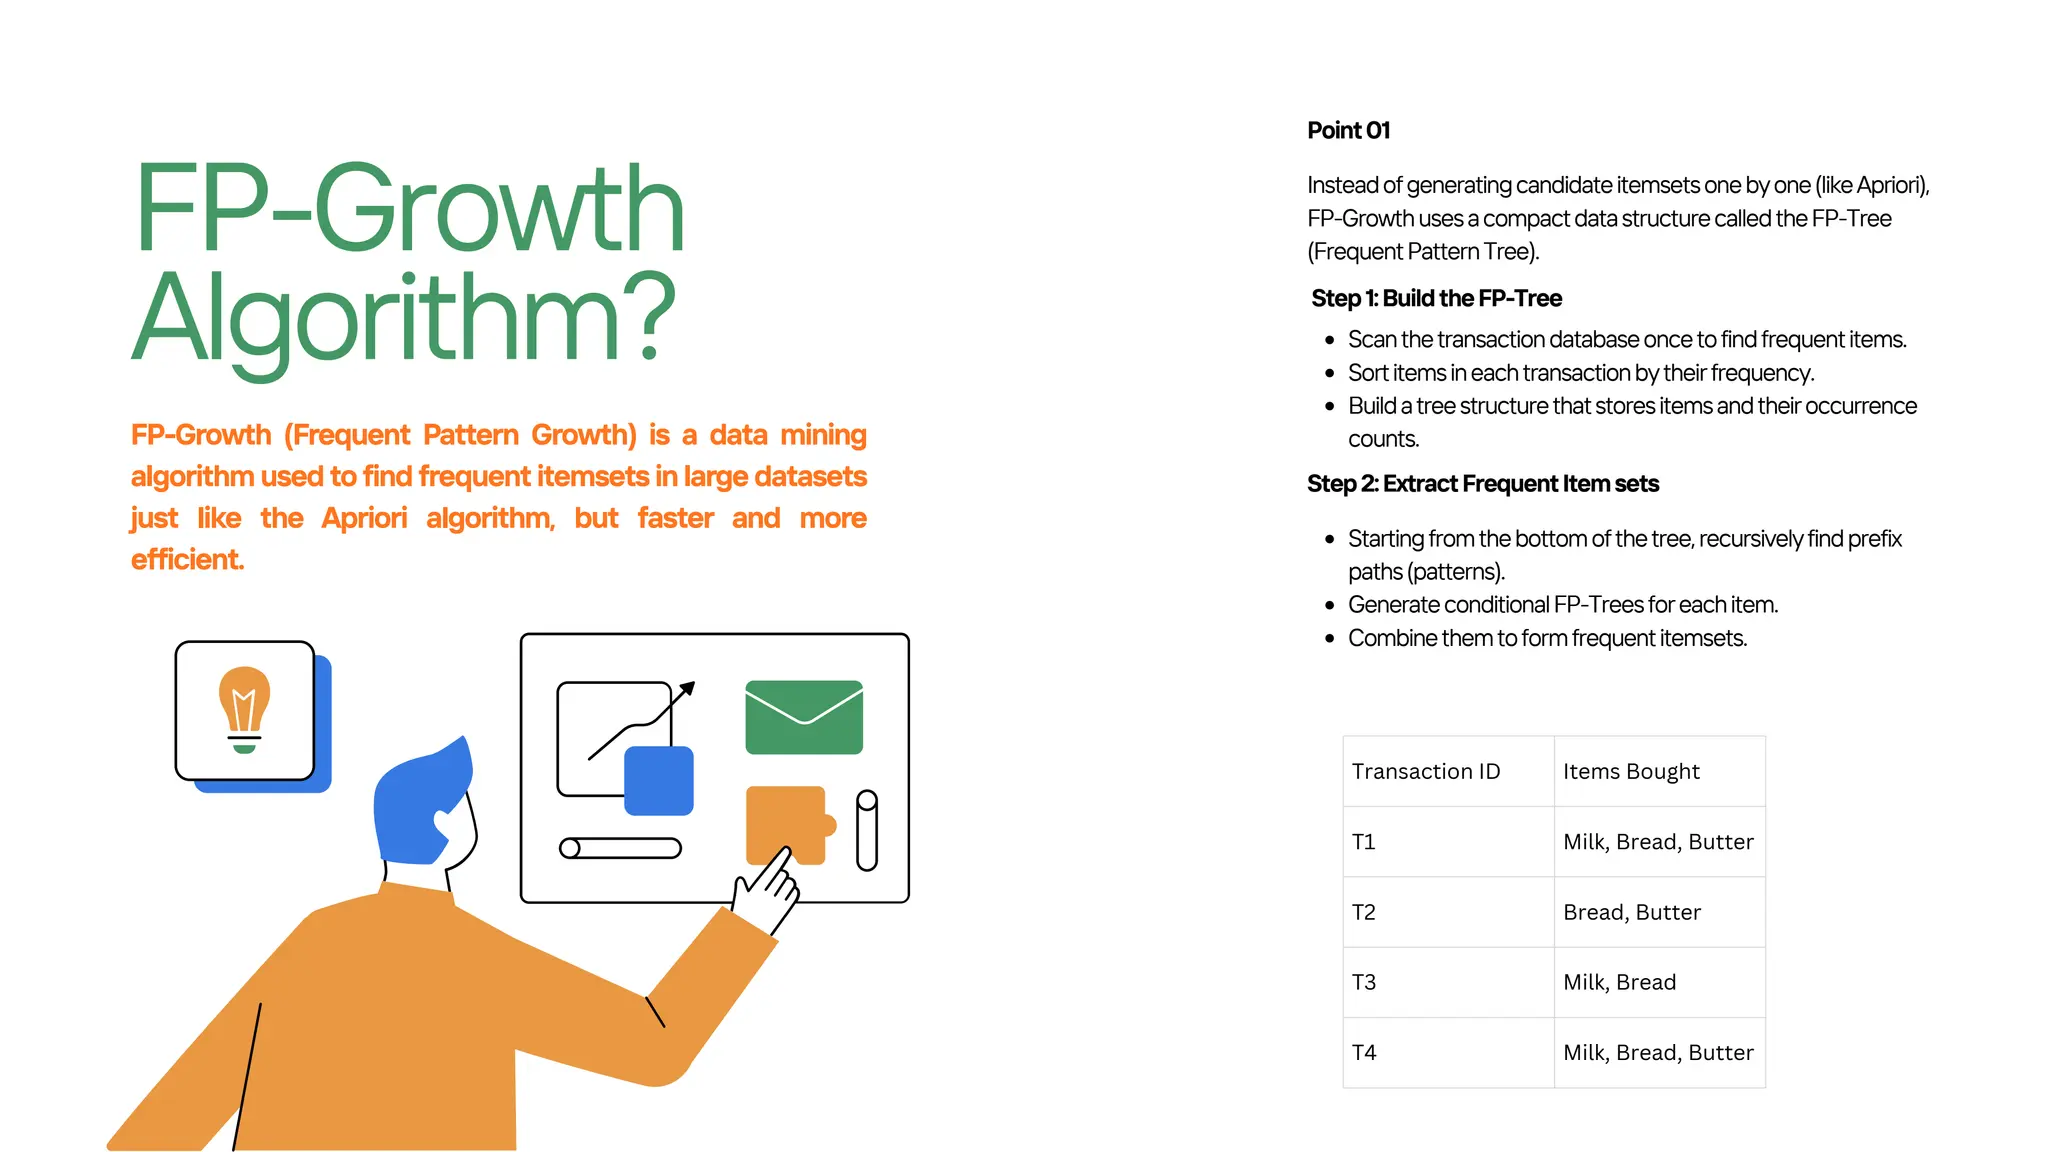
Transaction ID ItemsBought
T1 Milk, Bread, Butter
T2 Bread, Butter
T3 Milk, Bread
T4 Milk, Bread, Butter
FP-Growth
Algorithm?
Insteadofgeneratingcandidateitemsetsonebyone(likeApriori),
FP-GrowthusesacompactdatastructurecalledtheFP-Tree
(FrequentPatternTree).
Point01
Scanthetransactiondatabaseoncetofindfrequentitems.
Sortitemsineachtransactionbytheirfrequency.
Buildatreestructurethatstoresitemsandtheiroccurrence
counts.
Step1:BuildtheFP-Tree
FP-Growth (Frequent Pattern Growth) is a data mining
algorithm used to find frequent itemsets in large datasets
just like the Apriori algorithm, but faster and more
efficient.
Step2:ExtractFrequentItemsets
Startingfromthebottomofthetree,recursivelyfindprefix
paths(patterns).
GenerateconditionalFP-Treesforeachitem.
Combinethemtoformfrequentitemsets.
10.
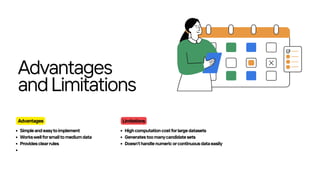
Limitation Description
🧩Complex TreeStructure
Can be hard to
understand and
🧮Memory Usage
May grow large for
sparse data (many
🧠Not Easy for Dynamic
Data
Tree must be
rebuilt if data
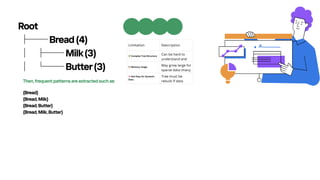
Root
├──Bread(4)
│ ├──Milk(3)
│ └──Butter(3)
Then,frequentpatternsareextractedsuchas:
{Bread}
{Bread,Milk}
{Bread,Butter}
{Bread,Milk,Butter}


![Matrix and determinant URT [Autosaved].pptx](https://cdn.slidesharecdn.com/ss_thumbnails/matrixanddeterminanturtautosaved-251018190340-9e6a6deb-thumbnail.jpg?width=600ounds&width=560&fit=bounds)


![RTP_AR_Basic_Learners' Workbook_KS2 [FOR REPRODUCTION] (1).pdf](https://cdn.slidesharecdn.com/ss_thumbnails/rtparbasiclearnersworkbookks2forreproduction1-251016024943-e51a16ac-thumbnail.jpg?width=600ounds&width=560&fit=bounds)


