Download as PDF, PPTX


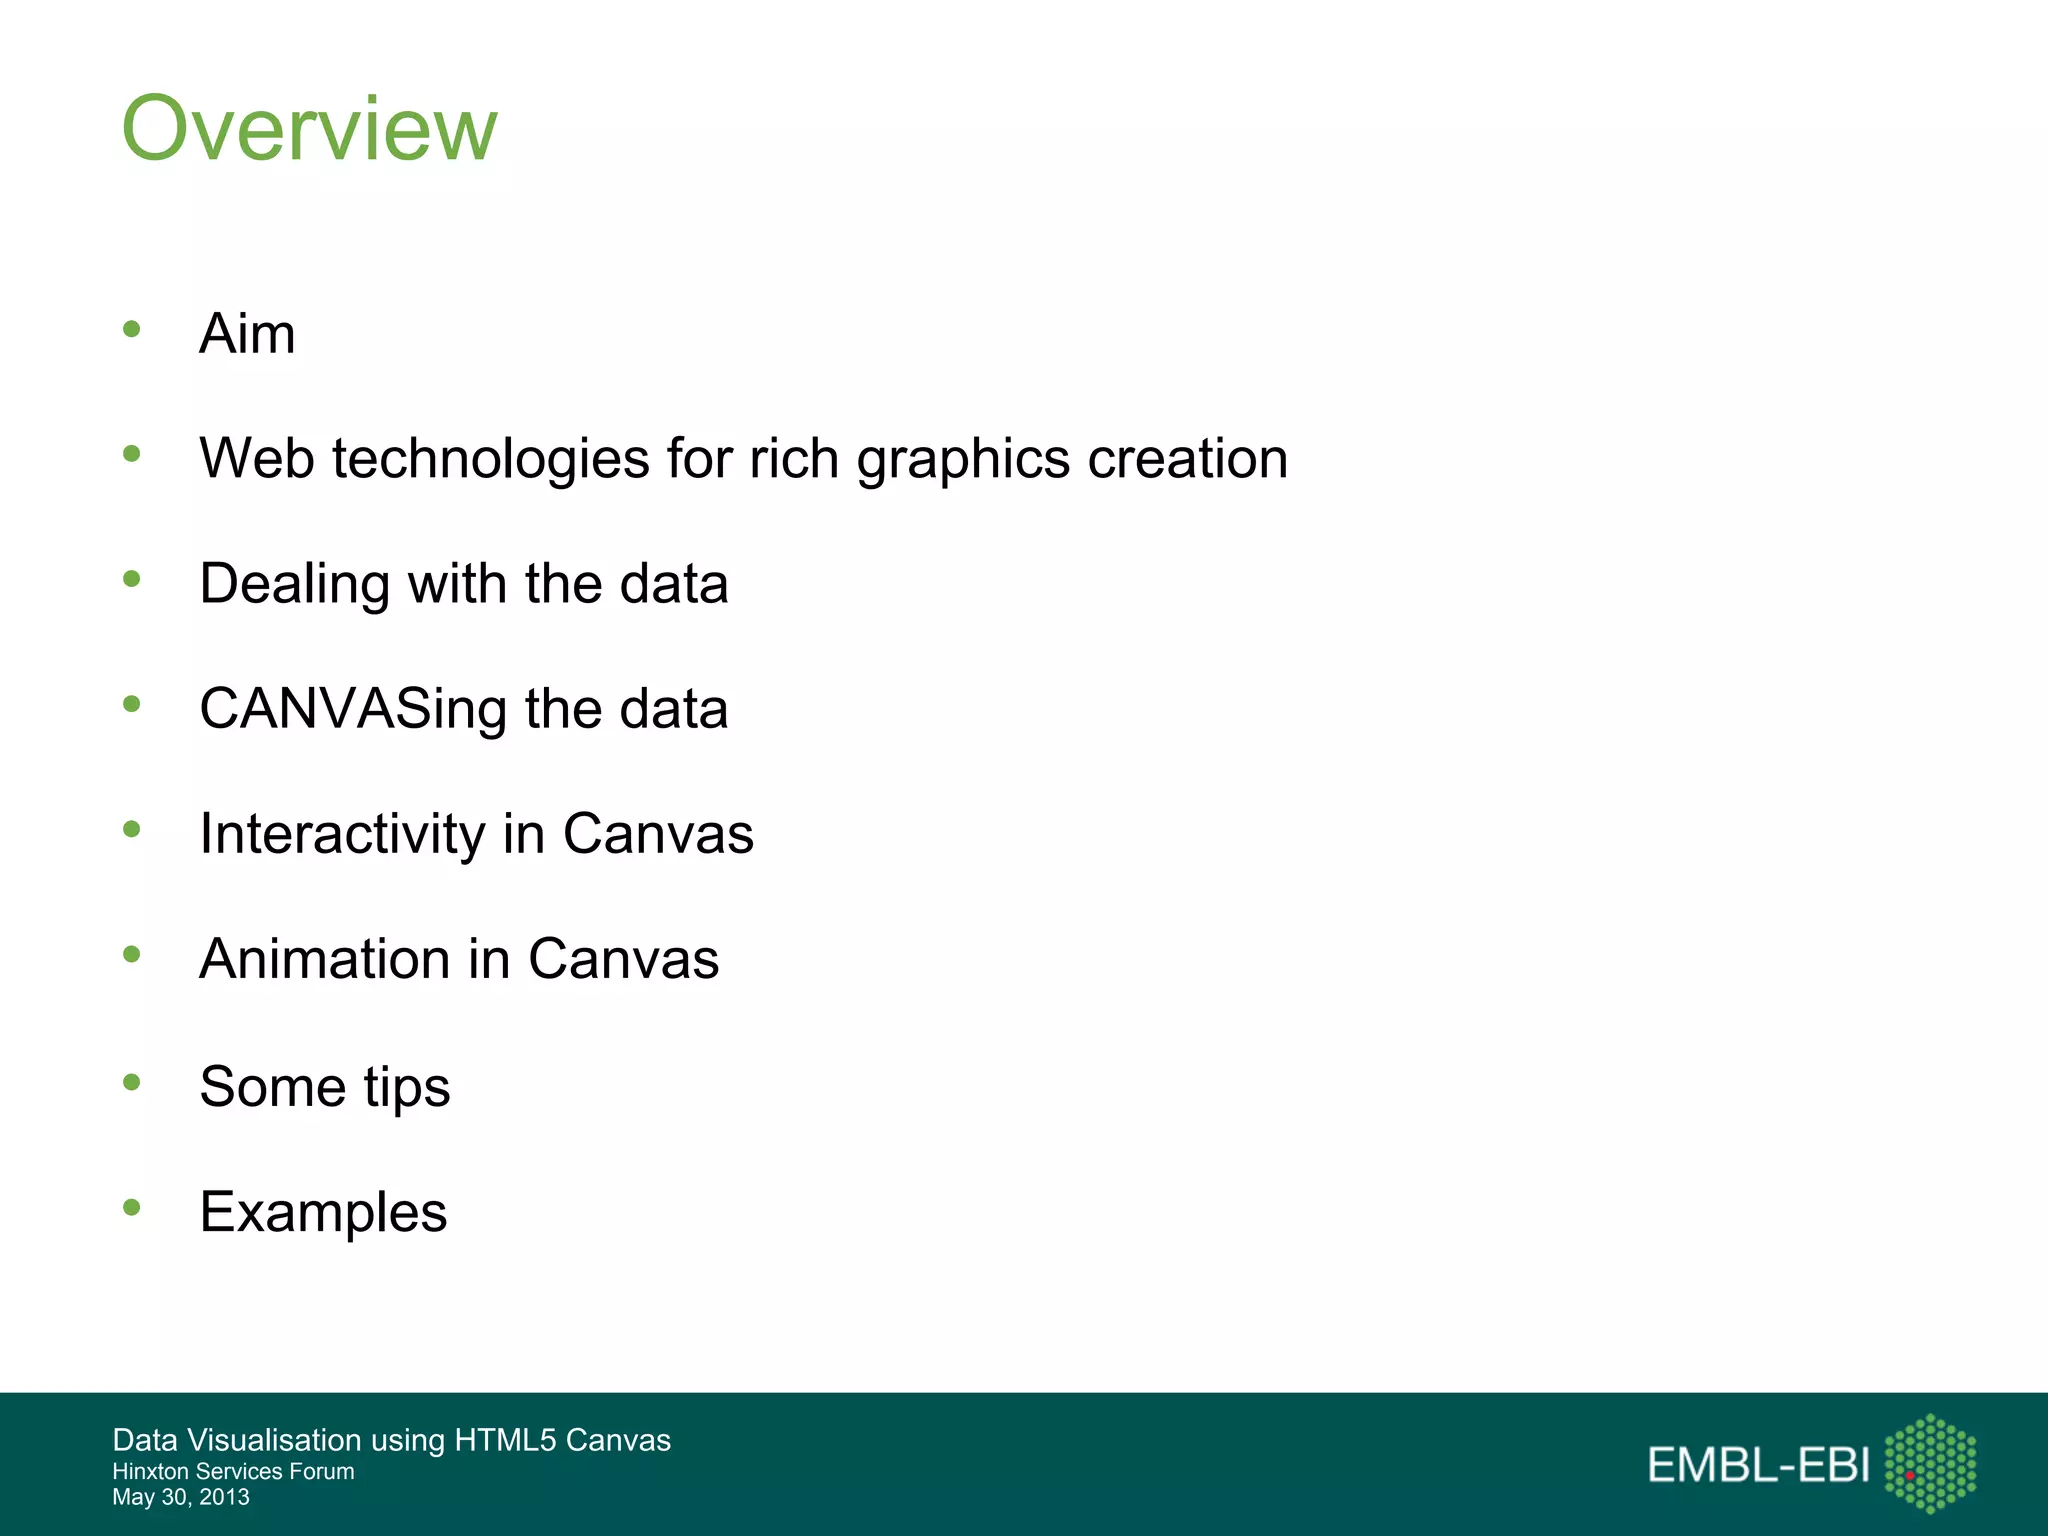

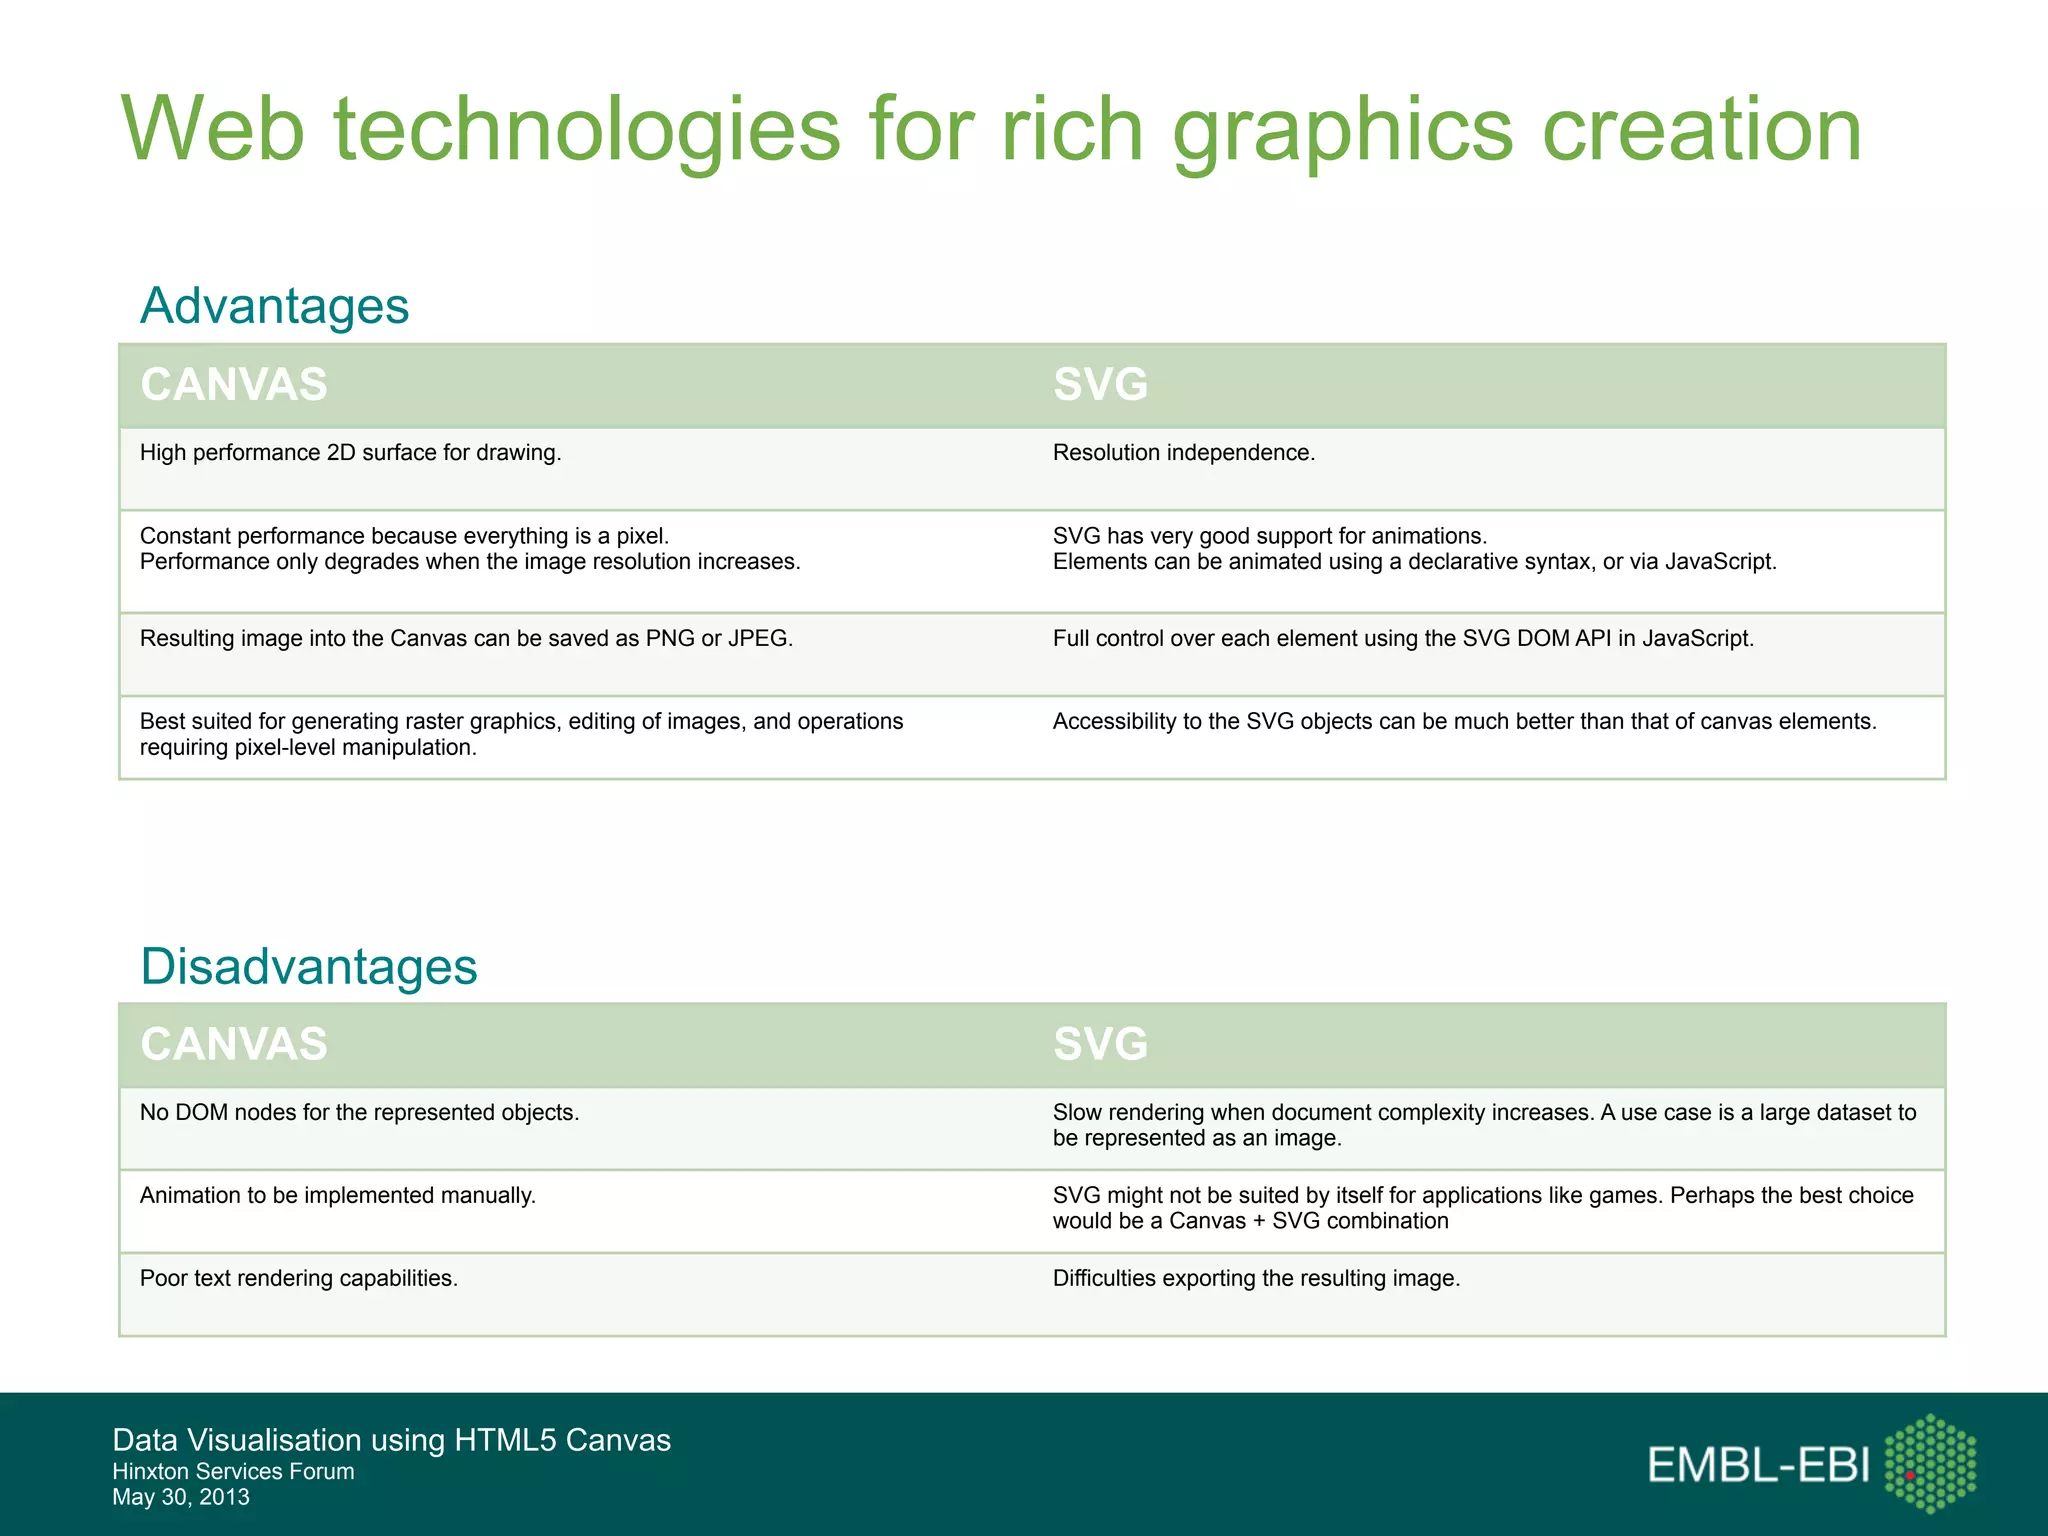
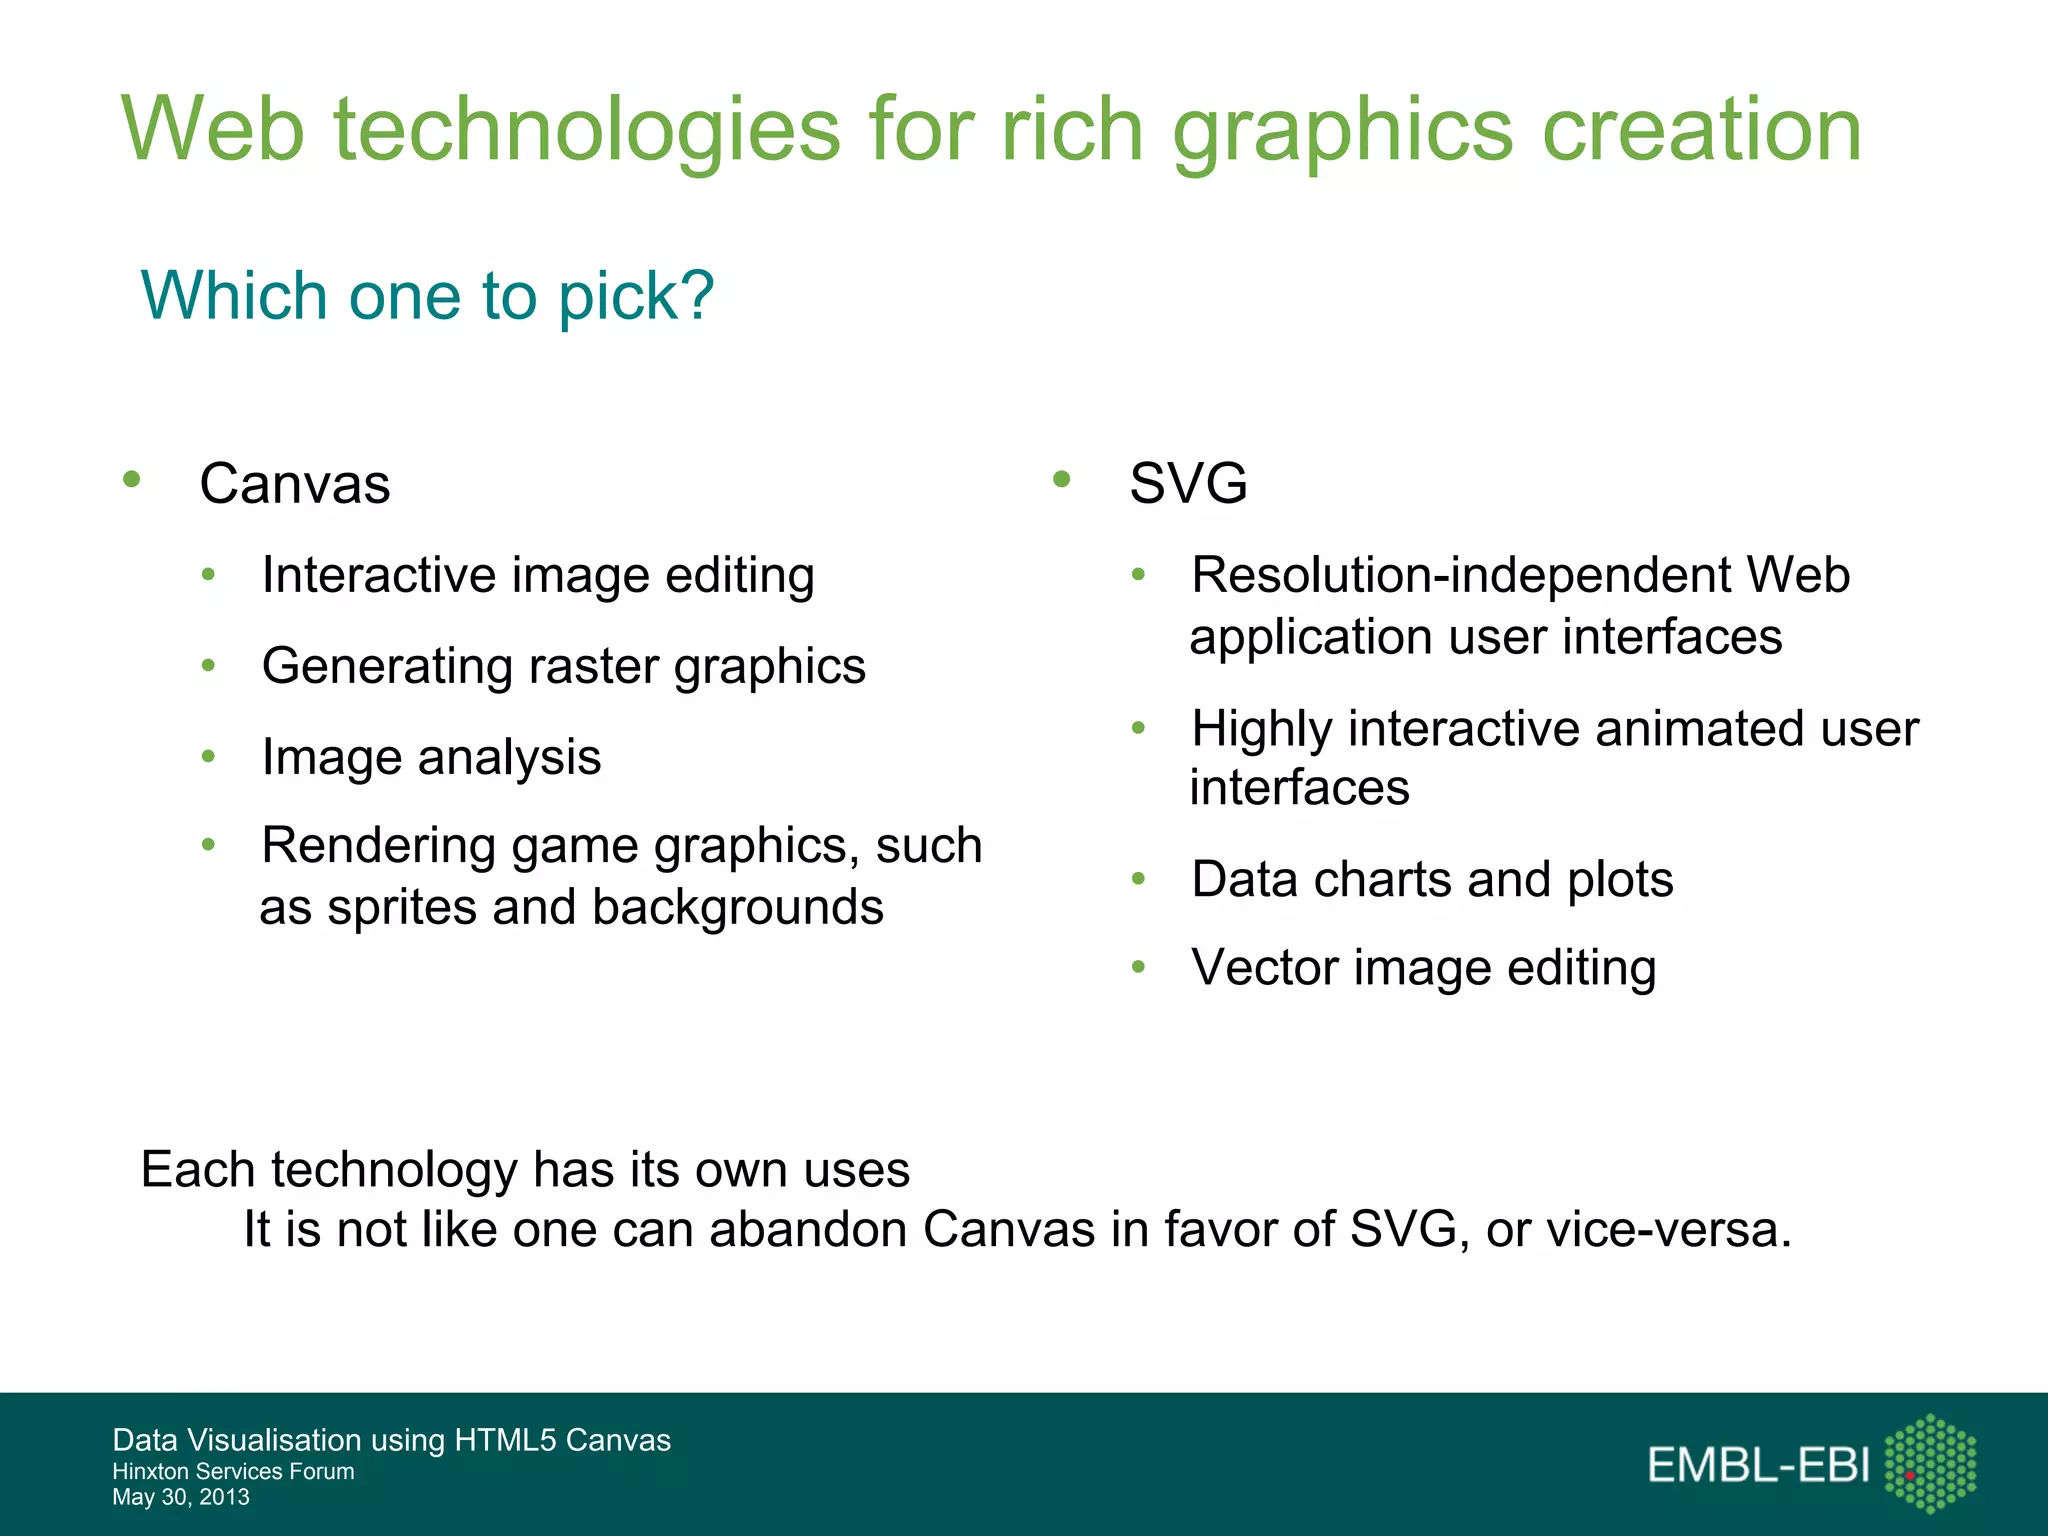
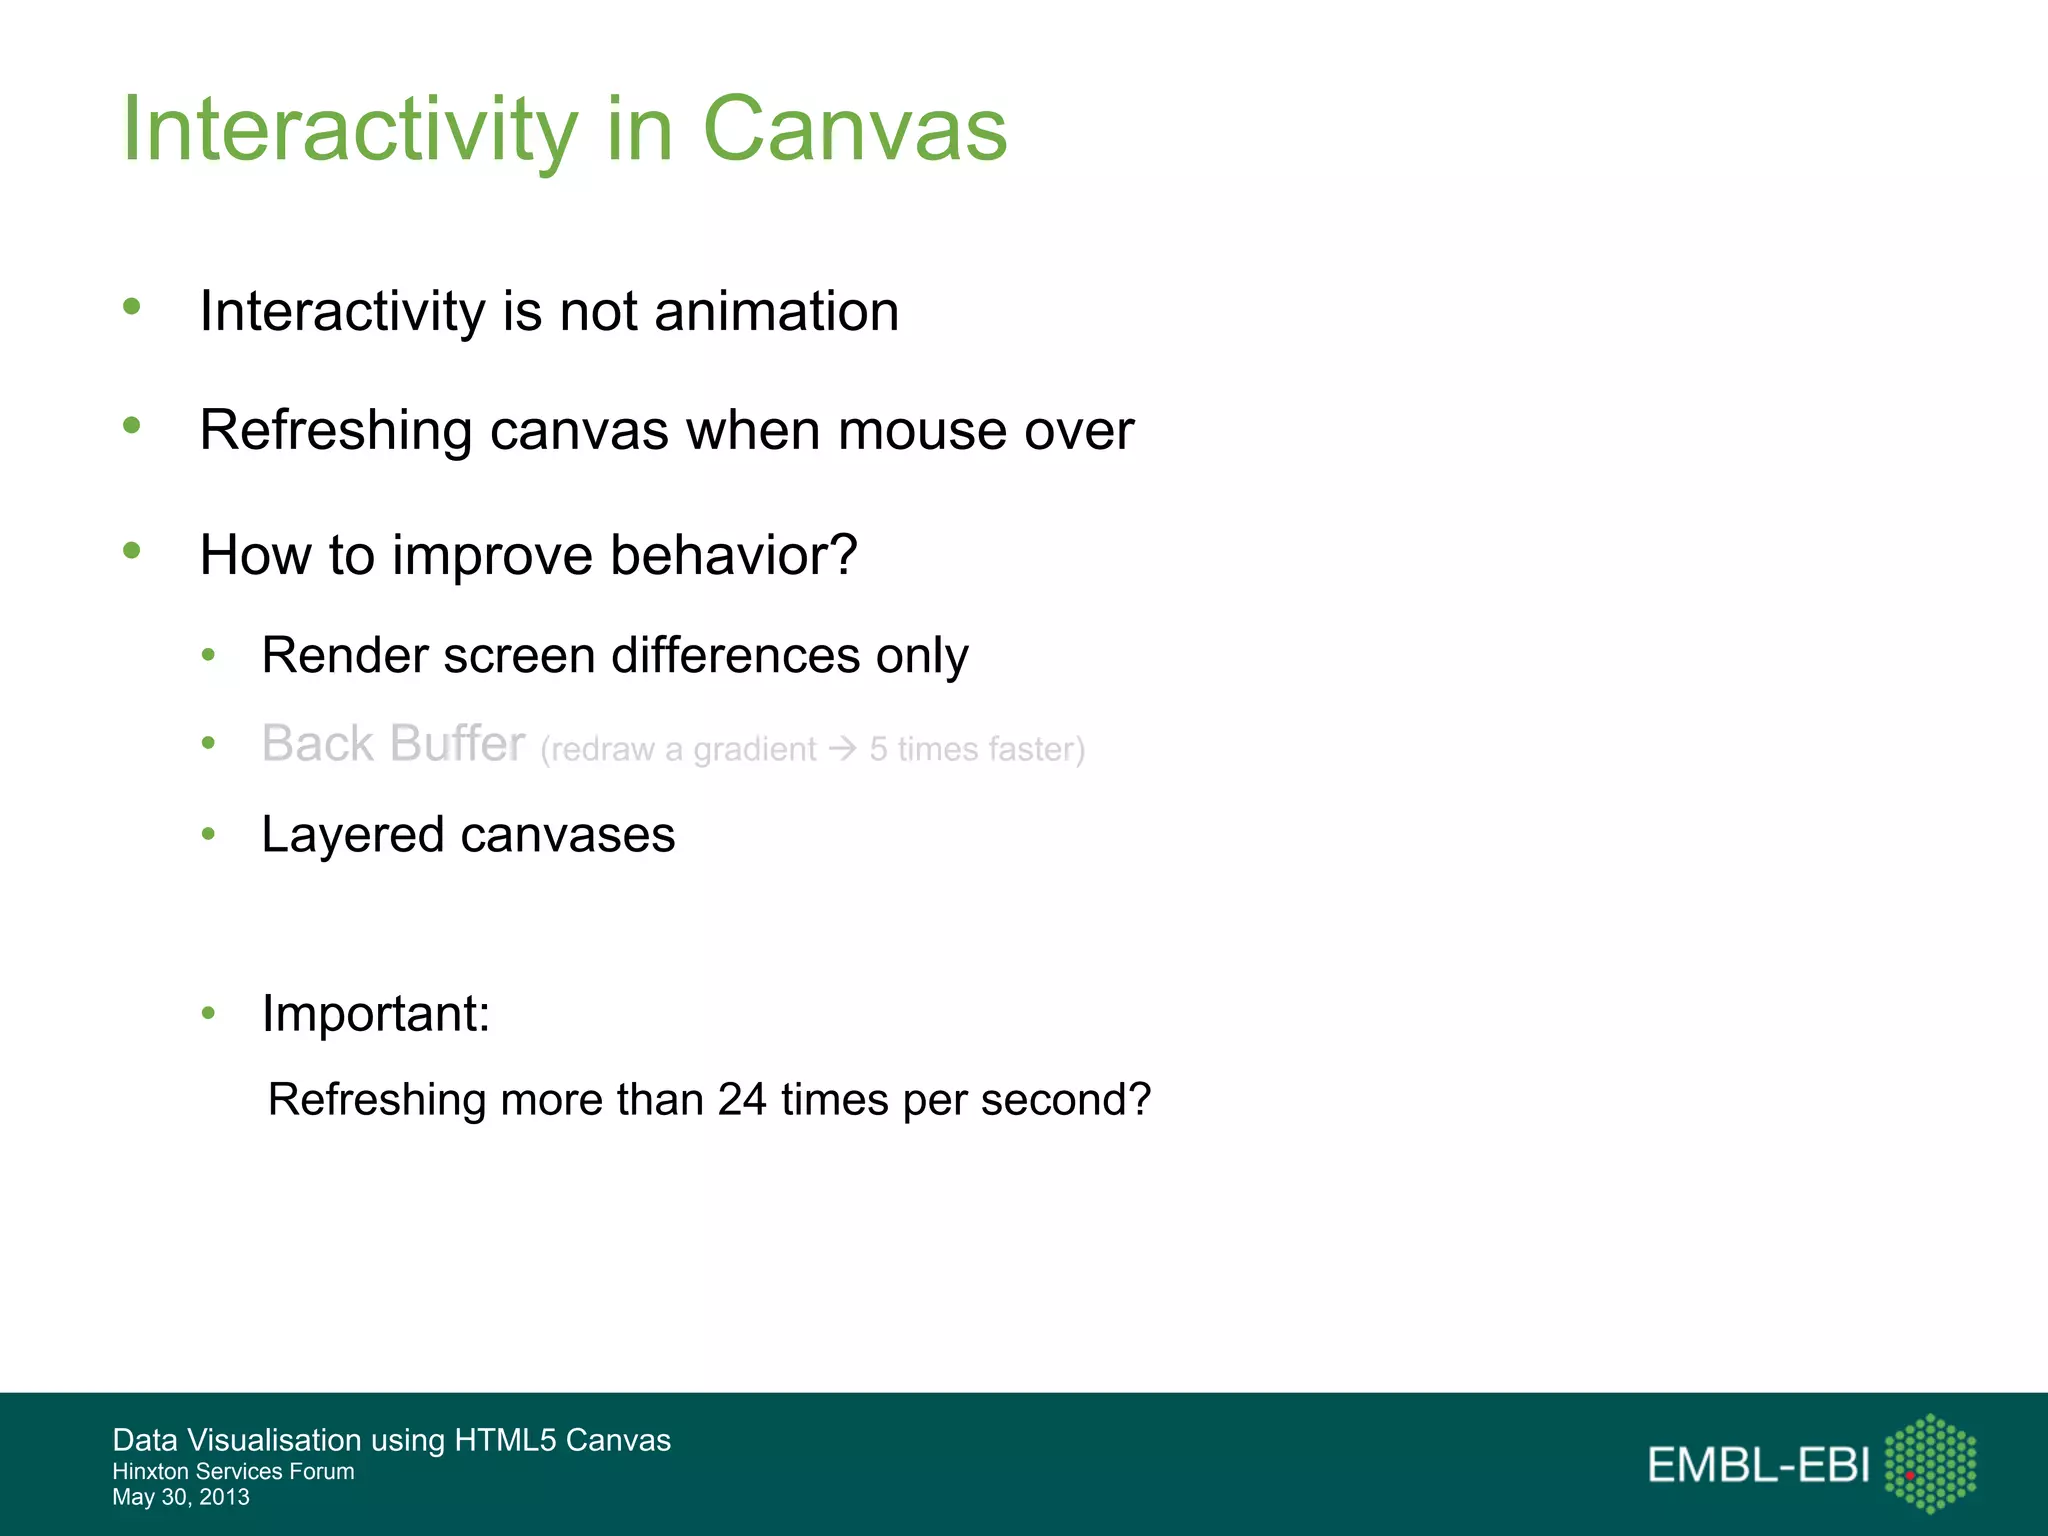

The document discusses using HTML5 Canvas for data visualization. It covers using Canvas and SVG for rich graphics, dealing with data by acquiring it from web services and separating the data model from the visual representation. It also discusses canvasing the data by drawing model objects, calculating positions, and handling mouse interactions. Additional topics include animation techniques, optimization tips like precalculating values, and examples of data visualization tools using Canvas.


