Download as PDF, PPTX


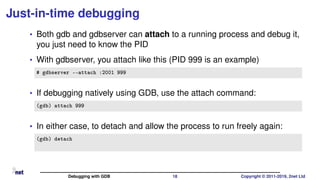
![Breakpoints
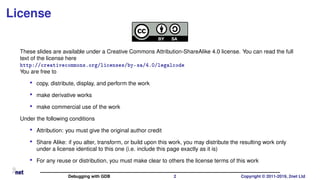
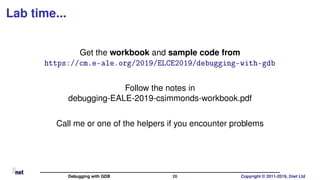
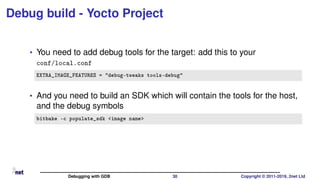
Add a breakpoint
break [line|function], example
(gdb) break main
Breakpoint 1 at 0x400535: file helloworld.c, line 7.
List breakpoints
info break:
(gdb) info break
Num Type Disp Enb Address What
1 breakpoint keep y 0x00400535 in main at helloworld.c:7
Delete a breakpoint
delete break:
(gdb) delete break 1
Debugging with GDB 11 Copyright © 2011-2019, 2net Ltd](https://image.slidesharecdn.com/debugging-eale-2019-csimmonds-200726171732/85/Debugging-embedded-devices-using-GDB-11-320.jpg)

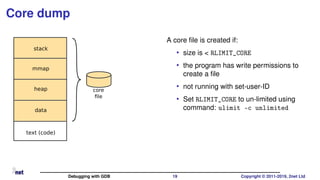
![GDB command files
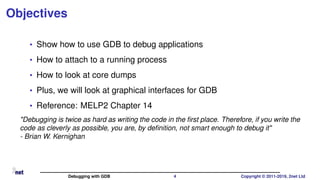
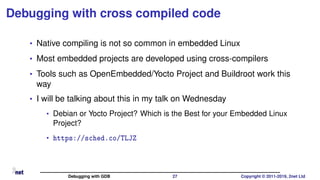
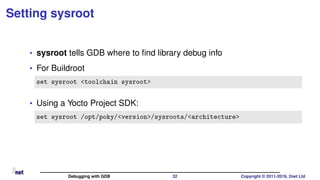
• At start-up GDB reads commands from
• $HOME/.gdbinit
• .gdbinit in current directory
• Files named by gdb command line option -x [file name]
• Note: auto-load safe-path
• Recent versions of GDB ignore .gdbinit unless you enable it in
$HOME/.gdbinit
add-auto-load-safe-path /home/myname/myproject/.gdbinit
Debugging with GDB 16 Copyright © 2011-2019, 2net Ltd](https://image.slidesharecdn.com/debugging-eale-2019-csimmonds-200726171732/85/Debugging-embedded-devices-using-GDB-16-320.jpg)
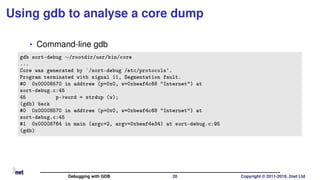


![Breakpoints
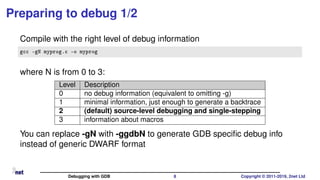
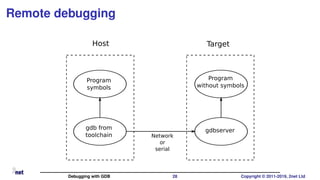
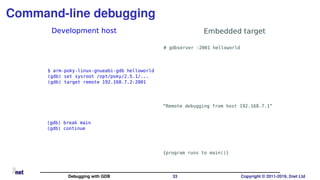
Add a breakpoint
break [line|function], example
(gdb) break main
Breakpoint 1 at 0x400535: file helloworld.c, line 7.
List breakpoints
info break:
(gdb) info break
Num Type Disp Enb Address What
1 breakpoint keep y 0x00400535 in main at helloworld.c:7
Delete a breakpoint
delete break:
(gdb) delete break 1
Debugging with GDB 11 Copyright © 2011-2019, 2net Ltd](https://image.slidesharecdn.com/debugging-eale-2019-csimmonds-200726171732/75/Debugging-embedded-devices-using-GDB-11-2048.jpg)
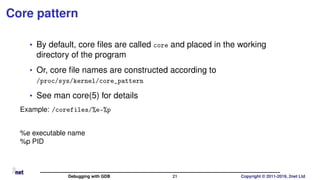
![GDB command files
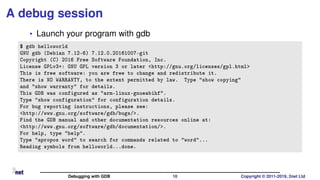
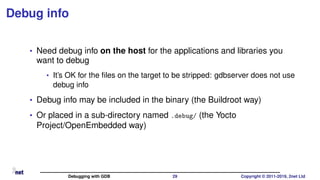
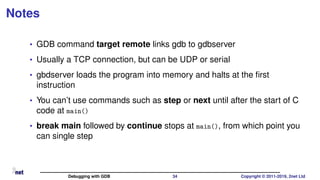
• At start-up GDB reads commands from
• $HOME/.gdbinit
• .gdbinit in current directory
• Files named by gdb command line option -x [file name]
• Note: auto-load safe-path
• Recent versions of GDB ignore .gdbinit unless you enable it in
$HOME/.gdbinit
add-auto-load-safe-path /home/myname/myproject/.gdbinit
Debugging with GDB 16 Copyright © 2011-2019, 2net Ltd](https://image.slidesharecdn.com/debugging-eale-2019-csimmonds-200726171732/75/Debugging-embedded-devices-using-GDB-16-2048.jpg)

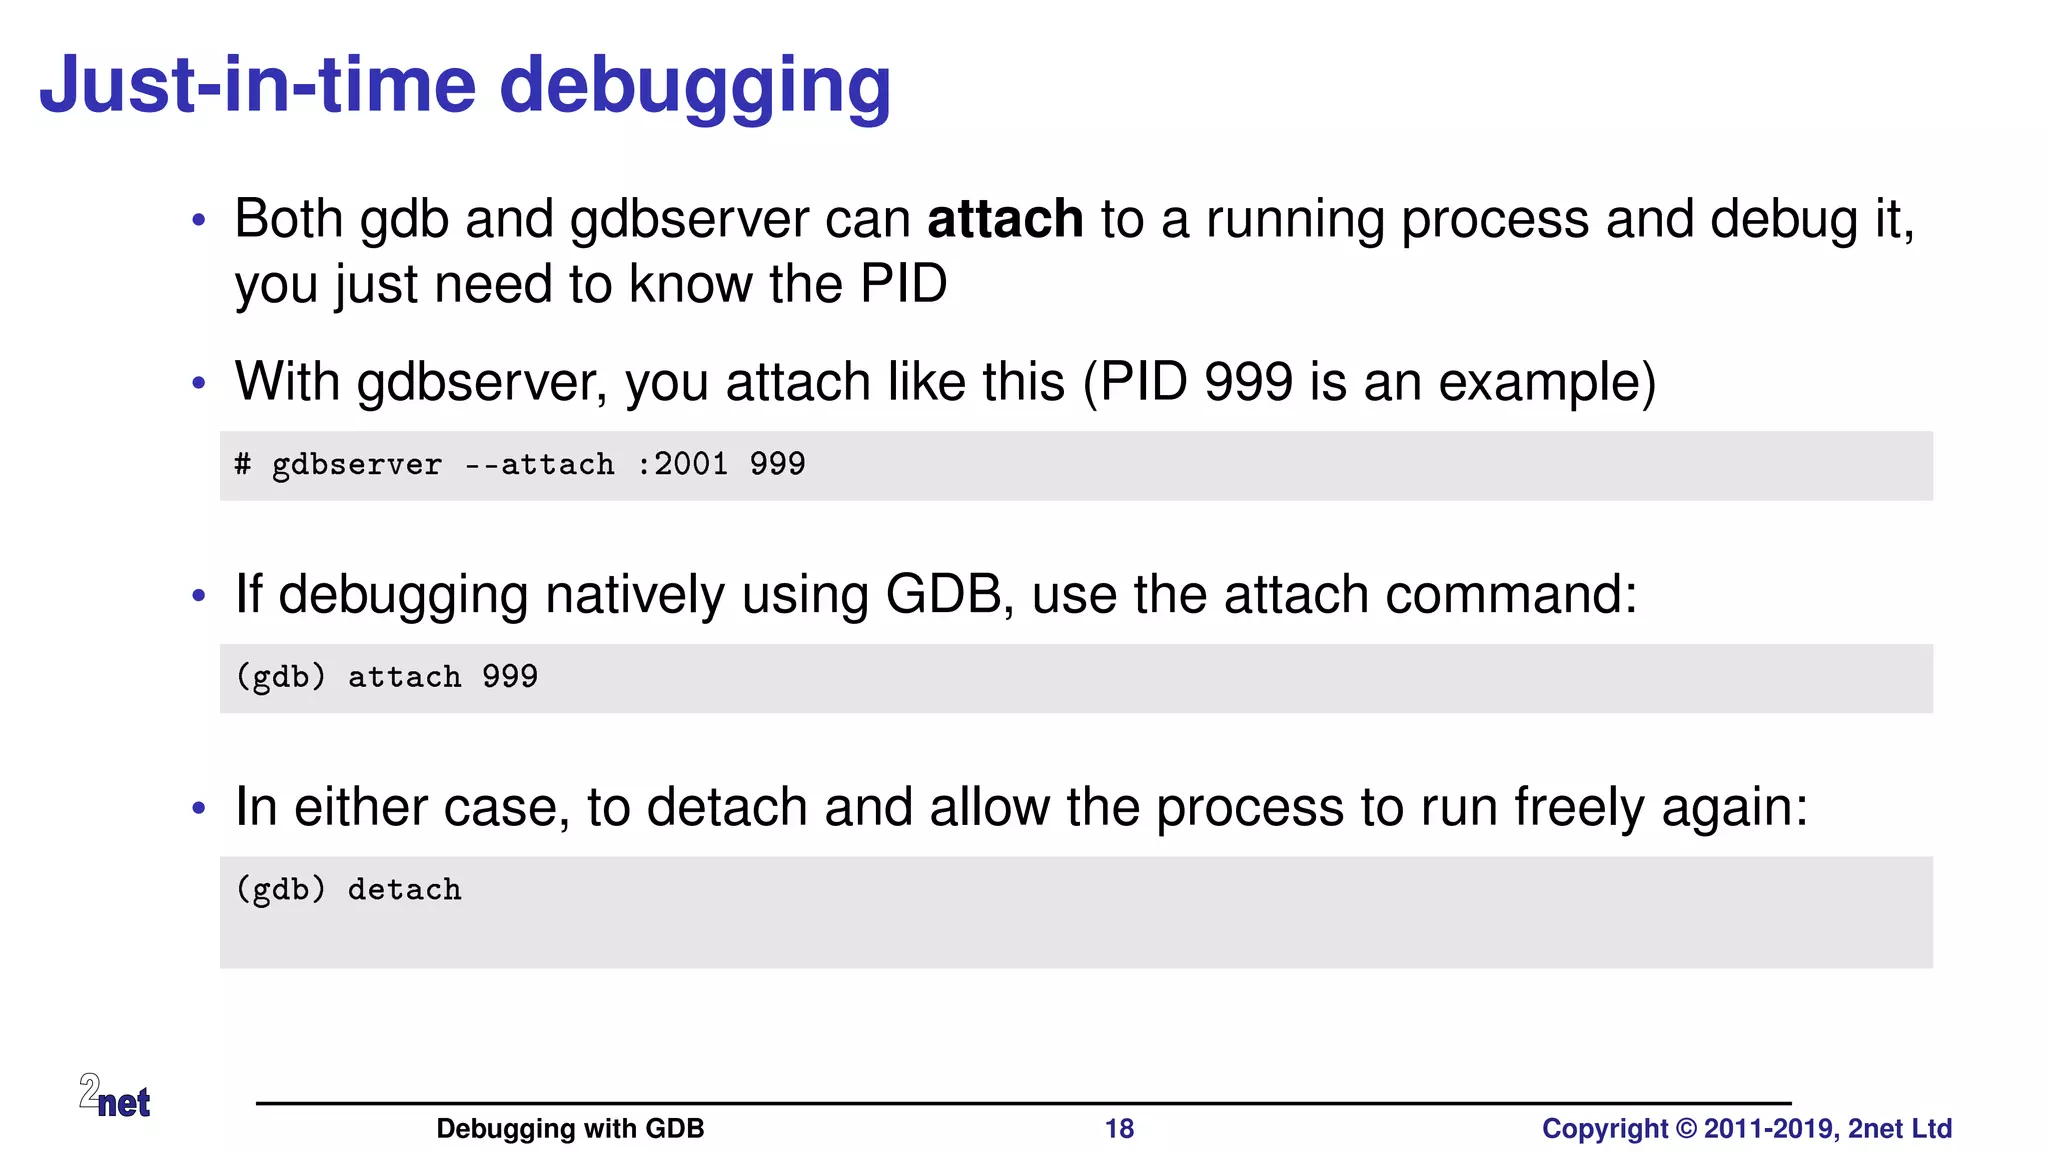
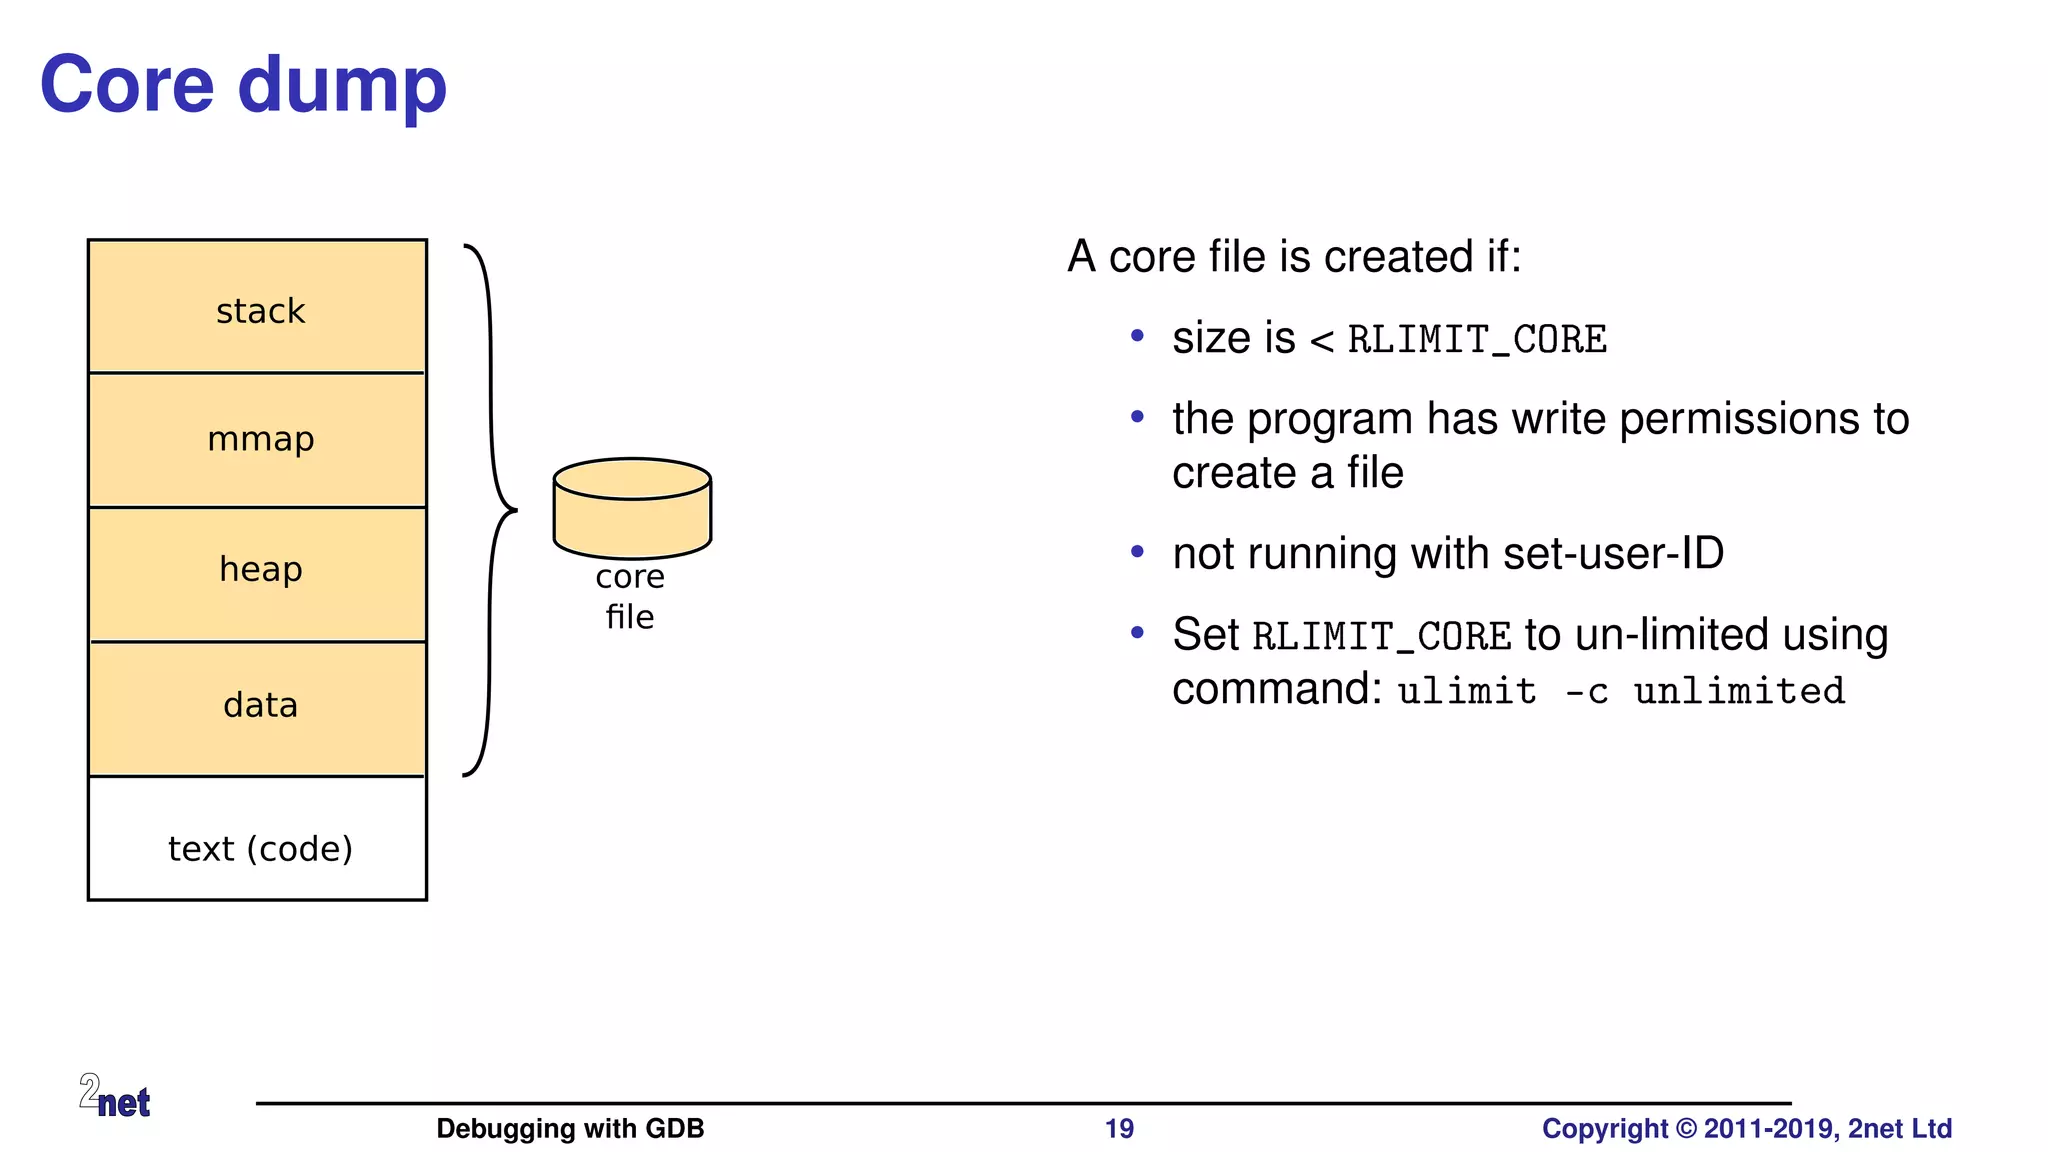
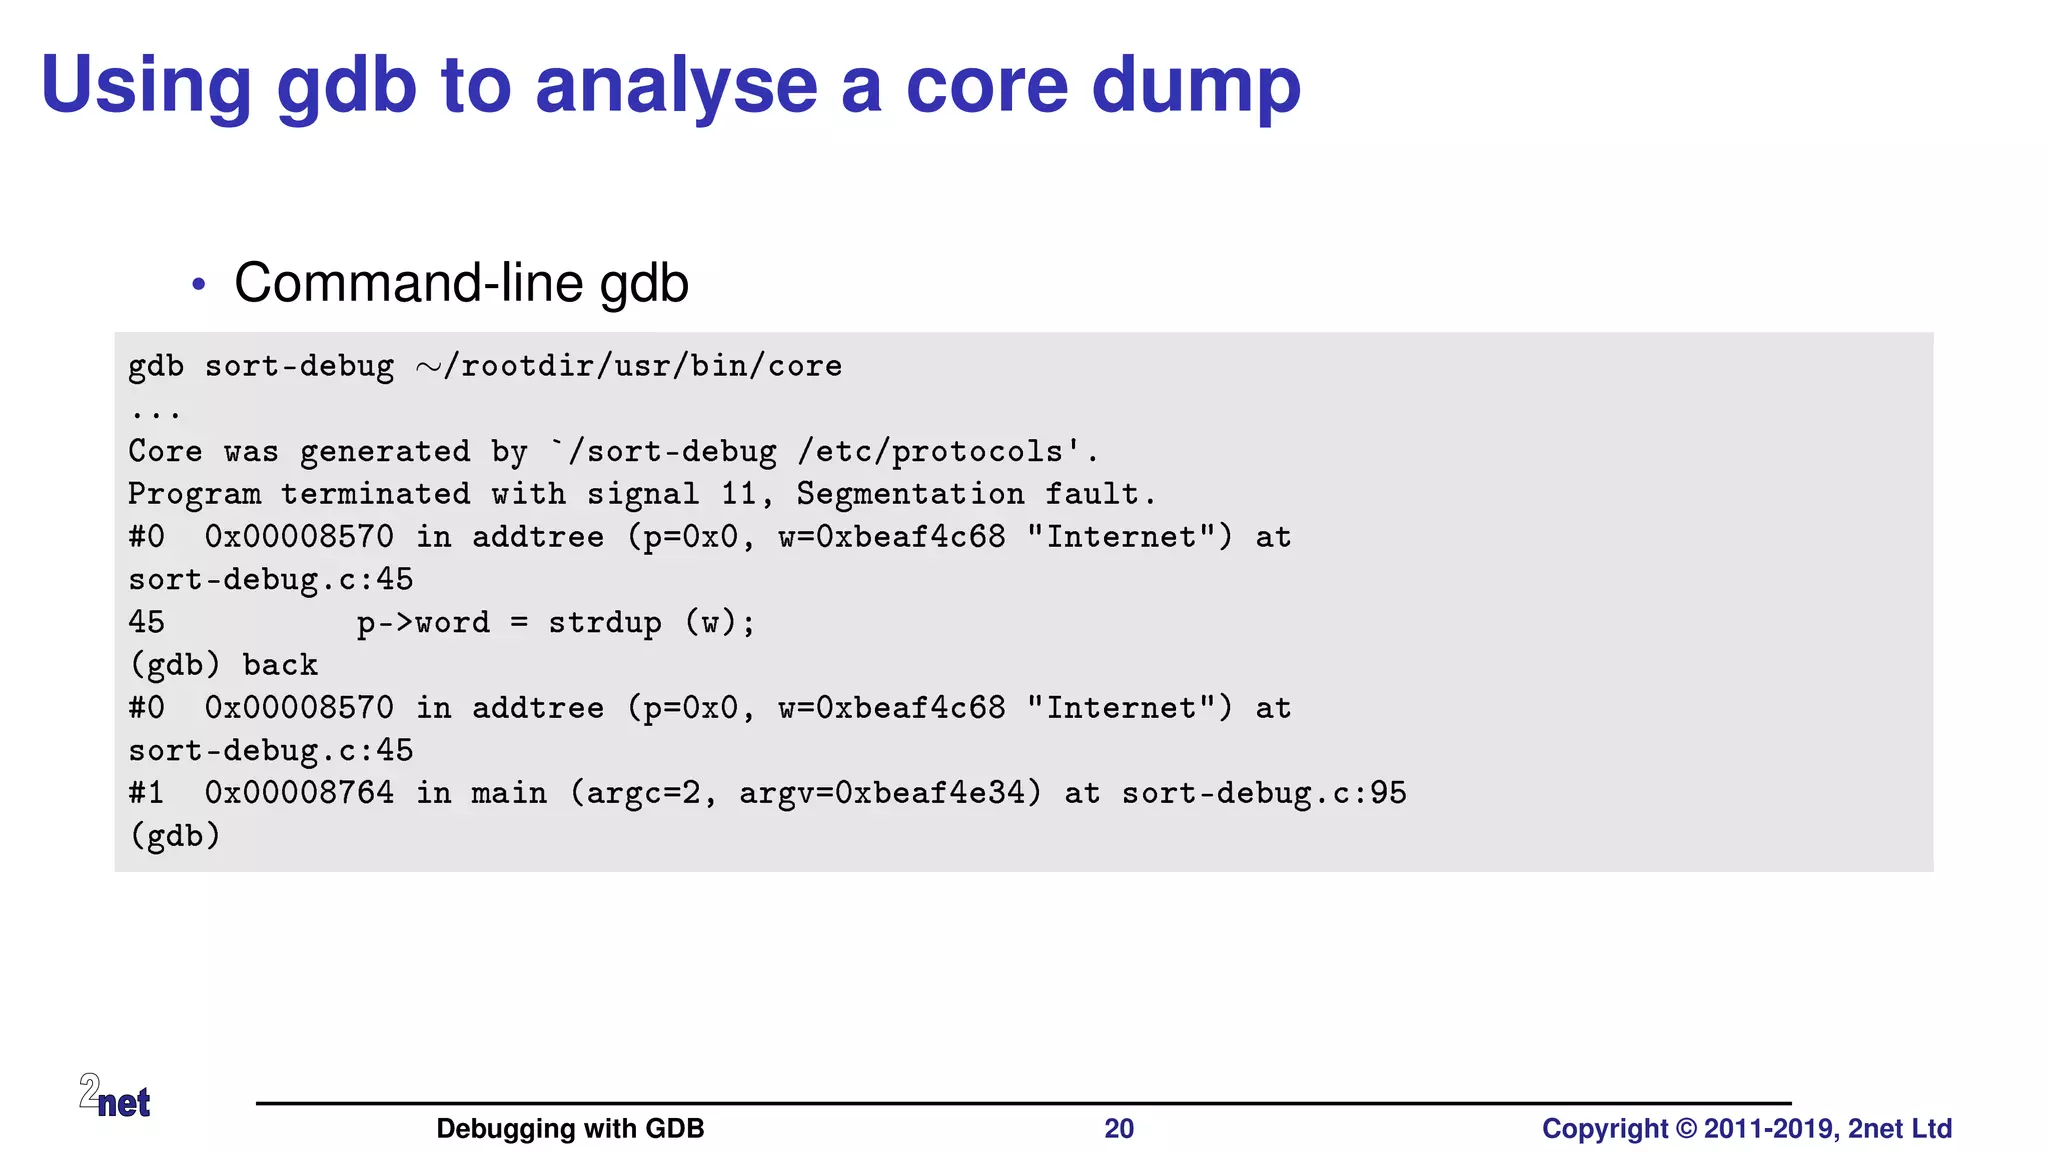


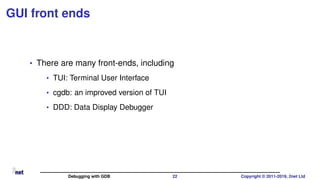
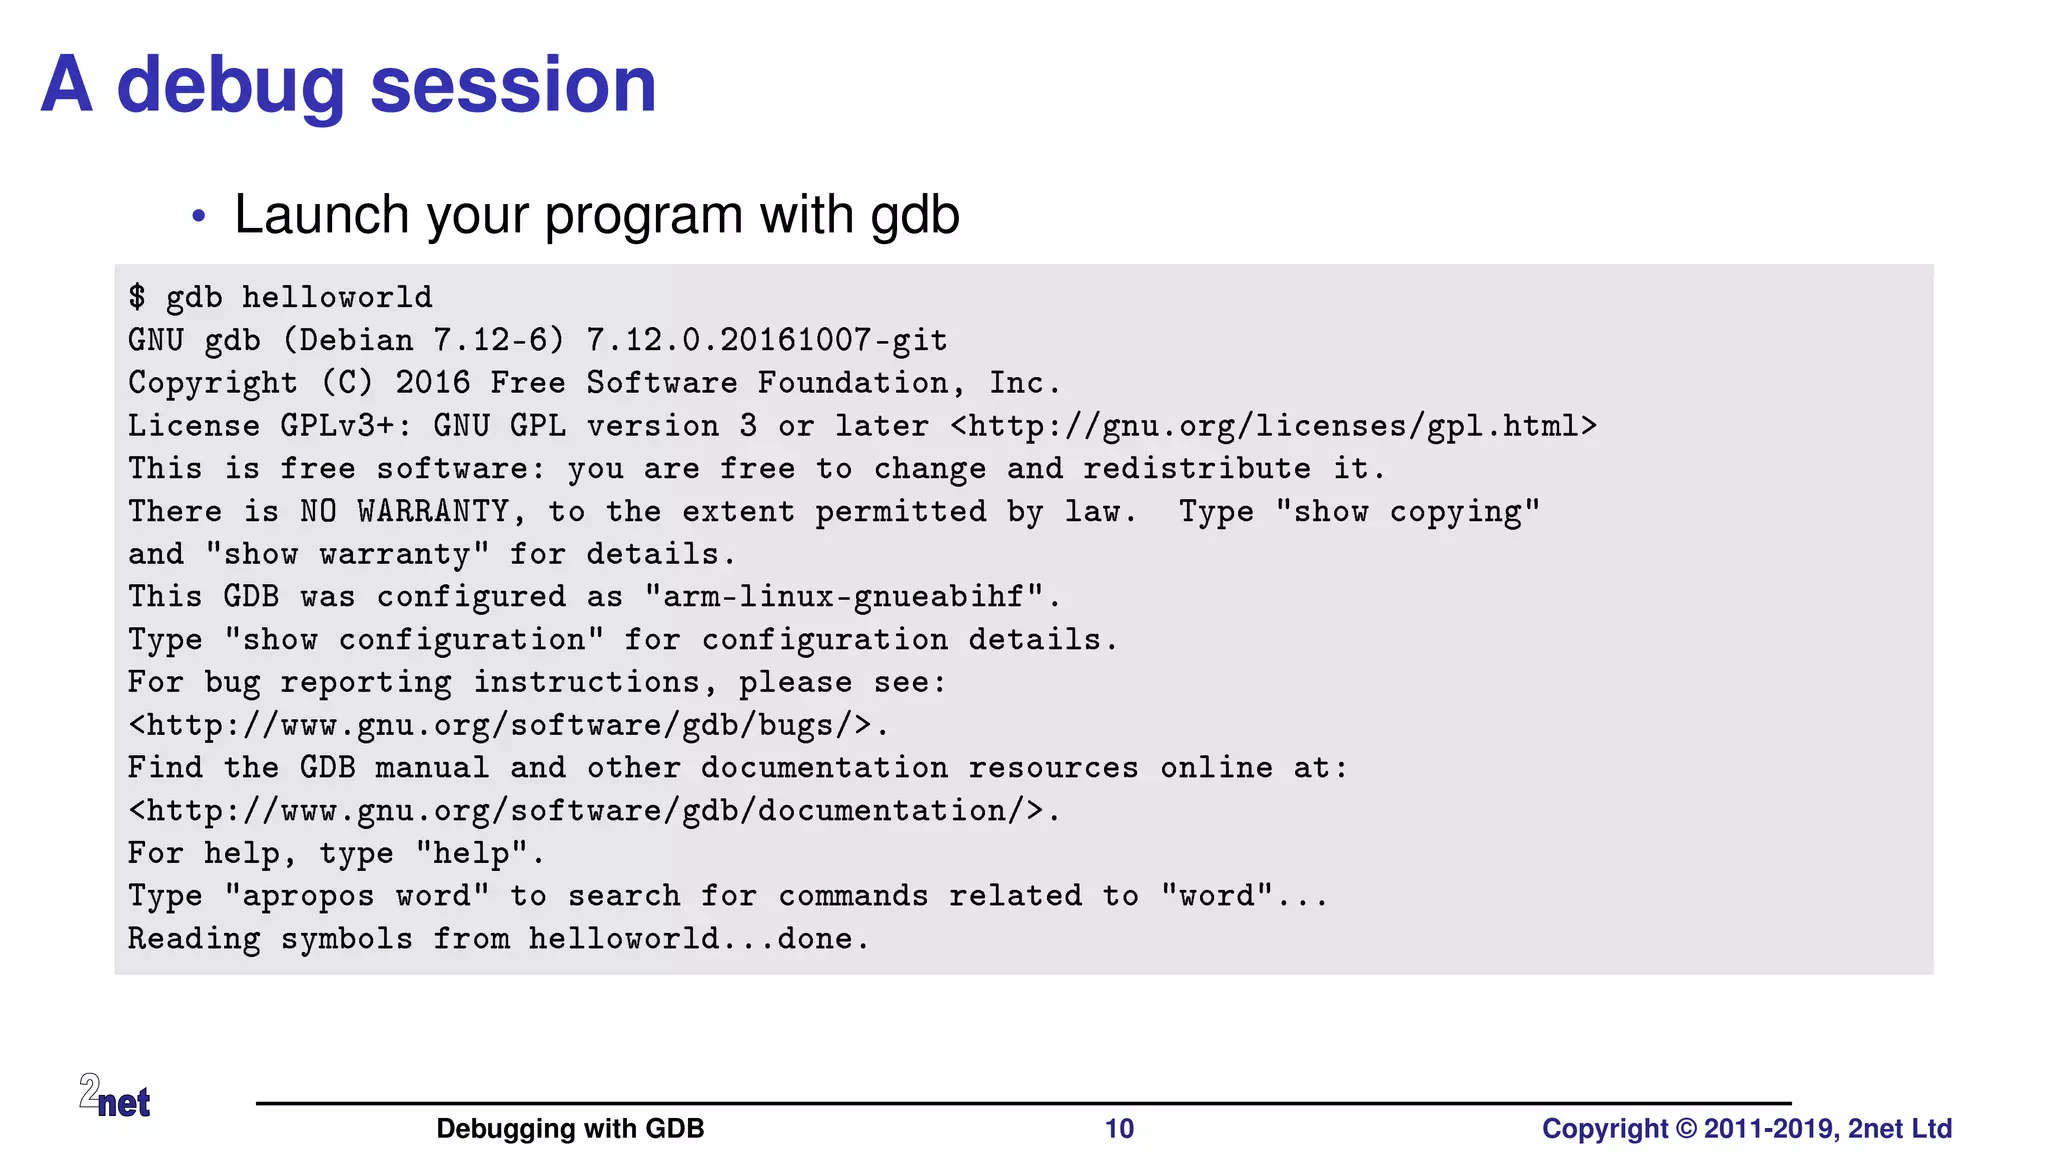
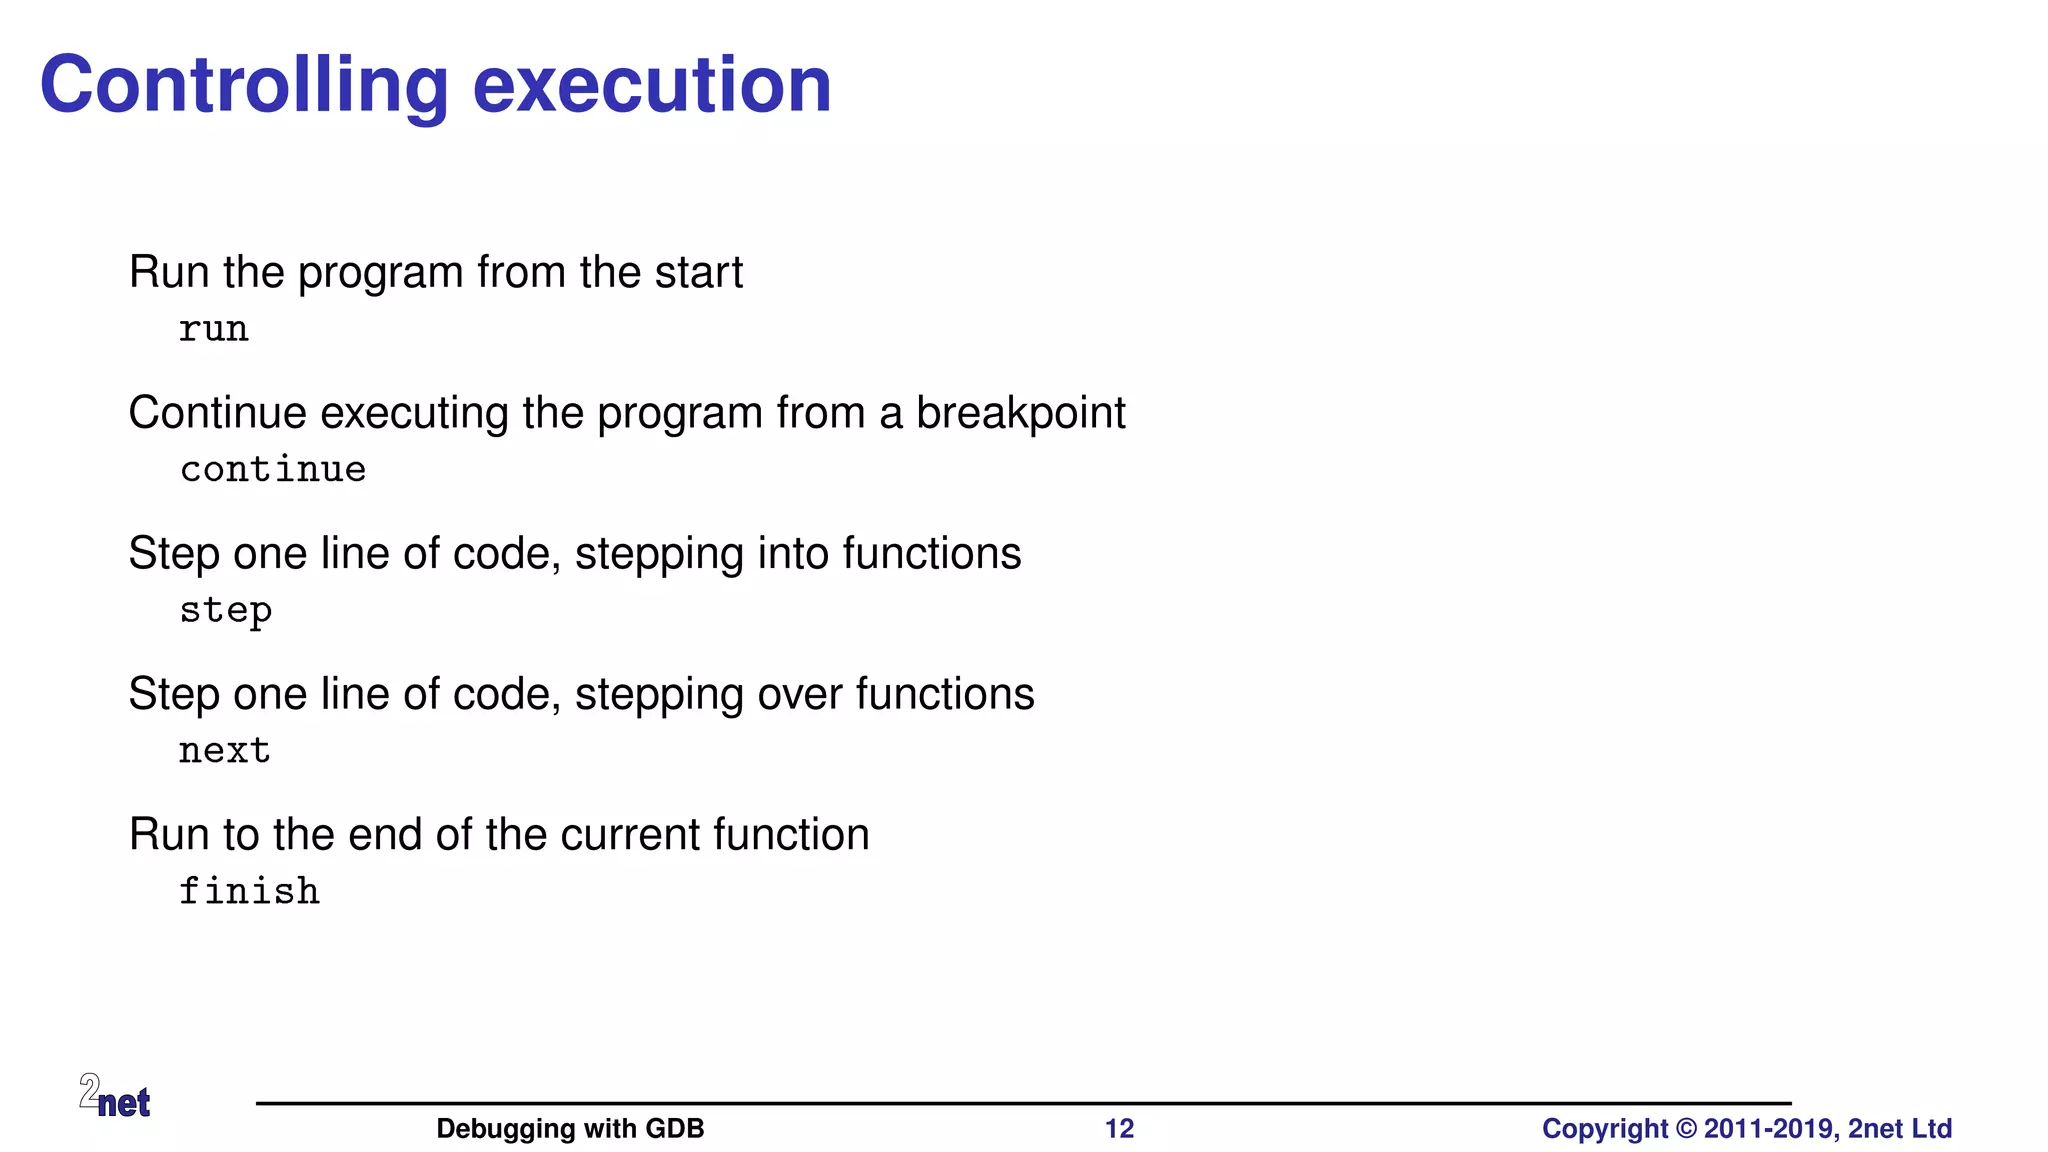
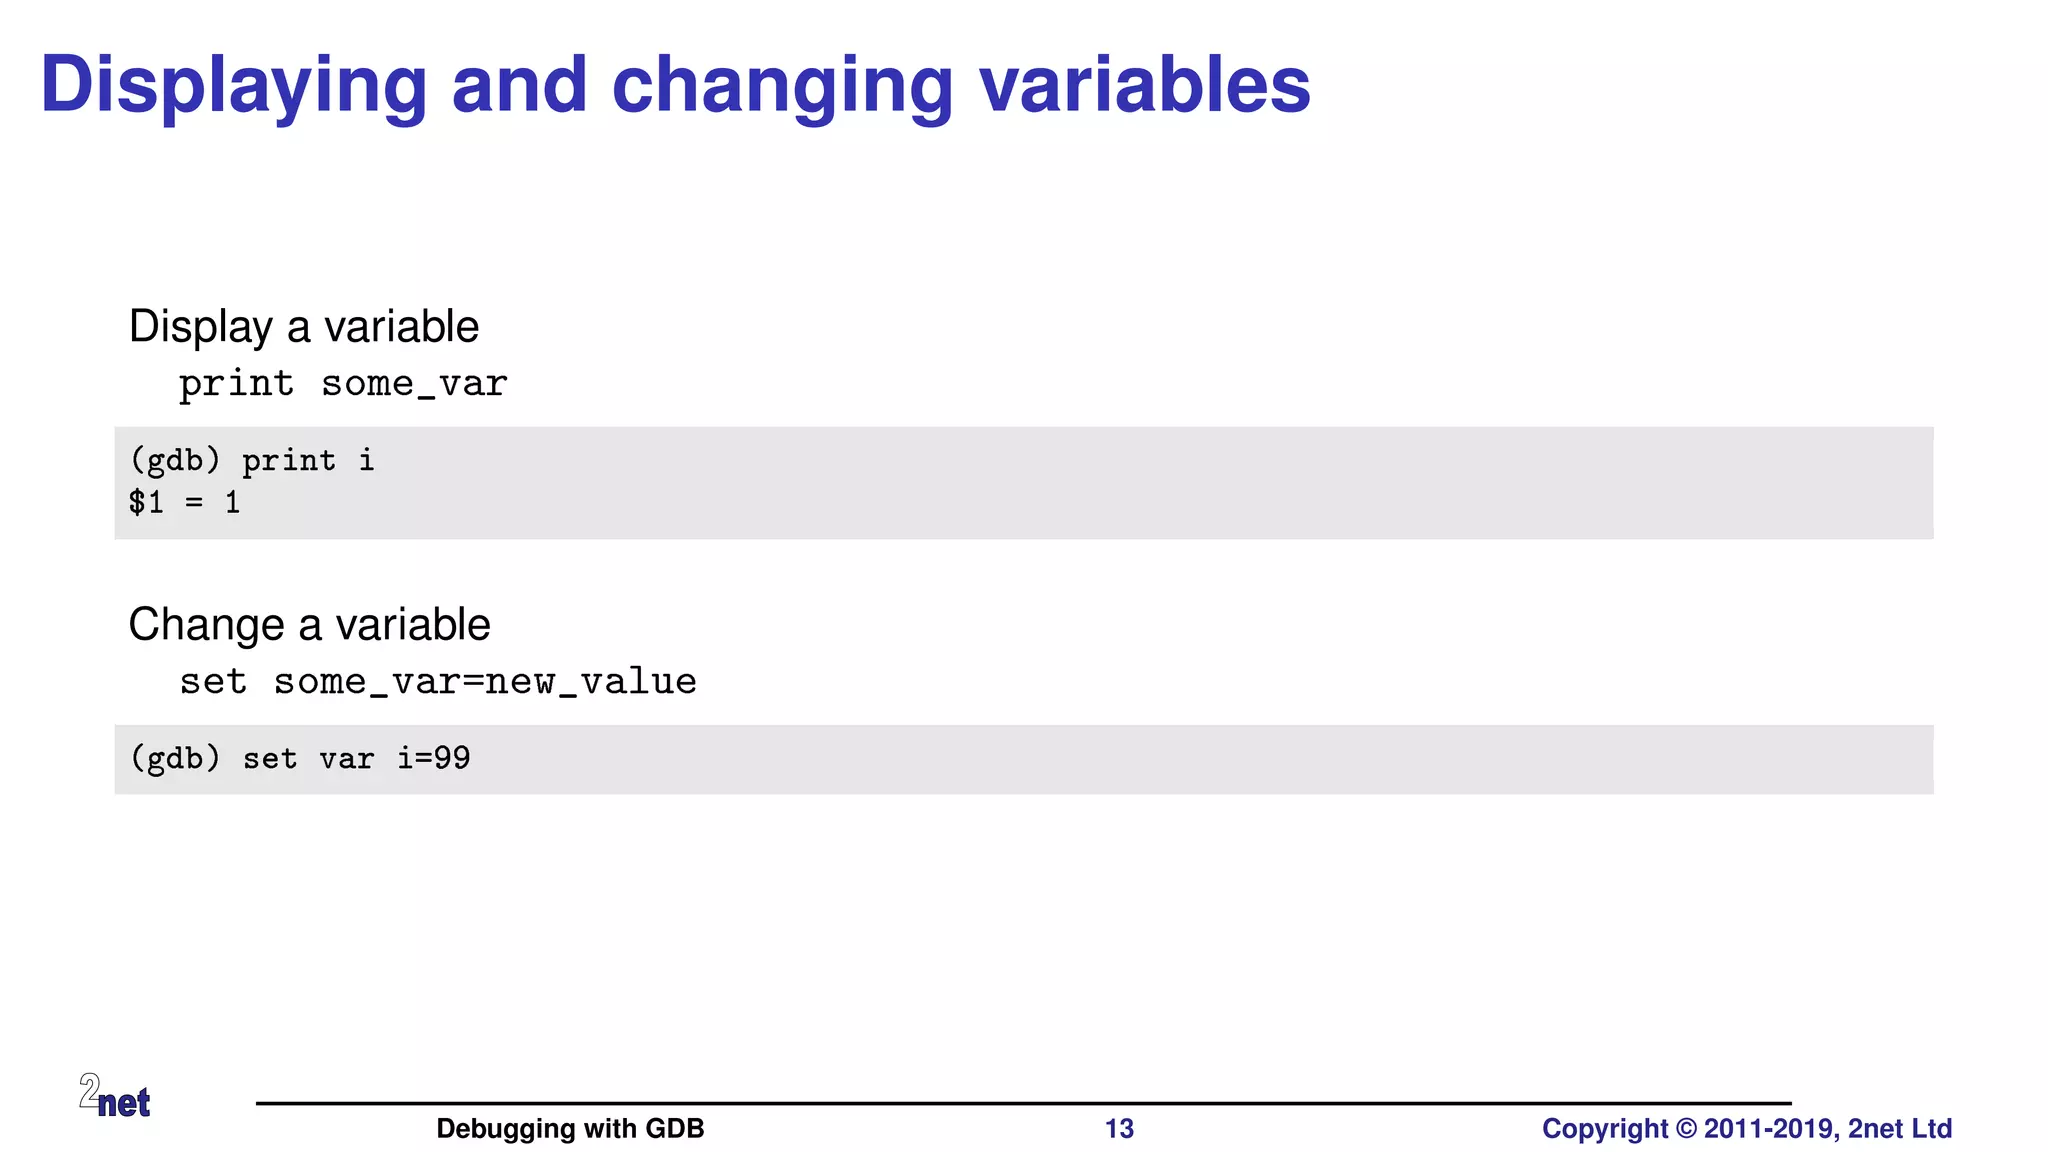
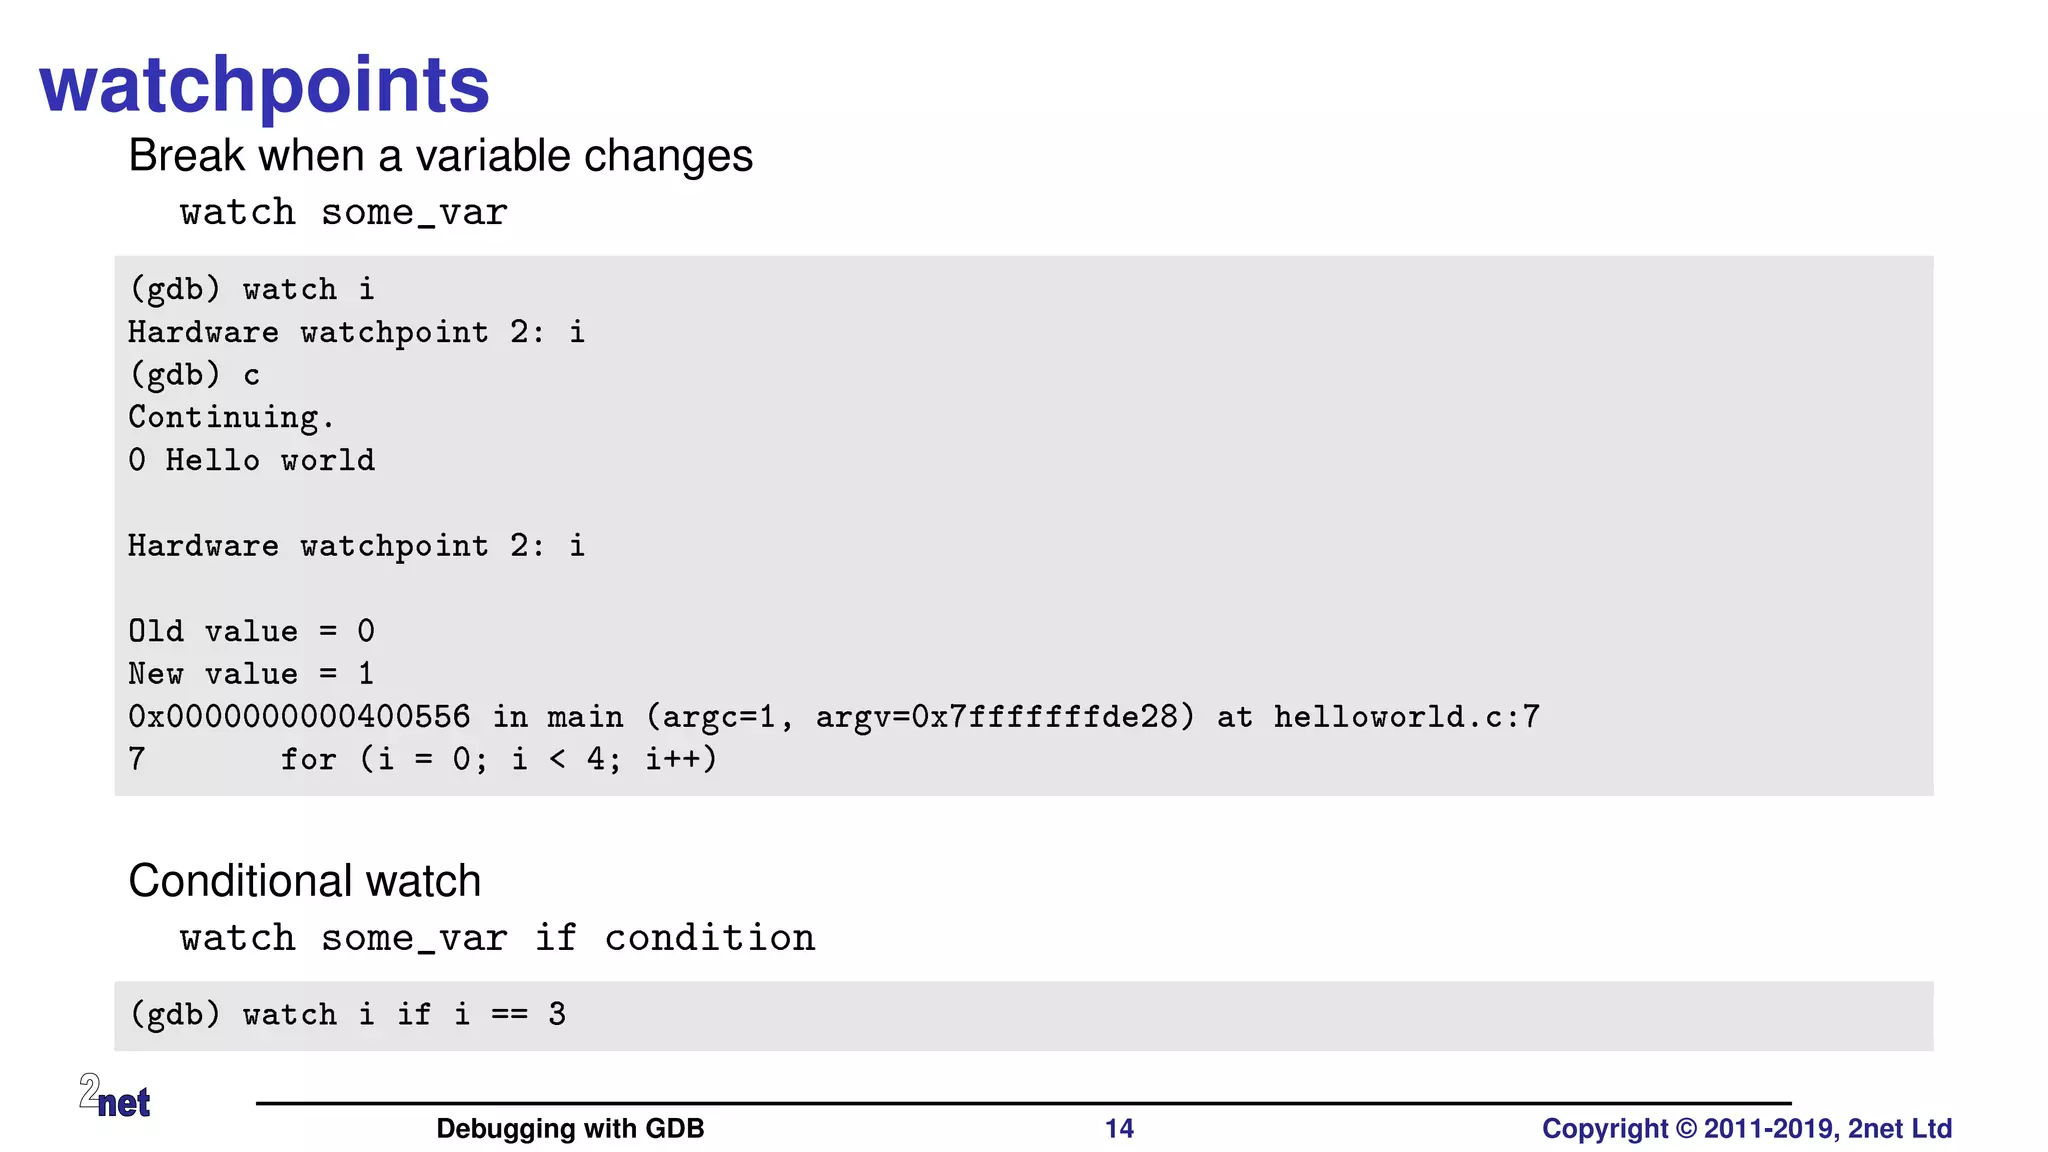
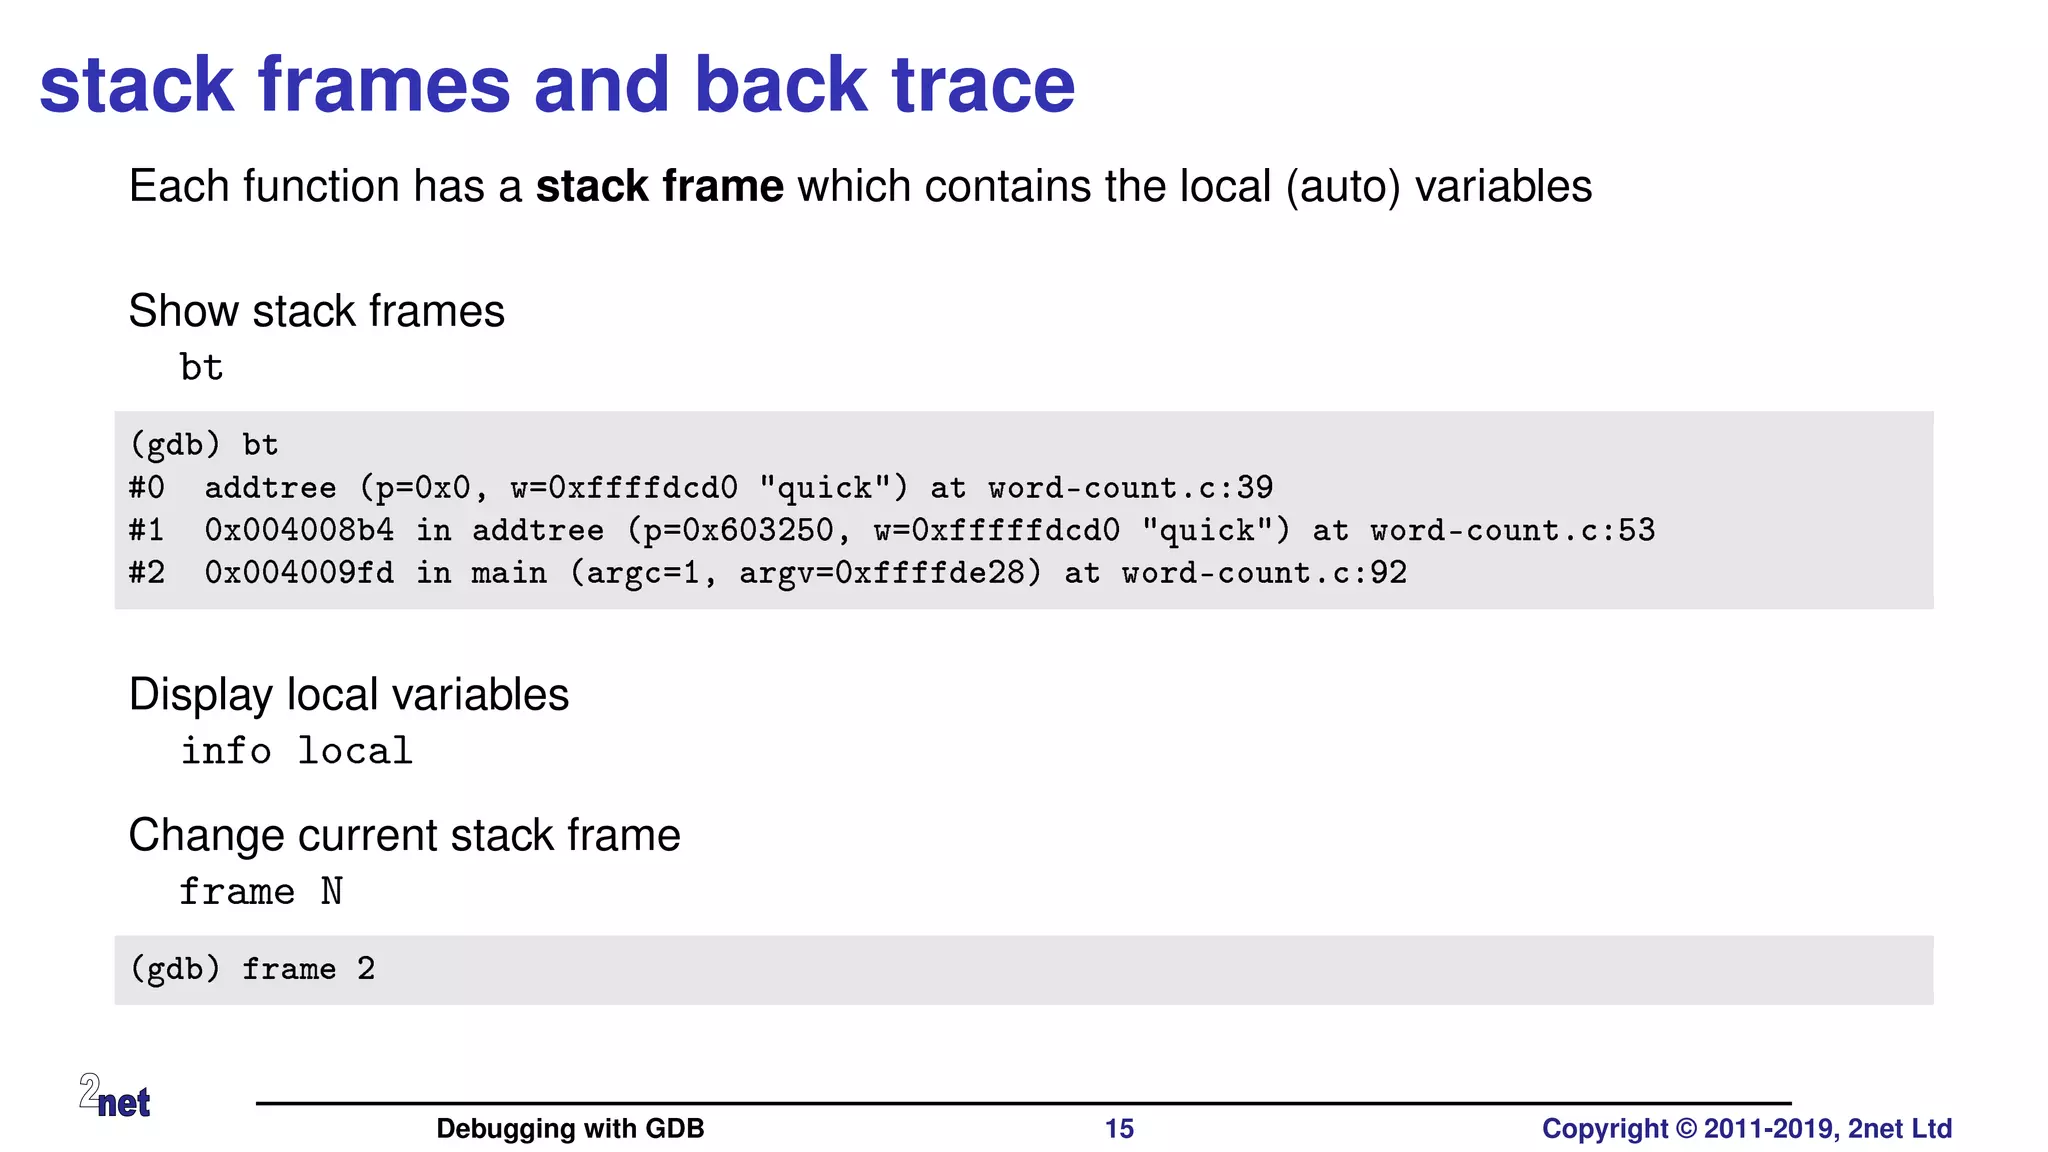
The document presents a comprehensive overview of debugging with GDB (GNU Debugger), covering essential techniques, commands, and tools for effective debugging in embedded Linux environments. It discusses topics such as breakpoints, watchpoints, and handling core dumps, as well as preparing for debugging sessions and remote debugging. Additionally, graphical interfaces and various front-ends for GDB are introduced, along with references to training materials and further reading for deeper understanding.


