


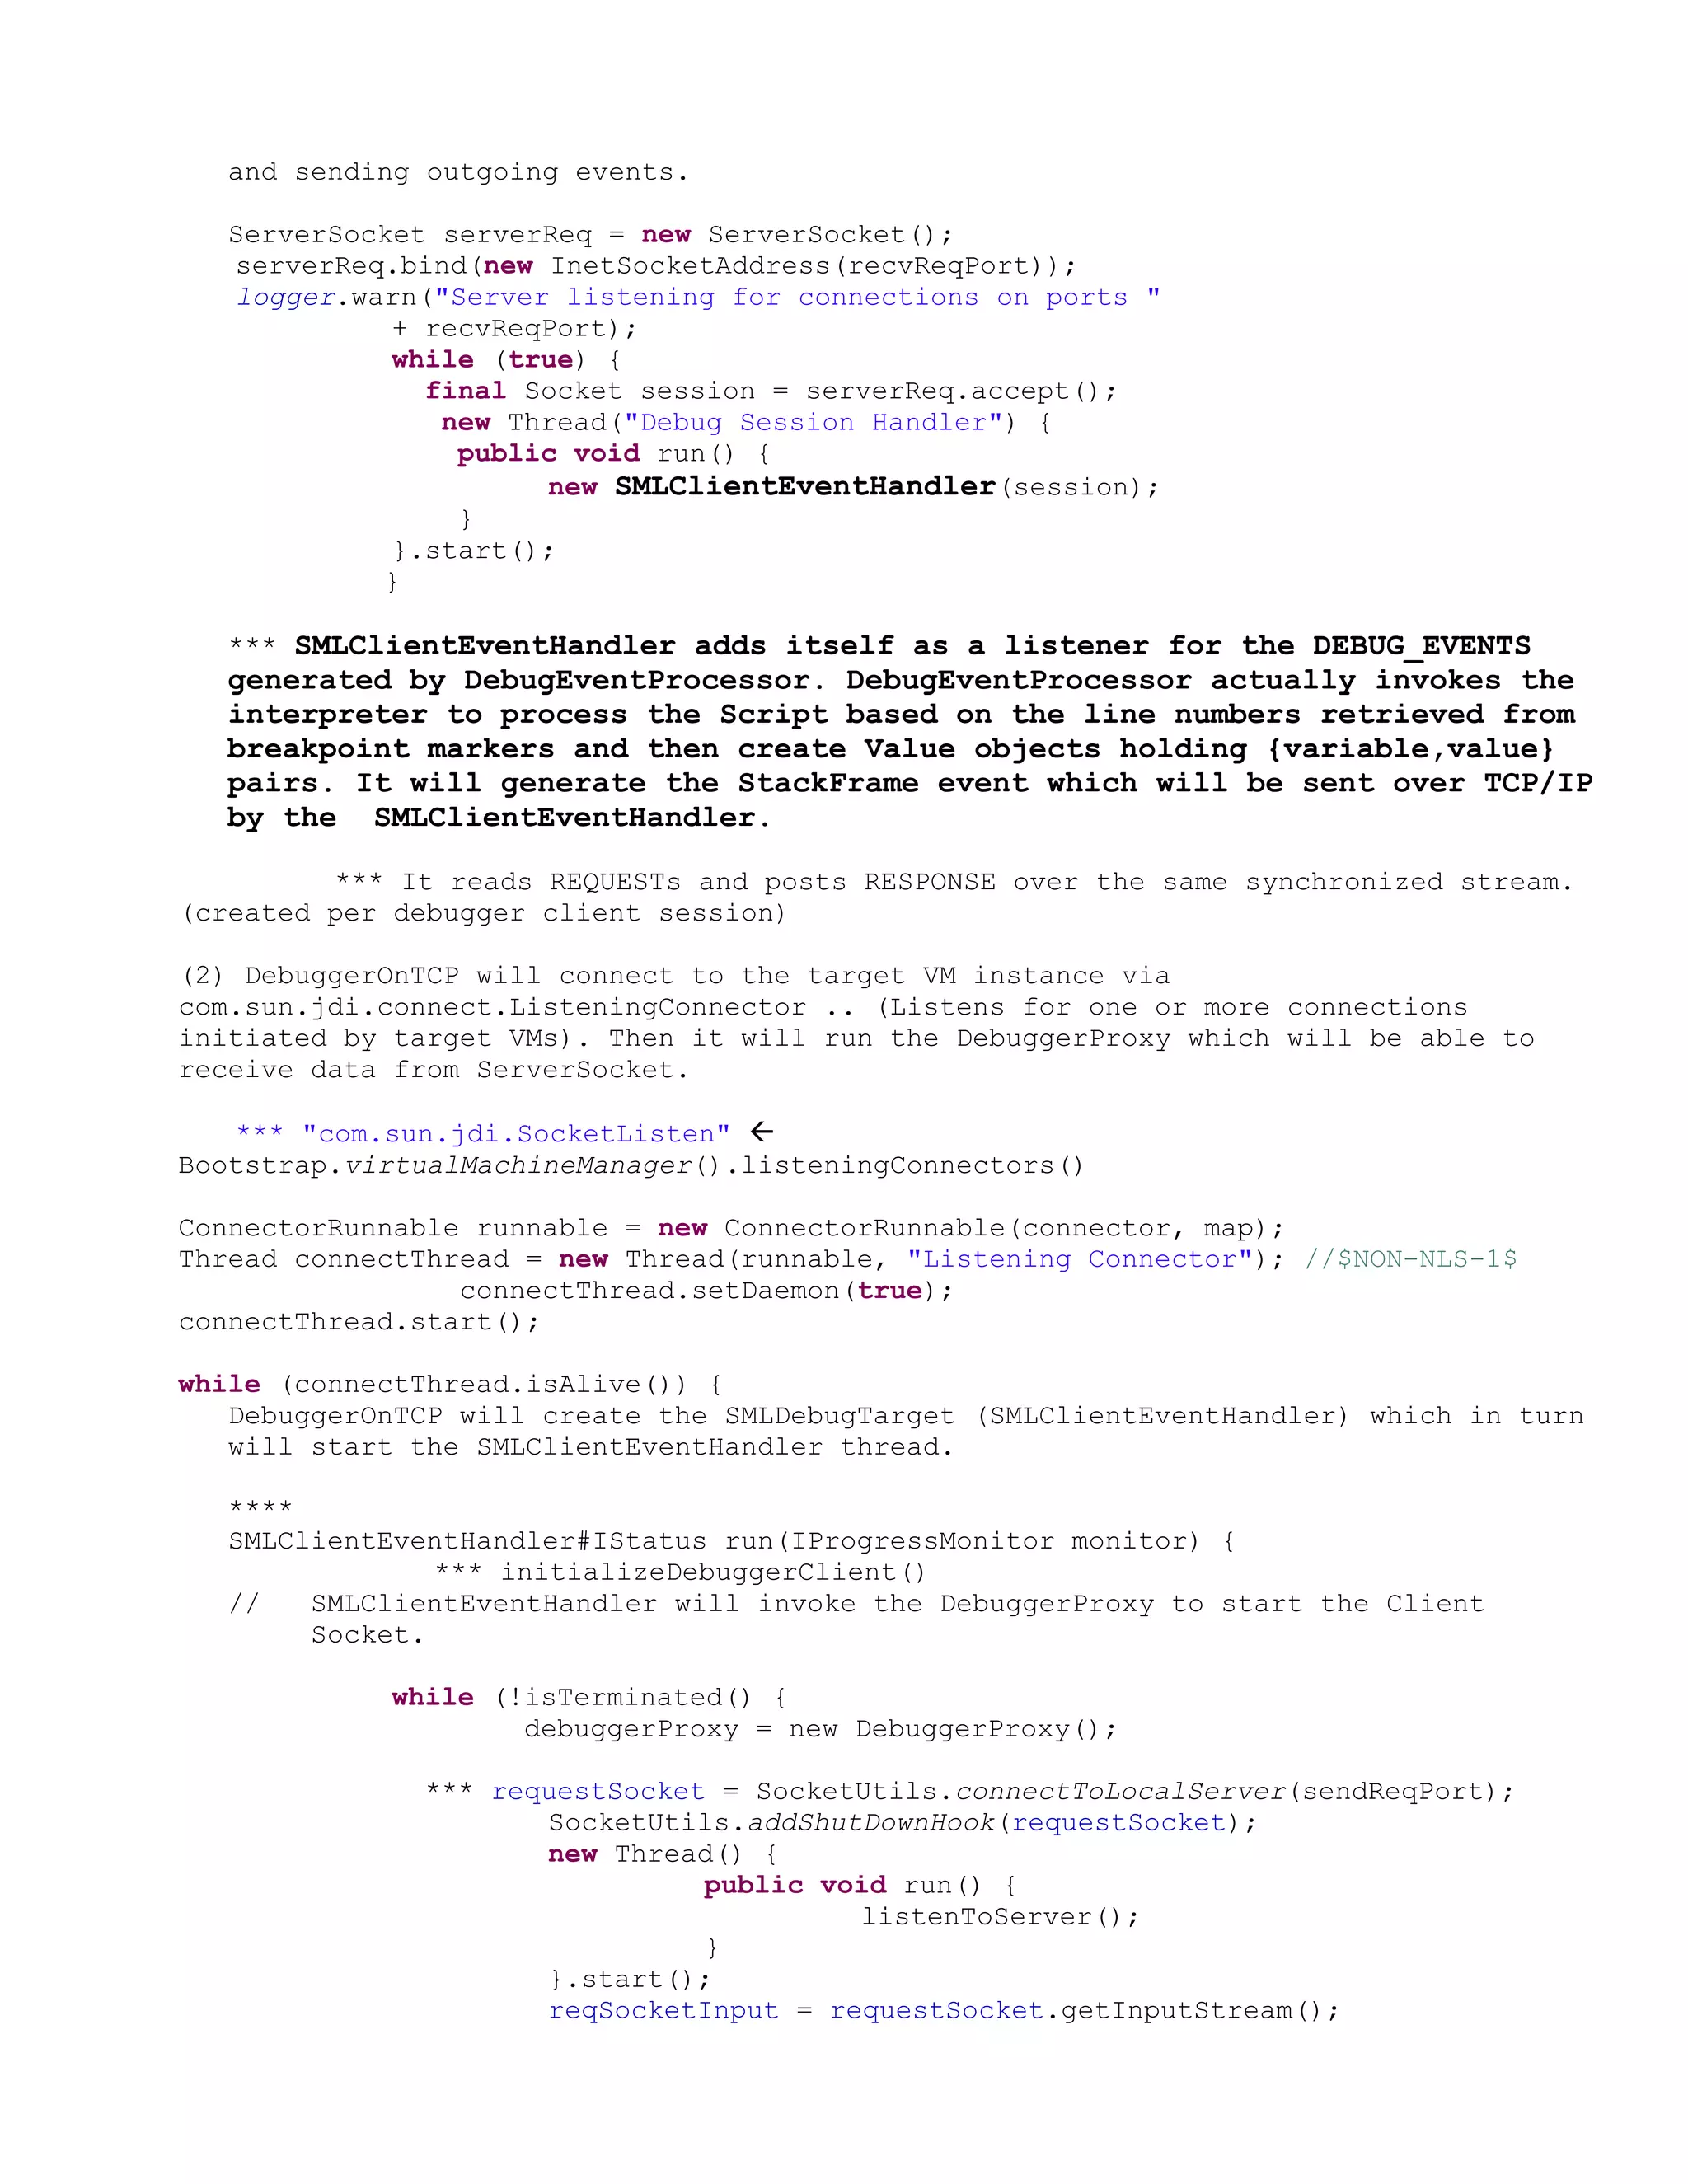
![reqSocketOutput = requestSocket.getOutputStream();
***
}
}
}
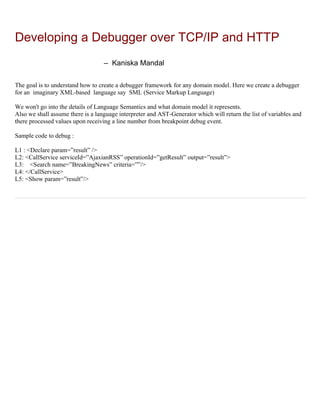
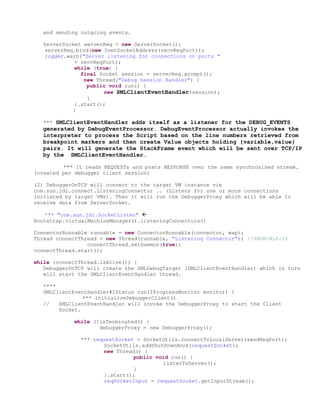
So, this is how the – debugger will - Send request in one thread on client side and
and Receive response in another thread on TCP server side.
Once DebuggerProxy is setup, it sends the first DEBUG_EVENT request LOGIN to the
DebuggerServer (DebuggerHost.java)
debugger.login
>> new ObjectOutputStream(reqSocketOutput).writeObject(request);
reqSocketOutput.flush();
SMLClientEventHandler will get the object thru the server socket ..
*** listenForRequests() {
while (!requestSocket.isClosed()) {
// check if we can receive requests.
SocketUtils.checkRecvChannel(requestSocket);
// schedule the request for running
// and sending acknowledgment to client.
synchronized (requestSocket) {
if (reqSocketInput.available() > 0) {
request = (Request) new ObjectInputStream(reqSocketInput).readObject();
if (request != null) {
String methodName = request.getDebuggerMethod();
Object[] args = request.getArgs();
if(methodName.equals("login")){
// store token info in session ..
debuggerProxy.registerForDebug()
>> ServerDebugEventProcessor stores the SML script for processing.
B – Show the Debugger UI
Event Notification is performed in a separate thread which queues up the events and fire them
EventListner listens to the debug events and then accordingly refreshes the UI … i.e.
if the Event is IDebugtarget.create then expands the target, resume – select target,
update label and refresh the children. Similarly for IThread.suspend – updates thread
labels and top frame labels.
ClientDebugEventDelegate#started() …
1.After initializing client socket, ClientDebugEventDelegate (SMLDebugElement)shows the
Debug UI
*** fires creation event : fireEvent(new DebugEvent(this, DebugEvent.CREATE));
2.Next it reads all the installed breakpoints and notifies the SMLClientEventHandler
*** fireBreakPointEvents() {
IBreakpoint[] breakpoints = DebugPlugin.getDefault().getBreakpointManag-
er().getBreakpoints(SMLDebugConstants.SML_DEBUG_MODEL_ID);
for (int i = 0; i < breakpoints.length; i++) {](https://image.slidesharecdn.com/debuggingovertcpandhttp-110320183058-phpapp01/85/Debugging-over-tcp-and-http-9-320.jpg)
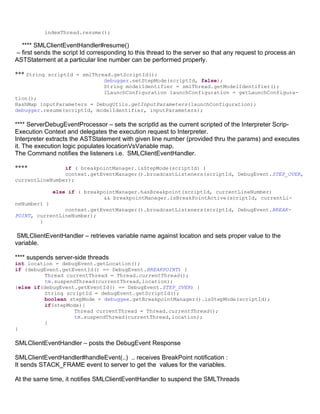
![clientSMLClientEventHandler#breakpointAdded(breakpoints[i]);
}
}
*** breakpointAdded(IBreakpoint breakpoint) {
if (supportsBreakpoint(breakpoint)) {
boolean isManagerEnabled =
DebugPlugin.getDefault().getBreakpointManager().isEnabled();
if (breakpoint.isEnabled() && isManagerEnabled) {
if(clientLookupThread == null)
return;
RemoteDebugger client = clientLookupThread.getClient();
if(client != null){
synchronized (client) {
clientLookupThread.setBreakpoint(breakpoint);
}
}
*** ILineBreakpoint lBp = (ILineBreakpoint) breakpoint;
IMarker marker = lBp.getMarker();
String scriptId = marker.getResource().getFullPath()
.toPortableString();
int lineNumber = lBp.getLineNumber();
markerIdVsBreakPointLineNum.put(marker.getId(),new Integer(lineNumber));
// keep track of the Breakpoints on the Server
debugger.setBreakpoint(scriptId, lineNumber, true);
*** The same breakpoint information is stored on the server side scriptVsbreak
points Map by ServerBreakPointManager…..
SMLServerEventHandler#setBreakpoint(String scriptId, int location, boolean
active) {
Breakpoint breakpoint = new Breakpoint(scriptId, null, location, active);
breakpointManager.setBreakpoint(breakpoint);
}
ServerBreakPointManager#setBreakpoint(Breakpoint breakpoint) {
Map scriptBreakpoints = getScriptsBreakpoint(breakpoint.getScriptId());
scriptBreakpoints.put(breakpoint.getLocation(), breakpoint);
}
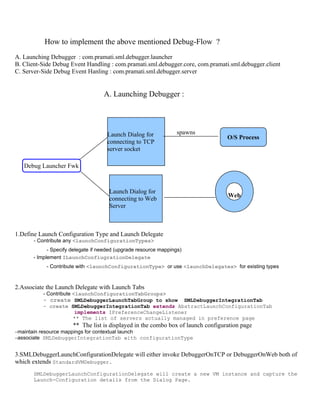
*** This is how all the break points get stored on the server side.
DebuggerProxy receives a START Event from Server once breakpoints are stored and notifies
the client-side debug event listners.
SMLClientEventHandler#handleEvent(DebugEvent debugEvent)
case DebugEvent.THREAD_START:
SMLThread mt = new SMLThread(smlDebugTarget, threadID, debugEvent.getScriptId());
smlDebugTarget.addThread(mt);
smlDebugTarget.fireCreationEvent();
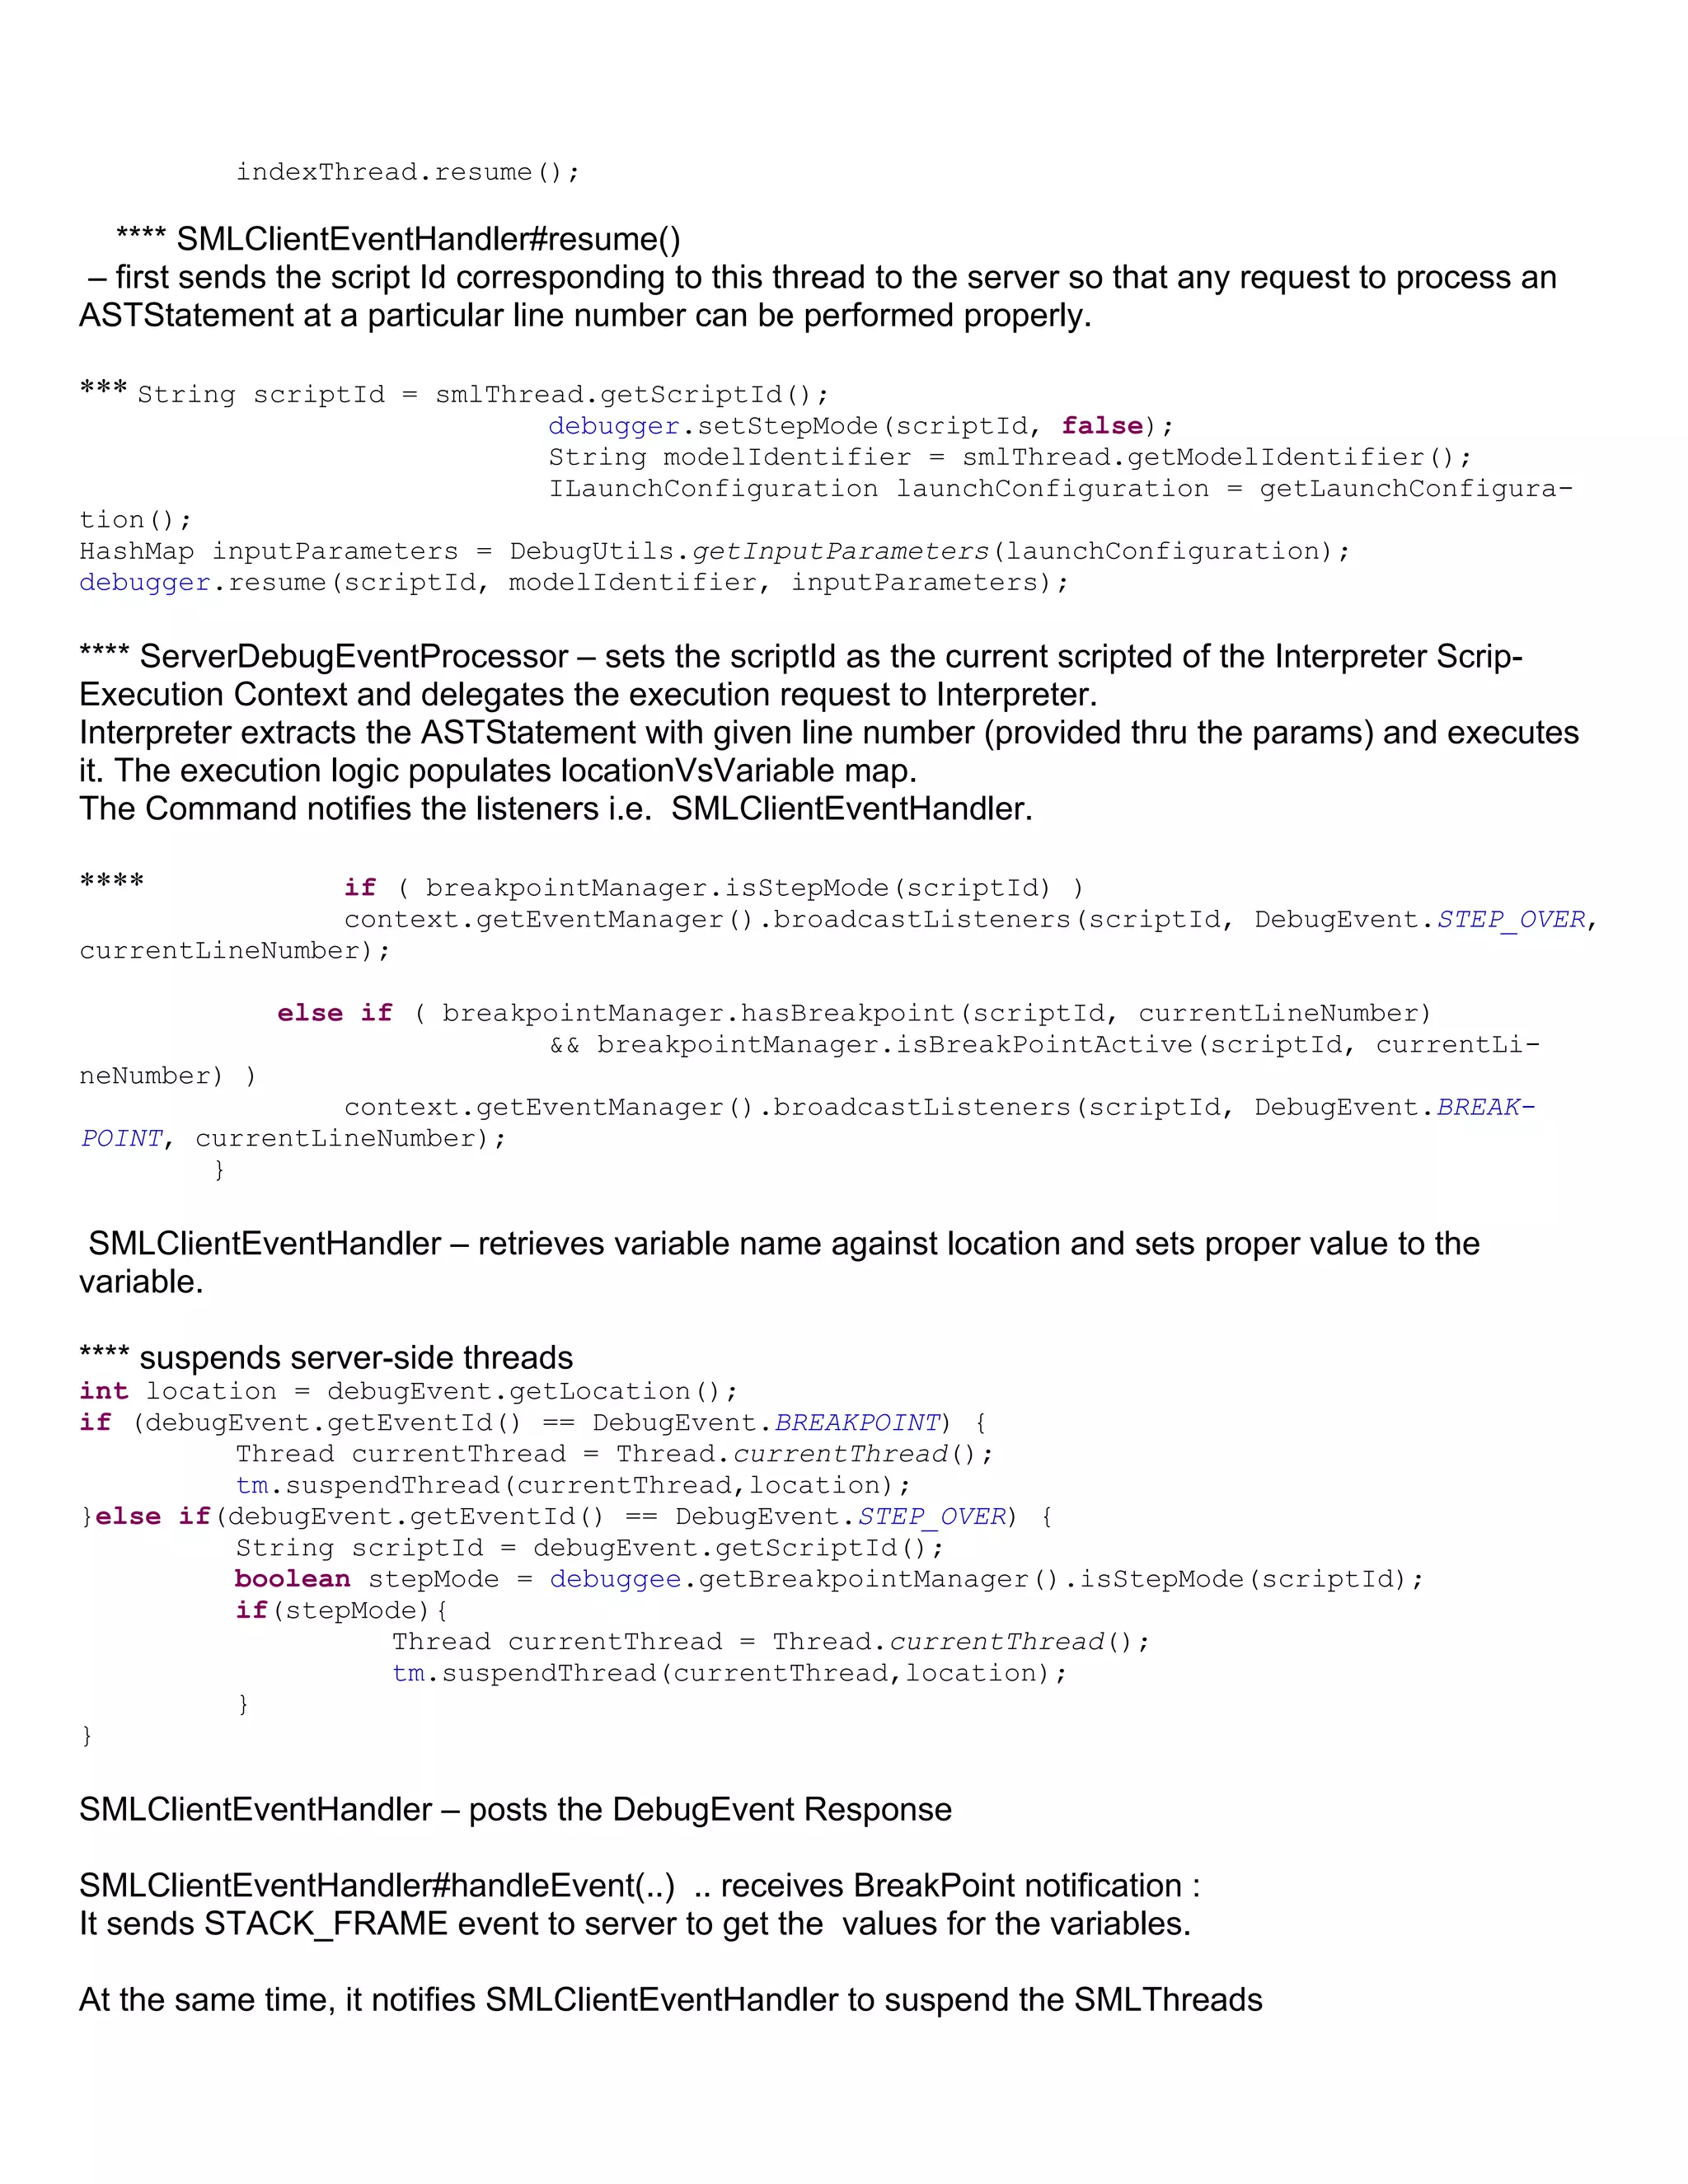
**** RESUME all the threads
resume() throws DebugException {
// resume all threads
for (int i = 0; i < fThreads.size(); i++) {
IThread indexThread = (IThread) fThreads.get(i);](https://image.slidesharecdn.com/debuggingovertcpandhttp-110320183058-phpapp01/85/Debugging-over-tcp-and-http-10-320.jpg)
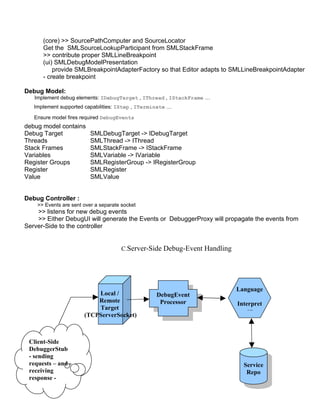
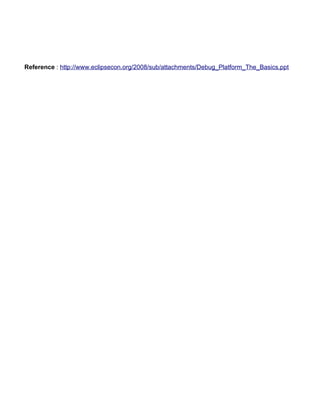
![DebugTargetProxy in turn handles the events and notifies ModelChnageListners to refresh the
views (fireModelChanged (IModelDelta delta)…)
case DebugEvent.BREAKPOINT: {
// if a break point is hit request for all the variables
debugger.getStackFrame(threadID);
smlDebugTarget.suspend();
Show the StackFrame :
client receives STACKFRAME Event >> create SMLStackFrame
case DebugEvent.STACKFRAME:
Debugdata rd = (Debugdata) data;
SMLThread mt = smlDebugTarget.getThread(threadID);
String scriptId = mt.getScriptId();
IResource resource = getResource(scriptId);
if(resource != null){
SMLStackFrame sf = new SMLStackFrame(mt, resource.getName(),
debugEvent.getLocation(), rd);
ArrayList stackFrames = getStackFramesForThread(threadID);
stackFrames.clear();
stackFrames.add(sf);
// viewed stack frame.
now show the data .. Debug Flow has to stop ..
>> getThread(threadID).suspend();
smlDebugTarget.suspended(threadID,org.eclipse.debug.core.DebugEvent.BREAKPOINT);
highlights the current breakpoint in the source code.
Scenario-2 : Debugging over the web
runner = new RemoteSMLServerDebugger(vm, launch); // debug mode for remote
private void submitRequest(Request request) {
Response response = transport.publishRequestAndGetResponse(request);
if (response.getException() != null) {
Throwable ex = response.getException();
if(ex instanceof JEMSException){
throw (JEMSException)ex;
}else{
throw new RuntimeException(response.getException());
}
}
DebugEvent[] events = response.getEvents();
if (events != null) {
for (int i = 0; i < events.length; i++) {
fireDebugEvent(events[i]);
}
}
}](https://image.slidesharecdn.com/debuggingovertcpandhttp-110320183058-phpapp01/85/Debugging-over-tcp-and-http-12-320.jpg)

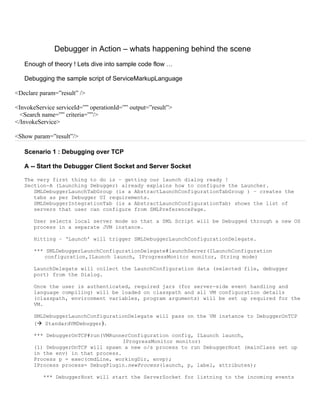
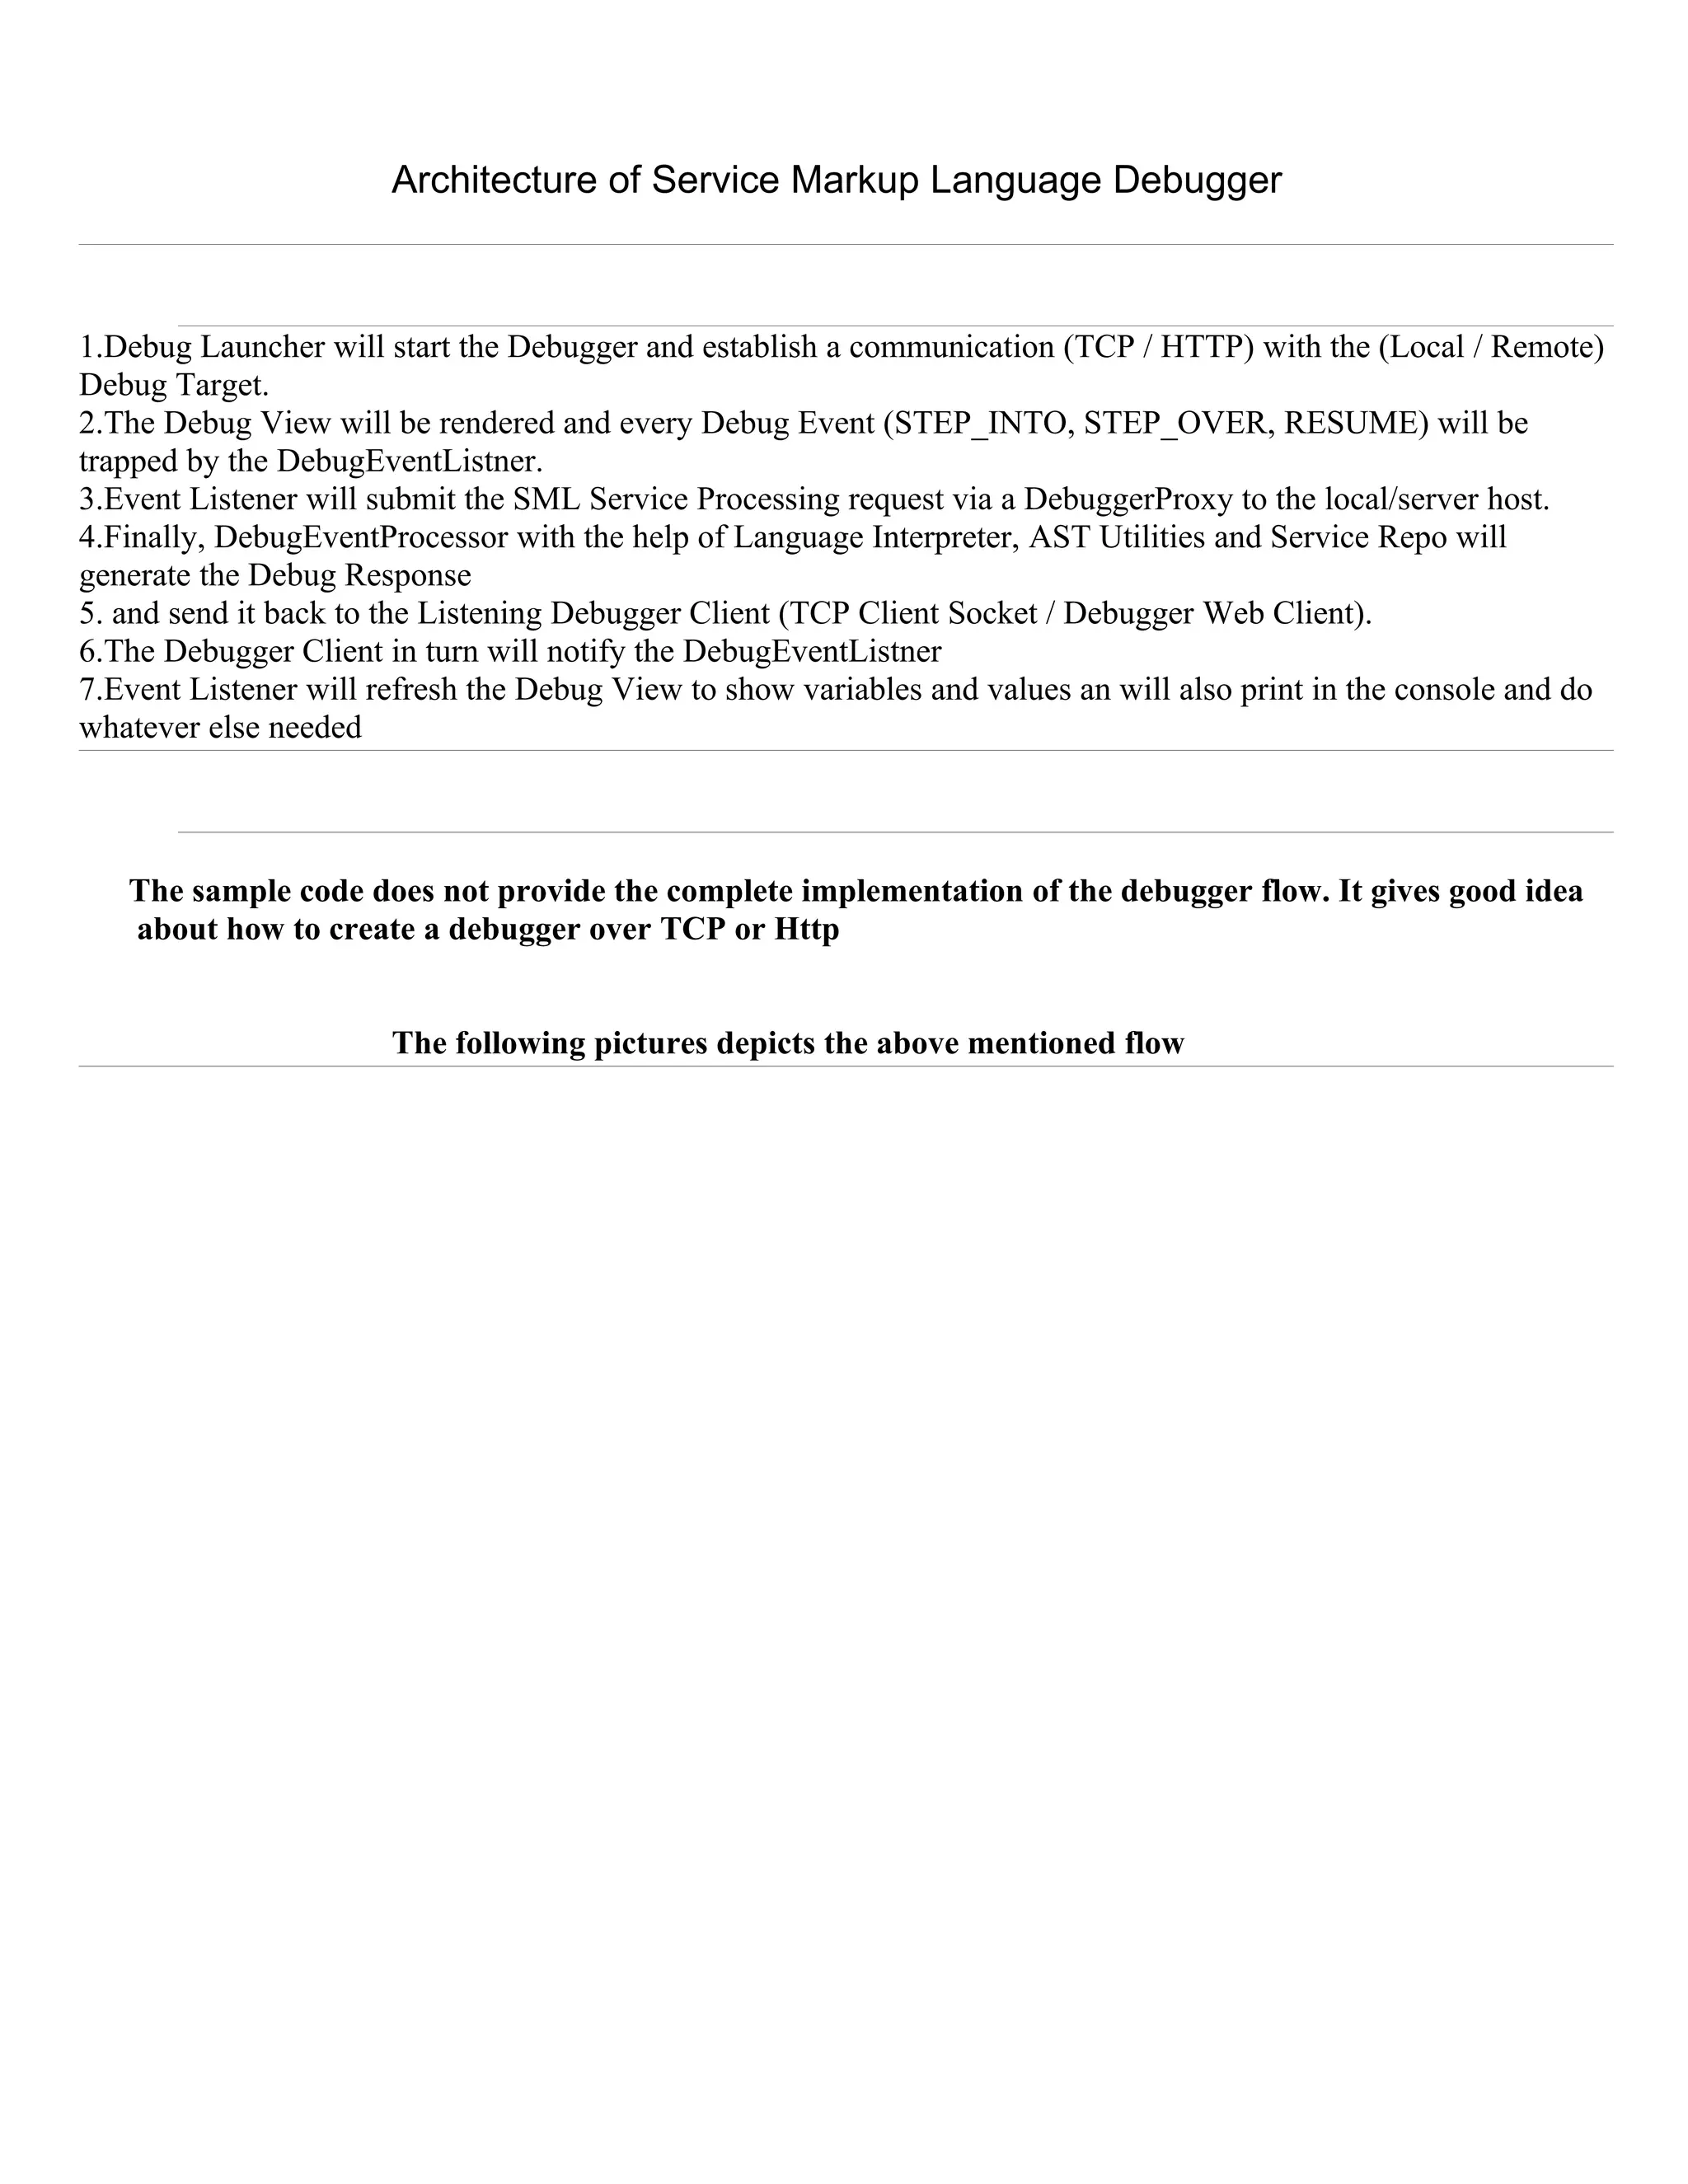
![Now so far we have seen how communication is established between debug client an debug target
(local / remote) and debug events are processed both at the Client and Server side.
Next few obvious questions pop up :
1. How does break point get created upon toggle / double click ?
Toggle breakpoint Action asks the active workbench part () for its its IToggleBreakpointsTarget
adapter. The action interacts with the adapter class
SMLLineBreakpointAdapter#toggleLineBreakpoints(IWorkbenchPart part, ISelection selection)
The editor gets a call back for decorating.
SMLDebugModelPresentation provides labels and images for breakpoint.
BreakPoint Dialog allows user to modify properties.
IBreakpoint stores the information required to install a breakpoint in a specific type of debugger :
For example,
In case of a language debugger, a line breakpoint stores a fully qualified type name and line
number.
In case of a graphical debugger, a figure breakpoint will store corresponding diagram model element
uri and its location.
IDebugTarget Listens for breakpoints being added/removed/changed during its lifecycle, and
updates them in the underlying runtime
Slide 87 of Debug_Platform_The_Basics
2. How to locate the code for a selected frame ?
Slides 91-105 of Debug_Platform_The_Basics
3. How to enable source highlighting for non-textual editor ?
Graphical Editors should implement IDebugEditorPresentation.
Debugger will send add/remove annotation events based on which editor will highlight the diagram
elements.
4. How to display custom variable view an watch expression ?
slide 127 of Debug_Platform_The_Basics
Eclipse Debug UI Utilities interact with the Standard Debug Model.
Debug Model Elements – represent the program being debugged which has the capabilities to step,
resume and terminate.
DebugPlugin.fireDebugEventSet(DebugEvent[] events)
DebugPlugin.addDebugEventListener(IDebugEventSetListener listener)
EventListner listens to the debug events and then accordingly refreshes the UI.](https://image.slidesharecdn.com/debuggingovertcpandhttp-110320183058-phpapp01/85/Debugging-over-tcp-and-http-14-320.jpg)


![reqSocketOutput = requestSocket.getOutputStream();
***
}
}
}
So, this is how the – debugger will - Send request in one thread on client side and
and Receive response in another thread on TCP server side.
Once DebuggerProxy is setup, it sends the first DEBUG_EVENT request LOGIN to the
DebuggerServer (DebuggerHost.java)
debugger.login
>> new ObjectOutputStream(reqSocketOutput).writeObject(request);
reqSocketOutput.flush();
SMLClientEventHandler will get the object thru the server socket ..
*** listenForRequests() {
while (!requestSocket.isClosed()) {
// check if we can receive requests.
SocketUtils.checkRecvChannel(requestSocket);
// schedule the request for running
// and sending acknowledgment to client.
synchronized (requestSocket) {
if (reqSocketInput.available() > 0) {
request = (Request) new ObjectInputStream(reqSocketInput).readObject();
if (request != null) {
String methodName = request.getDebuggerMethod();
Object[] args = request.getArgs();
if(methodName.equals("login")){
// store token info in session ..
debuggerProxy.registerForDebug()
>> ServerDebugEventProcessor stores the SML script for processing.
B – Show the Debugger UI
Event Notification is performed in a separate thread which queues up the events and fire them
EventListner listens to the debug events and then accordingly refreshes the UI … i.e.
if the Event is IDebugtarget.create then expands the target, resume – select target,
update label and refresh the children. Similarly for IThread.suspend – updates thread
labels and top frame labels.
ClientDebugEventDelegate#started() …
1.After initializing client socket, ClientDebugEventDelegate (SMLDebugElement)shows the
Debug UI
*** fires creation event : fireEvent(new DebugEvent(this, DebugEvent.CREATE));
2.Next it reads all the installed breakpoints and notifies the SMLClientEventHandler
*** fireBreakPointEvents() {
IBreakpoint[] breakpoints = DebugPlugin.getDefault().getBreakpointManag-
er().getBreakpoints(SMLDebugConstants.SML_DEBUG_MODEL_ID);
for (int i = 0; i < breakpoints.length; i++) {](https://image.slidesharecdn.com/debuggingovertcpandhttp-110320183058-phpapp01/75/Debugging-over-tcp-and-http-9-2048.jpg)
![clientSMLClientEventHandler#breakpointAdded(breakpoints[i]);
}
}
*** breakpointAdded(IBreakpoint breakpoint) {
if (supportsBreakpoint(breakpoint)) {
boolean isManagerEnabled =
DebugPlugin.getDefault().getBreakpointManager().isEnabled();
if (breakpoint.isEnabled() && isManagerEnabled) {
if(clientLookupThread == null)
return;
RemoteDebugger client = clientLookupThread.getClient();
if(client != null){
synchronized (client) {
clientLookupThread.setBreakpoint(breakpoint);
}
}
*** ILineBreakpoint lBp = (ILineBreakpoint) breakpoint;
IMarker marker = lBp.getMarker();
String scriptId = marker.getResource().getFullPath()
.toPortableString();
int lineNumber = lBp.getLineNumber();
markerIdVsBreakPointLineNum.put(marker.getId(),new Integer(lineNumber));
// keep track of the Breakpoints on the Server
debugger.setBreakpoint(scriptId, lineNumber, true);
*** The same breakpoint information is stored on the server side scriptVsbreak
points Map by ServerBreakPointManager…..
SMLServerEventHandler#setBreakpoint(String scriptId, int location, boolean
active) {
Breakpoint breakpoint = new Breakpoint(scriptId, null, location, active);
breakpointManager.setBreakpoint(breakpoint);
}
ServerBreakPointManager#setBreakpoint(Breakpoint breakpoint) {
Map scriptBreakpoints = getScriptsBreakpoint(breakpoint.getScriptId());
scriptBreakpoints.put(breakpoint.getLocation(), breakpoint);
}
*** This is how all the break points get stored on the server side.
DebuggerProxy receives a START Event from Server once breakpoints are stored and notifies
the client-side debug event listners.
SMLClientEventHandler#handleEvent(DebugEvent debugEvent)
case DebugEvent.THREAD_START:
SMLThread mt = new SMLThread(smlDebugTarget, threadID, debugEvent.getScriptId());
smlDebugTarget.addThread(mt);
smlDebugTarget.fireCreationEvent();
**** RESUME all the threads
resume() throws DebugException {
// resume all threads
for (int i = 0; i < fThreads.size(); i++) {
IThread indexThread = (IThread) fThreads.get(i);](https://image.slidesharecdn.com/debuggingovertcpandhttp-110320183058-phpapp01/75/Debugging-over-tcp-and-http-10-2048.jpg)
![DebugTargetProxy in turn handles the events and notifies ModelChnageListners to refresh the
views (fireModelChanged (IModelDelta delta)…)
case DebugEvent.BREAKPOINT: {
// if a break point is hit request for all the variables
debugger.getStackFrame(threadID);
smlDebugTarget.suspend();
Show the StackFrame :
client receives STACKFRAME Event >> create SMLStackFrame
case DebugEvent.STACKFRAME:
Debugdata rd = (Debugdata) data;
SMLThread mt = smlDebugTarget.getThread(threadID);
String scriptId = mt.getScriptId();
IResource resource = getResource(scriptId);
if(resource != null){
SMLStackFrame sf = new SMLStackFrame(mt, resource.getName(),
debugEvent.getLocation(), rd);
ArrayList stackFrames = getStackFramesForThread(threadID);
stackFrames.clear();
stackFrames.add(sf);
// viewed stack frame.
now show the data .. Debug Flow has to stop ..
>> getThread(threadID).suspend();
smlDebugTarget.suspended(threadID,org.eclipse.debug.core.DebugEvent.BREAKPOINT);
highlights the current breakpoint in the source code.
Scenario-2 : Debugging over the web
runner = new RemoteSMLServerDebugger(vm, launch); // debug mode for remote
private void submitRequest(Request request) {
Response response = transport.publishRequestAndGetResponse(request);
if (response.getException() != null) {
Throwable ex = response.getException();
if(ex instanceof JEMSException){
throw (JEMSException)ex;
}else{
throw new RuntimeException(response.getException());
}
}
DebugEvent[] events = response.getEvents();
if (events != null) {
for (int i = 0; i < events.length; i++) {
fireDebugEvent(events[i]);
}
}
}](https://image.slidesharecdn.com/debuggingovertcpandhttp-110320183058-phpapp01/75/Debugging-over-tcp-and-http-12-2048.jpg)

![Now so far we have seen how communication is established between debug client an debug target
(local / remote) and debug events are processed both at the Client and Server side.
Next few obvious questions pop up :
1. How does break point get created upon toggle / double click ?
Toggle breakpoint Action asks the active workbench part () for its its IToggleBreakpointsTarget
adapter. The action interacts with the adapter class
SMLLineBreakpointAdapter#toggleLineBreakpoints(IWorkbenchPart part, ISelection selection)
The editor gets a call back for decorating.
SMLDebugModelPresentation provides labels and images for breakpoint.
BreakPoint Dialog allows user to modify properties.
IBreakpoint stores the information required to install a breakpoint in a specific type of debugger :
For example,
In case of a language debugger, a line breakpoint stores a fully qualified type name and line
number.
In case of a graphical debugger, a figure breakpoint will store corresponding diagram model element
uri and its location.
IDebugTarget Listens for breakpoints being added/removed/changed during its lifecycle, and
updates them in the underlying runtime
Slide 87 of Debug_Platform_The_Basics
2. How to locate the code for a selected frame ?
Slides 91-105 of Debug_Platform_The_Basics
3. How to enable source highlighting for non-textual editor ?
Graphical Editors should implement IDebugEditorPresentation.
Debugger will send add/remove annotation events based on which editor will highlight the diagram
elements.
4. How to display custom variable view an watch expression ?
slide 127 of Debug_Platform_The_Basics
Eclipse Debug UI Utilities interact with the Standard Debug Model.
Debug Model Elements – represent the program being debugged which has the capabilities to step,
resume and terminate.
DebugPlugin.fireDebugEventSet(DebugEvent[] events)
DebugPlugin.addDebugEventListener(IDebugEventSetListener listener)
EventListner listens to the debug events and then accordingly refreshes the UI.](https://image.slidesharecdn.com/debuggingovertcpandhttp-110320183058-phpapp01/75/Debugging-over-tcp-and-http-14-2048.jpg)


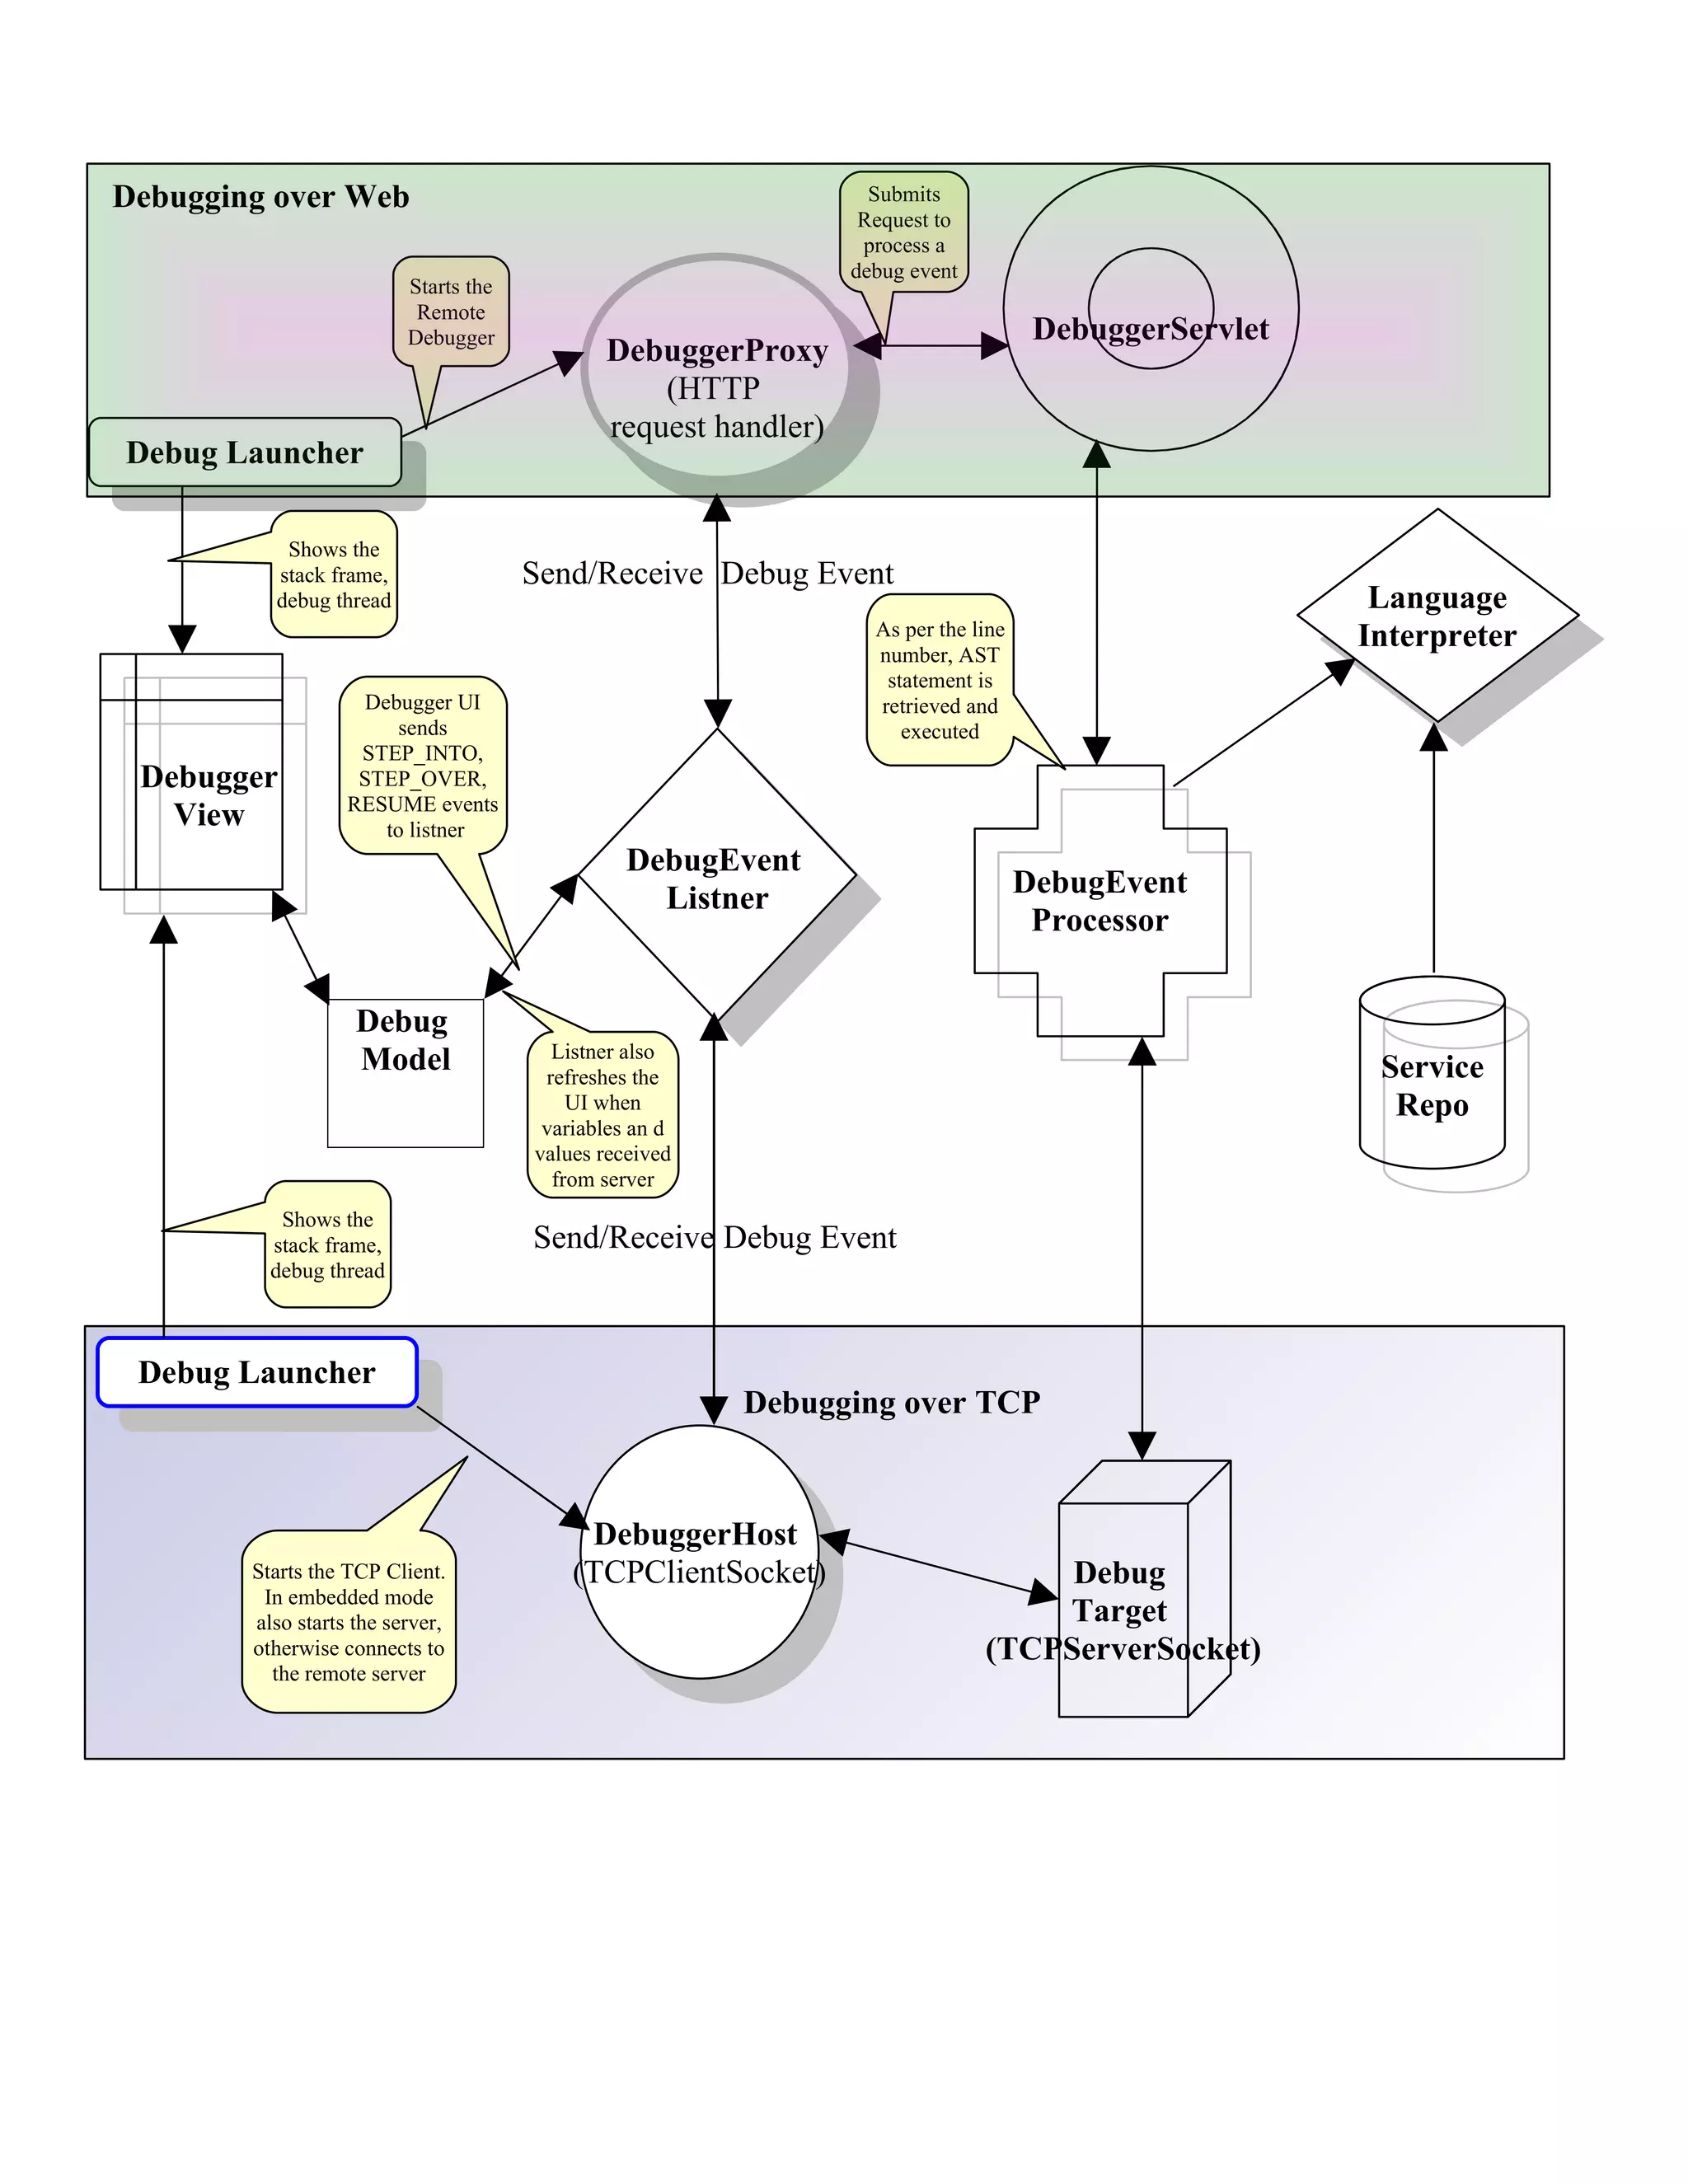
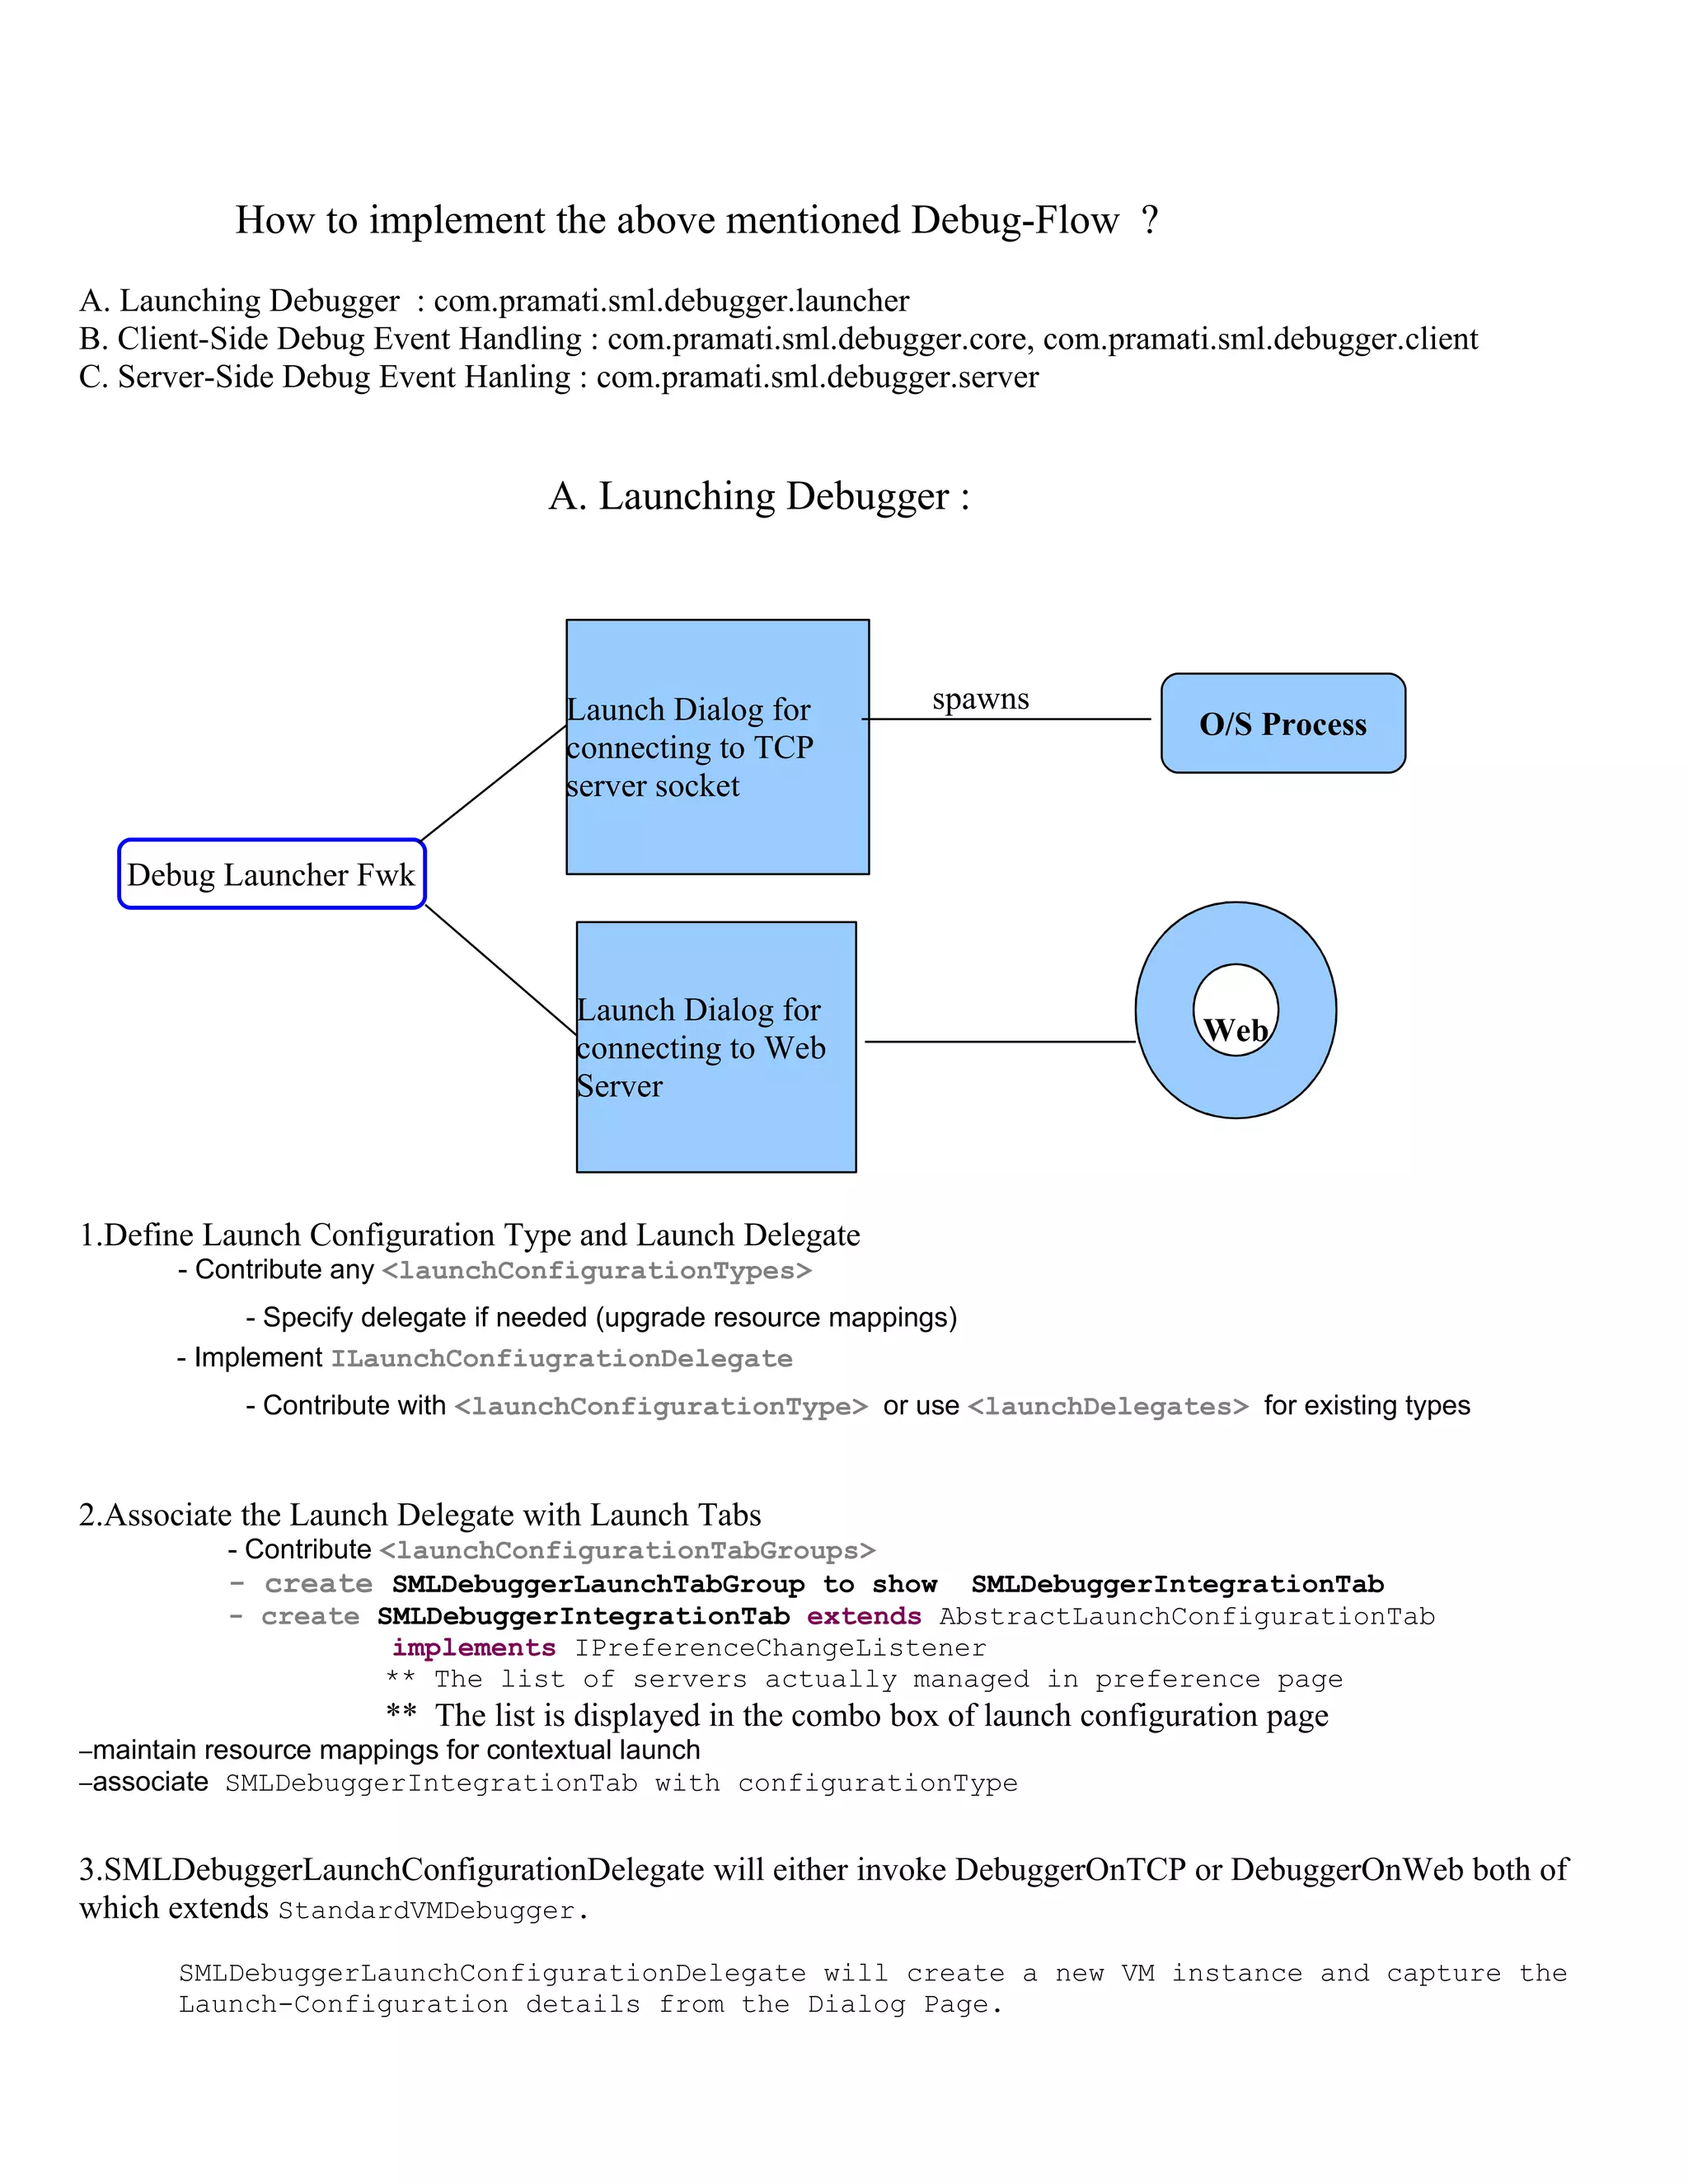
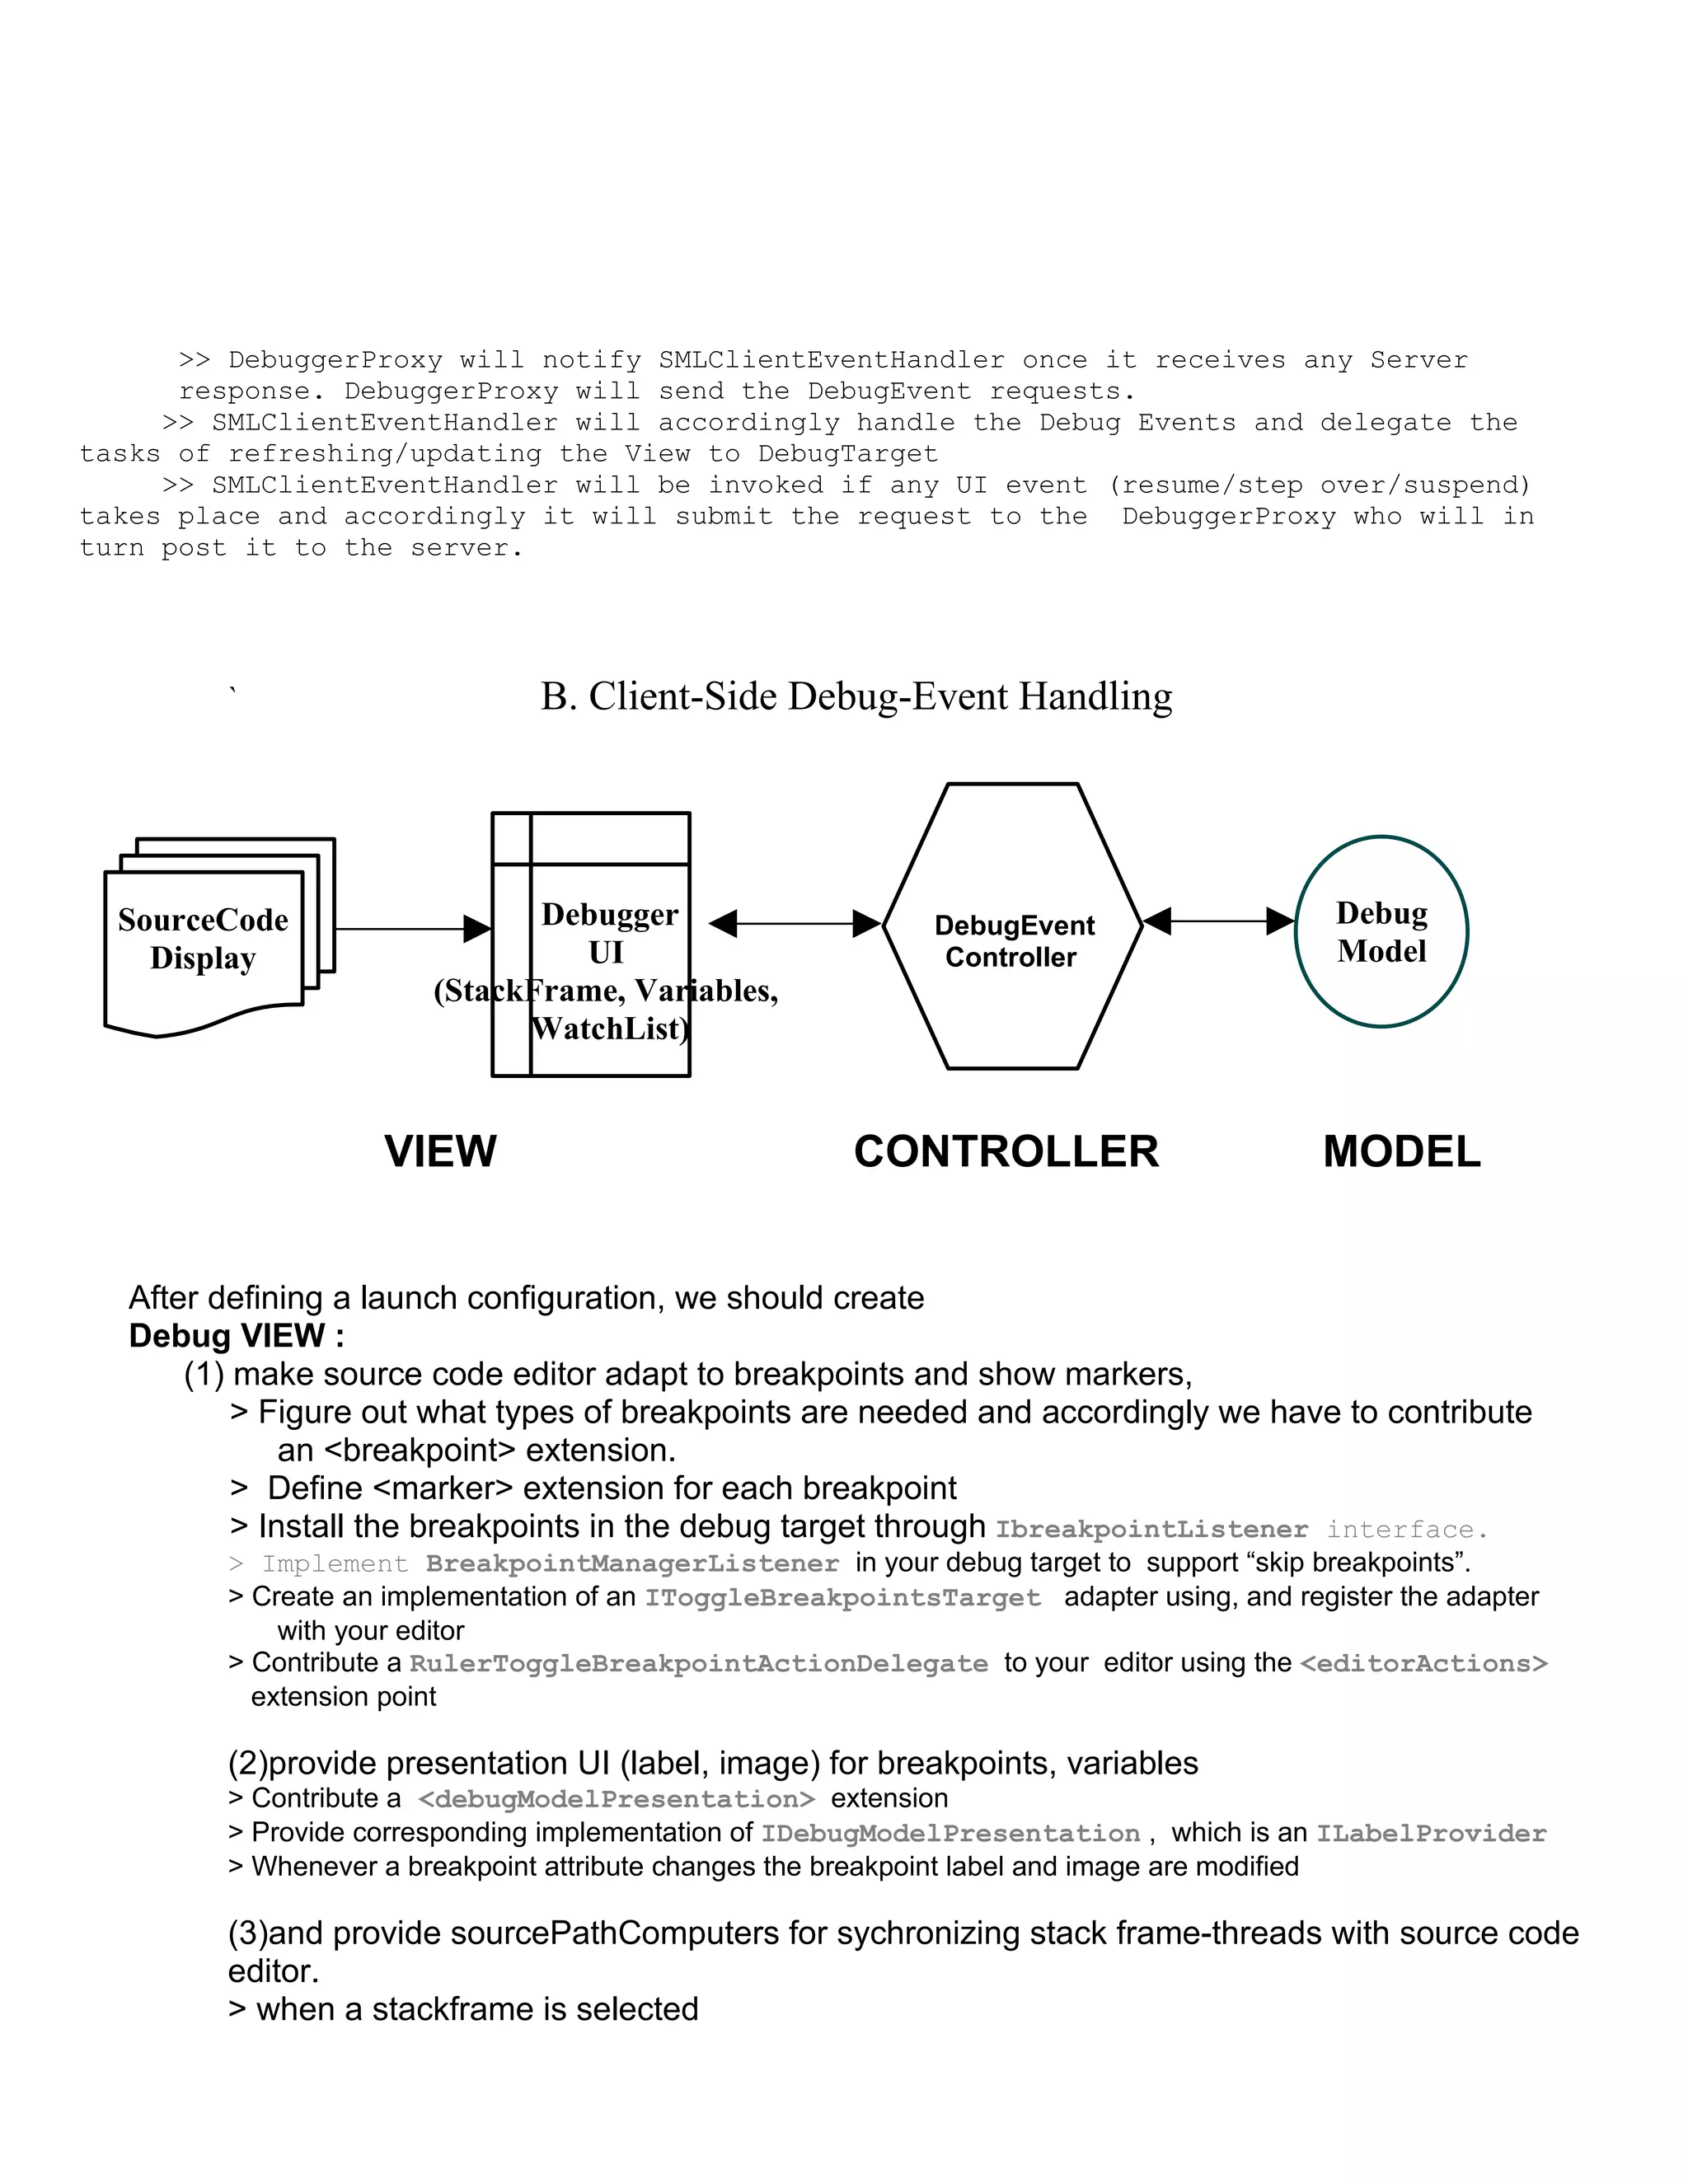
The document describes how to create a debugger framework over TCP/IP and HTTP. It discusses launching a debugger, handling debug events on the client and server sides, and processing debug events using a language interpreter. The debugger architecture involves a debug launcher, debug view, debug event listener, and debug event processor. The debug launcher starts the debugger and establishes communication with the remote debug target. The debug view handles UI elements like stack frames. The listener handles events like breakpoints, and the processor uses the language interpreter and AST utilities to generate debug responses.


