Downloaded 19 times


![S E T T I N G U P X D E B U G
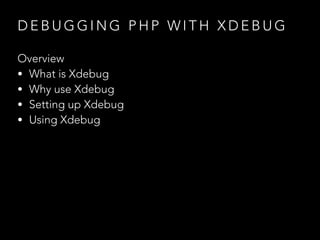
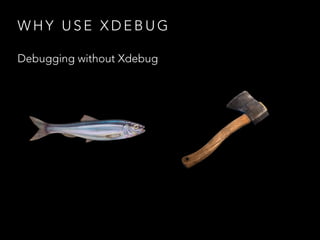
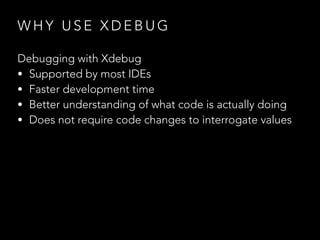
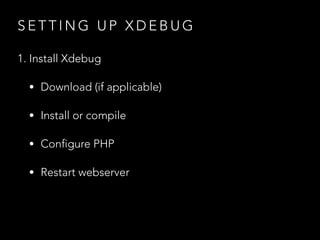
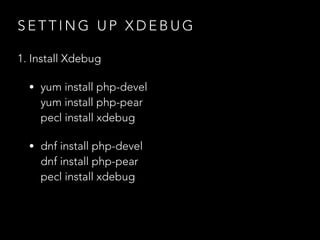
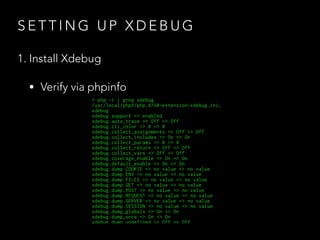
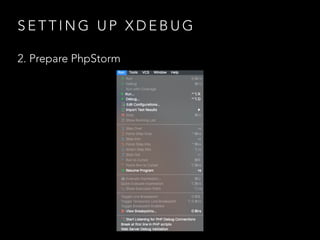
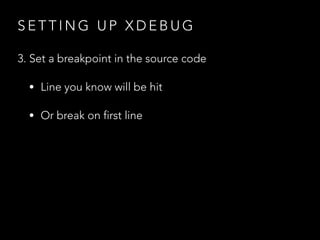
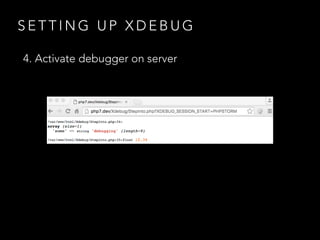
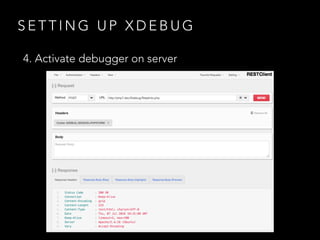
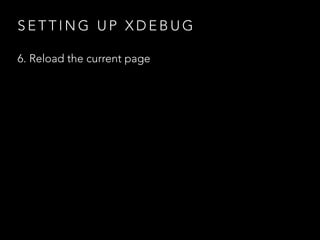
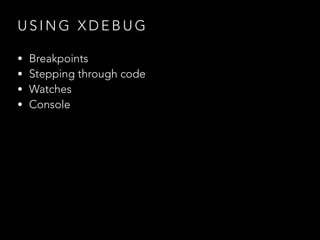
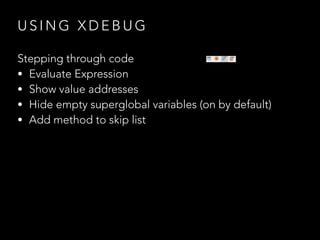
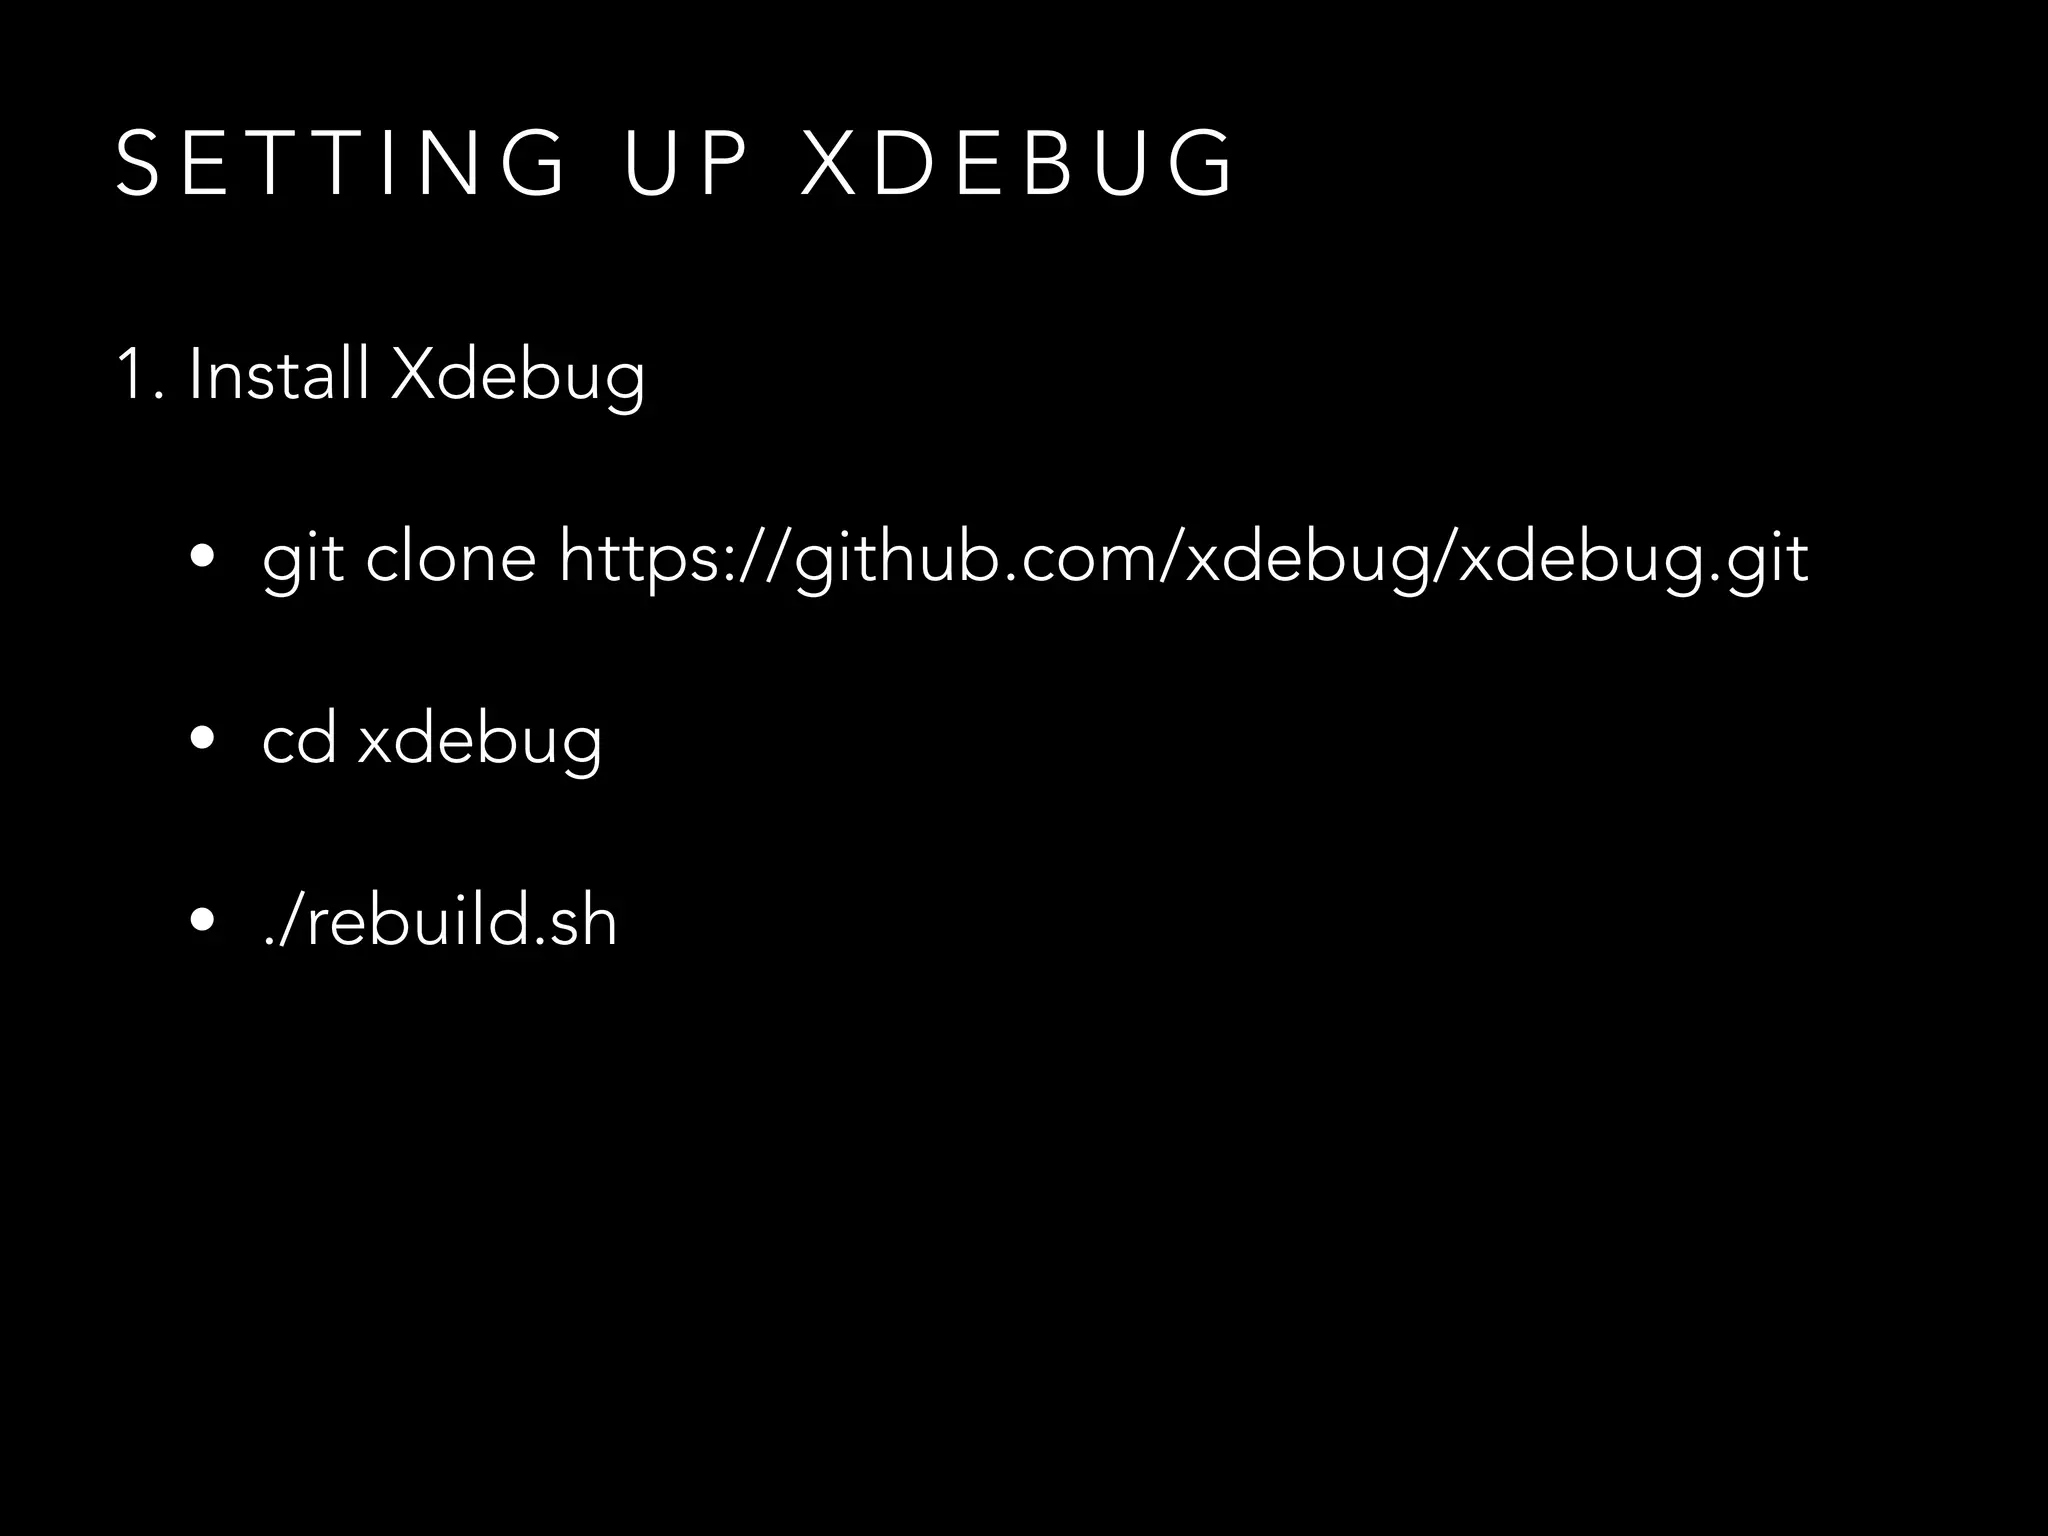
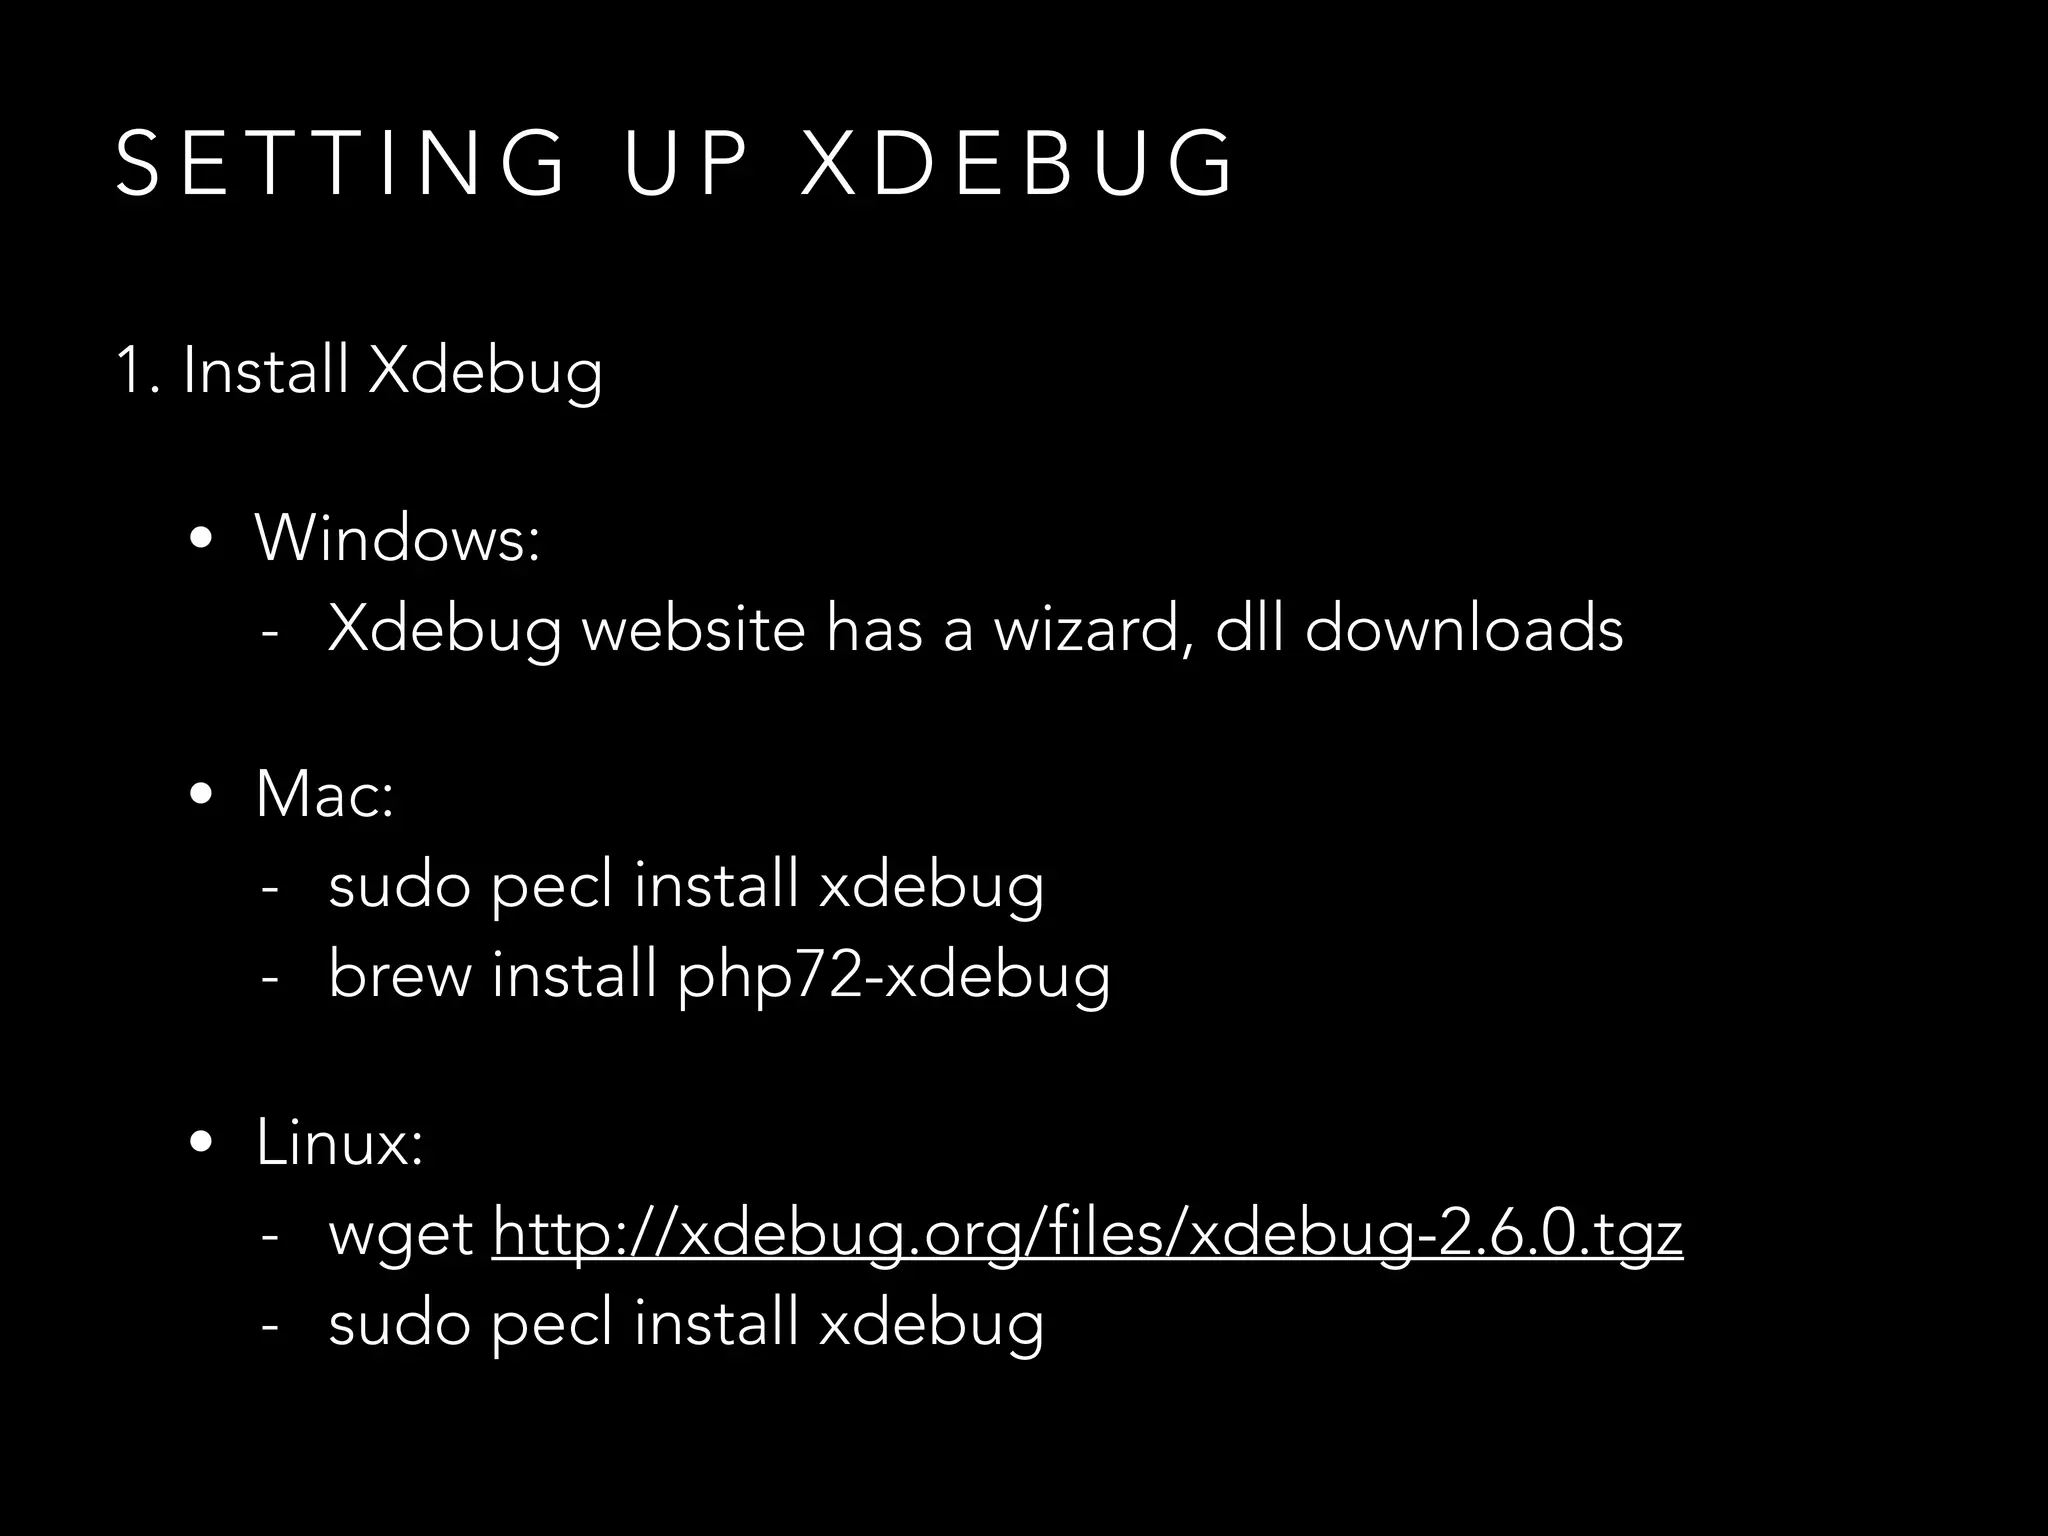
1. Install Xdebug
• Update php.ini by adding lines:
zend_extension = php_xdebug-2.6.0-7.2-vc15-nts-x86_64.dll
[xdebug]
xdebug.remote_enable = 1
xdebug.remote_autostart = 1
xdebug.remote_port = 9000
xdebug.remote_host = localhost
xdebug.idekey = PHPSTORM](https://image.slidesharecdn.com/debuggingphpwithxdebug-phpuk-180214231203/85/Debugging-PHP-with-Xdebug-PHPUK-2018-32-320.jpg)
![S E T T I N G U P X D E B U G
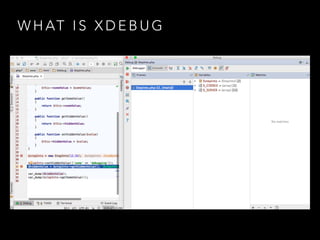
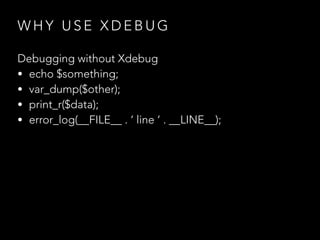
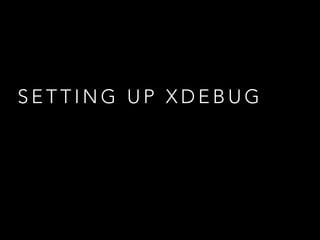
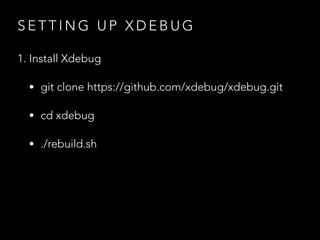
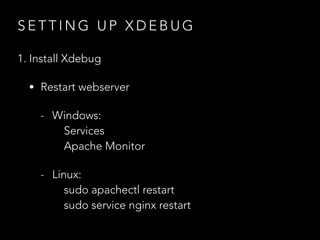
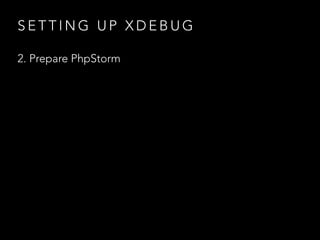
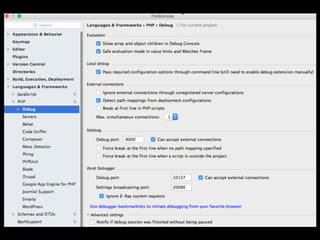
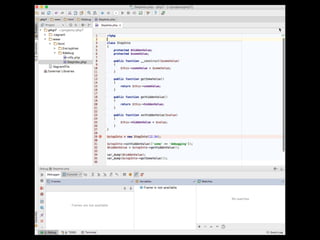
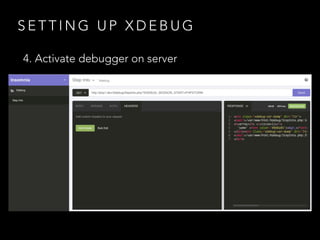
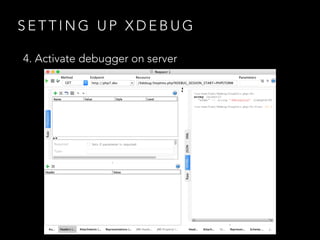
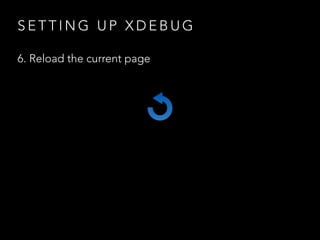
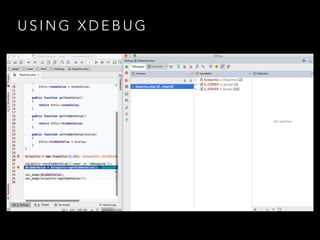
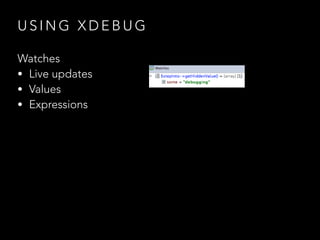
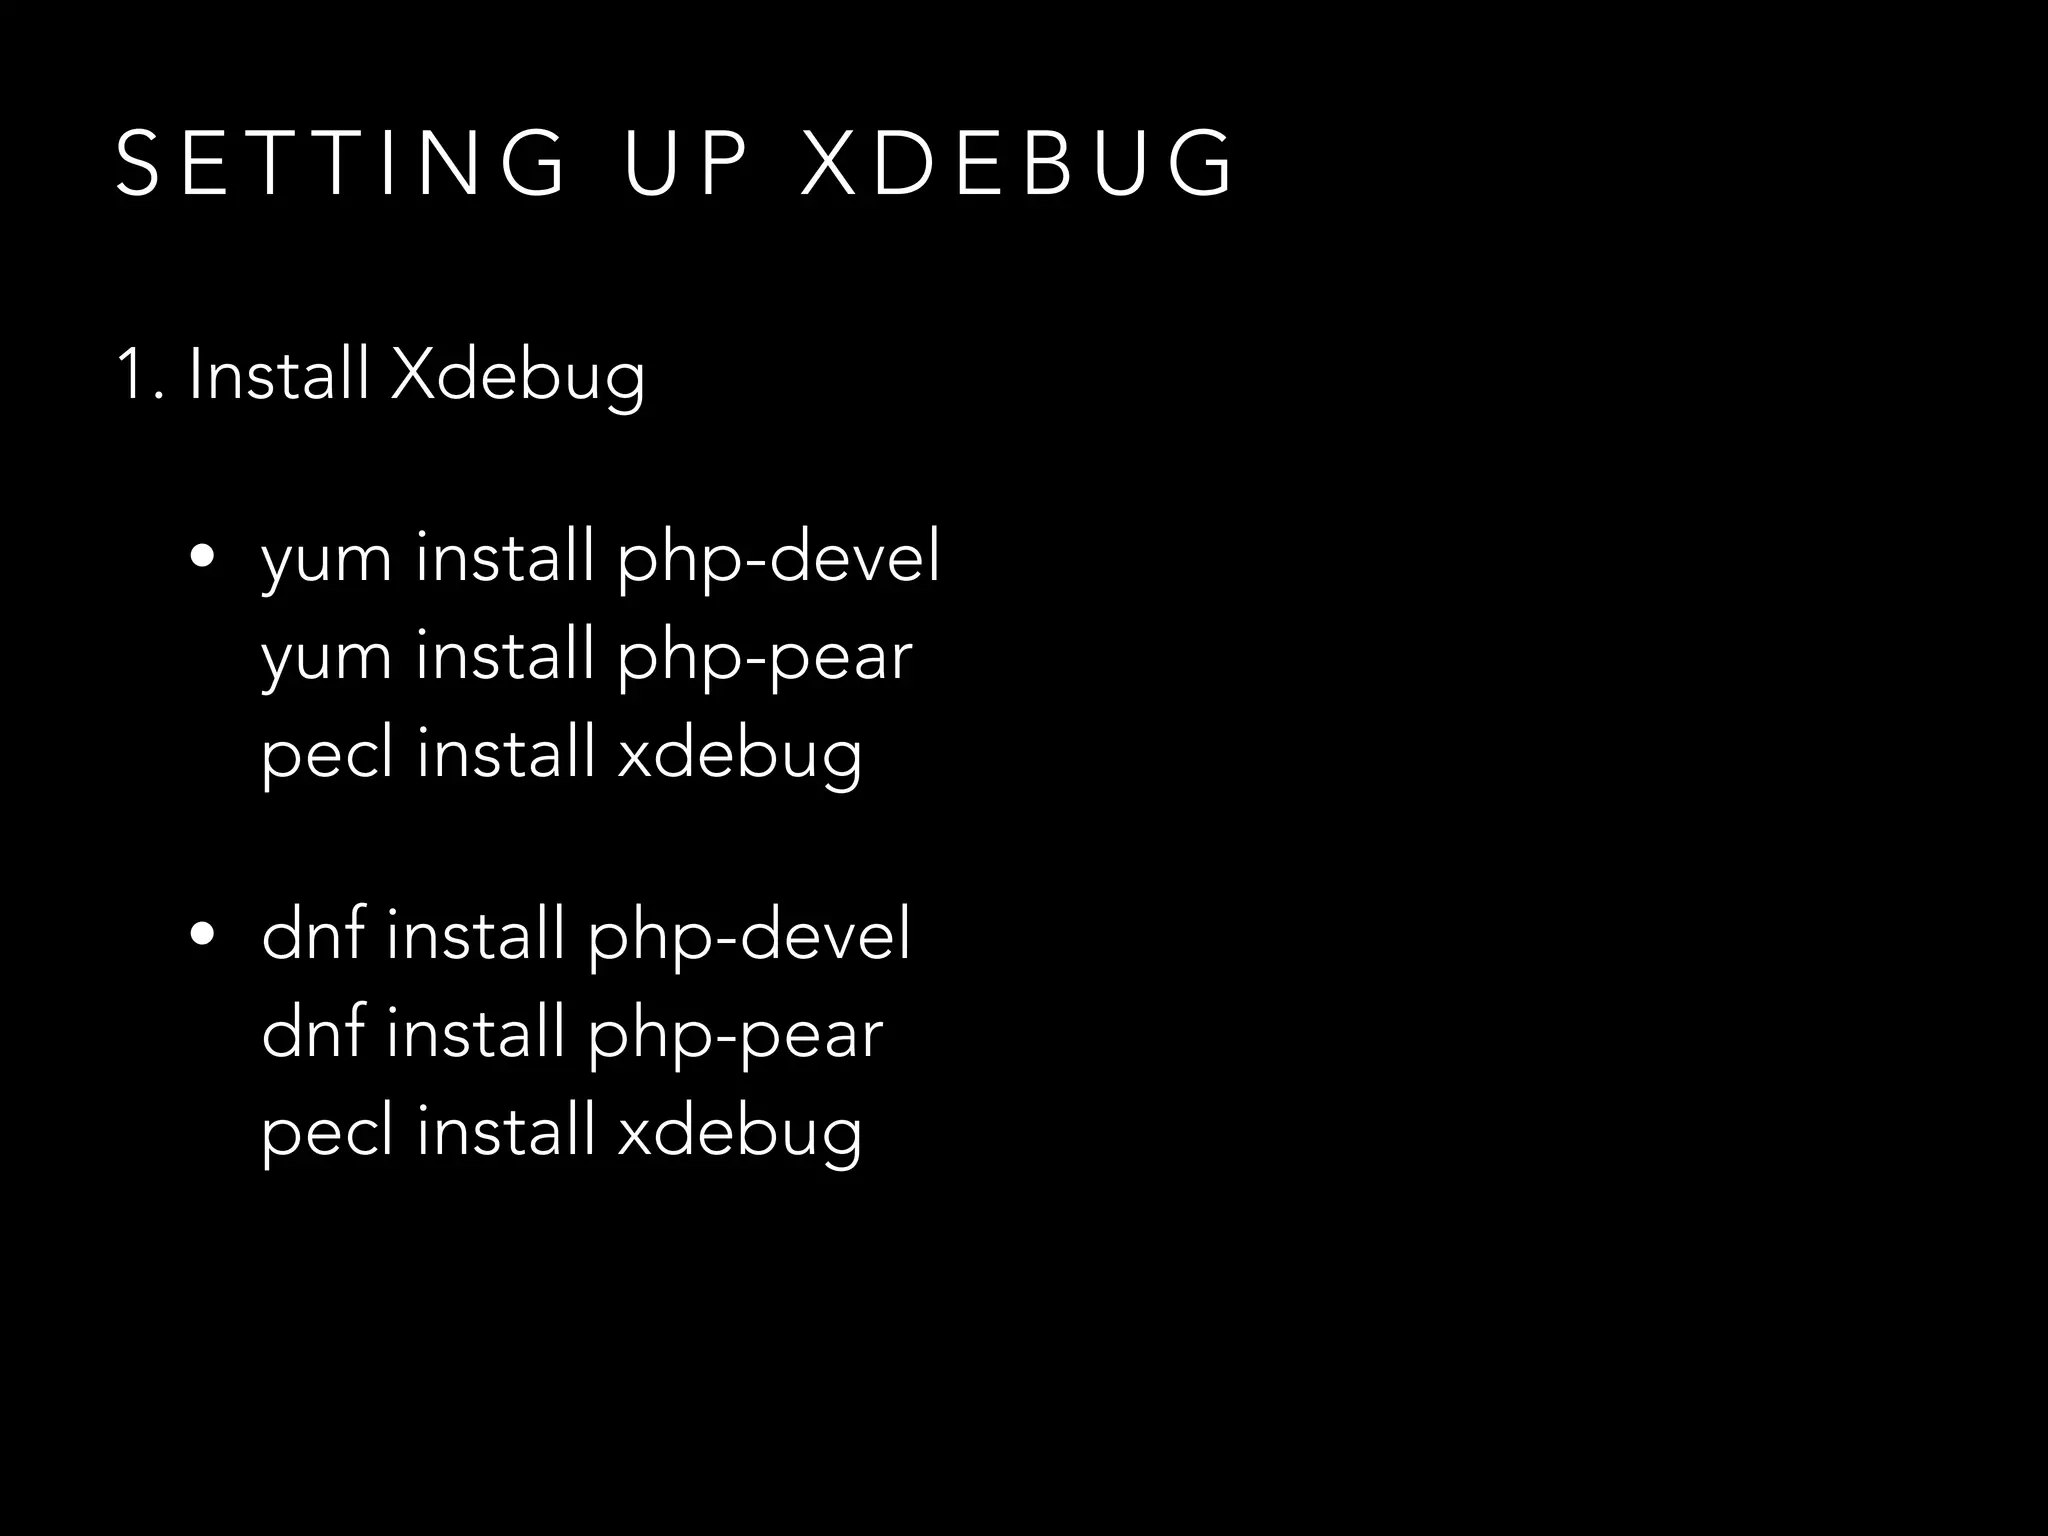
1. Install Xdebug
• Update php.ini by adding lines:
zend_extension = /usr/lib64/php/modules/xdebug.so
[xdebug]
xdebug.remote_enable = 1
xdebug.remote_autostart = 1
xdebug.remote_port = 9000
xdebug.remote_host = localhost
xdebug.idekey = PHPSTORM](https://image.slidesharecdn.com/debuggingphpwithxdebug-phpuk-180214231203/85/Debugging-PHP-with-Xdebug-PHPUK-2018-33-320.jpg)
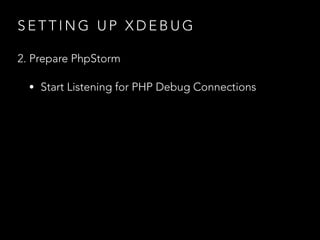


![S O U R C E S
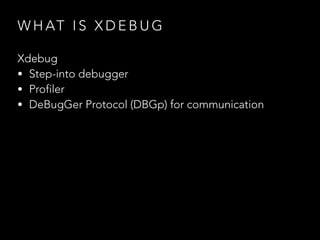
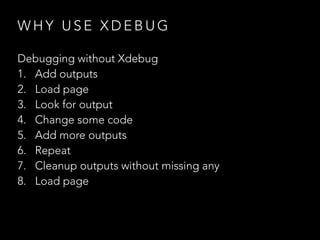
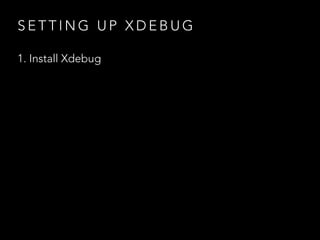
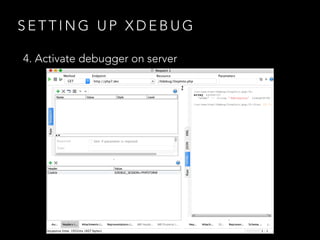
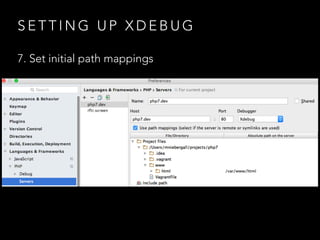
• JetBrains documentation https://confluence.jetbrains.com/display/PhpStorm/Zero-
configuration+Web+Application+Debugging+with+Xdebug+and+PhpStorm
• Xdebug documentation https://xdebug.org/docs/install
• David Stockton, php[architect], January 2015, https://www.phparch.com/wp-
content/uploads/2015/01/levelup-xdebug-phparchitect-jan2015.pdf
• https://sievertschreiber.files.wordpress.com/2010/04/crane-truck-double-fail.jpg](https://image.slidesharecdn.com/debuggingphpwithxdebug-phpuk-180214231203/85/Debugging-PHP-with-Xdebug-PHPUK-2018-87-320.jpg)


![S E T T I N G U P X D E B U G
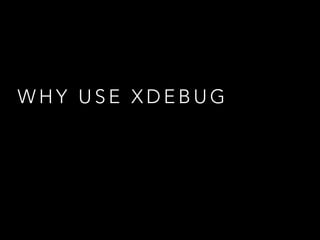
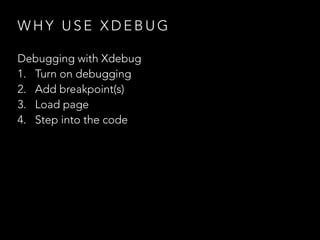
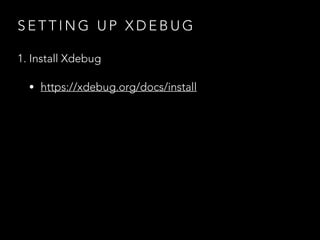
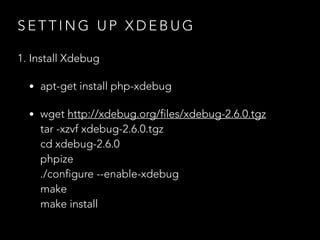
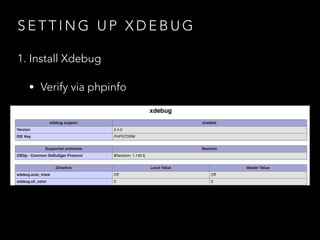
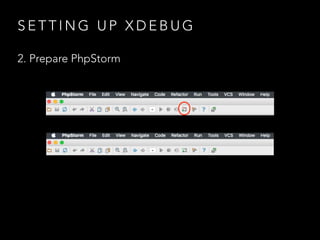
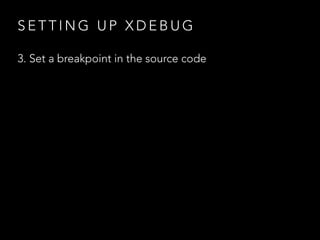
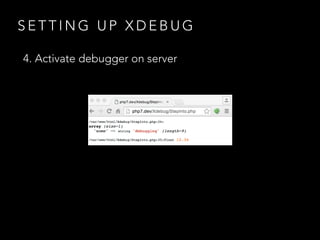
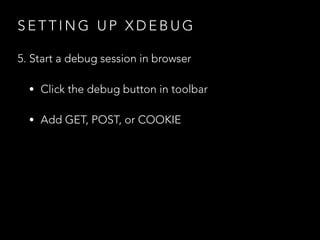
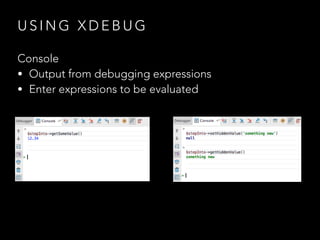
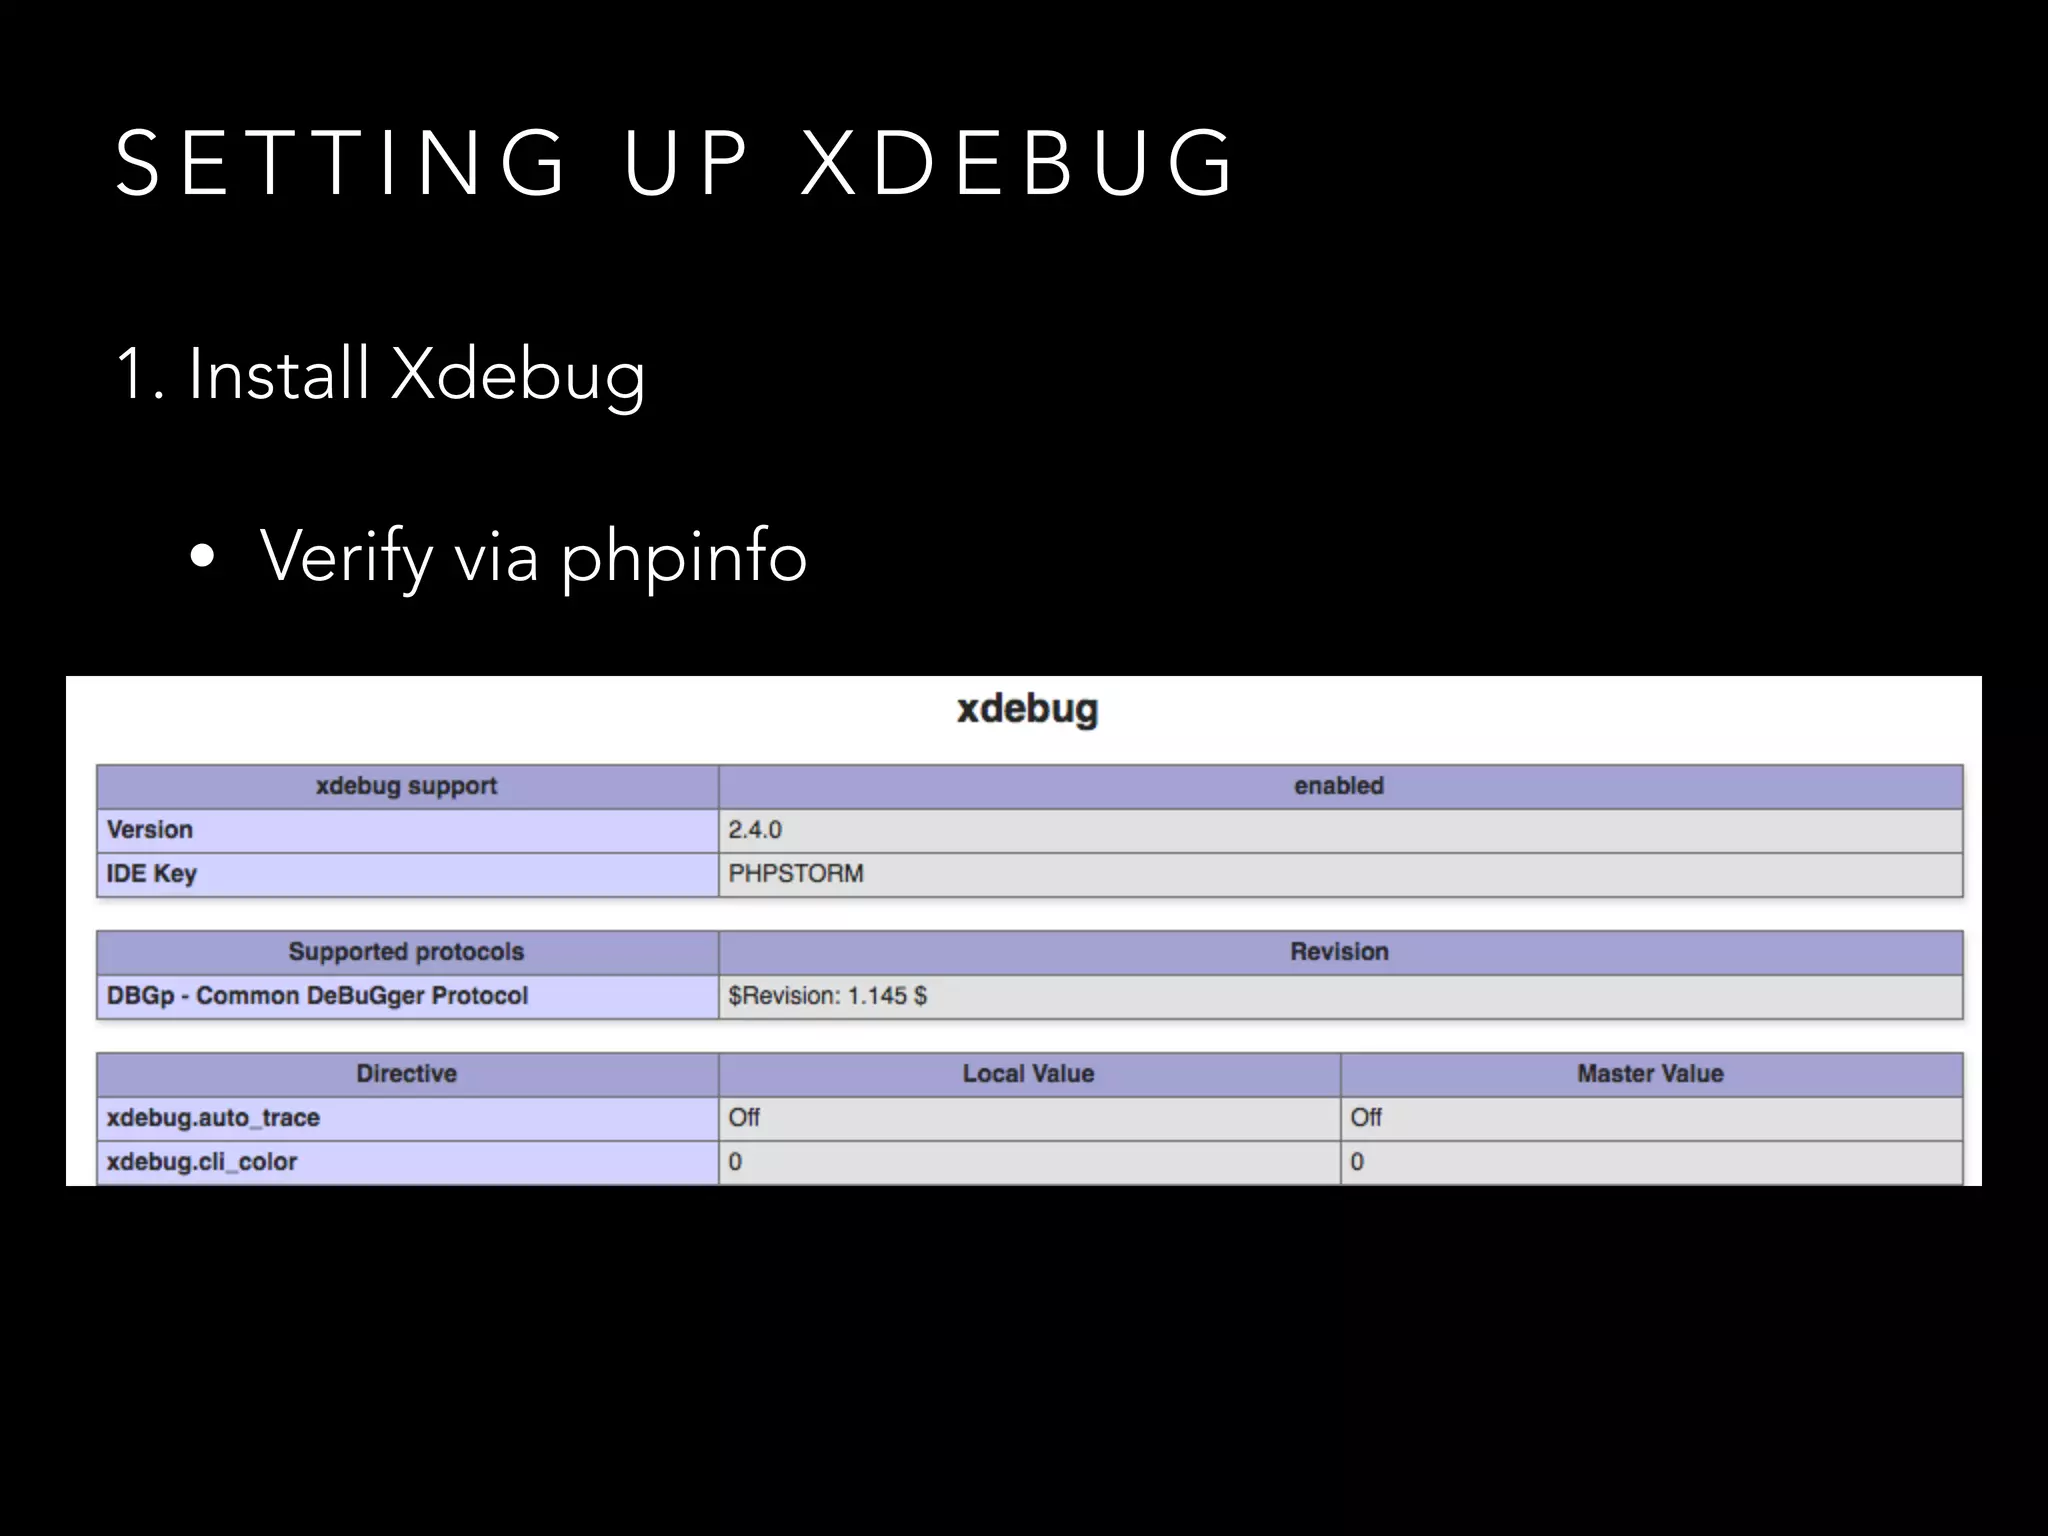
1. Install Xdebug
• Update php.ini by adding lines:
zend_extension = php_xdebug-2.6.0-7.2-vc15-nts-x86_64.dll
[xdebug]
xdebug.remote_enable = 1
xdebug.remote_autostart = 1
xdebug.remote_port = 9000
xdebug.remote_host = localhost
xdebug.idekey = PHPSTORM](https://image.slidesharecdn.com/debuggingphpwithxdebug-phpuk-180214231203/75/Debugging-PHP-with-Xdebug-PHPUK-2018-32-2048.jpg)
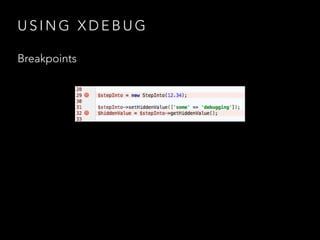
![S E T T I N G U P X D E B U G
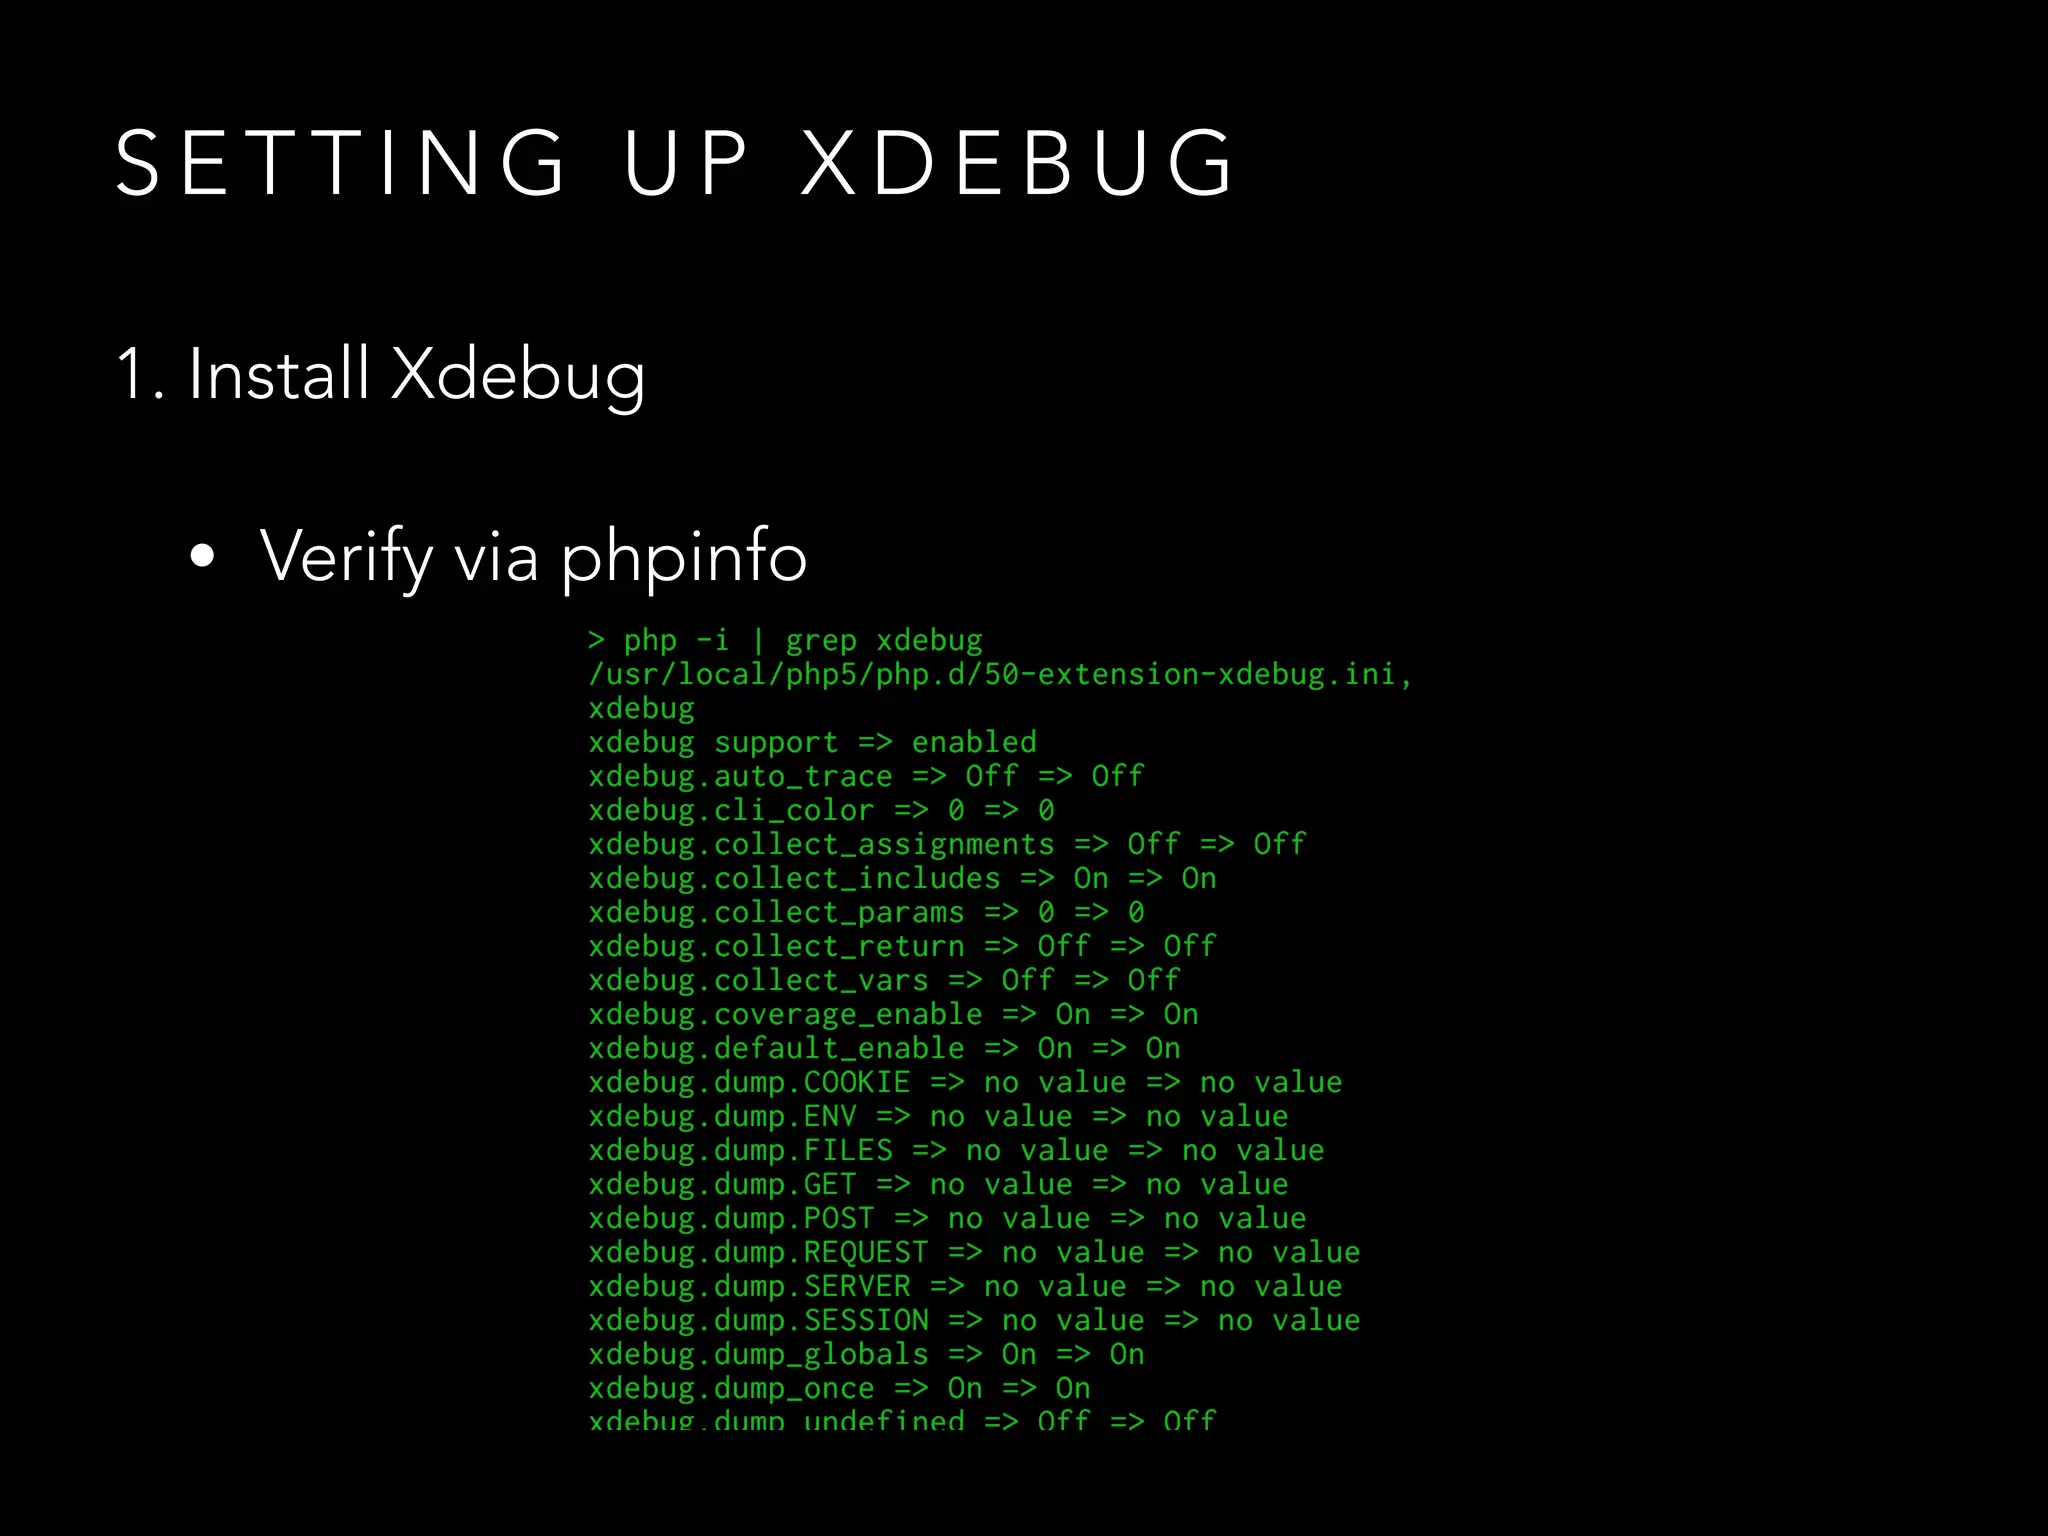
1. Install Xdebug
• Update php.ini by adding lines:
zend_extension = /usr/lib64/php/modules/xdebug.so
[xdebug]
xdebug.remote_enable = 1
xdebug.remote_autostart = 1
xdebug.remote_port = 9000
xdebug.remote_host = localhost
xdebug.idekey = PHPSTORM](https://image.slidesharecdn.com/debuggingphpwithxdebug-phpuk-180214231203/75/Debugging-PHP-with-Xdebug-PHPUK-2018-33-2048.jpg)


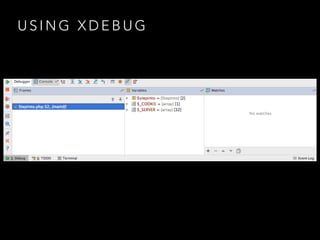
![S O U R C E S
• JetBrains documentation https://confluence.jetbrains.com/display/PhpStorm/Zero-
configuration+Web+Application+Debugging+with+Xdebug+and+PhpStorm
• Xdebug documentation https://xdebug.org/docs/install
• David Stockton, php[architect], January 2015, https://www.phparch.com/wp-
content/uploads/2015/01/levelup-xdebug-phparchitect-jan2015.pdf
• https://sievertschreiber.files.wordpress.com/2010/04/crane-truck-double-fail.jpg](https://image.slidesharecdn.com/debuggingphpwithxdebug-phpuk-180214231203/75/Debugging-PHP-with-Xdebug-PHPUK-2018-87-2048.jpg)

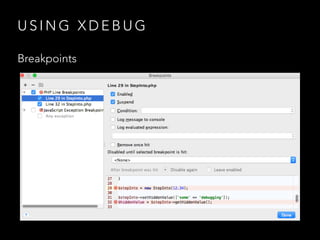
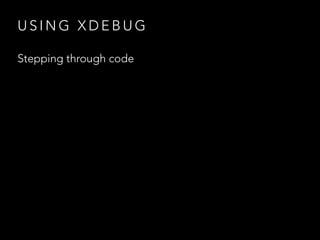
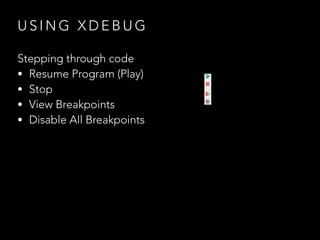
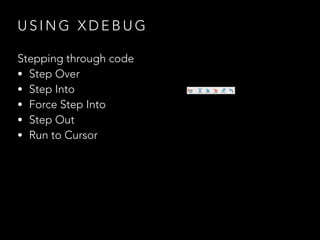
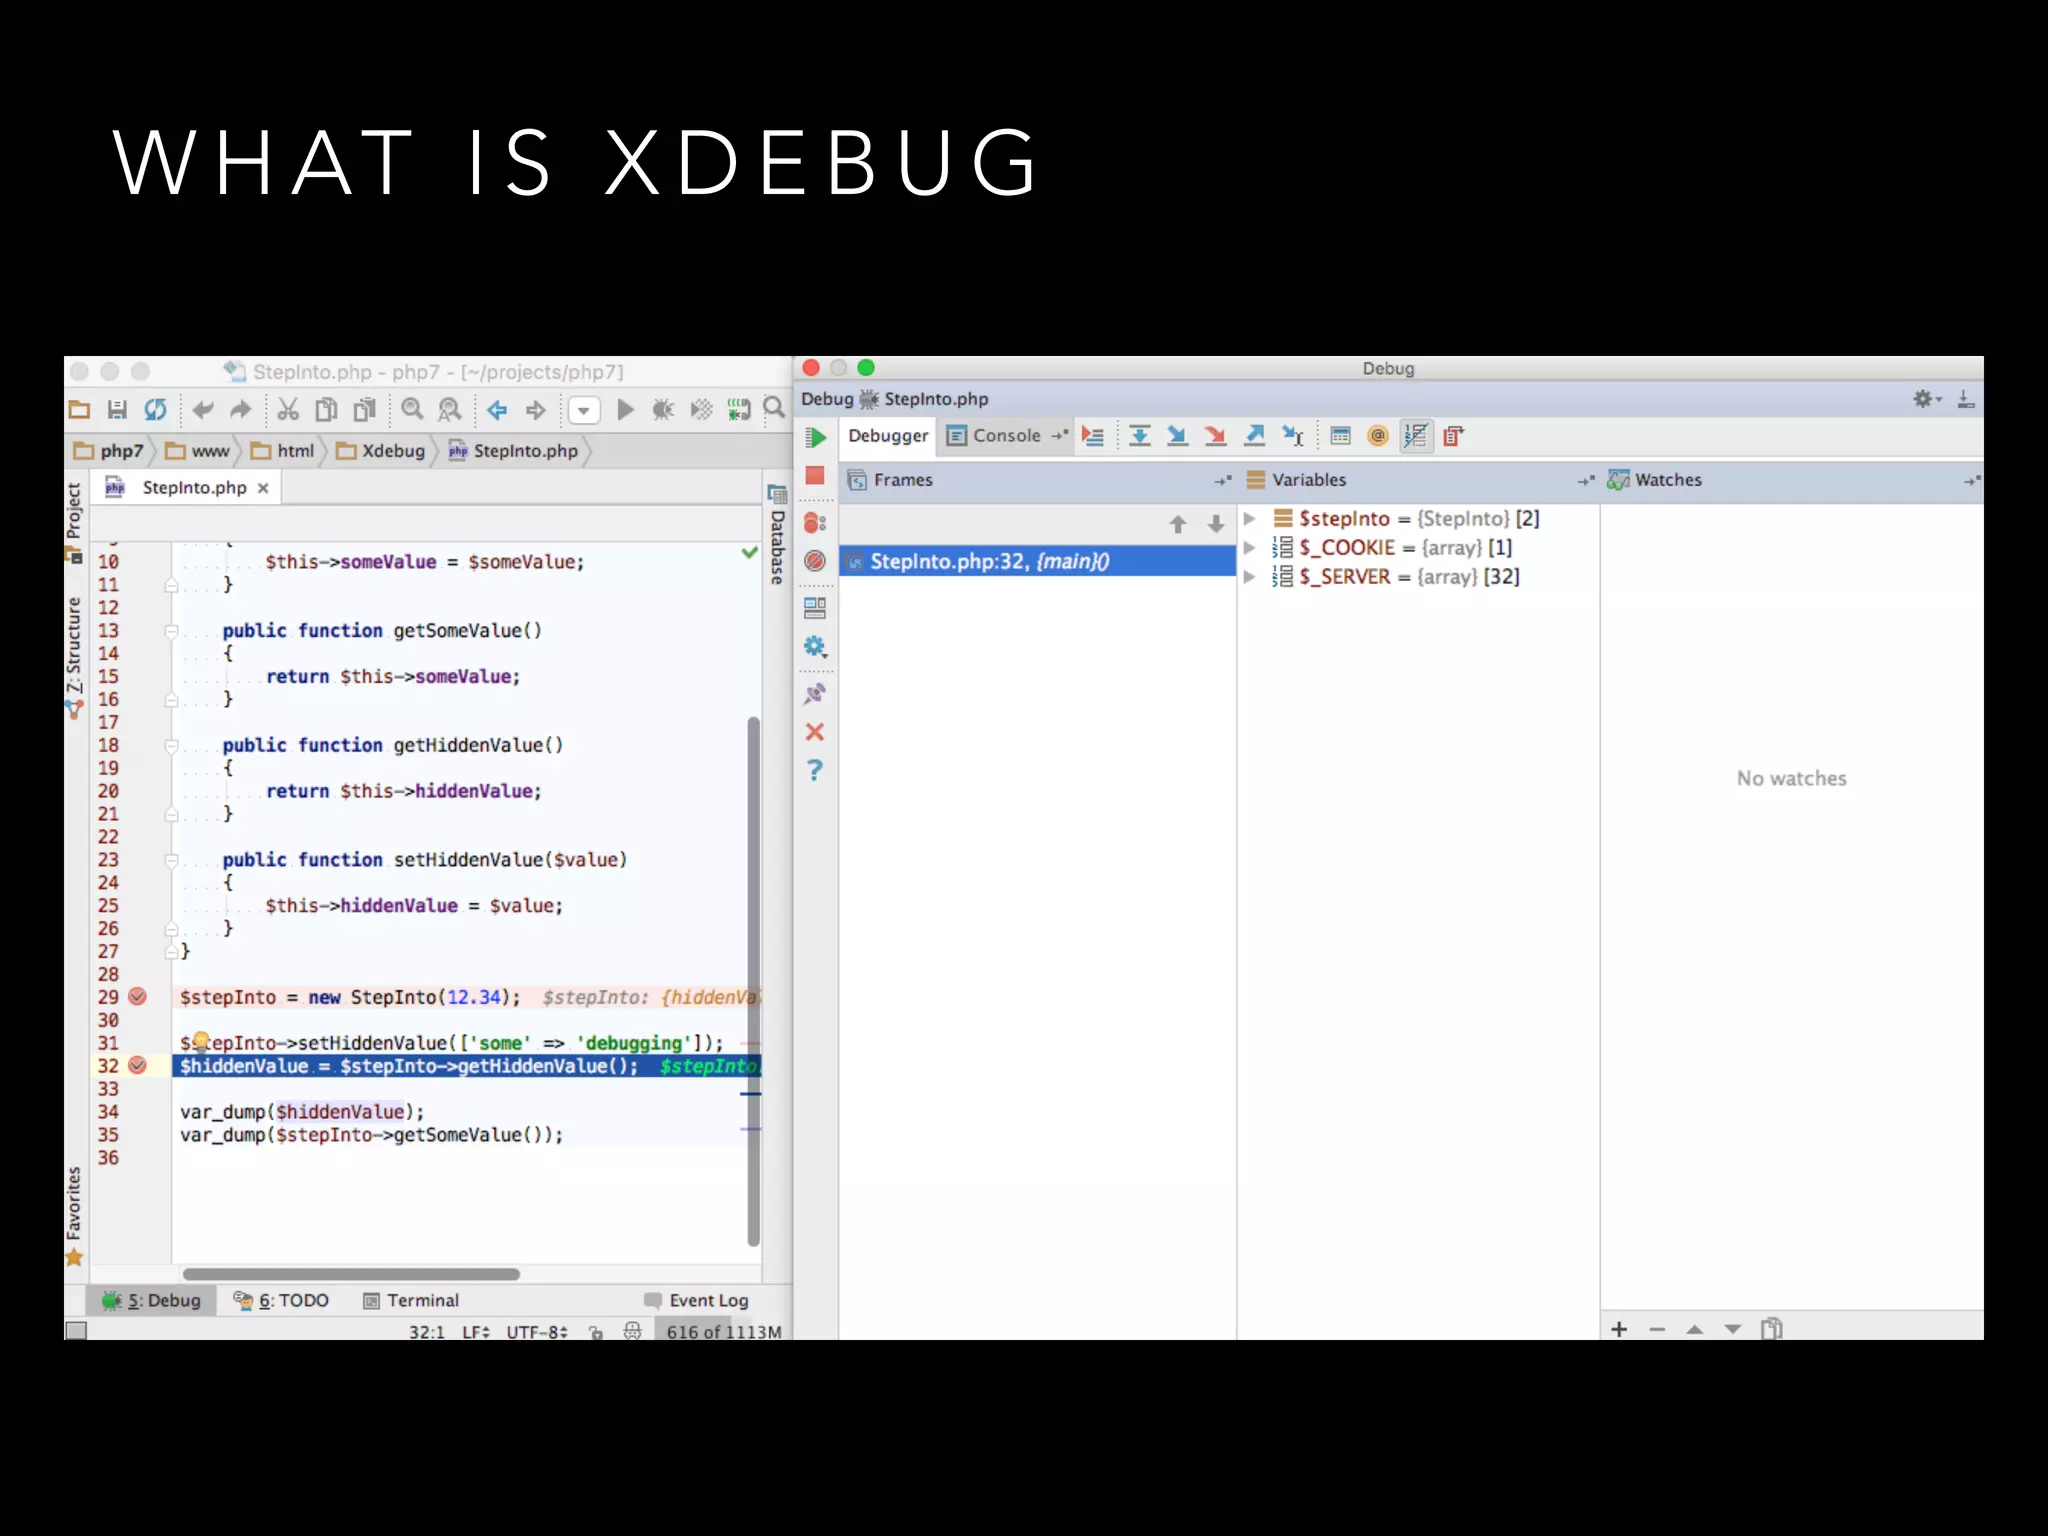
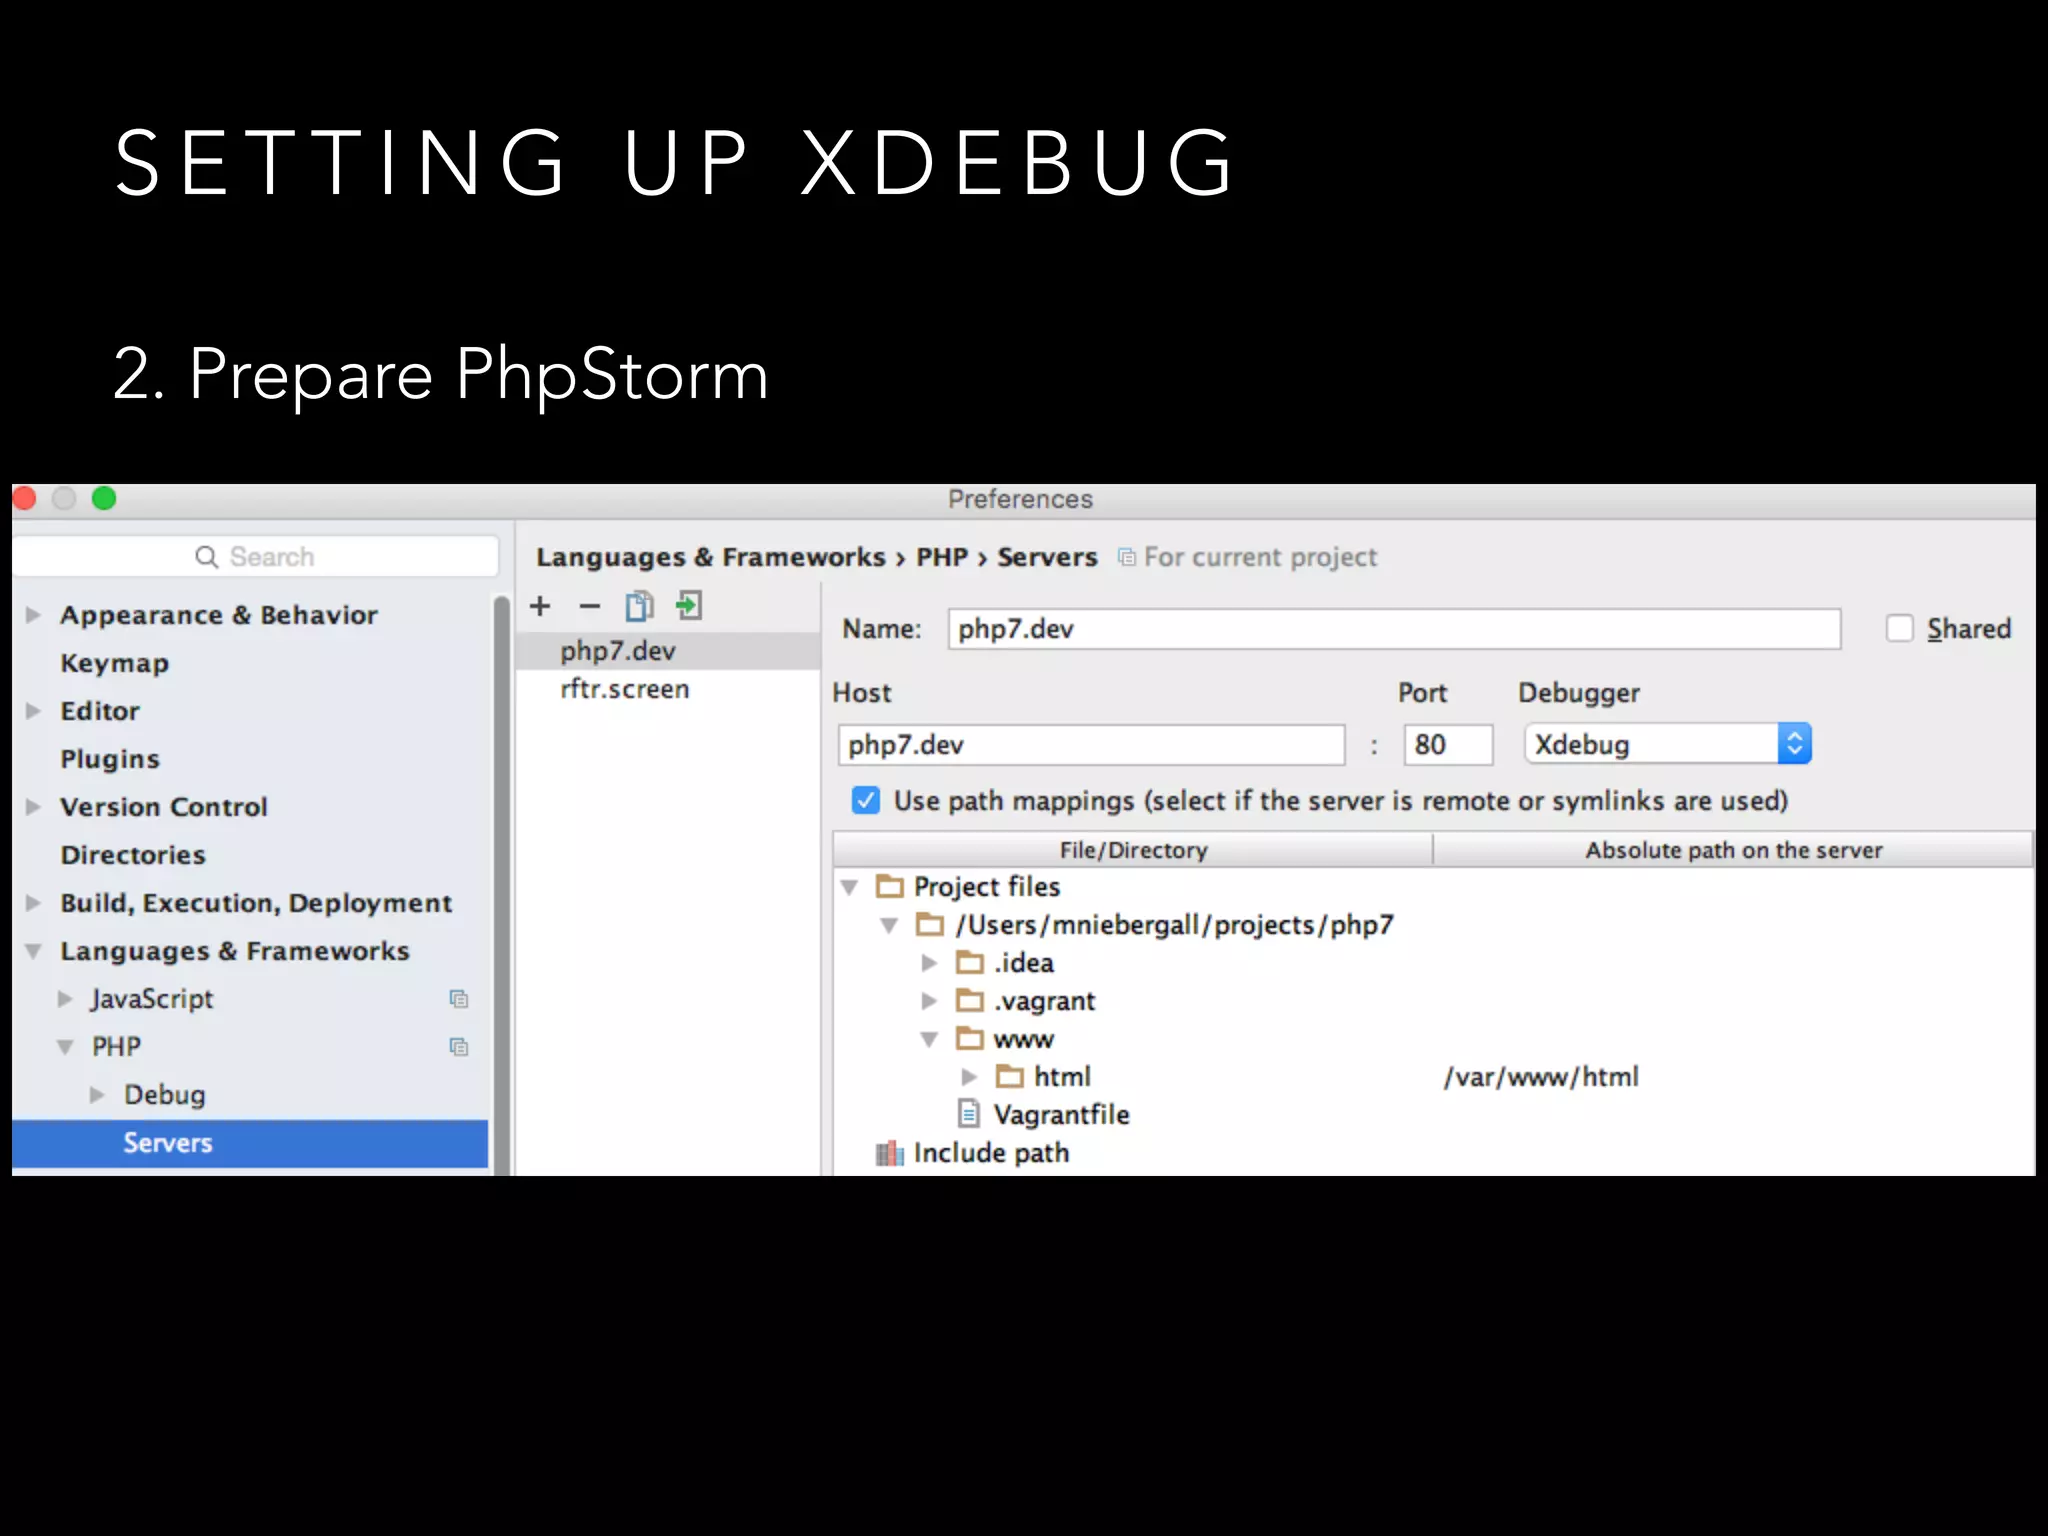
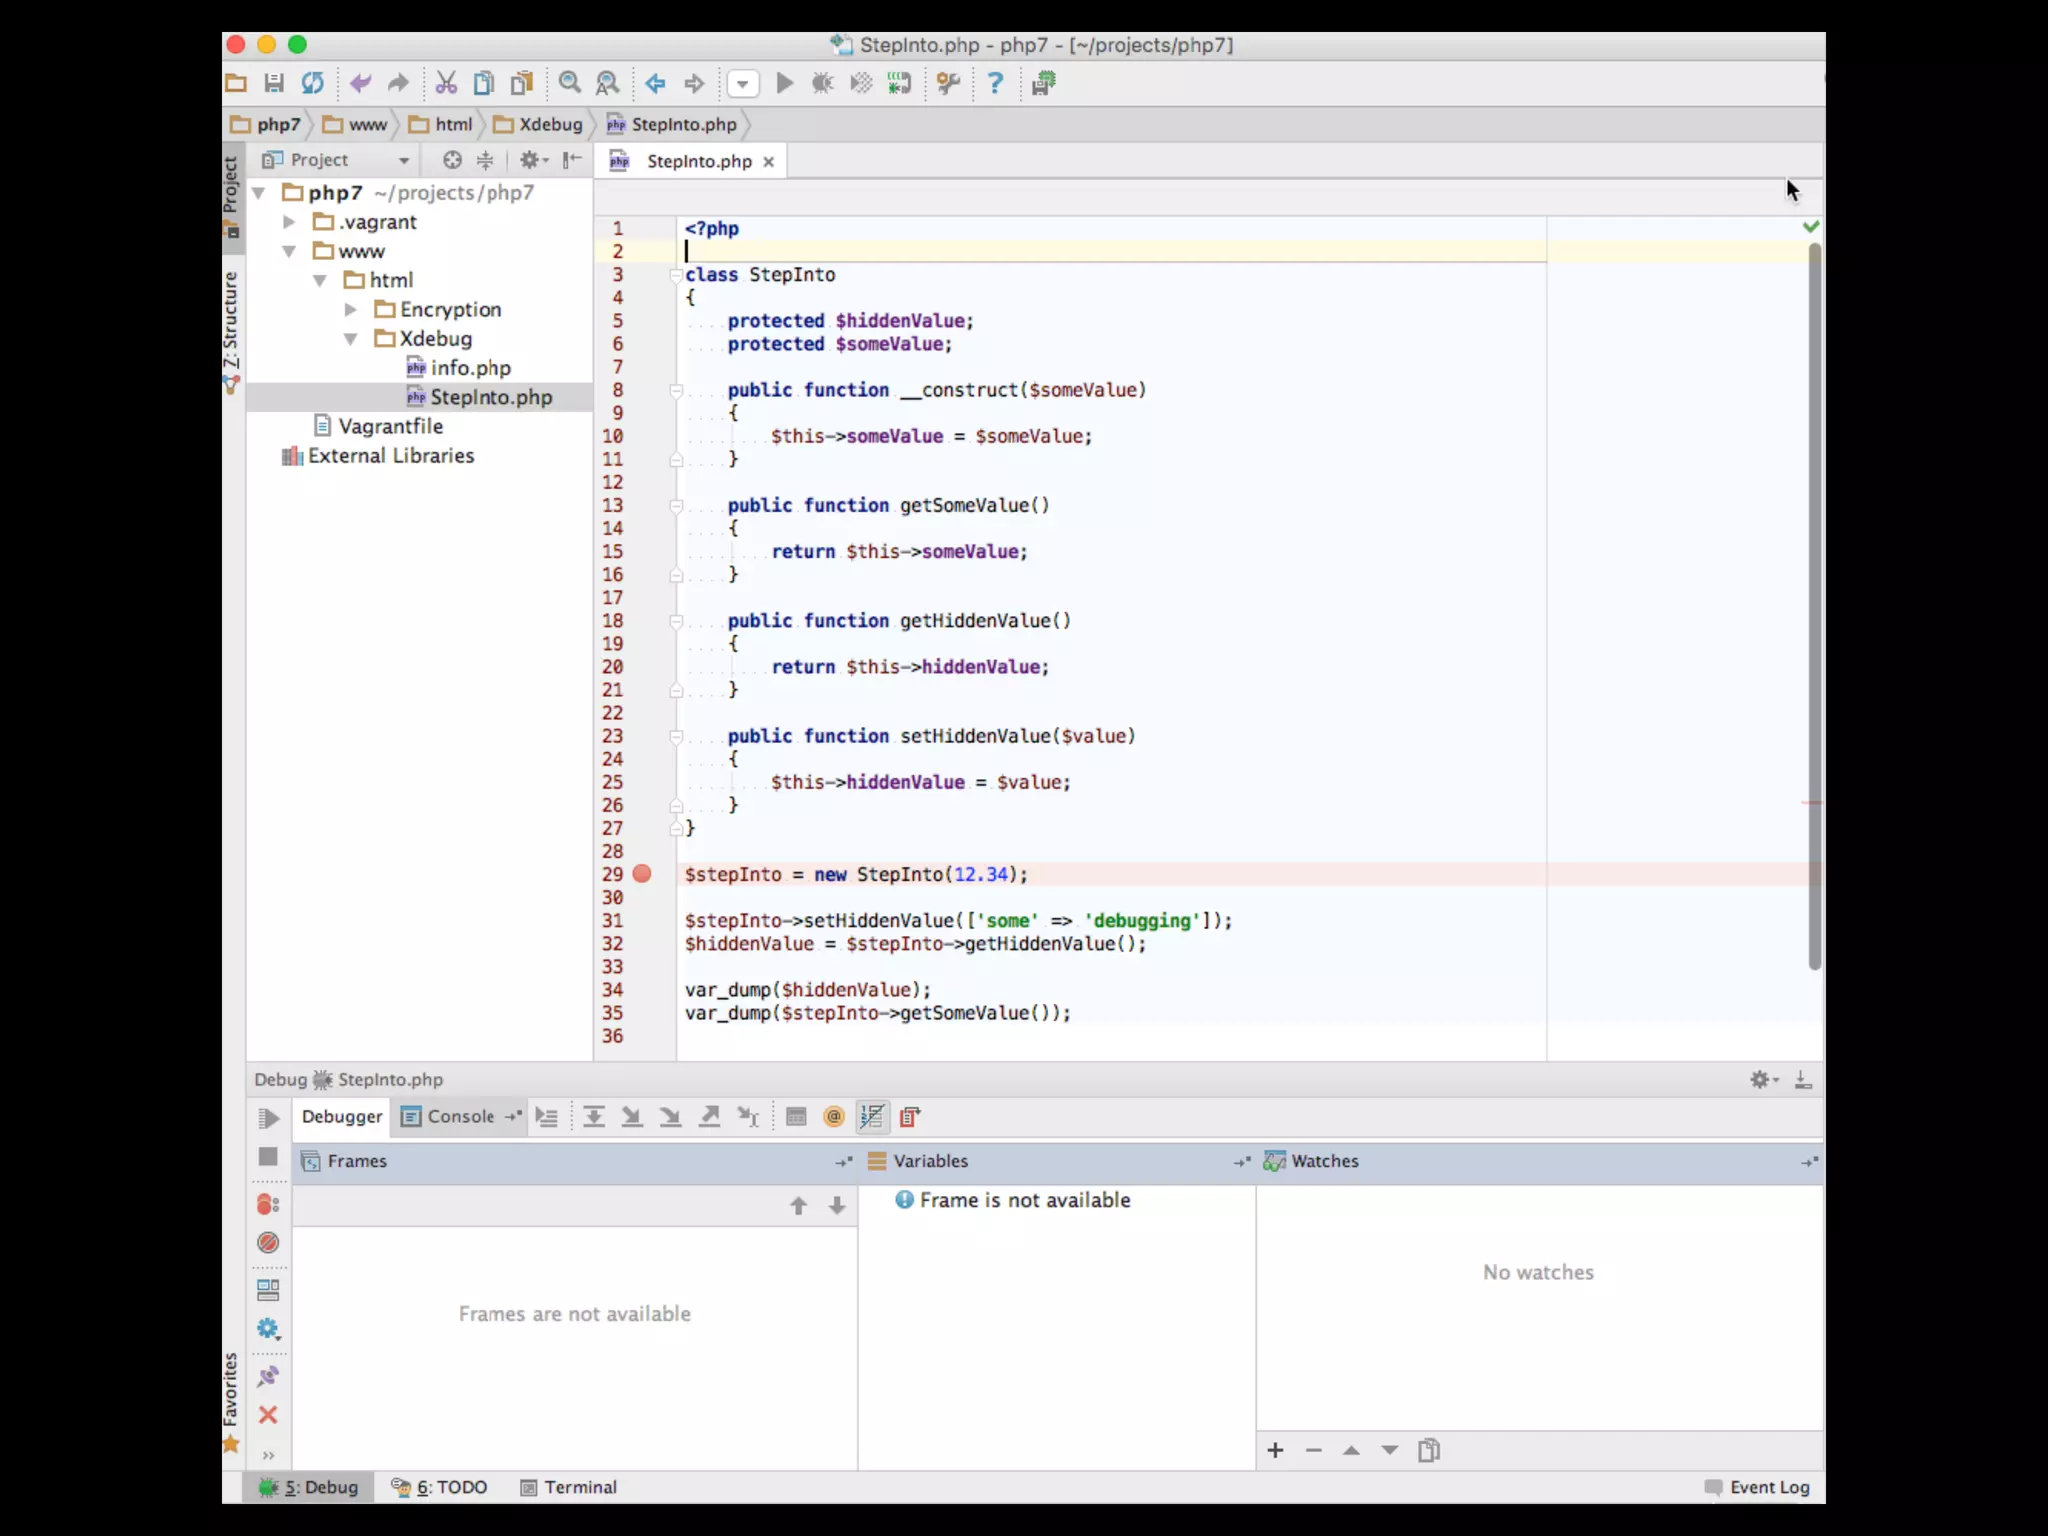
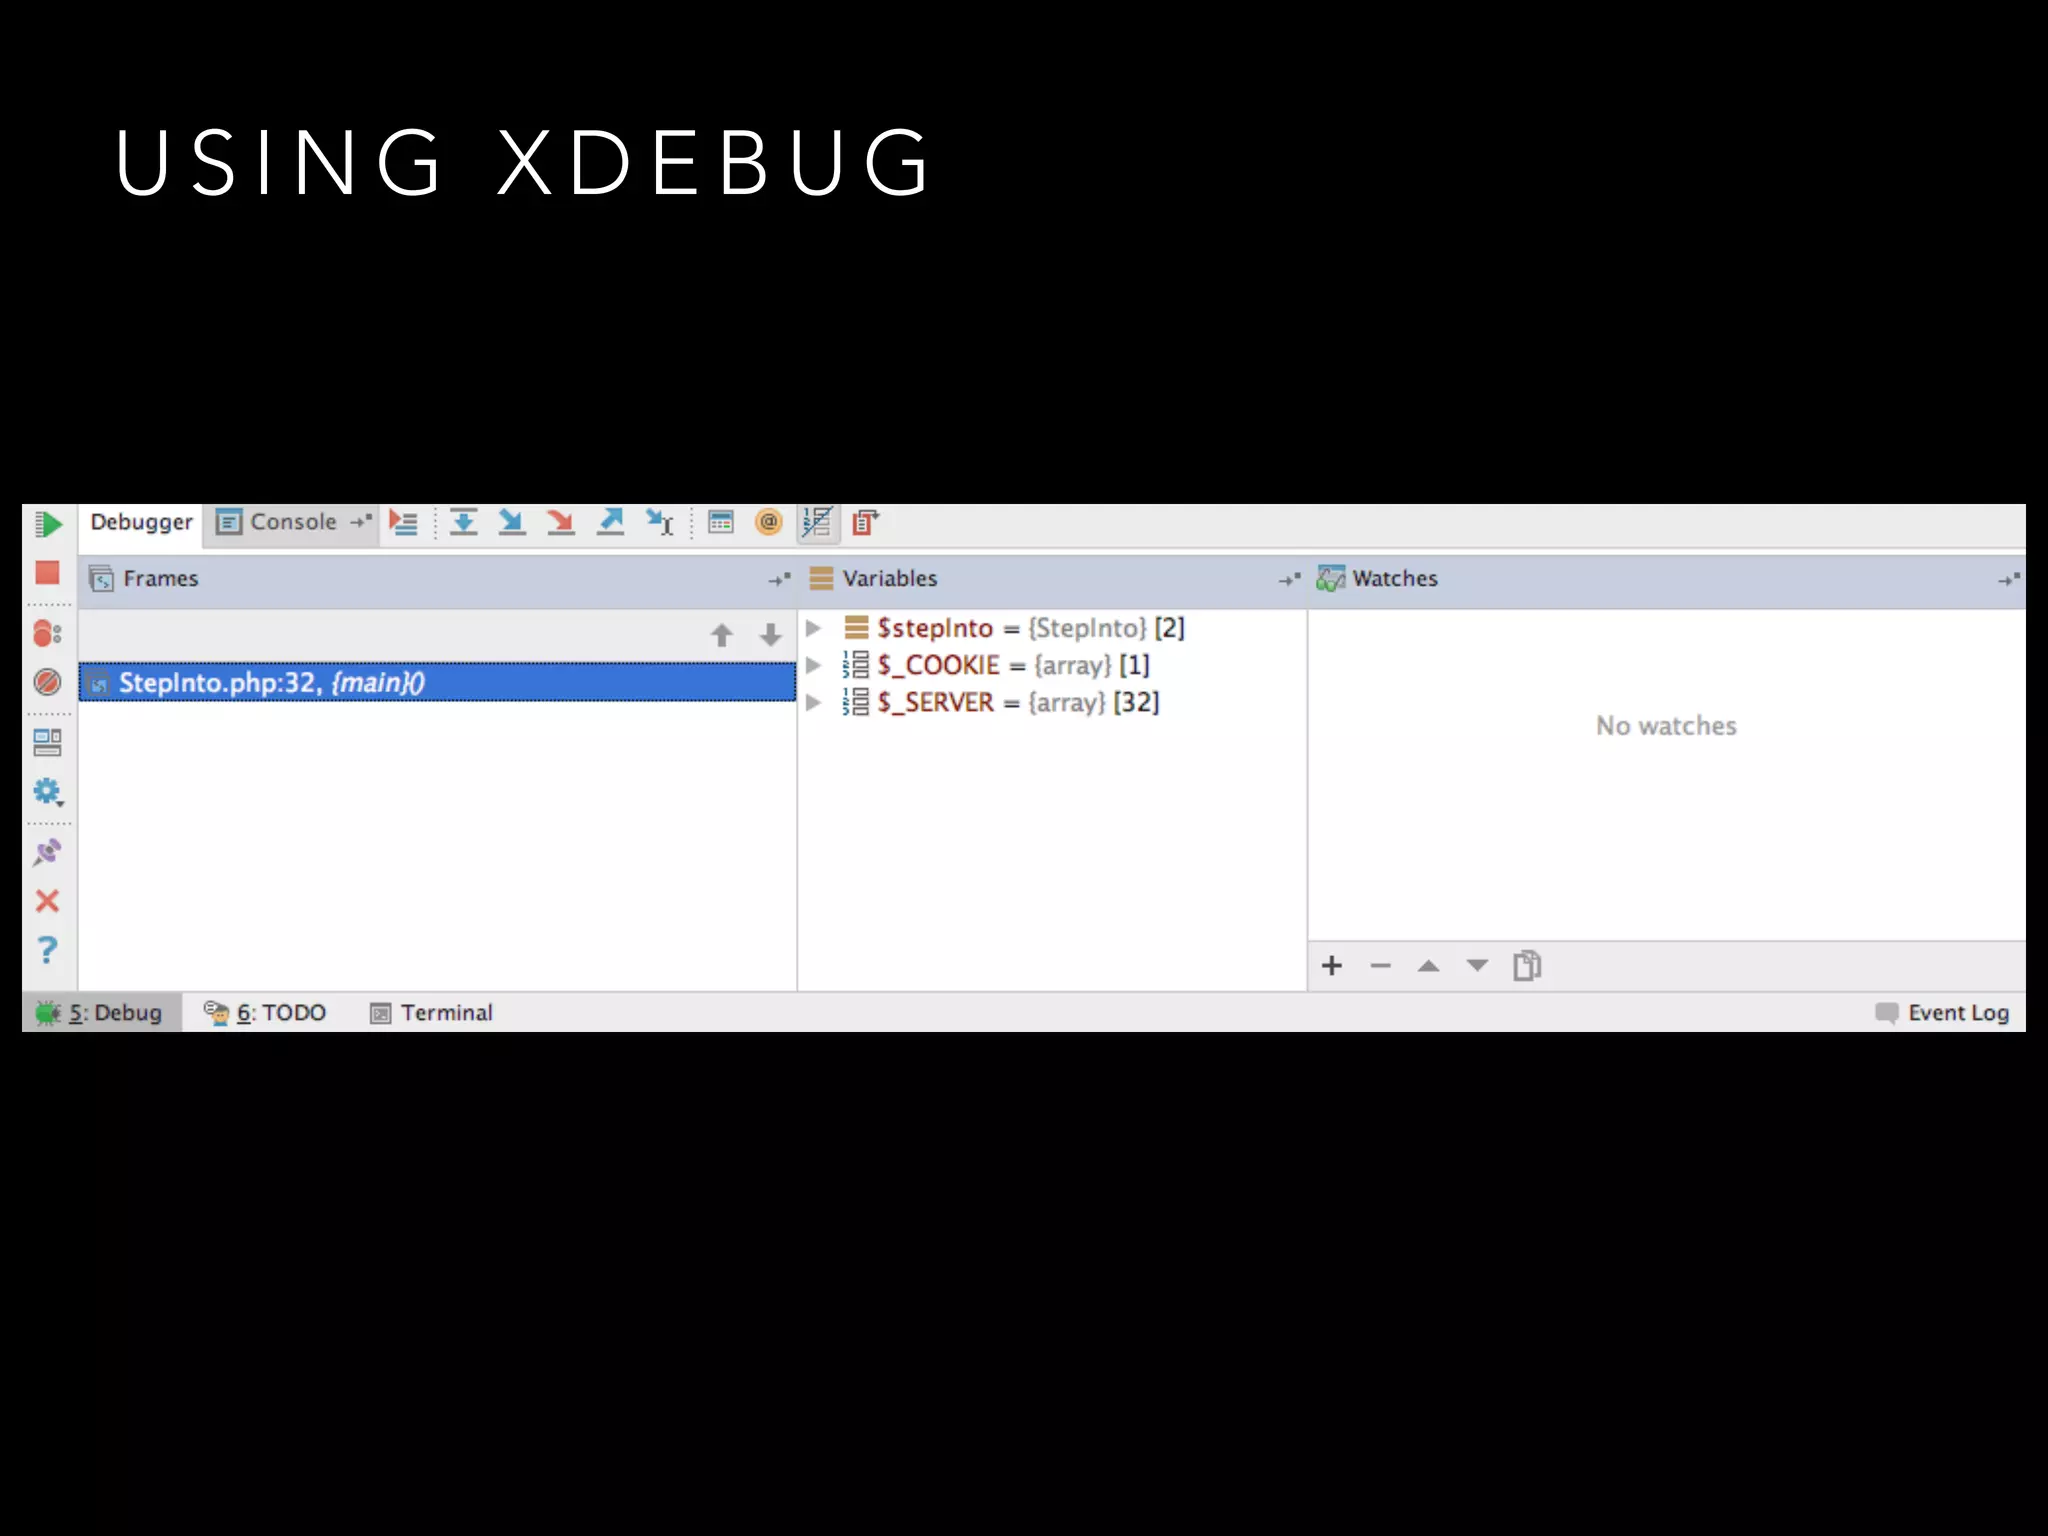
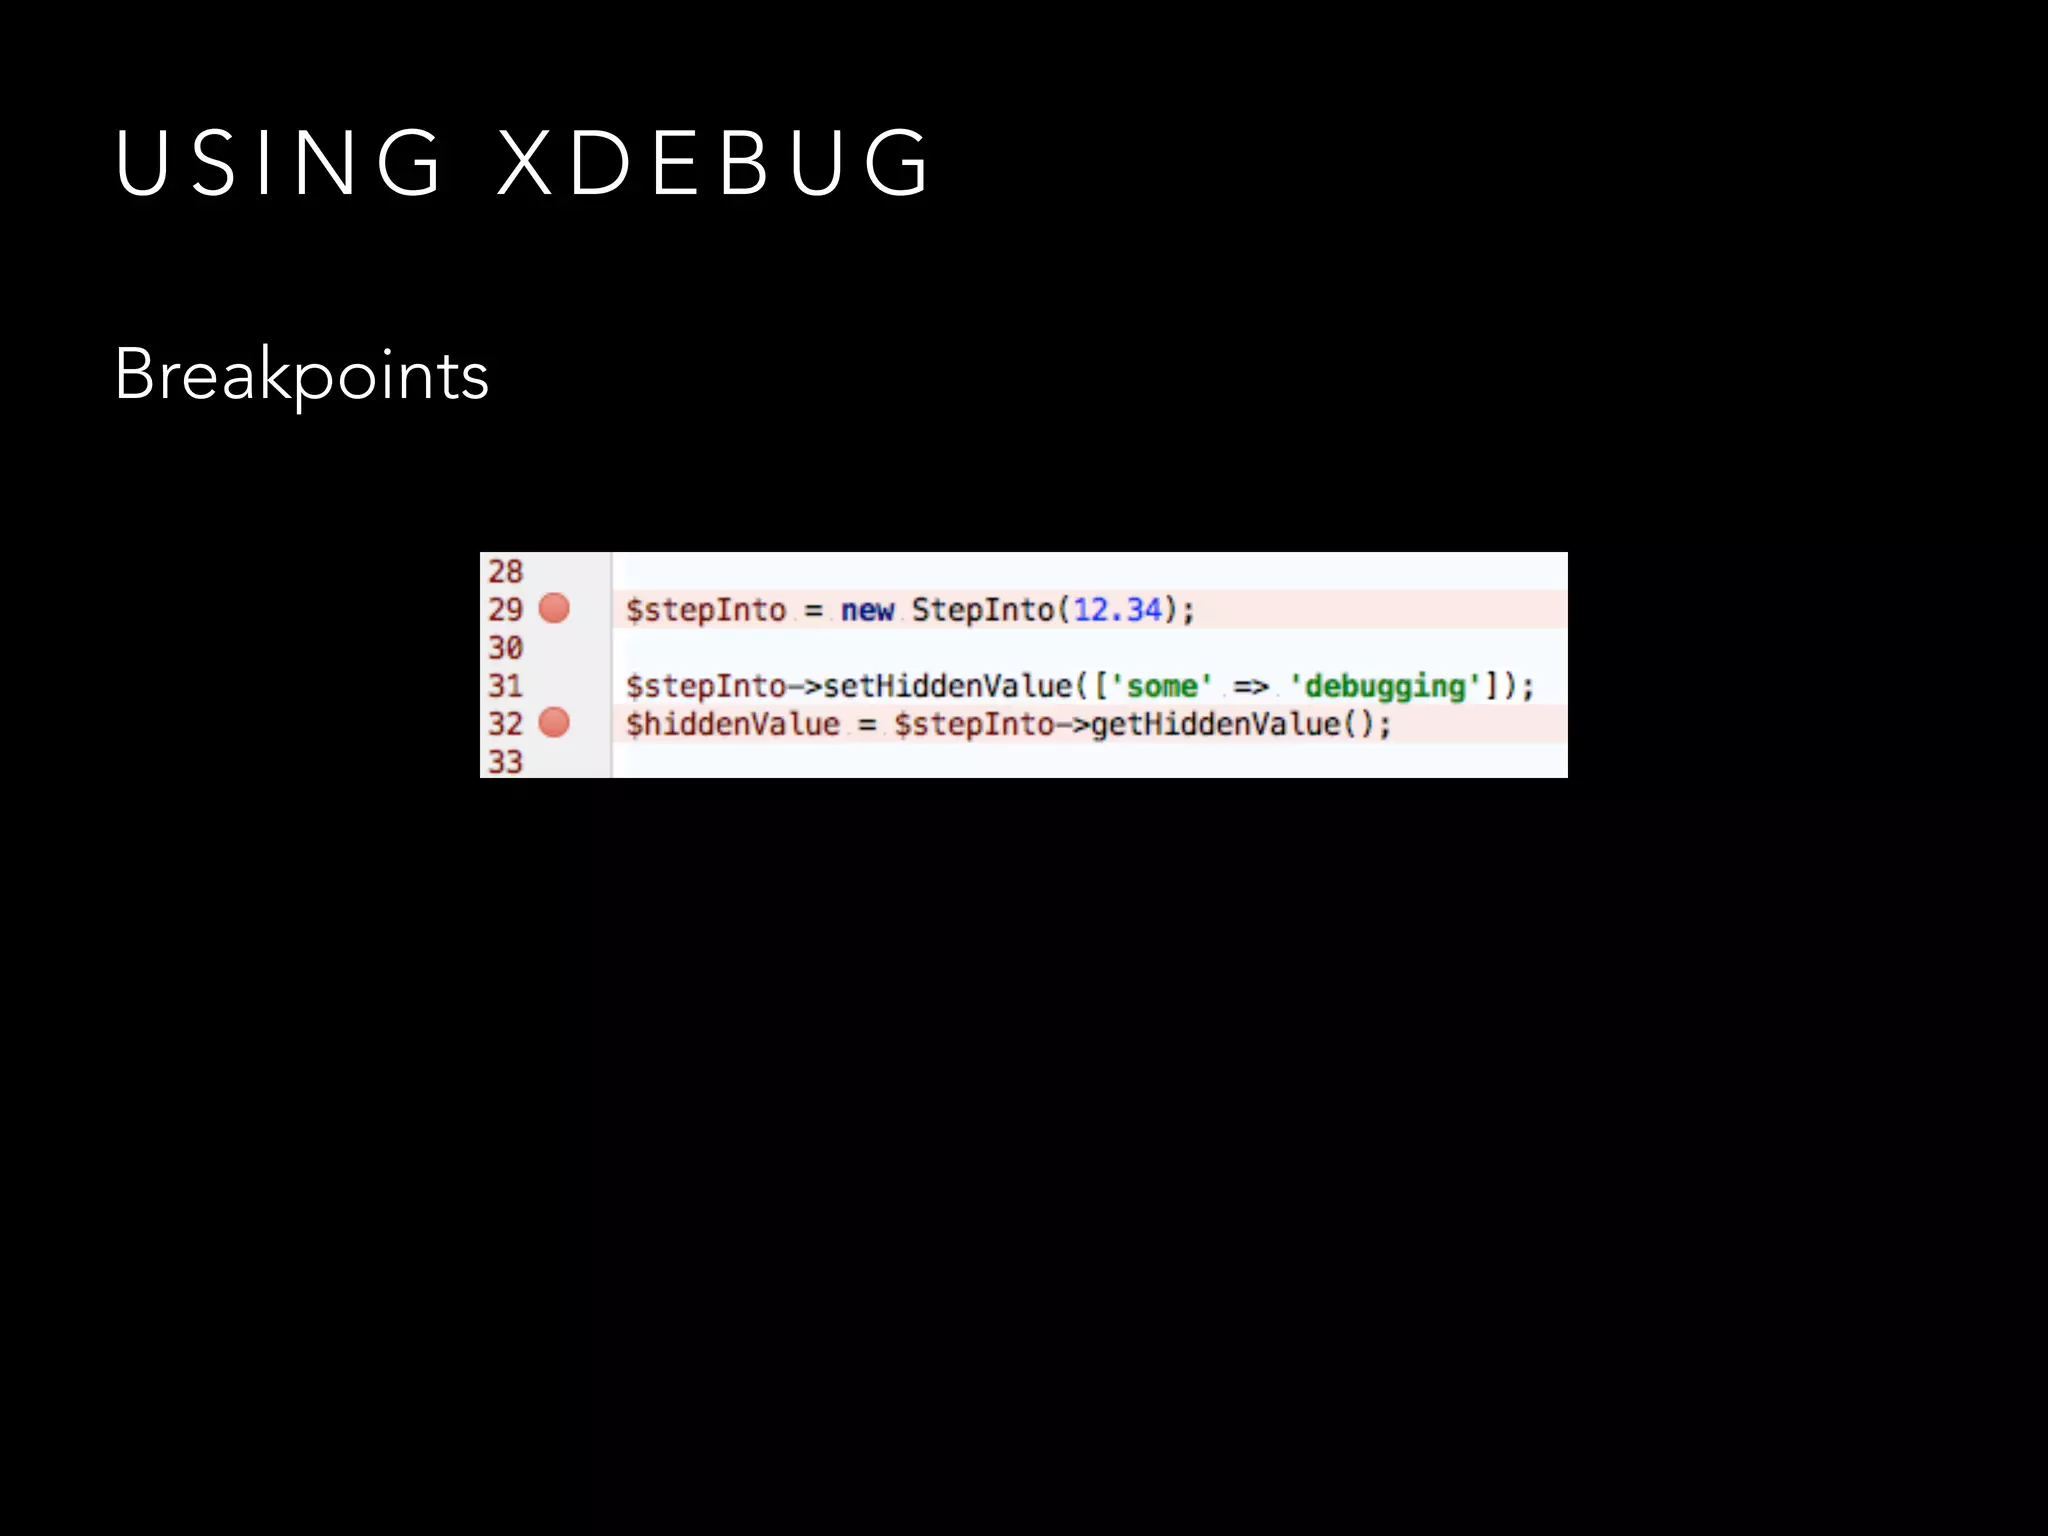
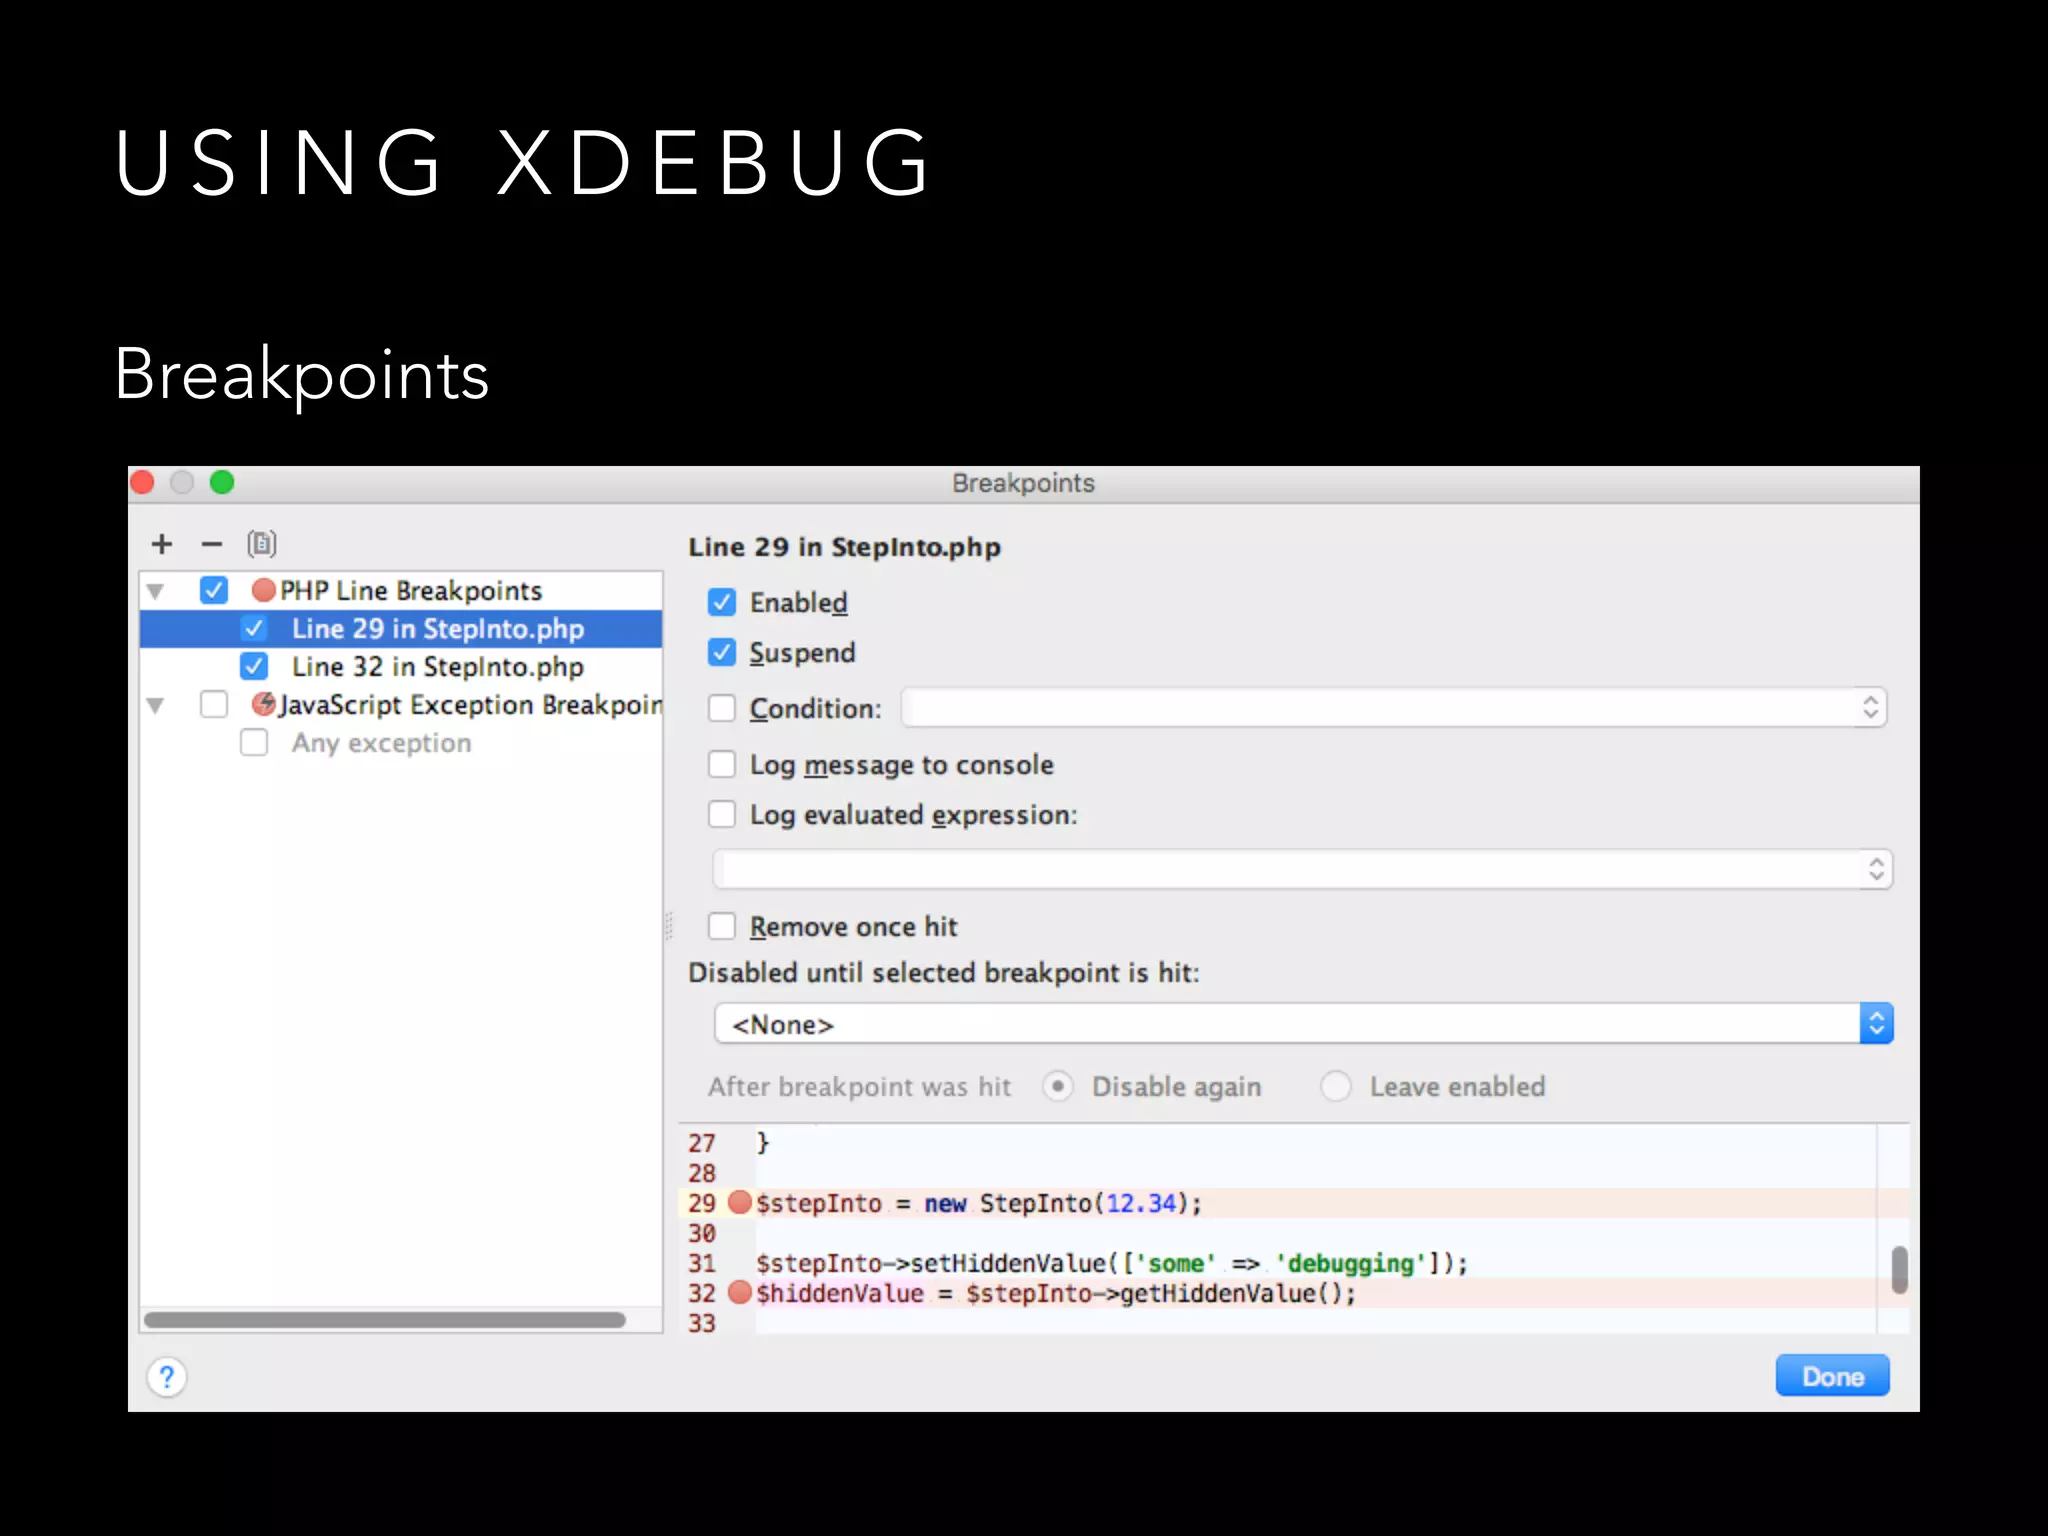
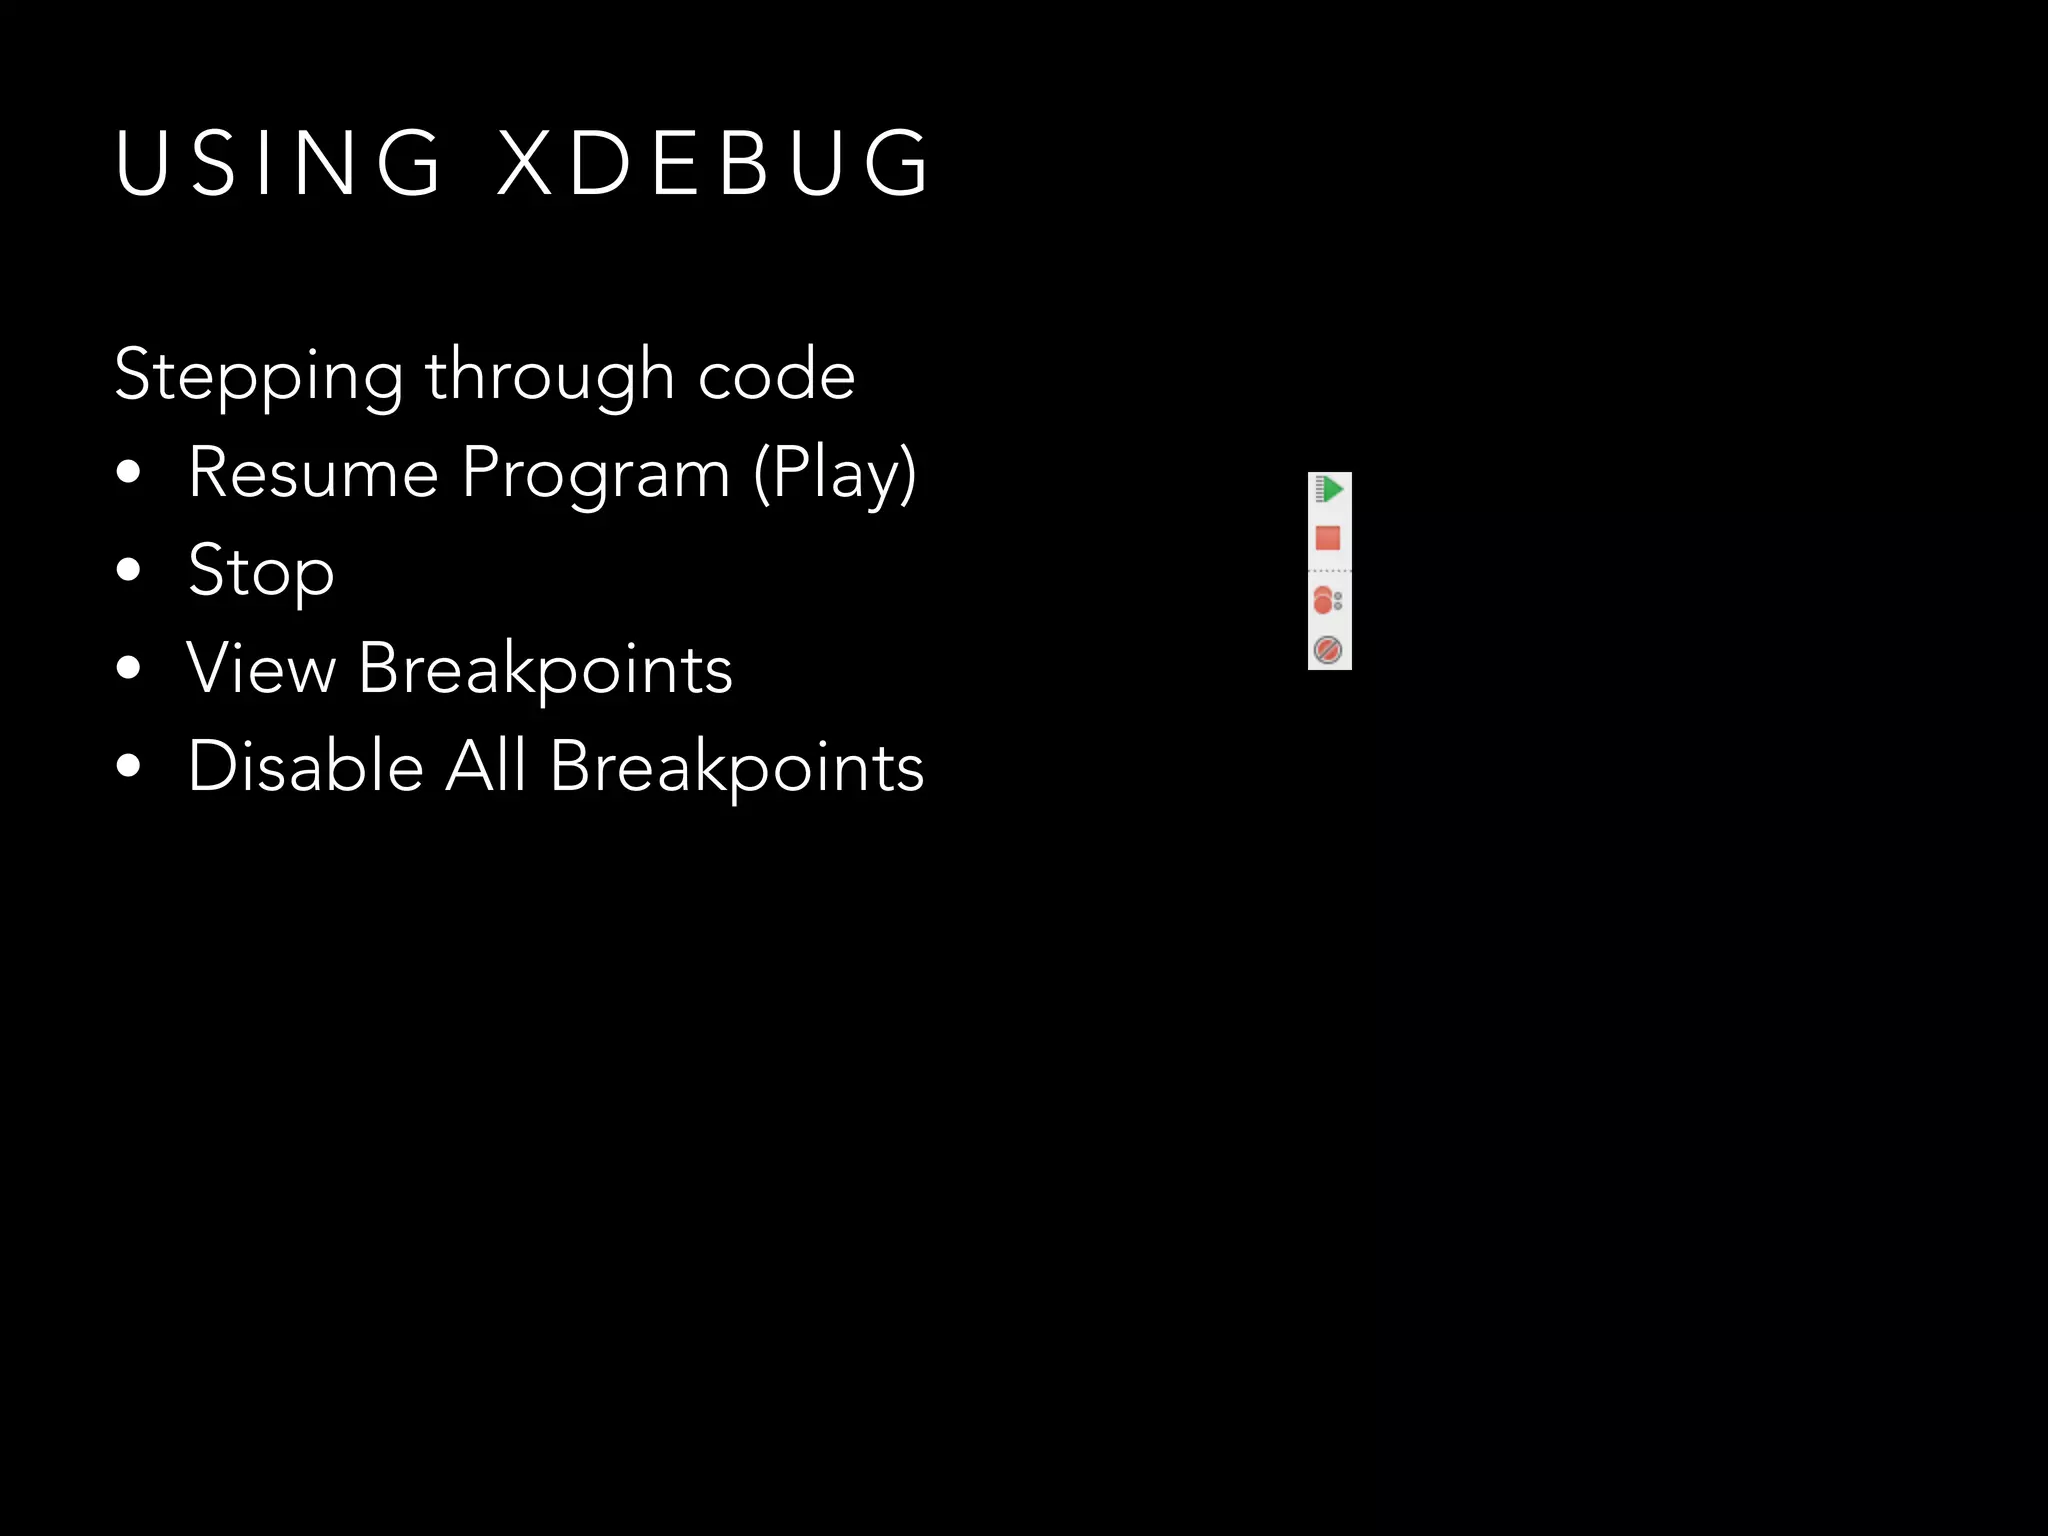
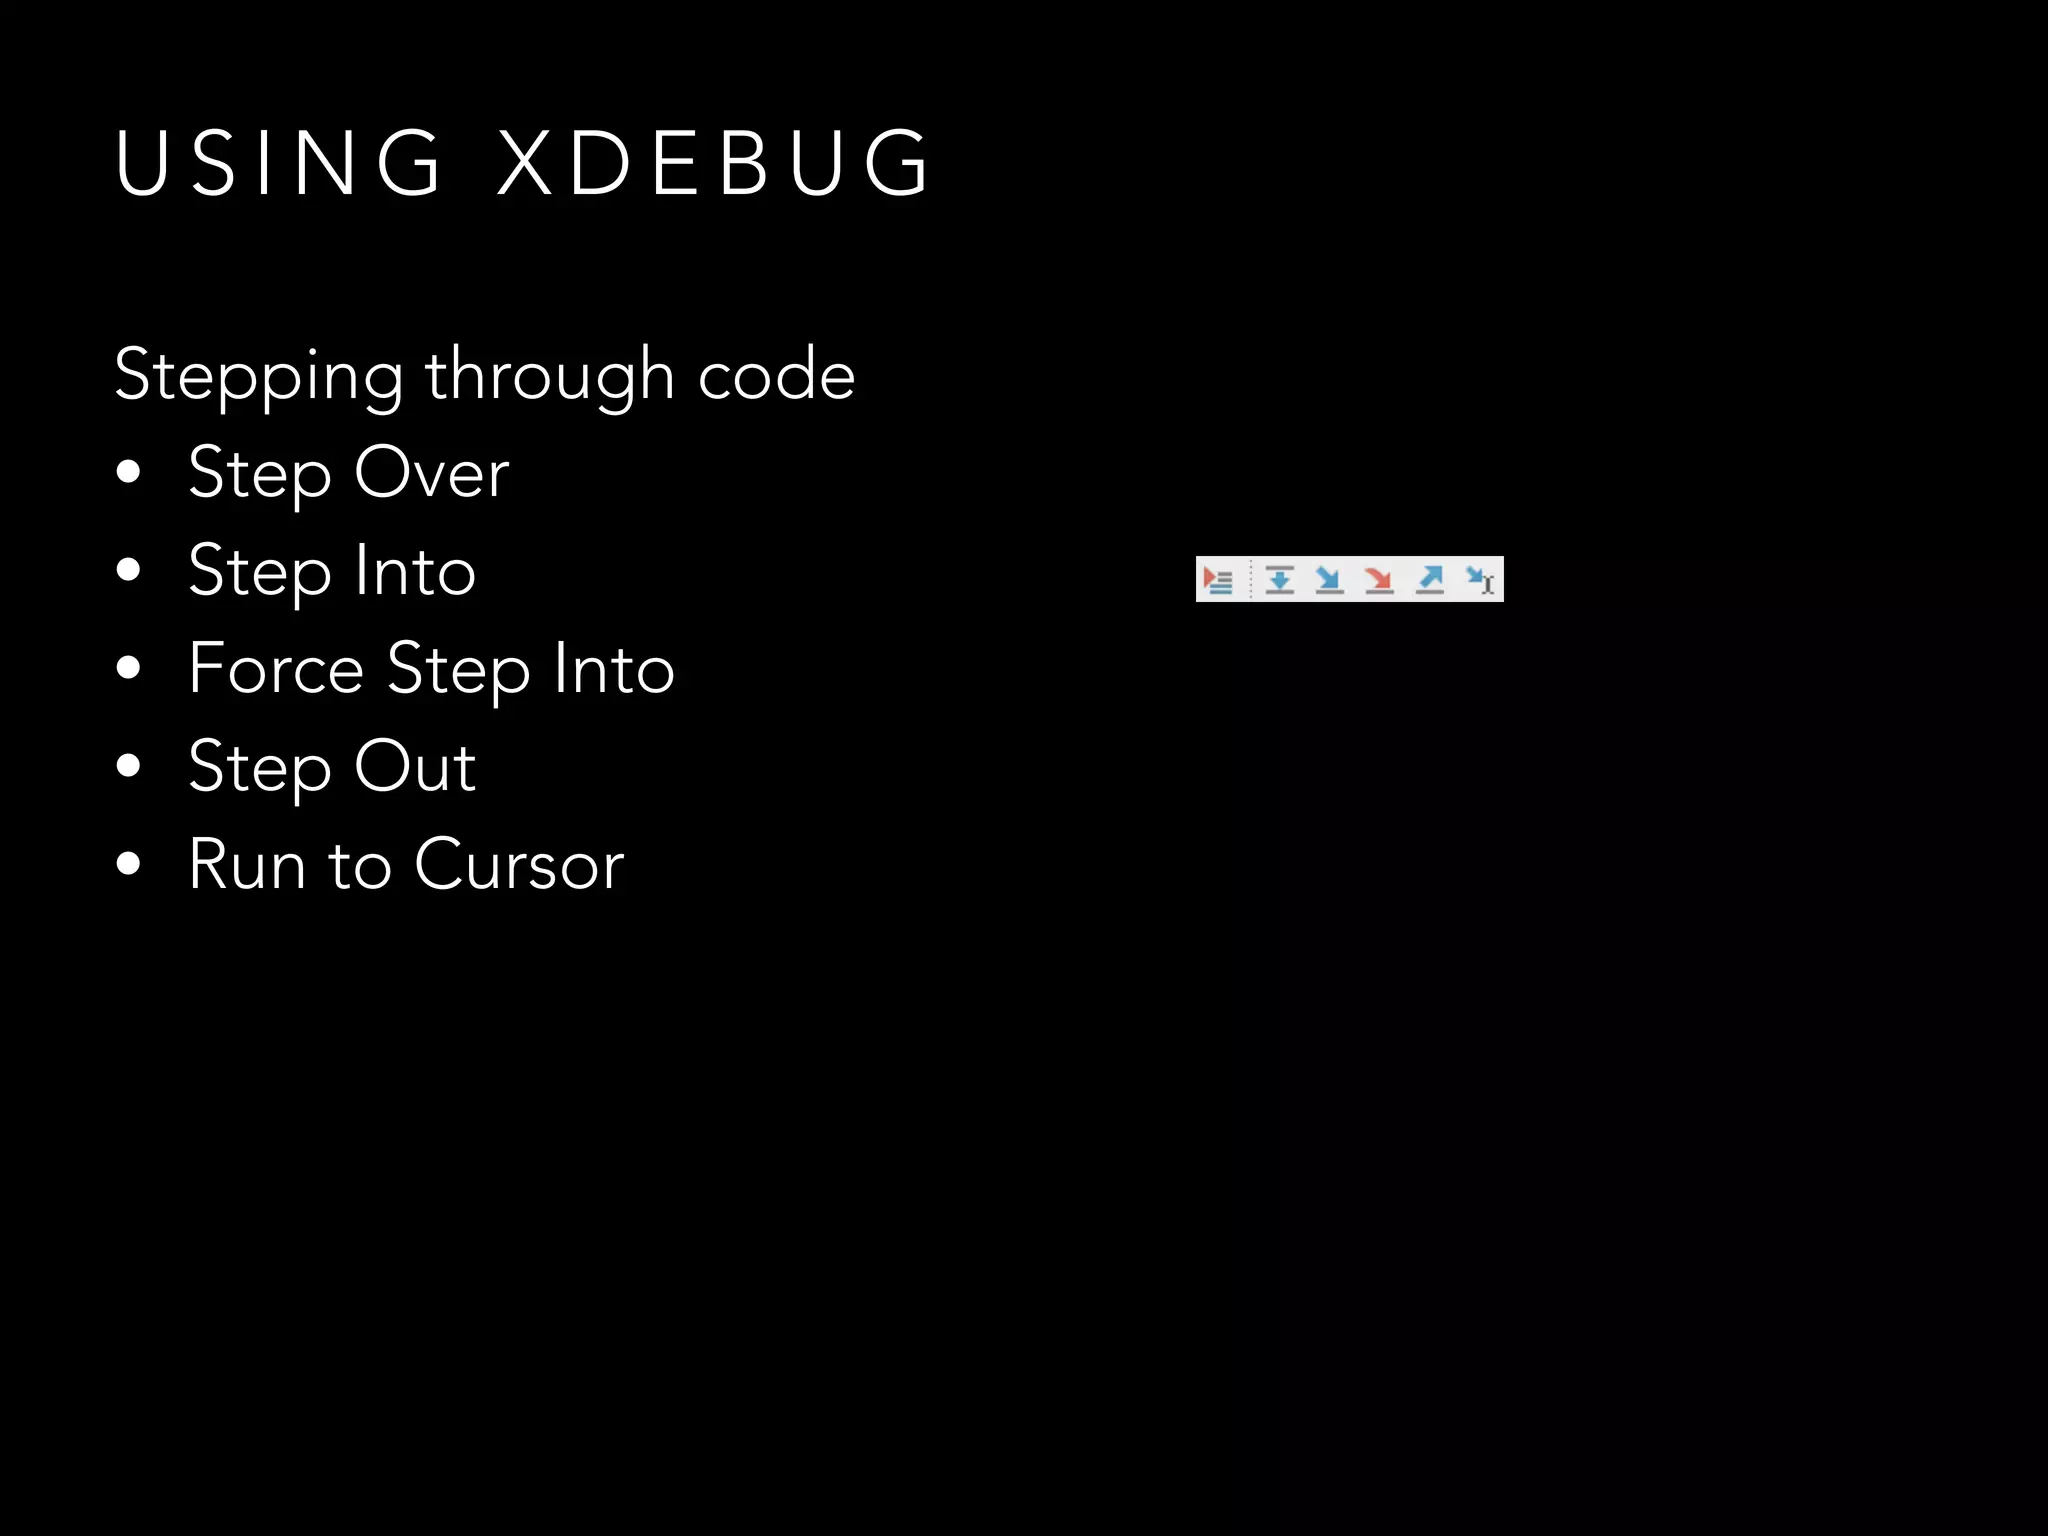
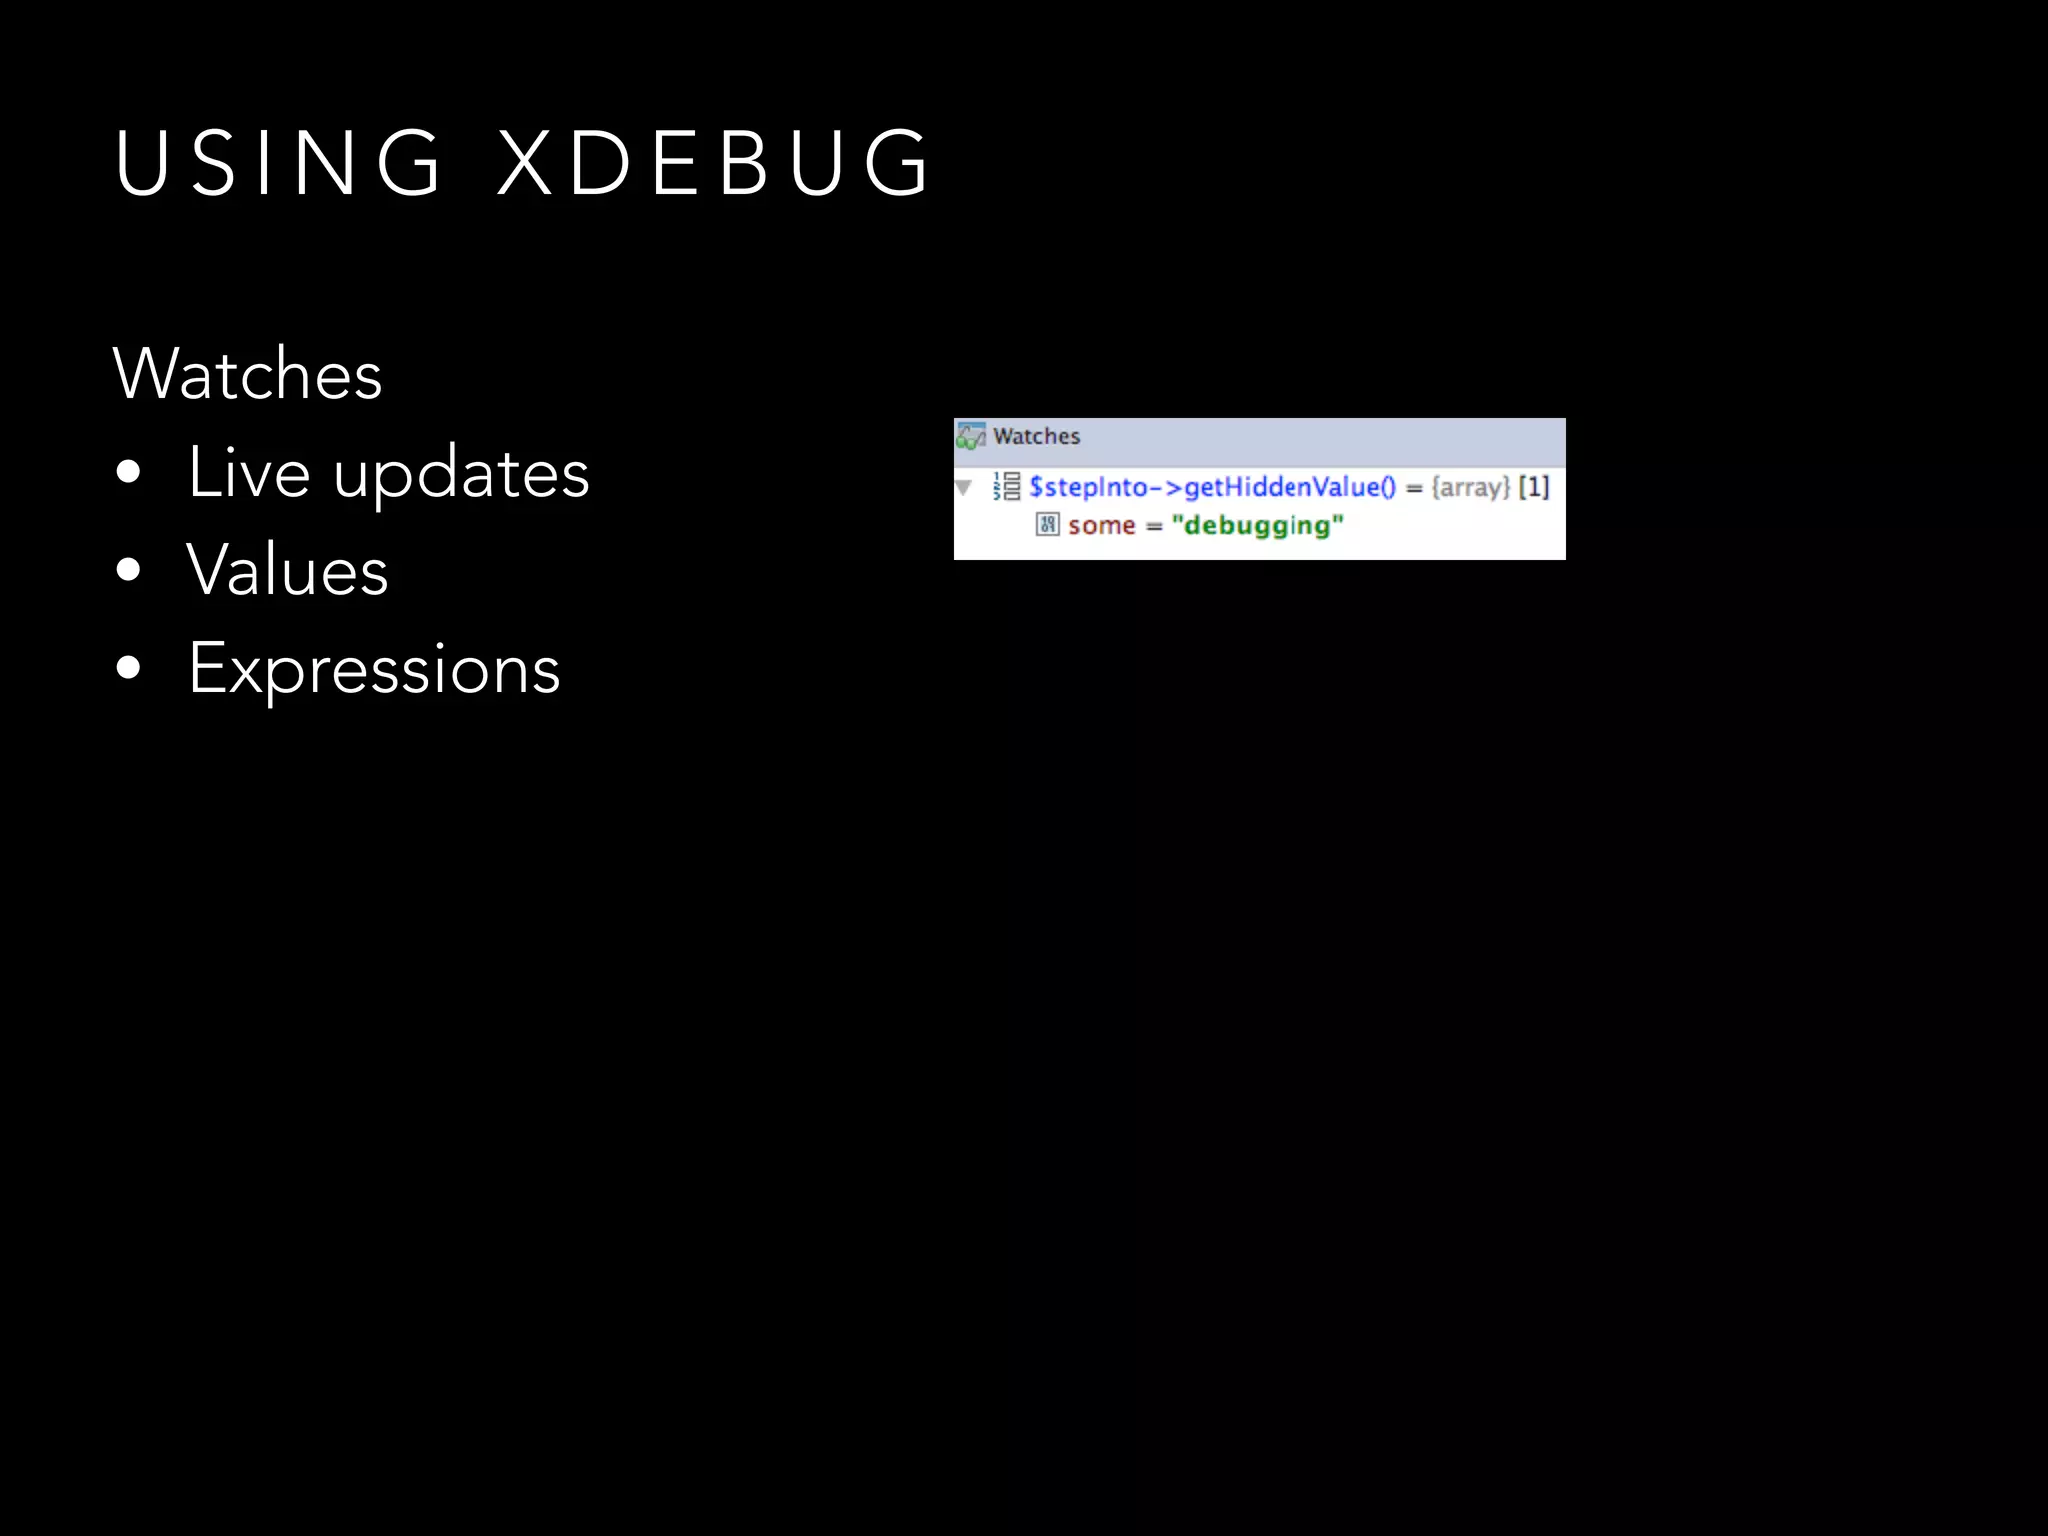
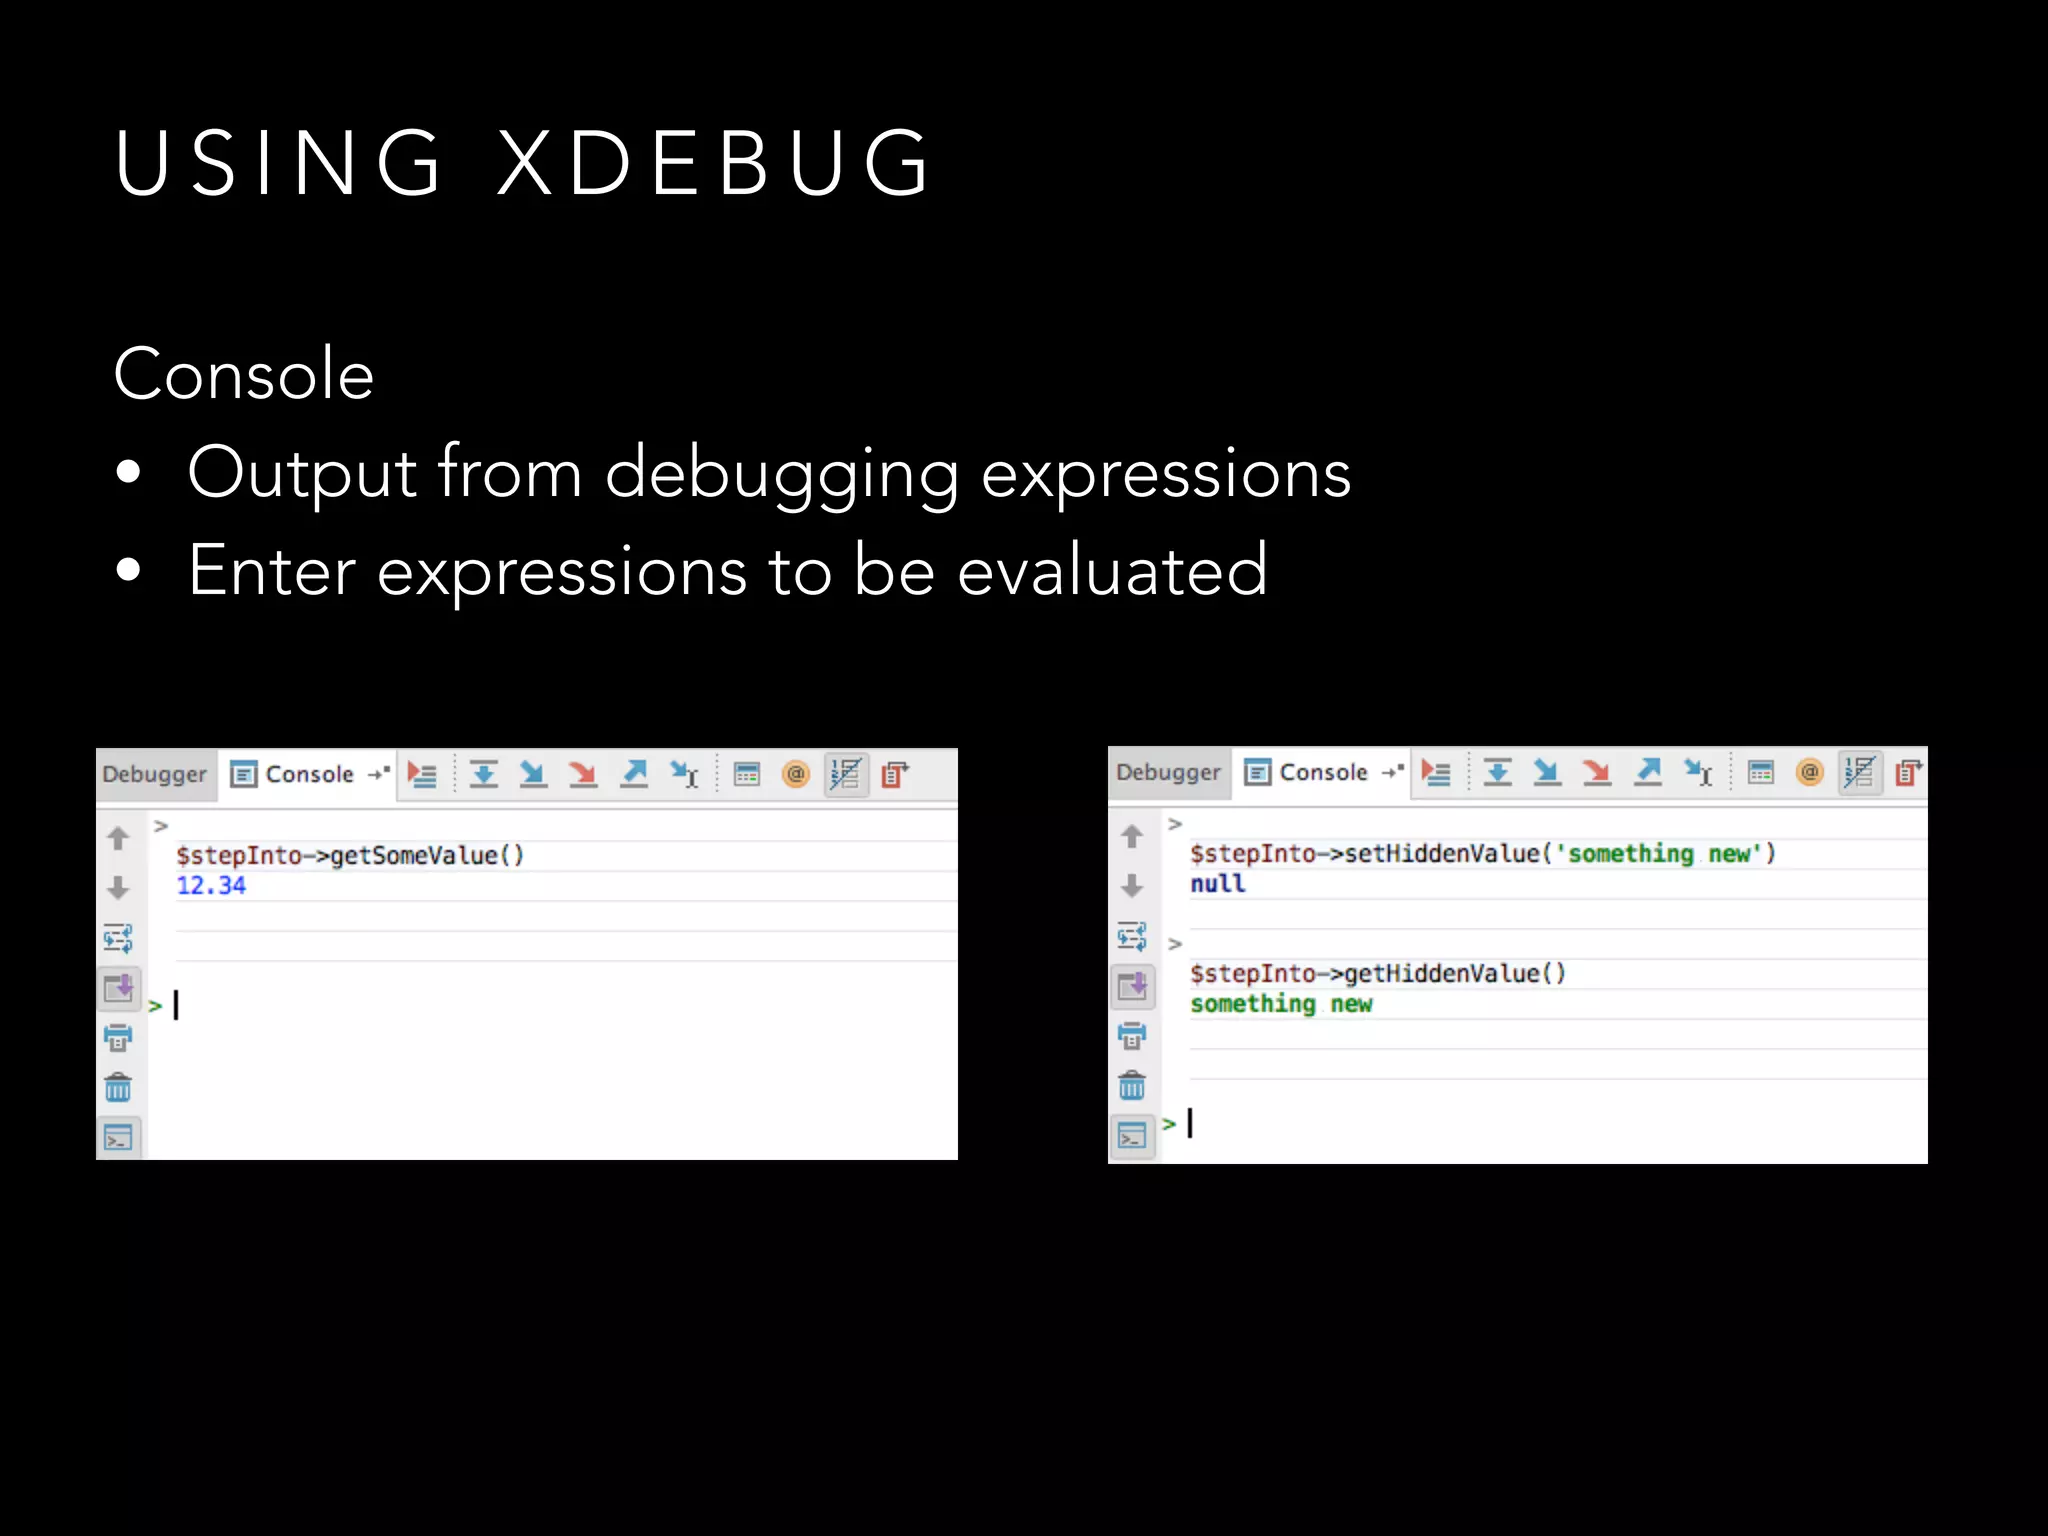
The document discusses using Xdebug to debug PHP code. It begins with an overview of Xdebug, explaining that it is a PHP extension that allows for step-by-step debugging and profiling of PHP applications. It then covers how to set up Xdebug, including installing the extension, configuring an IDE like PhpStorm to work with it, setting breakpoints in code, and activating the debugger. Finally, it discusses how to use Xdebug, such as setting and working with breakpoints, stepping through code, and using watches and the console window. The overall document serves as an introduction to debugging PHP applications with Xdebug.


![Filesystem Management with Flysystem - php[tek] 2023](https://cdn.slidesharecdn.com/ss_thumbnails/filesystemmanagementwithflysystem-phptek2023-230514204651-488affd7-thumbnail.jpg?width=600ounds&width=560&fit=bounds)
![Leveling Up With Unit Testing - php[tek] 2023](https://cdn.slidesharecdn.com/ss_thumbnails/levelingupwithunittesting-phptek2023-230514204446-cf06ada2-thumbnail.jpg?width=600ounds&width=560&fit=bounds)


