Download to read offline


![Latency
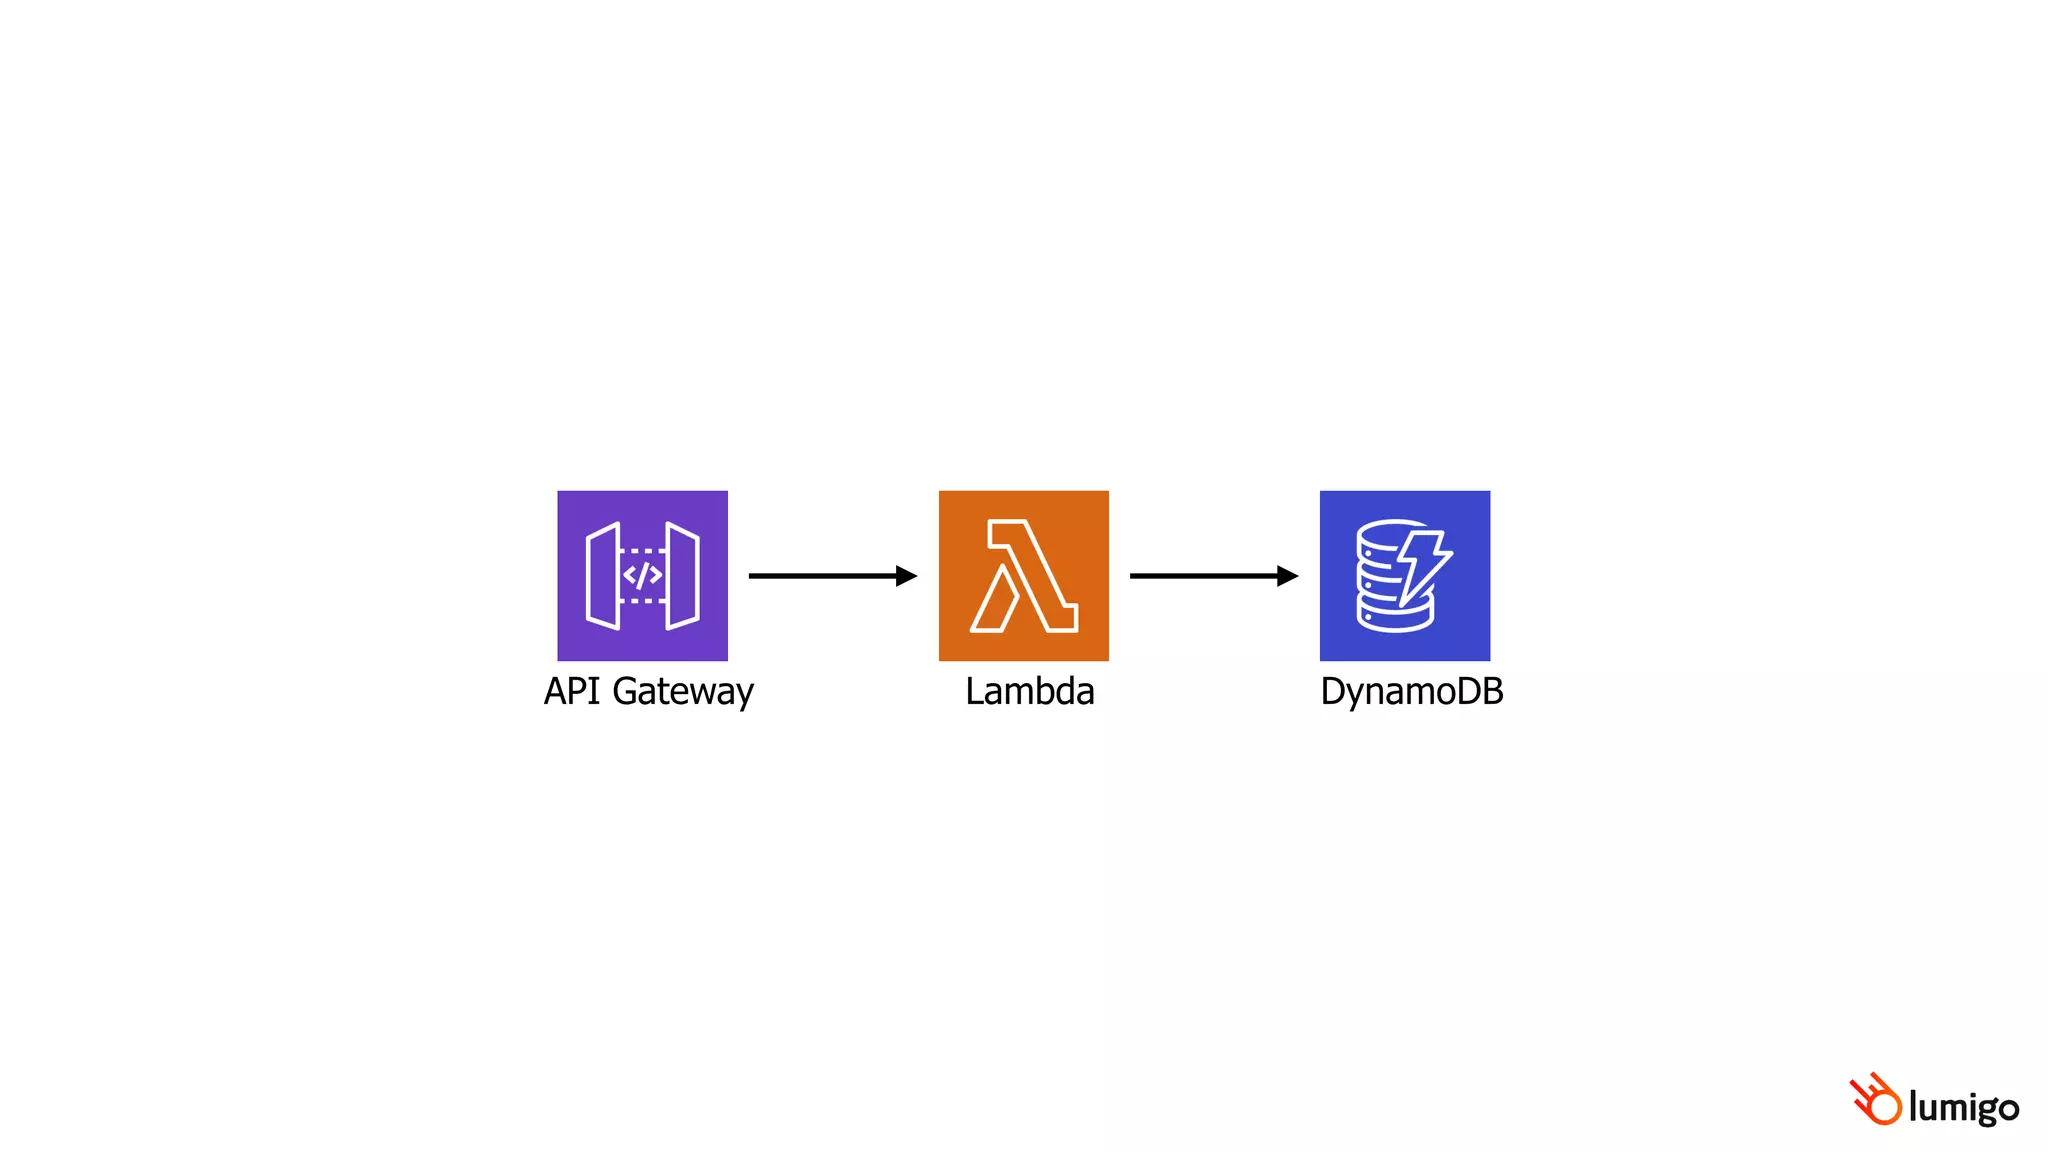
[API Gateway]](https://image.slidesharecdn.com/howtodebugslowlambdaresponsetimes-200912230629/85/How-to-debug-slow-lambda-response-times-49-320.jpg)
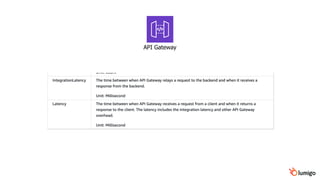
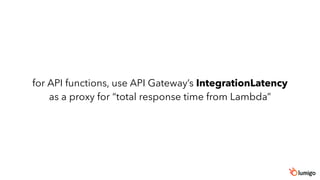
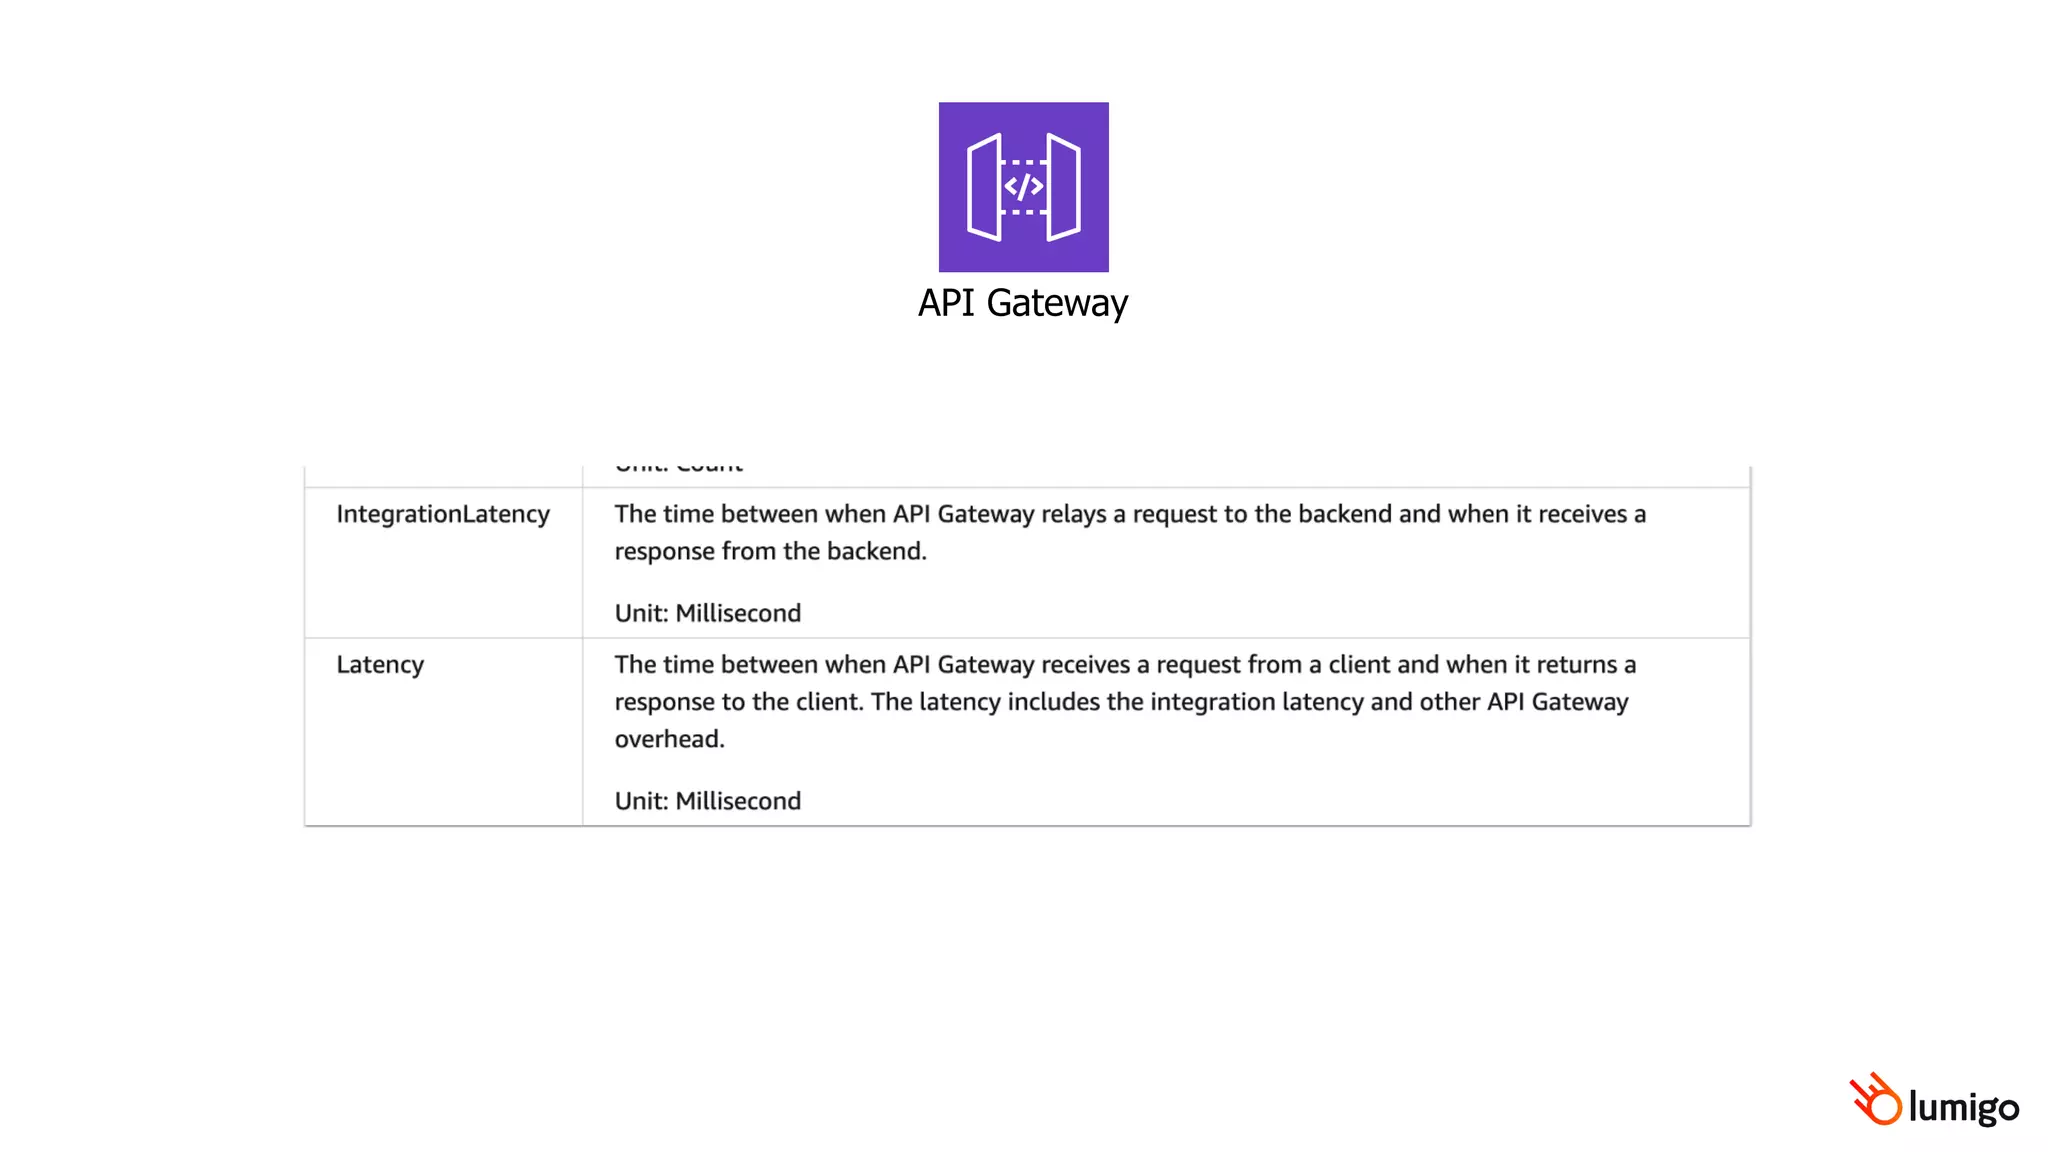
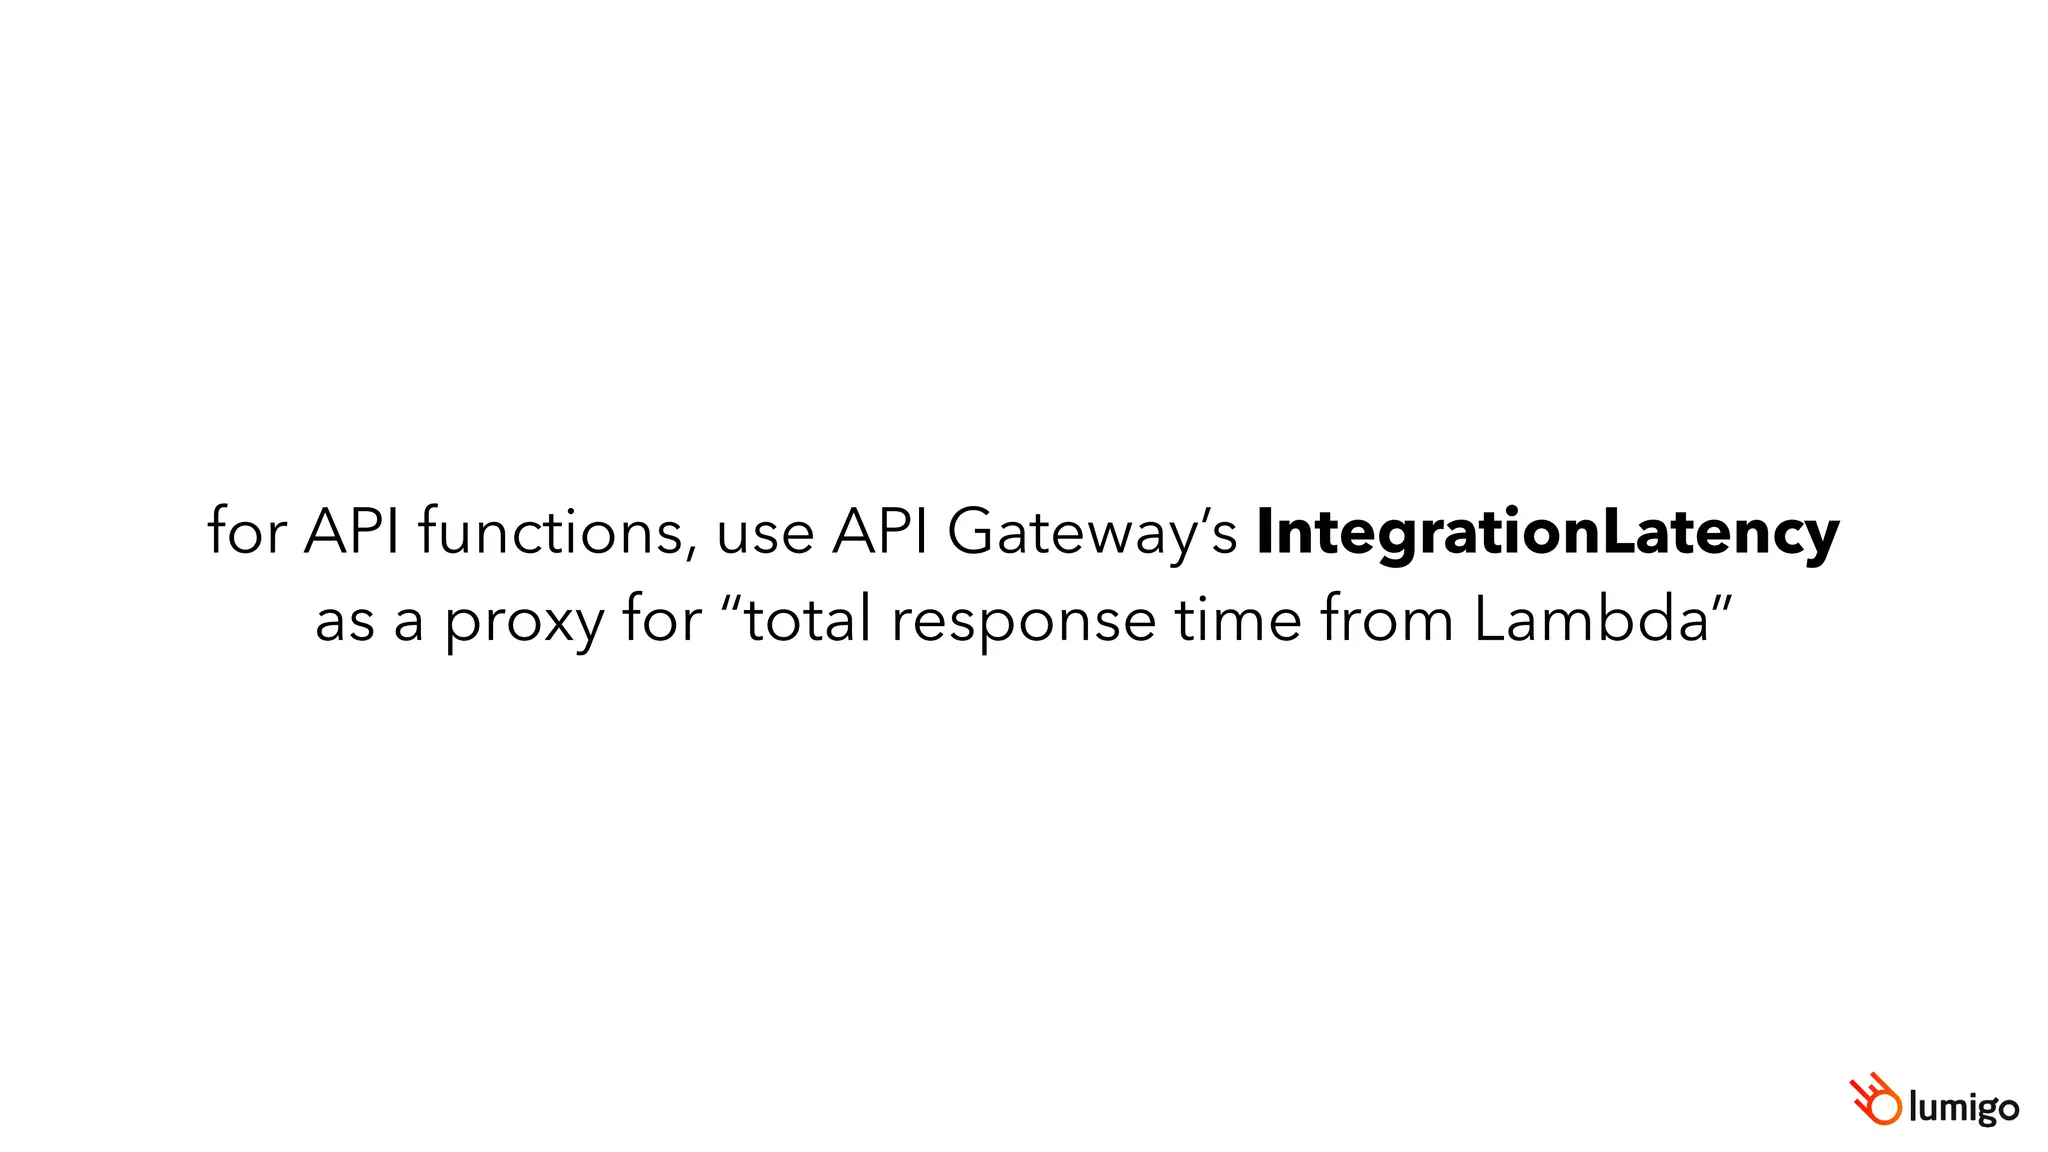
![IntegrationLatency
[API Gateway]
Latency
[API Gateway]](https://image.slidesharecdn.com/howtodebugslowlambdaresponsetimes-200912230629/85/How-to-debug-slow-lambda-response-times-50-320.jpg)
![API Gateway’s latency
overhead IntegrationLatency
[API Gateway]
Latency
[API Gateway]](https://image.slidesharecdn.com/howtodebugslowlambdaresponsetimes-200912230629/85/How-to-debug-slow-lambda-response-times-51-320.jpg)
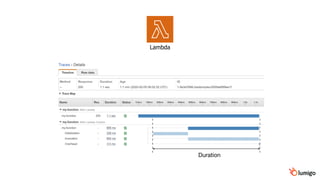
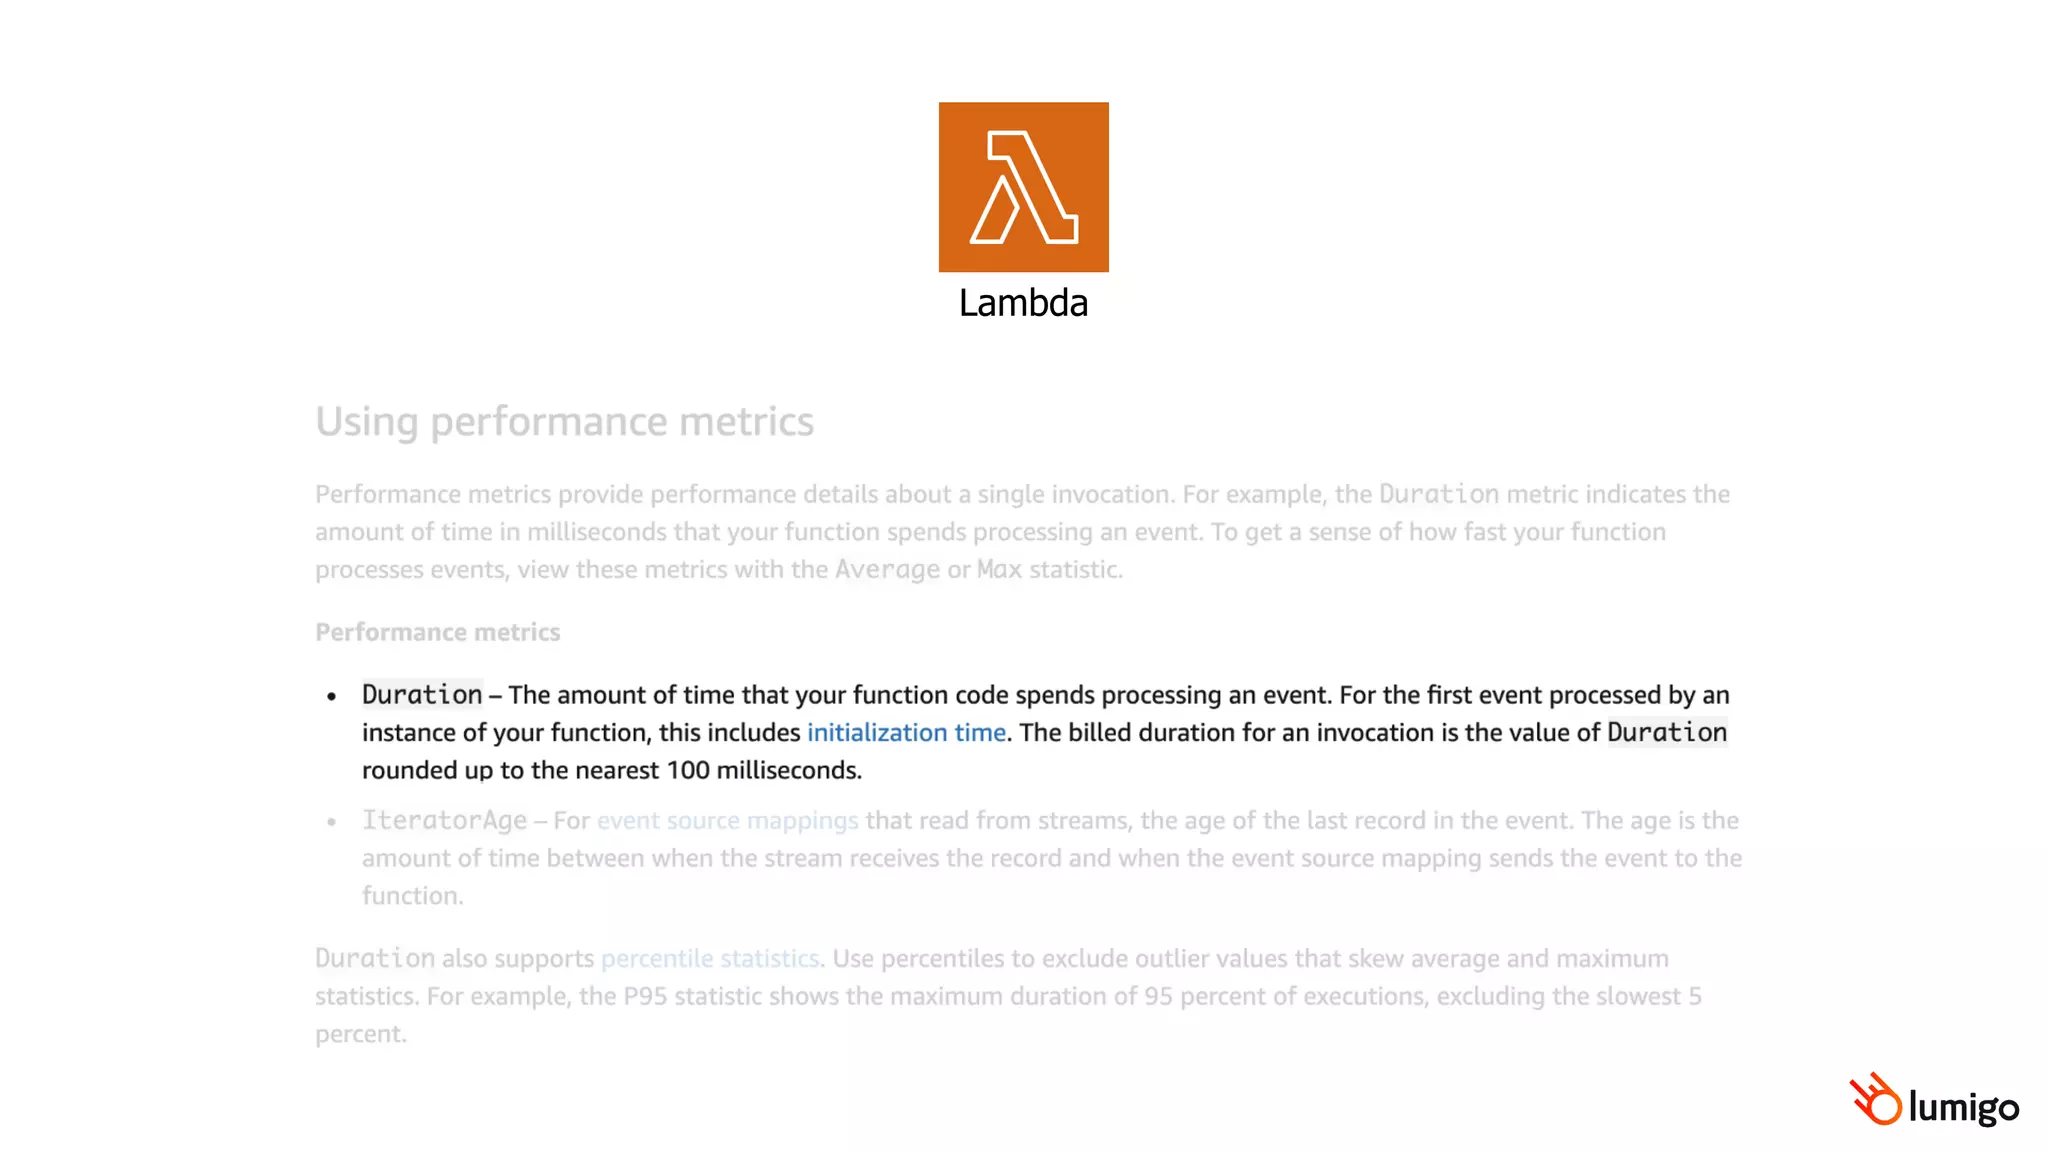
![Duration
[Lambda]
API Gateway’s latency
overhead IntegrationLatency
[API Gateway]
Latency
[API Gateway]](https://image.slidesharecdn.com/howtodebugslowlambdaresponsetimes-200912230629/85/How-to-debug-slow-lambda-response-times-52-320.jpg)
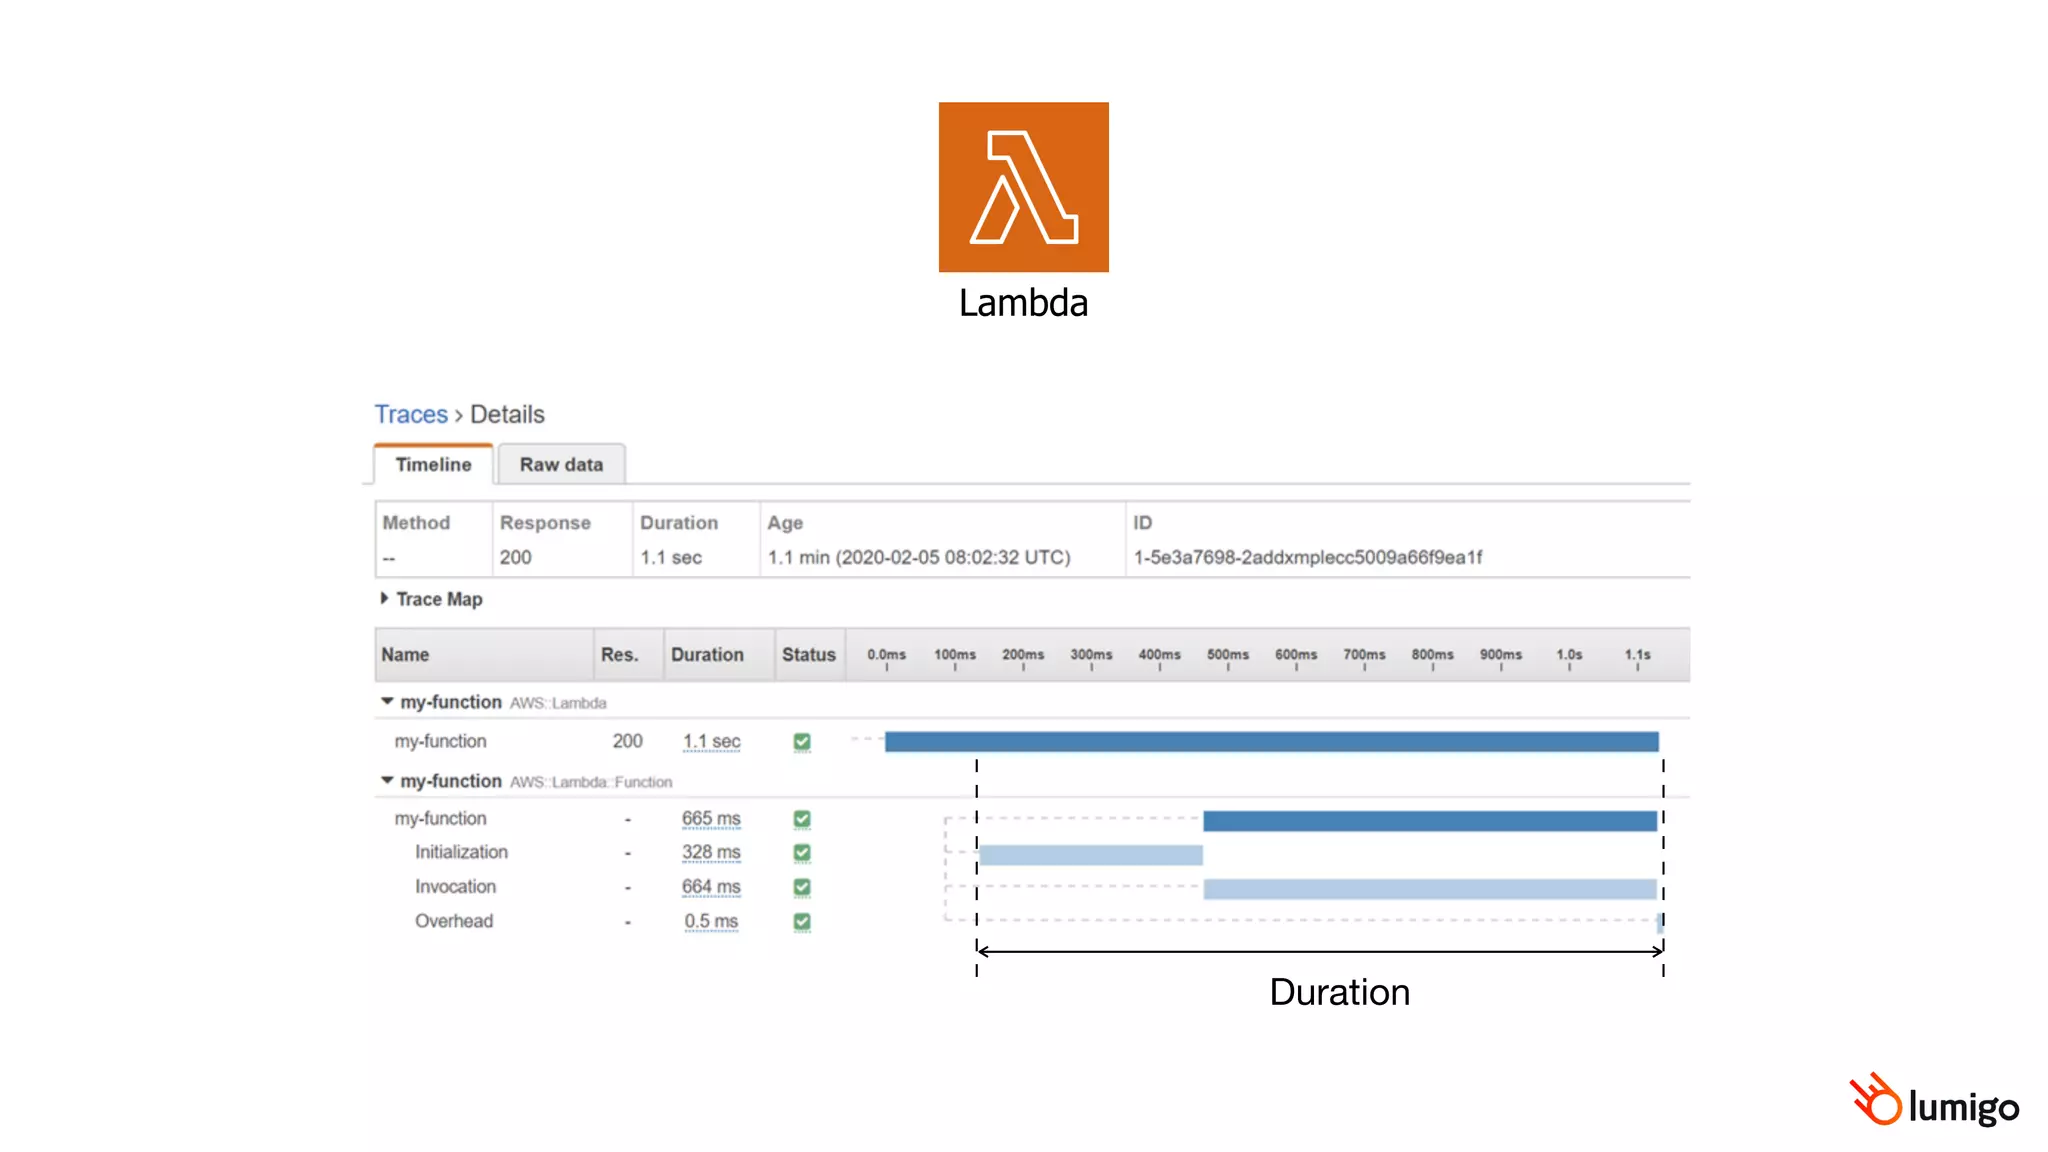
![Duration
[Lambda]
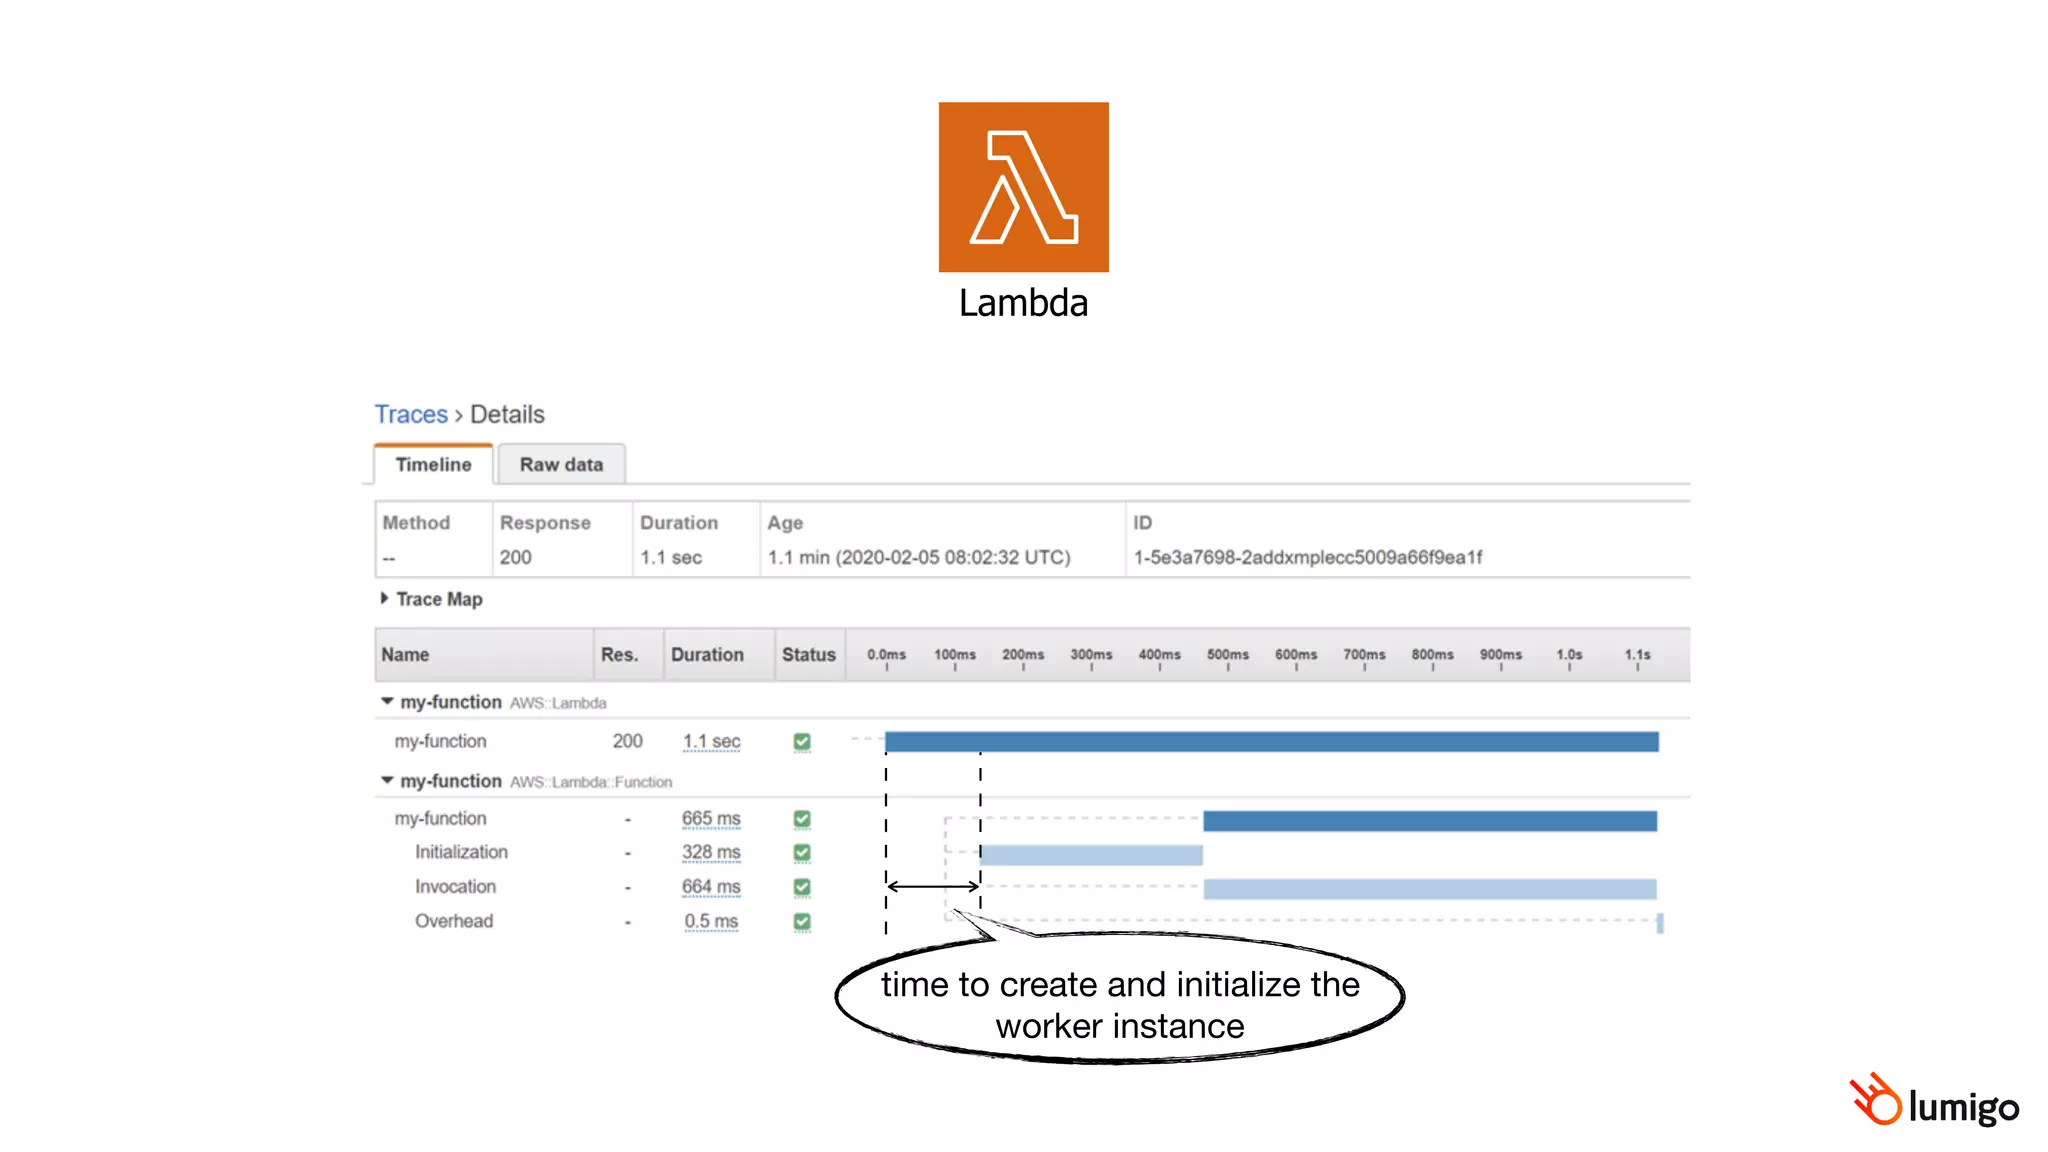
Lambda’s
allocation time
API Gateway’s latency
overhead IntegrationLatency
[API Gateway]
Latency
[API Gateway]](https://image.slidesharecdn.com/howtodebugslowlambdaresponsetimes-200912230629/85/How-to-debug-slow-lambda-response-times-53-320.jpg)
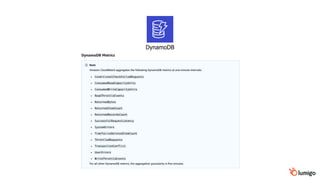
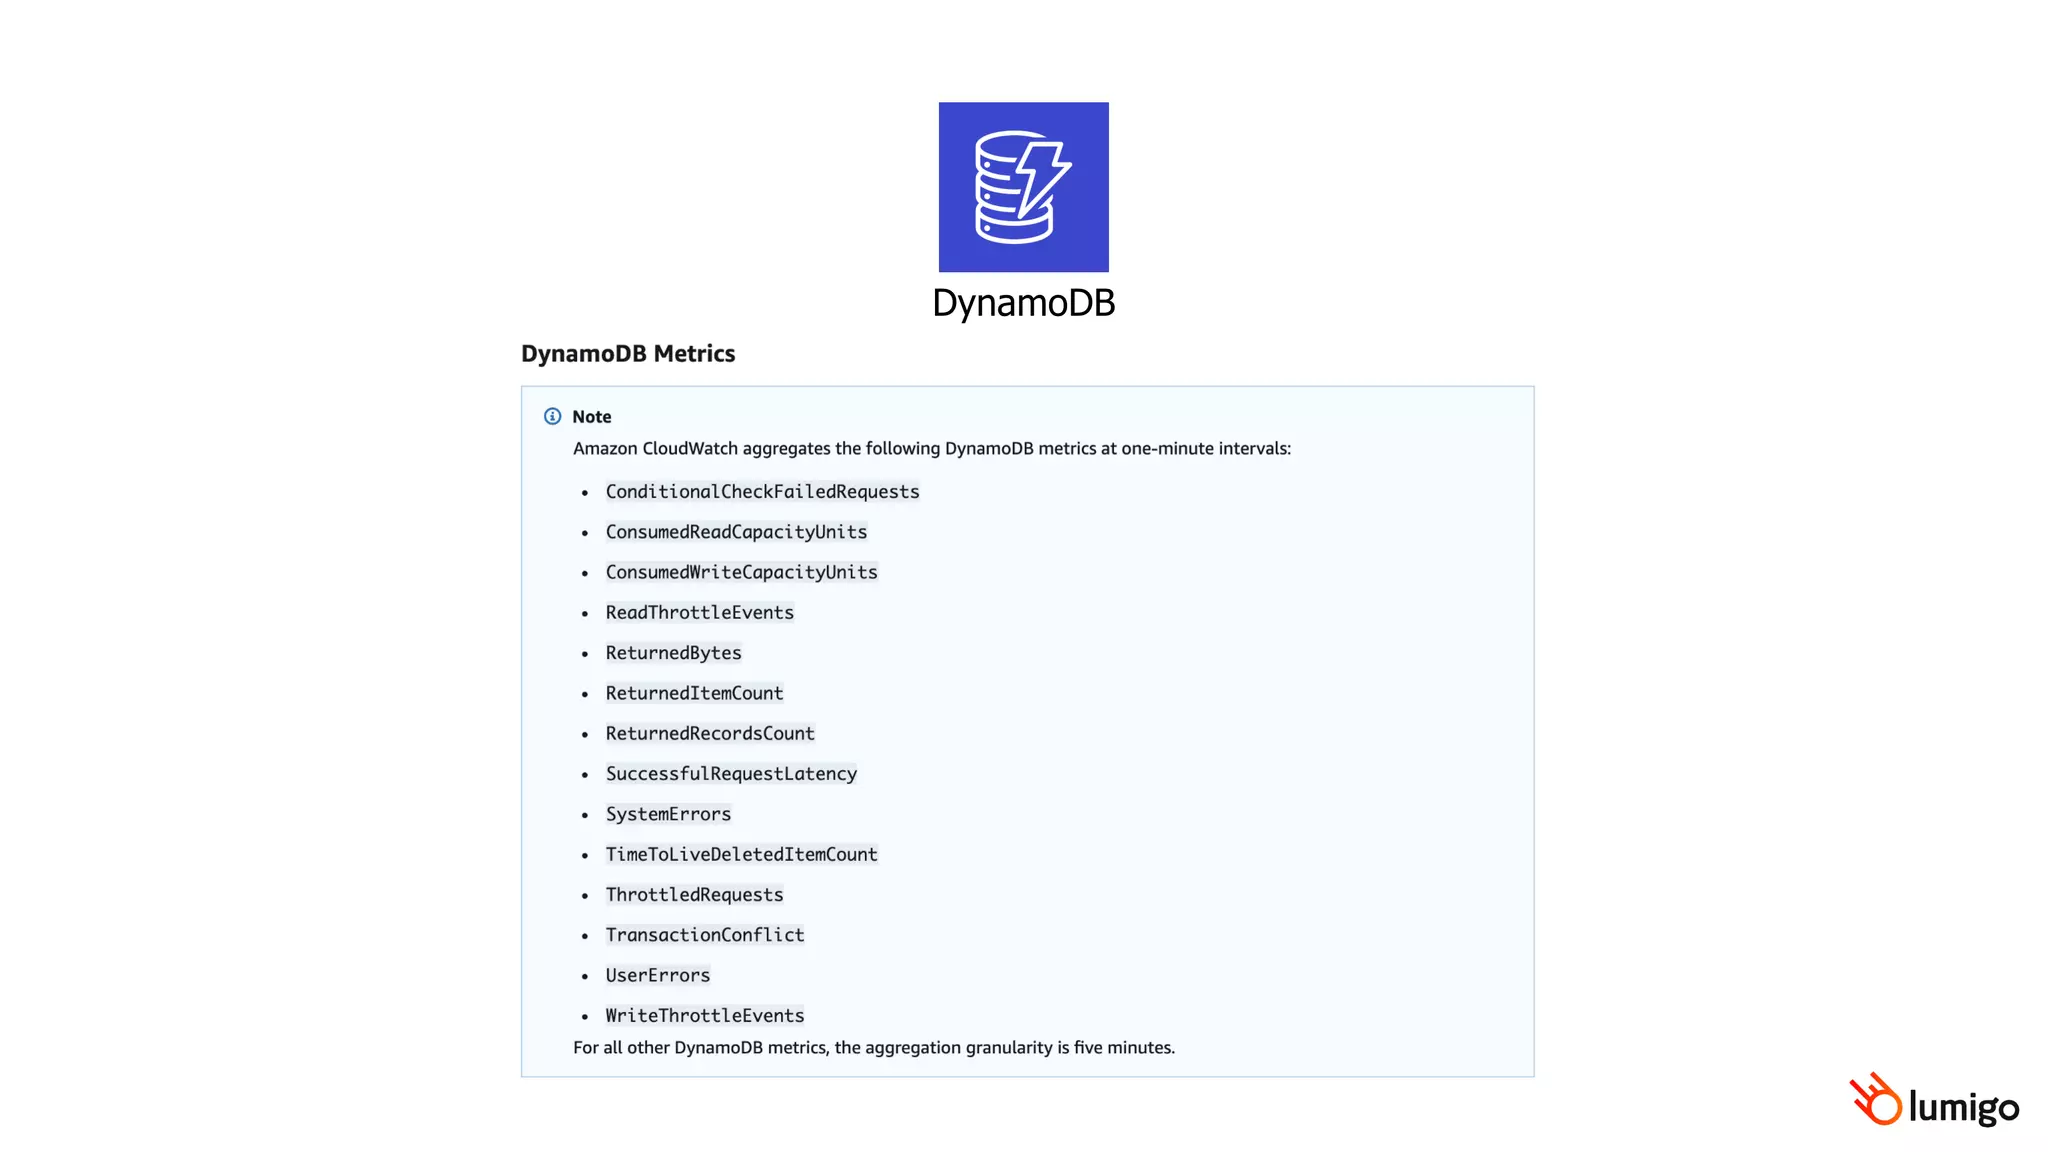
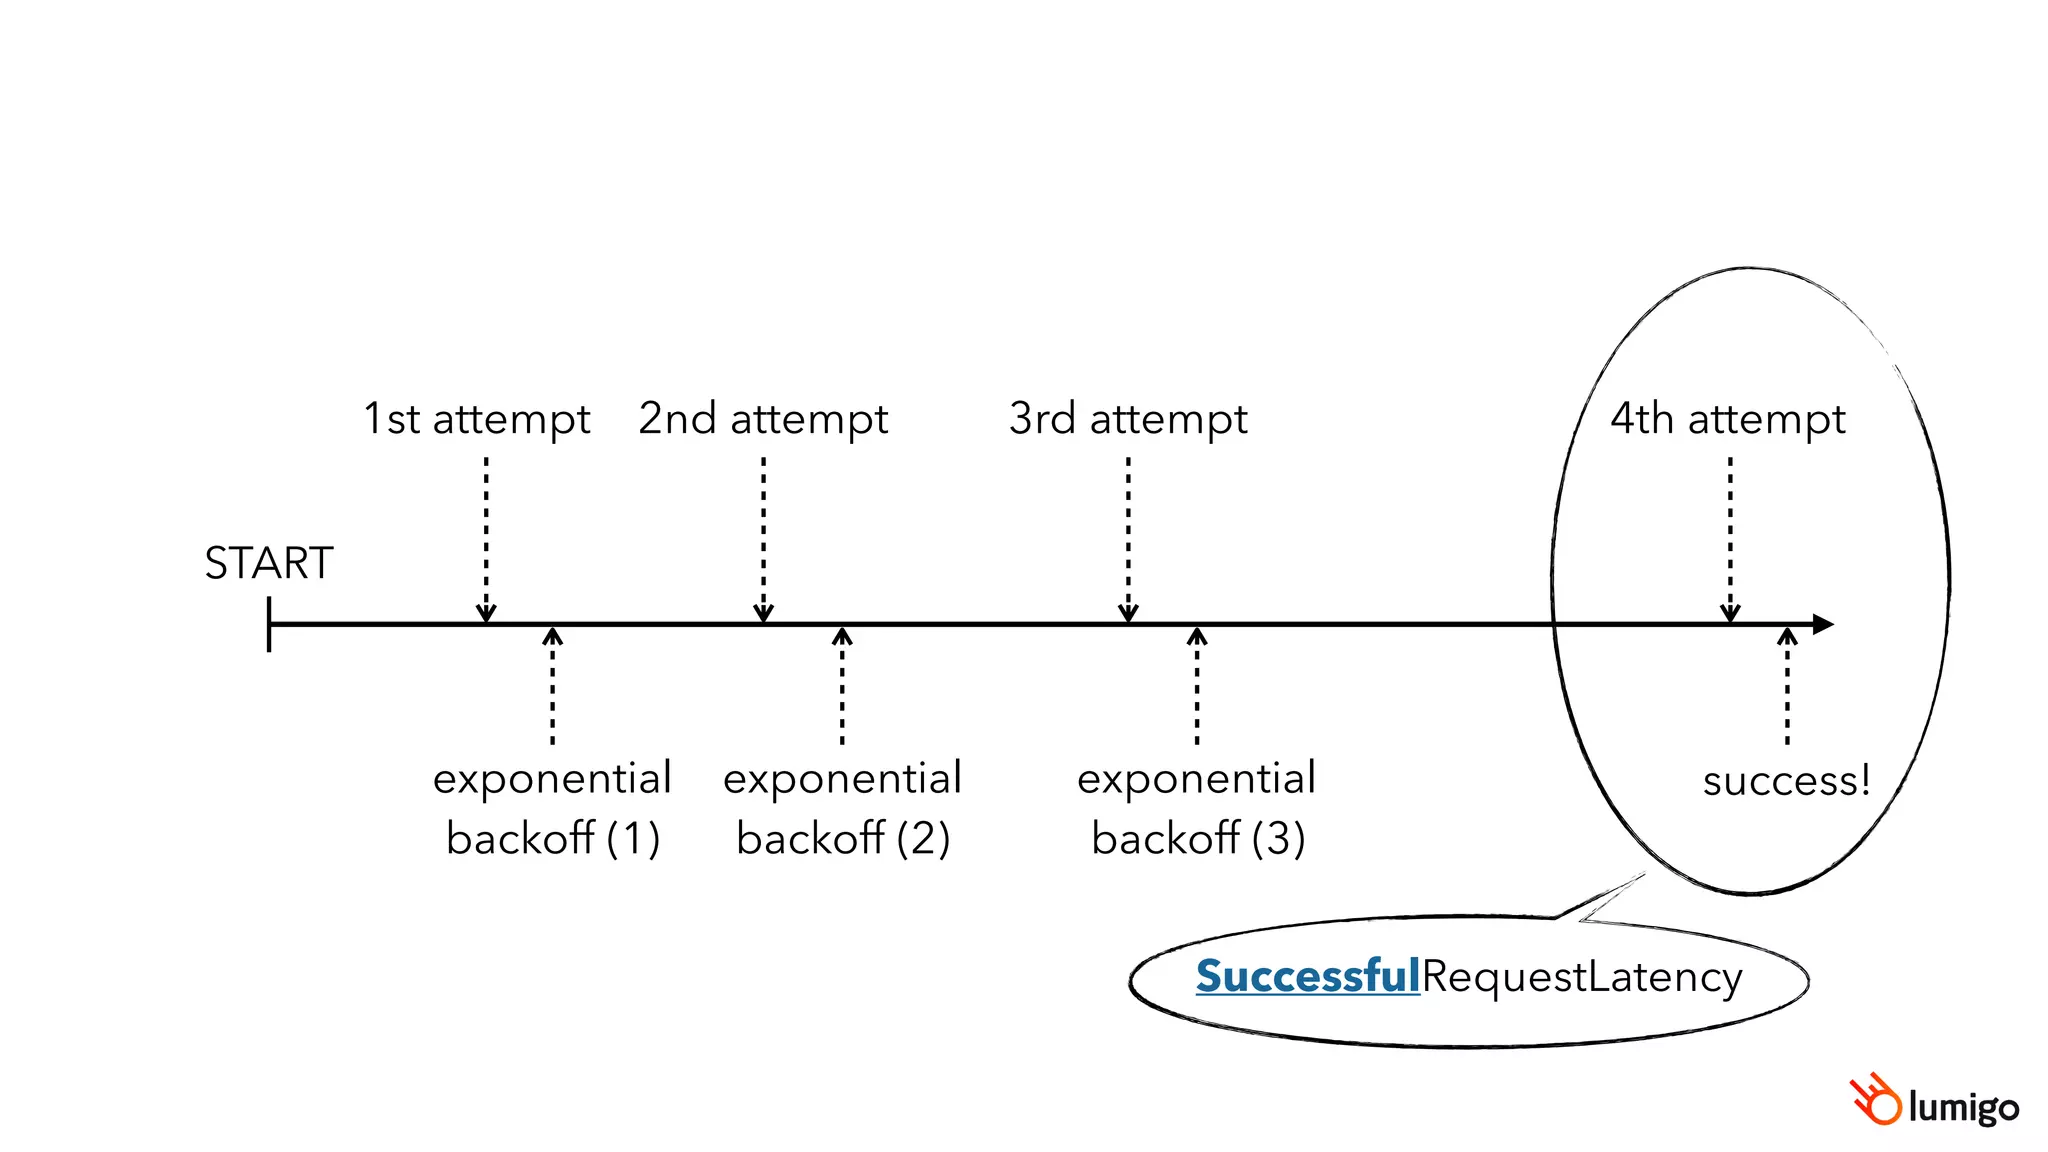
![SuccessfulRequestLatency
[DynamoDB]
Duration
[Lambda]
Lambda’s
allocation time
API Gateway’s latency
overhead IntegrationLatency
[API Gateway]
Latency
[API Gateway]](https://image.slidesharecdn.com/howtodebugslowlambdaresponsetimes-200912230629/85/How-to-debug-slow-lambda-response-times-54-320.jpg)
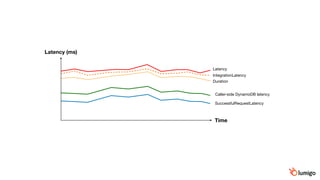
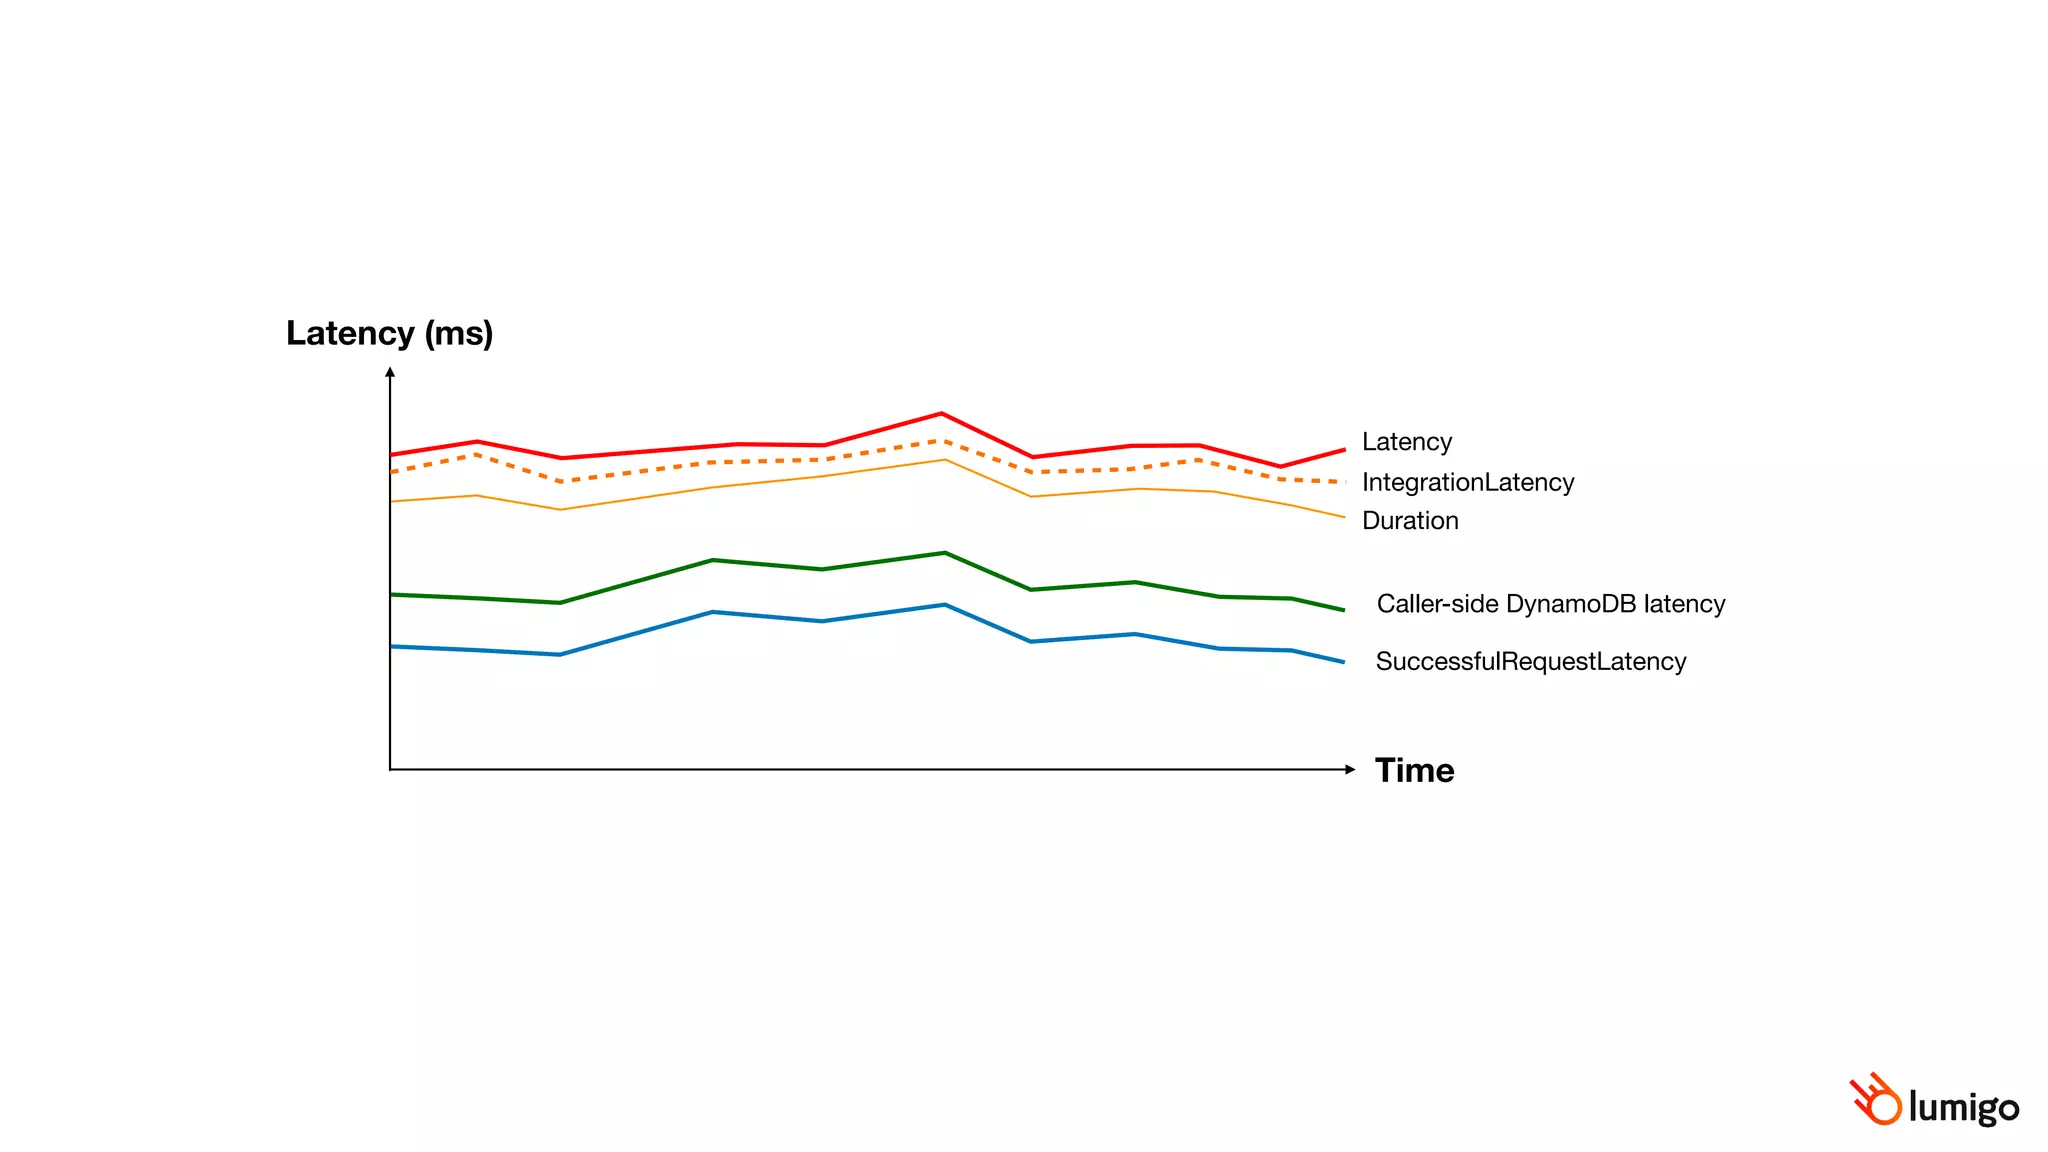
![Caller-side DynamoDB latency
[custom metric]
SuccessfulRequestLatency
[DynamoDB]
Duration
[Lambda]
Lambda’s
allocation time
API Gateway’s latency
overhead IntegrationLatency
[API Gateway]
Latency
[API Gateway]](https://image.slidesharecdn.com/howtodebugslowlambdaresponsetimes-200912230629/85/How-to-debug-slow-lambda-response-times-55-320.jpg)
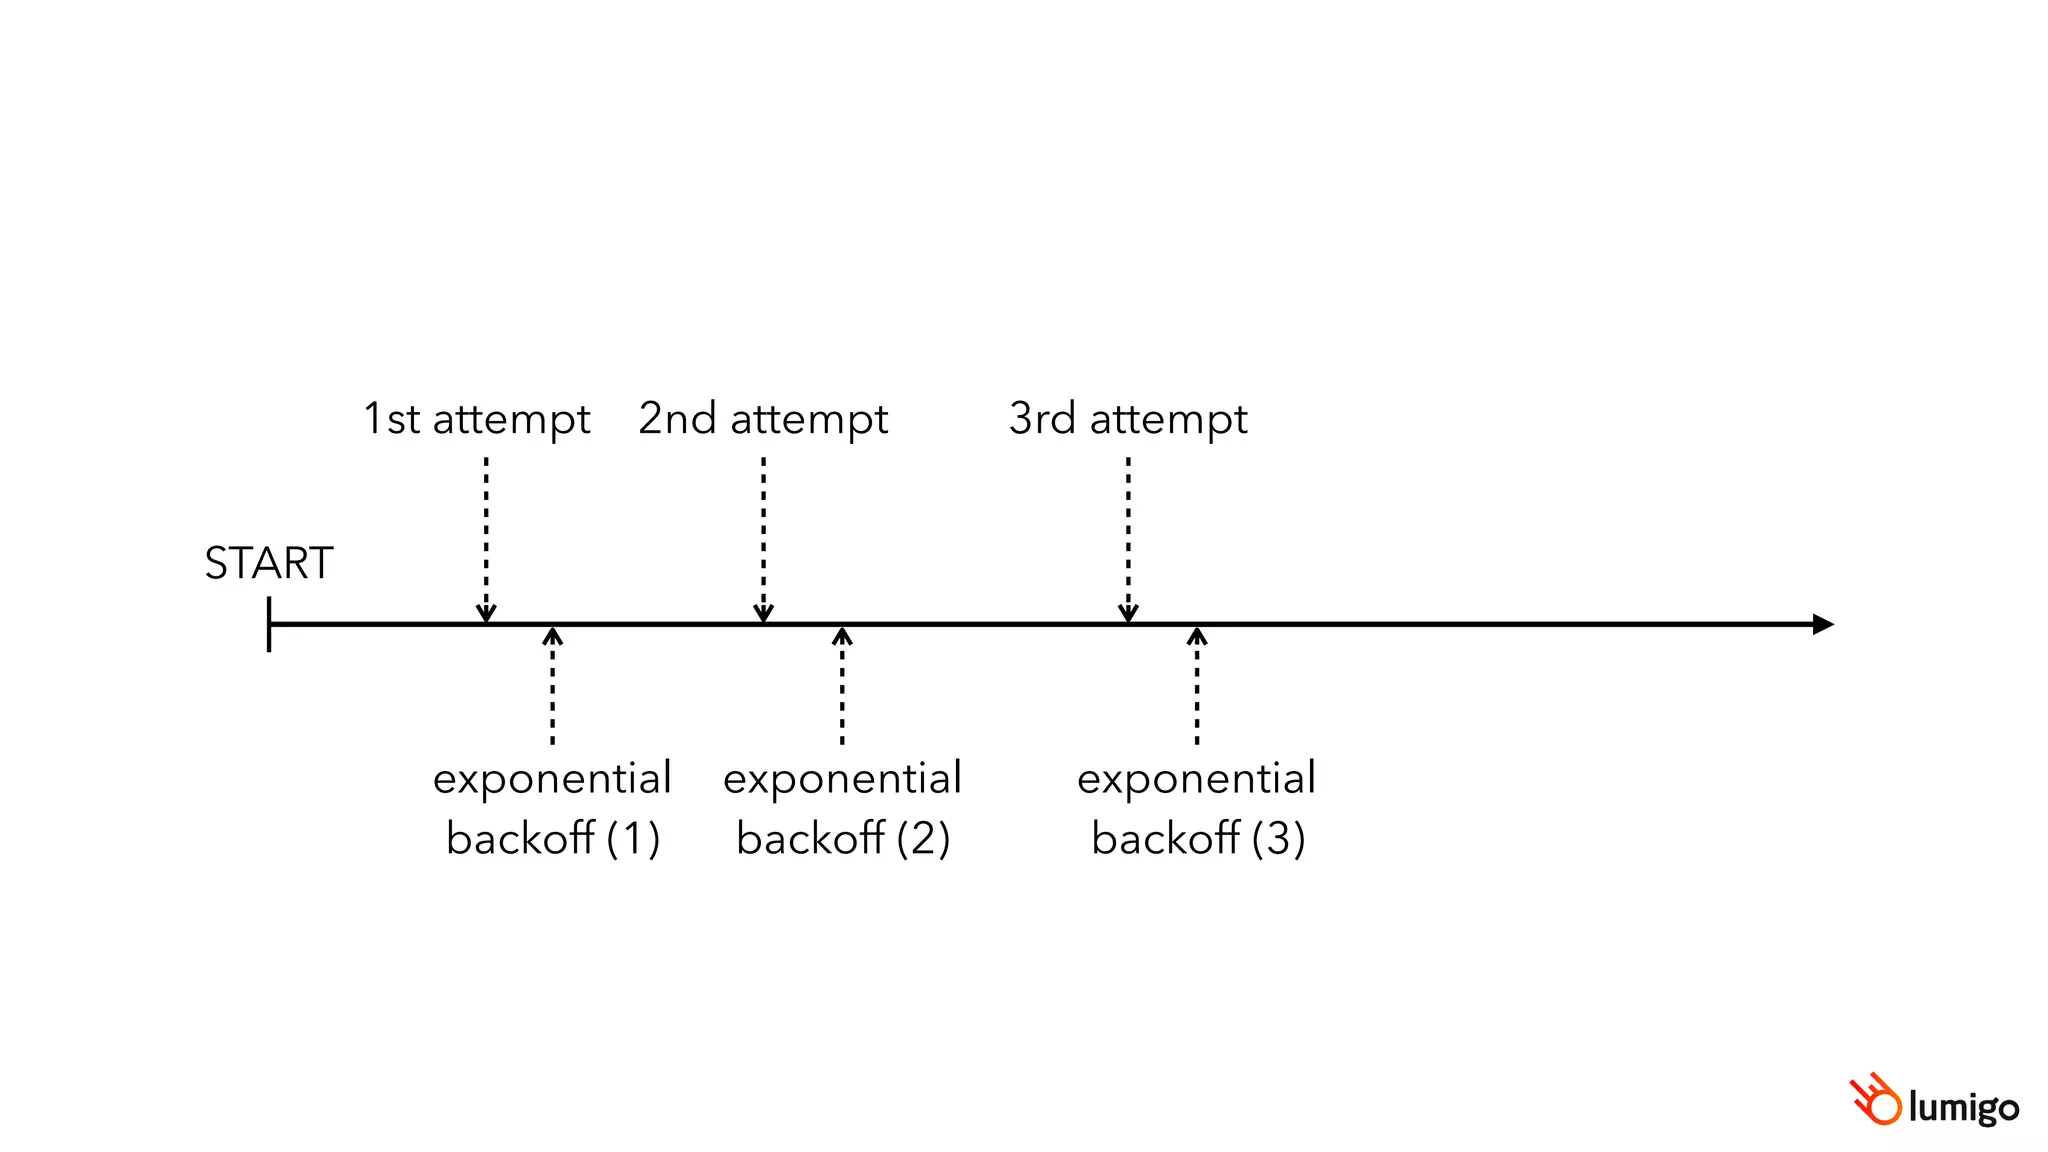
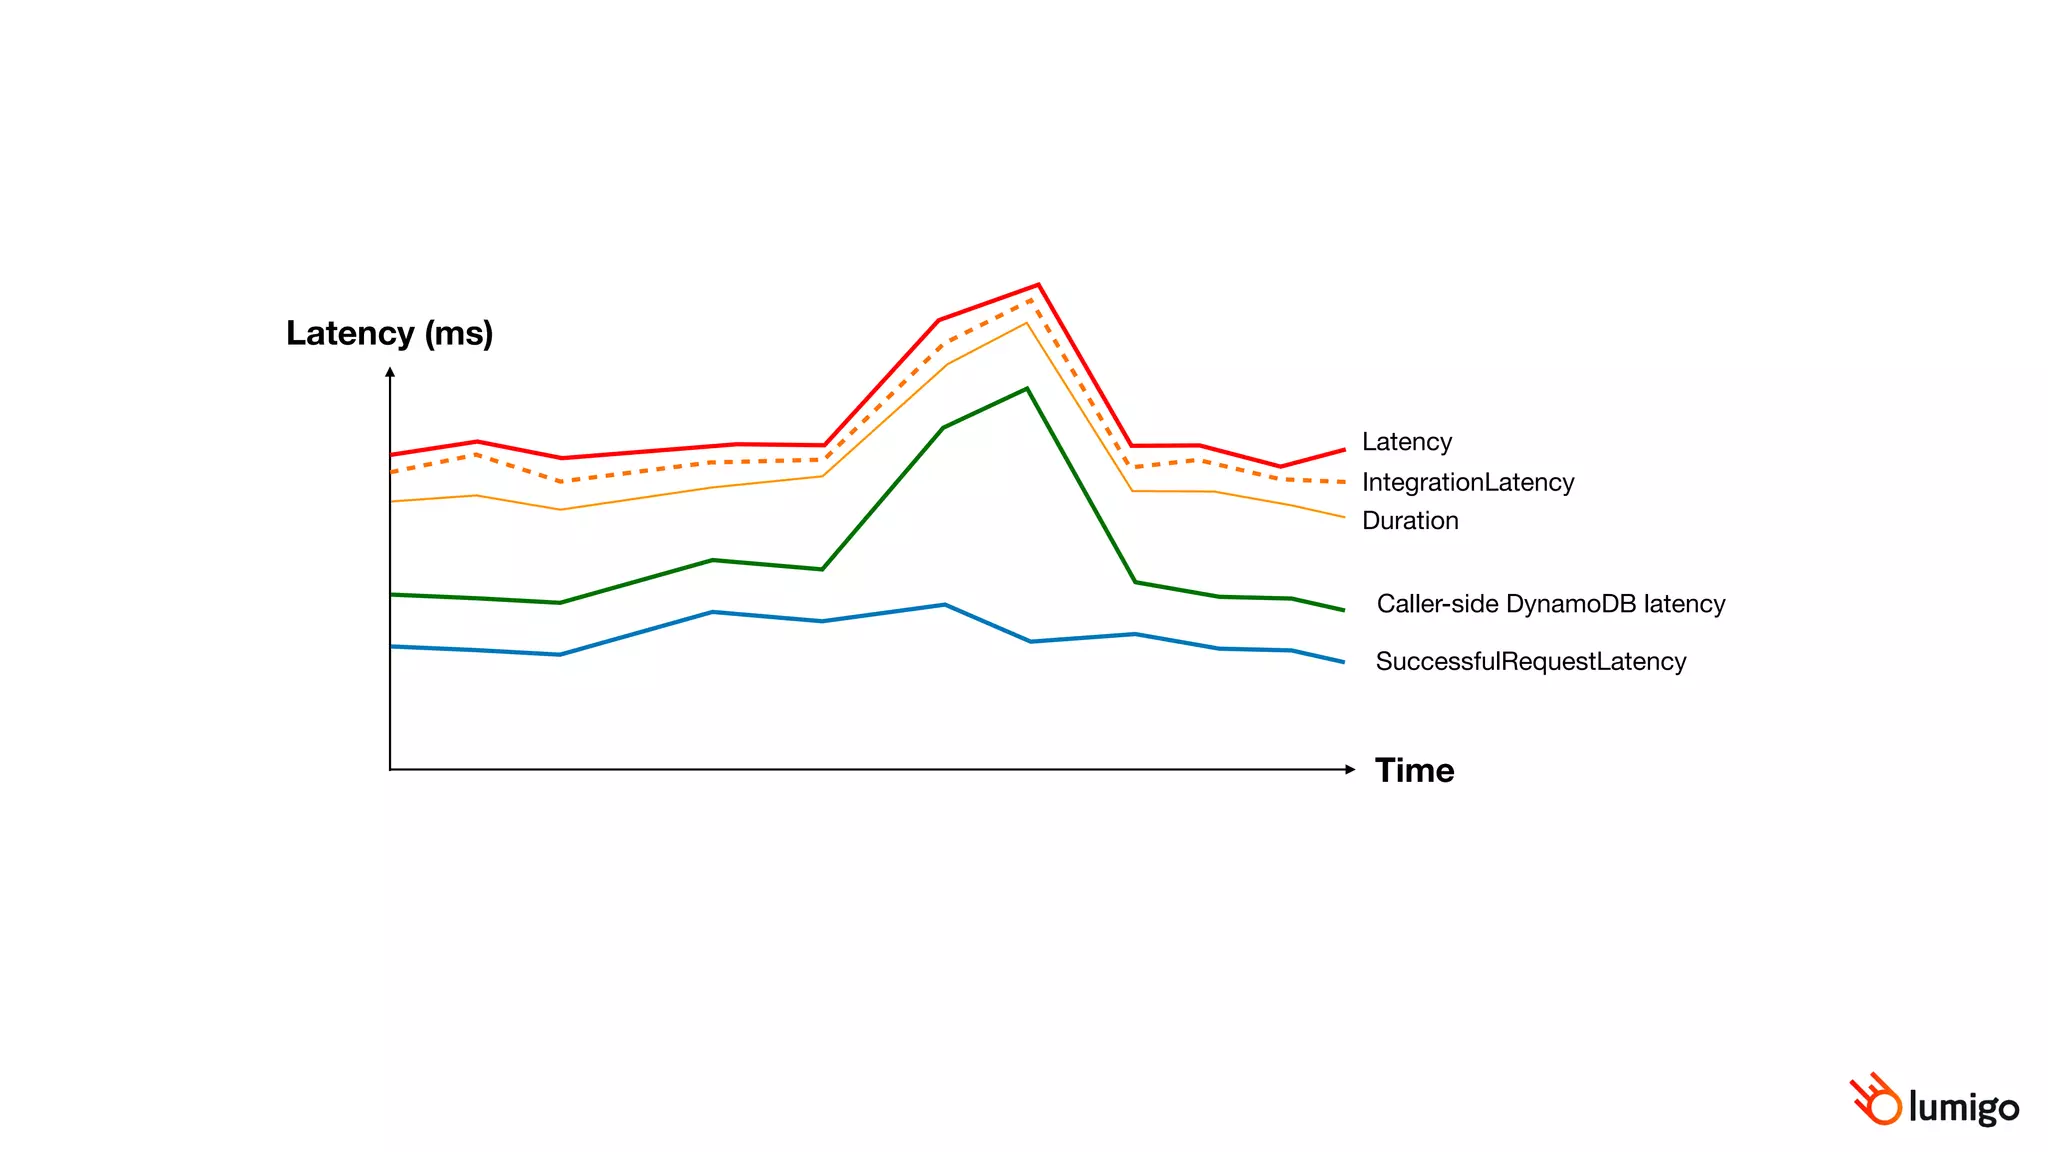
![Caller-side retries
(mostly)
Caller-side DynamoDB latency
[custom metric]
SuccessfulRequestLatency
[DynamoDB]
Duration
[Lambda]
Lambda’s
allocation time
API Gateway’s latency
overhead IntegrationLatency
[API Gateway]
Latency
[API Gateway]](https://image.slidesharecdn.com/howtodebugslowlambdaresponsetimes-200912230629/85/How-to-debug-slow-lambda-response-times-56-320.jpg)


![Latency
[API Gateway]](https://image.slidesharecdn.com/howtodebugslowlambdaresponsetimes-200912230629/75/How-to-debug-slow-lambda-response-times-49-2048.jpg)
![IntegrationLatency
[API Gateway]
Latency
[API Gateway]](https://image.slidesharecdn.com/howtodebugslowlambdaresponsetimes-200912230629/75/How-to-debug-slow-lambda-response-times-50-2048.jpg)
![API Gateway’s latency
overhead IntegrationLatency
[API Gateway]
Latency
[API Gateway]](https://image.slidesharecdn.com/howtodebugslowlambdaresponsetimes-200912230629/75/How-to-debug-slow-lambda-response-times-51-2048.jpg)
![Duration
[Lambda]
API Gateway’s latency
overhead IntegrationLatency
[API Gateway]
Latency
[API Gateway]](https://image.slidesharecdn.com/howtodebugslowlambdaresponsetimes-200912230629/75/How-to-debug-slow-lambda-response-times-52-2048.jpg)
![Duration
[Lambda]
Lambda’s
allocation time
API Gateway’s latency
overhead IntegrationLatency
[API Gateway]
Latency
[API Gateway]](https://image.slidesharecdn.com/howtodebugslowlambdaresponsetimes-200912230629/75/How-to-debug-slow-lambda-response-times-53-2048.jpg)
![SuccessfulRequestLatency
[DynamoDB]
Duration
[Lambda]
Lambda’s
allocation time
API Gateway’s latency
overhead IntegrationLatency
[API Gateway]
Latency
[API Gateway]](https://image.slidesharecdn.com/howtodebugslowlambdaresponsetimes-200912230629/75/How-to-debug-slow-lambda-response-times-54-2048.jpg)
![Caller-side DynamoDB latency
[custom metric]
SuccessfulRequestLatency
[DynamoDB]
Duration
[Lambda]
Lambda’s
allocation time
API Gateway’s latency
overhead IntegrationLatency
[API Gateway]
Latency
[API Gateway]](https://image.slidesharecdn.com/howtodebugslowlambdaresponsetimes-200912230629/75/How-to-debug-slow-lambda-response-times-55-2048.jpg)
![Caller-side retries
(mostly)
Caller-side DynamoDB latency
[custom metric]
SuccessfulRequestLatency
[DynamoDB]
Duration
[Lambda]
Lambda’s
allocation time
API Gateway’s latency
overhead IntegrationLatency
[API Gateway]
Latency
[API Gateway]](https://image.slidesharecdn.com/howtodebugslowlambdaresponsetimes-200912230629/75/How-to-debug-slow-lambda-response-times-56-2048.jpg)


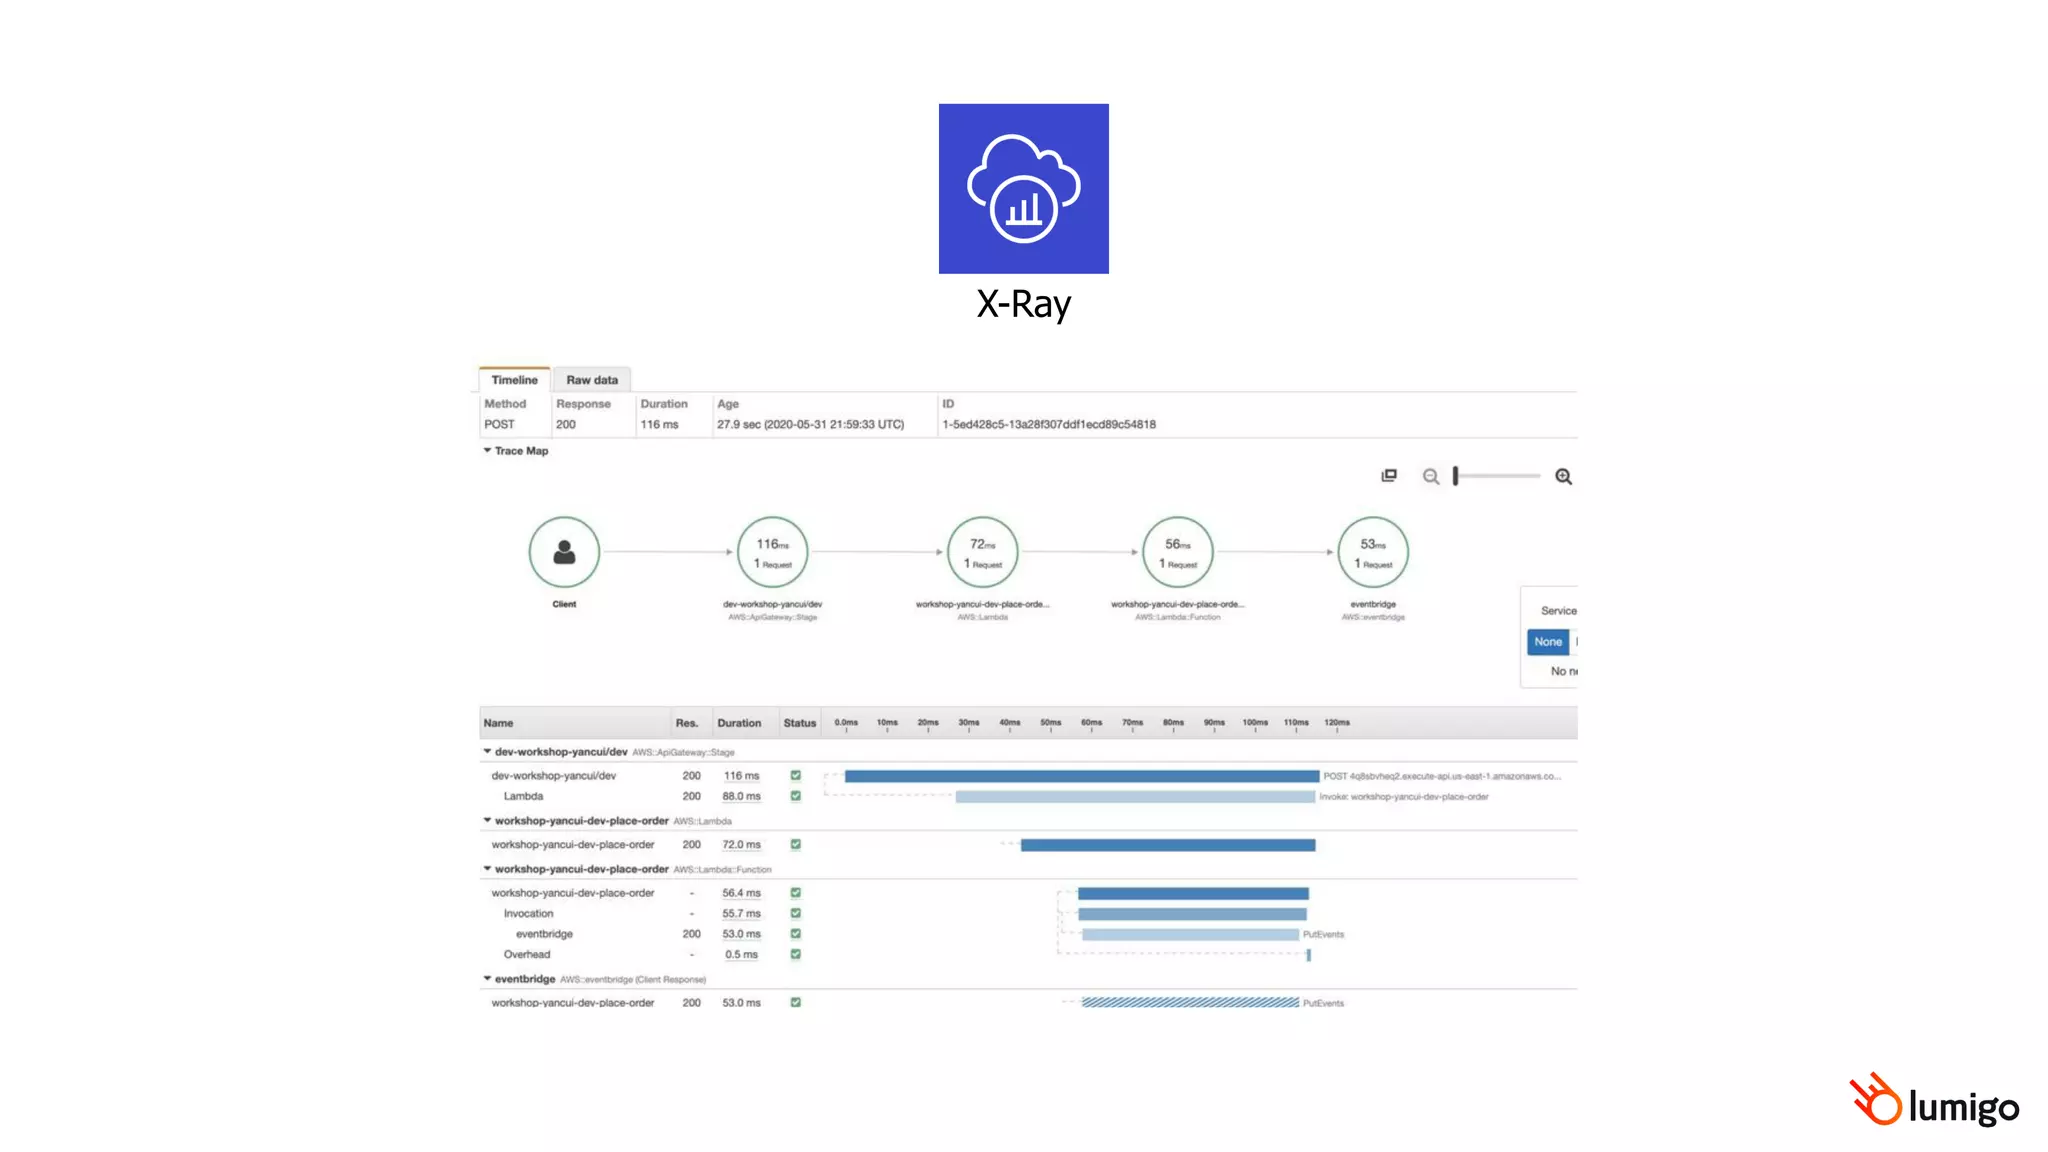

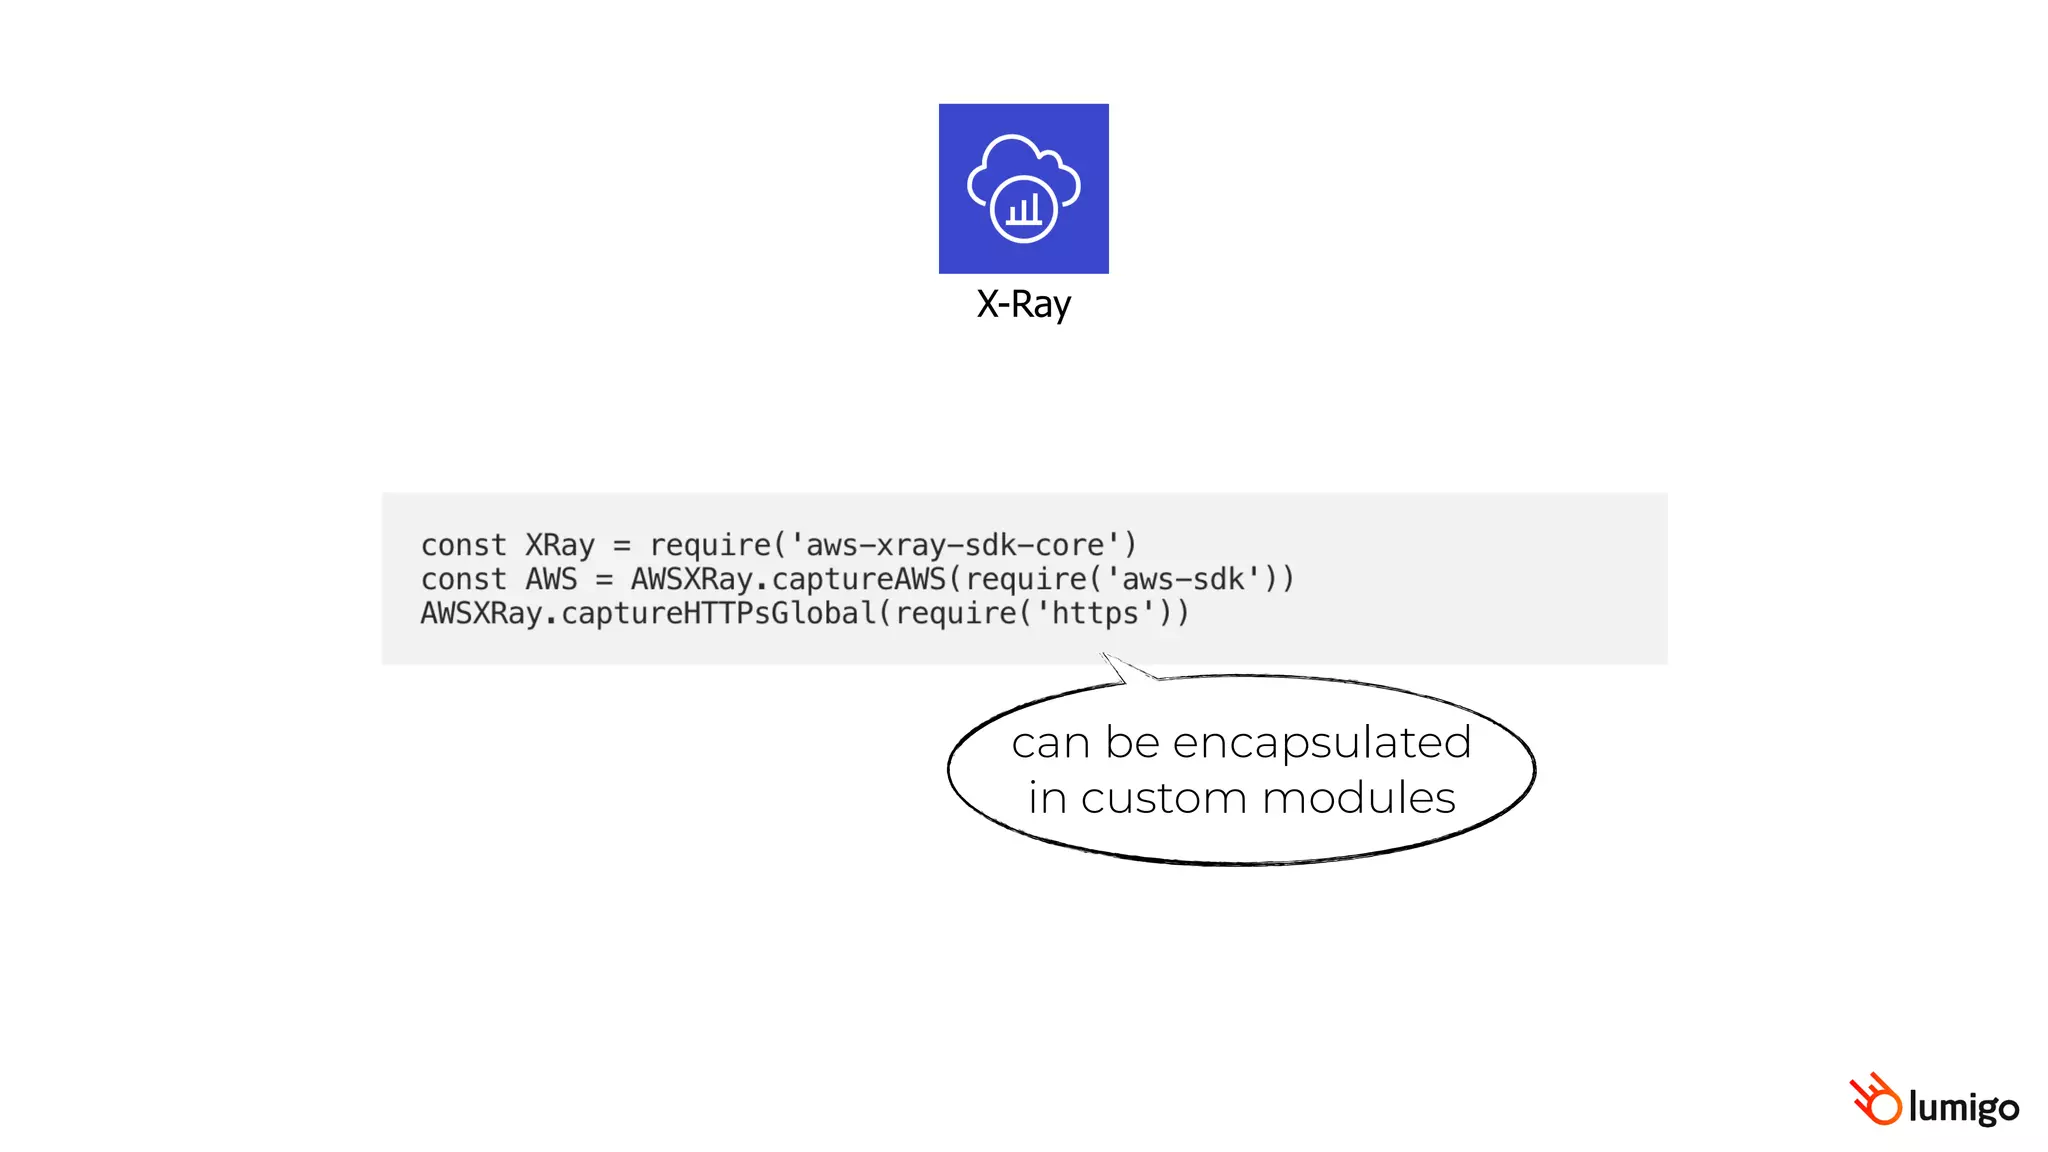

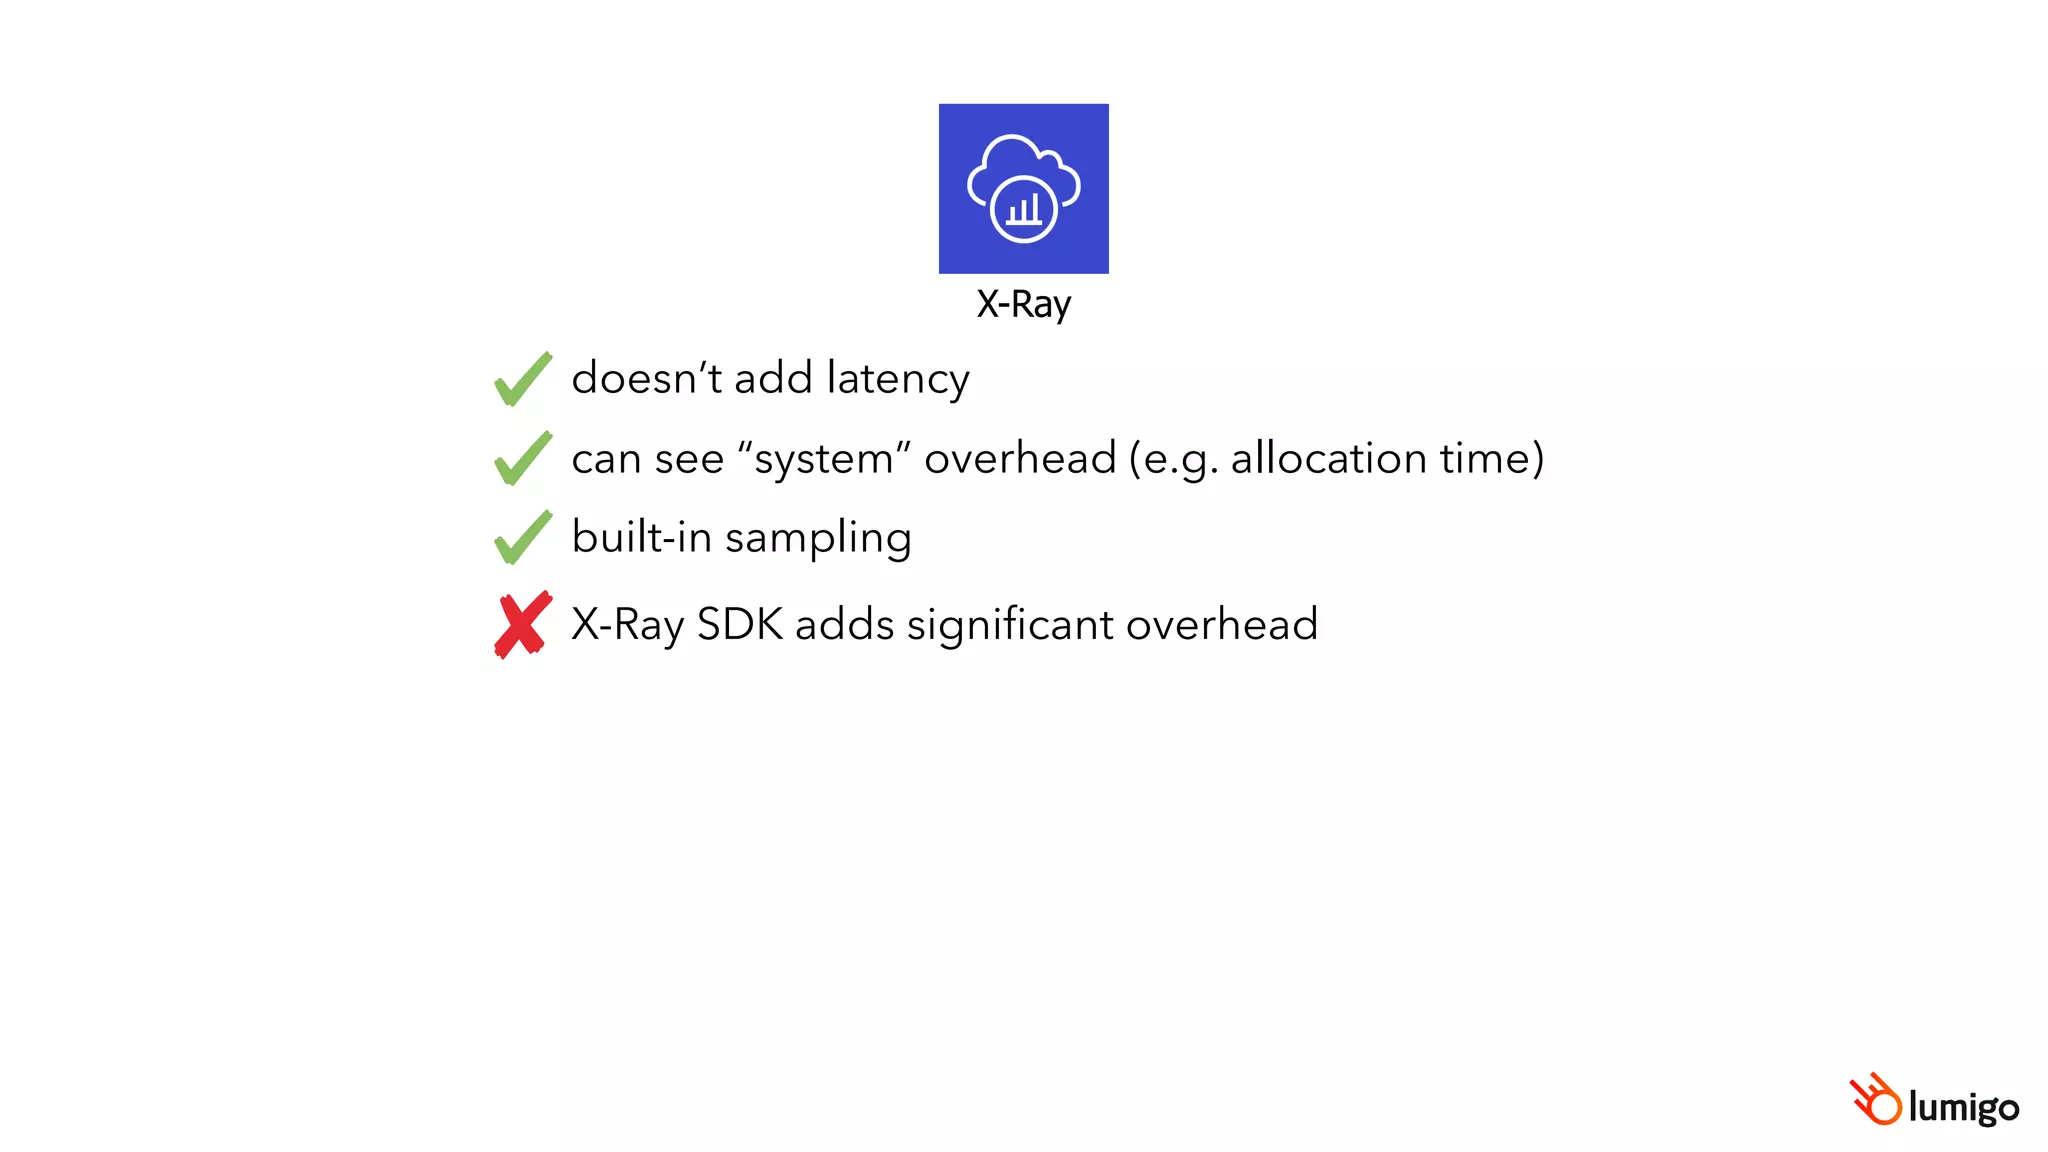


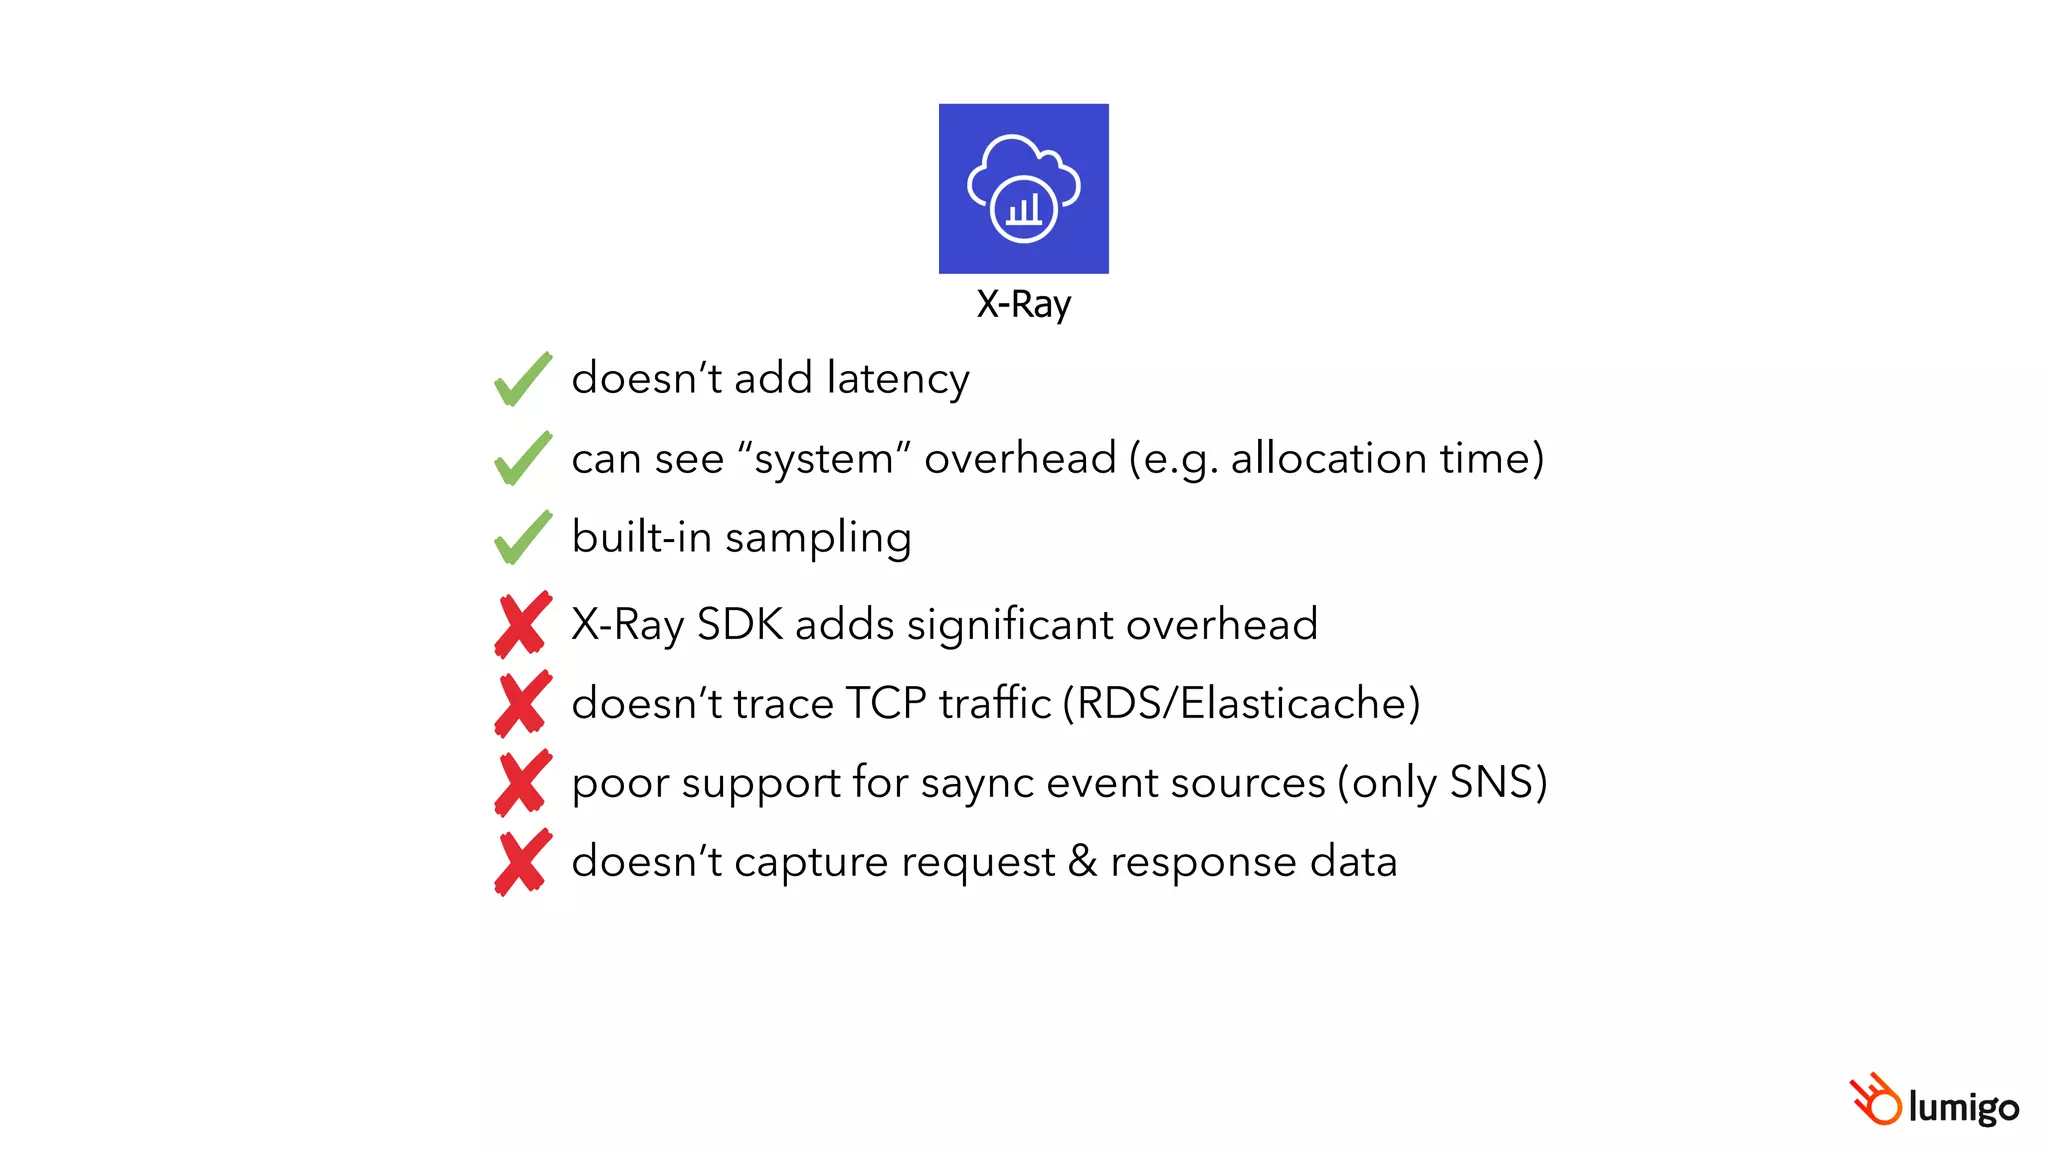
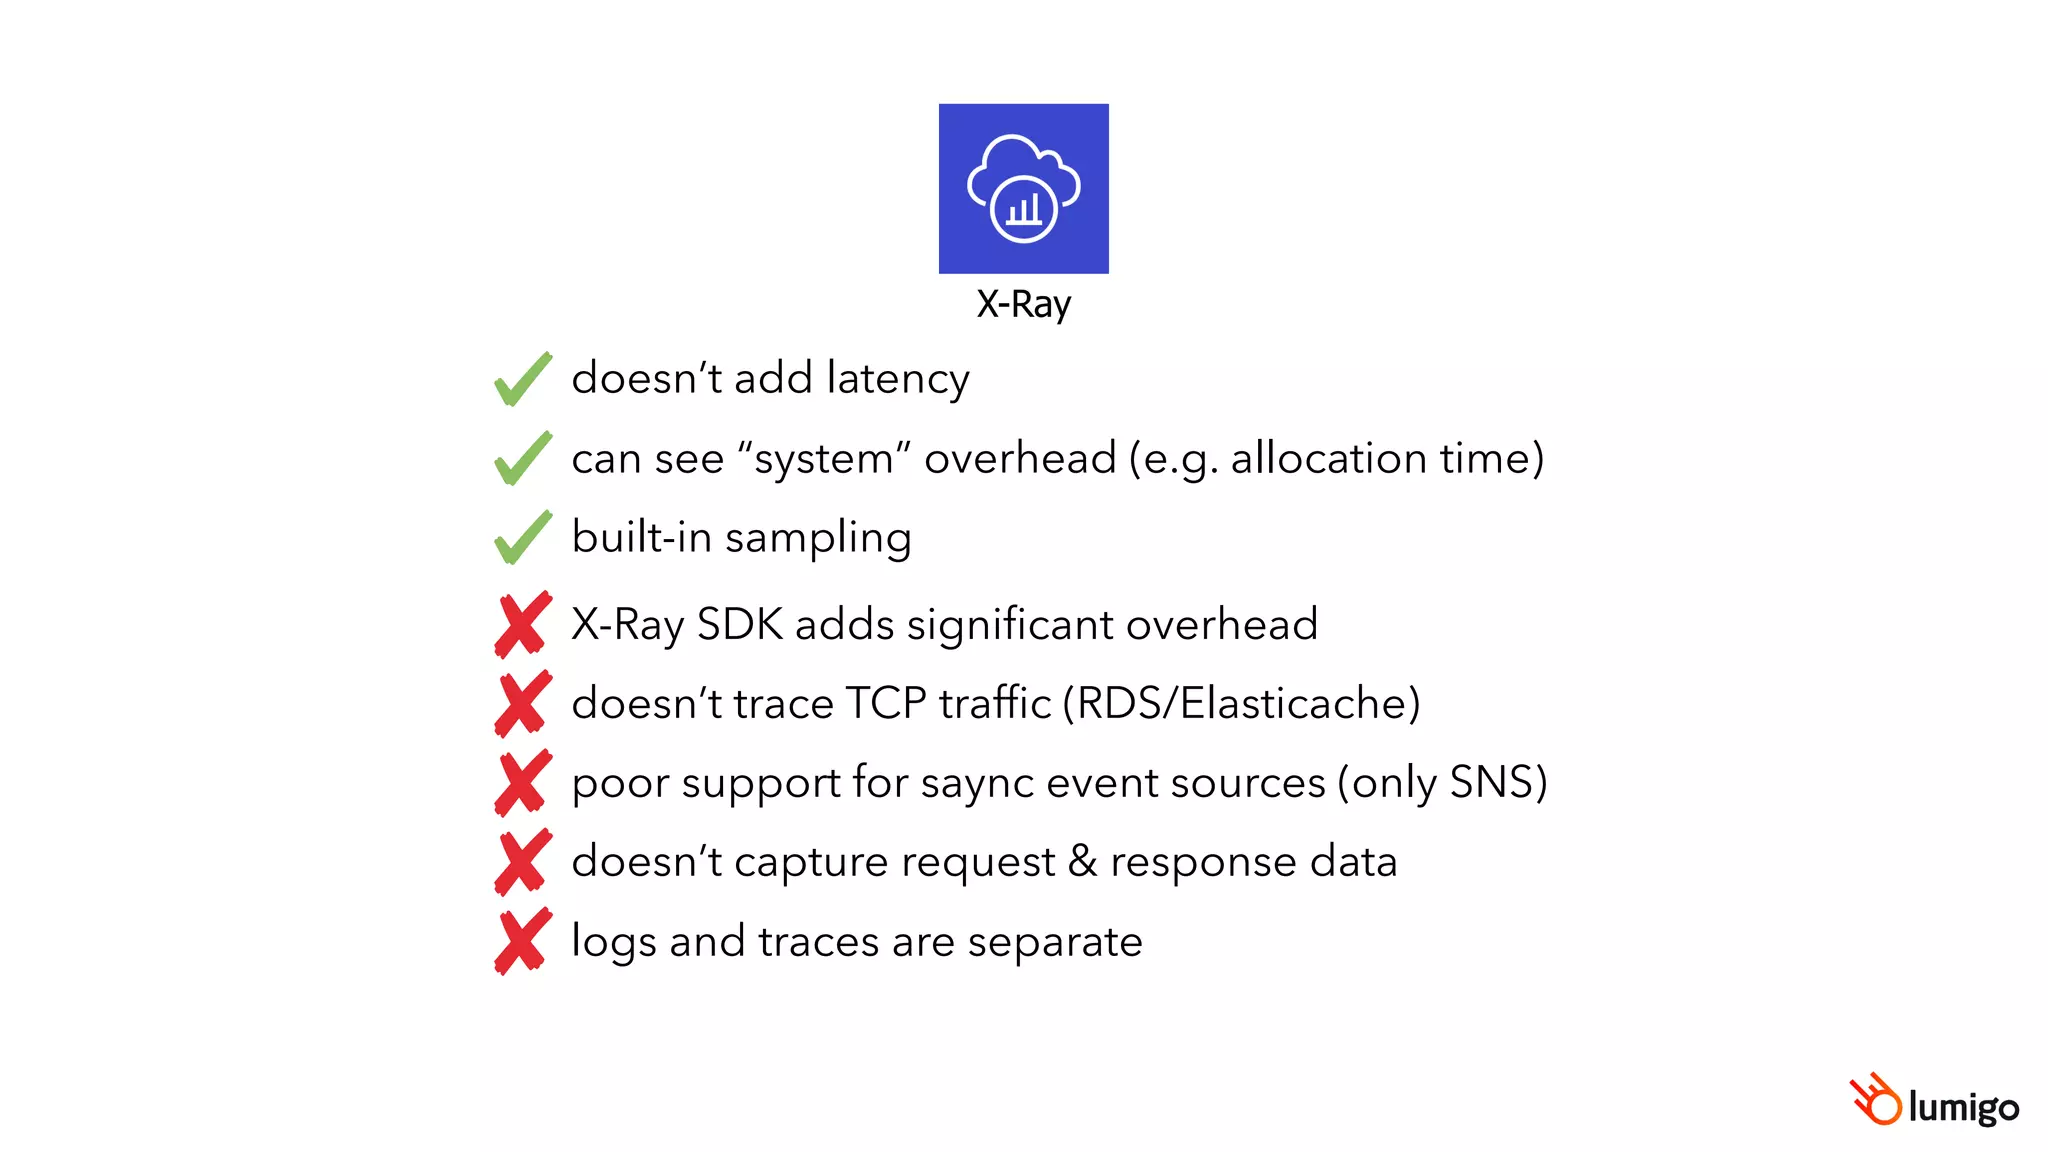
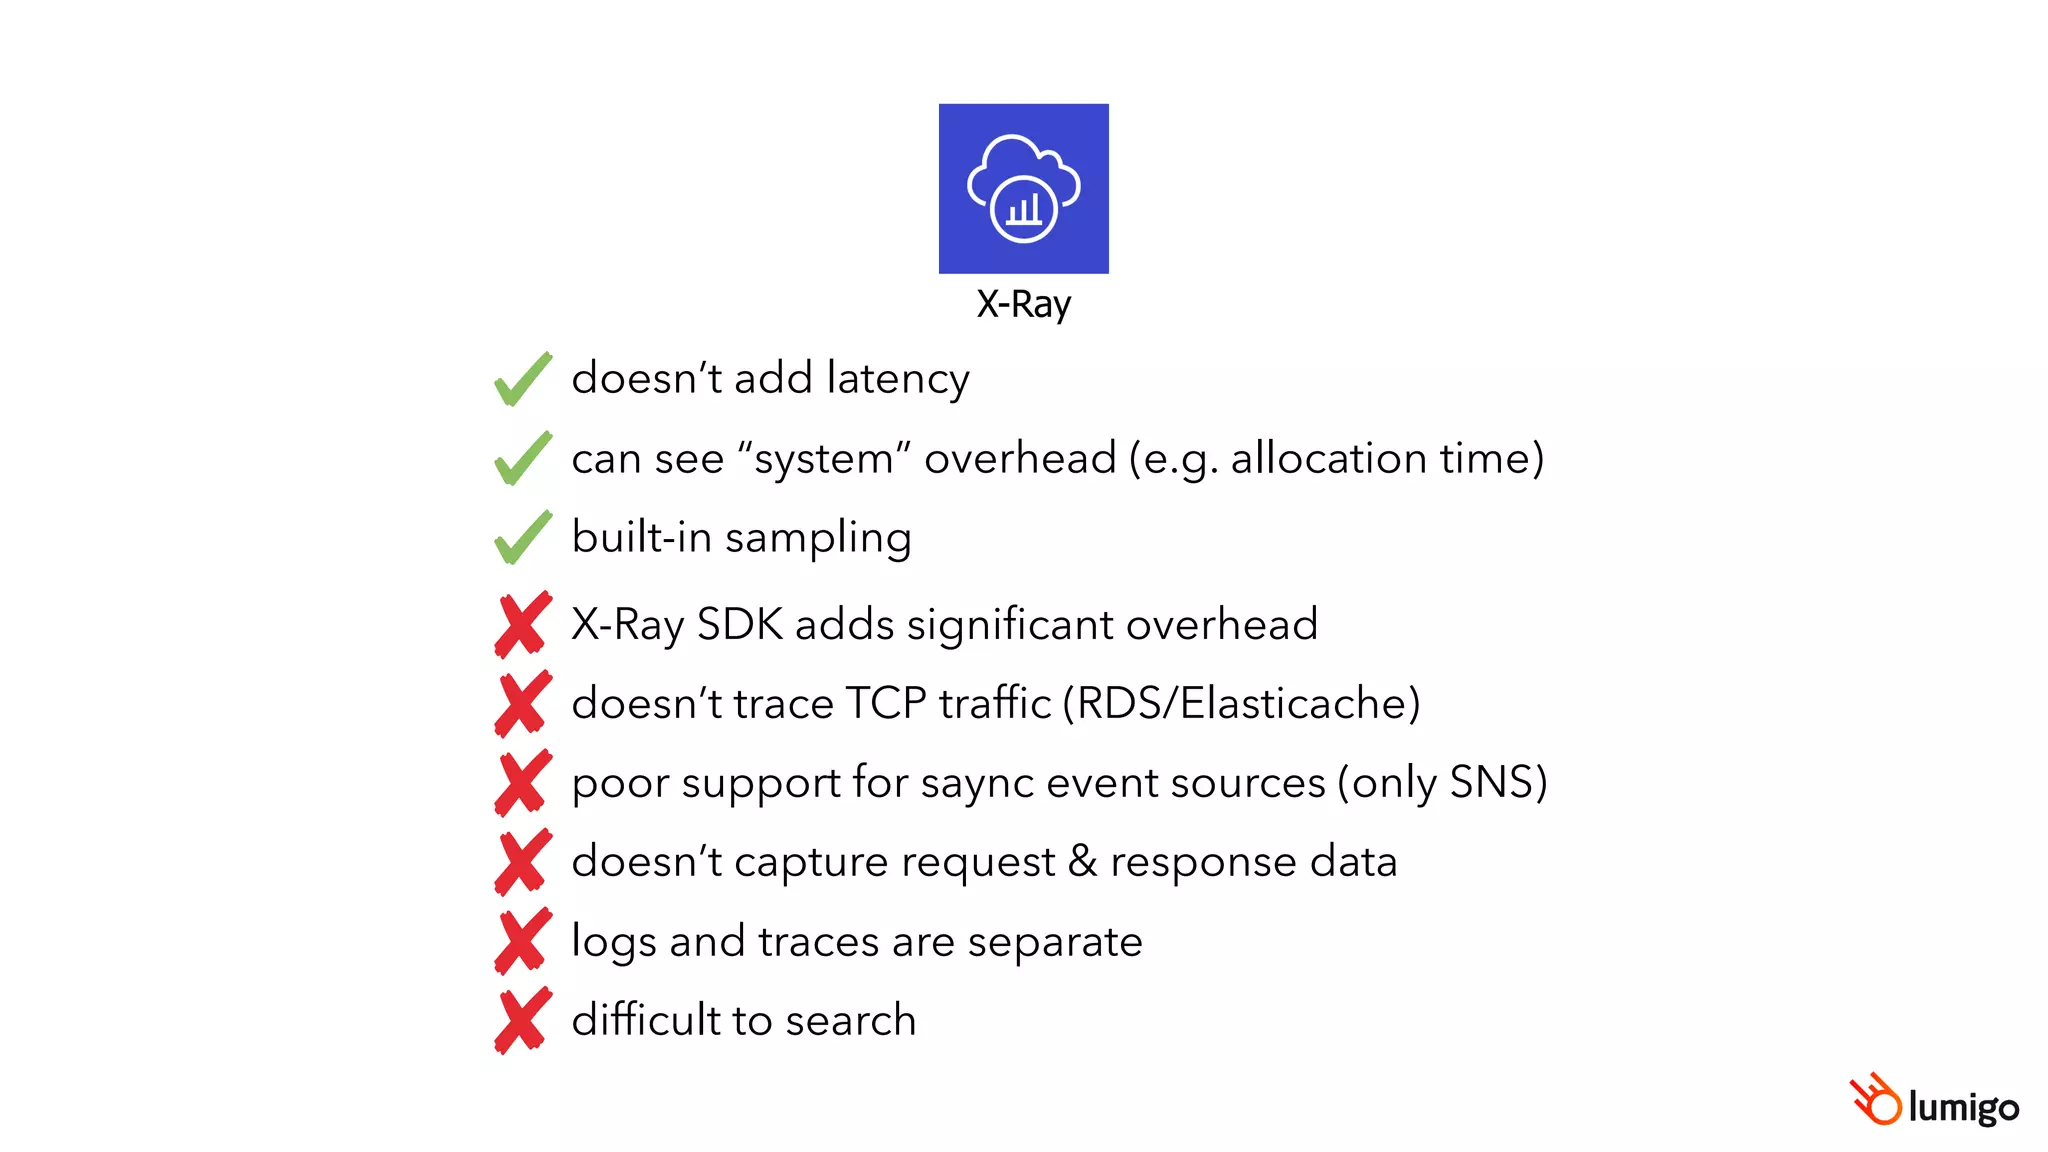


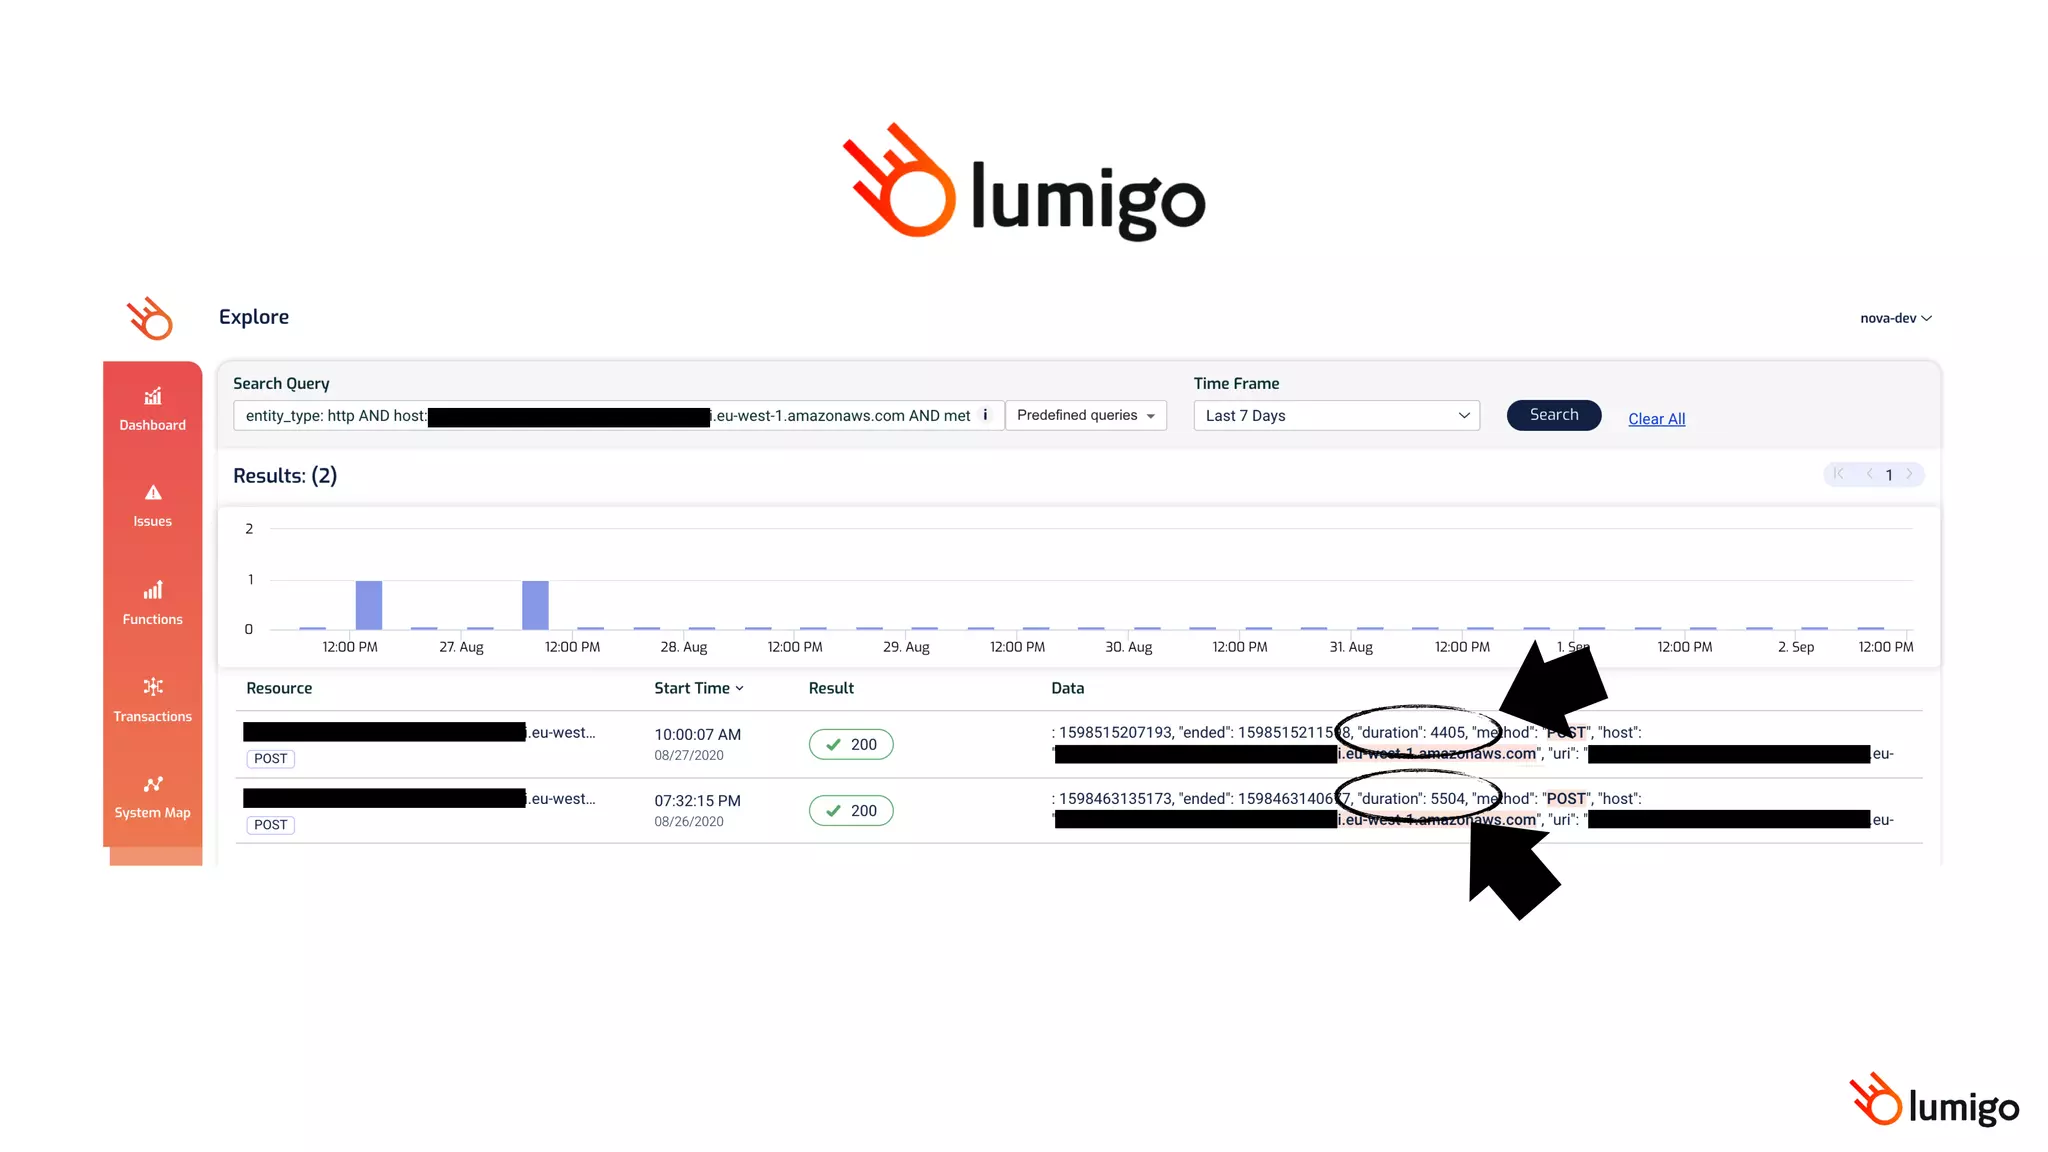
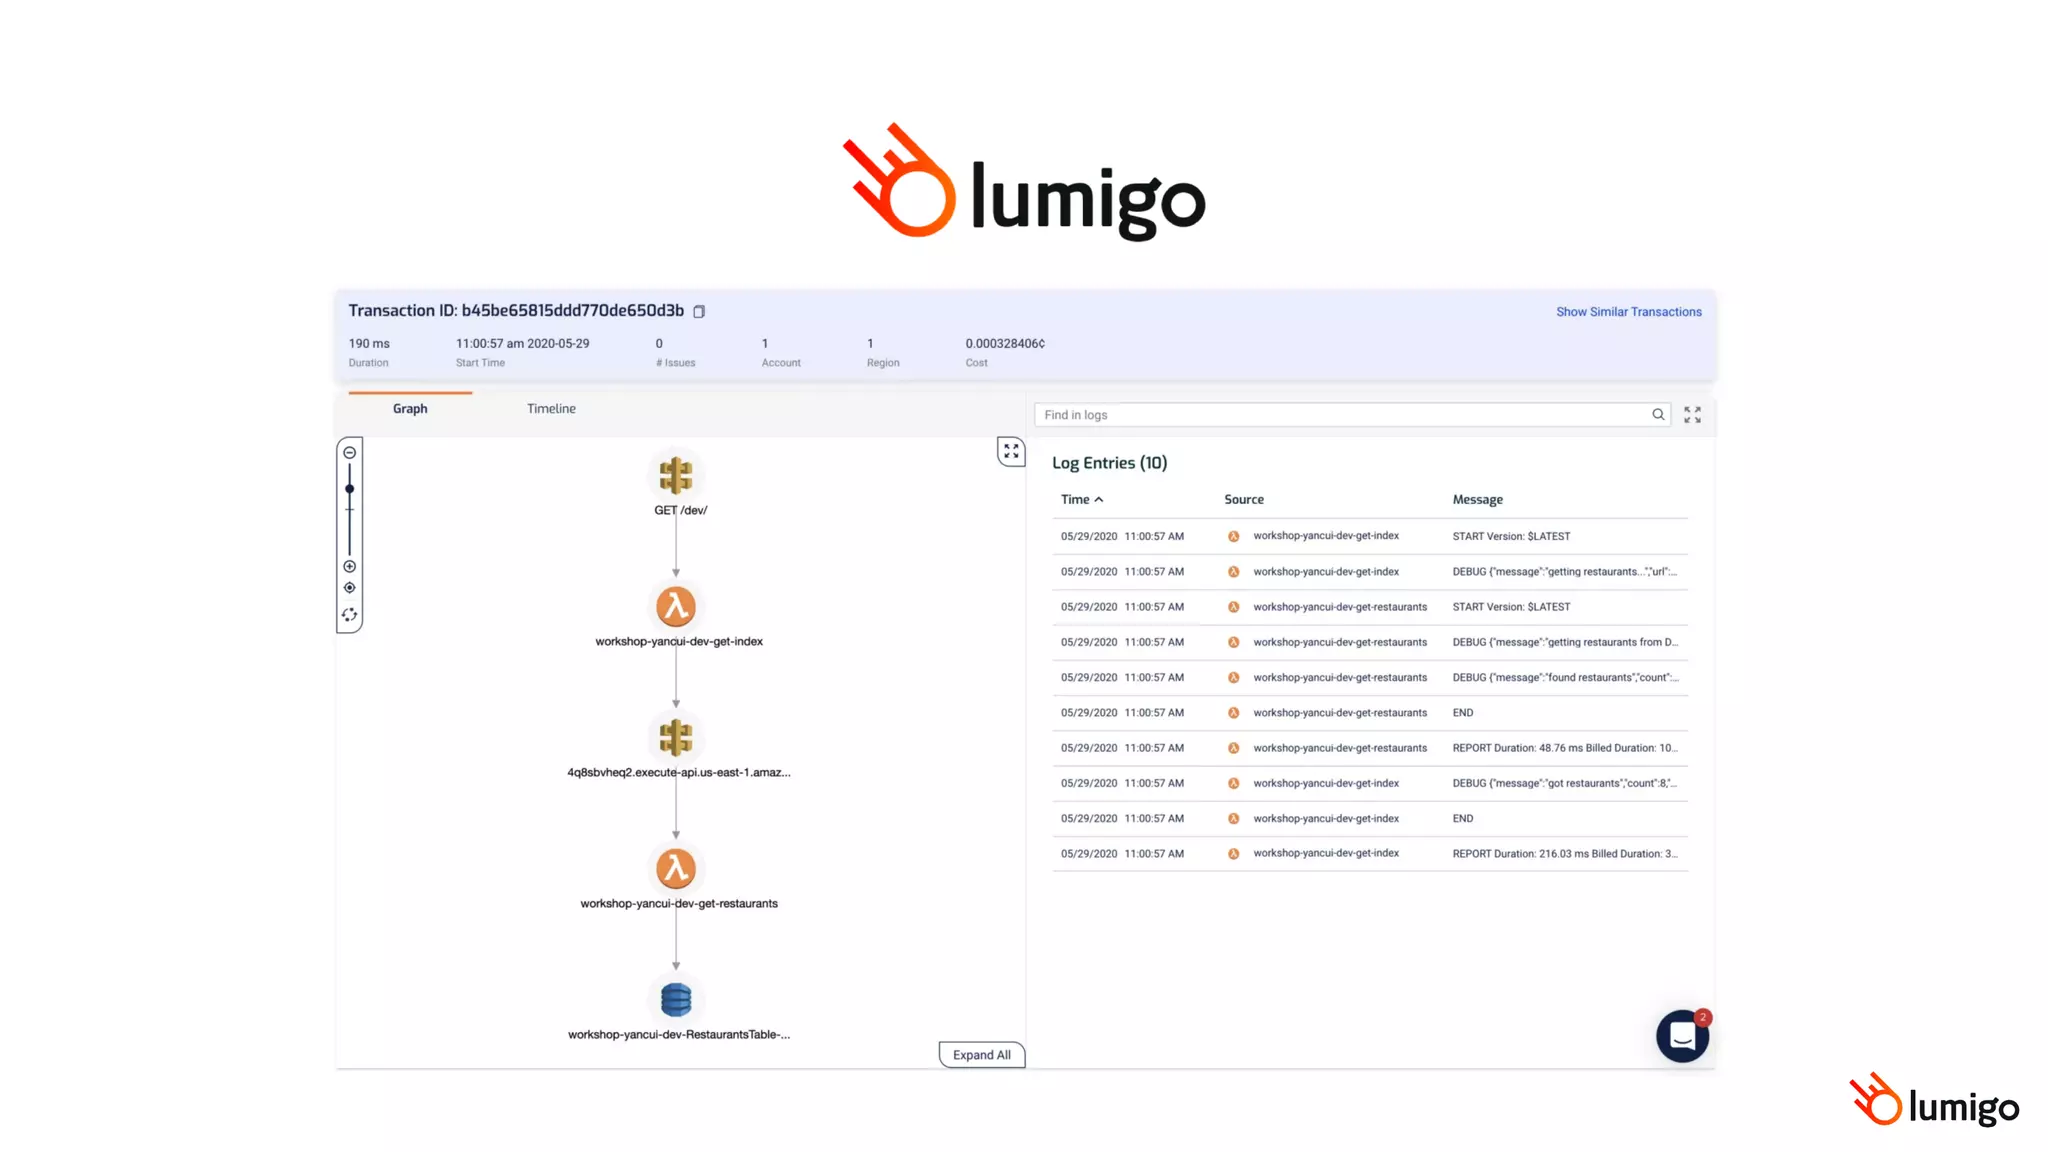
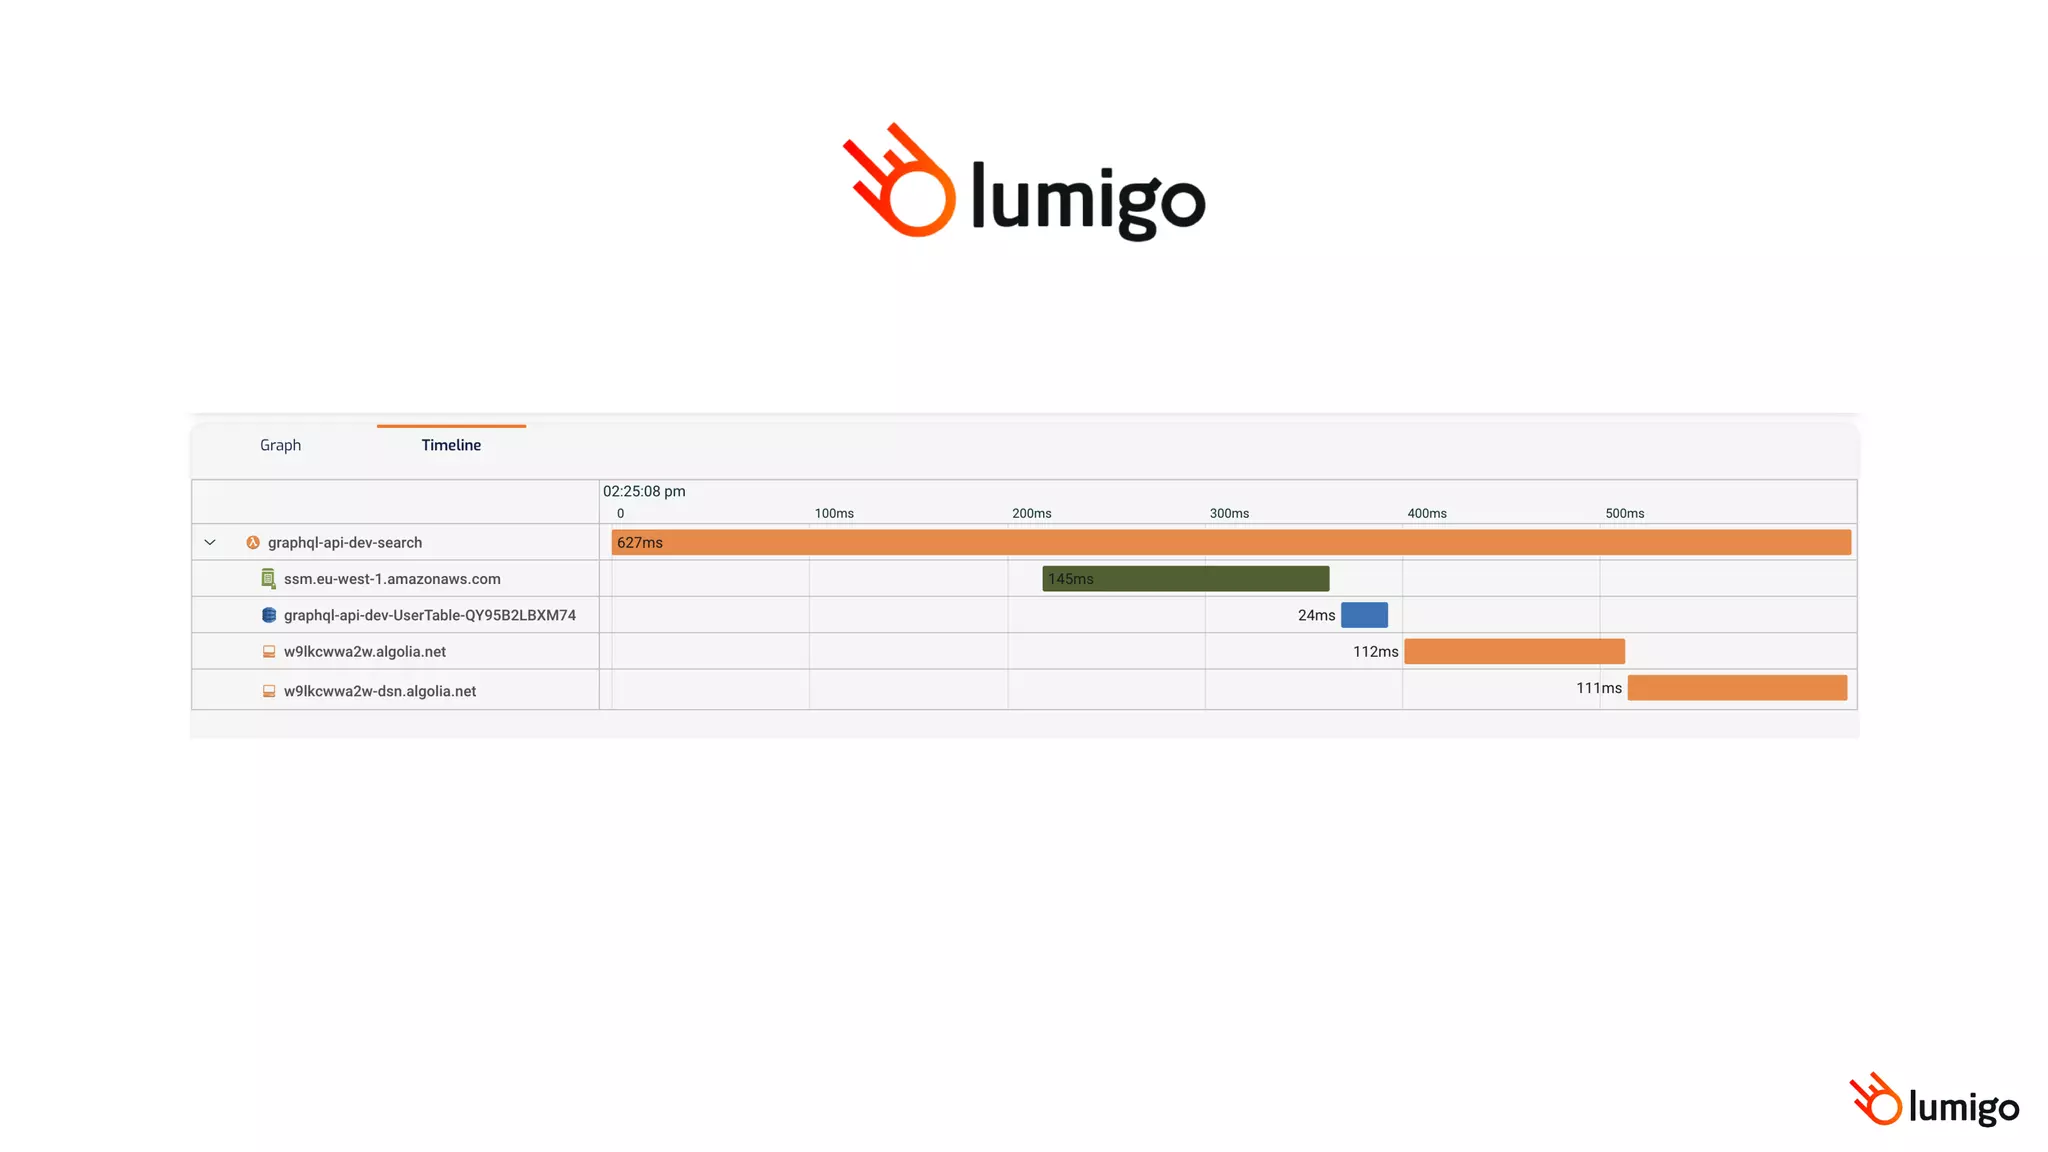

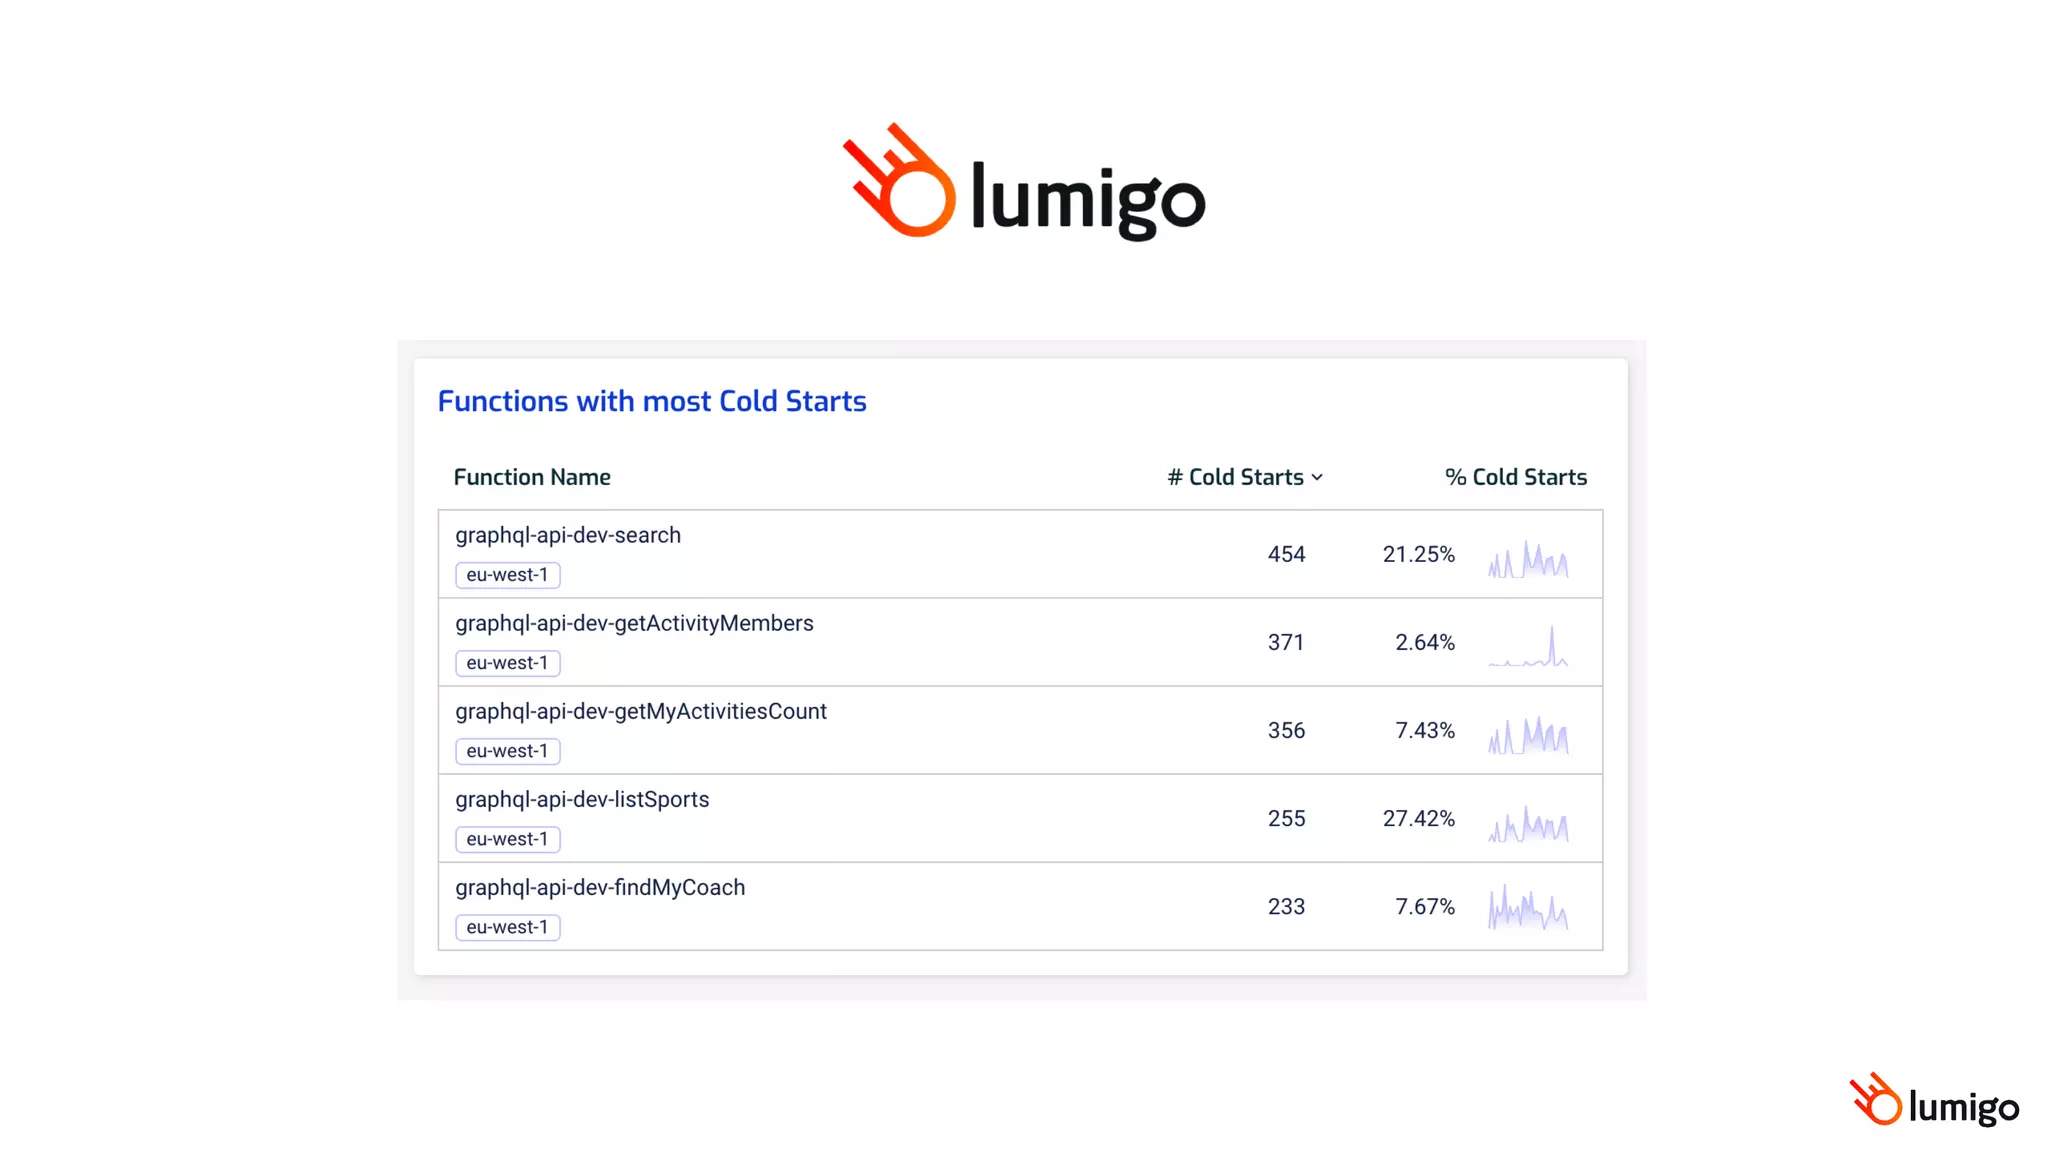
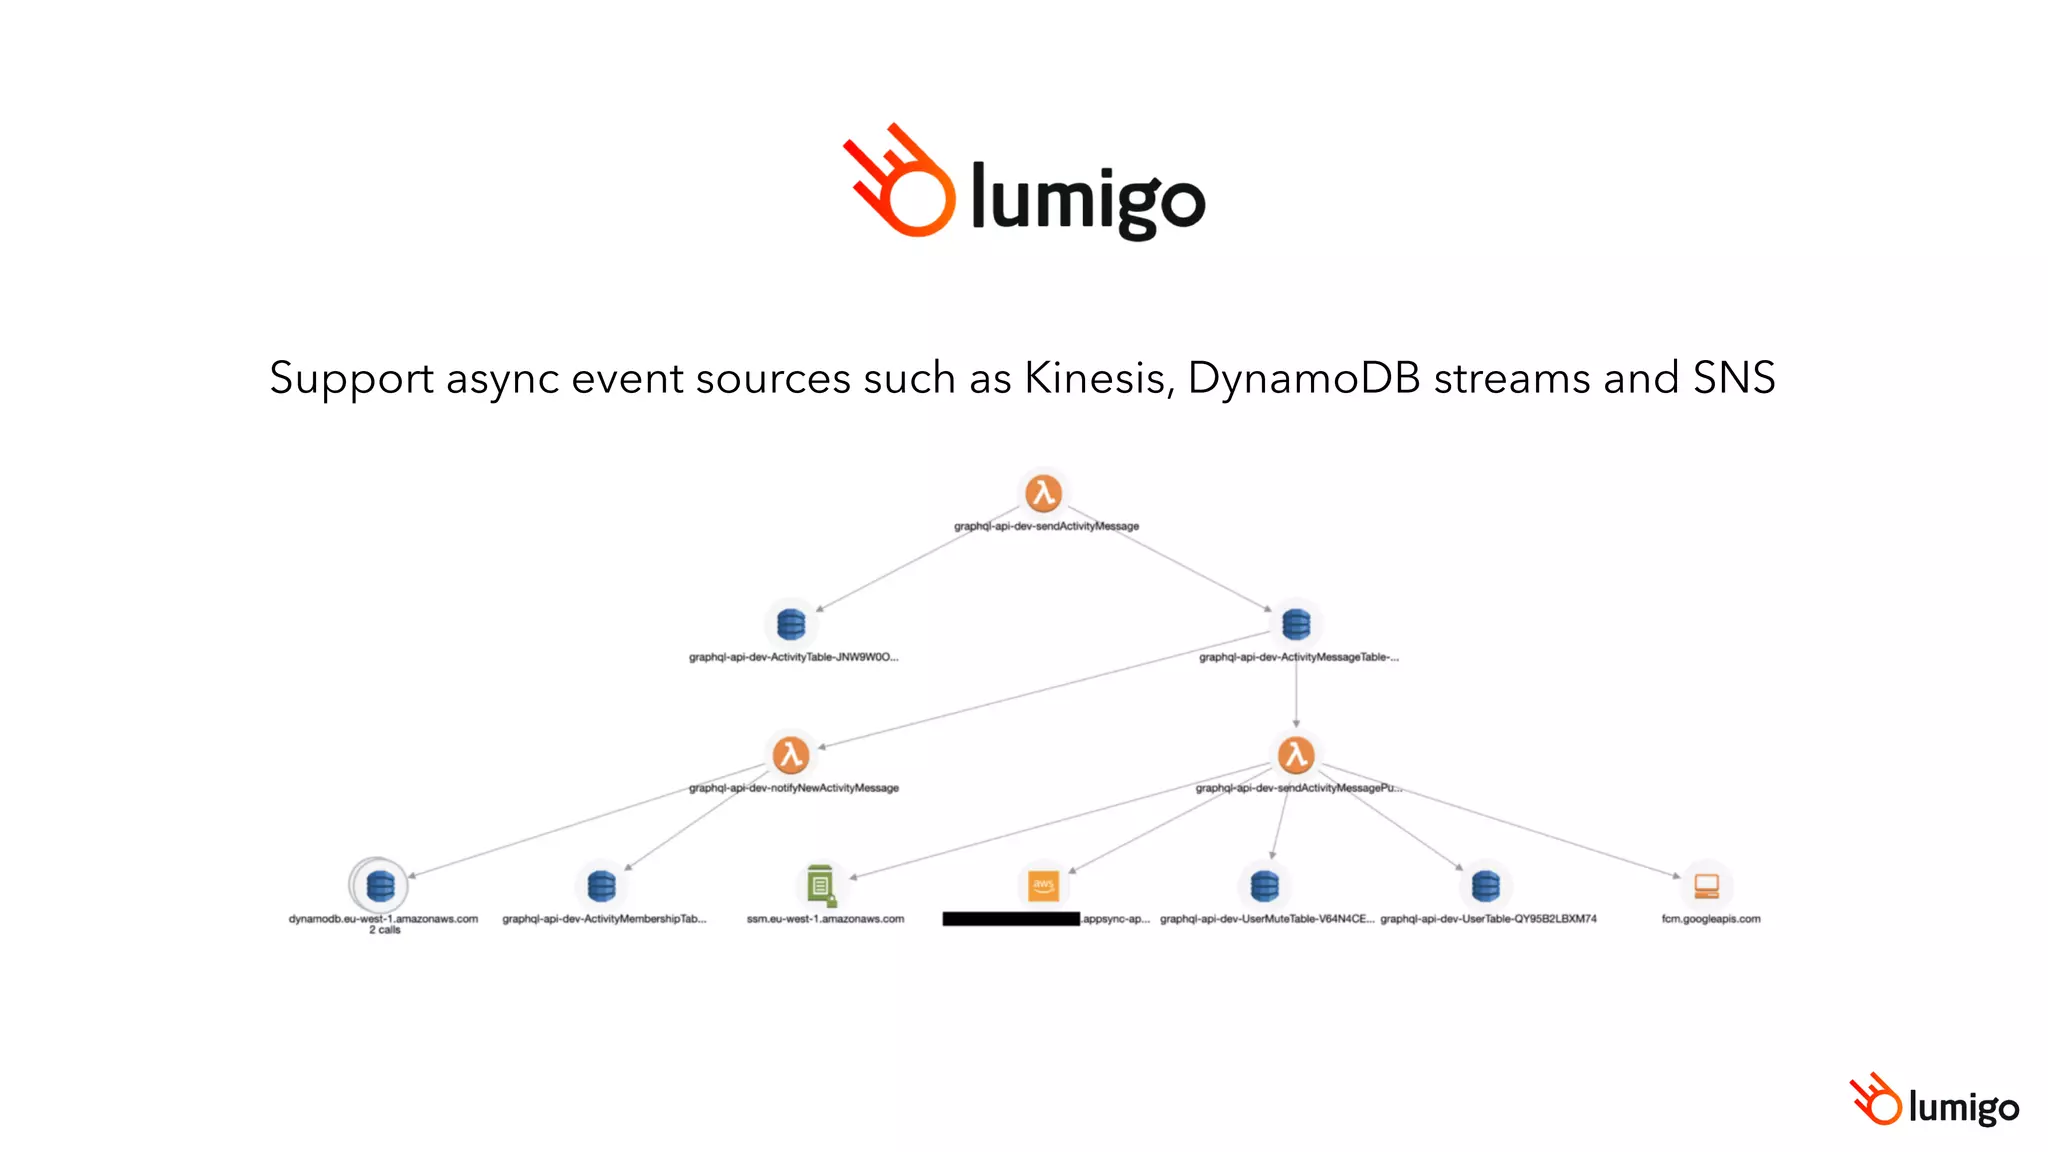
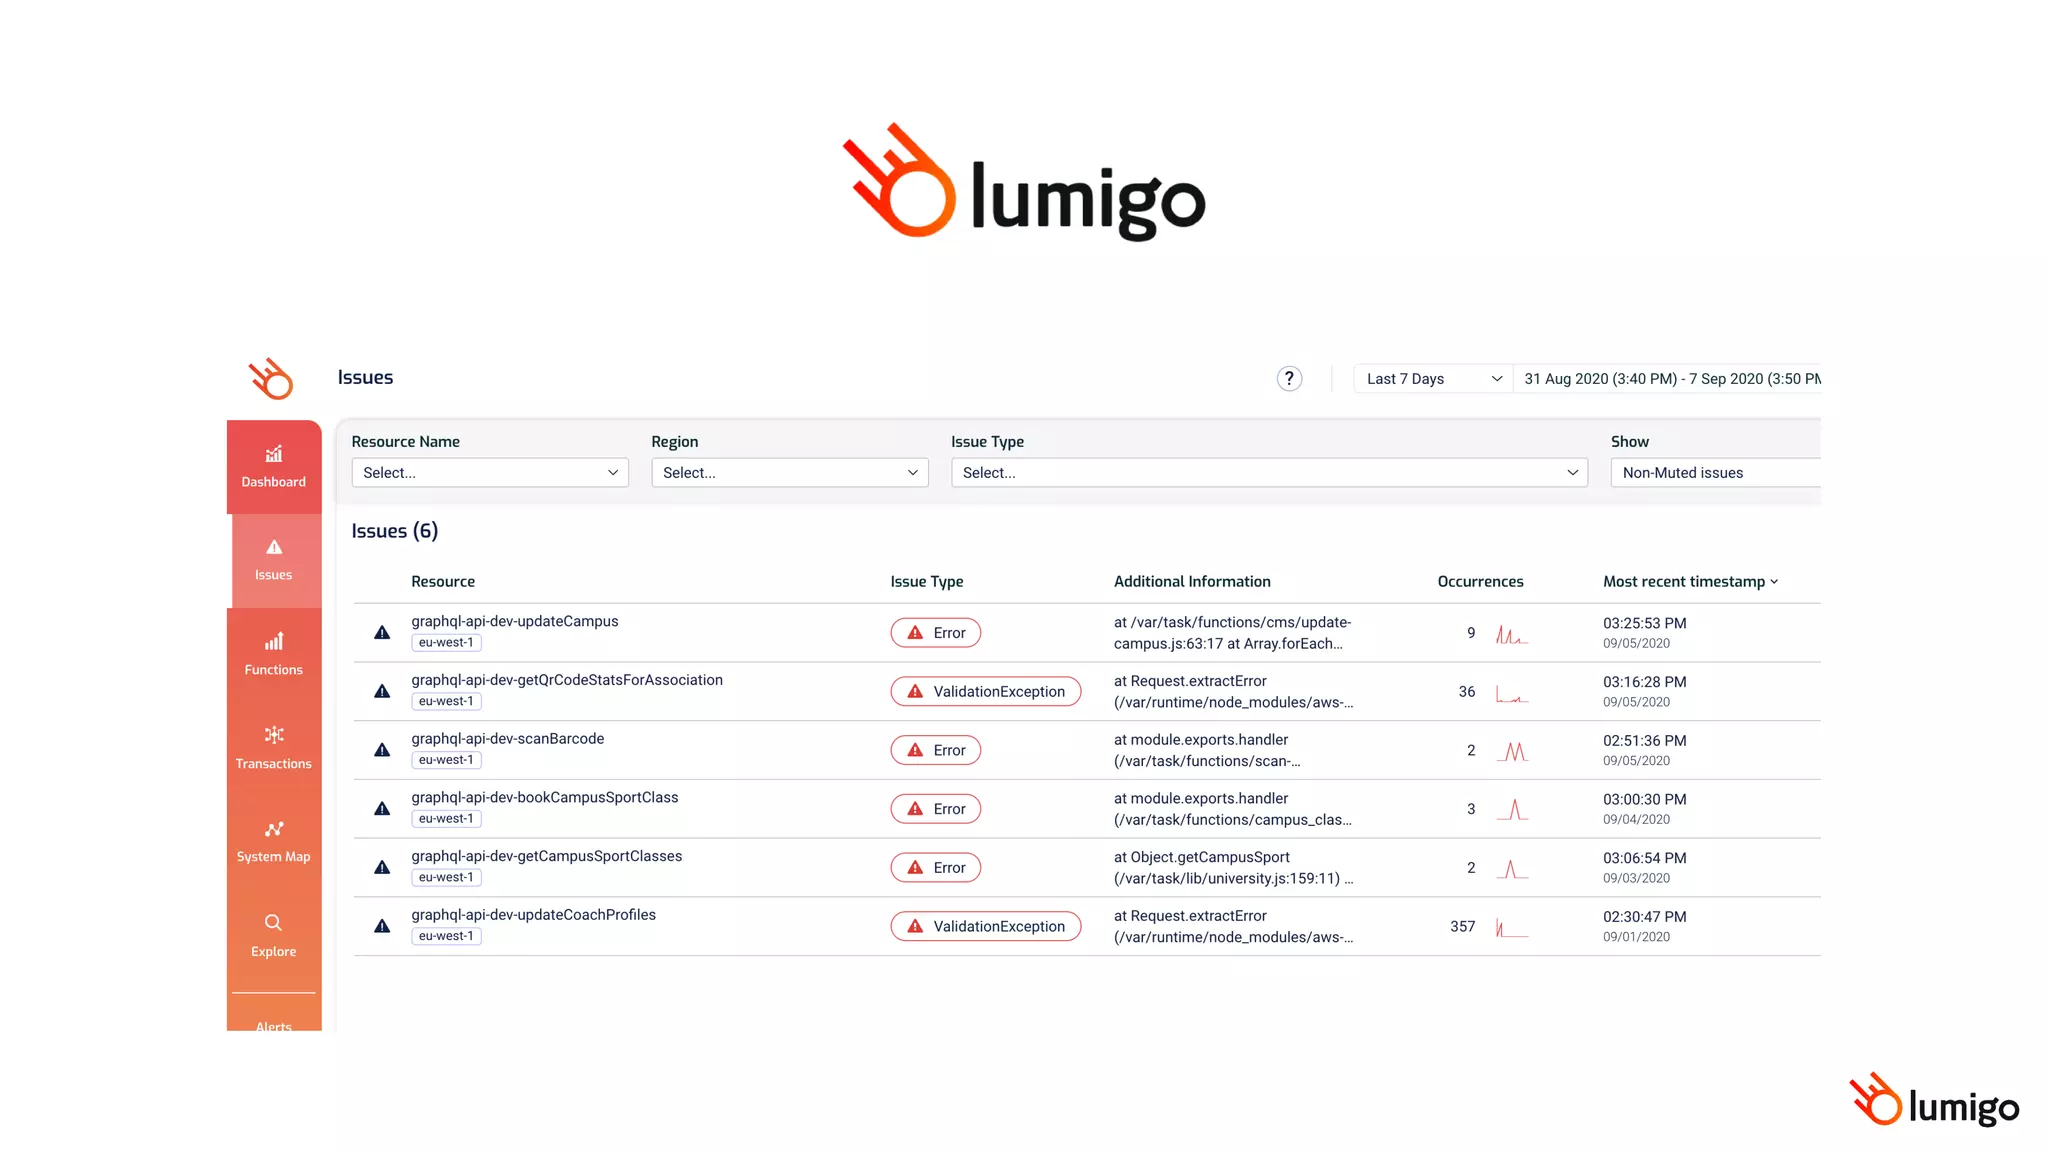

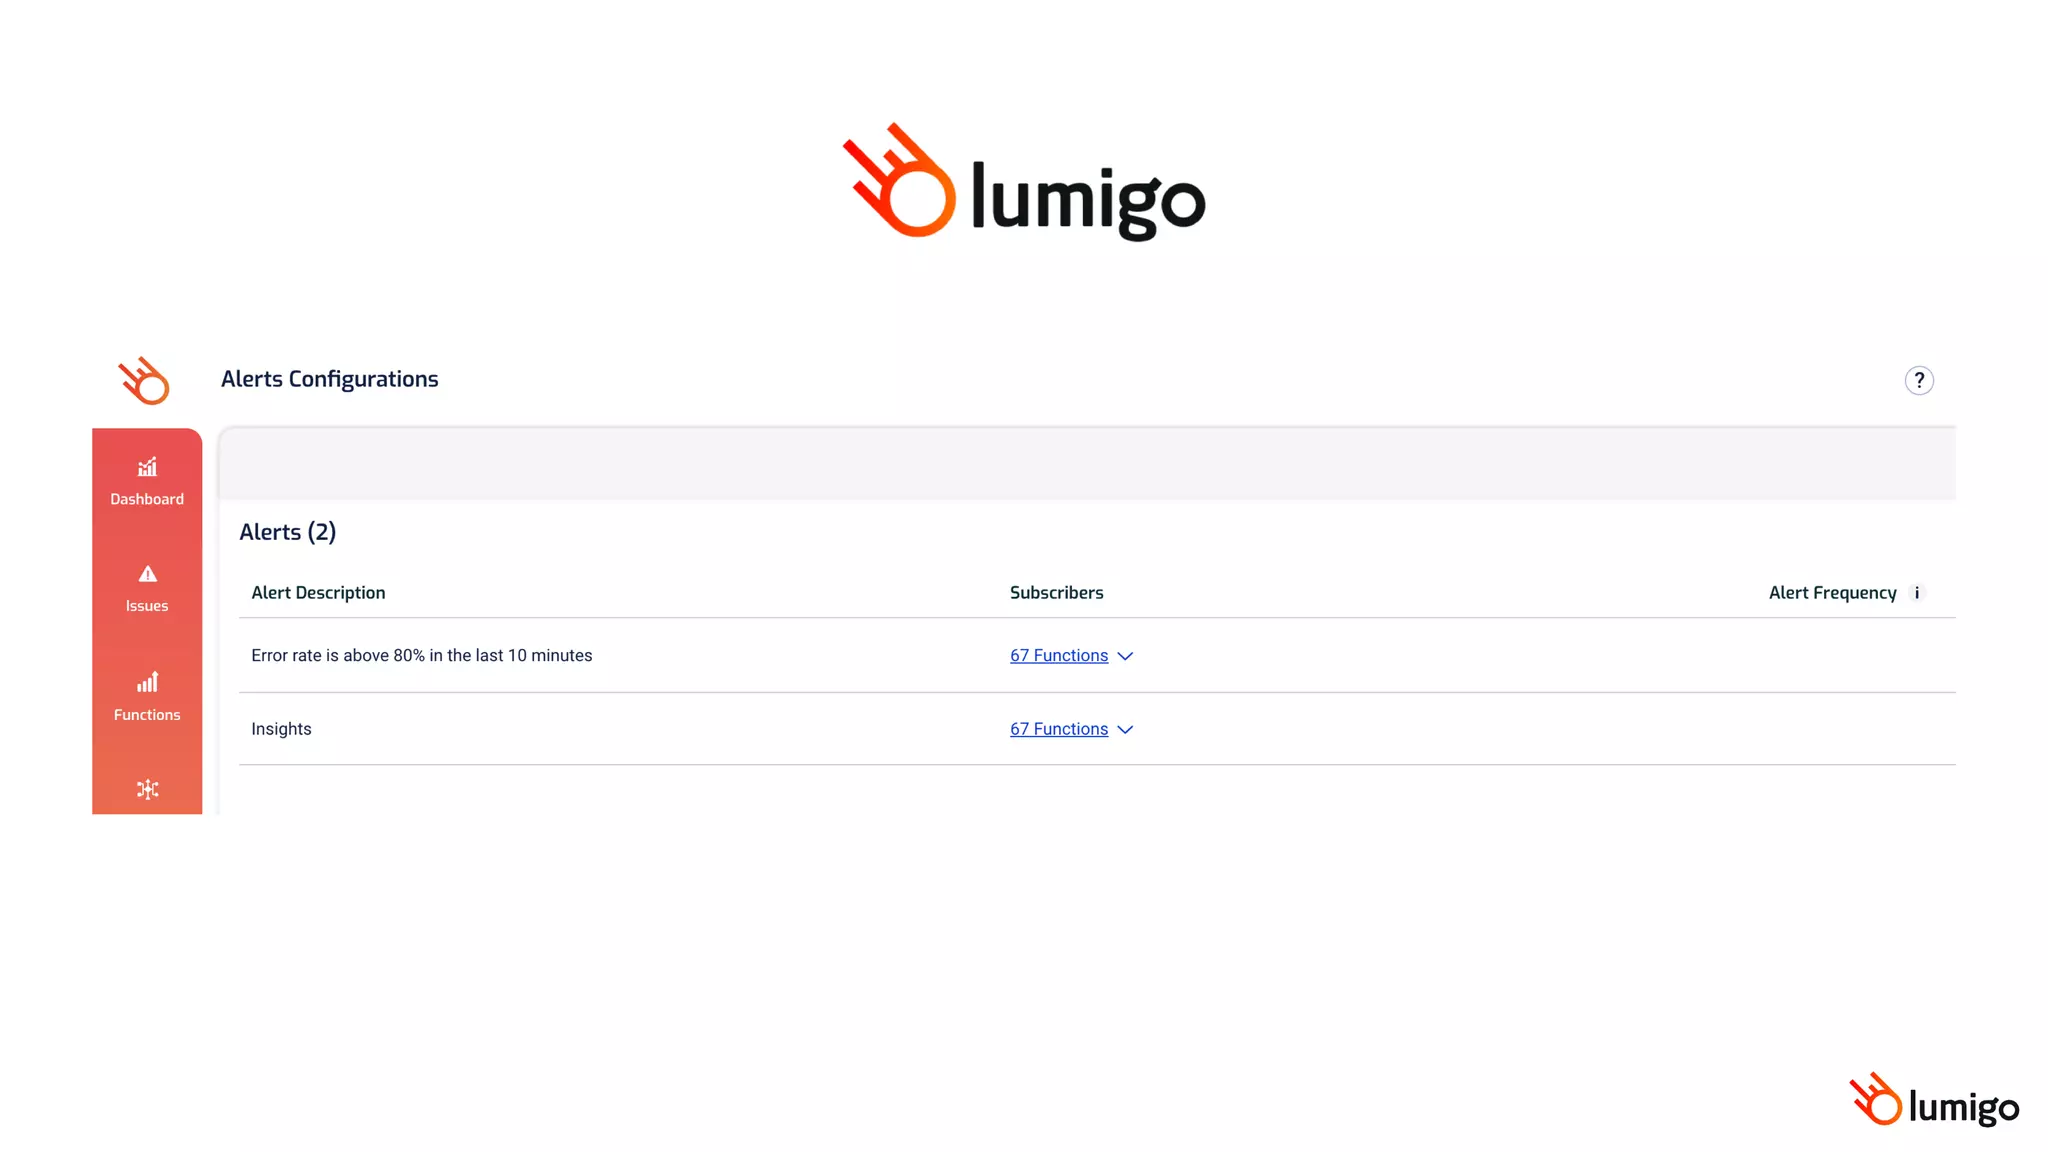


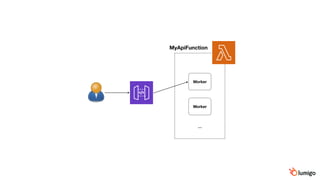
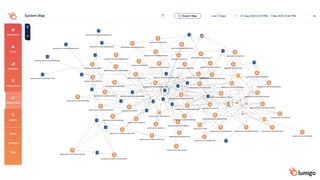
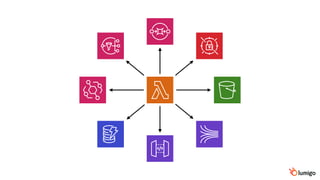
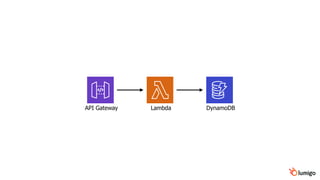
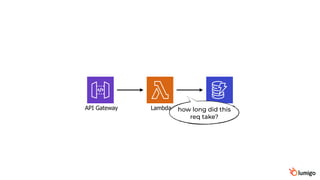
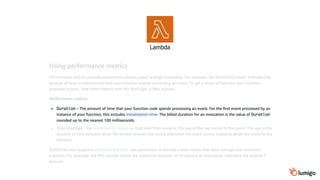
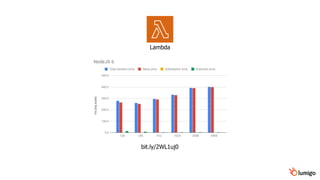
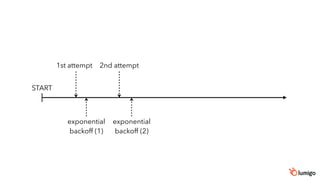
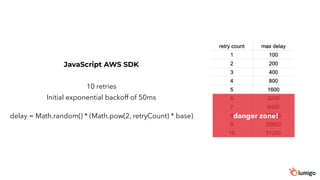
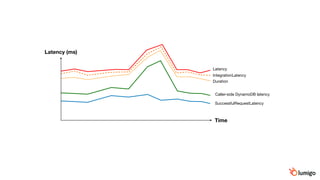
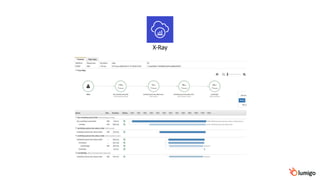
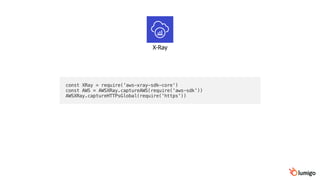
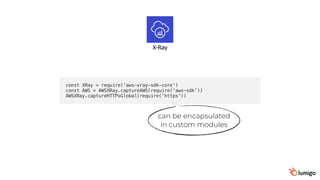
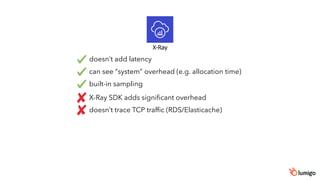
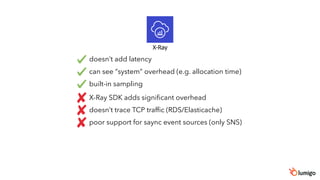
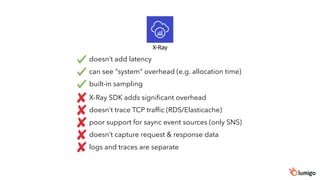
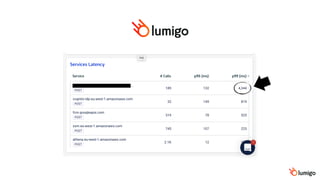
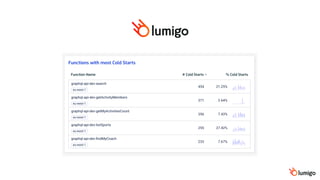
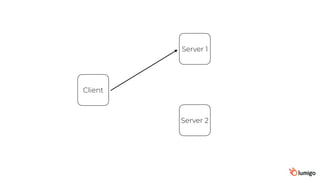
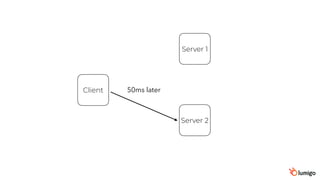
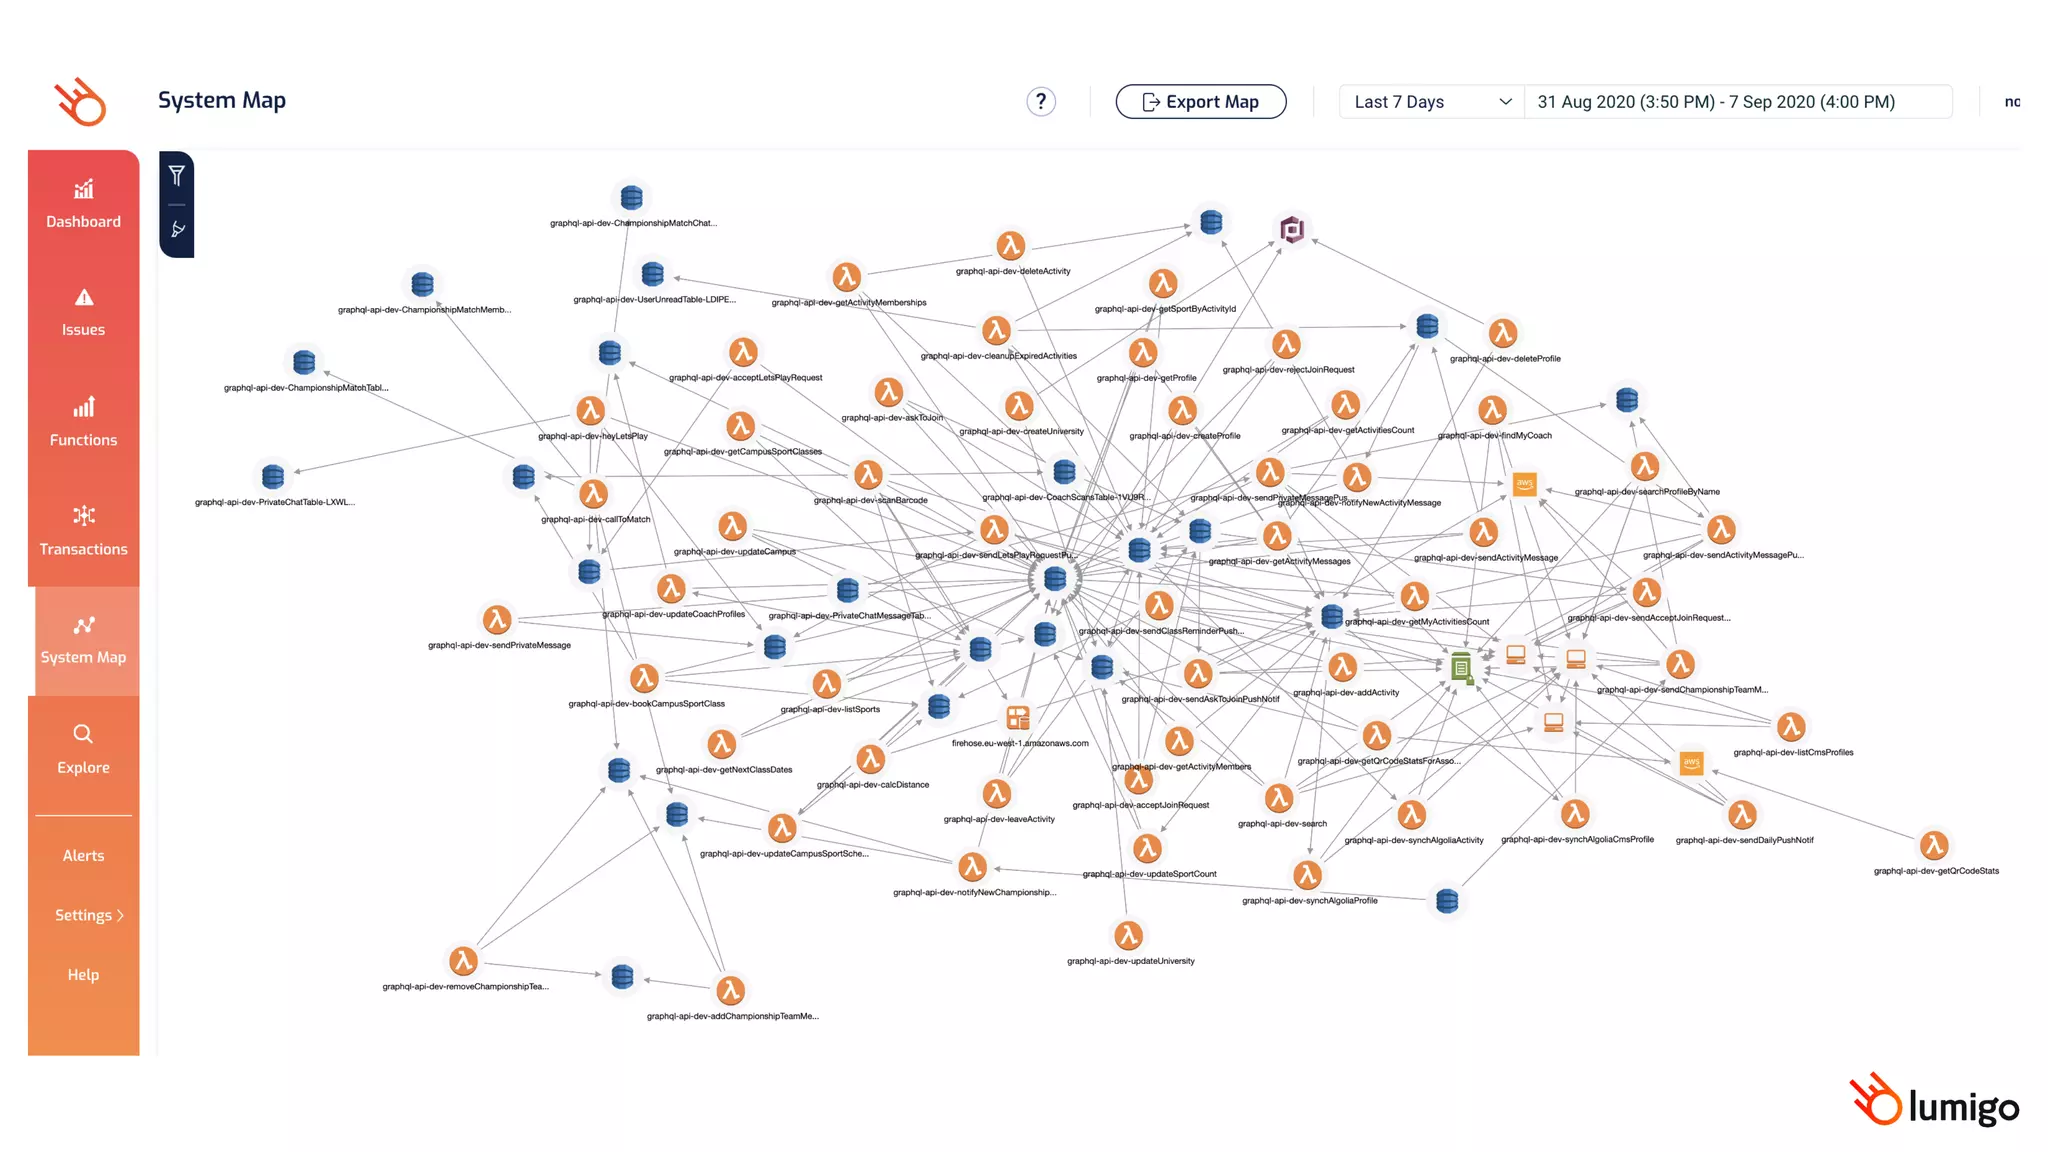
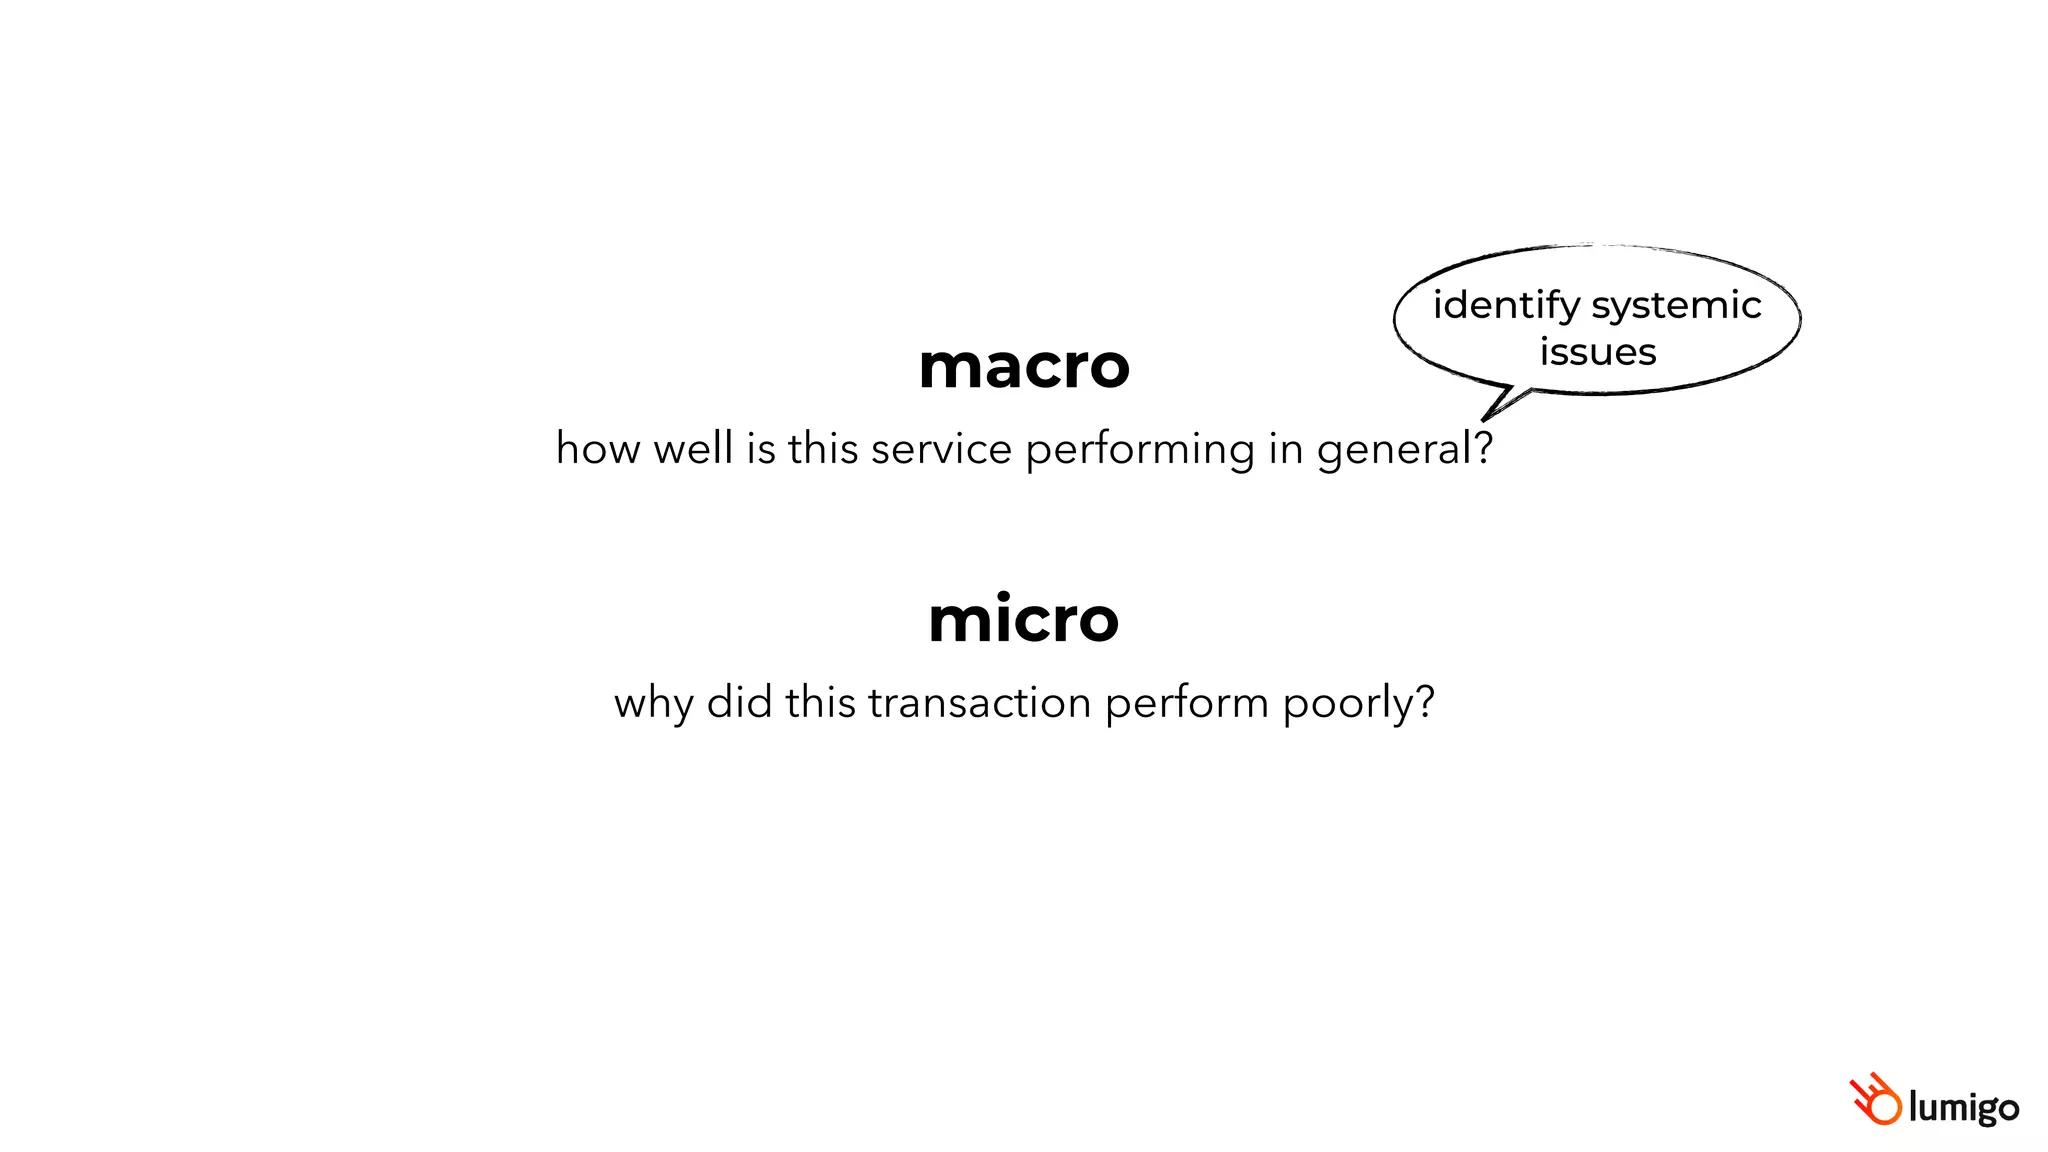
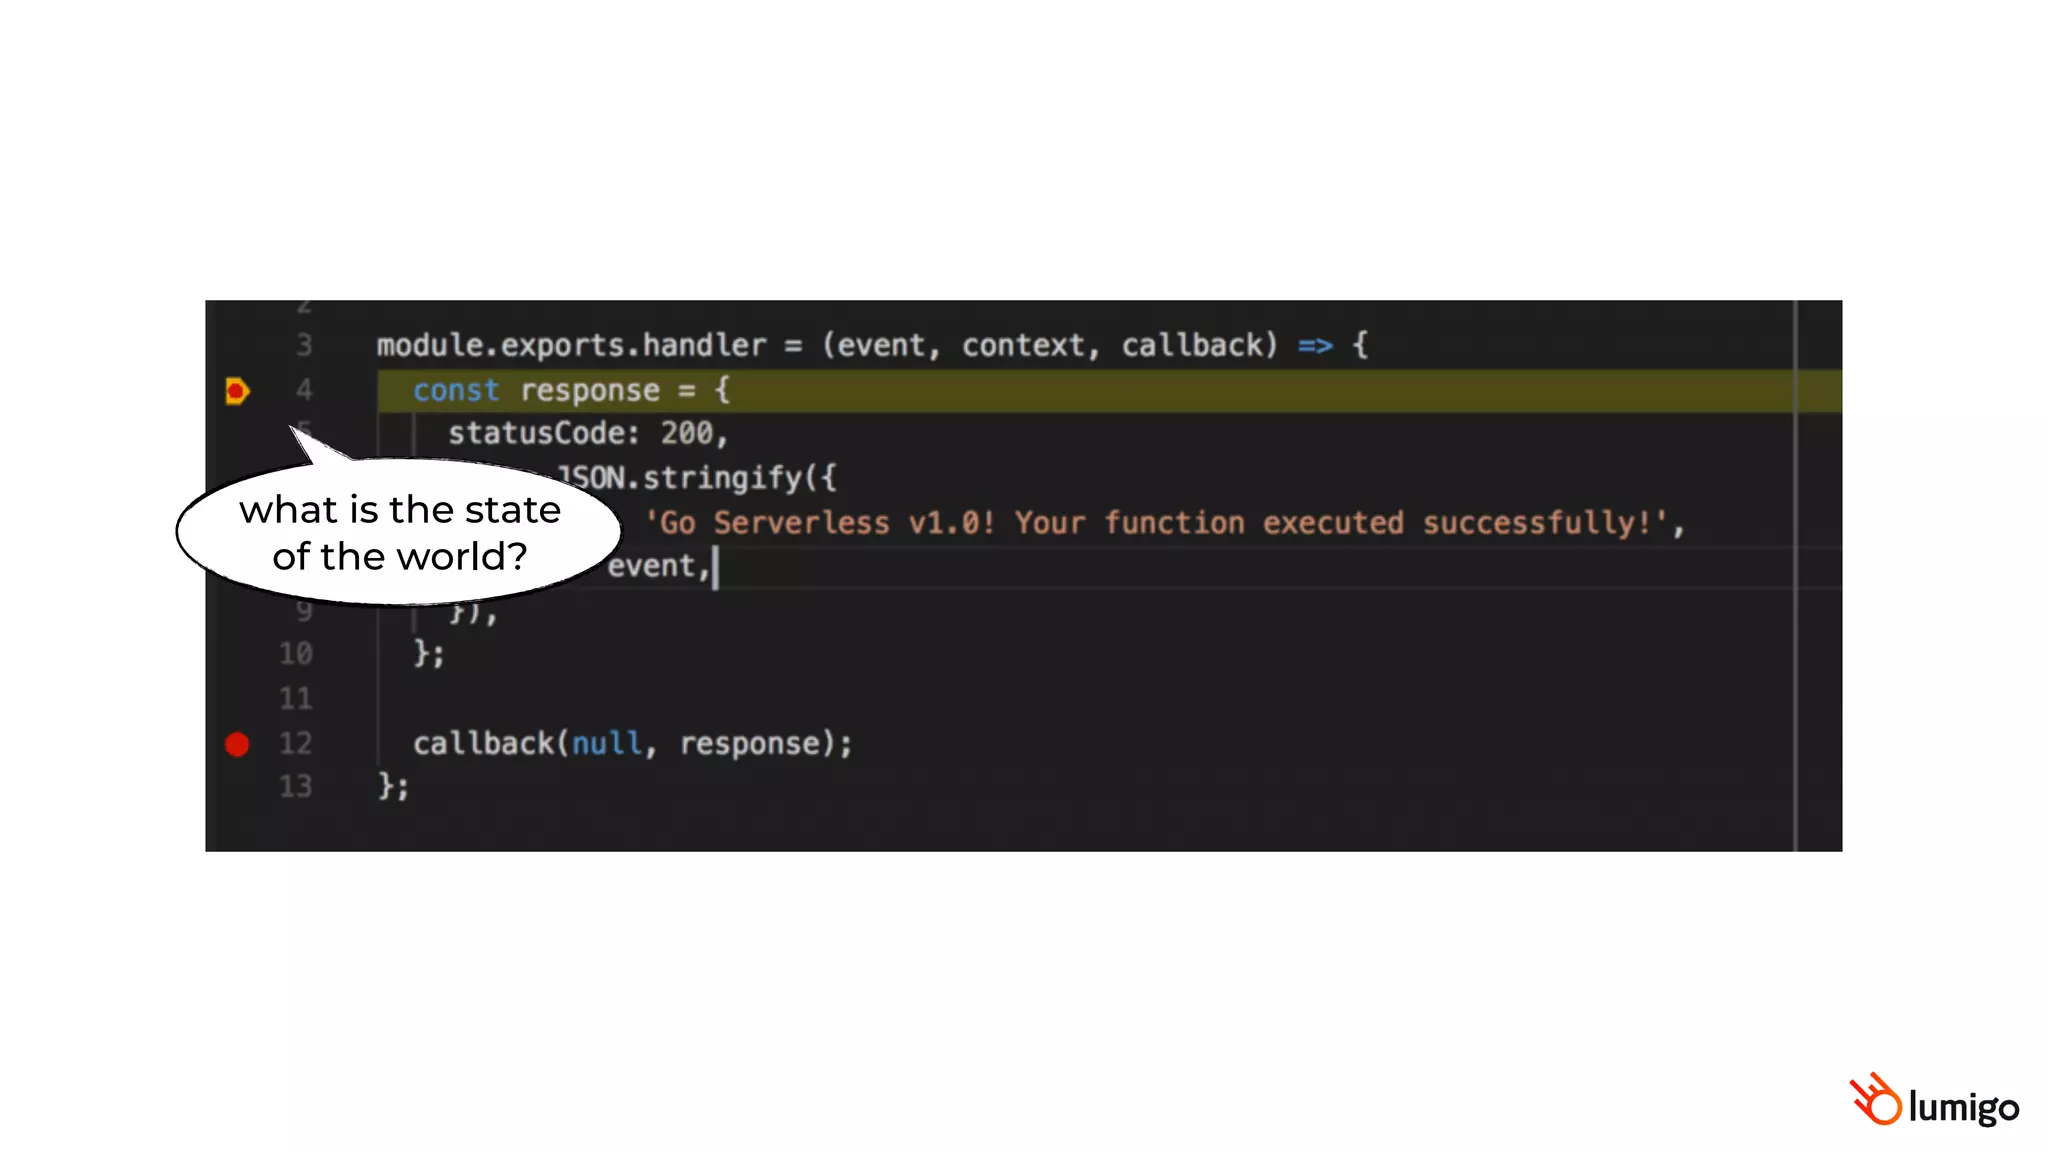
The document discusses strategies for debugging slow AWS Lambda response times, focusing on identifying systemic issues through observability and analyzing function integration points. It emphasizes collecting key performance metrics, the potential impact of cold starts, and the role of tools like AWS X-Ray for tracing. Additionally, it suggests caching strategies and exploring alternative services to mitigate slow dependencies.


![[Tokyo Scala User Group] Akka Streams & Reactive Streams (0.7)](https://cdn.slidesharecdn.com/ss_thumbnails/2014-akka-streams-tokyo-140914201812-phpapp01-thumbnail.jpg?width=600ounds&width=560&fit=bounds)


