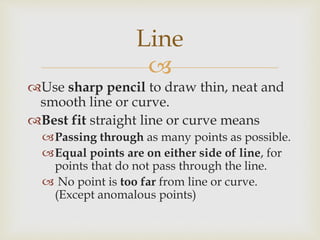
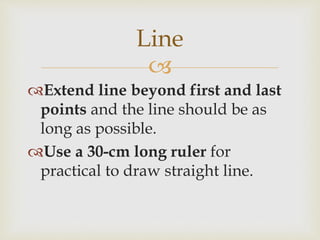
Downloaded 102 times
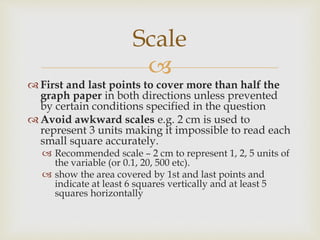
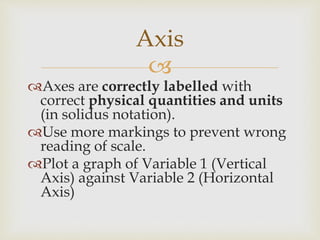
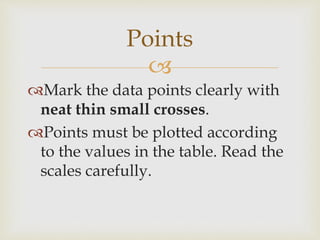

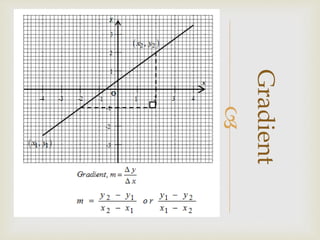
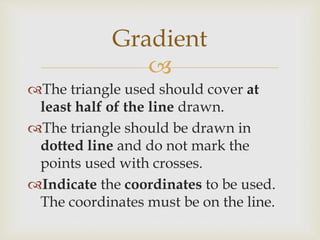
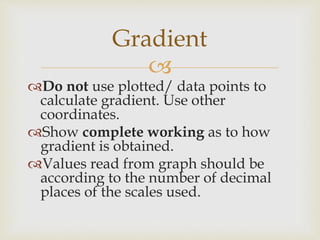
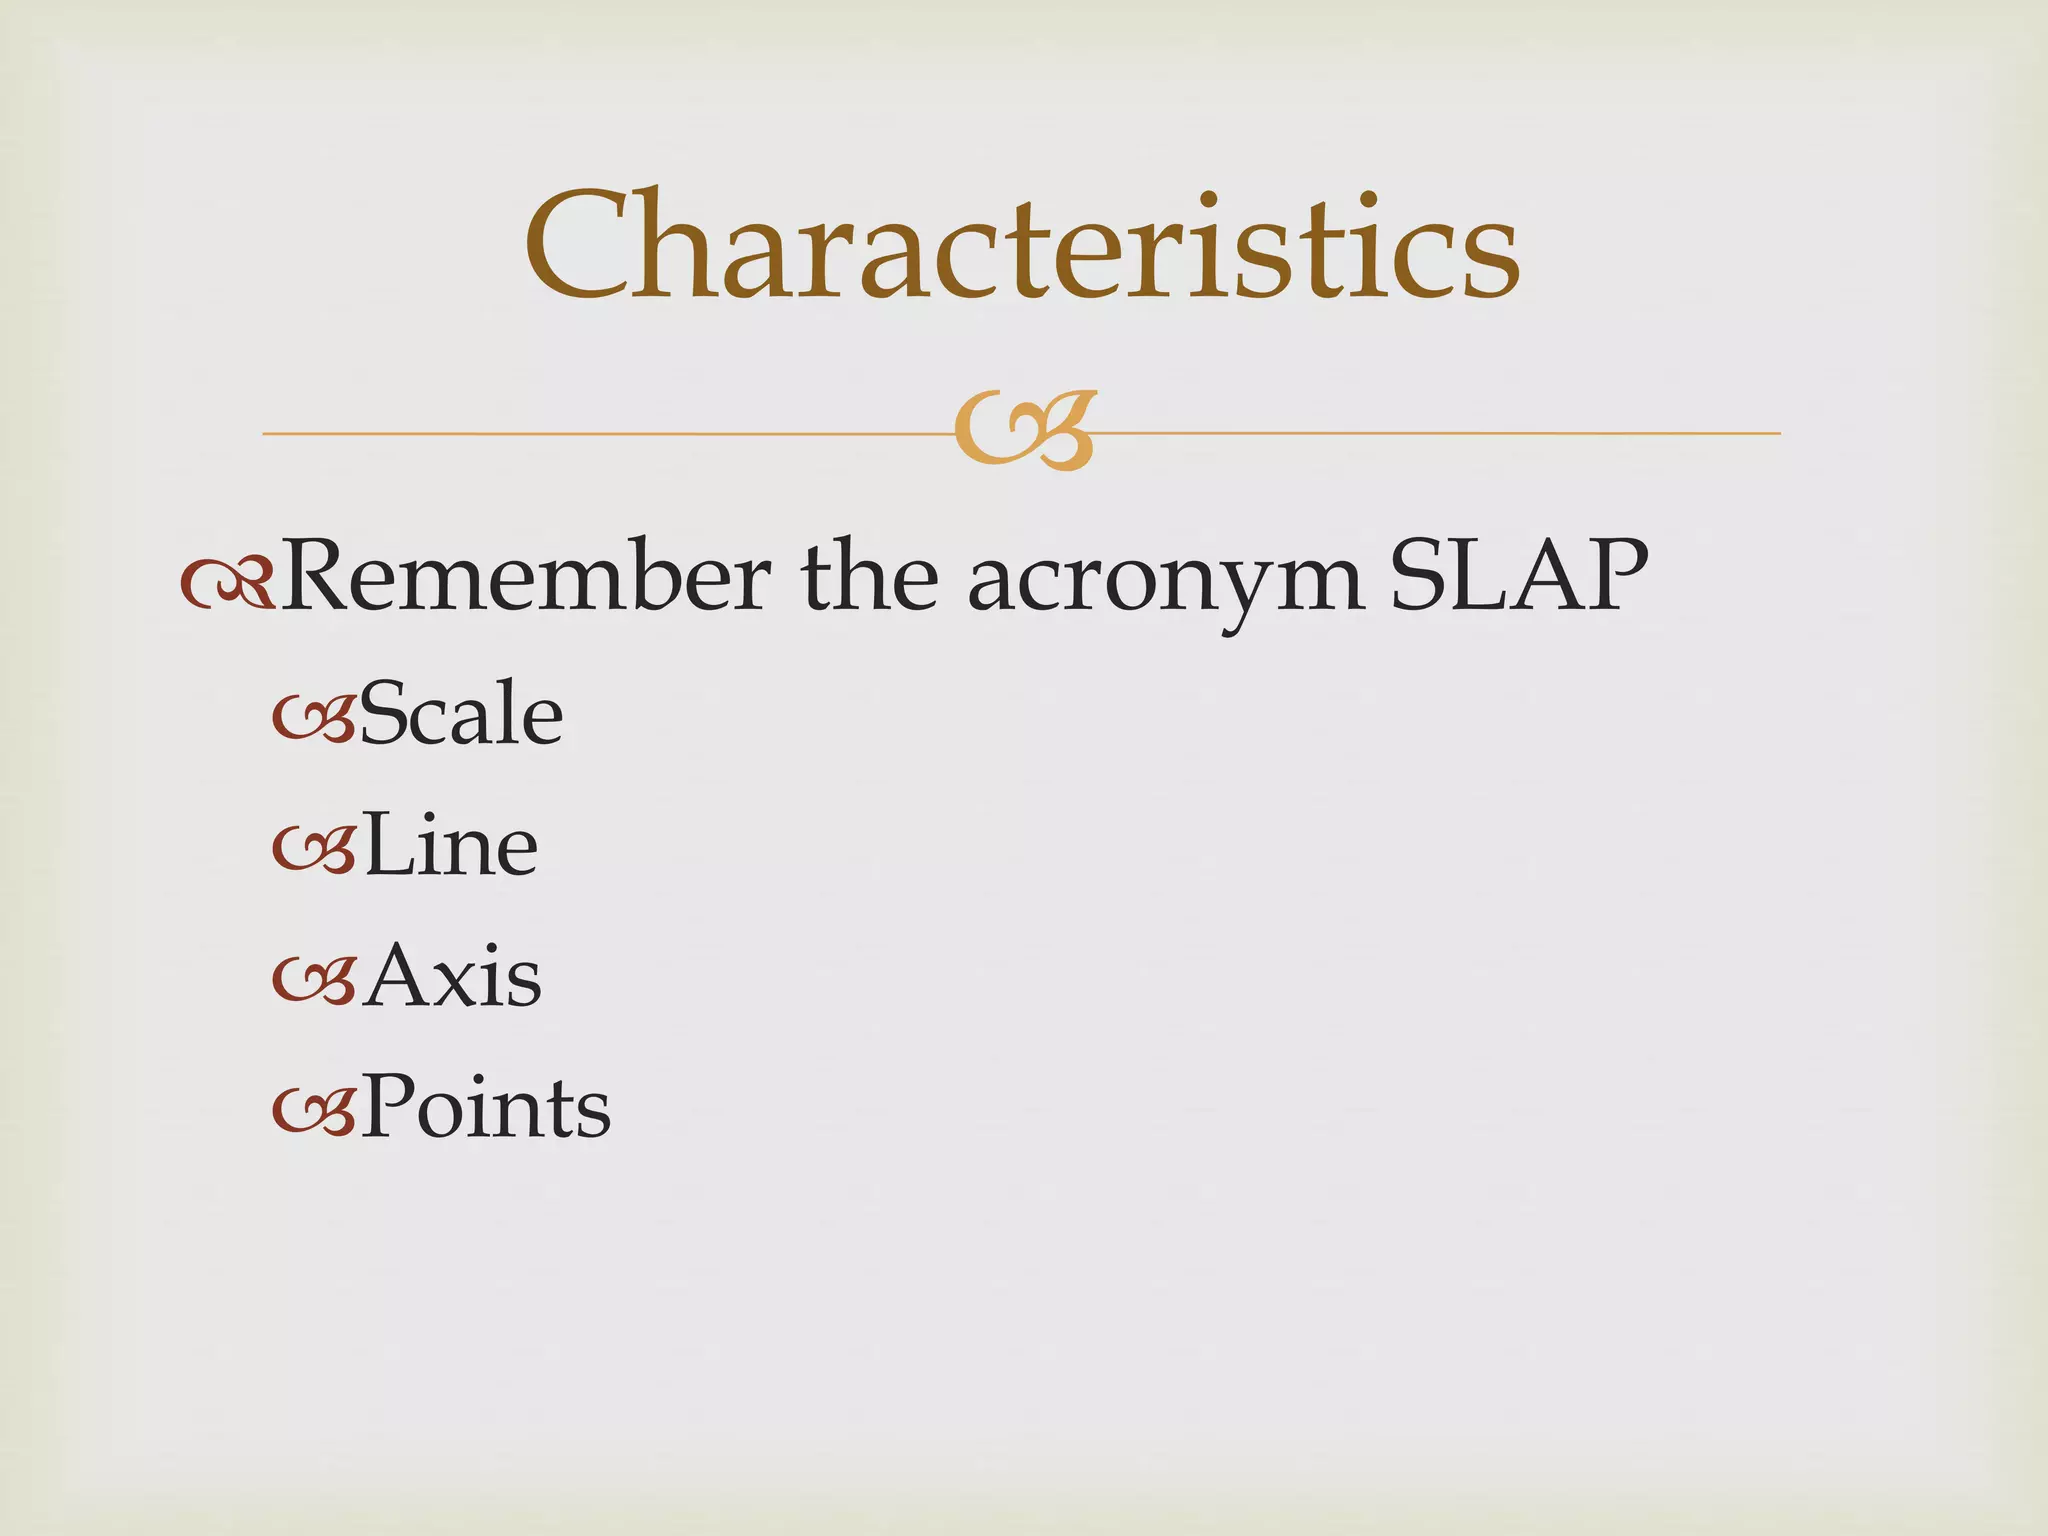
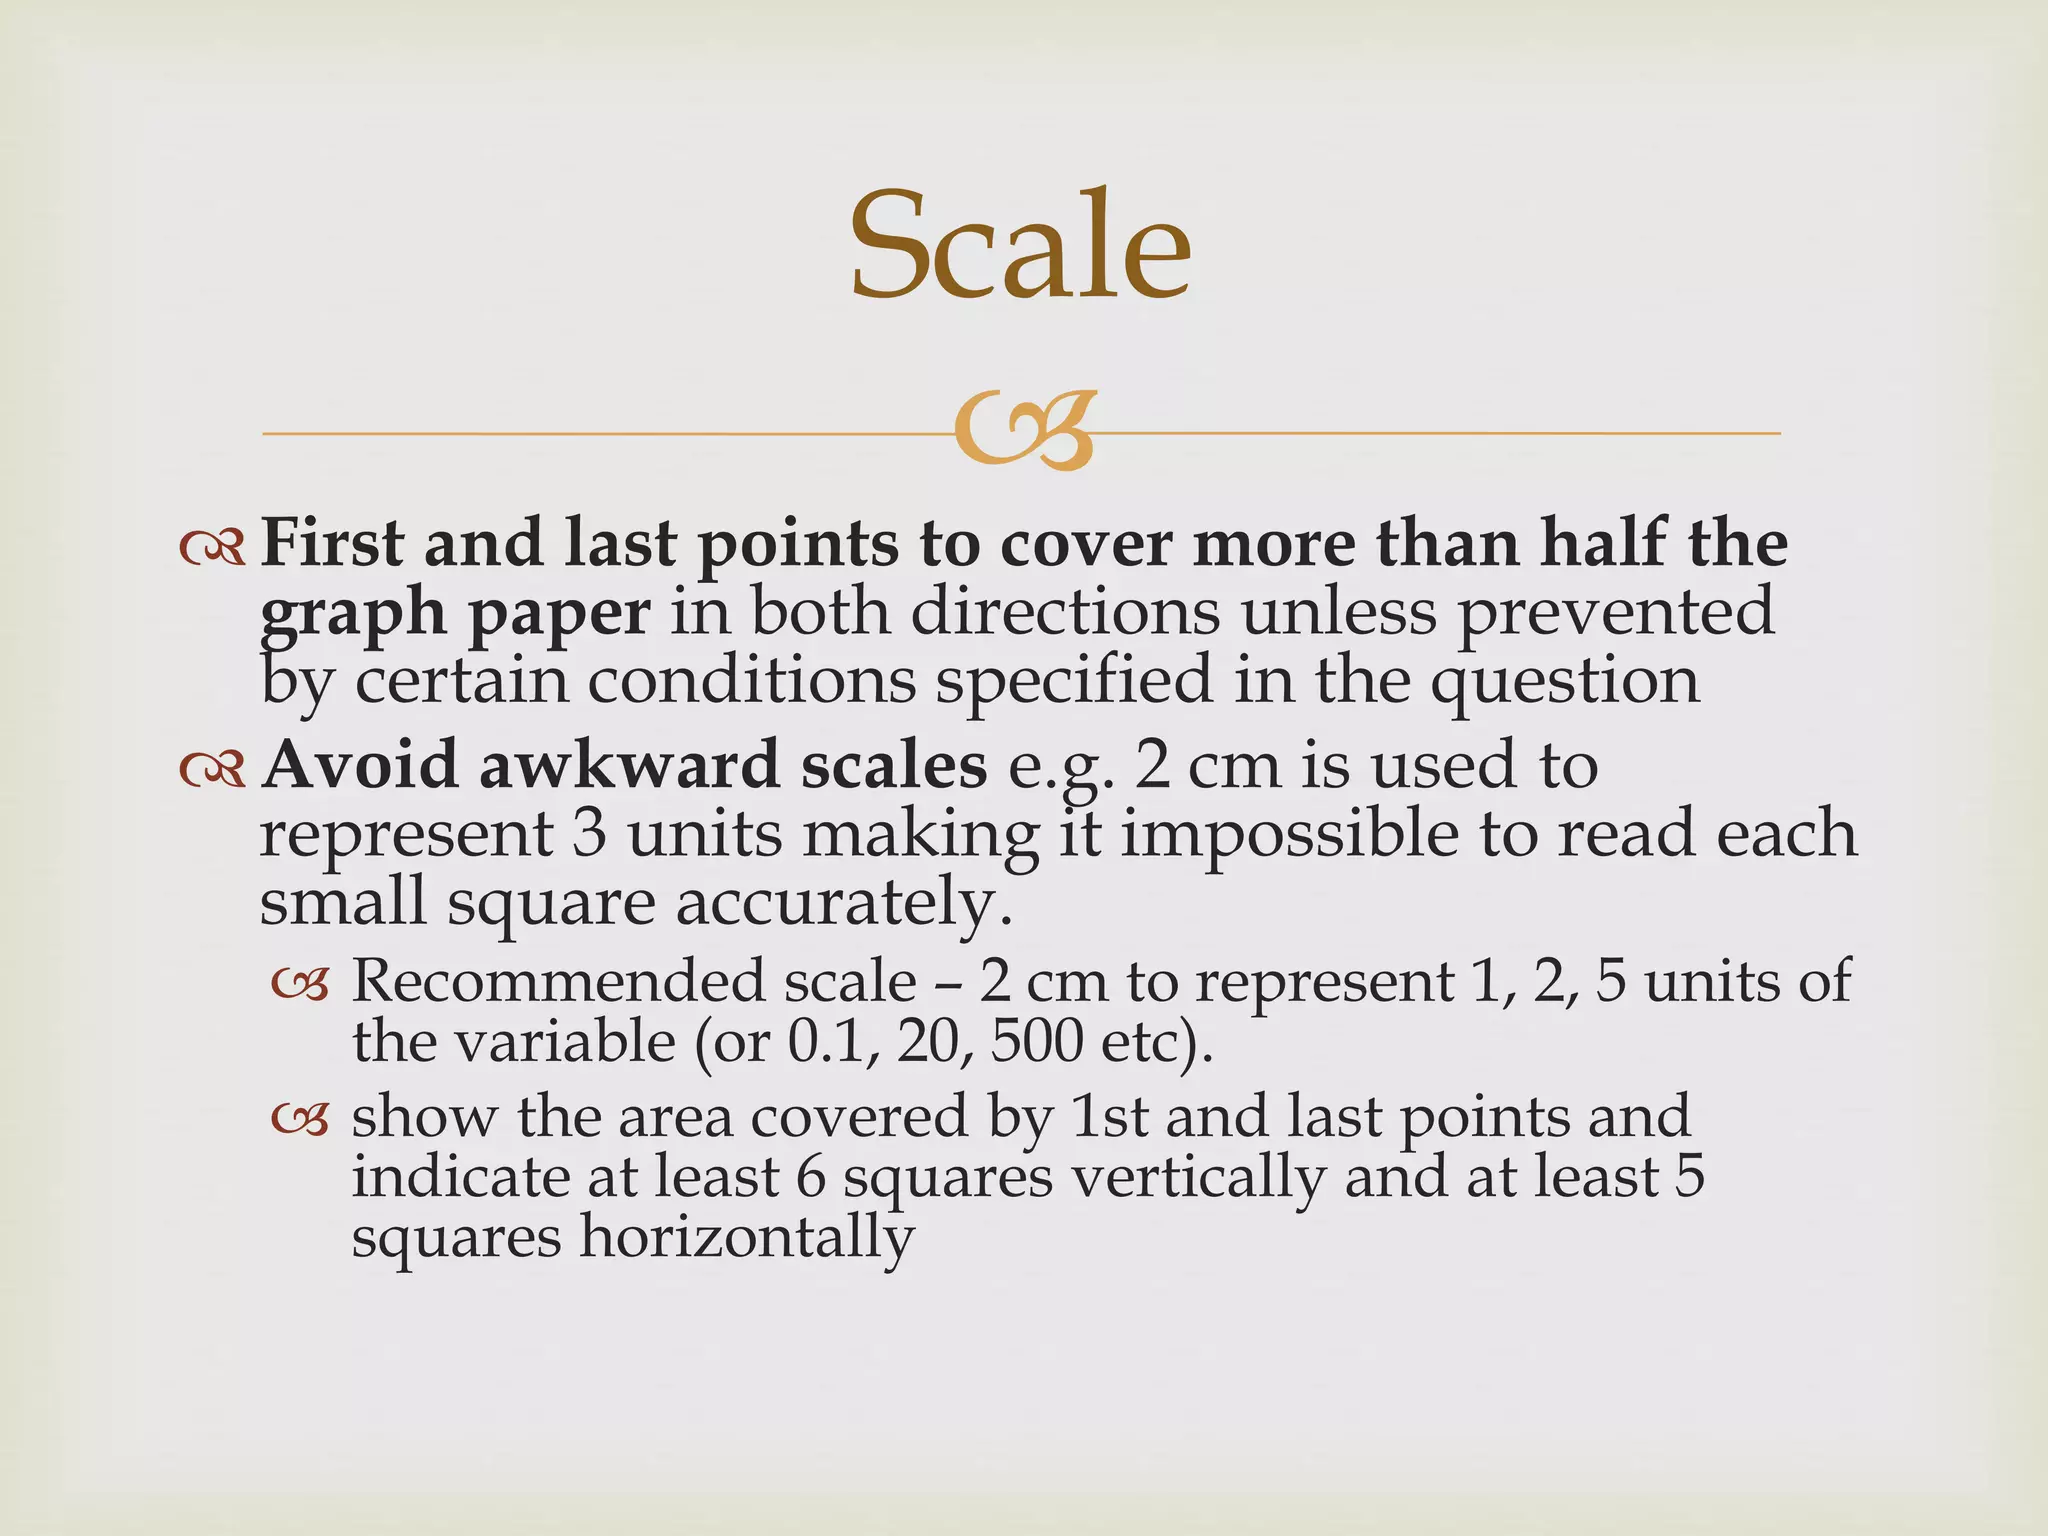
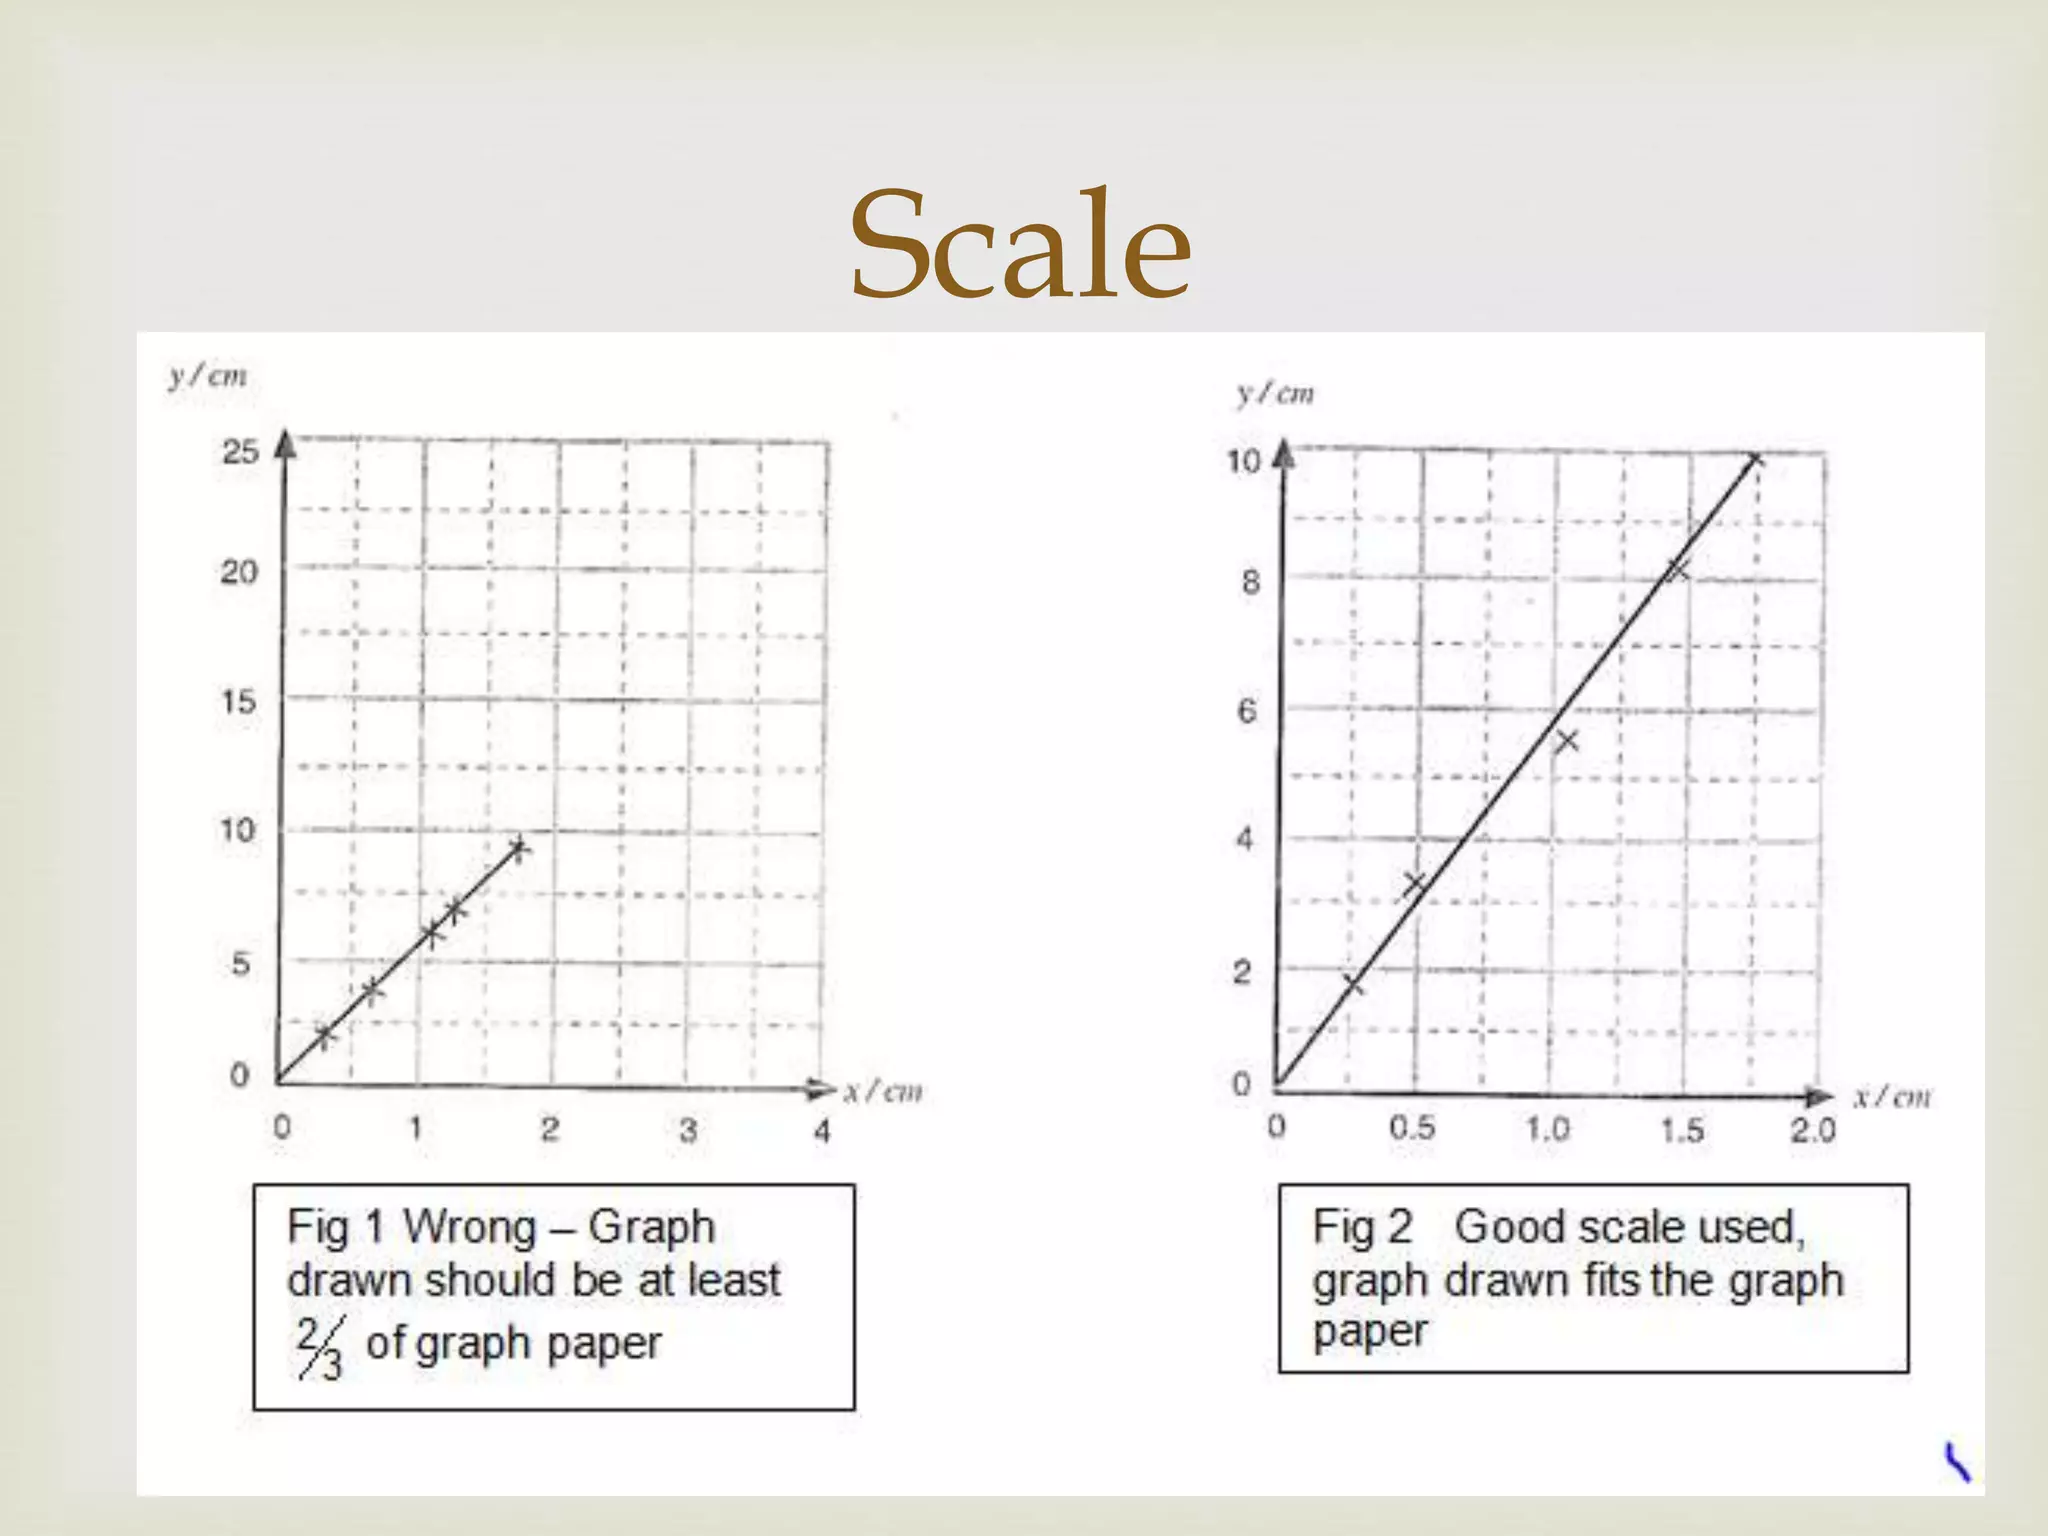
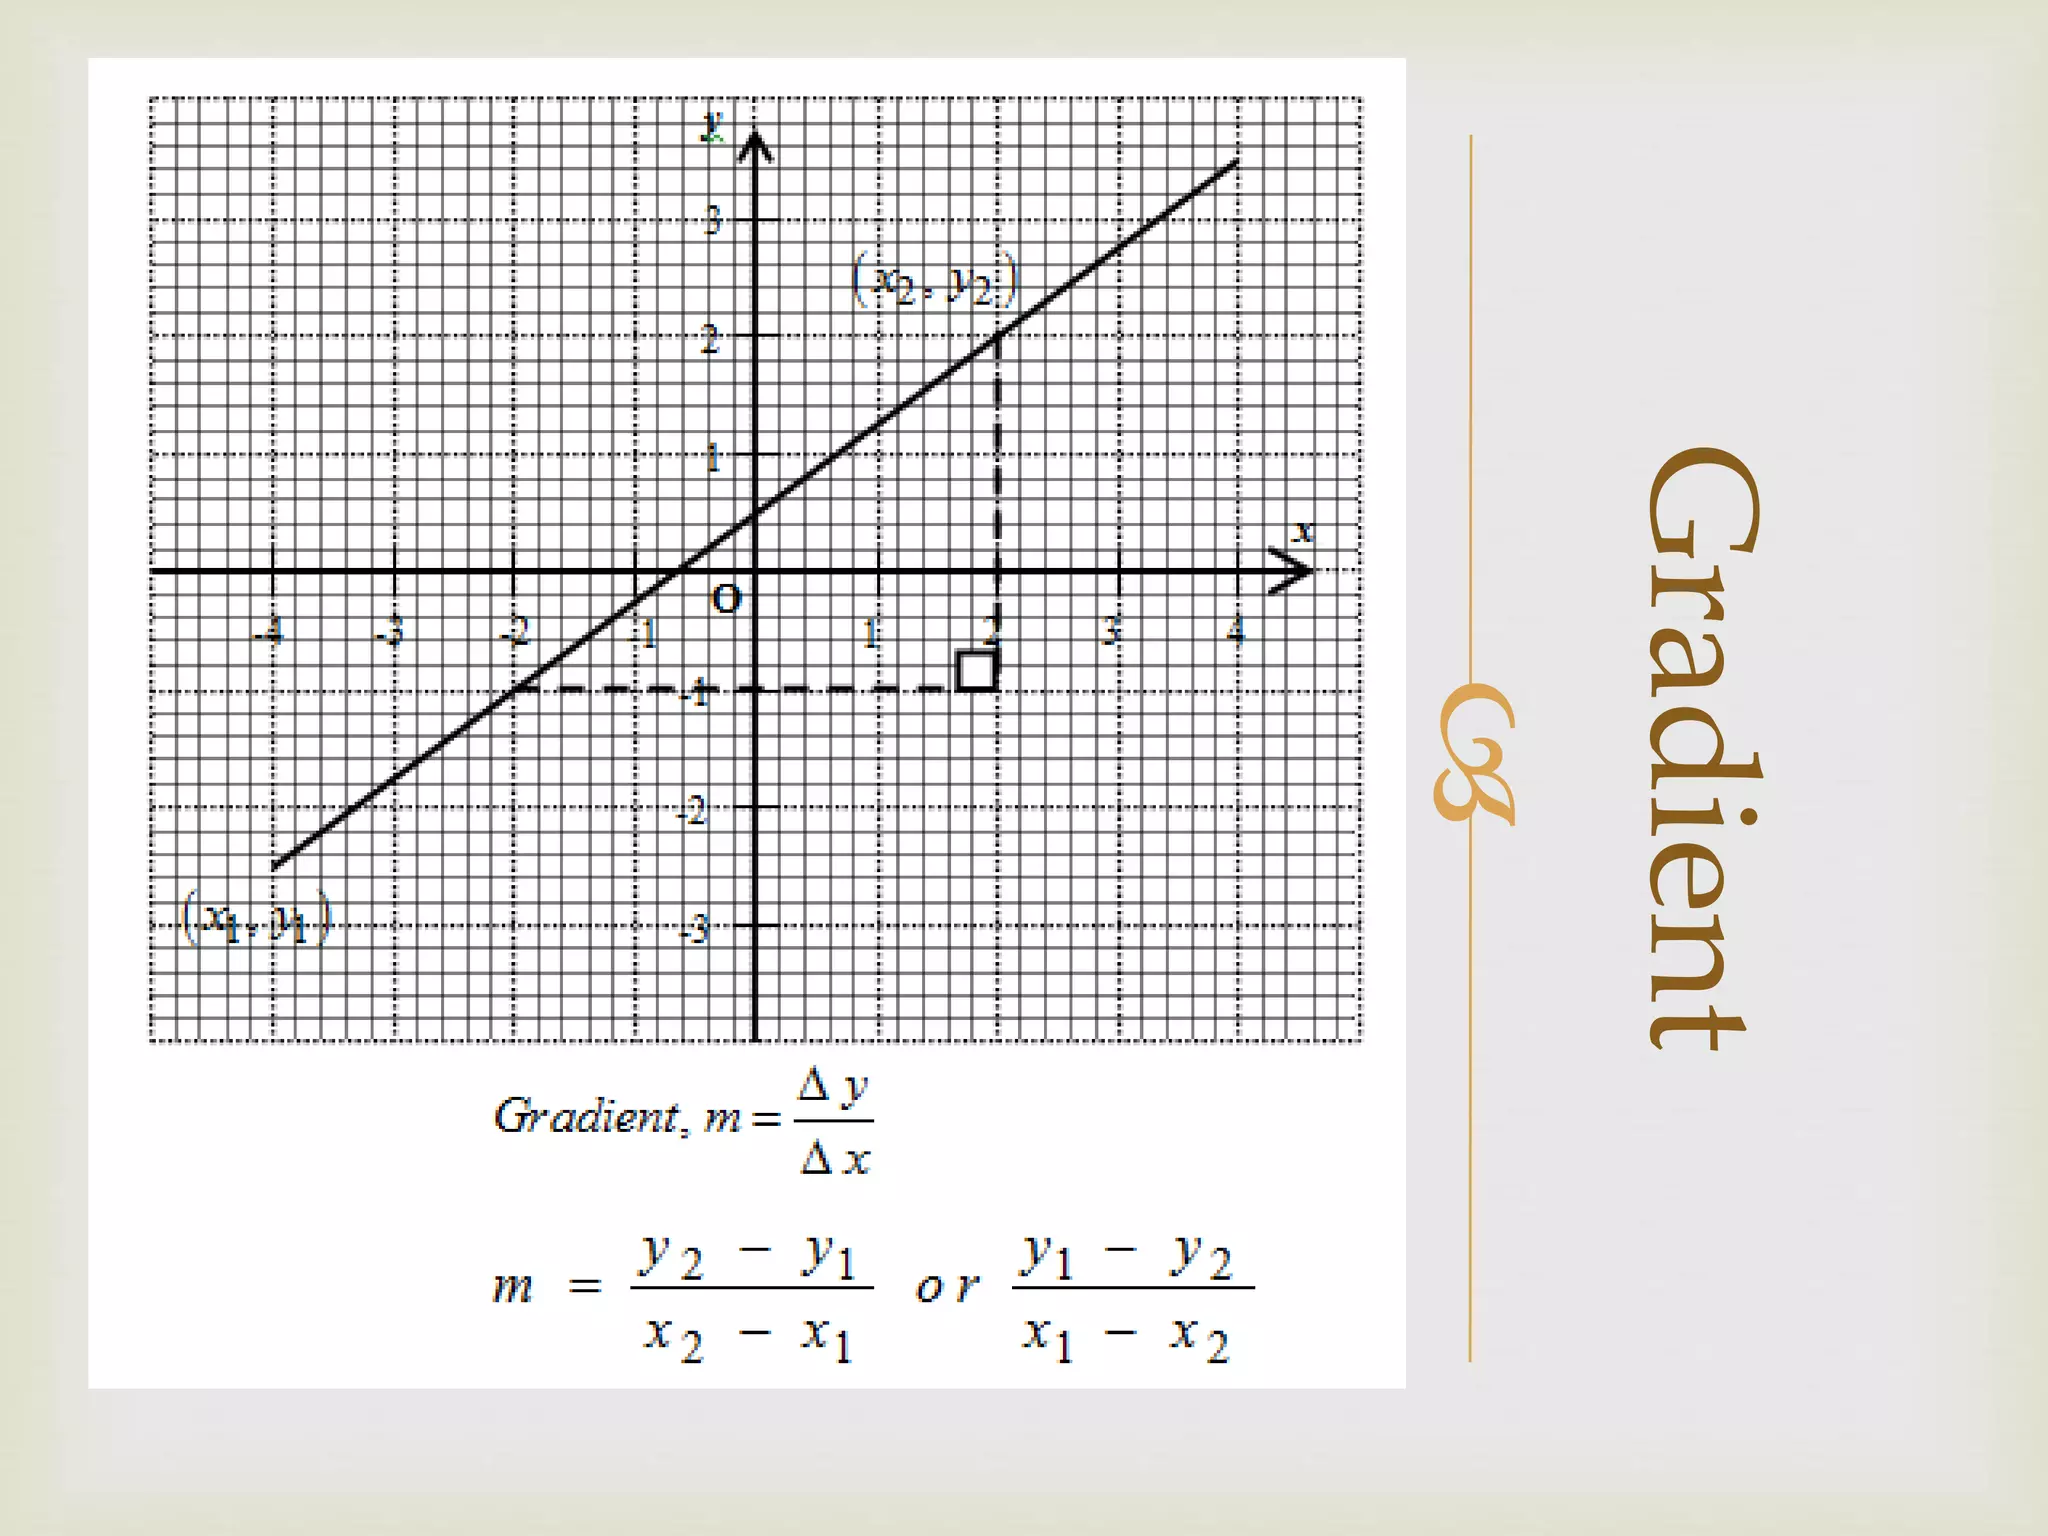
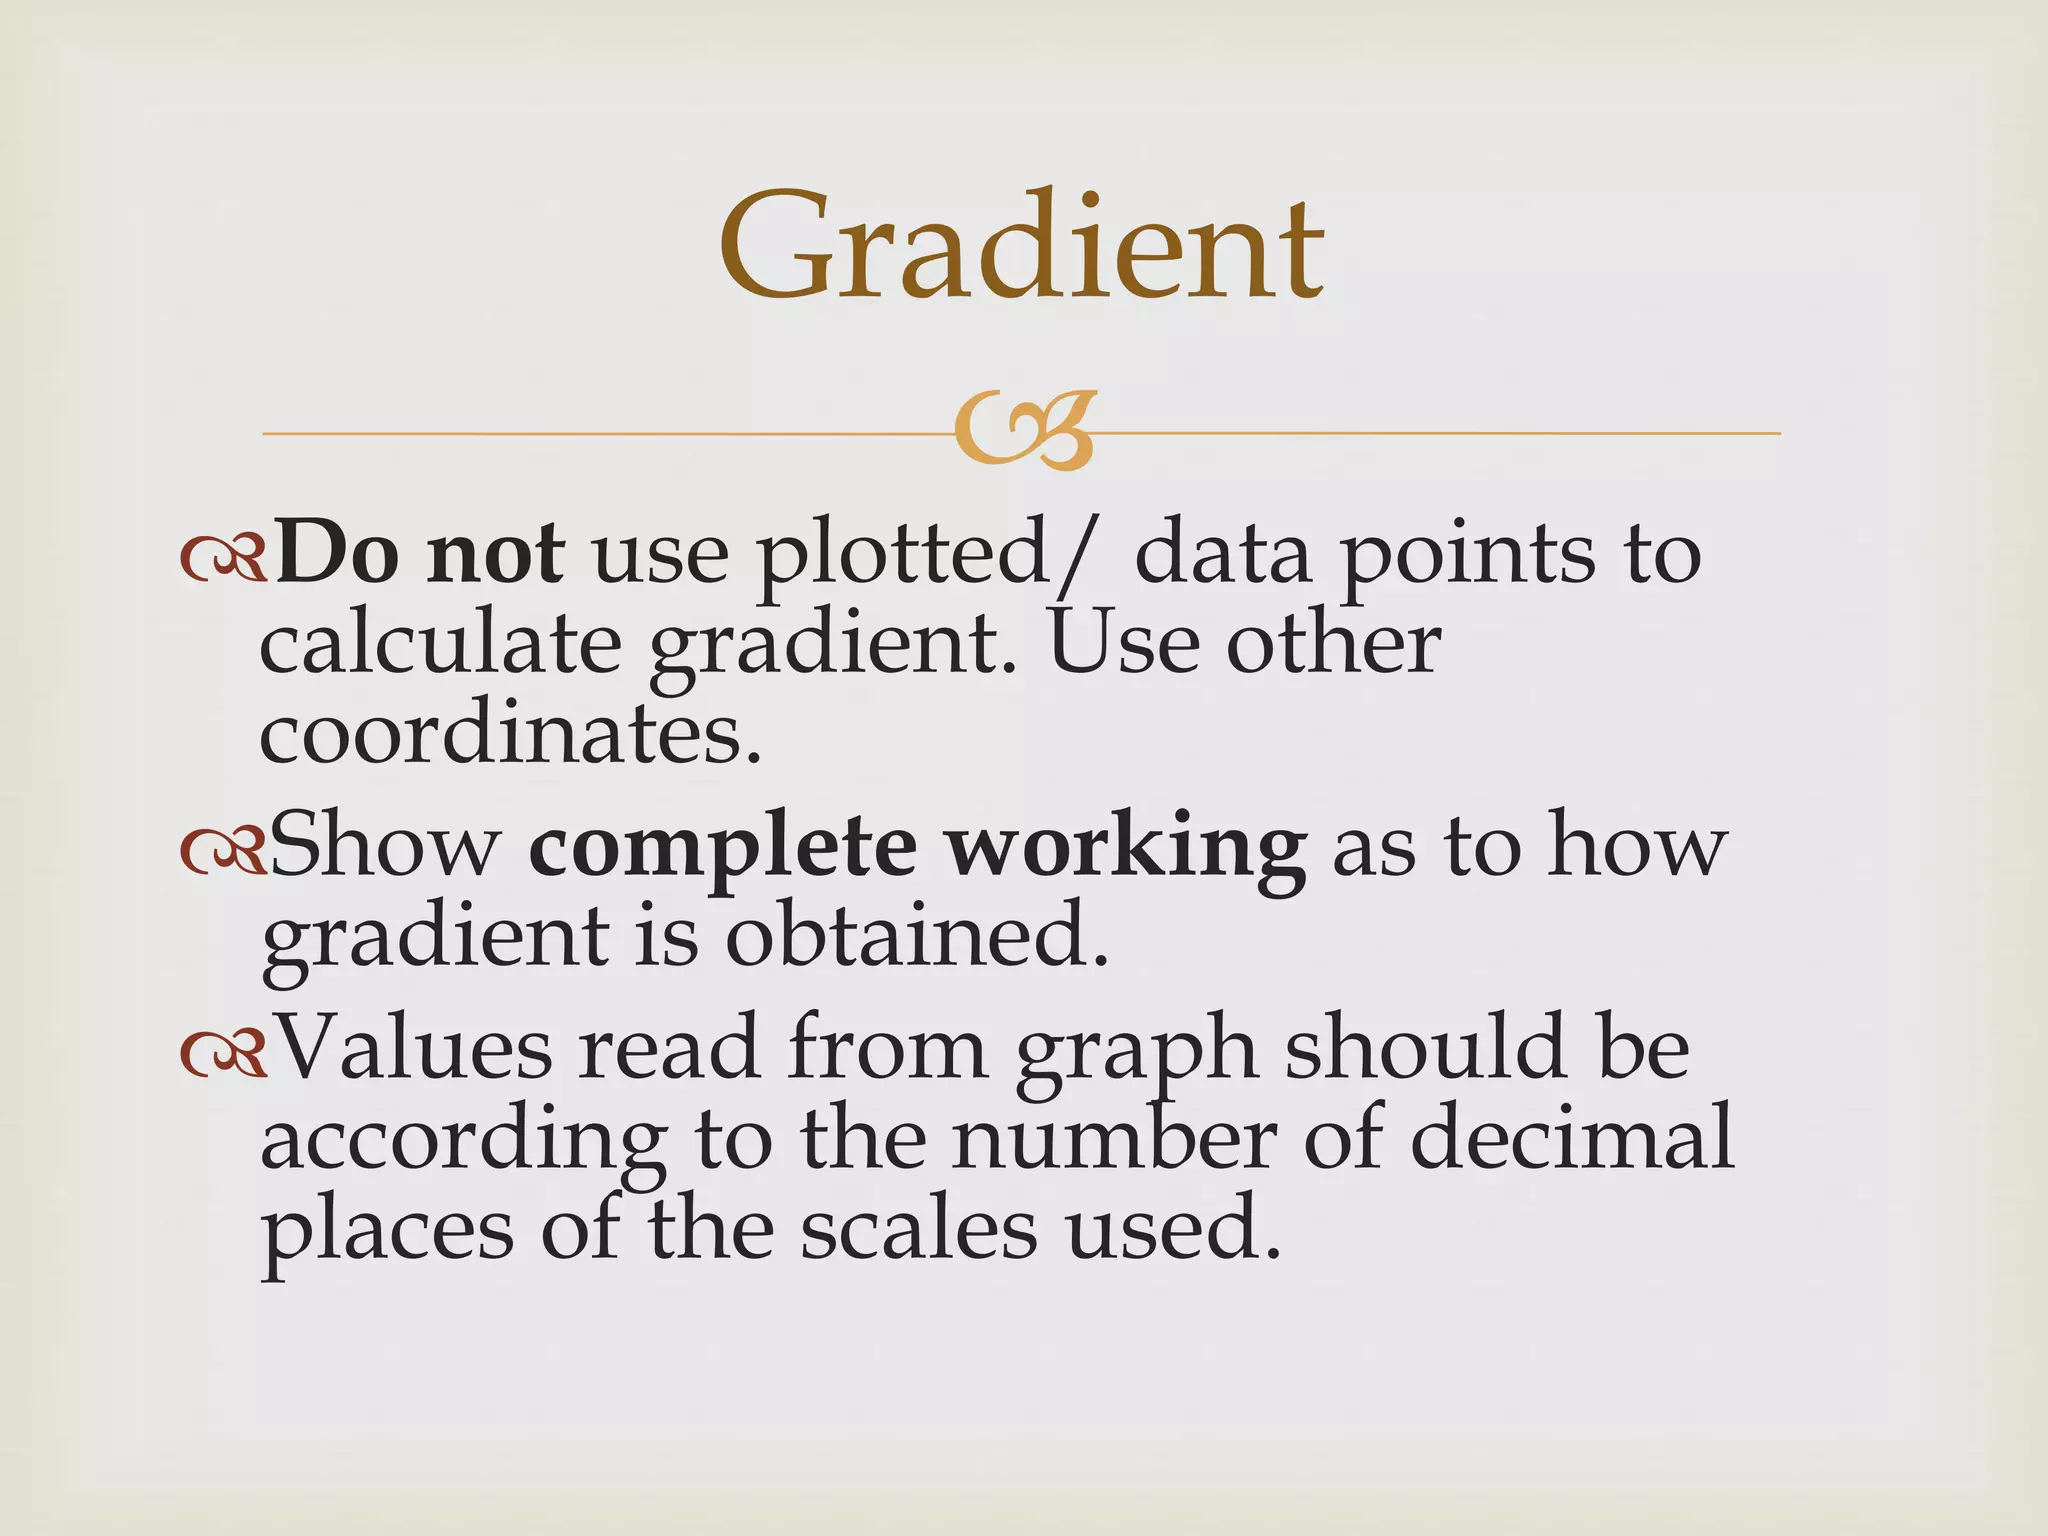
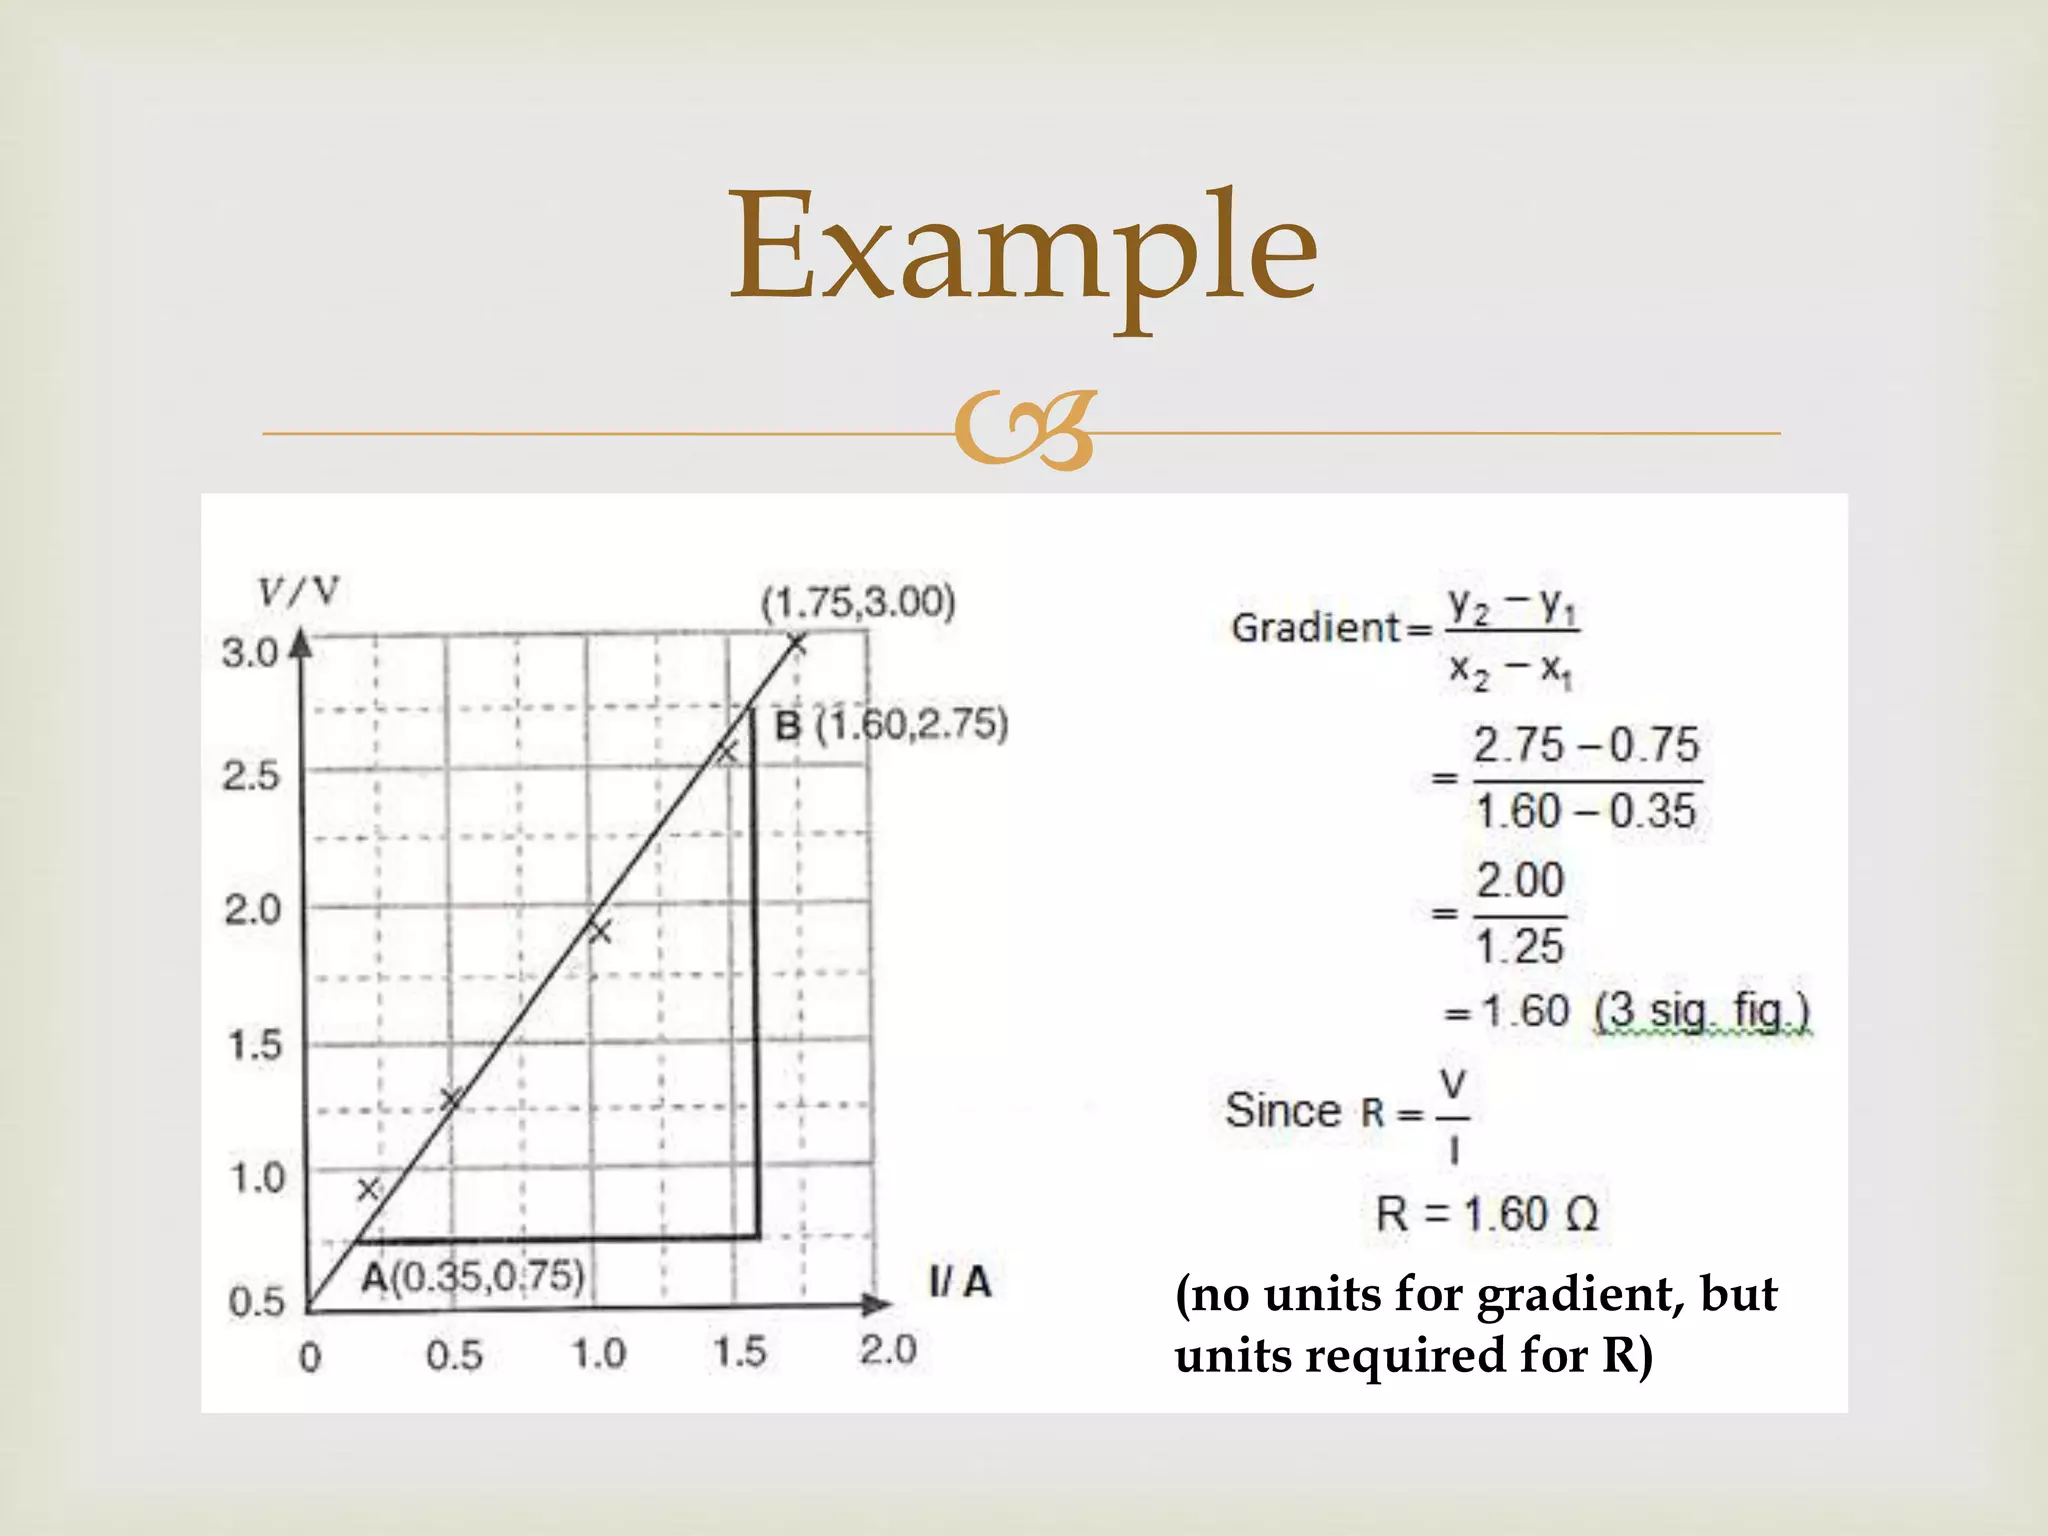
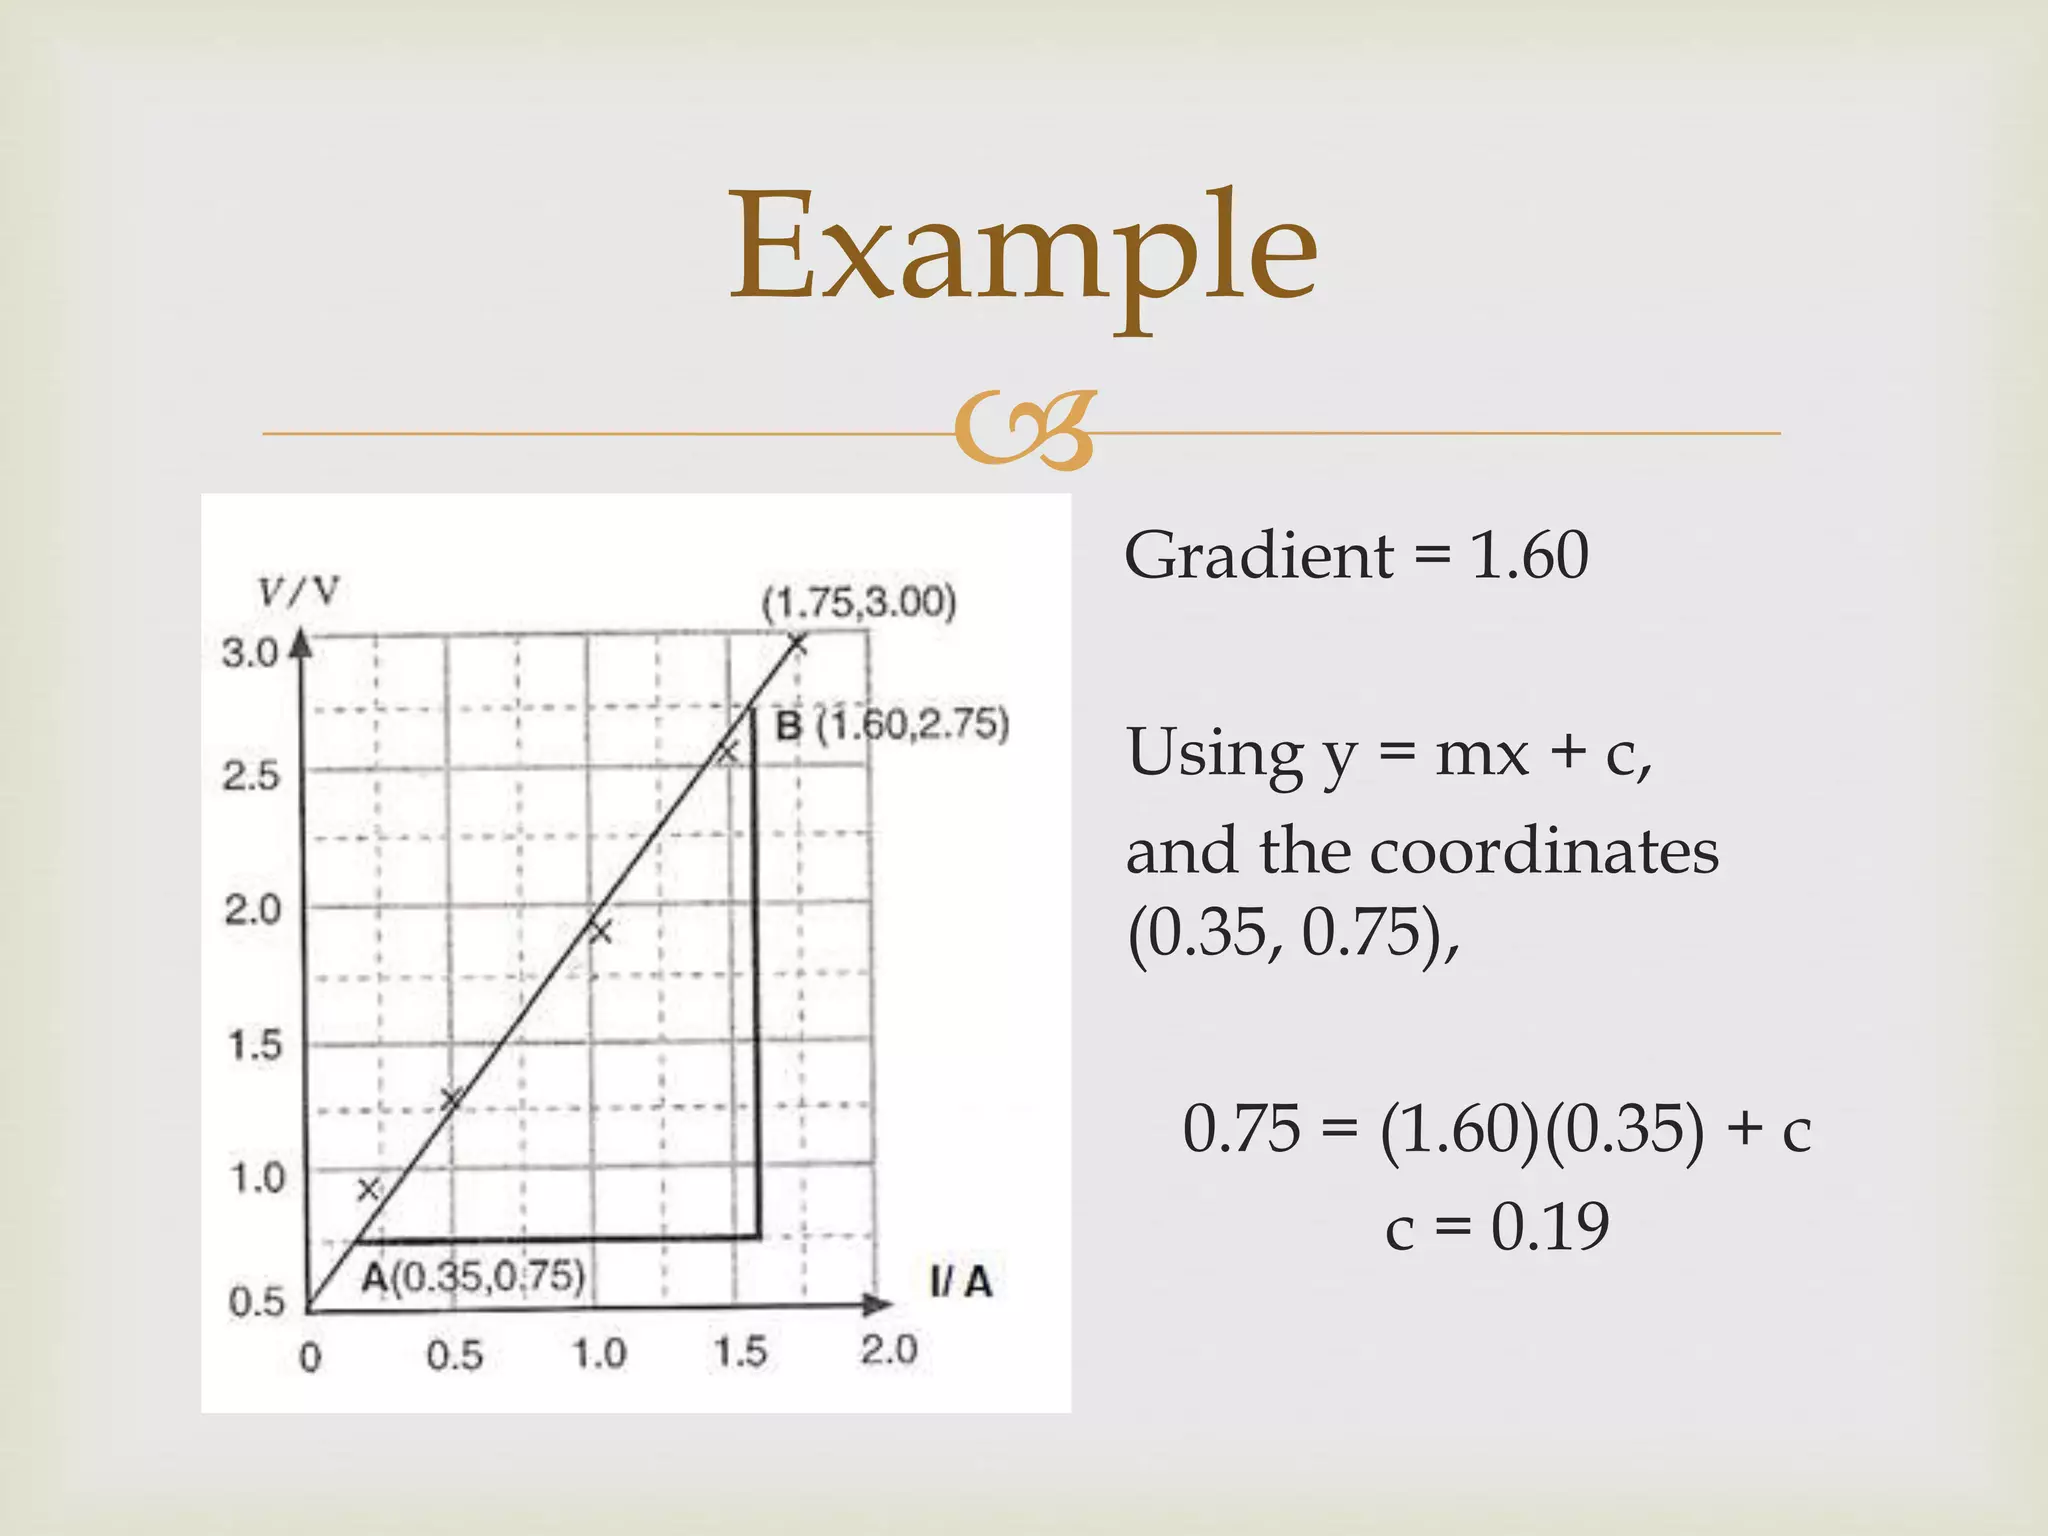

This document provides guidance on creating high-quality graphs with proper scaling, labeling, plotting of points, and calculating gradients. Key steps include using a scale where each small unit on the graph represents 1-5 units of the variable, labeling the axes with the variables and units, plotting points according to the values in the table, drawing a best-fit smooth line passing through most points, and using a triangle that covers half the line to calculate the gradient without using actual plotted points. Following these techniques will result in clear, accurate graphs.


![Checklist for practicals[1]](https://cdn.slidesharecdn.com/ss_thumbnails/checklistforpracticals1-110206102018-phpapp02-thumbnail.jpg?width=600ounds&width=560&fit=bounds)


