This document contains code for analyzing car sales data. It includes functions for reading a CSV file containing car sales data, providing a data analysis menu to view the data in different ways (e.g. columns, rows), adding or deleting records, and generating line graphs of sales data for different car models over time. The code allows users to select a car manufacturer, then a specific model to view a line graph comparing its sales figures across years.


![##Project Name: Car Model Sales Analysis
##Made By: Kush Shah, 12 Agni/ ZSE-G
import pandas as pd
import numpy as np
import time
import matplotlib.pyplot as plt
df = pd.DataFrame()
def introduction():
def read_csv_file():
df = pd.read_csv("/Users/admin/Desktop/Kush/Study/IP/PROJECT/CAR.csv")
print(df)
##Name of function: clear()
##Purpose: Clear Output Screen
def clear():
for x in range(3):
print()
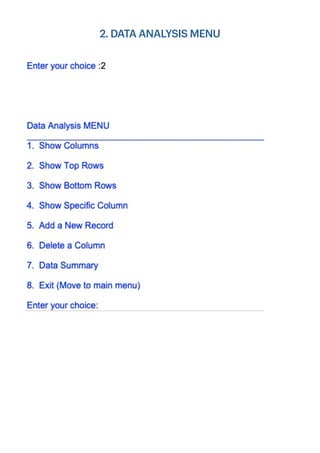
def data_analysis_menu():
df = pd.read_csv("/Users/admin/Desktop/Kush/Study/IP/PROJECT/CAR.csv")
while True:
clear()
print('nnData Analysis MENU ')
print('_'*50)
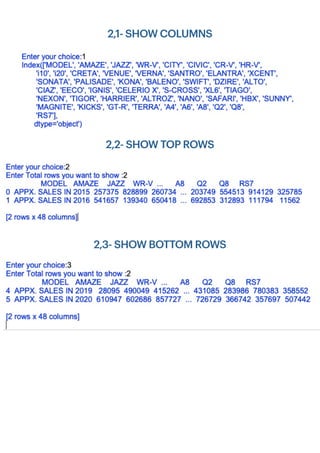
print('1. Show Columnsn')
print('2. Show Top Rowsn')
print('3. Show Bottom Rowsn')
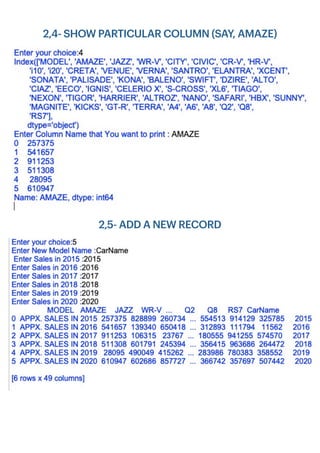
print('4. Show Specific Columnn')
print('5. Add a New Recordn')
print('6. Delete a Columnn')
print('7. Data Summaryn')
print('8. Exit (Move to main menu)n')
ch = int(input('Enter your choice:'))
if ch == 1:
print (df.columns)
wait = input()
if ch == 2:
n = int(input('Enter Total rows you want to show :'))
print(df.head(n))
wait = input()
if ch == 3:
n = int(input('Enter Total rows you want to show :'))
print(df.tail(n))
wait = input()
if ch == 4:
print(df.columns)
col_name = input('Enter Column Name that You want to print : ')
print(df[col_name])
wait = input()
if ch==5:
a = input('Enter New Model Name :')
b = input(' Enter Sales in 2015 :')
c= int(input('Enter Sales in 2016 :'))
d = int(input('Enter Sales in 2017 :'))
e = int(input('Enter Sales in 2018 :'))
f = int(input('Enter Sales in 2019 :'))](https://image.slidesharecdn.com/projectfile-kushshah-210328091452/85/Informatics-Practices-Information-Practices-Project-IP-Project-Class-12-4-320.jpg)
![g= int(input('Enter Sales in 2020 :'))
new_data= pd.Series([b,c,d,e,f,g])
df= pd.read_csv("/Users/admin/Desktop/Kush/Study/IP/PROJECT/CAR.csv", index_col=None)
z=len(df.axes[1])
df.insert(z, a, new_data)
df.to_csv("/Users/admin/Desktop/Kush/Study/IP/PROJECT/CAR.csv", index=False)
print(df)
wait=input()
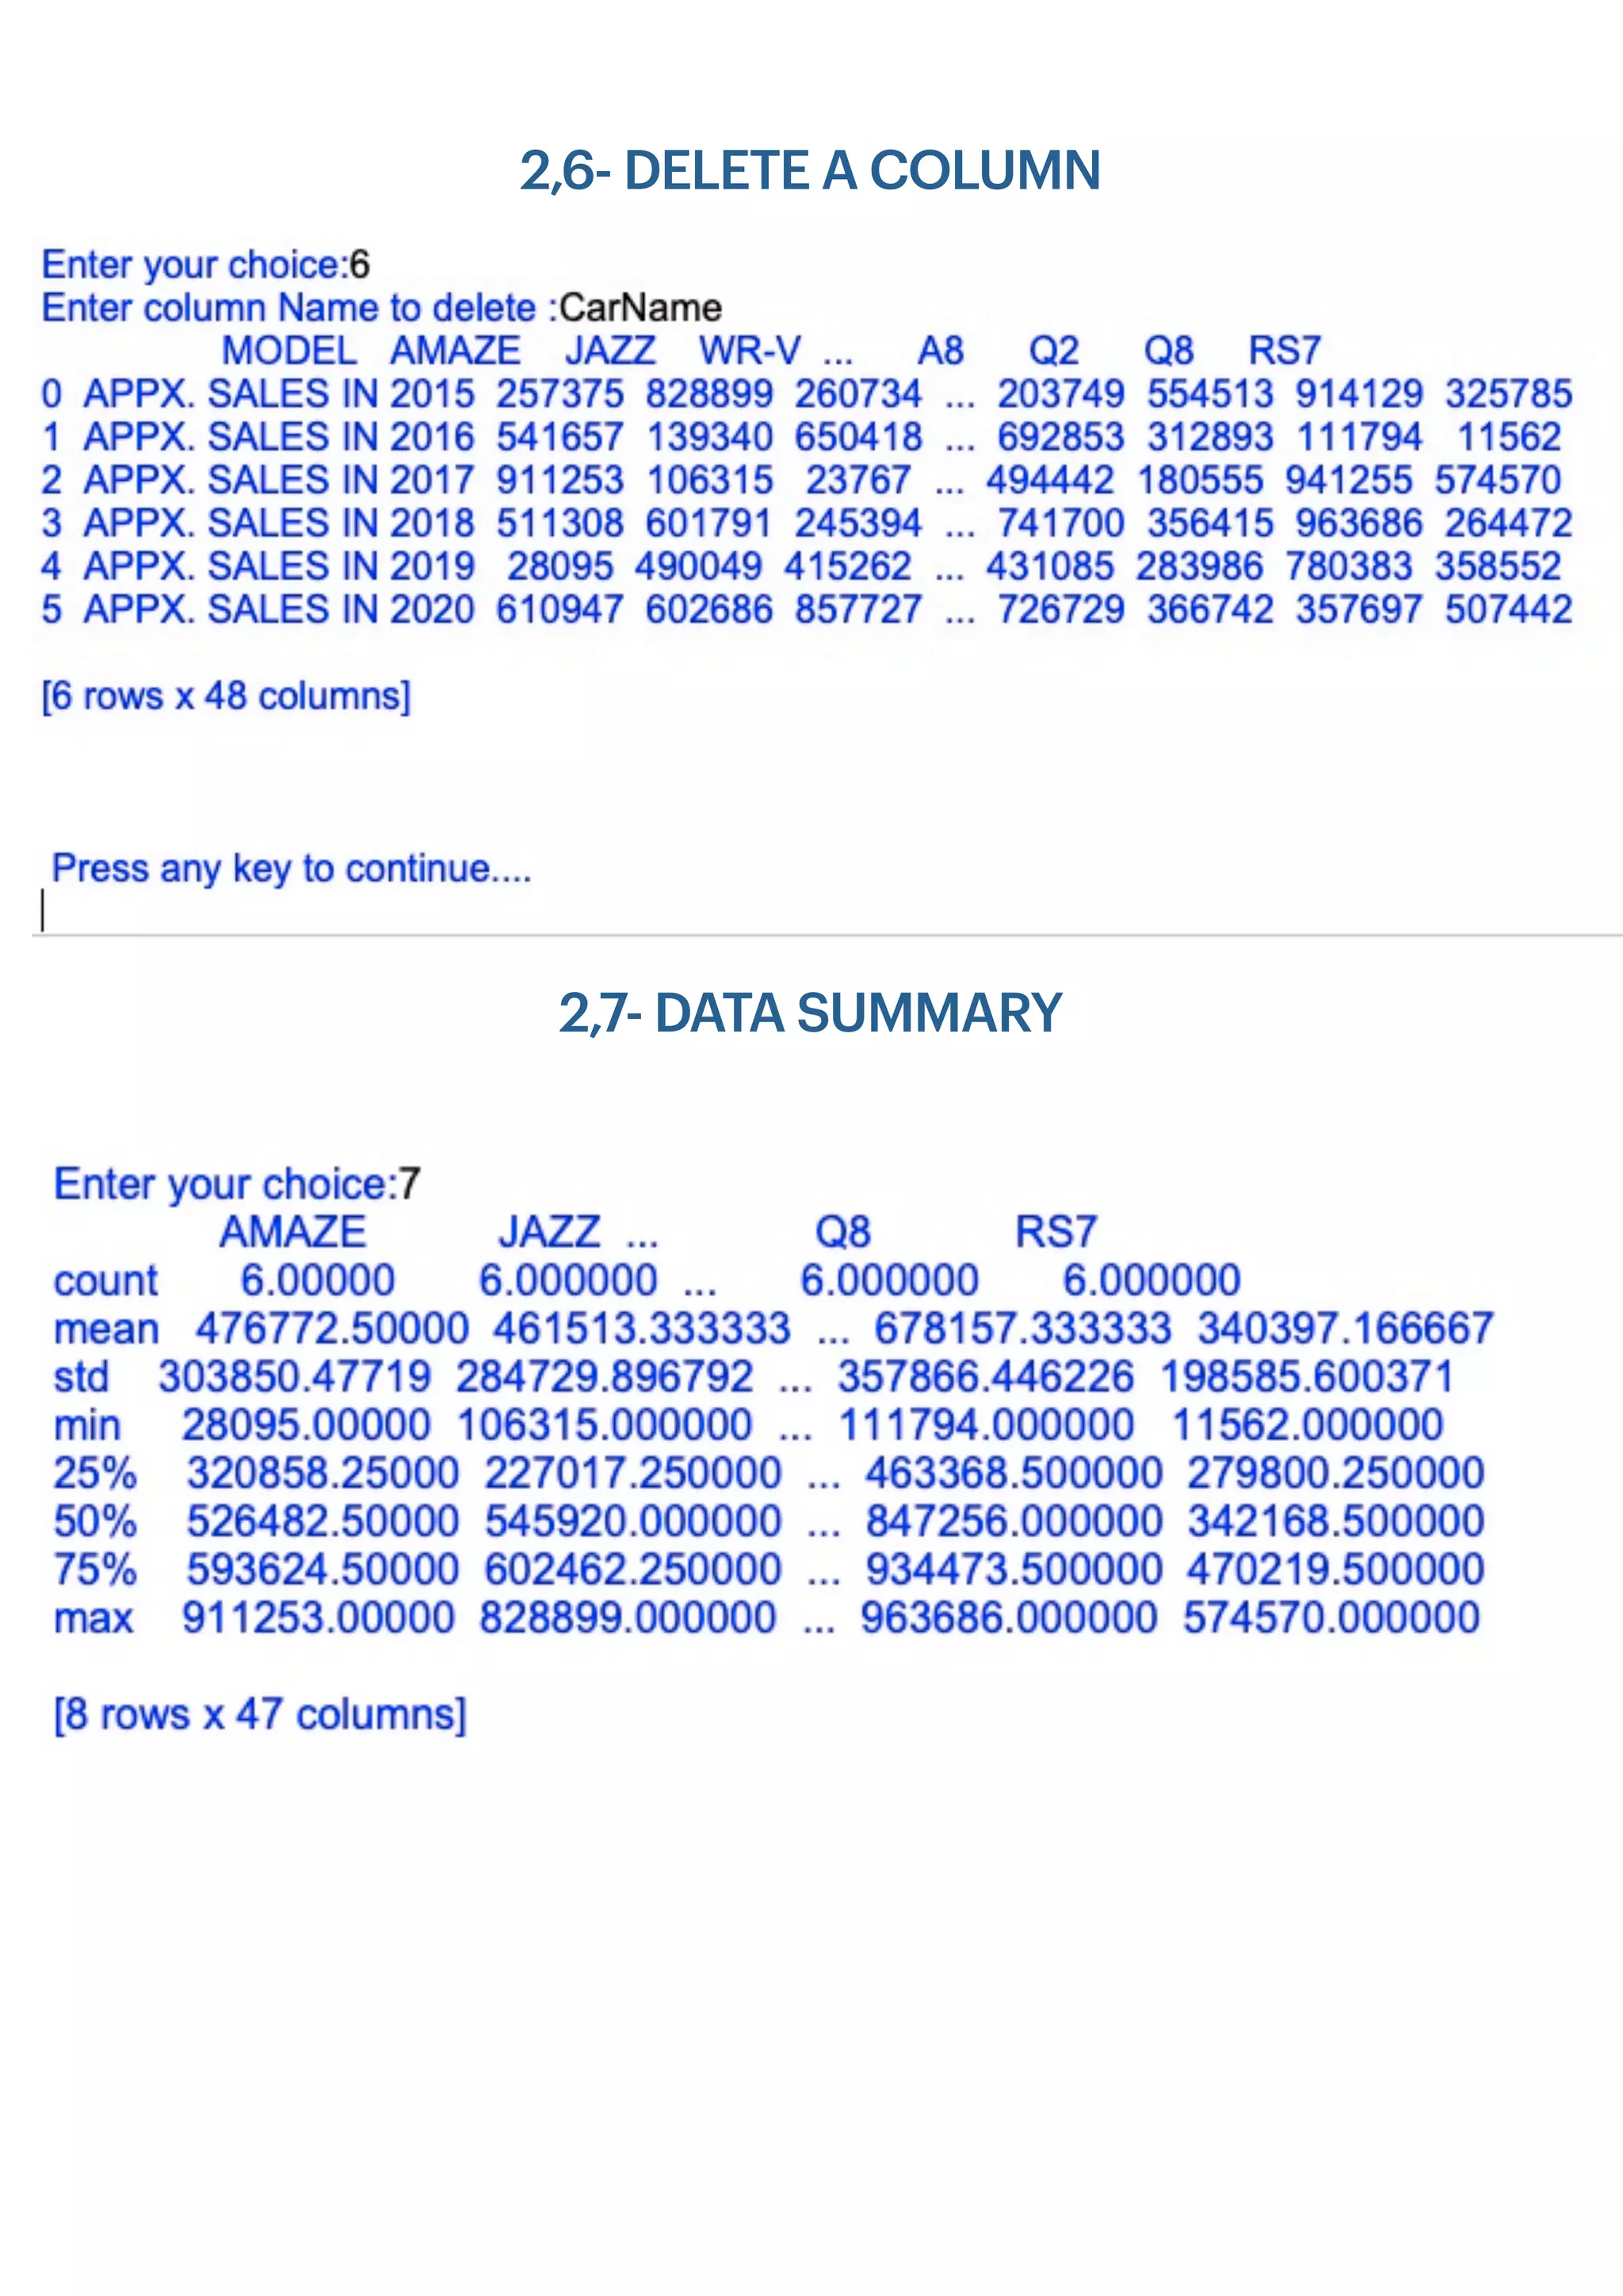
if ch==6:
col_name =input('Enter column Name to delete :')
del df[col_name]
df.to_csv("/Users/admin/Desktop/Kush/Study/IP/PROJECT/CAR.csv", index= False)
print(df)
print('nnn Press any key to continue....')
wait=input()
if ch==7:
print(df.describe())
print("nnnPress any key to continue....")
wait=input()
if ch ==8:
main_menu()
break
# name of function : graph
# purpose : To generate a Graph menu
def graph():
df = pd.read_csv("/Users/admin/Desktop/Kush/Study/IP/PROJECT/CAR.csv")
while True:
clear()
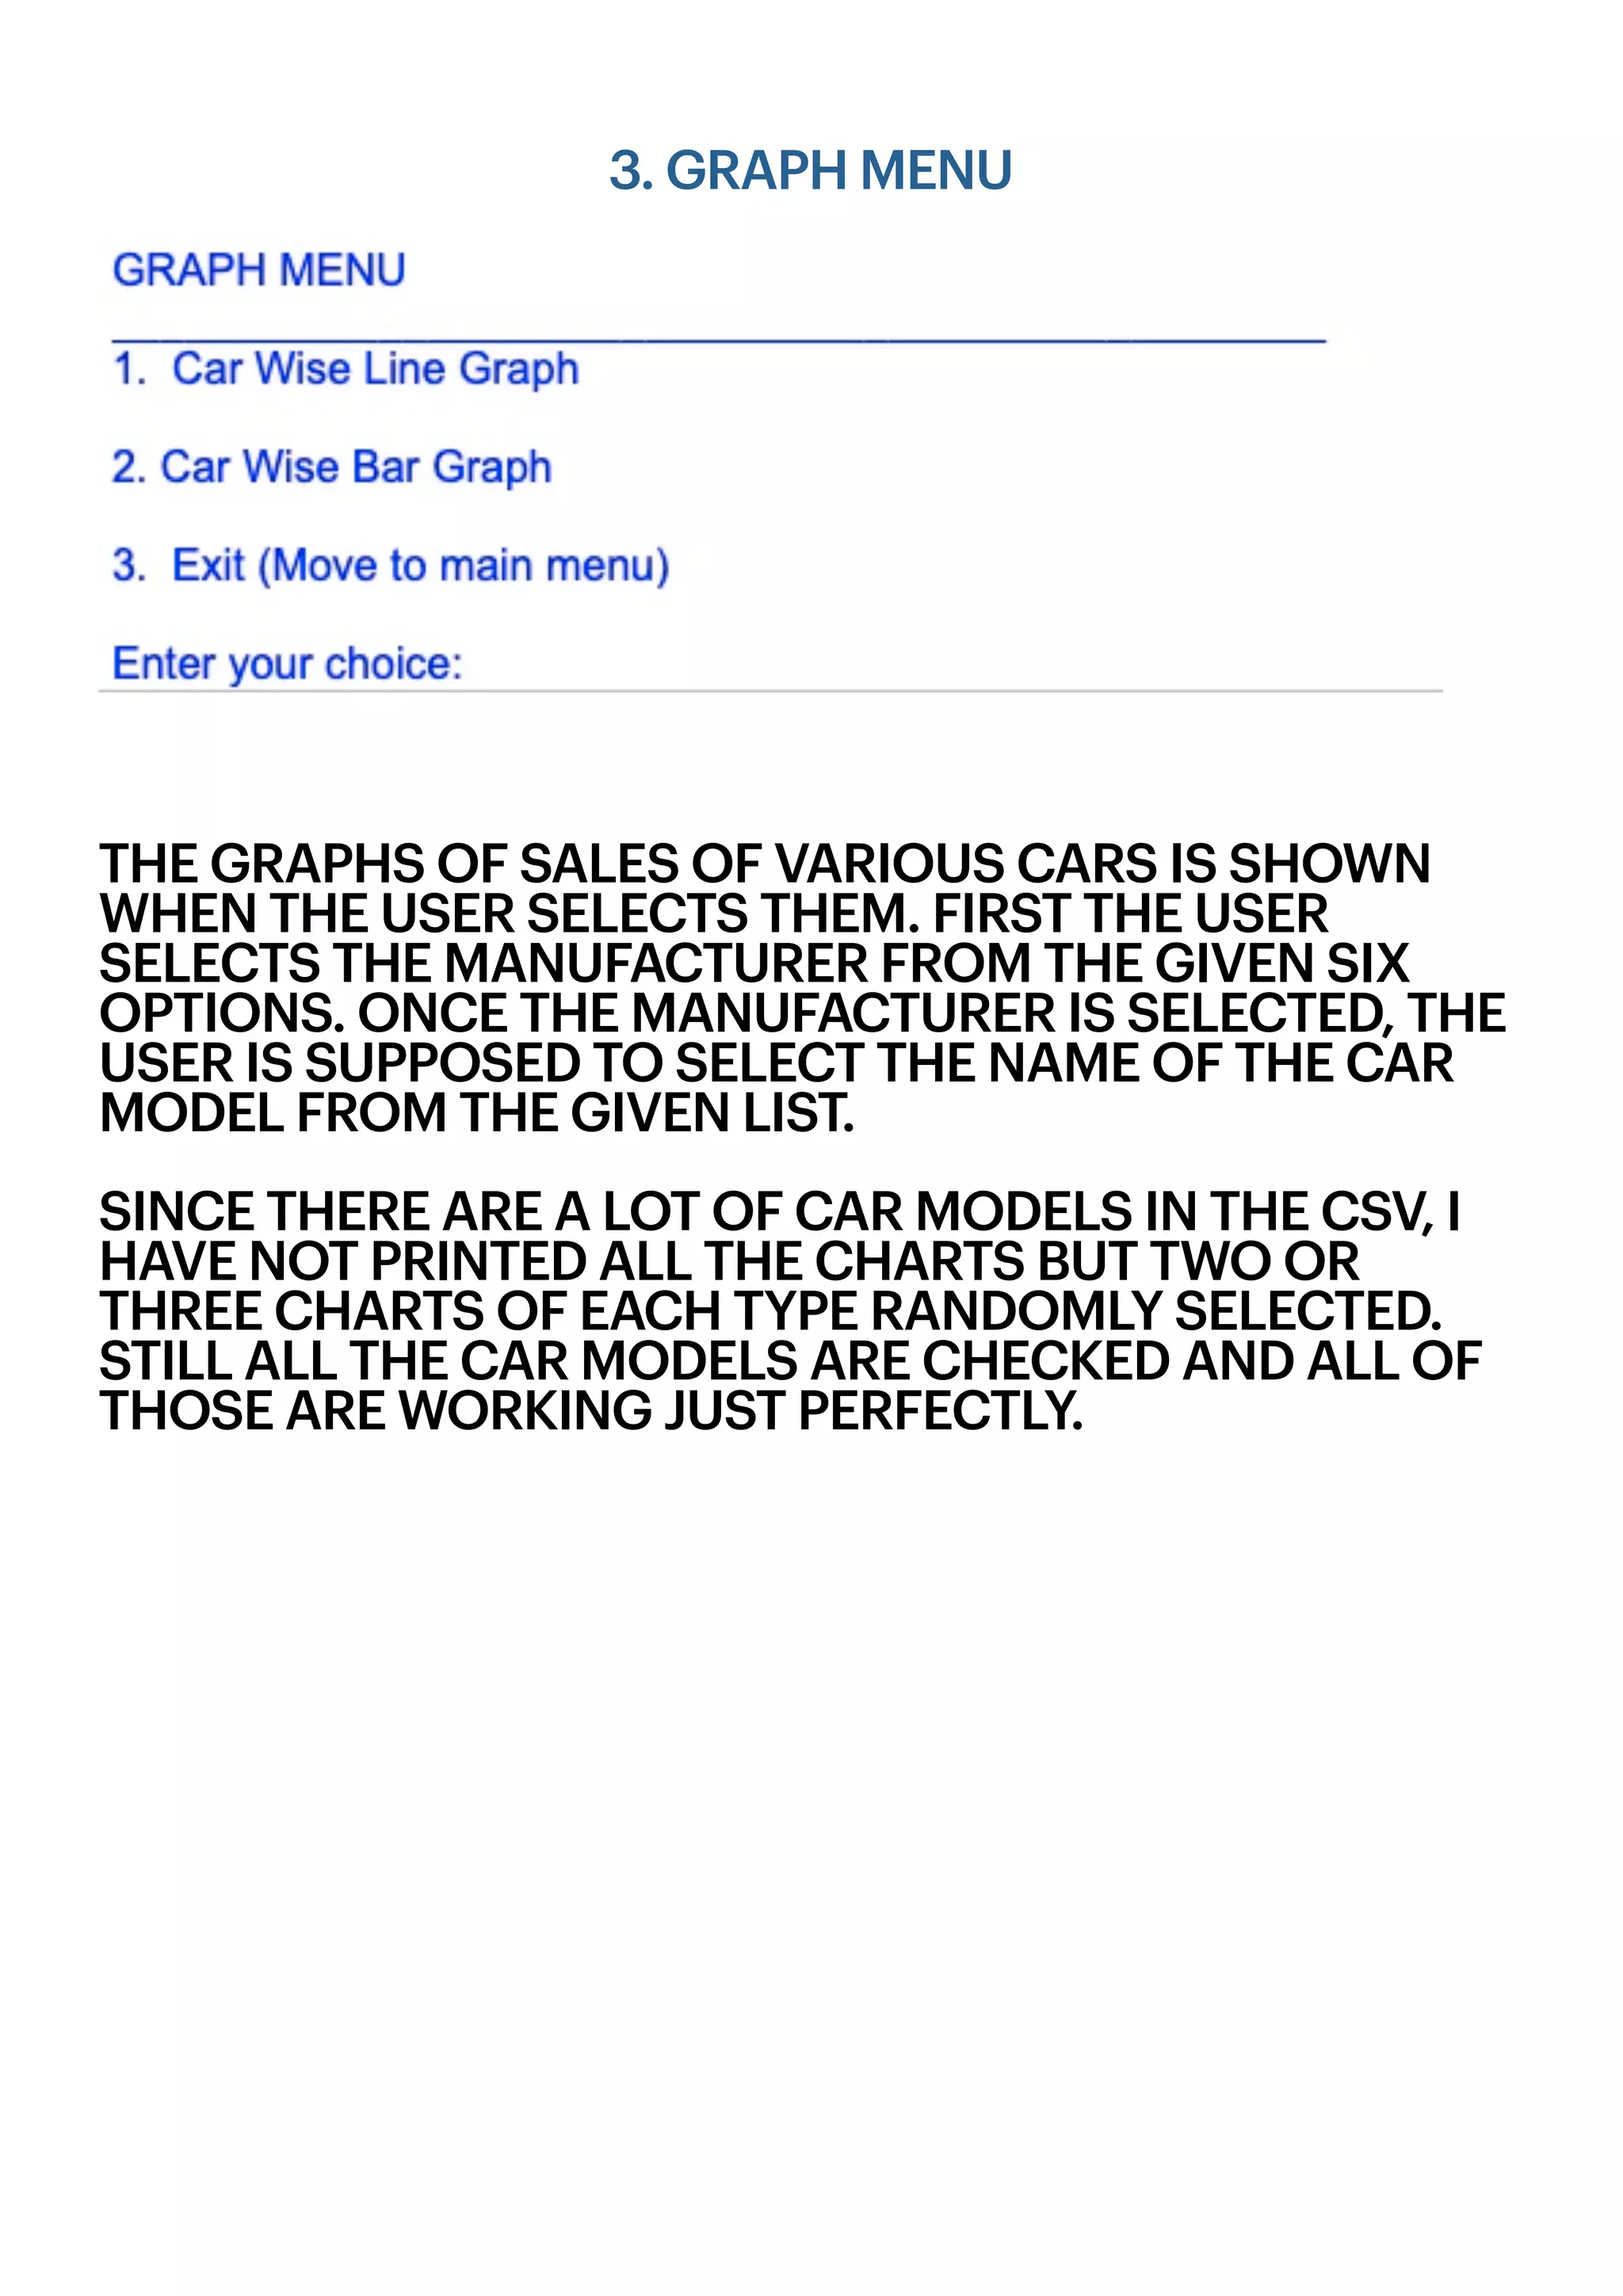
print('nGRAPH MENU ')
print('_'*50)
print('1. Car Wise Line Graphn')
print('2. Car Wise Bar Graphn')
print('3. Exit (Move to main menu)n')
ch = int(input('Enter your choice:'))
if ch == 1:
clear()
print('nSELECT MANUFACTURER')
print('_'*50)
print('1. Hondan')
print('2. Hyundain')
print('3. Maruti Suzukin')
print('4. Tatan')
print('5. Nissann')
print('6. Audin')
ch1 = int(input('Enter your choice:'))
if ch1 == 1:
clear()
print('nSELECT CAR')
print('_'*50)
print('1. Amazen')
print('2. Jazzn')
print('3. WR-Vn')
print('4. CR-Vn')](https://image.slidesharecdn.com/projectfile-kushshah-210328091452/85/Informatics-Practices-Information-Practices-Project-IP-Project-Class-12-5-320.jpg)
![print('5. HR-Vn')
print('6. Cityn')
print('7. Civicn')
ch2 = int(input('Enter your choice:'))
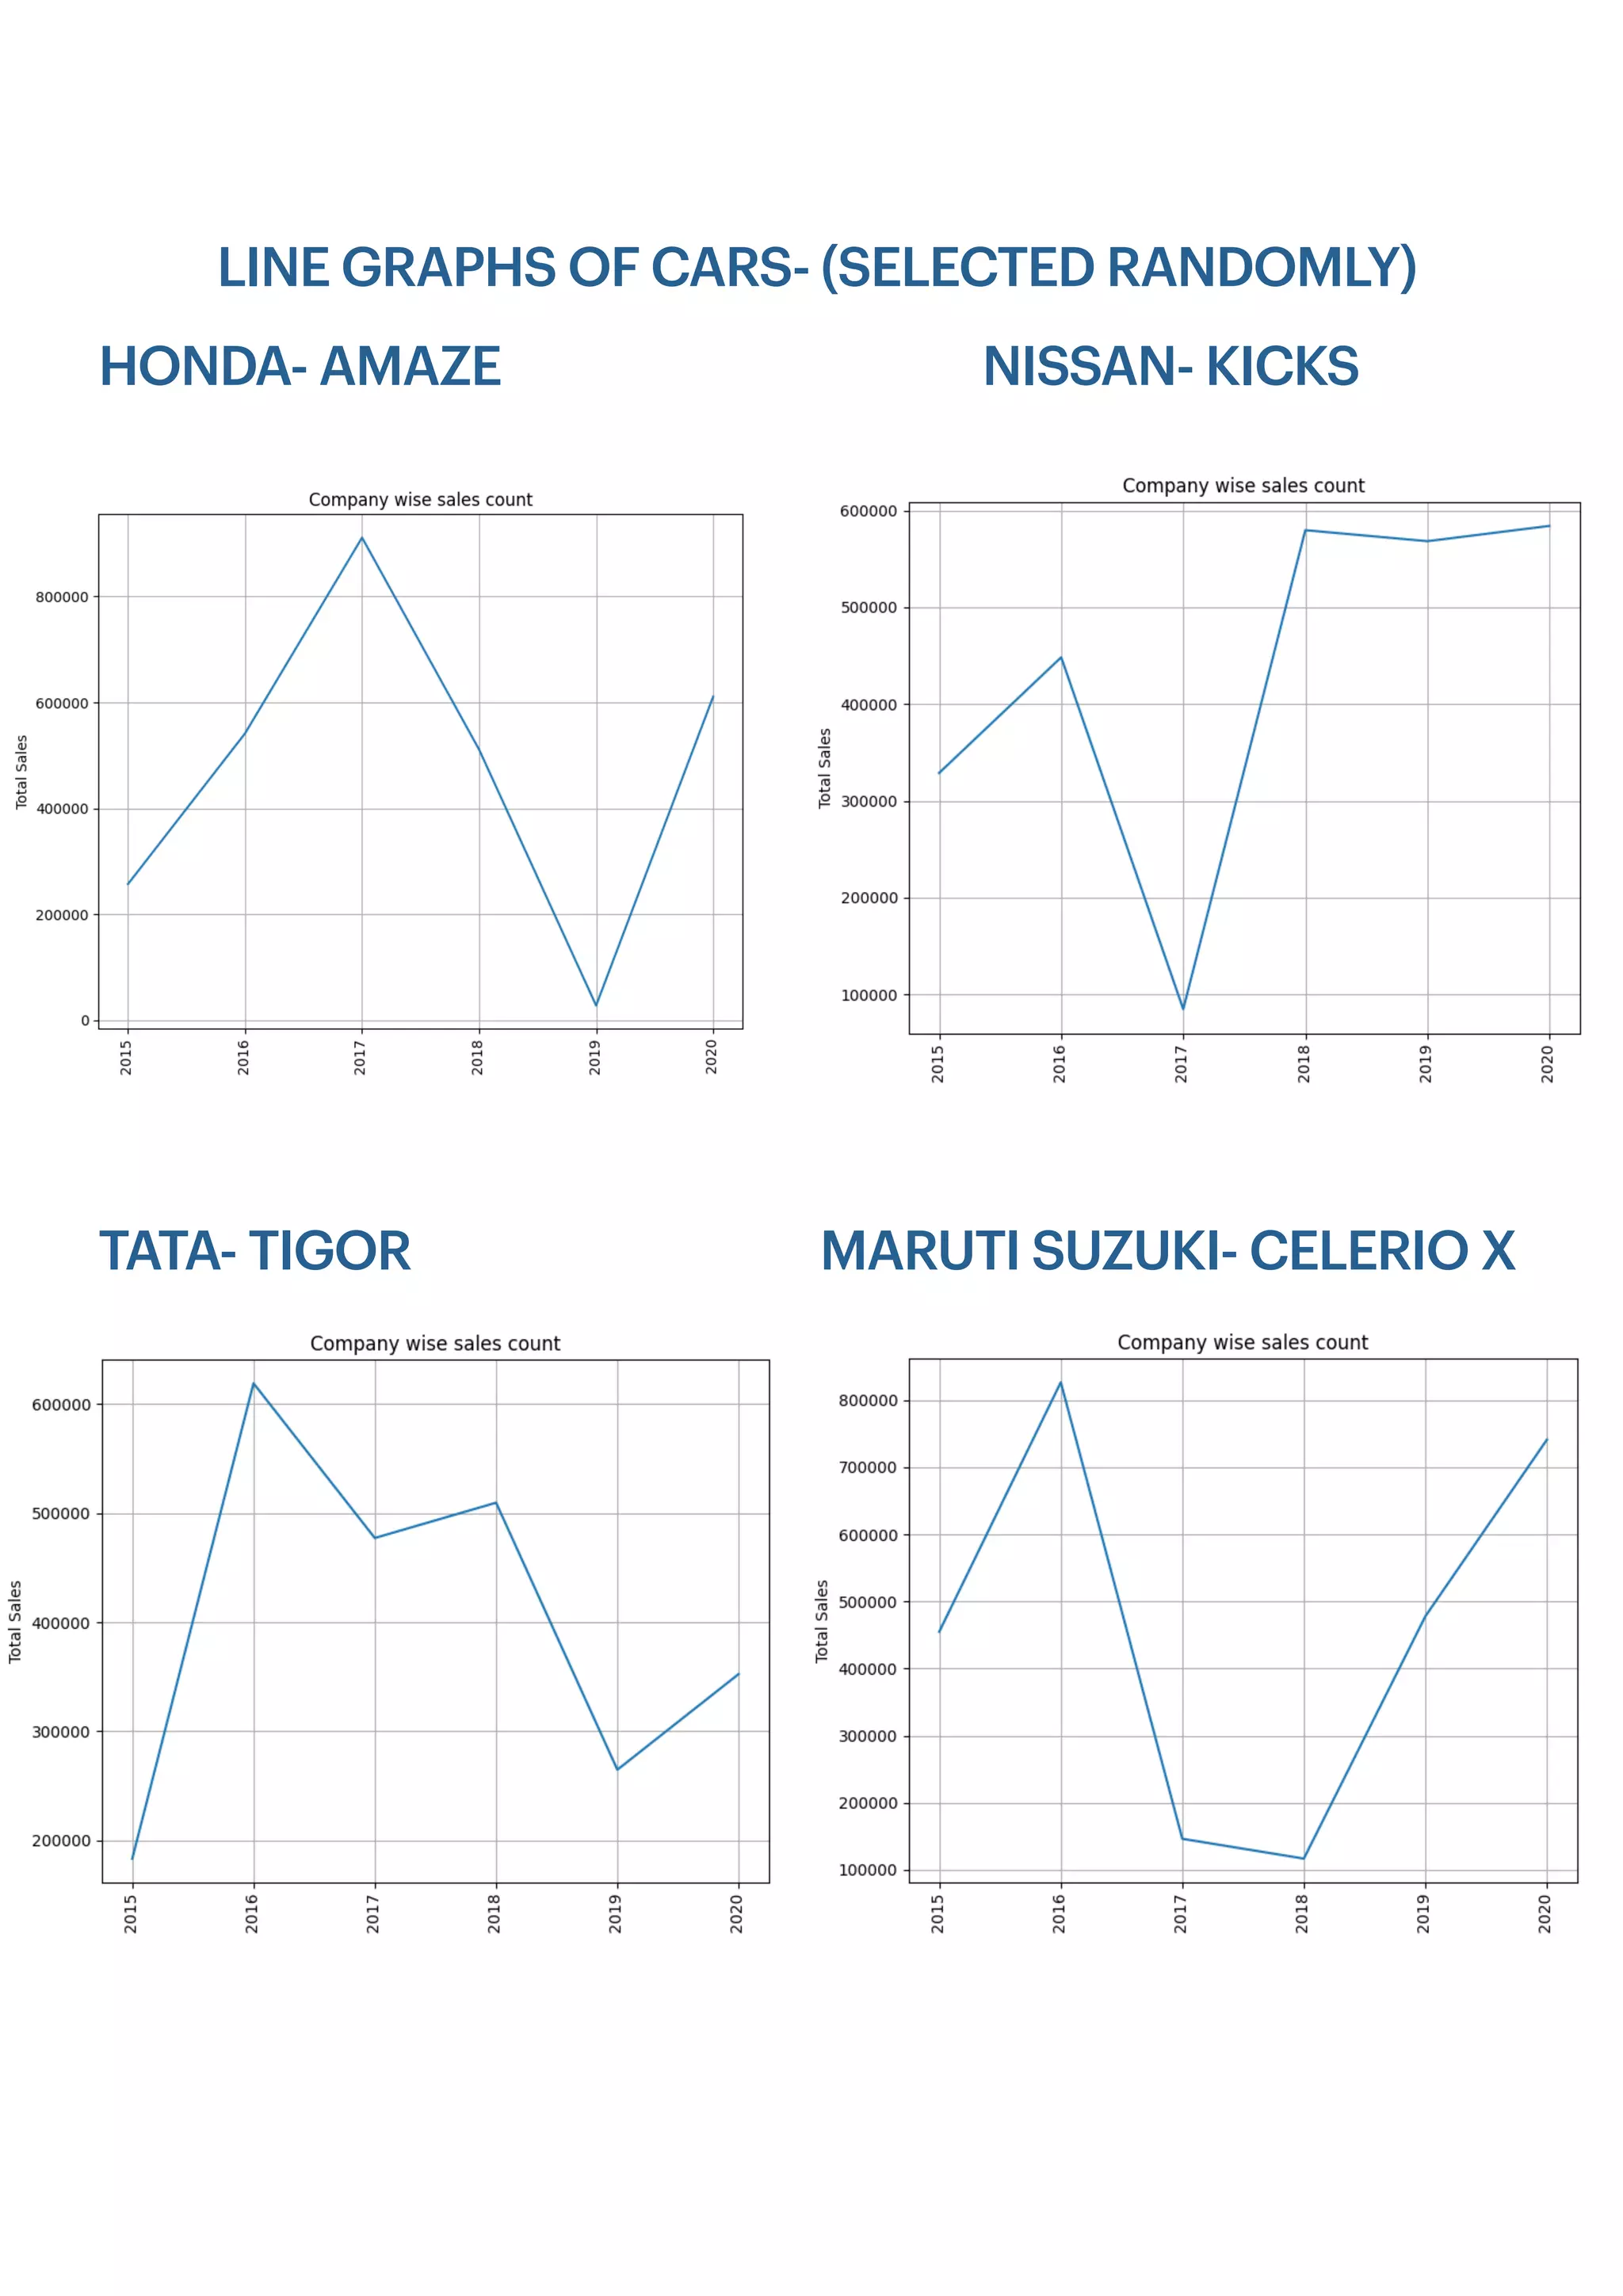
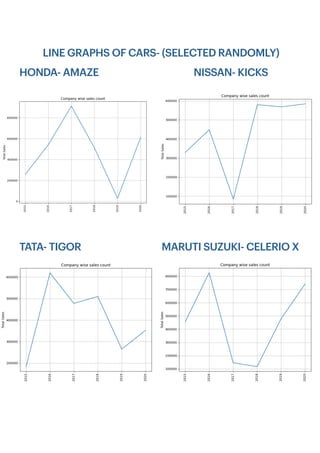
if ch2==1:
g = df.groupby('AMAZE')
x = df['MODEL']
y = df['AMAZE']
plt.xticks(rotation='vertical')
plt.xlabel('COMPANY')
plt.ylabel('Total Sales')
plt.title('Company wise sales count')
plt.grid(True)
plt.plot(x, y)
plt.show()
if ch2==2:
g = df.groupby('JAZZ')
x = df['MODEL']
y = df['JAZZ']
plt.xticks(rotation='vertical')
plt.xlabel('COMPANY')
plt.ylabel('Total Sales')
plt.title('Company wise sales count')
plt.grid(True)
plt.plot(x, y)
plt.show()
if ch2==3:
g = df.groupby('WR-V')
x = df['MODEL']
y = df['WR-V']
plt.xticks(rotation='vertical')
plt.xlabel('COMPANY')
plt.ylabel('Total Sales')
plt.title('Company wise sales count')
plt.grid(True)
plt.plot(x, y)
plt.show()
if ch2==4:
g = df.groupby('CR-V')
x = df['MODEL']
y = df['CR-V']
plt.xticks(rotation='vertical')
plt.xlabel('COMPANY')
plt.ylabel('Total Sales')
plt.title('Company wise sales count')
plt.grid(True)
plt.plot(x, y)
plt.show()
if ch2==5:
g = df.groupby('HR-V')
x = df['MODEL']
y = df['HR-V']
plt.xticks(rotation='vertical')
plt.xlabel('COMPANY')
plt.ylabel('Total Sales')
plt.title('Company wise sales count')
plt.grid(True)
plt.plot(x, y)
plt.show()
if ch2==6:
g = df.groupby('CITY')
x = df['MODEL']](https://image.slidesharecdn.com/projectfile-kushshah-210328091452/85/Informatics-Practices-Information-Practices-Project-IP-Project-Class-12-6-320.jpg)
![y = df['CITY']
plt.xticks(rotation='vertical')
plt.xlabel('COMPANY')
plt.ylabel('Total Sales')
plt.title('Company wise sales count')
plt.grid(True)
plt.plot(x, y)
plt.show()
if ch2==7:
g = df.groupby('CIVIC')
x = df['MODEL']
y = df['CIVIC']
plt.xticks(rotation='vertical')
plt.xlabel('COMPANY')
plt.ylabel('Total Sales')
plt.title('Company wise sales count')
plt.grid(True)
plt.plot(x, y)
plt.show()
if ch1==2:
clear()
print('nSELECT CAR')
print('_'*50)
print('1. i10n')
print('2. i20n')
print('3. Cretan')
print('4. Venuen')
print('5. Vernan')
print('6. Santron')
print('7. Elantran')
print('8. Xcentn')
print('9. Sonatan')
print('10. Palisaden')
print('11. Konan')
ch3 = int(input('Enter your choice:'))
if ch3==1:
g = df.groupby('i10')
x = df['MODEL']
y = df['i10']
plt.xticks(rotation='vertical')
plt.xlabel('COMPANY')
plt.ylabel('Total Sales')
plt.title('Company wise sales count')
plt.grid(True)
plt.plot(x, y)
plt.show()
if ch3==2:
g = df.groupby('i20')
x = df['MODEL']
y = df['i20']
plt.xticks(rotation='vertical')
plt.xlabel('COMPANY')
plt.ylabel('Total Sales')
plt.title('Company wise sales count')
plt.grid(True)
plt.plot(x, y)
plt.show()
if ch3==3:
g = df.groupby('CRETA')
x = df['MODEL']
y = df['CRETA']](https://image.slidesharecdn.com/projectfile-kushshah-210328091452/85/Informatics-Practices-Information-Practices-Project-IP-Project-Class-12-7-320.jpg)
![plt.xticks(rotation='vertical')
plt.xlabel('COMPANY')
plt.ylabel('Total Sales')
plt.title('Company wise sales count')
plt.grid(True)
plt.plot(x, y)
plt.show()
if ch3==4:
g = df.groupby('VENUE')
x = df['MODEL']
y = df['VENUE']
plt.xticks(rotation='vertical')
plt.xlabel('COMPANY')
plt.ylabel('Total Sales')
plt.title('Company wise sales count')
plt.grid(True)
plt.plot(x, y)
plt.show()
if ch3==5:
g = df.groupby('VERNA')
x = df['MODEL']
y = df['VERNA']
plt.xticks(rotation='vertical')
plt.xlabel('COMPANY')
plt.ylabel('Total Sales')
plt.title('Company wise sales count')
plt.grid(True)
plt.plot(x, y)
plt.show()
if ch3==6:
g = df.groupby('SANTRO')
x = df['MODEL']
y = df['SANTRO']
plt.xticks(rotation='vertical')
plt.xlabel('COMPANY')
plt.ylabel('Total Sales')
plt.title('Company wise sales count')
plt.grid(True)
plt.plot(x, y)
plt.show()
if ch3==7:
g = df.groupby('ELANTRA')
x = df['MODEL']
y = df['ELANTRA']
plt.xticks(rotation='vertical')
plt.xlabel('COMPANY')
plt.ylabel('Total Sales')
plt.title('Company wise sales count')
plt.grid(True)
plt.plot(x, y)
plt.show()
if ch3==8:
g = df.groupby('XCENT')
x = df['MODEL']
y = df['XCENT']
plt.xticks(rotation='vertical')
plt.xlabel('COMPANY')
plt.ylabel('Total Sales')
plt.title('Company wise sales count')
plt.grid(True)
plt.plot(x, y)
plt.show()
if ch3==9:
g = df.groupby('SONATA')](https://image.slidesharecdn.com/projectfile-kushshah-210328091452/85/Informatics-Practices-Information-Practices-Project-IP-Project-Class-12-8-320.jpg)
![x = df['MODEL']
y = df['SONATA']
plt.xticks(rotation='vertical')
plt.xlabel('COMPANY')
plt.ylabel('Total Sales')
plt.title('Company wise sales count')
plt.grid(True)
plt.plot(x, y)
plt.show()
if ch3==10:
g = df.groupby('PALISADE')
x = df['MODEL']
y = df['PALISADE']
plt.xticks(rotation='vertical')
plt.xlabel('COMPANY')
plt.ylabel('Total Sales')
plt.title('Company wise sales count')
plt.grid(True)
plt.plot(x, y)
plt.show()
if ch3==11:
g = df.groupby('KONA')
x = df['MODEL']
y = df['KONA']
plt.xticks(rotation='vertical')
plt.xlabel('COMPANY')
plt.ylabel('Total Sales')
plt.title('Company wise sales count')
plt.grid(True)
plt.plot(x, y)
plt.show()
if ch1==3:
clear()
print('nSELECT CAR')
print('_'*50)
print('1. Balenon')
print('2. Swiftn')
print('3. DZiren')
print('4. Alton')
print('5. Ciazn')
print('6. Eecon')
print('7. Ignisn')
print('8. Celerio Xn')
print('9 S-Crossn')
print('10. XL6n')
ch4 = int(input('Enter your choice:'))
if ch4==1:
g = df.groupby('BALENO')
x = df['MODEL']
y = df['BALENO']
plt.xticks(rotation='vertical')
plt.xlabel('COMPANY')
plt.ylabel('Total Sales')
plt.title('Company wise sales count')
plt.grid(True)
plt.plot(x, y)
plt.show()
if ch4==2:
g = df.groupby('SWIFT')
x = df['MODEL']
y = df['SWIFT']
plt.xticks(rotation='vertical')](https://image.slidesharecdn.com/projectfile-kushshah-210328091452/85/Informatics-Practices-Information-Practices-Project-IP-Project-Class-12-9-320.jpg)
![plt.xlabel('COMPANY')
plt.ylabel('Total Sales')
plt.title('Company wise sales count')
plt.grid(True)
plt.plot(x, y)
plt.show()
if ch4==3:
g = df.groupby('DZIRE')
x = df['MODEL']
y = df['DZIRE']
plt.xticks(rotation='vertical')
plt.xlabel('COMPANY')
plt.ylabel('Total Sales')
plt.title('Company wise sales count')
plt.grid(True)
plt.plot(x, y)
plt.show()
if ch4==4:
g = df.groupby('ALTO')
x = df['MODEL']
y = df['ALTO']
plt.xticks(rotation='vertical')
plt.xlabel('COMPANY')
plt.ylabel('Total Sales')
plt.title('Company wise sales count')
plt.grid(True)
plt.plot(x, y)
plt.show()
if ch4==5:
g = df.groupby('CIAZ')
x = df['MODEL']
y = df['CIAZ']
plt.xticks(rotation='vertical')
plt.xlabel('COMPANY')
plt.ylabel('Total Sales')
plt.title('Company wise sales count')
plt.grid(True)
plt.plot(x, y)
plt.show()
if ch4==6:
g = df.groupby('EECO')
x = df['MODEL']
y = df['EECO']
plt.xticks(rotation='vertical')
plt.xlabel('COMPANY')
plt.ylabel('Total Sales')
plt.title('Company wise sales count')
plt.grid(True)
plt.plot(x, y)
plt.show()
if ch4==7:
g = df.groupby('IGNIS')
x = df['MODEL']
y = df['IGNIS']
plt.xticks(rotation='vertical')
plt.xlabel('COMPANY')
plt.ylabel('Total Sales')
plt.title('Company wise sales count')
plt.grid(True)
plt.plot(x, y)
plt.show()
if ch4==8:
g = df.groupby('CELERIO X')
x = df['MODEL']](https://image.slidesharecdn.com/projectfile-kushshah-210328091452/85/Informatics-Practices-Information-Practices-Project-IP-Project-Class-12-10-320.jpg)
![y = df['CELERIO X']
plt.xticks(rotation='vertical')
plt.xlabel('COMPANY')
plt.ylabel('Total Sales')
plt.title('Company wise sales count')
plt.grid(True)
plt.plot(x, y)
plt.show()
if ch4==9:
g = df.groupby('S-CROSS')
x = df['MODEL']
y = df['S-CROSS']
plt.xticks(rotation='vertical')
plt.xlabel('COMPANY')
plt.ylabel('Total Sales')
plt.title('Company wise sales count')
plt.grid(True)
plt.plot(x, y)
plt.show()
if ch4==10:
g = df.groupby('XL6')
x = df['MODEL']
y = df['XL6']
plt.xticks(rotation='vertical')
plt.xlabel('COMPANY')
plt.ylabel('Total Sales')
plt.title('Company wise sales count')
plt.grid(True)
plt.plot(x, y)
plt.show()
if ch1==4:
clear()
print('nSELECT CAR')
print('_'*50)
print('1. Tiagon')
print('2. Nexonn')
print('3. Tigorn')
print('4. Harriern')
print('5. Altrozn')
print('6. Nanon')
print('7. Safarin')
print('8. HBXn')
ch5 = int(input('Enter your choice:'))
if ch5==1:
g = df.groupby('TIAGO')
x = df['MODEL']
y = df['TIAGO']
plt.xticks(rotation='vertical')
plt.xlabel('COMPANY')
plt.ylabel('Total Sales')
plt.title('Company wise sales count')
plt.grid(True)
plt.plot(x, y)
plt.show()
if ch5==2:
g = df.groupby('NEXON')
x = df['MODEL']
y = df['NEXON']
plt.xticks(rotation='vertical')
plt.xlabel('COMPANY')
plt.ylabel('Total Sales')
plt.title('Company wise sales count')](https://image.slidesharecdn.com/projectfile-kushshah-210328091452/85/Informatics-Practices-Information-Practices-Project-IP-Project-Class-12-11-320.jpg)
![plt.grid(True)
plt.plot(x, y)
plt.show()
if ch5==3:
g = df.groupby('TIGOR')
x = df['MODEL']
y = df['TIGOR']
plt.xticks(rotation='vertical')
plt.xlabel('COMPANY')
plt.ylabel('Total Sales')
plt.title('Company wise sales count')
plt.grid(True)
plt.plot(x, y)
plt.show()
if ch5==4:
g = df.groupby('HARRIER')
x = df['MODEL']
y = df['HARRIER']
plt.xticks(rotation='vertical')
plt.xlabel('COMPANY')
plt.ylabel('Total Sales')
plt.title('Company wise sales count')
plt.grid(True)
plt.plot(x, y)
plt.show()
if ch5==5:
g = df.groupby('ALTROZ')
x = df['MODEL']
y = df['ALTROZ']
plt.xticks(rotation='vertical')
plt.xlabel('COMPANY')
plt.ylabel('Total Sales')
plt.title('Company wise sales count')
plt.grid(True)
plt.plot(x, y)
plt.show()
if ch5==6:
g = df.groupby('NANO')
x = df['MODEL']
y = df['NANO']
plt.xticks(rotation='vertical')
plt.xlabel('COMPANY')
plt.ylabel('Total Sales')
plt.title('Company wise sales count')
plt.grid(True)
plt.plot(x, y)
plt.show()
if ch5==7:
g = df.groupby('SAFARI')
x = df['MODEL']
y = df['SAFARI']
plt.xticks(rotation='vertical')
plt.xlabel('COMPANY')
plt.ylabel('Total Sales')
plt.title('Company wise sales count')
plt.grid(True)
plt.plot(x, y)
plt.show()
if ch5==8:
g = df.groupby('HBX')
x = df['MODEL']
y = df['HBX']
plt.xticks(rotation='vertical')
plt.xlabel('COMPANY')](https://image.slidesharecdn.com/projectfile-kushshah-210328091452/85/Informatics-Practices-Information-Practices-Project-IP-Project-Class-12-12-320.jpg)
![plt.ylabel('Total Sales')
plt.title('Company wise sales count')
plt.grid(True)
plt.plot(x, y)
plt.show()
if ch1==5:
clear()
print('nSELECT CAR')
print('_'*50)
print('1. Sunnyn')
print('2. Magniten')
print('3. Kicksn')
print('4. GT-Rn')
print('5. Terran')
ch6 = int(input('Enter your choice:'))
if ch6==1:
g = df.groupby('SUNNY')
x = df['MODEL']
y = df['SUNNY']
plt.xticks(rotation='vertical')
plt.xlabel('COMPANY')
plt.ylabel('Total Sales')
plt.title('Company wise sales count')
plt.grid(True)
plt.plot(x, y)
plt.show()
if ch6==2:
g = df.groupby('MAGNITE')
x = df['MODEL']
y = df['MAGNITE']
plt.xticks(rotation='vertical')
plt.xlabel('COMPANY')
plt.ylabel('Total Sales')
plt.title('Company wise sales count')
plt.grid(True)
plt.plot(x, y)
plt.show()
if ch6==3:
g = df.groupby('KICKS')
x = df['MODEL']
y = df['KICKS']
plt.xticks(rotation='vertical')
plt.xlabel('COMPANY')
plt.ylabel('Total Sales')
plt.title('Company wise sales count')
plt.grid(True)
plt.plot(x, y)
plt.show()
if ch6==4:
g = df.groupby('GT-R')
x = df['MODEL']
y = df['GT-R']
plt.xticks(rotation='vertical')
plt.xlabel('COMPANY')
plt.ylabel('Total Sales')
plt.title('Company wise sales count')
plt.grid(True)
plt.plot(x, y)
plt.show()
if ch6==5:
g = df.groupby('TERRA')](https://image.slidesharecdn.com/projectfile-kushshah-210328091452/85/Informatics-Practices-Information-Practices-Project-IP-Project-Class-12-13-320.jpg)
![x = df['MODEL']
y = df['TERRA']
plt.xticks(rotation='vertical')
plt.xlabel('COMPANY')
plt.ylabel('Total Sales')
plt.title('Company wise sales count')
plt.grid(True)
plt.plot(x, y)
plt.show()
if ch1==6:
clear()
print('nSELECT CAR')
print('_'*50)
print('1. A4n')
print('2. A6n')
print('3. A8n')
print('4. Q2n')
print('5. Q8n')
print('6. RS7n')
ch7 = int(input('Enter your choice:'))
if ch7==1:
g = df.groupby('A4')
x = df['MODEL']
y = df['A4']
plt.xticks(rotation='vertical')
plt.xlabel('COMPANY')
plt.ylabel('Total Sales')
plt.title('Company wise sales count')
plt.grid(True)
plt.plot(x, y)
plt.show()
if ch7==2:
g = df.groupby('A6')
x = df['MODEL']
y = df['A8']
plt.xticks(rotation='vertical')
plt.xlabel('COMPANY')
plt.ylabel('Total Sales')
plt.title('Company wise sales count')
plt.grid(True)
plt.plot(x, y)
plt.show()
if ch7==3:
g = df.groupby('A8')
x = df['MODEL']
y = df['A8']
plt.xticks(rotation='vertical')
plt.xlabel('COMPANY')
plt.ylabel('Total Sales')
plt.title('Company wise sales count')
plt.grid(True)
plt.plot(x, y)
plt.show()
if ch7==4:
g = df.groupby('Q2')
x = df['MODEL']
y = df['Q2']
plt.xticks(rotation='vertical')
plt.xlabel('COMPANY')
plt.ylabel('Total Sales')
plt.title('Company wise sales count')
plt.grid(True)](https://image.slidesharecdn.com/projectfile-kushshah-210328091452/85/Informatics-Practices-Information-Practices-Project-IP-Project-Class-12-14-320.jpg)
![plt.plot(x, y)
plt.show()
if ch7==5:
g = df.groupby('Q8')
x = df['MODEL']
y = df['Q8']
plt.xticks(rotation='vertical')
plt.xlabel('COMPANY')
plt.ylabel('Total Sales')
plt.title('Company wise sales count')
plt.grid(True)
plt.plot(x, y)
plt.show()
if ch7==6:
g = df.groupby('RS7')
x = df['MODEL']
y = df['RS7']
plt.xticks(rotation='vertical')
plt.xlabel('COMPANY')
plt.ylabel('Total Sales')
plt.title('Company wise sales count')
plt.grid(True)
plt.plot(x, y)
plt.show()
if ch == 2:
clear()
print('nSELECT MANUFACTURER')
print('_'*50)
print('1. Hondan')
print('2. Hyundain')
print('3. Maruti Suzukin')
print('4. Tatan')
print('5. Nissann')
print('6. Audin')
ch8 = int(input('Enter your choice:'))
if ch8==1:
clear()
print('nSELECT CAR')
print('_'*50)
print('1. Amazen')
print('2. Jazzn')
print('3. WR-Vn')
print('4. CR-Vn')
print('5. HR-Vn')
print('6. Cityn')
print('7. Civicn')
ch9 = int(input('Enter your choice:'))
if ch9==1:
g = df.groupby('AMAZE')
x = df['MODEL']
y = df['AMAZE']
plt.xticks(rotation='vertical')
plt.xlabel('Year')
plt.ylabel('Total Sales')
plt.title('Car Wise Sales Count')
plt.bar(x, y)
plt.grid(True)
plt.show()](https://image.slidesharecdn.com/projectfile-kushshah-210328091452/85/Informatics-Practices-Information-Practices-Project-IP-Project-Class-12-15-320.jpg)
![if ch9==2:
g = df.groupby('JAZZ')
x = df['MODEL']
y = df['JAZZ']
plt.xticks(rotation='vertical')
plt.xlabel('COMPANY')
plt.ylabel('Total Sales')
plt.title('Car Wise Sales Count')
plt.bar(x, y)
plt.grid(True)
plt.show()
if ch9==3:
g = df.groupby('WR-V')
x = df['MODEL']
y = df['WR_V']
plt.xticks(rotation='vertical')
plt.xlabel('COMPANY')
plt.ylabel('Total Sales')
plt.title('Car Wise Sales Count')
plt.bar(x, y)
plt.grid(True)
plt.show()
if ch9==4:
g = df.groupby('CR-V')
x = df['MODEL']
y = df['CR-V']
plt.xticks(rotation='vertical')
plt.xlabel('COMPANY')
plt.ylabel('Total Sales')
plt.title('Car Wise Sales Count')
plt.bar(x, y)
plt.grid(True)
plt.show()
if ch9==5:
g = df.groupby('HR-V')
x = df['MODEL']
y = df['HR-V']
plt.xticks(rotation='vertical')
plt.xlabel('COMPANY')
plt.ylabel('Total Sales')
plt.title('Car Wise Sales Count')
plt.bar(x, y)
plt.grid(True)
plt.show()
if ch9==6:
g = df.groupby('CITY')
x = df['MODEL']
y = df['CITY']
plt.xticks(rotation='vertical')
plt.xlabel('COMPANY')
plt.ylabel('Total Sales')
plt.title('Car Wise Sales Count')
plt.bar(x, y)
plt.grid(True)
plt.show()
if ch9==7:
g = df.groupby('CIVIC')
x = df['MODEL']
y = df['CIVIC']
plt.xticks(rotation='vertical')
plt.xlabel('COMPANY')
plt.ylabel('Total Sales')
plt.title('Car Wise Sales Count')
plt.bar(x, y)](https://image.slidesharecdn.com/projectfile-kushshah-210328091452/85/Informatics-Practices-Information-Practices-Project-IP-Project-Class-12-16-320.jpg)
![plt.grid(True)
plt.show()
if ch8==2:
clear()
print('nSELECT CAR')
print('_'*50)
print('1. i10n')
print('2. i20n')
print('3. Cretan')
print('4. Venuen')
print('5. Vernan')
print('6. Santron')
print('7. Elantran')
print('8. Xcentn')
print('9. Sonatan')
print('10. Palisaden')
print('11. Konan')
ch10 = int(input('Enter your choice:'))
if ch10==1:
g = df.groupby('i10')
x = df['MODEL']
y = df['i10']
plt.xticks(rotation='vertical')
plt.xlabel('COMPANY')
plt.ylabel('Total Sales')
plt.title('Company wise sales count')
plt.grid(True)
plt.bar(x, y)
plt.show()
if ch10==2:
g = df.groupby('i20')
x = df['MODEL']
y = df['i20']
plt.xticks(rotation='vertical')
plt.xlabel('COMPANY')
plt.ylabel('Total Sales')
plt.title('Company wise sales count')
plt.grid(True)
plt.bar(x, y)
plt.show()
if ch10==3:
g = df.groupby('CRETA')
x = df['MODEL']
y = df['CRETA']
plt.xticks(rotation='vertical')
plt.xlabel('COMPANY')
plt.ylabel('Total Sales')
plt.title('Company wise sales count')
plt.grid(True)
plt.bar(x, y)
plt.show()
if ch10==4:
g = df.groupby('VENUE')
x = df['MODEL']
y = df['VENUE']
plt.xticks(rotation='vertical')
plt.xlabel('COMPANY')
plt.ylabel('Total Sales')
plt.title('Company wise sales count')
plt.grid(True)
plt.bar(x, y)](https://image.slidesharecdn.com/projectfile-kushshah-210328091452/85/Informatics-Practices-Information-Practices-Project-IP-Project-Class-12-17-320.jpg)
![plt.show()
if ch10==5:
g = df.groupby('VERNA')
x = df['MODEL']
y = df['VERNA']
plt.xticks(rotation='vertical')
plt.xlabel('COMPANY')
plt.ylabel('Total Sales')
plt.title('Company wise sales count')
plt.grid(True)
plt.bar(x, y)
plt.show()
if ch10==6:
g = df.groupby('SANTRO')
x = df['MODEL']
y = df['SANTRO']
plt.xticks(rotation='vertical')
plt.xlabel('COMPANY')
plt.ylabel('Total Sales')
plt.title('Company wise sales count')
plt.grid(True)
plt.bar(x, y)
plt.show()
if ch10==7:
g = df.groupby('ELANTRA')
x = df['MODEL']
y = df['ELANTRA']
plt.xticks(rotation='vertical')
plt.xlabel('COMPANY')
plt.ylabel('Total Sales')
plt.title('Company wise sales count')
plt.grid(True)
plt.bar(x, y)
plt.show()
if ch10==8:
g = df.groupby('XCENT')
x = df['MODEL']
y = df['XCENT']
plt.xticks(rotation='vertical')
plt.xlabel('COMPANY')
plt.ylabel('Total Sales')
plt.title('Company wise sales count')
plt.grid(True)
plt.bar(x, y)
plt.show()
if ch10==9:
g = df.groupby('SONATA')
x = df['MODEL']
y = df['SONATA']
plt.xticks(rotation='vertical')
plt.xlabel('COMPANY')
plt.ylabel('Total Sales')
plt.title('Company wise sales count')
plt.grid(True)
plt.bar(x, y)
plt.show()
if ch10==10:
g = df.groupby('PALISADE')
x = df['MODEL']
y = df['PALISADE']
plt.xticks(rotation='vertical')
plt.xlabel('COMPANY')
plt.ylabel('Total Sales')
plt.title('Company wise sales count')](https://image.slidesharecdn.com/projectfile-kushshah-210328091452/85/Informatics-Practices-Information-Practices-Project-IP-Project-Class-12-18-320.jpg)
![plt.grid(True)
plt.bar(x, y)
plt.show()
if ch10==11:
g = df.groupby('KONA')
x = df['MODEL']
y = df['KONA']
plt.xticks(rotation='vertical')
plt.xlabel('COMPANY')
plt.ylabel('Total Sales')
plt.title('Company wise sales count')
plt.grid(True)
plt.bar(x, y)
plt.show()
if ch8==3:
clear()
print('nSELECT CAR')
print('_'*50)
print('1. Balenon')
print('2. Swiftn')
print('3. DZiren')
print('4. Alton')
print('5. Ciazn')
print('6. Eecon')
print('7. Ignisn')
print('8. Celerio Xn')
print('9 S-Crossn')
print('10. XL6n')
ch11 = int(input('Enter your choice:'))
if ch11==1:
g = df.groupby('BALENO')
x = df['MODEL']
y = df['BALENO']
plt.xticks(rotation='vertical')
plt.xlabel('COMPANY')
plt.ylabel('Total Sales')
plt.title('Company wise sales count')
plt.grid(True)
plt.bar(x, y)
plt.show()
if ch11==2:
g = df.groupby('SWIFT')
x = df['MODEL']
y = df['SWIFT']
plt.xticks(rotation='vertical')
plt.xlabel('COMPANY')
plt.ylabel('Total Sales')
plt.title('Company wise sales count')
plt.grid(True)
plt.bar(x, y)
plt.show()
if ch11==3:
g = df.groupby('DZIRE')
x = df['MODEL']
y = df['DZIRE']
plt.xticks(rotation='vertical')
plt.xlabel('COMPANY')
plt.ylabel('Total Sales')
plt.title('Company wise sales count')
plt.grid(True)
plt.bar(x, y)](https://image.slidesharecdn.com/projectfile-kushshah-210328091452/85/Informatics-Practices-Information-Practices-Project-IP-Project-Class-12-19-320.jpg)
![plt.show()
if ch11==4:
g = df.groupby('ALTO')
x = df['MODEL']
y = df['ALTO']
plt.xticks(rotation='vertical')
plt.xlabel('COMPANY')
plt.ylabel('Total Sales')
plt.title('Company wise sales count')
plt.grid(True)
plt.bar(x, y)
plt.show()
if ch11==5:
g = df.groupby('CIAZ')
x = df['MODEL']
y = df['CIAZ']
plt.xticks(rotation='vertical')
plt.xlabel('COMPANY')
plt.ylabel('Total Sales')
plt.title('Company wise sales count')
plt.grid(True)
plt.bar(x, y)
plt.show()
if ch11==6:
g = df.groupby('EECO')
x = df['MODEL']
y = df['EECO']
plt.xticks(rotation='vertical')
plt.xlabel('COMPANY')
plt.ylabel('Total Sales')
plt.title('Company wise sales count')
plt.grid(True)
plt.bar(x, y)
plt.show()
if ch11==7:
g = df.groupby('IGNIS')
x = df['MODEL']
y = df['IGNIS']
plt.xticks(rotation='vertical')
plt.xlabel('COMPANY')
plt.ylabel('Total Sales')
plt.title('Company wise sales count')
plt.grid(True)
plt.bar(x, y)
plt.show()
if ch11==8:
g = df.groupby('CELERIO X')
x = df['MODEL']
y = df['CELERIO X']
plt.xticks(rotation='vertical')
plt.xlabel('COMPANY')
plt.ylabel('Total Sales')
plt.title('Company wise sales count')
plt.grid(True)
plt.bar(x, y)
plt.show()
if ch11==9:
g = df.groupby('S-CROSS')
x = df['MODEL']
y = df['S-CROSS']
plt.xticks(rotation='vertical')
plt.xlabel('COMPANY')
plt.ylabel('Total Sales')
plt.title('Company wise sales count')](https://image.slidesharecdn.com/projectfile-kushshah-210328091452/85/Informatics-Practices-Information-Practices-Project-IP-Project-Class-12-20-320.jpg)
![plt.grid(True)
plt.bar(x, y)
plt.show()
if ch11==10:
g = df.groupby('XL6')
x = df['MODEL']
y = df['XL6']
plt.xticks(rotation='vertical')
plt.xlabel('COMPANY')
plt.ylabel('Total Sales')
plt.title('Company wise sales count')
plt.grid(True)
plt.bar(x, y)
plt.show()
if ch8==4:
clear()
print('nSELECT CAR')
print('_'*50)
print('1. Tiagon')
print('2. Nexonn')
print('3. Tigorn')
print('4. Harriern')
print('5. Altrozn')
print('6. Nanon')
print('7. Safarin')
print('8. HBXn')
ch12 = int(input('Enter your choice:'))
if ch12==1:
g = df.groupby('TIAGO')
x = df['MODEL']
y = df['TIAGO']
plt.xticks(rotation='vertical')
plt.xlabel('COMPANY')
plt.ylabel('Total Sales')
plt.title('Company wise sales count')
plt.grid(True)
plt.bar(x, y)
plt.show()
if ch12==2:
g = df.groupby('NEXON')
x = df['MODEL']
y = df['NEXON']
plt.xticks(rotation='vertical')
plt.xlabel('COMPANY')
plt.ylabel('Total Sales')
plt.title('Company wise sales count')
plt.grid(True)
plt.bar(x, y)
plt.show()
if ch12==3:
g = df.groupby('TIGOR')
x = df['MODEL']
y = df['TIGOR']
plt.xticks(rotation='vertical')
plt.xlabel('COMPANY')
plt.ylabel('Total Sales')
plt.title('Company wise sales count')
plt.grid(True)
plt.bar(x, y)
plt.show()
if ch12==4:
g = df.groupby('HARRIER')](https://image.slidesharecdn.com/projectfile-kushshah-210328091452/85/Informatics-Practices-Information-Practices-Project-IP-Project-Class-12-21-320.jpg)
![x = df['MODEL']
y = df['HARRIER']
plt.xticks(rotation='vertical')
plt.xlabel('COMPANY')
plt.ylabel('Total Sales')
plt.title('Company wise sales count')
plt.grid(True)
plt.bar(x, y)
plt.show()
if ch12==5:
g = df.groupby('ALTROZ')
x = df['MODEL']
y = df['ALTROZ']
plt.xticks(rotation='vertical')
plt.xlabel('COMPANY')
plt.ylabel('Total Sales')
plt.title('Company wise sales count')
plt.grid(True)
plt.bar(x, y)
plt.show()
if ch12==6:
g = df.groupby('NANO')
x = df['MODEL']
y = df['NANO']
plt.xticks(rotation='vertical')
plt.xlabel('COMPANY')
plt.ylabel('Total Sales')
plt.title('Company wise sales count')
plt.grid(True)
plt.bar(x, y)
plt.show()
if ch12==7:
g = df.groupby('SAFARI')
x = df['MODEL']
y = df['SAFARI']
plt.xticks(rotation='vertical')
plt.xlabel('COMPANY')
plt.ylabel('Total Sales')
plt.title('Company wise sales count')
plt.grid(True)
plt.bar(x, y)
plt.show()
if ch12==8:
g = df.groupby('HBX')
x = df['MODEL']
y = df['HBX']
plt.xticks(rotation='vertical')
plt.xlabel('COMPANY')
plt.ylabel('Total Sales')
plt.title('Company wise sales count')
plt.grid(True)
plt.bar(x, y)
plt.show()
if ch8==5:
clear()
print('nSELECT CAR')
print('_'*50)
print('1. Sunnyn')
print('2. Magniten')
print('3. Kicksn')
print('4. GT-Rn')
print('5. Terran')](https://image.slidesharecdn.com/projectfile-kushshah-210328091452/85/Informatics-Practices-Information-Practices-Project-IP-Project-Class-12-22-320.jpg)
![ch13 = int(input('Enter your choice:'))
if ch13==1:
g = df.groupby('SUNNY')
x = df['MODEL']
y = df['SUNNY']
plt.xticks(rotation='vertical')
plt.xlabel('COMPANY')
plt.ylabel('Total Sales')
plt.title('Company wise sales count')
plt.grid(True)
plt.bar(x, y)
plt.show()
if ch13==2:
g = df.groupby('MAGNITE')
x = df['MODEL']
y = df['MAGNITE']
plt.xticks(rotation='vertical')
plt.xlabel('COMPANY')
plt.ylabel('Total Sales')
plt.title('Company wise sales count')
plt.grid(True)
plt.bar(x, y)
plt.show()
if ch13==3:
g = df.groupby('KICKS')
x = df['MODEL']
y = df['KICKS']
plt.xticks(rotation='vertical')
plt.xlabel('COMPANY')
plt.ylabel('Total Sales')
plt.title('Company wise sales count')
plt.grid(True)
plt.bar(x, y)
plt.show()
if ch13==4:
g = df.groupby('GT-R')
x = df['MODEL']
y = df['GT-R']
plt.xticks(rotation='vertical')
plt.xlabel('COMPANY')
plt.ylabel('Total Sales')
plt.title('Company wise sales count')
plt.grid(True)
plt.bar(x, y)
plt.show()
if ch13==5:
g = df.groupby('TERRA')
x = df['MODEL']
y = df['TERRA']
plt.xticks(rotation='vertical')
plt.xlabel('COMPANY')
plt.ylabel('Total Sales')
plt.title('Company wise sales count')
plt.grid(True)
plt.bar(x, y)
plt.show()
if ch8==6:
clear()
print('nSELECT CAR')
print('_'*50)
print('1. A4n')
print('2. A6n')
print('3. A8n')](https://image.slidesharecdn.com/projectfile-kushshah-210328091452/85/Informatics-Practices-Information-Practices-Project-IP-Project-Class-12-23-320.jpg)
![print('4. Q2n')
print('5. Q8n')
print('6. RS7n')
ch14 = int(input('Enter your choice:'))
if ch14==1:
g = df.groupby('A4')
x = df['MODEL']
y = df['A4']
plt.xticks(rotation='vertical')
plt.xlabel('COMPANY')
plt.ylabel('Total Sales')
plt.title('Company wise sales count')
plt.grid(True)
plt.bar(x, y)
plt.show()
if ch14==2:
g = df.groupby('A6')
x = df['MODEL']
y = df['A8']
plt.xticks(rotation='vertical')
plt.xlabel('COMPANY')
plt.ylabel('Total Sales')
plt.title('Company wise sales count')
plt.grid(True)
plt.bar(x, y)
plt.show()
if ch14==3:
g = df.groupby('A8')
x = df['MODEL']
y = df['A8']
plt.xticks(rotation='vertical')
plt.xlabel('COMPANY')
plt.ylabel('Total Sales')
plt.title('Company wise sales count')
plt.grid(True)
plt.bar(x, y)
plt.show()
if ch14==4:
g = df.groupby('Q2')
x = df['MODEL']
y = df['Q2']
plt.xticks(rotation='vertical')
plt.xlabel('COMPANY')
plt.ylabel('Total Sales')
plt.title('Company wise sales count')
plt.grid(True)
plt.bar(x, y)
plt.show()
if ch14==5:
g = df.groupby('Q8')
x = df['MODEL']
y = df['Q8']
plt.xticks(rotation='vertical')
plt.xlabel('COMPANY')
plt.ylabel('Total Sales')
plt.title('Company wise sales count')
plt.grid(True)
plt.bar(x, y)
plt.show()
if ch14==6:
g = df.groupby('RS7')
x = df['MODEL']](https://image.slidesharecdn.com/projectfile-kushshah-210328091452/85/Informatics-Practices-Information-Practices-Project-IP-Project-Class-12-24-320.jpg)
![y = df['RS7']
plt.xticks(rotation='vertical')
plt.xlabel('COMPANY')
plt.ylabel('Total Sales')
plt.title('Company wise sales count')
plt.grid(True)
plt.bar(x, y)
plt.show()
if ch == 3:
main_menu()
wait = input()
def main_menu():
clear()
introduction()
while True:
clear()
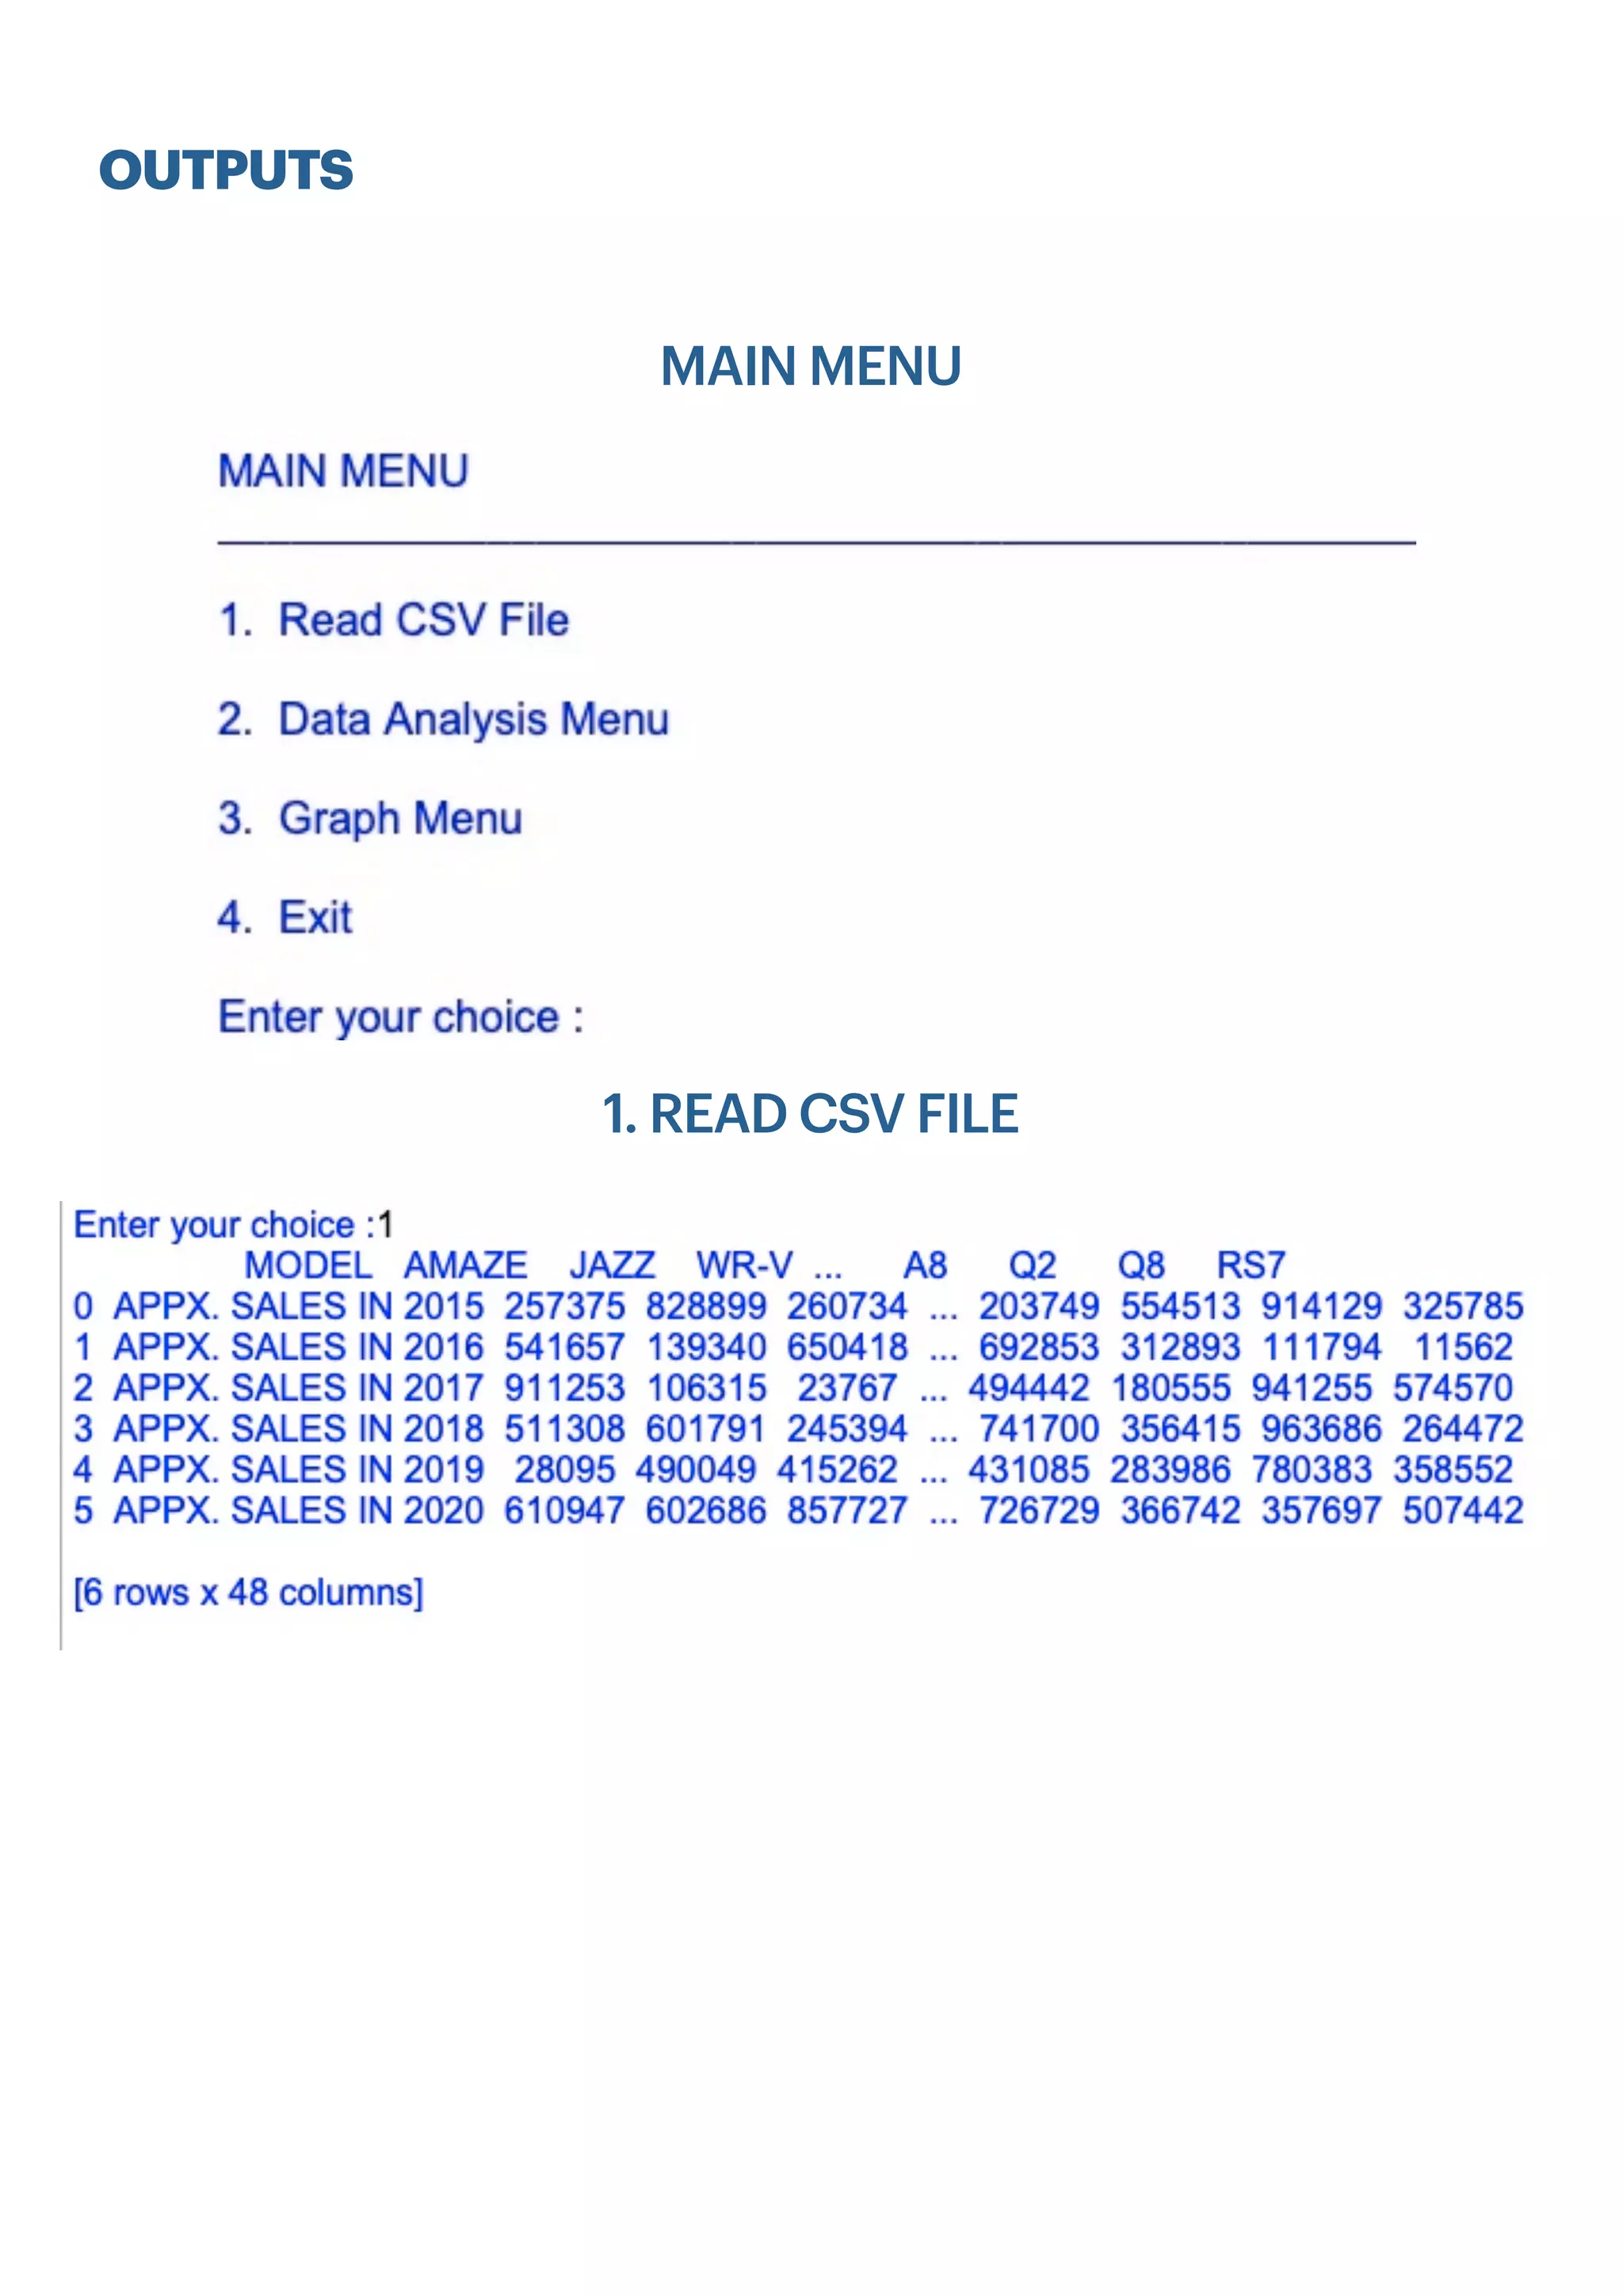
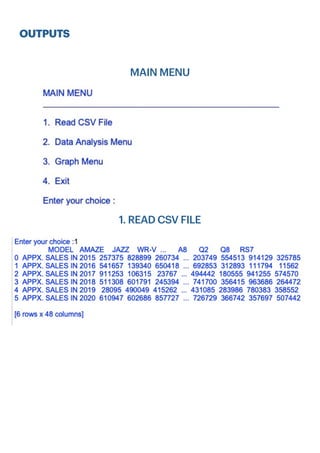
print('MAIN MENU ')
print('_'*50)
print()
print('1. Read CSV Filen')
print('2. Data Analysis Menun')
print('3. Graph Menun')
print('4. Exitn')
choice = int(input('Enter your choice :'))
if choice == 1:
df = pd.read_csv("/Users/admin/Desktop/Kush/Study/IP/PROJECT/CAR.csv")
print (df)
wait = input()
if choice == 2:
data_analysis_menu()
wait = input()
if choice == 3:
graph()
wait = input()
if choice == 4:
print ("Project Made by- Kush Shah")
break
clear()
# call your main menu
main_menu()](https://image.slidesharecdn.com/projectfile-kushshah-210328091452/85/Informatics-Practices-Information-Practices-Project-IP-Project-Class-12-25-320.jpg)


![##Project Name: Car Model Sales Analysis
##Made By: Kush Shah, 12 Agni/ ZSE-G
import pandas as pd
import numpy as np
import time
import matplotlib.pyplot as plt
df = pd.DataFrame()
def introduction():
def read_csv_file():
df = pd.read_csv("/Users/admin/Desktop/Kush/Study/IP/PROJECT/CAR.csv")
print(df)
##Name of function: clear()
##Purpose: Clear Output Screen
def clear():
for x in range(3):
print()
def data_analysis_menu():
df = pd.read_csv("/Users/admin/Desktop/Kush/Study/IP/PROJECT/CAR.csv")
while True:
clear()
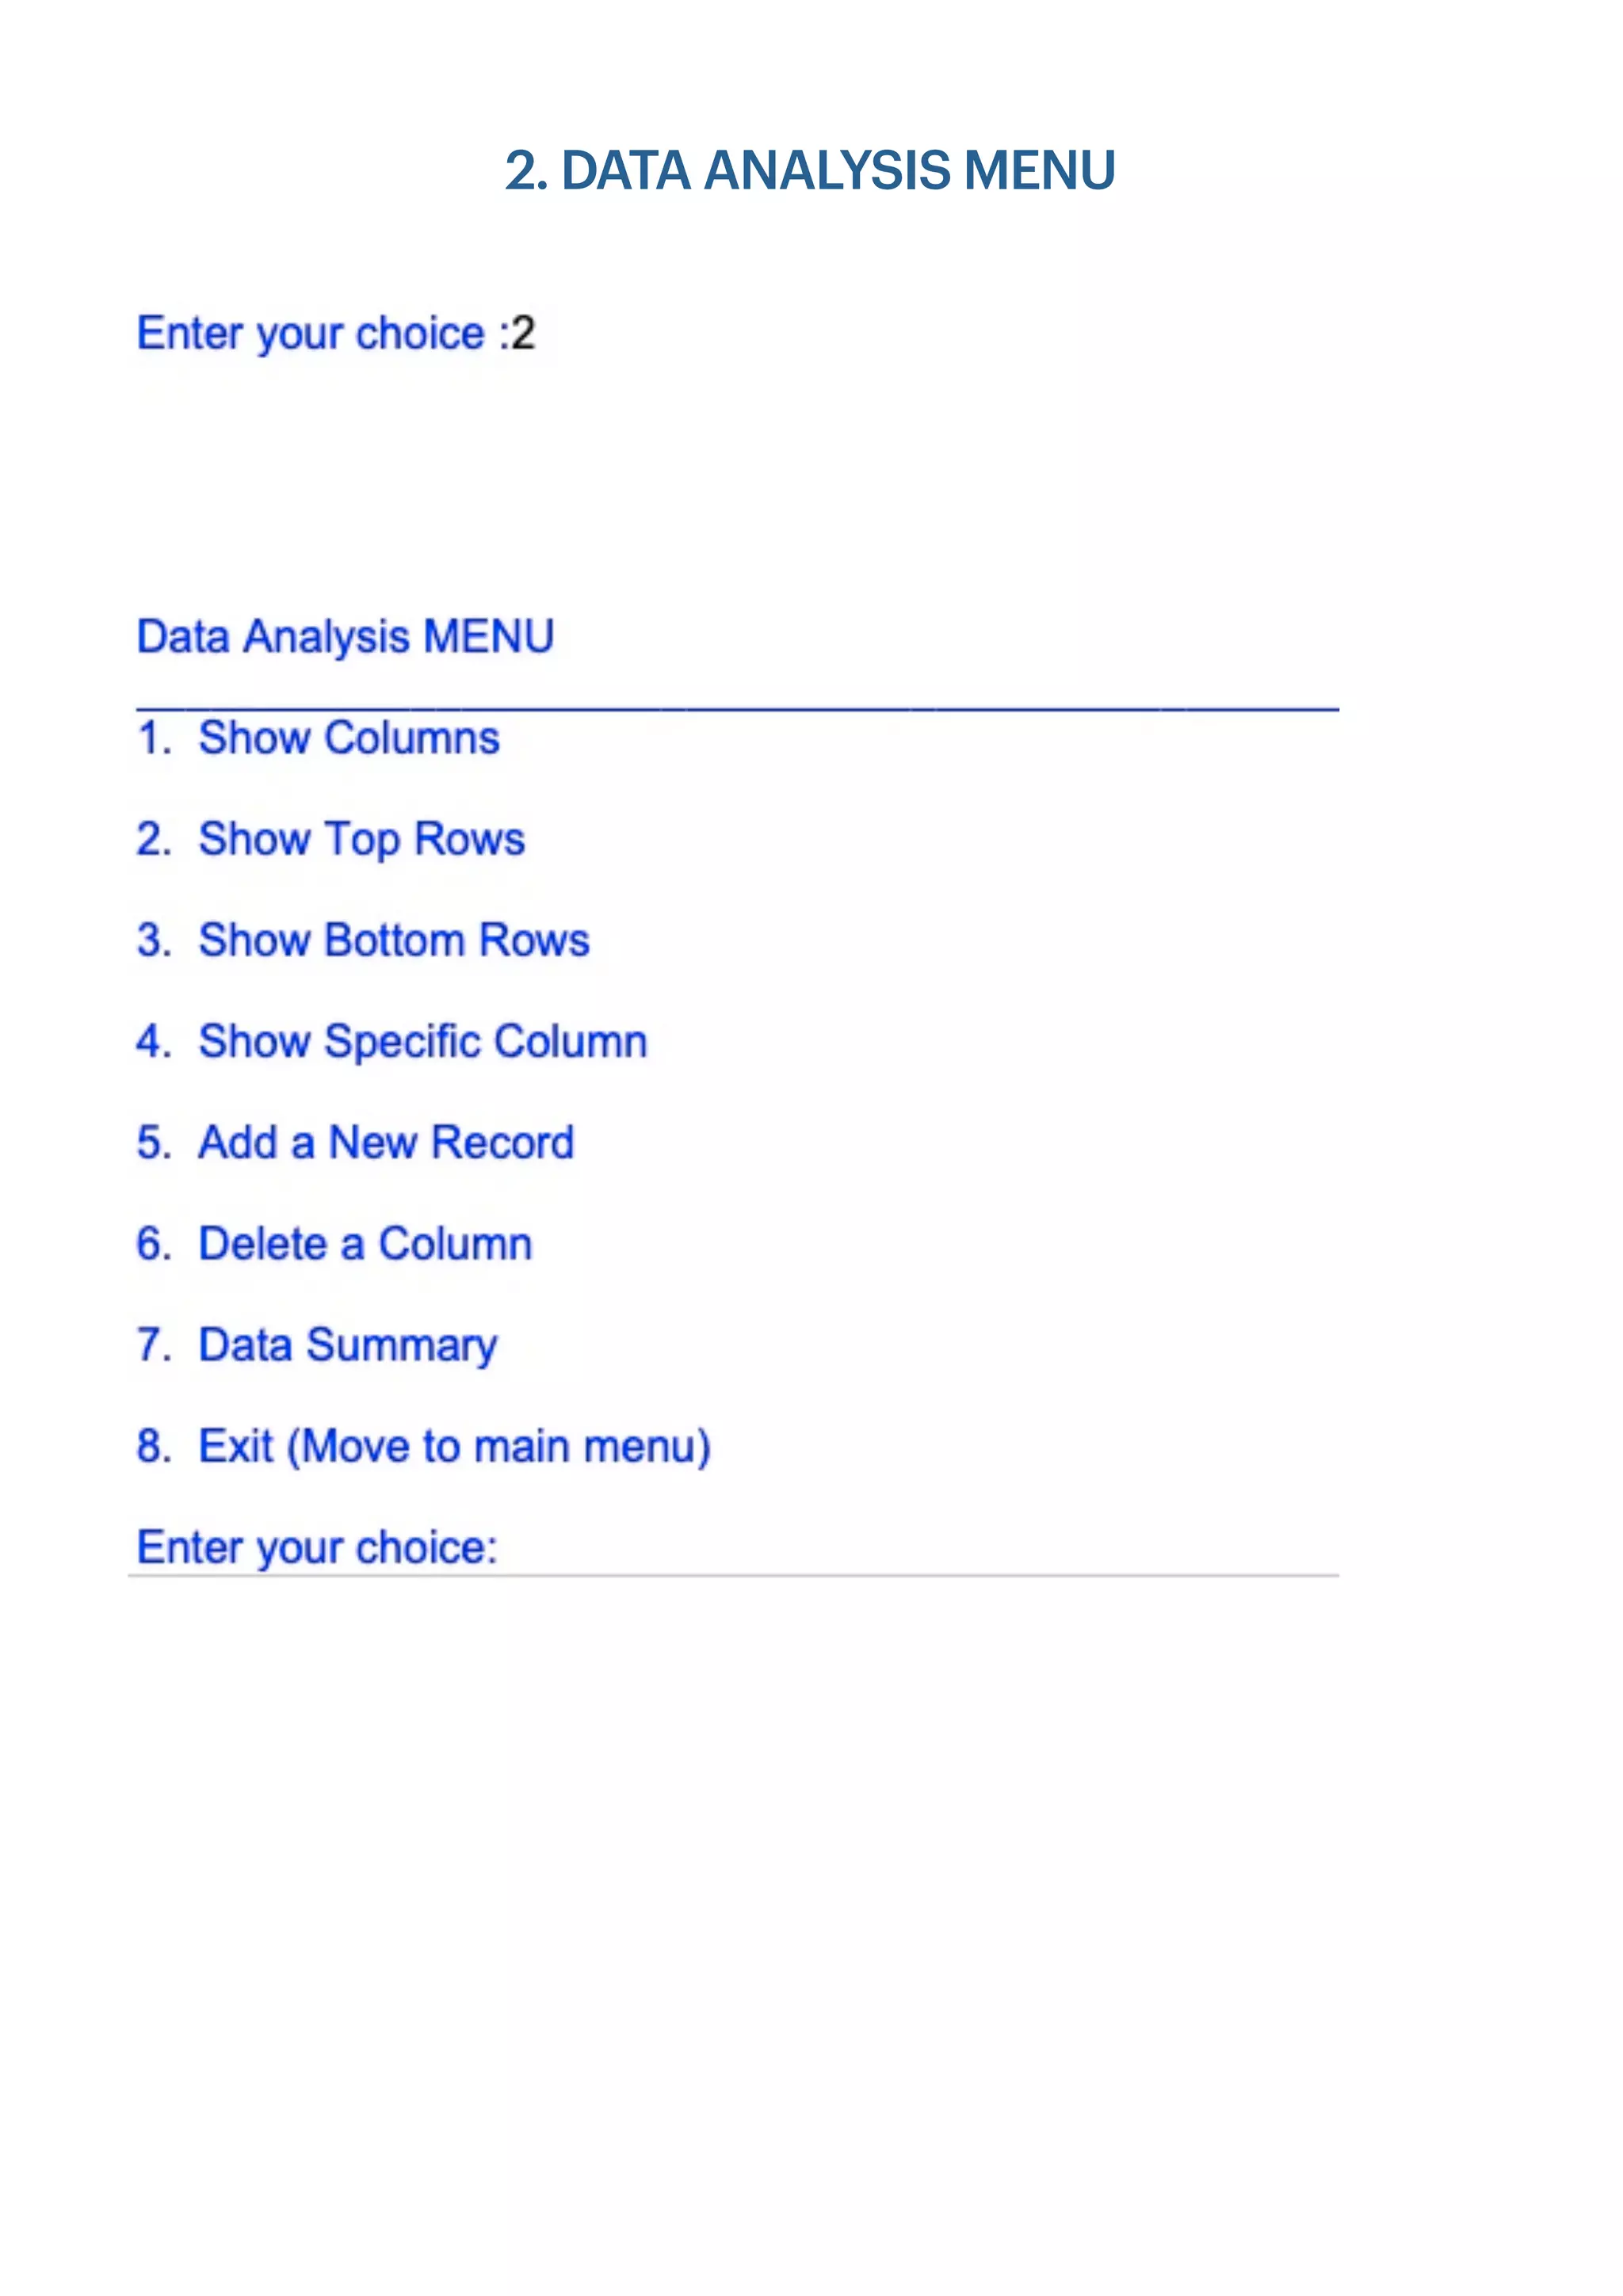
print('nnData Analysis MENU ')
print('_'*50)
print('1. Show Columnsn')
print('2. Show Top Rowsn')
print('3. Show Bottom Rowsn')
print('4. Show Specific Columnn')
print('5. Add a New Recordn')
print('6. Delete a Columnn')
print('7. Data Summaryn')
print('8. Exit (Move to main menu)n')
ch = int(input('Enter your choice:'))
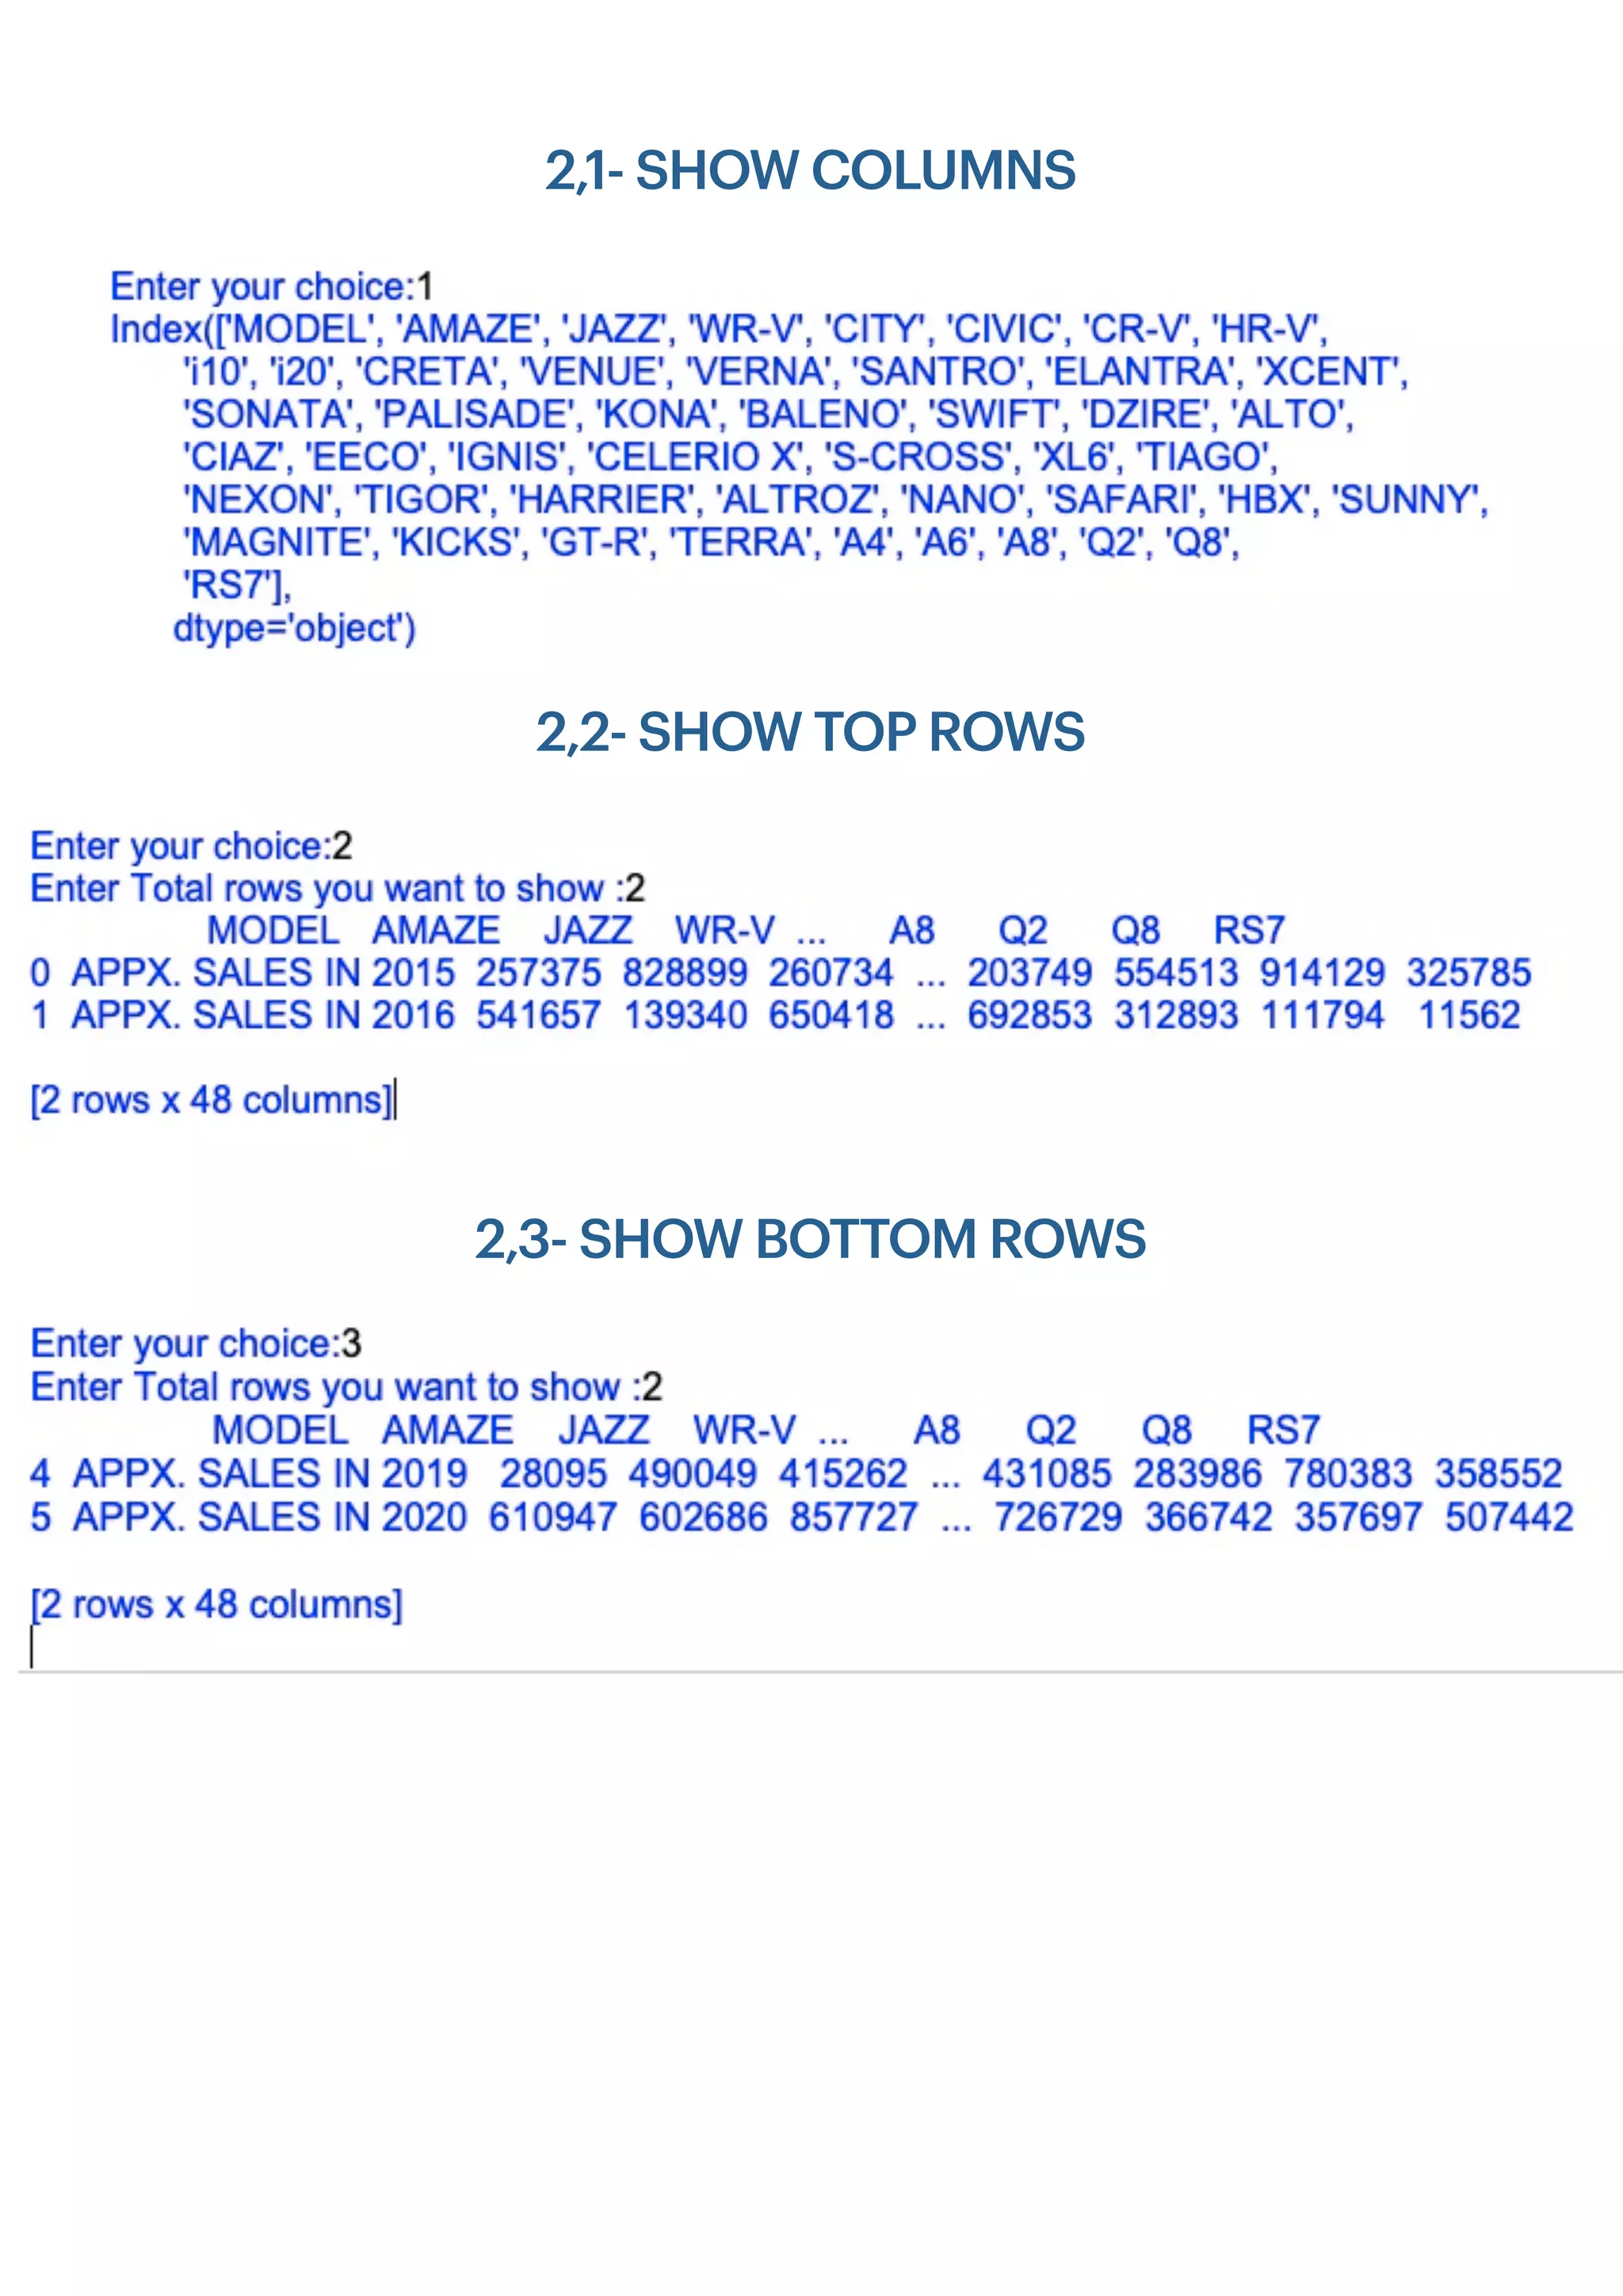
if ch == 1:
print (df.columns)
wait = input()
if ch == 2:
n = int(input('Enter Total rows you want to show :'))
print(df.head(n))
wait = input()
if ch == 3:
n = int(input('Enter Total rows you want to show :'))
print(df.tail(n))
wait = input()
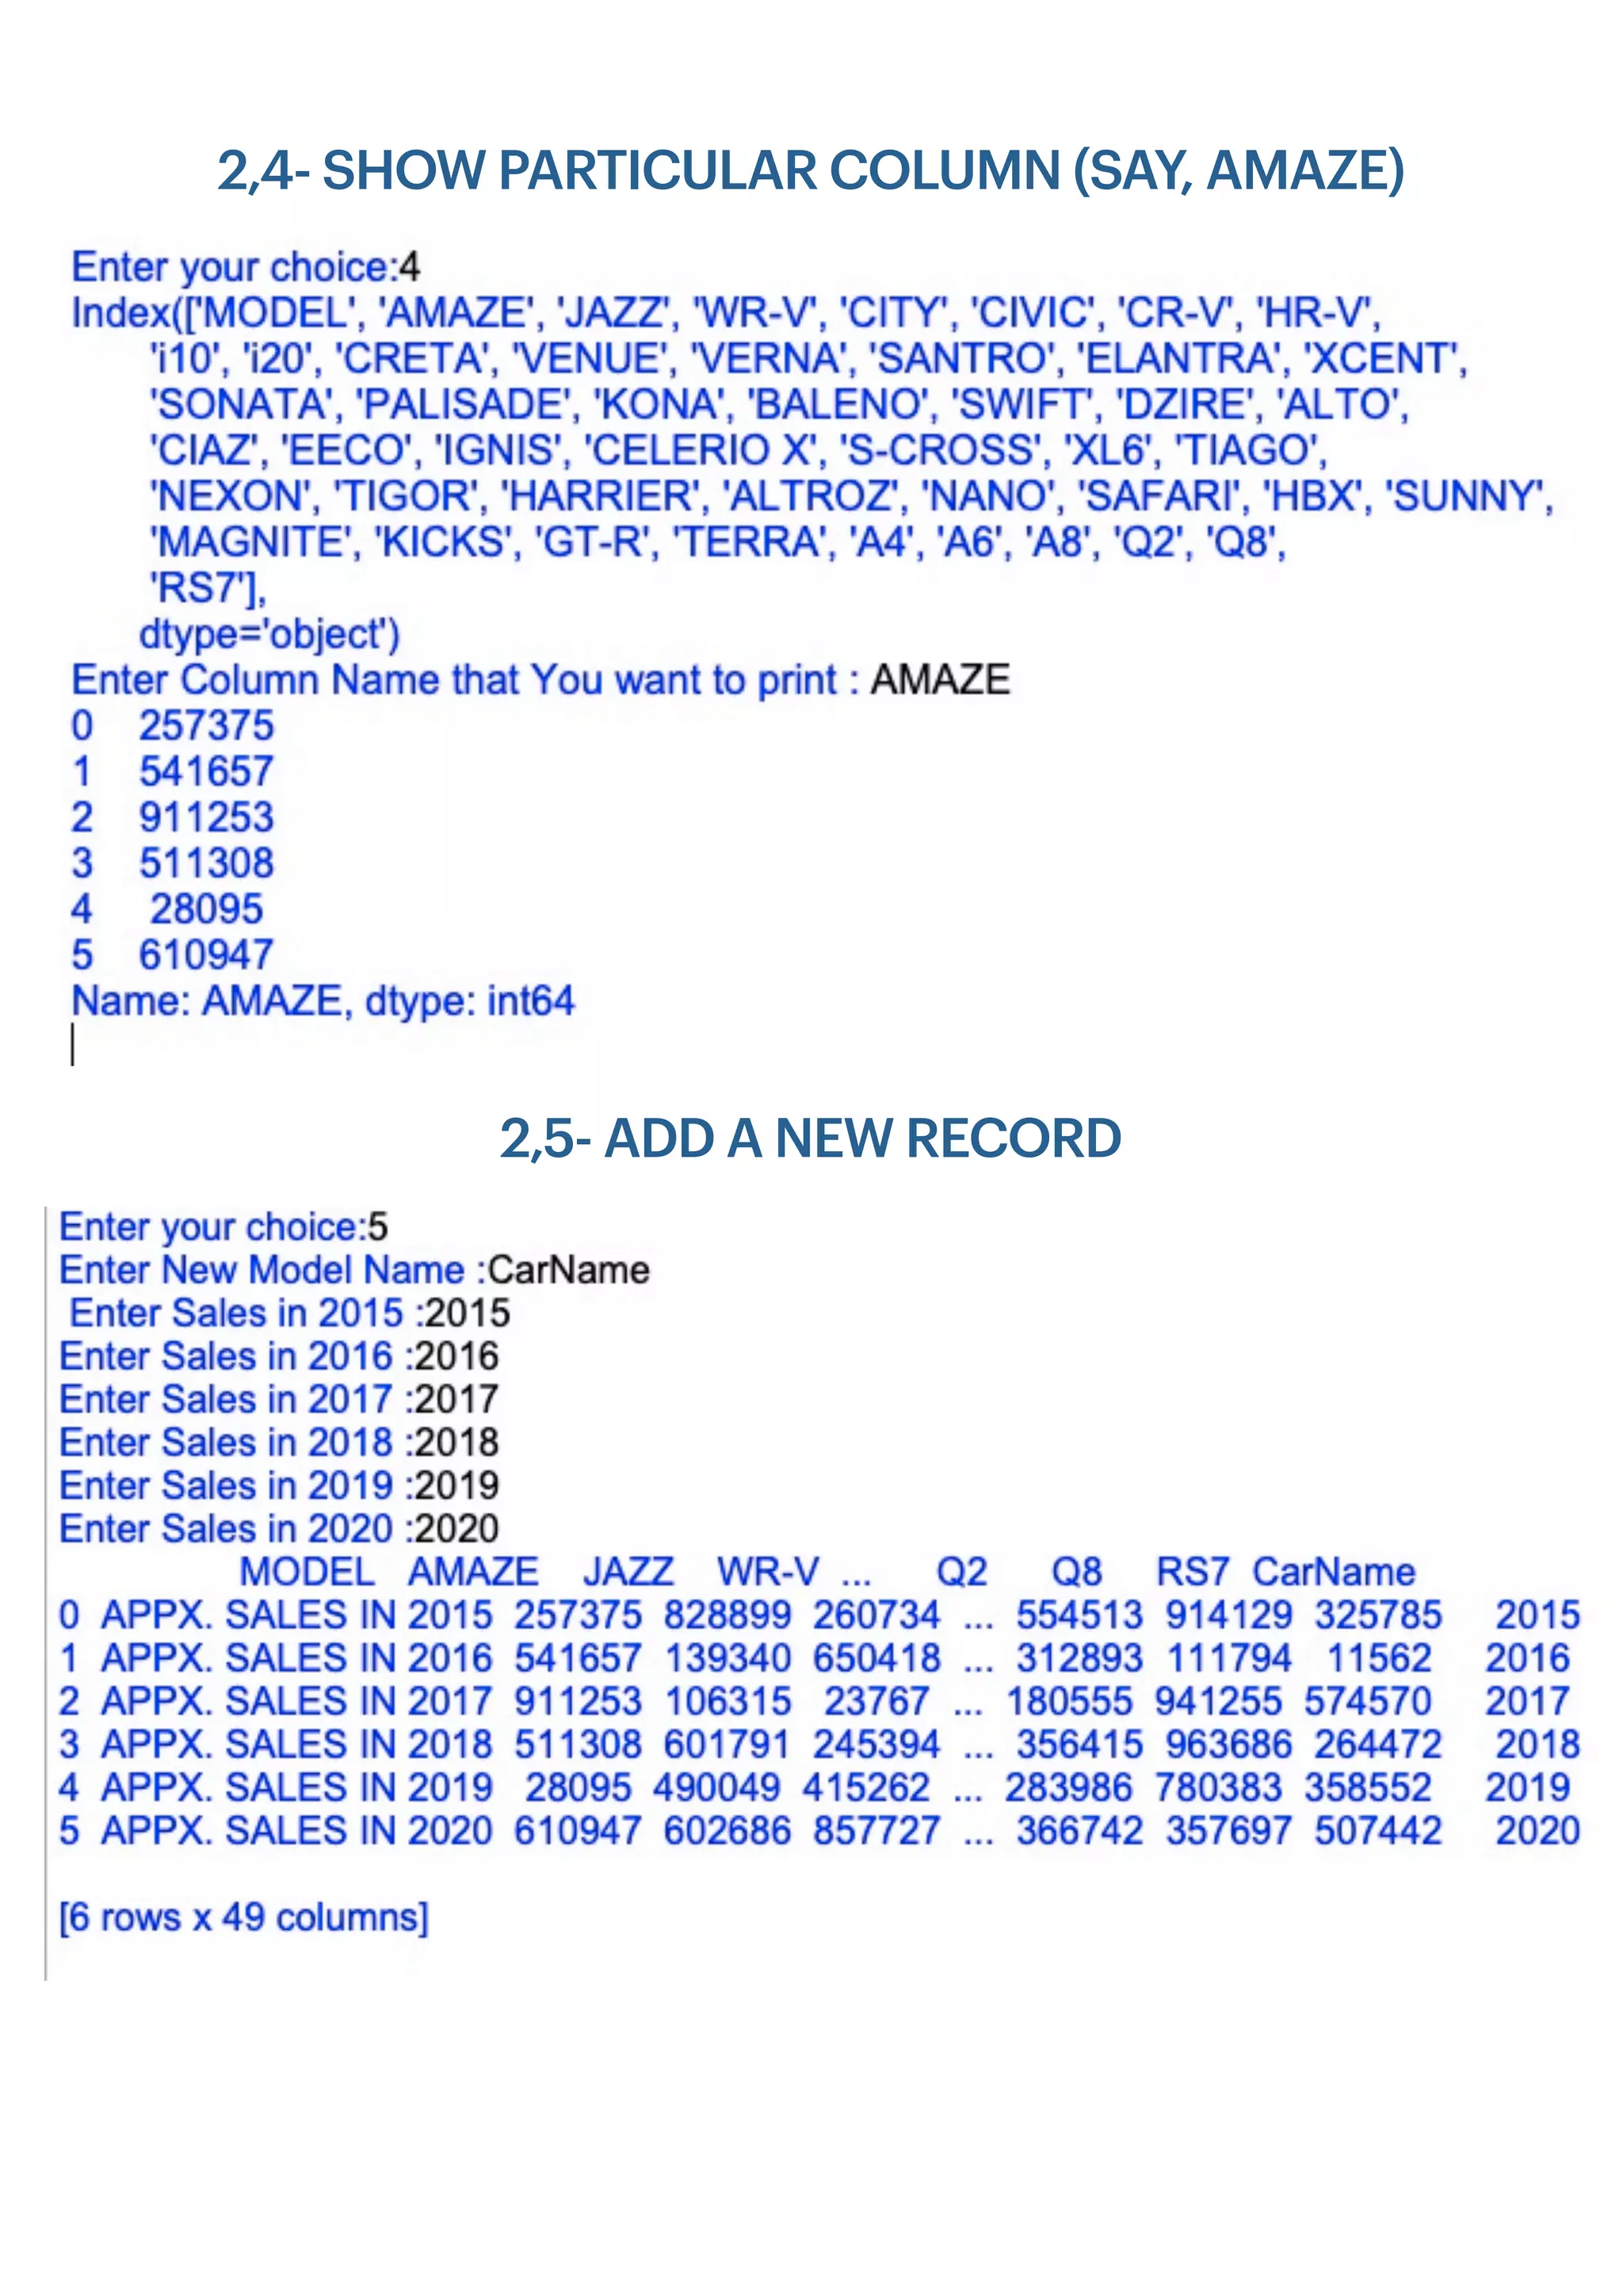
if ch == 4:
print(df.columns)
col_name = input('Enter Column Name that You want to print : ')
print(df[col_name])
wait = input()
if ch==5:
a = input('Enter New Model Name :')
b = input(' Enter Sales in 2015 :')
c= int(input('Enter Sales in 2016 :'))
d = int(input('Enter Sales in 2017 :'))
e = int(input('Enter Sales in 2018 :'))
f = int(input('Enter Sales in 2019 :'))](https://image.slidesharecdn.com/projectfile-kushshah-210328091452/75/Informatics-Practices-Information-Practices-Project-IP-Project-Class-12-4-2048.jpg)
![g= int(input('Enter Sales in 2020 :'))
new_data= pd.Series([b,c,d,e,f,g])
df= pd.read_csv("/Users/admin/Desktop/Kush/Study/IP/PROJECT/CAR.csv", index_col=None)
z=len(df.axes[1])
df.insert(z, a, new_data)
df.to_csv("/Users/admin/Desktop/Kush/Study/IP/PROJECT/CAR.csv", index=False)
print(df)
wait=input()
if ch==6:
col_name =input('Enter column Name to delete :')
del df[col_name]
df.to_csv("/Users/admin/Desktop/Kush/Study/IP/PROJECT/CAR.csv", index= False)
print(df)
print('nnn Press any key to continue....')
wait=input()
if ch==7:
print(df.describe())
print("nnnPress any key to continue....")
wait=input()
if ch ==8:
main_menu()
break
# name of function : graph
# purpose : To generate a Graph menu
def graph():
df = pd.read_csv("/Users/admin/Desktop/Kush/Study/IP/PROJECT/CAR.csv")
while True:
clear()
print('nGRAPH MENU ')
print('_'*50)
print('1. Car Wise Line Graphn')
print('2. Car Wise Bar Graphn')
print('3. Exit (Move to main menu)n')
ch = int(input('Enter your choice:'))
if ch == 1:
clear()
print('nSELECT MANUFACTURER')
print('_'*50)
print('1. Hondan')
print('2. Hyundain')
print('3. Maruti Suzukin')
print('4. Tatan')
print('5. Nissann')
print('6. Audin')
ch1 = int(input('Enter your choice:'))
if ch1 == 1:
clear()
print('nSELECT CAR')
print('_'*50)
print('1. Amazen')
print('2. Jazzn')
print('3. WR-Vn')
print('4. CR-Vn')](https://image.slidesharecdn.com/projectfile-kushshah-210328091452/75/Informatics-Practices-Information-Practices-Project-IP-Project-Class-12-5-2048.jpg)
![print('5. HR-Vn')
print('6. Cityn')
print('7. Civicn')
ch2 = int(input('Enter your choice:'))
if ch2==1:
g = df.groupby('AMAZE')
x = df['MODEL']
y = df['AMAZE']
plt.xticks(rotation='vertical')
plt.xlabel('COMPANY')
plt.ylabel('Total Sales')
plt.title('Company wise sales count')
plt.grid(True)
plt.plot(x, y)
plt.show()
if ch2==2:
g = df.groupby('JAZZ')
x = df['MODEL']
y = df['JAZZ']
plt.xticks(rotation='vertical')
plt.xlabel('COMPANY')
plt.ylabel('Total Sales')
plt.title('Company wise sales count')
plt.grid(True)
plt.plot(x, y)
plt.show()
if ch2==3:
g = df.groupby('WR-V')
x = df['MODEL']
y = df['WR-V']
plt.xticks(rotation='vertical')
plt.xlabel('COMPANY')
plt.ylabel('Total Sales')
plt.title('Company wise sales count')
plt.grid(True)
plt.plot(x, y)
plt.show()
if ch2==4:
g = df.groupby('CR-V')
x = df['MODEL']
y = df['CR-V']
plt.xticks(rotation='vertical')
plt.xlabel('COMPANY')
plt.ylabel('Total Sales')
plt.title('Company wise sales count')
plt.grid(True)
plt.plot(x, y)
plt.show()
if ch2==5:
g = df.groupby('HR-V')
x = df['MODEL']
y = df['HR-V']
plt.xticks(rotation='vertical')
plt.xlabel('COMPANY')
plt.ylabel('Total Sales')
plt.title('Company wise sales count')
plt.grid(True)
plt.plot(x, y)
plt.show()
if ch2==6:
g = df.groupby('CITY')
x = df['MODEL']](https://image.slidesharecdn.com/projectfile-kushshah-210328091452/75/Informatics-Practices-Information-Practices-Project-IP-Project-Class-12-6-2048.jpg)
![y = df['CITY']
plt.xticks(rotation='vertical')
plt.xlabel('COMPANY')
plt.ylabel('Total Sales')
plt.title('Company wise sales count')
plt.grid(True)
plt.plot(x, y)
plt.show()
if ch2==7:
g = df.groupby('CIVIC')
x = df['MODEL']
y = df['CIVIC']
plt.xticks(rotation='vertical')
plt.xlabel('COMPANY')
plt.ylabel('Total Sales')
plt.title('Company wise sales count')
plt.grid(True)
plt.plot(x, y)
plt.show()
if ch1==2:
clear()
print('nSELECT CAR')
print('_'*50)
print('1. i10n')
print('2. i20n')
print('3. Cretan')
print('4. Venuen')
print('5. Vernan')
print('6. Santron')
print('7. Elantran')
print('8. Xcentn')
print('9. Sonatan')
print('10. Palisaden')
print('11. Konan')
ch3 = int(input('Enter your choice:'))
if ch3==1:
g = df.groupby('i10')
x = df['MODEL']
y = df['i10']
plt.xticks(rotation='vertical')
plt.xlabel('COMPANY')
plt.ylabel('Total Sales')
plt.title('Company wise sales count')
plt.grid(True)
plt.plot(x, y)
plt.show()
if ch3==2:
g = df.groupby('i20')
x = df['MODEL']
y = df['i20']
plt.xticks(rotation='vertical')
plt.xlabel('COMPANY')
plt.ylabel('Total Sales')
plt.title('Company wise sales count')
plt.grid(True)
plt.plot(x, y)
plt.show()
if ch3==3:
g = df.groupby('CRETA')
x = df['MODEL']
y = df['CRETA']](https://image.slidesharecdn.com/projectfile-kushshah-210328091452/75/Informatics-Practices-Information-Practices-Project-IP-Project-Class-12-7-2048.jpg)
![plt.xticks(rotation='vertical')
plt.xlabel('COMPANY')
plt.ylabel('Total Sales')
plt.title('Company wise sales count')
plt.grid(True)
plt.plot(x, y)
plt.show()
if ch3==4:
g = df.groupby('VENUE')
x = df['MODEL']
y = df['VENUE']
plt.xticks(rotation='vertical')
plt.xlabel('COMPANY')
plt.ylabel('Total Sales')
plt.title('Company wise sales count')
plt.grid(True)
plt.plot(x, y)
plt.show()
if ch3==5:
g = df.groupby('VERNA')
x = df['MODEL']
y = df['VERNA']
plt.xticks(rotation='vertical')
plt.xlabel('COMPANY')
plt.ylabel('Total Sales')
plt.title('Company wise sales count')
plt.grid(True)
plt.plot(x, y)
plt.show()
if ch3==6:
g = df.groupby('SANTRO')
x = df['MODEL']
y = df['SANTRO']
plt.xticks(rotation='vertical')
plt.xlabel('COMPANY')
plt.ylabel('Total Sales')
plt.title('Company wise sales count')
plt.grid(True)
plt.plot(x, y)
plt.show()
if ch3==7:
g = df.groupby('ELANTRA')
x = df['MODEL']
y = df['ELANTRA']
plt.xticks(rotation='vertical')
plt.xlabel('COMPANY')
plt.ylabel('Total Sales')
plt.title('Company wise sales count')
plt.grid(True)
plt.plot(x, y)
plt.show()
if ch3==8:
g = df.groupby('XCENT')
x = df['MODEL']
y = df['XCENT']
plt.xticks(rotation='vertical')
plt.xlabel('COMPANY')
plt.ylabel('Total Sales')
plt.title('Company wise sales count')
plt.grid(True)
plt.plot(x, y)
plt.show()
if ch3==9:
g = df.groupby('SONATA')](https://image.slidesharecdn.com/projectfile-kushshah-210328091452/75/Informatics-Practices-Information-Practices-Project-IP-Project-Class-12-8-2048.jpg)
![x = df['MODEL']
y = df['SONATA']
plt.xticks(rotation='vertical')
plt.xlabel('COMPANY')
plt.ylabel('Total Sales')
plt.title('Company wise sales count')
plt.grid(True)
plt.plot(x, y)
plt.show()
if ch3==10:
g = df.groupby('PALISADE')
x = df['MODEL']
y = df['PALISADE']
plt.xticks(rotation='vertical')
plt.xlabel('COMPANY')
plt.ylabel('Total Sales')
plt.title('Company wise sales count')
plt.grid(True)
plt.plot(x, y)
plt.show()
if ch3==11:
g = df.groupby('KONA')
x = df['MODEL']
y = df['KONA']
plt.xticks(rotation='vertical')
plt.xlabel('COMPANY')
plt.ylabel('Total Sales')
plt.title('Company wise sales count')
plt.grid(True)
plt.plot(x, y)
plt.show()
if ch1==3:
clear()
print('nSELECT CAR')
print('_'*50)
print('1. Balenon')
print('2. Swiftn')
print('3. DZiren')
print('4. Alton')
print('5. Ciazn')
print('6. Eecon')
print('7. Ignisn')
print('8. Celerio Xn')
print('9 S-Crossn')
print('10. XL6n')
ch4 = int(input('Enter your choice:'))
if ch4==1:
g = df.groupby('BALENO')
x = df['MODEL']
y = df['BALENO']
plt.xticks(rotation='vertical')
plt.xlabel('COMPANY')
plt.ylabel('Total Sales')
plt.title('Company wise sales count')
plt.grid(True)
plt.plot(x, y)
plt.show()
if ch4==2:
g = df.groupby('SWIFT')
x = df['MODEL']
y = df['SWIFT']
plt.xticks(rotation='vertical')](https://image.slidesharecdn.com/projectfile-kushshah-210328091452/75/Informatics-Practices-Information-Practices-Project-IP-Project-Class-12-9-2048.jpg)
![plt.xlabel('COMPANY')
plt.ylabel('Total Sales')
plt.title('Company wise sales count')
plt.grid(True)
plt.plot(x, y)
plt.show()
if ch4==3:
g = df.groupby('DZIRE')
x = df['MODEL']
y = df['DZIRE']
plt.xticks(rotation='vertical')
plt.xlabel('COMPANY')
plt.ylabel('Total Sales')
plt.title('Company wise sales count')
plt.grid(True)
plt.plot(x, y)
plt.show()
if ch4==4:
g = df.groupby('ALTO')
x = df['MODEL']
y = df['ALTO']
plt.xticks(rotation='vertical')
plt.xlabel('COMPANY')
plt.ylabel('Total Sales')
plt.title('Company wise sales count')
plt.grid(True)
plt.plot(x, y)
plt.show()
if ch4==5:
g = df.groupby('CIAZ')
x = df['MODEL']
y = df['CIAZ']
plt.xticks(rotation='vertical')
plt.xlabel('COMPANY')
plt.ylabel('Total Sales')
plt.title('Company wise sales count')
plt.grid(True)
plt.plot(x, y)
plt.show()
if ch4==6:
g = df.groupby('EECO')
x = df['MODEL']
y = df['EECO']
plt.xticks(rotation='vertical')
plt.xlabel('COMPANY')
plt.ylabel('Total Sales')
plt.title('Company wise sales count')
plt.grid(True)
plt.plot(x, y)
plt.show()
if ch4==7:
g = df.groupby('IGNIS')
x = df['MODEL']
y = df['IGNIS']
plt.xticks(rotation='vertical')
plt.xlabel('COMPANY')
plt.ylabel('Total Sales')
plt.title('Company wise sales count')
plt.grid(True)
plt.plot(x, y)
plt.show()
if ch4==8:
g = df.groupby('CELERIO X')
x = df['MODEL']](https://image.slidesharecdn.com/projectfile-kushshah-210328091452/75/Informatics-Practices-Information-Practices-Project-IP-Project-Class-12-10-2048.jpg)
![y = df['CELERIO X']
plt.xticks(rotation='vertical')
plt.xlabel('COMPANY')
plt.ylabel('Total Sales')
plt.title('Company wise sales count')
plt.grid(True)
plt.plot(x, y)
plt.show()
if ch4==9:
g = df.groupby('S-CROSS')
x = df['MODEL']
y = df['S-CROSS']
plt.xticks(rotation='vertical')
plt.xlabel('COMPANY')
plt.ylabel('Total Sales')
plt.title('Company wise sales count')
plt.grid(True)
plt.plot(x, y)
plt.show()
if ch4==10:
g = df.groupby('XL6')
x = df['MODEL']
y = df['XL6']
plt.xticks(rotation='vertical')
plt.xlabel('COMPANY')
plt.ylabel('Total Sales')
plt.title('Company wise sales count')
plt.grid(True)
plt.plot(x, y)
plt.show()
if ch1==4:
clear()
print('nSELECT CAR')
print('_'*50)
print('1. Tiagon')
print('2. Nexonn')
print('3. Tigorn')
print('4. Harriern')
print('5. Altrozn')
print('6. Nanon')
print('7. Safarin')
print('8. HBXn')
ch5 = int(input('Enter your choice:'))
if ch5==1:
g = df.groupby('TIAGO')
x = df['MODEL']
y = df['TIAGO']
plt.xticks(rotation='vertical')
plt.xlabel('COMPANY')
plt.ylabel('Total Sales')
plt.title('Company wise sales count')
plt.grid(True)
plt.plot(x, y)
plt.show()
if ch5==2:
g = df.groupby('NEXON')
x = df['MODEL']
y = df['NEXON']
plt.xticks(rotation='vertical')
plt.xlabel('COMPANY')
plt.ylabel('Total Sales')
plt.title('Company wise sales count')](https://image.slidesharecdn.com/projectfile-kushshah-210328091452/75/Informatics-Practices-Information-Practices-Project-IP-Project-Class-12-11-2048.jpg)
![plt.grid(True)
plt.plot(x, y)
plt.show()
if ch5==3:
g = df.groupby('TIGOR')
x = df['MODEL']
y = df['TIGOR']
plt.xticks(rotation='vertical')
plt.xlabel('COMPANY')
plt.ylabel('Total Sales')
plt.title('Company wise sales count')
plt.grid(True)
plt.plot(x, y)
plt.show()
if ch5==4:
g = df.groupby('HARRIER')
x = df['MODEL']
y = df['HARRIER']
plt.xticks(rotation='vertical')
plt.xlabel('COMPANY')
plt.ylabel('Total Sales')
plt.title('Company wise sales count')
plt.grid(True)
plt.plot(x, y)
plt.show()
if ch5==5:
g = df.groupby('ALTROZ')
x = df['MODEL']
y = df['ALTROZ']
plt.xticks(rotation='vertical')
plt.xlabel('COMPANY')
plt.ylabel('Total Sales')
plt.title('Company wise sales count')
plt.grid(True)
plt.plot(x, y)
plt.show()
if ch5==6:
g = df.groupby('NANO')
x = df['MODEL']
y = df['NANO']
plt.xticks(rotation='vertical')
plt.xlabel('COMPANY')
plt.ylabel('Total Sales')
plt.title('Company wise sales count')
plt.grid(True)
plt.plot(x, y)
plt.show()
if ch5==7:
g = df.groupby('SAFARI')
x = df['MODEL']
y = df['SAFARI']
plt.xticks(rotation='vertical')
plt.xlabel('COMPANY')
plt.ylabel('Total Sales')
plt.title('Company wise sales count')
plt.grid(True)
plt.plot(x, y)
plt.show()
if ch5==8:
g = df.groupby('HBX')
x = df['MODEL']
y = df['HBX']
plt.xticks(rotation='vertical')
plt.xlabel('COMPANY')](https://image.slidesharecdn.com/projectfile-kushshah-210328091452/75/Informatics-Practices-Information-Practices-Project-IP-Project-Class-12-12-2048.jpg)
![plt.ylabel('Total Sales')
plt.title('Company wise sales count')
plt.grid(True)
plt.plot(x, y)
plt.show()
if ch1==5:
clear()
print('nSELECT CAR')
print('_'*50)
print('1. Sunnyn')
print('2. Magniten')
print('3. Kicksn')
print('4. GT-Rn')
print('5. Terran')
ch6 = int(input('Enter your choice:'))
if ch6==1:
g = df.groupby('SUNNY')
x = df['MODEL']
y = df['SUNNY']
plt.xticks(rotation='vertical')
plt.xlabel('COMPANY')
plt.ylabel('Total Sales')
plt.title('Company wise sales count')
plt.grid(True)
plt.plot(x, y)
plt.show()
if ch6==2:
g = df.groupby('MAGNITE')
x = df['MODEL']
y = df['MAGNITE']
plt.xticks(rotation='vertical')
plt.xlabel('COMPANY')
plt.ylabel('Total Sales')
plt.title('Company wise sales count')
plt.grid(True)
plt.plot(x, y)
plt.show()
if ch6==3:
g = df.groupby('KICKS')
x = df['MODEL']
y = df['KICKS']
plt.xticks(rotation='vertical')
plt.xlabel('COMPANY')
plt.ylabel('Total Sales')
plt.title('Company wise sales count')
plt.grid(True)
plt.plot(x, y)
plt.show()
if ch6==4:
g = df.groupby('GT-R')
x = df['MODEL']
y = df['GT-R']
plt.xticks(rotation='vertical')
plt.xlabel('COMPANY')
plt.ylabel('Total Sales')
plt.title('Company wise sales count')
plt.grid(True)
plt.plot(x, y)
plt.show()
if ch6==5:
g = df.groupby('TERRA')](https://image.slidesharecdn.com/projectfile-kushshah-210328091452/75/Informatics-Practices-Information-Practices-Project-IP-Project-Class-12-13-2048.jpg)
![x = df['MODEL']
y = df['TERRA']
plt.xticks(rotation='vertical')
plt.xlabel('COMPANY')
plt.ylabel('Total Sales')
plt.title('Company wise sales count')
plt.grid(True)
plt.plot(x, y)
plt.show()
if ch1==6:
clear()
print('nSELECT CAR')
print('_'*50)
print('1. A4n')
print('2. A6n')
print('3. A8n')
print('4. Q2n')
print('5. Q8n')
print('6. RS7n')
ch7 = int(input('Enter your choice:'))
if ch7==1:
g = df.groupby('A4')
x = df['MODEL']
y = df['A4']
plt.xticks(rotation='vertical')
plt.xlabel('COMPANY')
plt.ylabel('Total Sales')
plt.title('Company wise sales count')
plt.grid(True)
plt.plot(x, y)
plt.show()
if ch7==2:
g = df.groupby('A6')
x = df['MODEL']
y = df['A8']
plt.xticks(rotation='vertical')
plt.xlabel('COMPANY')
plt.ylabel('Total Sales')
plt.title('Company wise sales count')
plt.grid(True)
plt.plot(x, y)
plt.show()
if ch7==3:
g = df.groupby('A8')
x = df['MODEL']
y = df['A8']
plt.xticks(rotation='vertical')
plt.xlabel('COMPANY')
plt.ylabel('Total Sales')
plt.title('Company wise sales count')
plt.grid(True)
plt.plot(x, y)
plt.show()
if ch7==4:
g = df.groupby('Q2')
x = df['MODEL']
y = df['Q2']
plt.xticks(rotation='vertical')
plt.xlabel('COMPANY')
plt.ylabel('Total Sales')
plt.title('Company wise sales count')
plt.grid(True)](https://image.slidesharecdn.com/projectfile-kushshah-210328091452/75/Informatics-Practices-Information-Practices-Project-IP-Project-Class-12-14-2048.jpg)
![plt.plot(x, y)
plt.show()
if ch7==5:
g = df.groupby('Q8')
x = df['MODEL']
y = df['Q8']
plt.xticks(rotation='vertical')
plt.xlabel('COMPANY')
plt.ylabel('Total Sales')
plt.title('Company wise sales count')
plt.grid(True)
plt.plot(x, y)
plt.show()
if ch7==6:
g = df.groupby('RS7')
x = df['MODEL']
y = df['RS7']
plt.xticks(rotation='vertical')
plt.xlabel('COMPANY')
plt.ylabel('Total Sales')
plt.title('Company wise sales count')
plt.grid(True)
plt.plot(x, y)
plt.show()
if ch == 2:
clear()
print('nSELECT MANUFACTURER')
print('_'*50)
print('1. Hondan')
print('2. Hyundain')
print('3. Maruti Suzukin')
print('4. Tatan')
print('5. Nissann')
print('6. Audin')
ch8 = int(input('Enter your choice:'))
if ch8==1:
clear()
print('nSELECT CAR')
print('_'*50)
print('1. Amazen')
print('2. Jazzn')
print('3. WR-Vn')
print('4. CR-Vn')
print('5. HR-Vn')
print('6. Cityn')
print('7. Civicn')
ch9 = int(input('Enter your choice:'))
if ch9==1:
g = df.groupby('AMAZE')
x = df['MODEL']
y = df['AMAZE']
plt.xticks(rotation='vertical')
plt.xlabel('Year')
plt.ylabel('Total Sales')
plt.title('Car Wise Sales Count')
plt.bar(x, y)
plt.grid(True)
plt.show()](https://image.slidesharecdn.com/projectfile-kushshah-210328091452/75/Informatics-Practices-Information-Practices-Project-IP-Project-Class-12-15-2048.jpg)
![if ch9==2:
g = df.groupby('JAZZ')
x = df['MODEL']
y = df['JAZZ']
plt.xticks(rotation='vertical')
plt.xlabel('COMPANY')
plt.ylabel('Total Sales')
plt.title('Car Wise Sales Count')
plt.bar(x, y)
plt.grid(True)
plt.show()
if ch9==3:
g = df.groupby('WR-V')
x = df['MODEL']
y = df['WR_V']
plt.xticks(rotation='vertical')
plt.xlabel('COMPANY')
plt.ylabel('Total Sales')
plt.title('Car Wise Sales Count')
plt.bar(x, y)
plt.grid(True)
plt.show()
if ch9==4:
g = df.groupby('CR-V')
x = df['MODEL']
y = df['CR-V']
plt.xticks(rotation='vertical')
plt.xlabel('COMPANY')
plt.ylabel('Total Sales')
plt.title('Car Wise Sales Count')
plt.bar(x, y)
plt.grid(True)
plt.show()
if ch9==5:
g = df.groupby('HR-V')
x = df['MODEL']
y = df['HR-V']
plt.xticks(rotation='vertical')
plt.xlabel('COMPANY')
plt.ylabel('Total Sales')
plt.title('Car Wise Sales Count')
plt.bar(x, y)
plt.grid(True)
plt.show()
if ch9==6:
g = df.groupby('CITY')
x = df['MODEL']
y = df['CITY']
plt.xticks(rotation='vertical')
plt.xlabel('COMPANY')
plt.ylabel('Total Sales')
plt.title('Car Wise Sales Count')
plt.bar(x, y)
plt.grid(True)
plt.show()
if ch9==7:
g = df.groupby('CIVIC')
x = df['MODEL']
y = df['CIVIC']
plt.xticks(rotation='vertical')
plt.xlabel('COMPANY')
plt.ylabel('Total Sales')
plt.title('Car Wise Sales Count')
plt.bar(x, y)](https://image.slidesharecdn.com/projectfile-kushshah-210328091452/75/Informatics-Practices-Information-Practices-Project-IP-Project-Class-12-16-2048.jpg)
![plt.grid(True)
plt.show()
if ch8==2:
clear()
print('nSELECT CAR')
print('_'*50)
print('1. i10n')
print('2. i20n')
print('3. Cretan')
print('4. Venuen')
print('5. Vernan')
print('6. Santron')
print('7. Elantran')
print('8. Xcentn')
print('9. Sonatan')
print('10. Palisaden')
print('11. Konan')
ch10 = int(input('Enter your choice:'))
if ch10==1:
g = df.groupby('i10')
x = df['MODEL']
y = df['i10']
plt.xticks(rotation='vertical')
plt.xlabel('COMPANY')
plt.ylabel('Total Sales')
plt.title('Company wise sales count')
plt.grid(True)
plt.bar(x, y)
plt.show()
if ch10==2:
g = df.groupby('i20')
x = df['MODEL']
y = df['i20']
plt.xticks(rotation='vertical')
plt.xlabel('COMPANY')
plt.ylabel('Total Sales')
plt.title('Company wise sales count')
plt.grid(True)
plt.bar(x, y)
plt.show()
if ch10==3:
g = df.groupby('CRETA')
x = df['MODEL']
y = df['CRETA']
plt.xticks(rotation='vertical')
plt.xlabel('COMPANY')
plt.ylabel('Total Sales')
plt.title('Company wise sales count')
plt.grid(True)
plt.bar(x, y)
plt.show()
if ch10==4:
g = df.groupby('VENUE')
x = df['MODEL']
y = df['VENUE']
plt.xticks(rotation='vertical')
plt.xlabel('COMPANY')
plt.ylabel('Total Sales')
plt.title('Company wise sales count')
plt.grid(True)
plt.bar(x, y)](https://image.slidesharecdn.com/projectfile-kushshah-210328091452/75/Informatics-Practices-Information-Practices-Project-IP-Project-Class-12-17-2048.jpg)
![plt.show()
if ch10==5:
g = df.groupby('VERNA')
x = df['MODEL']
y = df['VERNA']
plt.xticks(rotation='vertical')
plt.xlabel('COMPANY')
plt.ylabel('Total Sales')
plt.title('Company wise sales count')
plt.grid(True)
plt.bar(x, y)
plt.show()
if ch10==6:
g = df.groupby('SANTRO')
x = df['MODEL']
y = df['SANTRO']
plt.xticks(rotation='vertical')
plt.xlabel('COMPANY')
plt.ylabel('Total Sales')
plt.title('Company wise sales count')
plt.grid(True)
plt.bar(x, y)
plt.show()
if ch10==7:
g = df.groupby('ELANTRA')
x = df['MODEL']
y = df['ELANTRA']
plt.xticks(rotation='vertical')
plt.xlabel('COMPANY')
plt.ylabel('Total Sales')
plt.title('Company wise sales count')
plt.grid(True)
plt.bar(x, y)
plt.show()
if ch10==8:
g = df.groupby('XCENT')
x = df['MODEL']
y = df['XCENT']
plt.xticks(rotation='vertical')
plt.xlabel('COMPANY')
plt.ylabel('Total Sales')
plt.title('Company wise sales count')
plt.grid(True)
plt.bar(x, y)
plt.show()
if ch10==9:
g = df.groupby('SONATA')
x = df['MODEL']
y = df['SONATA']
plt.xticks(rotation='vertical')
plt.xlabel('COMPANY')
plt.ylabel('Total Sales')
plt.title('Company wise sales count')
plt.grid(True)
plt.bar(x, y)
plt.show()
if ch10==10:
g = df.groupby('PALISADE')
x = df['MODEL']
y = df['PALISADE']
plt.xticks(rotation='vertical')
plt.xlabel('COMPANY')
plt.ylabel('Total Sales')
plt.title('Company wise sales count')](https://image.slidesharecdn.com/projectfile-kushshah-210328091452/75/Informatics-Practices-Information-Practices-Project-IP-Project-Class-12-18-2048.jpg)
![plt.grid(True)
plt.bar(x, y)
plt.show()
if ch10==11:
g = df.groupby('KONA')
x = df['MODEL']
y = df['KONA']
plt.xticks(rotation='vertical')
plt.xlabel('COMPANY')
plt.ylabel('Total Sales')
plt.title('Company wise sales count')
plt.grid(True)
plt.bar(x, y)
plt.show()
if ch8==3:
clear()
print('nSELECT CAR')
print('_'*50)
print('1. Balenon')
print('2. Swiftn')
print('3. DZiren')
print('4. Alton')
print('5. Ciazn')
print('6. Eecon')
print('7. Ignisn')
print('8. Celerio Xn')
print('9 S-Crossn')
print('10. XL6n')
ch11 = int(input('Enter your choice:'))
if ch11==1:
g = df.groupby('BALENO')
x = df['MODEL']
y = df['BALENO']
plt.xticks(rotation='vertical')
plt.xlabel('COMPANY')
plt.ylabel('Total Sales')
plt.title('Company wise sales count')
plt.grid(True)
plt.bar(x, y)
plt.show()
if ch11==2:
g = df.groupby('SWIFT')
x = df['MODEL']
y = df['SWIFT']
plt.xticks(rotation='vertical')
plt.xlabel('COMPANY')
plt.ylabel('Total Sales')
plt.title('Company wise sales count')
plt.grid(True)
plt.bar(x, y)
plt.show()
if ch11==3:
g = df.groupby('DZIRE')
x = df['MODEL']
y = df['DZIRE']
plt.xticks(rotation='vertical')
plt.xlabel('COMPANY')
plt.ylabel('Total Sales')
plt.title('Company wise sales count')
plt.grid(True)
plt.bar(x, y)](https://image.slidesharecdn.com/projectfile-kushshah-210328091452/75/Informatics-Practices-Information-Practices-Project-IP-Project-Class-12-19-2048.jpg)
![plt.show()
if ch11==4:
g = df.groupby('ALTO')
x = df['MODEL']
y = df['ALTO']
plt.xticks(rotation='vertical')
plt.xlabel('COMPANY')
plt.ylabel('Total Sales')
plt.title('Company wise sales count')
plt.grid(True)
plt.bar(x, y)
plt.show()
if ch11==5:
g = df.groupby('CIAZ')
x = df['MODEL']
y = df['CIAZ']
plt.xticks(rotation='vertical')
plt.xlabel('COMPANY')
plt.ylabel('Total Sales')
plt.title('Company wise sales count')
plt.grid(True)
plt.bar(x, y)
plt.show()
if ch11==6:
g = df.groupby('EECO')
x = df['MODEL']
y = df['EECO']
plt.xticks(rotation='vertical')
plt.xlabel('COMPANY')
plt.ylabel('Total Sales')
plt.title('Company wise sales count')
plt.grid(True)
plt.bar(x, y)
plt.show()
if ch11==7:
g = df.groupby('IGNIS')
x = df['MODEL']
y = df['IGNIS']
plt.xticks(rotation='vertical')
plt.xlabel('COMPANY')
plt.ylabel('Total Sales')
plt.title('Company wise sales count')
plt.grid(True)
plt.bar(x, y)
plt.show()
if ch11==8:
g = df.groupby('CELERIO X')
x = df['MODEL']
y = df['CELERIO X']
plt.xticks(rotation='vertical')
plt.xlabel('COMPANY')
plt.ylabel('Total Sales')
plt.title('Company wise sales count')
plt.grid(True)
plt.bar(x, y)
plt.show()
if ch11==9:
g = df.groupby('S-CROSS')
x = df['MODEL']
y = df['S-CROSS']
plt.xticks(rotation='vertical')
plt.xlabel('COMPANY')
plt.ylabel('Total Sales')
plt.title('Company wise sales count')](https://image.slidesharecdn.com/projectfile-kushshah-210328091452/75/Informatics-Practices-Information-Practices-Project-IP-Project-Class-12-20-2048.jpg)
![plt.grid(True)
plt.bar(x, y)
plt.show()
if ch11==10:
g = df.groupby('XL6')
x = df['MODEL']
y = df['XL6']
plt.xticks(rotation='vertical')
plt.xlabel('COMPANY')
plt.ylabel('Total Sales')
plt.title('Company wise sales count')
plt.grid(True)
plt.bar(x, y)
plt.show()
if ch8==4:
clear()
print('nSELECT CAR')
print('_'*50)
print('1. Tiagon')
print('2. Nexonn')
print('3. Tigorn')
print('4. Harriern')
print('5. Altrozn')
print('6. Nanon')
print('7. Safarin')
print('8. HBXn')
ch12 = int(input('Enter your choice:'))
if ch12==1:
g = df.groupby('TIAGO')
x = df['MODEL']
y = df['TIAGO']
plt.xticks(rotation='vertical')
plt.xlabel('COMPANY')
plt.ylabel('Total Sales')
plt.title('Company wise sales count')
plt.grid(True)
plt.bar(x, y)
plt.show()
if ch12==2:
g = df.groupby('NEXON')
x = df['MODEL']
y = df['NEXON']
plt.xticks(rotation='vertical')
plt.xlabel('COMPANY')
plt.ylabel('Total Sales')
plt.title('Company wise sales count')
plt.grid(True)
plt.bar(x, y)
plt.show()
if ch12==3:
g = df.groupby('TIGOR')
x = df['MODEL']
y = df['TIGOR']
plt.xticks(rotation='vertical')
plt.xlabel('COMPANY')
plt.ylabel('Total Sales')
plt.title('Company wise sales count')
plt.grid(True)
plt.bar(x, y)
plt.show()
if ch12==4:
g = df.groupby('HARRIER')](https://image.slidesharecdn.com/projectfile-kushshah-210328091452/75/Informatics-Practices-Information-Practices-Project-IP-Project-Class-12-21-2048.jpg)
![x = df['MODEL']
y = df['HARRIER']
plt.xticks(rotation='vertical')
plt.xlabel('COMPANY')
plt.ylabel('Total Sales')
plt.title('Company wise sales count')
plt.grid(True)
plt.bar(x, y)
plt.show()
if ch12==5:
g = df.groupby('ALTROZ')
x = df['MODEL']
y = df['ALTROZ']
plt.xticks(rotation='vertical')
plt.xlabel('COMPANY')
plt.ylabel('Total Sales')
plt.title('Company wise sales count')
plt.grid(True)
plt.bar(x, y)
plt.show()
if ch12==6:
g = df.groupby('NANO')
x = df['MODEL']
y = df['NANO']
plt.xticks(rotation='vertical')
plt.xlabel('COMPANY')
plt.ylabel('Total Sales')
plt.title('Company wise sales count')
plt.grid(True)
plt.bar(x, y)
plt.show()
if ch12==7:
g = df.groupby('SAFARI')
x = df['MODEL']
y = df['SAFARI']
plt.xticks(rotation='vertical')
plt.xlabel('COMPANY')
plt.ylabel('Total Sales')
plt.title('Company wise sales count')
plt.grid(True)
plt.bar(x, y)
plt.show()
if ch12==8:
g = df.groupby('HBX')
x = df['MODEL']
y = df['HBX']
plt.xticks(rotation='vertical')
plt.xlabel('COMPANY')
plt.ylabel('Total Sales')
plt.title('Company wise sales count')
plt.grid(True)
plt.bar(x, y)
plt.show()
if ch8==5:
clear()
print('nSELECT CAR')
print('_'*50)
print('1. Sunnyn')
print('2. Magniten')
print('3. Kicksn')
print('4. GT-Rn')
print('5. Terran')](https://image.slidesharecdn.com/projectfile-kushshah-210328091452/75/Informatics-Practices-Information-Practices-Project-IP-Project-Class-12-22-2048.jpg)
![ch13 = int(input('Enter your choice:'))
if ch13==1:
g = df.groupby('SUNNY')
x = df['MODEL']
y = df['SUNNY']
plt.xticks(rotation='vertical')
plt.xlabel('COMPANY')
plt.ylabel('Total Sales')
plt.title('Company wise sales count')
plt.grid(True)
plt.bar(x, y)
plt.show()
if ch13==2:
g = df.groupby('MAGNITE')
x = df['MODEL']
y = df['MAGNITE']
plt.xticks(rotation='vertical')
plt.xlabel('COMPANY')
plt.ylabel('Total Sales')
plt.title('Company wise sales count')
plt.grid(True)
plt.bar(x, y)
plt.show()
if ch13==3:
g = df.groupby('KICKS')
x = df['MODEL']
y = df['KICKS']
plt.xticks(rotation='vertical')
plt.xlabel('COMPANY')
plt.ylabel('Total Sales')
plt.title('Company wise sales count')
plt.grid(True)
plt.bar(x, y)
plt.show()
if ch13==4:
g = df.groupby('GT-R')
x = df['MODEL']
y = df['GT-R']
plt.xticks(rotation='vertical')
plt.xlabel('COMPANY')
plt.ylabel('Total Sales')
plt.title('Company wise sales count')
plt.grid(True)
plt.bar(x, y)
plt.show()
if ch13==5:
g = df.groupby('TERRA')
x = df['MODEL']
y = df['TERRA']
plt.xticks(rotation='vertical')
plt.xlabel('COMPANY')
plt.ylabel('Total Sales')
plt.title('Company wise sales count')
plt.grid(True)
plt.bar(x, y)
plt.show()
if ch8==6:
clear()
print('nSELECT CAR')
print('_'*50)
print('1. A4n')
print('2. A6n')
print('3. A8n')](https://image.slidesharecdn.com/projectfile-kushshah-210328091452/75/Informatics-Practices-Information-Practices-Project-IP-Project-Class-12-23-2048.jpg)
![print('4. Q2n')
print('5. Q8n')
print('6. RS7n')
ch14 = int(input('Enter your choice:'))
if ch14==1:
g = df.groupby('A4')
x = df['MODEL']
y = df['A4']
plt.xticks(rotation='vertical')
plt.xlabel('COMPANY')
plt.ylabel('Total Sales')
plt.title('Company wise sales count')
plt.grid(True)
plt.bar(x, y)
plt.show()
if ch14==2:
g = df.groupby('A6')
x = df['MODEL']
y = df['A8']
plt.xticks(rotation='vertical')
plt.xlabel('COMPANY')
plt.ylabel('Total Sales')
plt.title('Company wise sales count')
plt.grid(True)
plt.bar(x, y)
plt.show()
if ch14==3:
g = df.groupby('A8')
x = df['MODEL']
y = df['A8']
plt.xticks(rotation='vertical')
plt.xlabel('COMPANY')
plt.ylabel('Total Sales')
plt.title('Company wise sales count')
plt.grid(True)
plt.bar(x, y)
plt.show()
if ch14==4:
g = df.groupby('Q2')
x = df['MODEL']
y = df['Q2']
plt.xticks(rotation='vertical')
plt.xlabel('COMPANY')
plt.ylabel('Total Sales')
plt.title('Company wise sales count')
plt.grid(True)
plt.bar(x, y)
plt.show()
if ch14==5:
g = df.groupby('Q8')
x = df['MODEL']
y = df['Q8']
plt.xticks(rotation='vertical')
plt.xlabel('COMPANY')
plt.ylabel('Total Sales')
plt.title('Company wise sales count')
plt.grid(True)
plt.bar(x, y)
plt.show()
if ch14==6:
g = df.groupby('RS7')
x = df['MODEL']](https://image.slidesharecdn.com/projectfile-kushshah-210328091452/75/Informatics-Practices-Information-Practices-Project-IP-Project-Class-12-24-2048.jpg)
![y = df['RS7']
plt.xticks(rotation='vertical')
plt.xlabel('COMPANY')
plt.ylabel('Total Sales')
plt.title('Company wise sales count')
plt.grid(True)
plt.bar(x, y)
plt.show()
if ch == 3:
main_menu()
wait = input()
def main_menu():
clear()
introduction()
while True:
clear()
print('MAIN MENU ')
print('_'*50)
print()
print('1. Read CSV Filen')
print('2. Data Analysis Menun')
print('3. Graph Menun')
print('4. Exitn')
choice = int(input('Enter your choice :'))
if choice == 1:
df = pd.read_csv("/Users/admin/Desktop/Kush/Study/IP/PROJECT/CAR.csv")
print (df)
wait = input()
if choice == 2:
data_analysis_menu()
wait = input()
if choice == 3:
graph()
wait = input()
if choice == 4:
print ("Project Made by- Kush Shah")
break
clear()
# call your main menu
main_menu()](https://image.slidesharecdn.com/projectfile-kushshah-210328091452/75/Informatics-Practices-Information-Practices-Project-IP-Project-Class-12-25-2048.jpg)