Download as KEY, PPTX

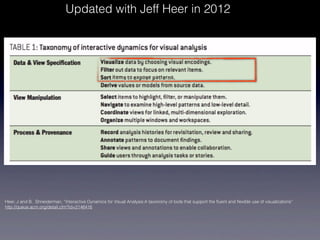
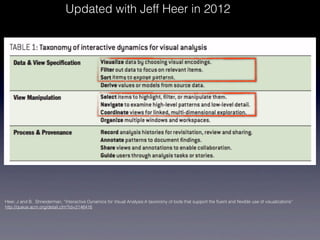


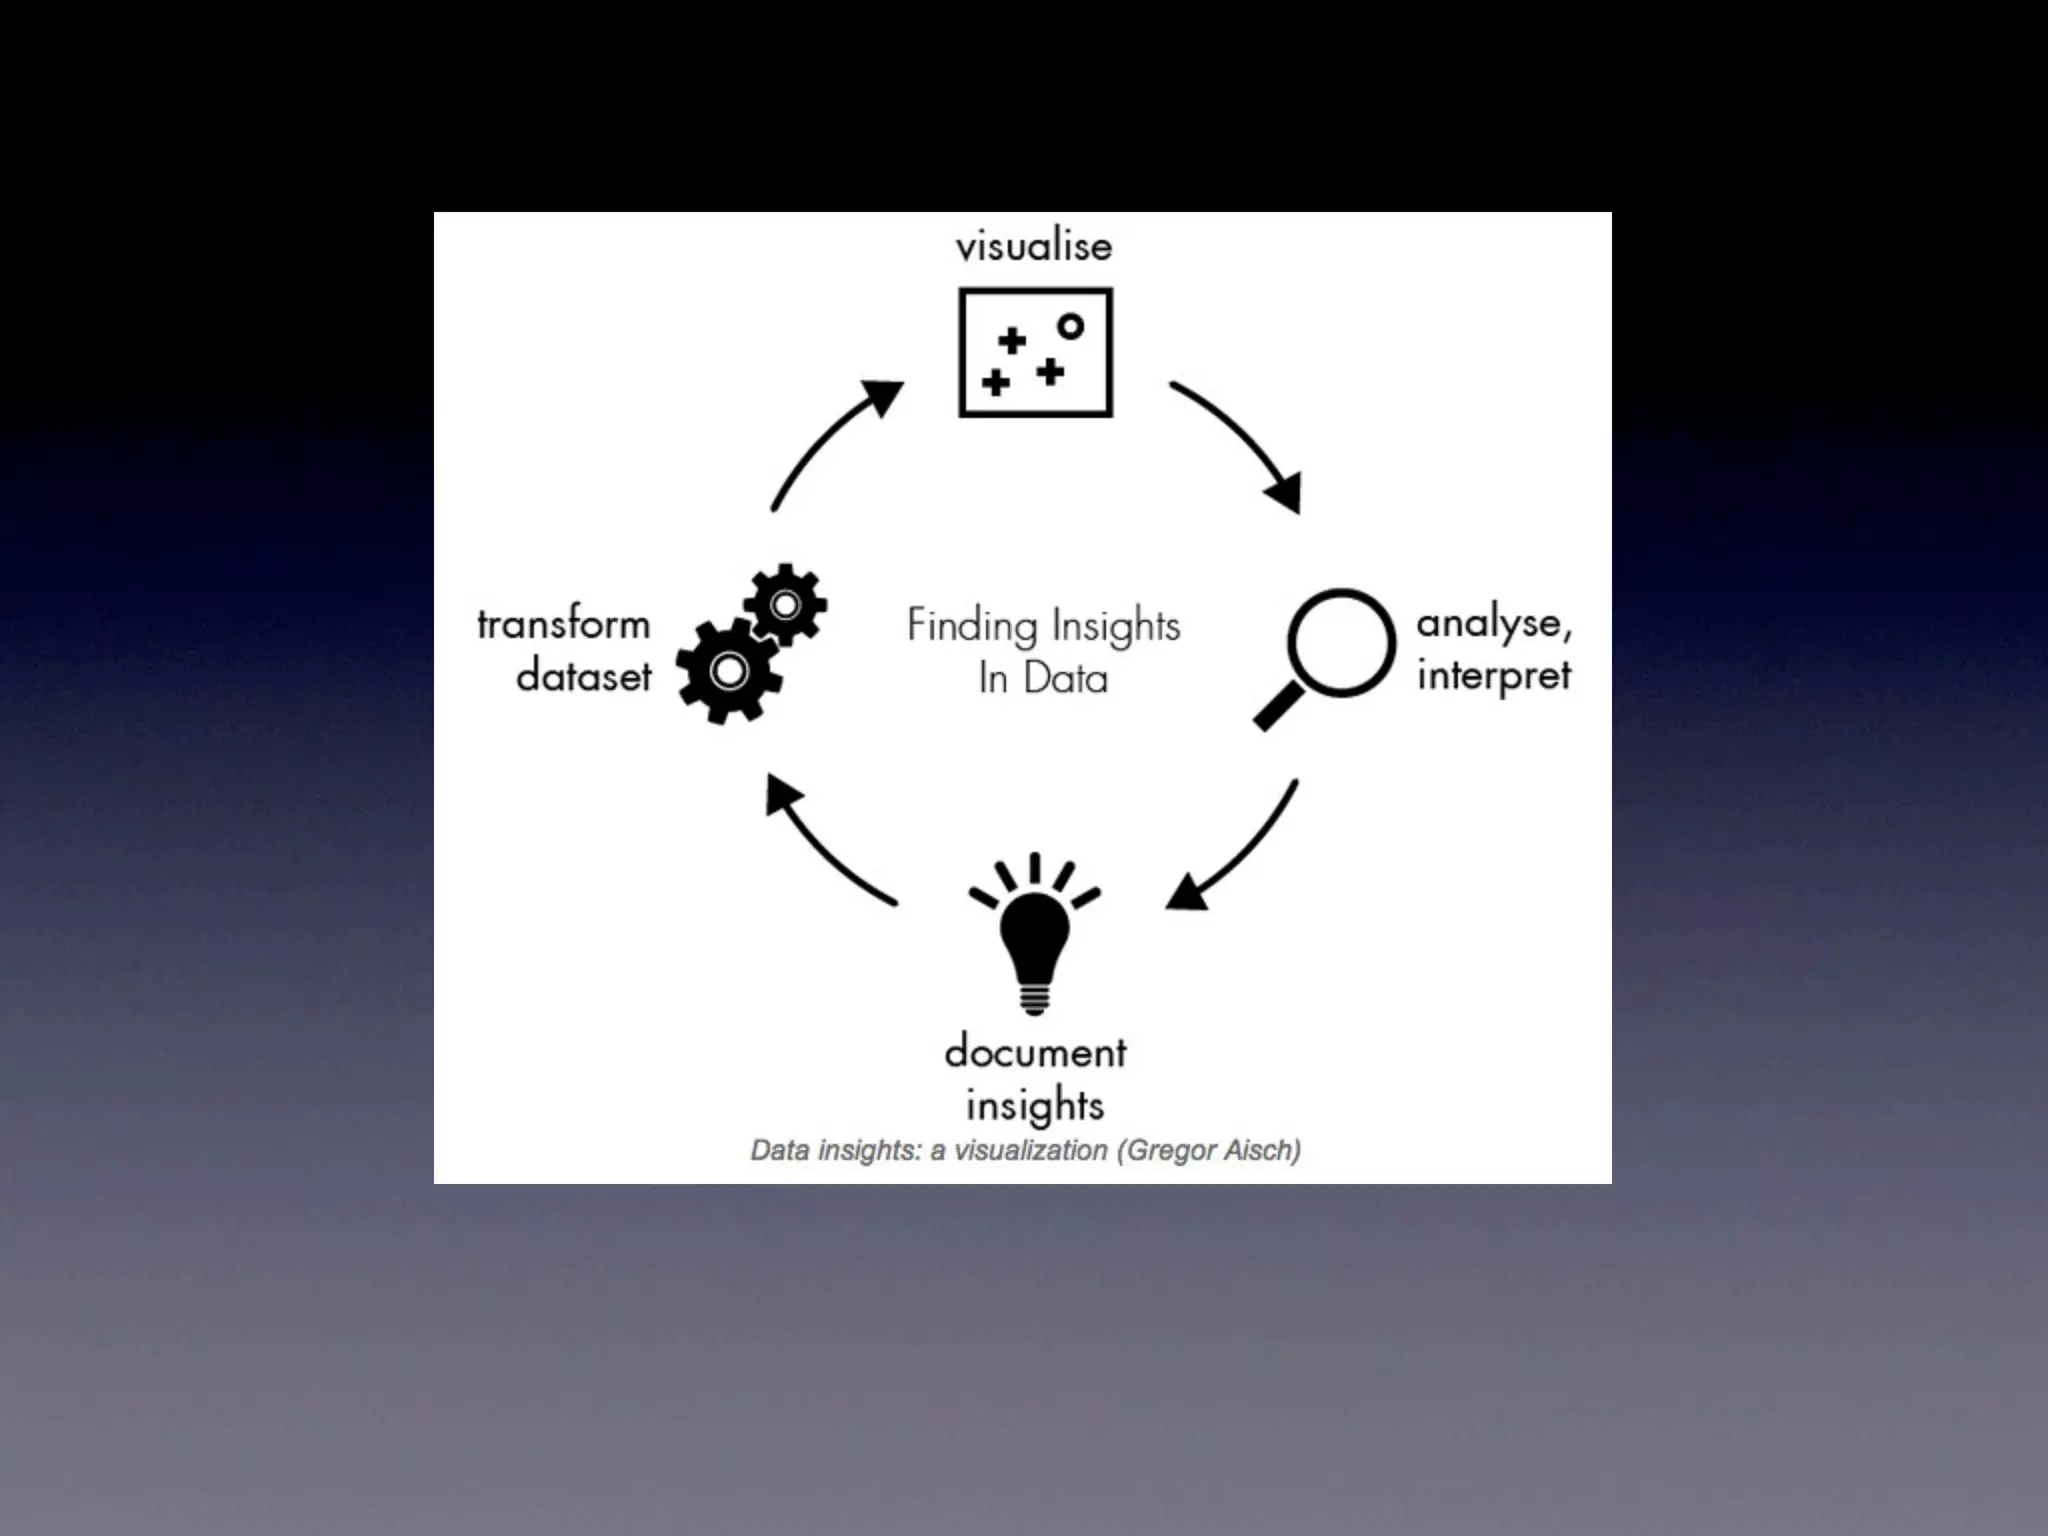
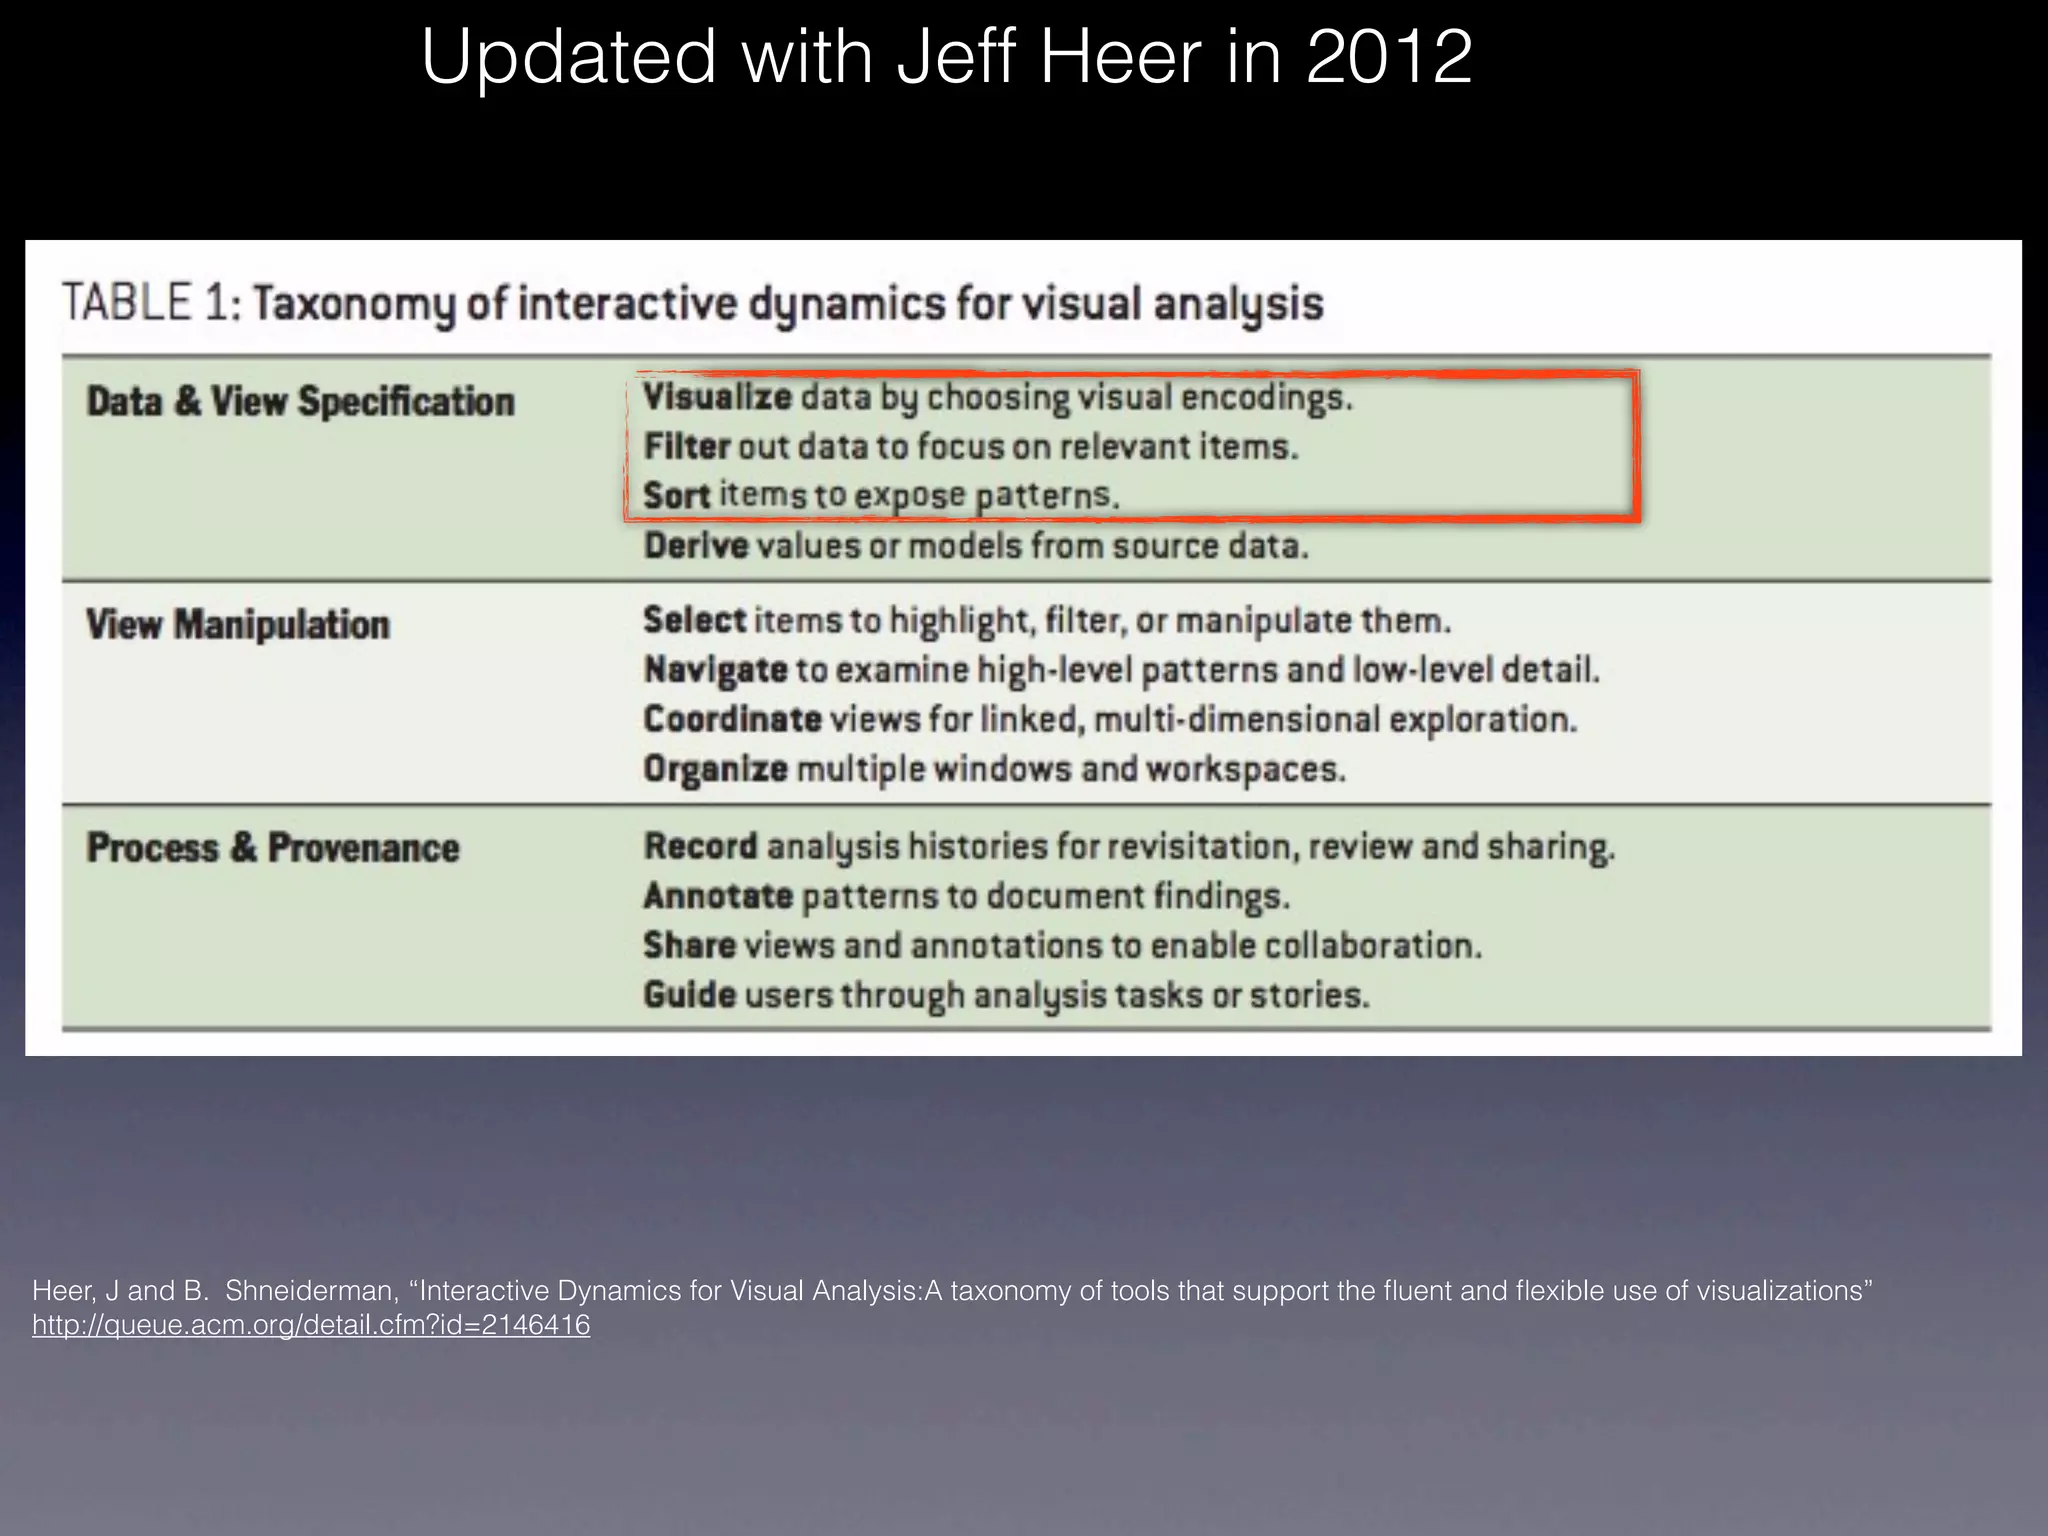
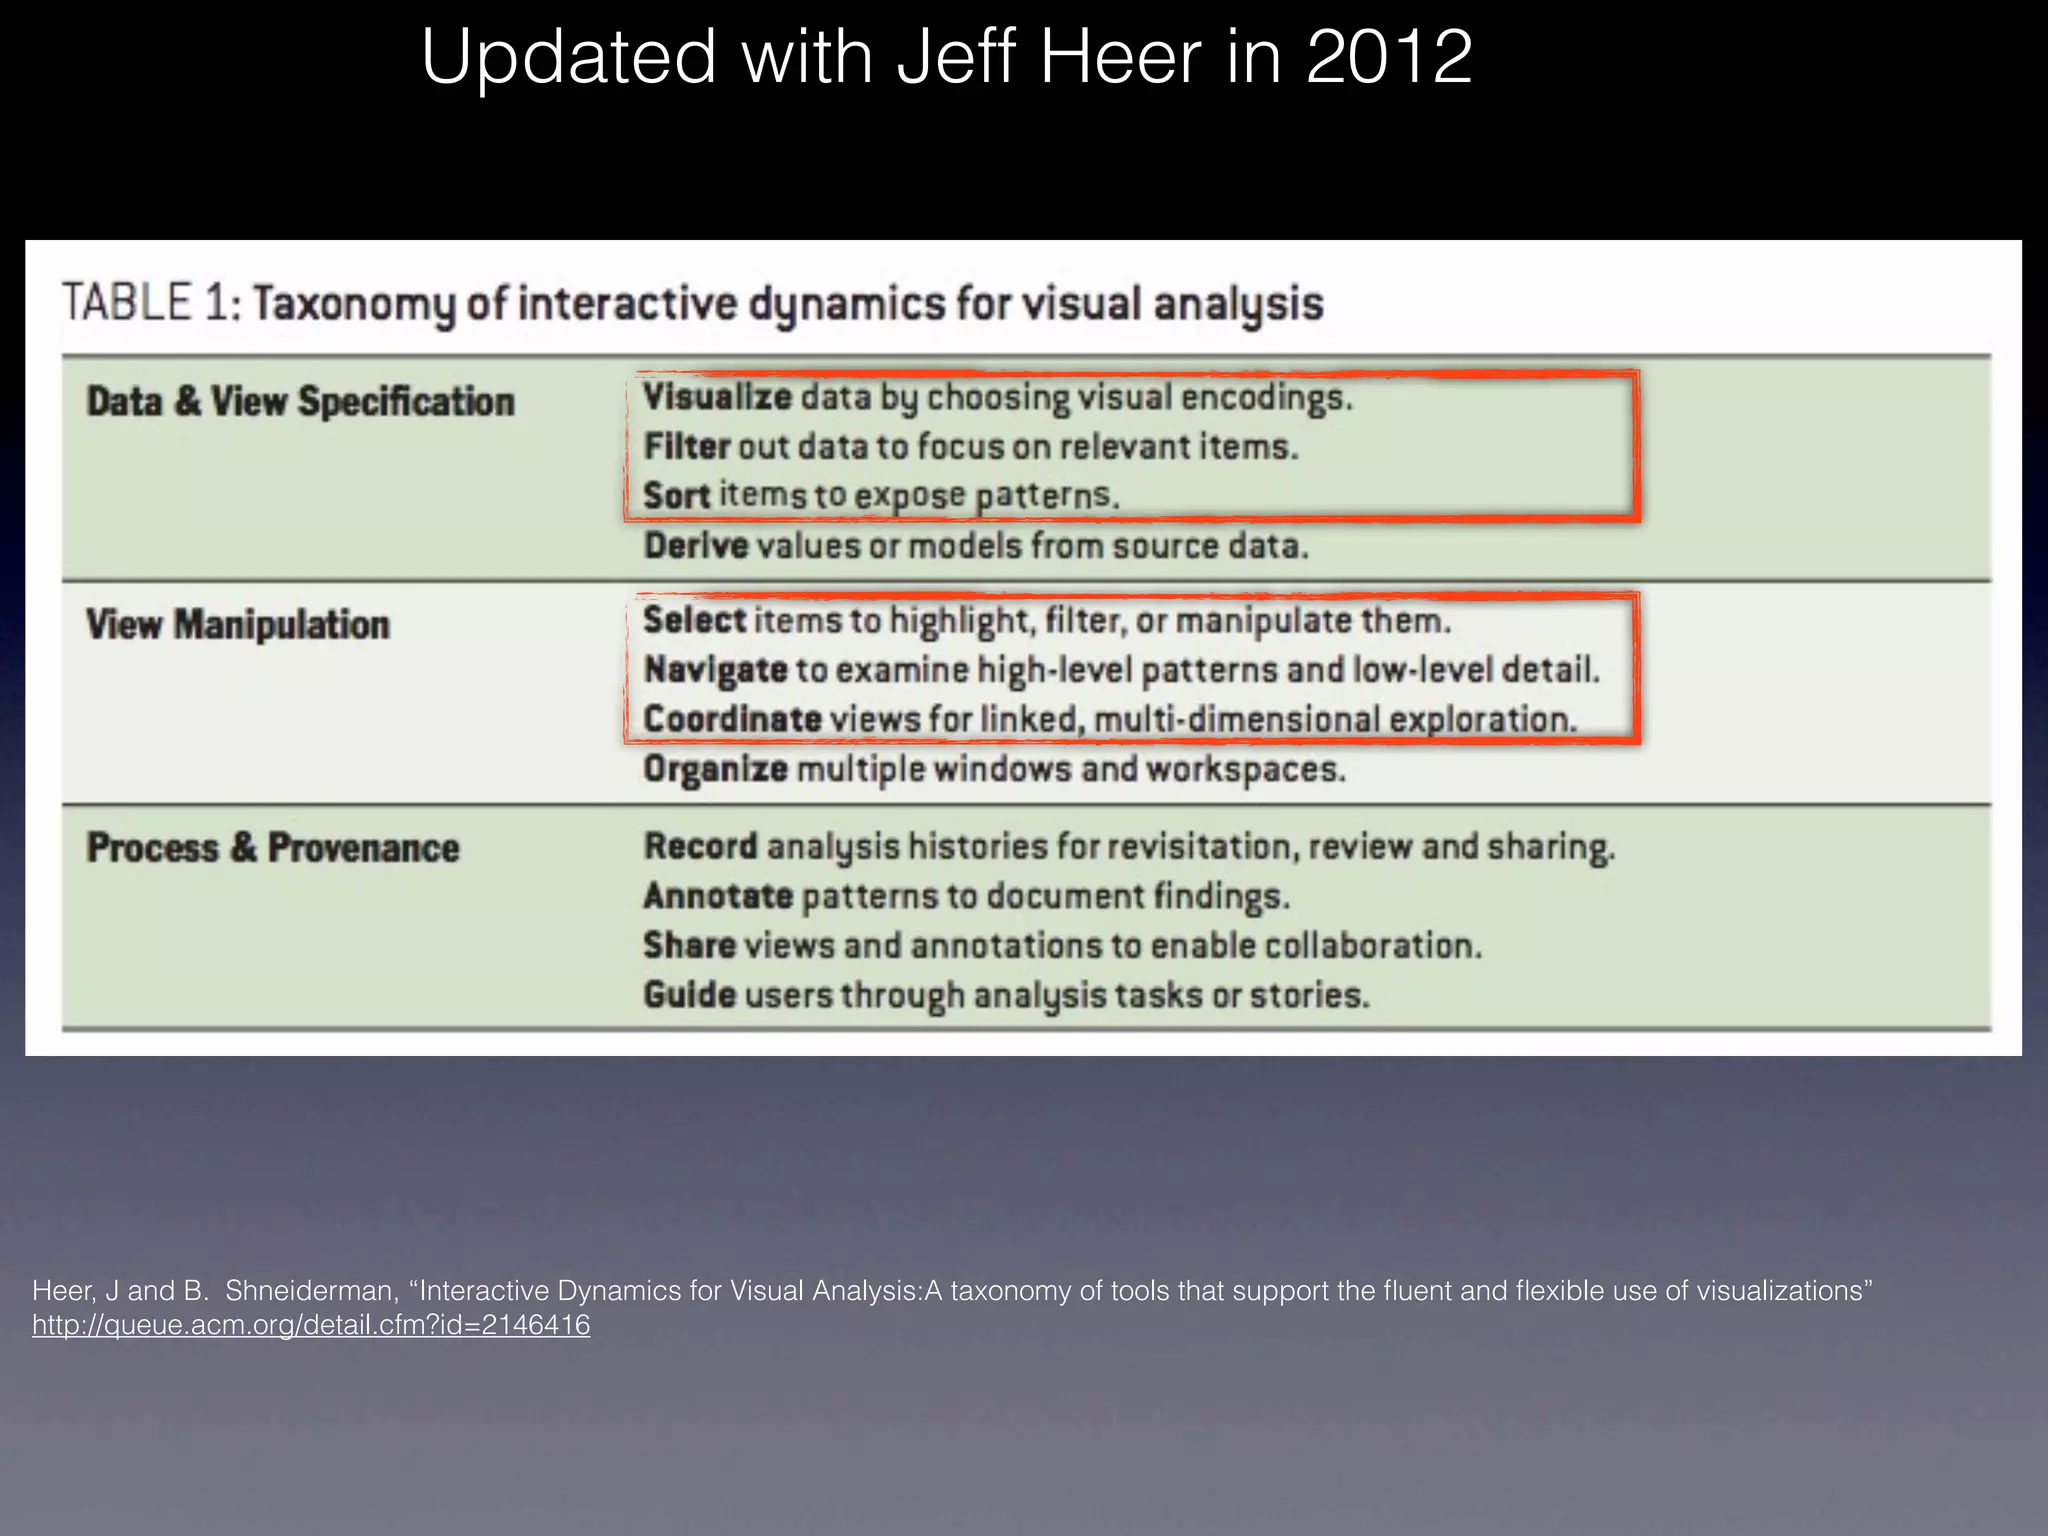
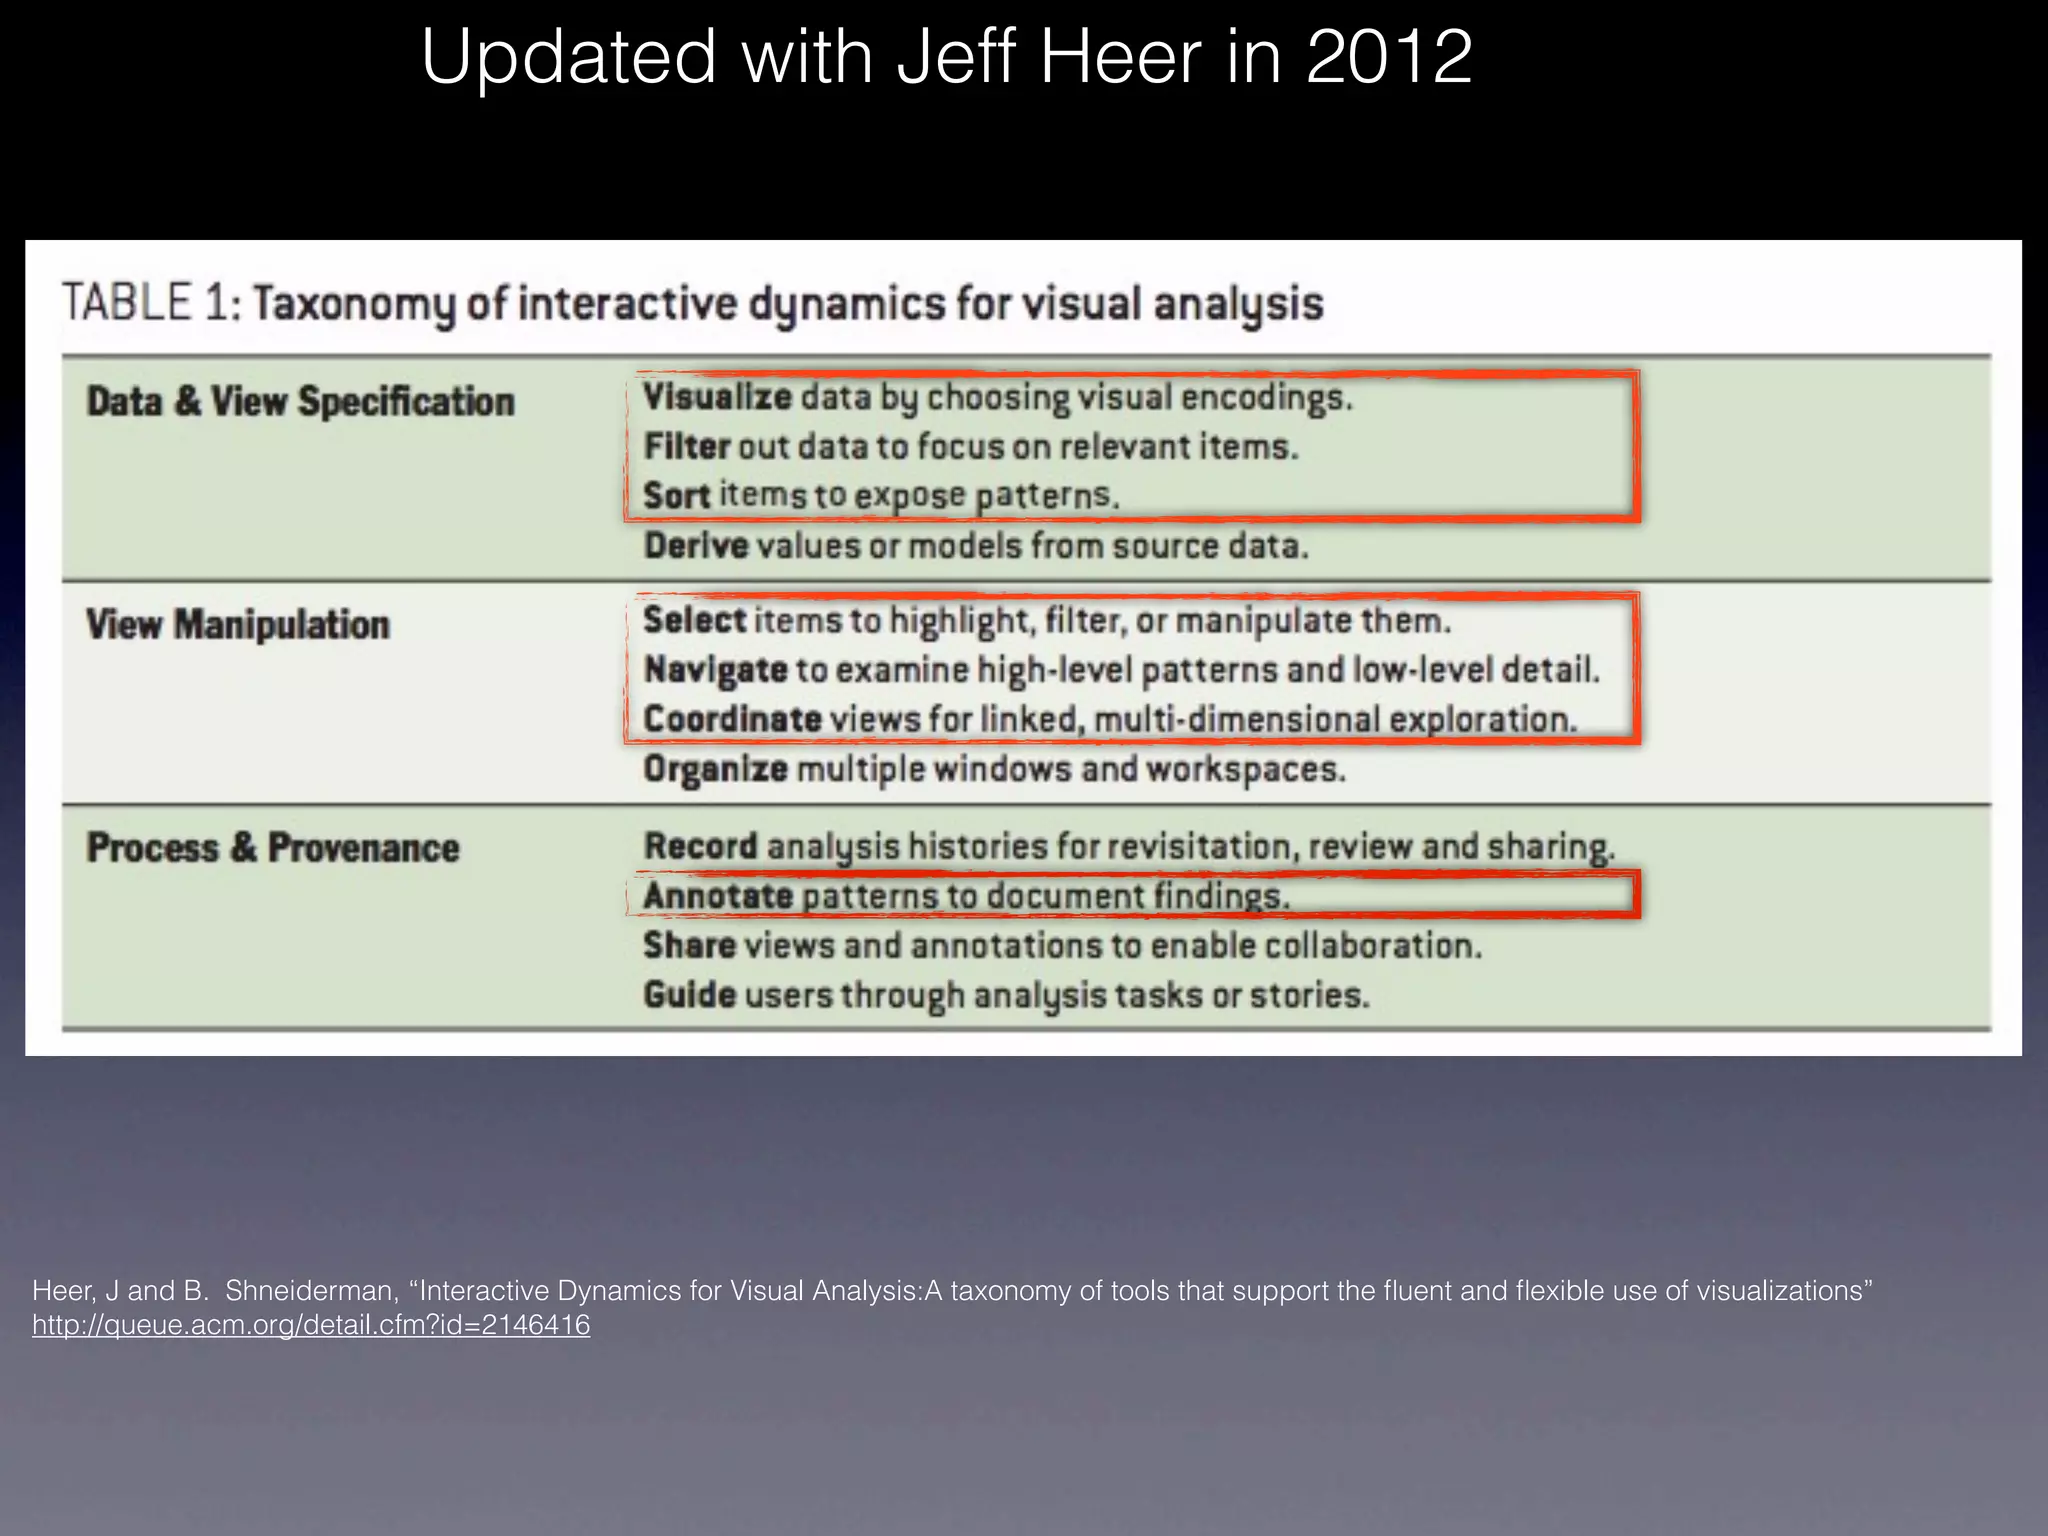


The document discusses interactive data visualization techniques using d3.js, referencing Shneiderman's visual analysis principles. It emphasizes a structured approach to visualizing data through methods such as filtering, sorting, and zooming, along with various examples and resources for learning d3.js. Additionally, it provides links to tools, tutorials, and community events for further engagement in data visualization practices.


