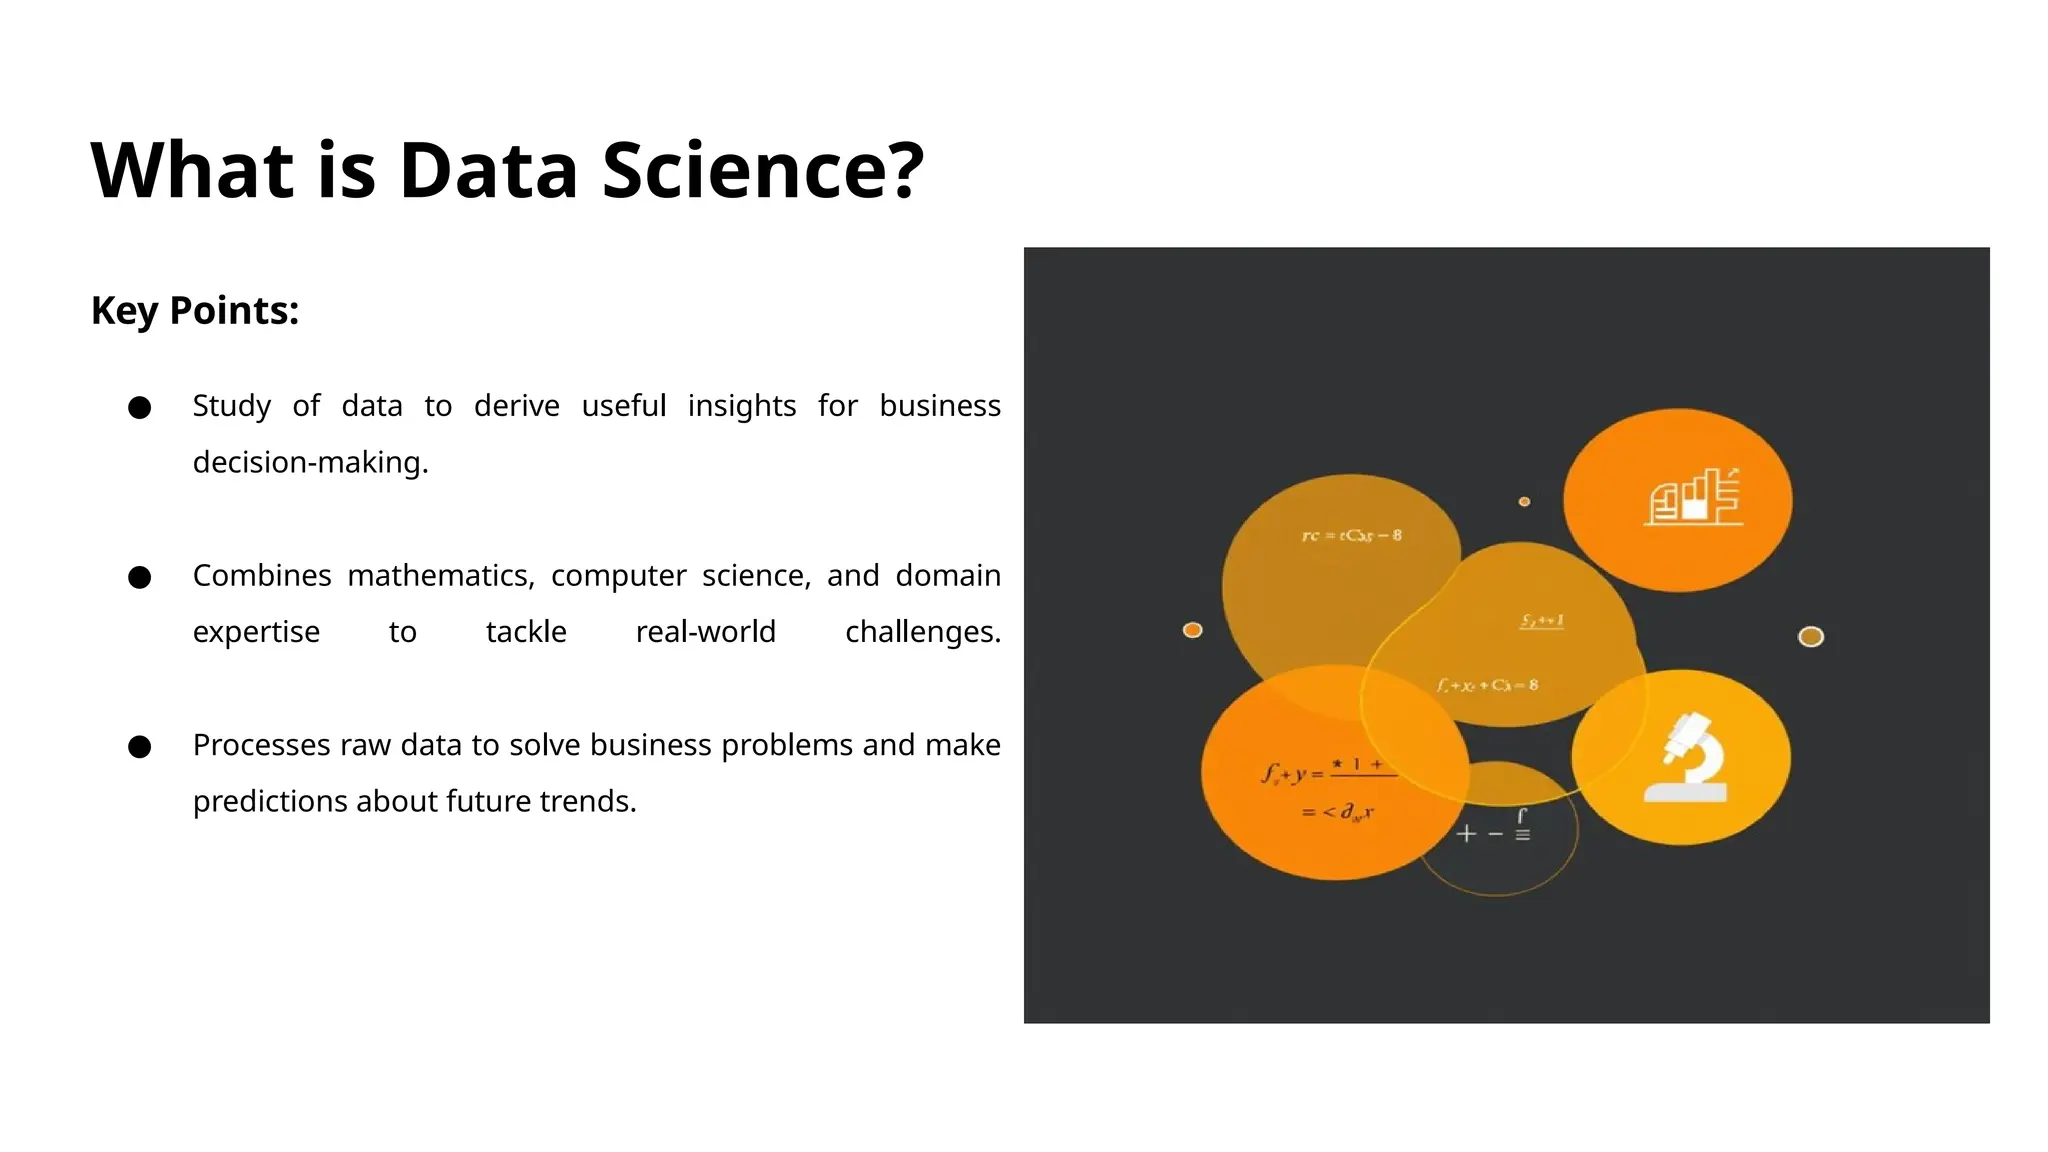
What is DataScience?
Key Points:
● Study of data to derive useful insights for business
decision-making.
● Combines mathematics, computer science, and domain
expertise to tackle real-world challenges.
● Processes raw data to solve business problems and make
predictions about future trends.
3.
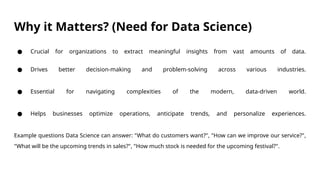
Why it Matters?(Need for Data Science)
● Crucial for organizations to extract meaningful insights from vast amounts of data.
● Drives better decision-making and problem-solving across various industries.
● Essential for navigating complexities of the modern, data-driven world.
● Helps businesses optimize operations, anticipate trends, and personalize experiences.
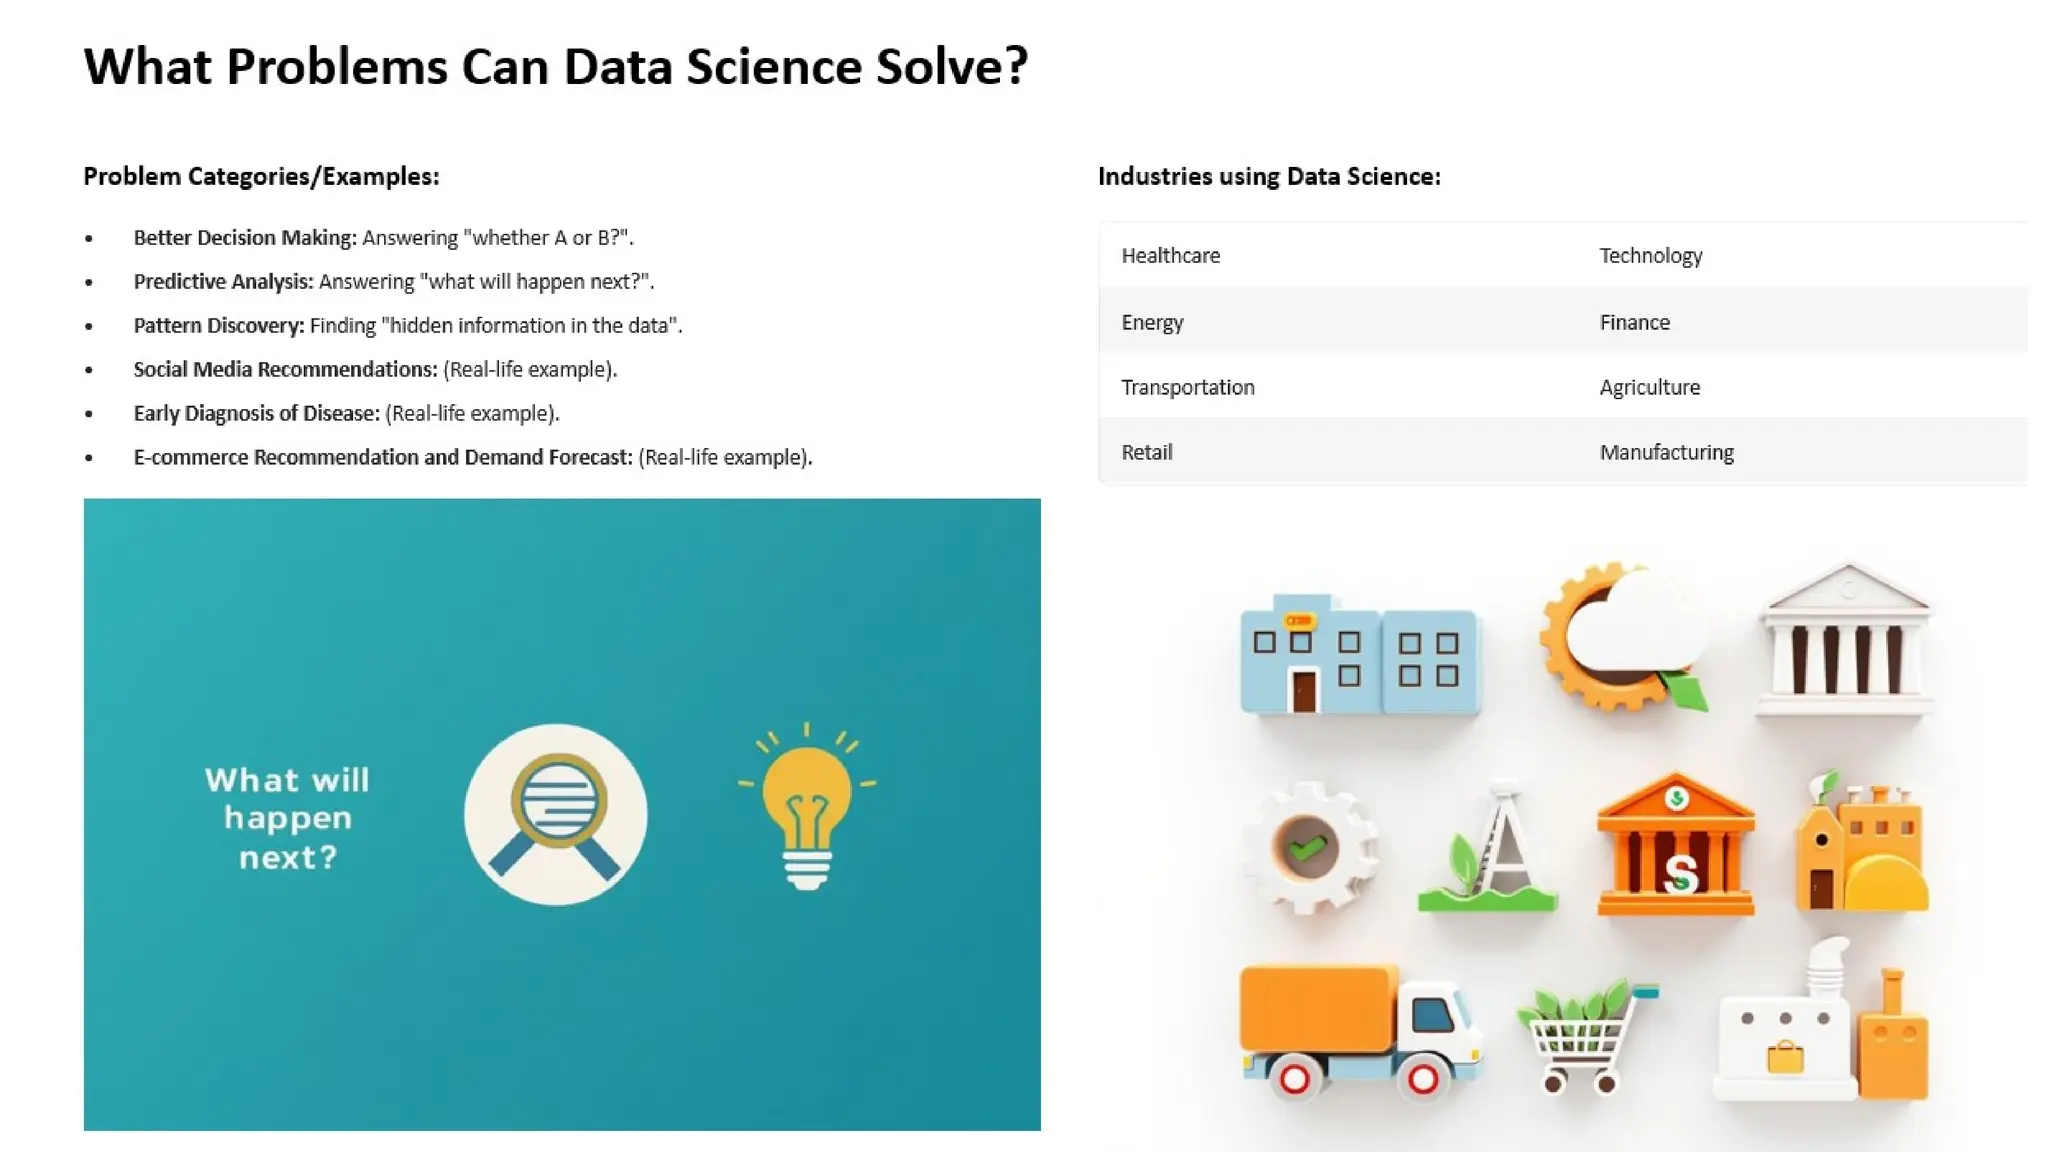
Example questions Data Science can answer: "What do customers want?", "How can we improve our service?",
"What will be the upcoming trends in sales?", "How much stock is needed for the upcoming festival?".
11.
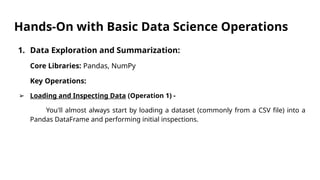
Hands-On with BasicData Science Operations
1. Data Exploration and Summarization:
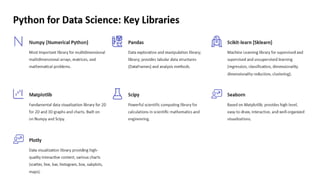
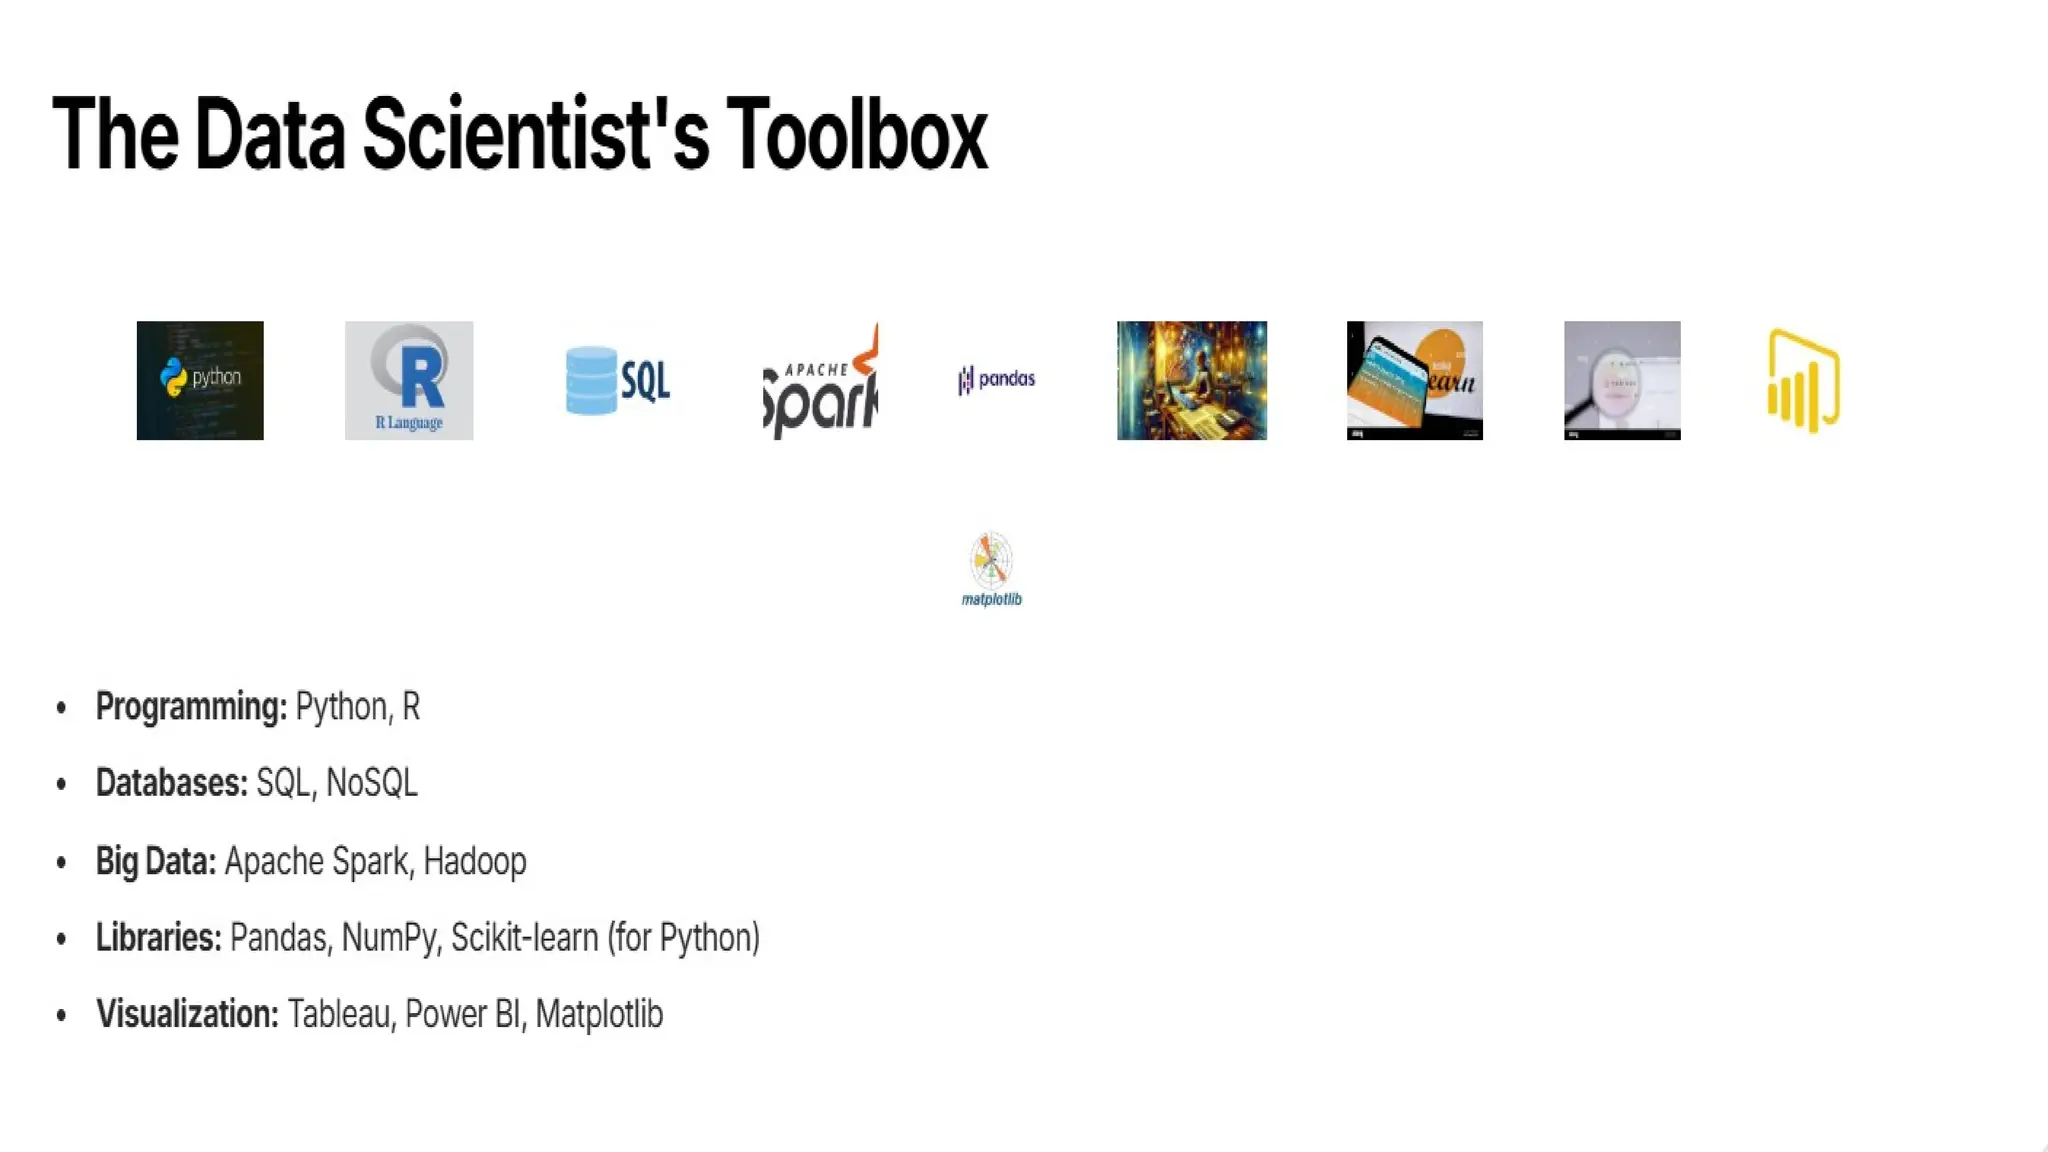
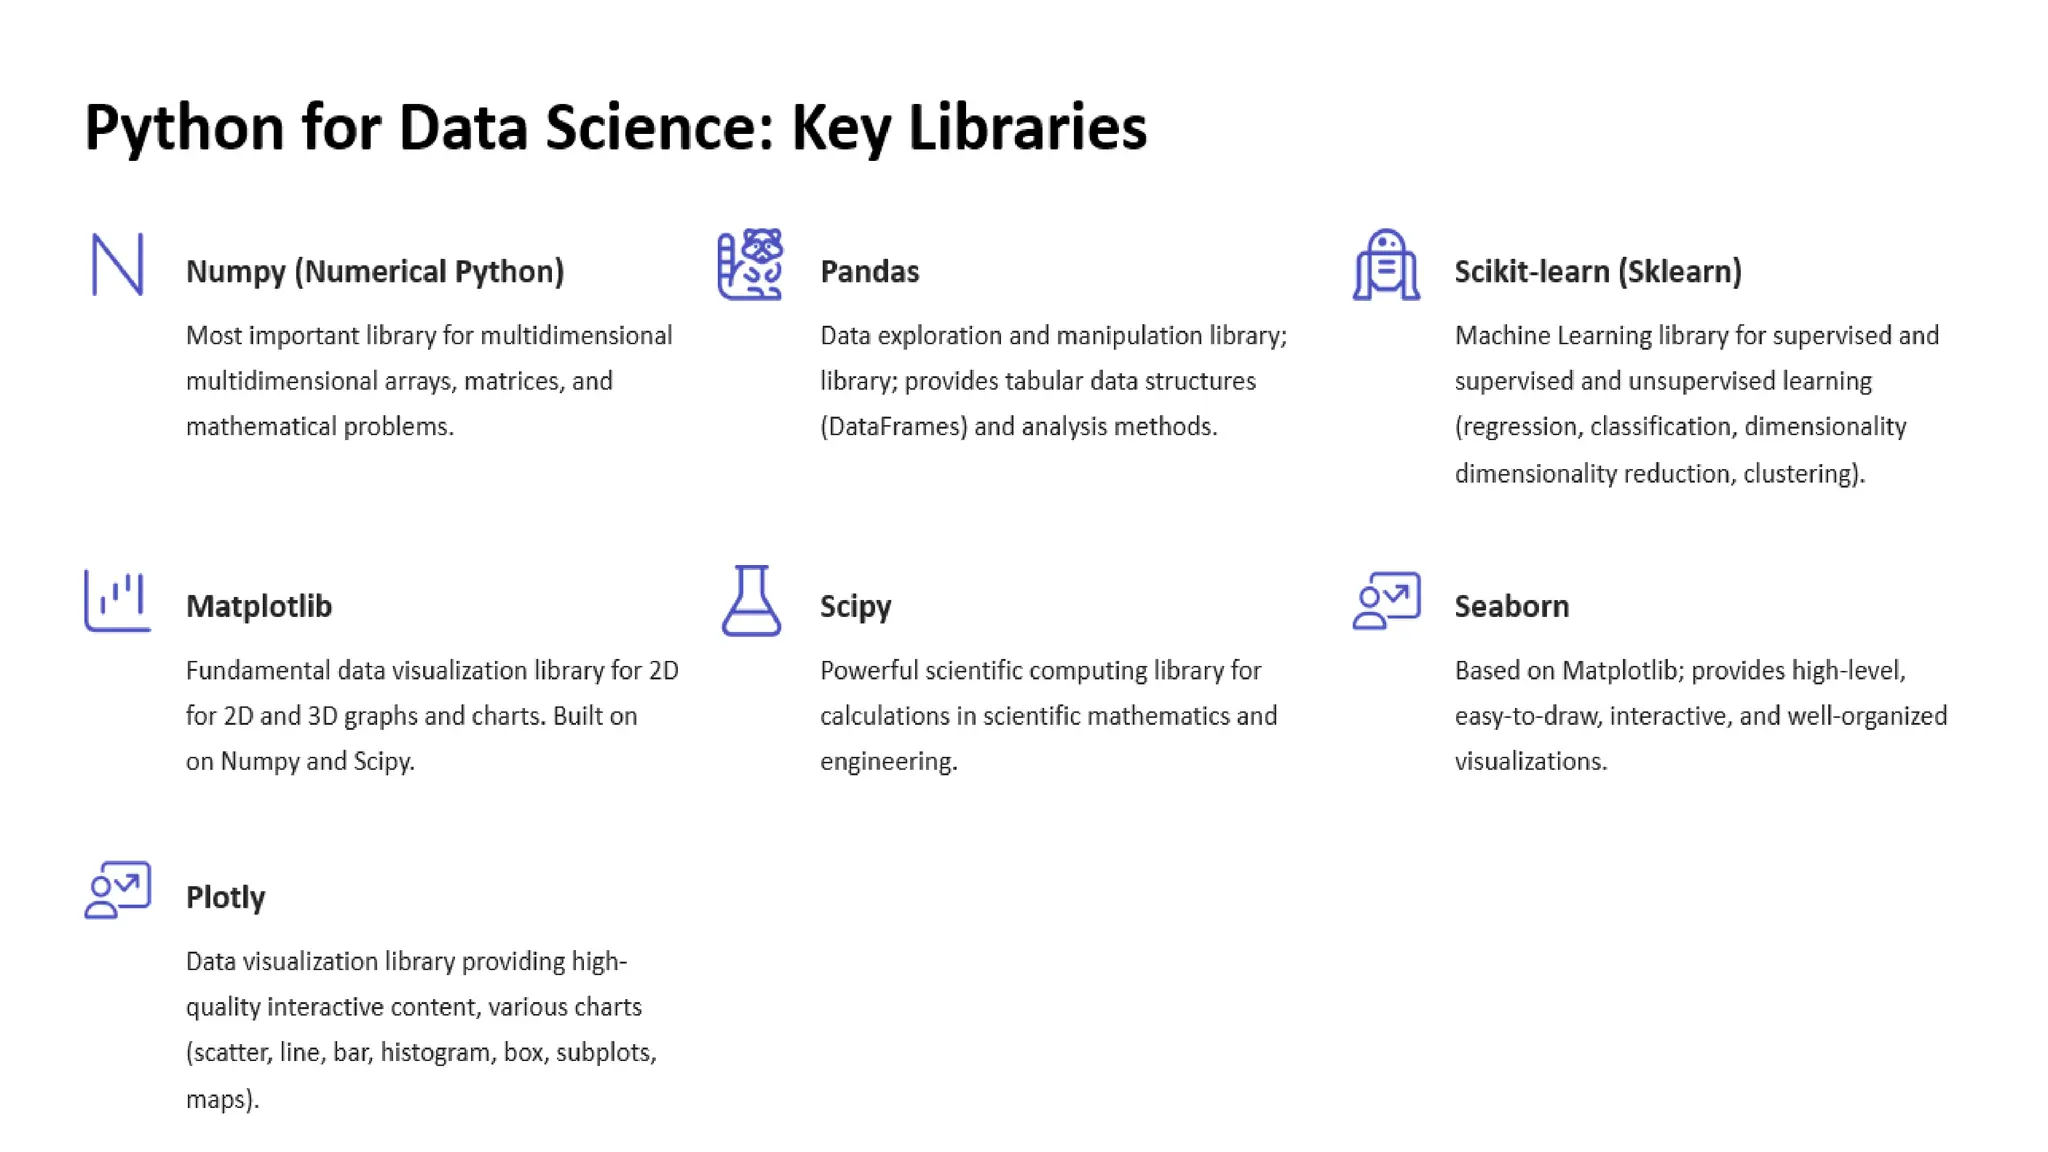
Core Libraries: Pandas, NumPy
Key Operations:
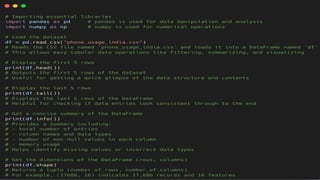
➢ Loading and Inspecting Data (Operation 1) -
You'll almost always start by loading a dataset (commonly from a CSV file) into a
Pandas DataFrame and performing initial inspections.
2. Data Cleaningand Preprocessing:
Raw data is rarely clean. We have to identify and handle common data quality issues.
Core Libraries: Pandas, NumPy
Key Operations:
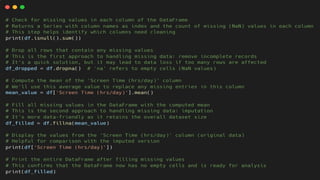
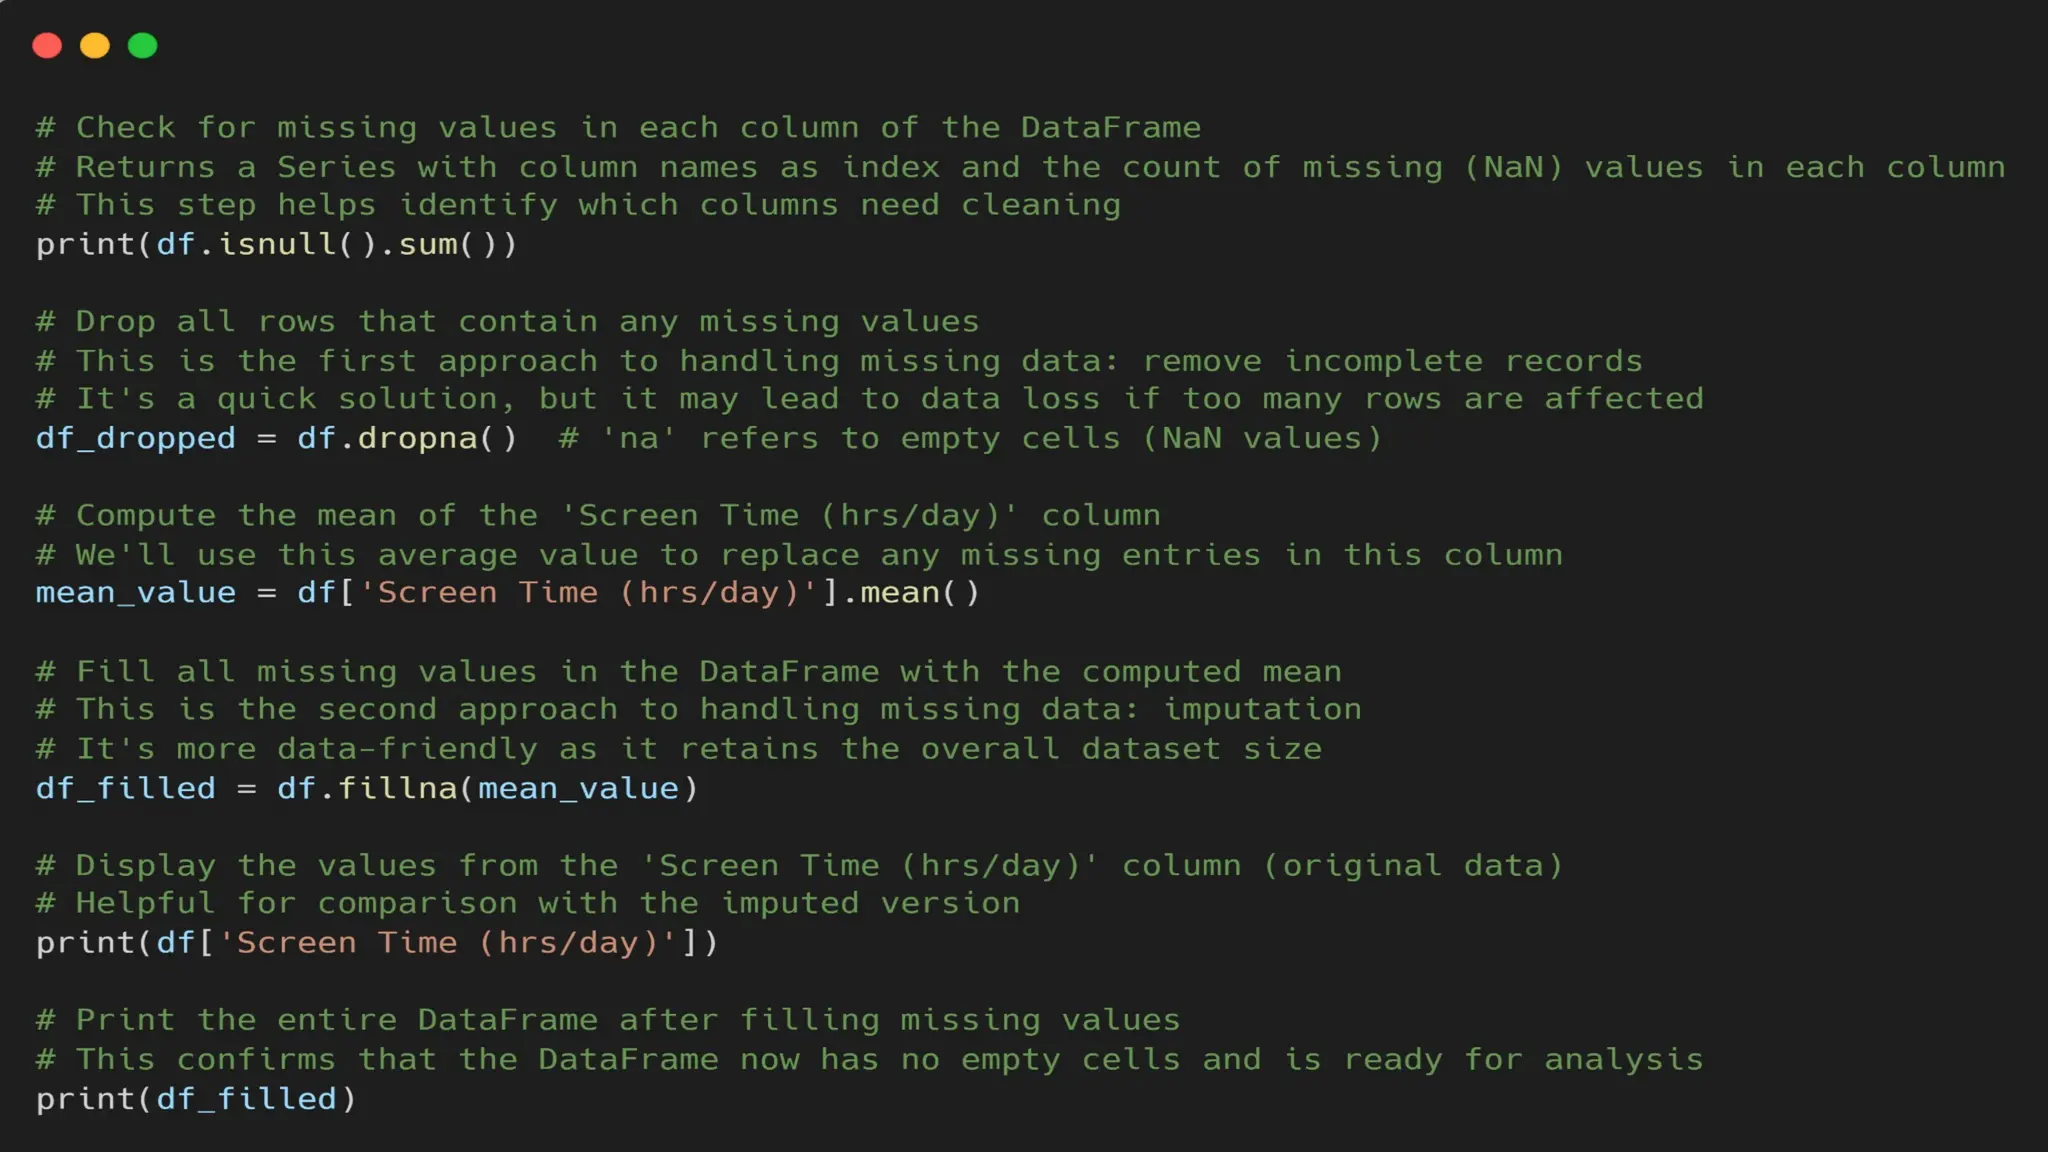
➢ Handling Missing Values (Operation 1) -
This is one of the most common data cleaning tasks.
16.
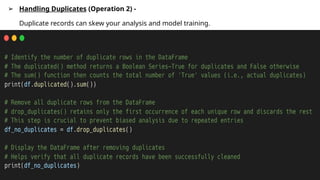
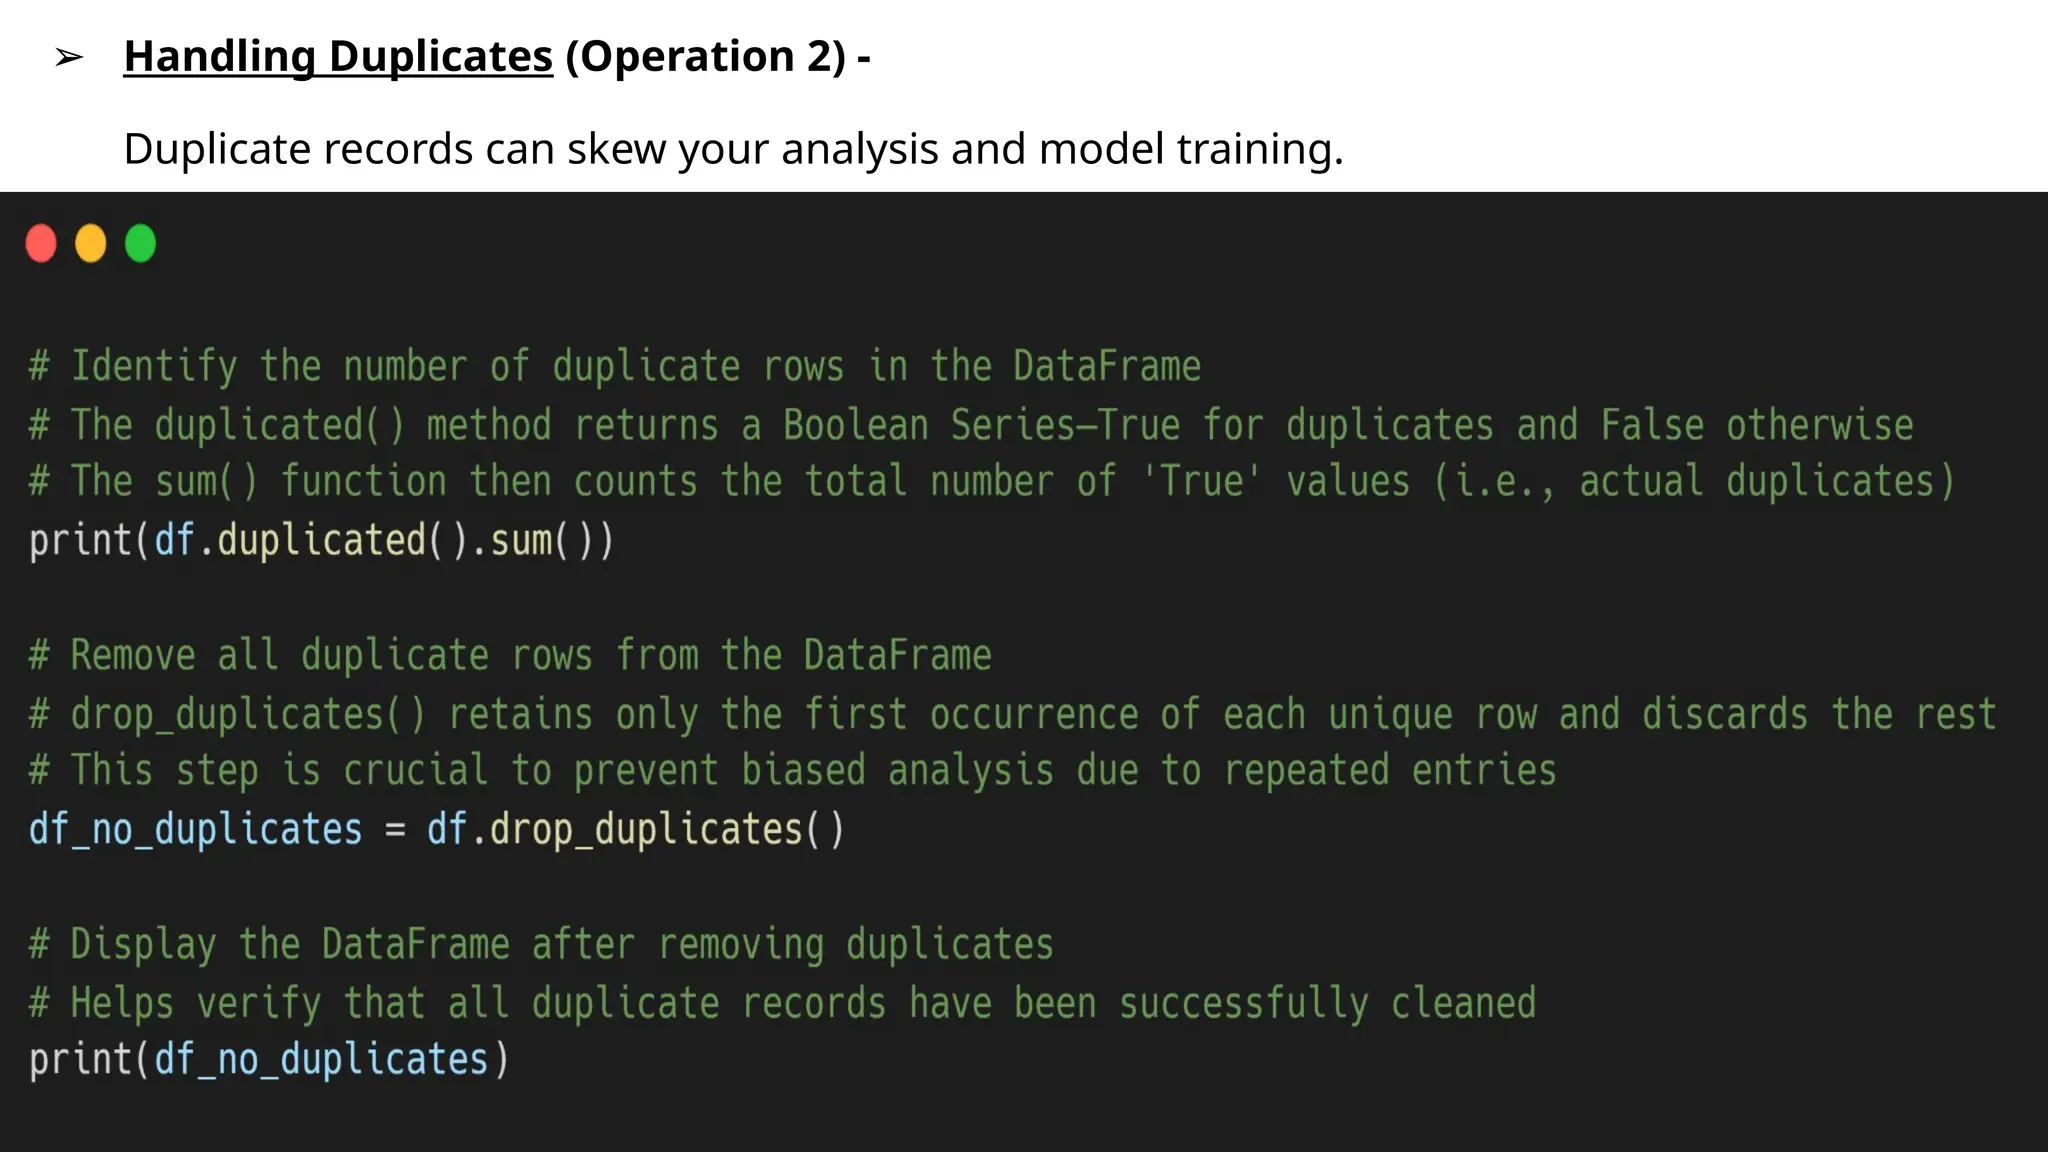
➢ Handling Duplicates(Operation 2) -
Duplicate records can skew your analysis and model training.
17.
3. Data Selectionand Manipulation:
You'll often need to select specific subsets of your data or manipulate it to create new
columns or structures.
Core Libraries: Pandas
Key Operations:
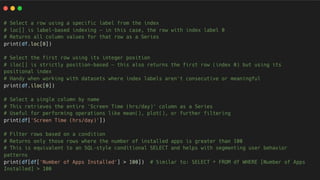
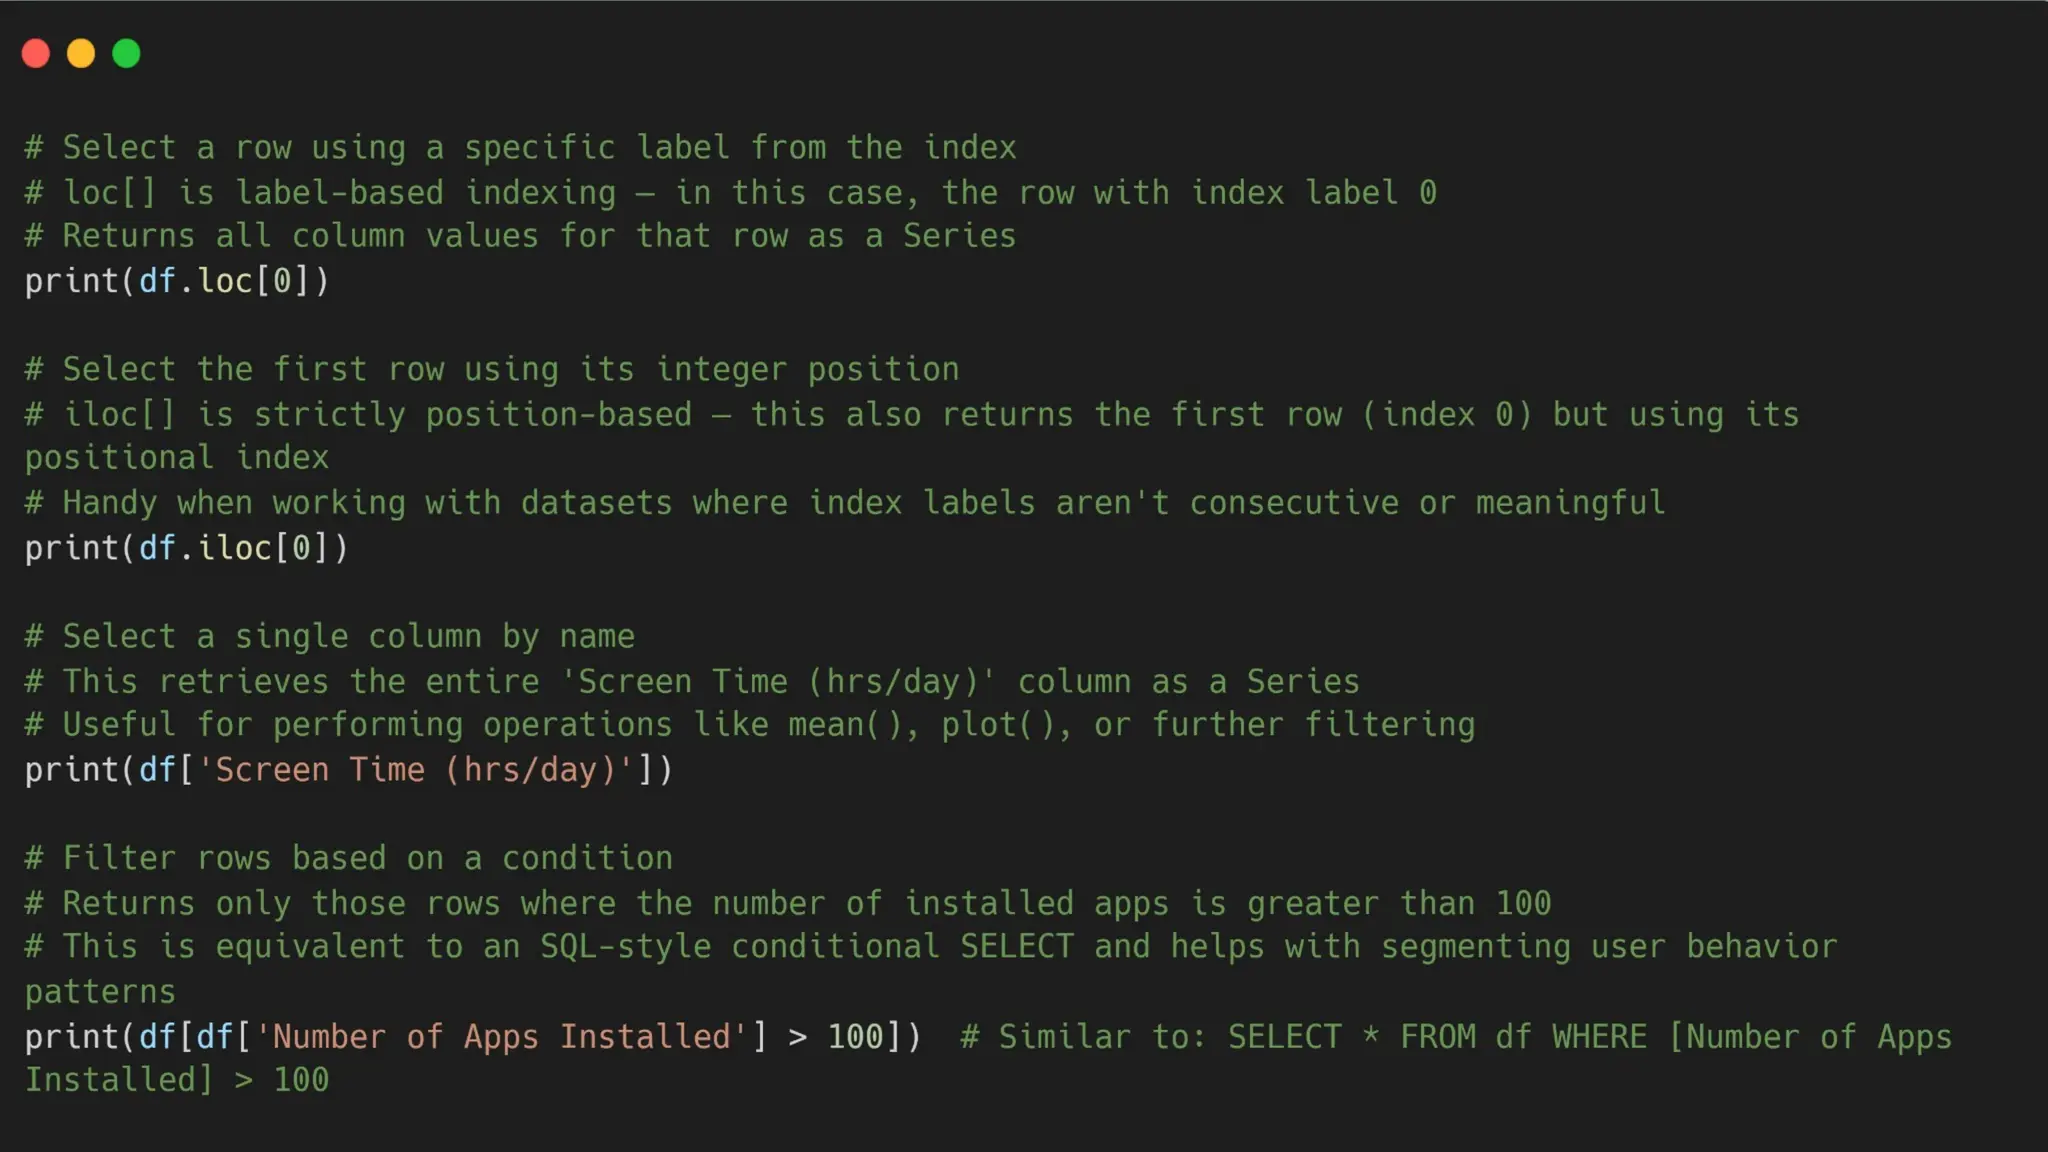
➢ Selecting Data with loc and iloc (Operation 1) -
Understanding the difference between label-based indexing (loc) and integer-based
indexing (iloc) is fundamental.
19.
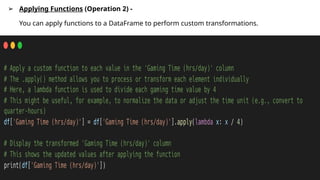
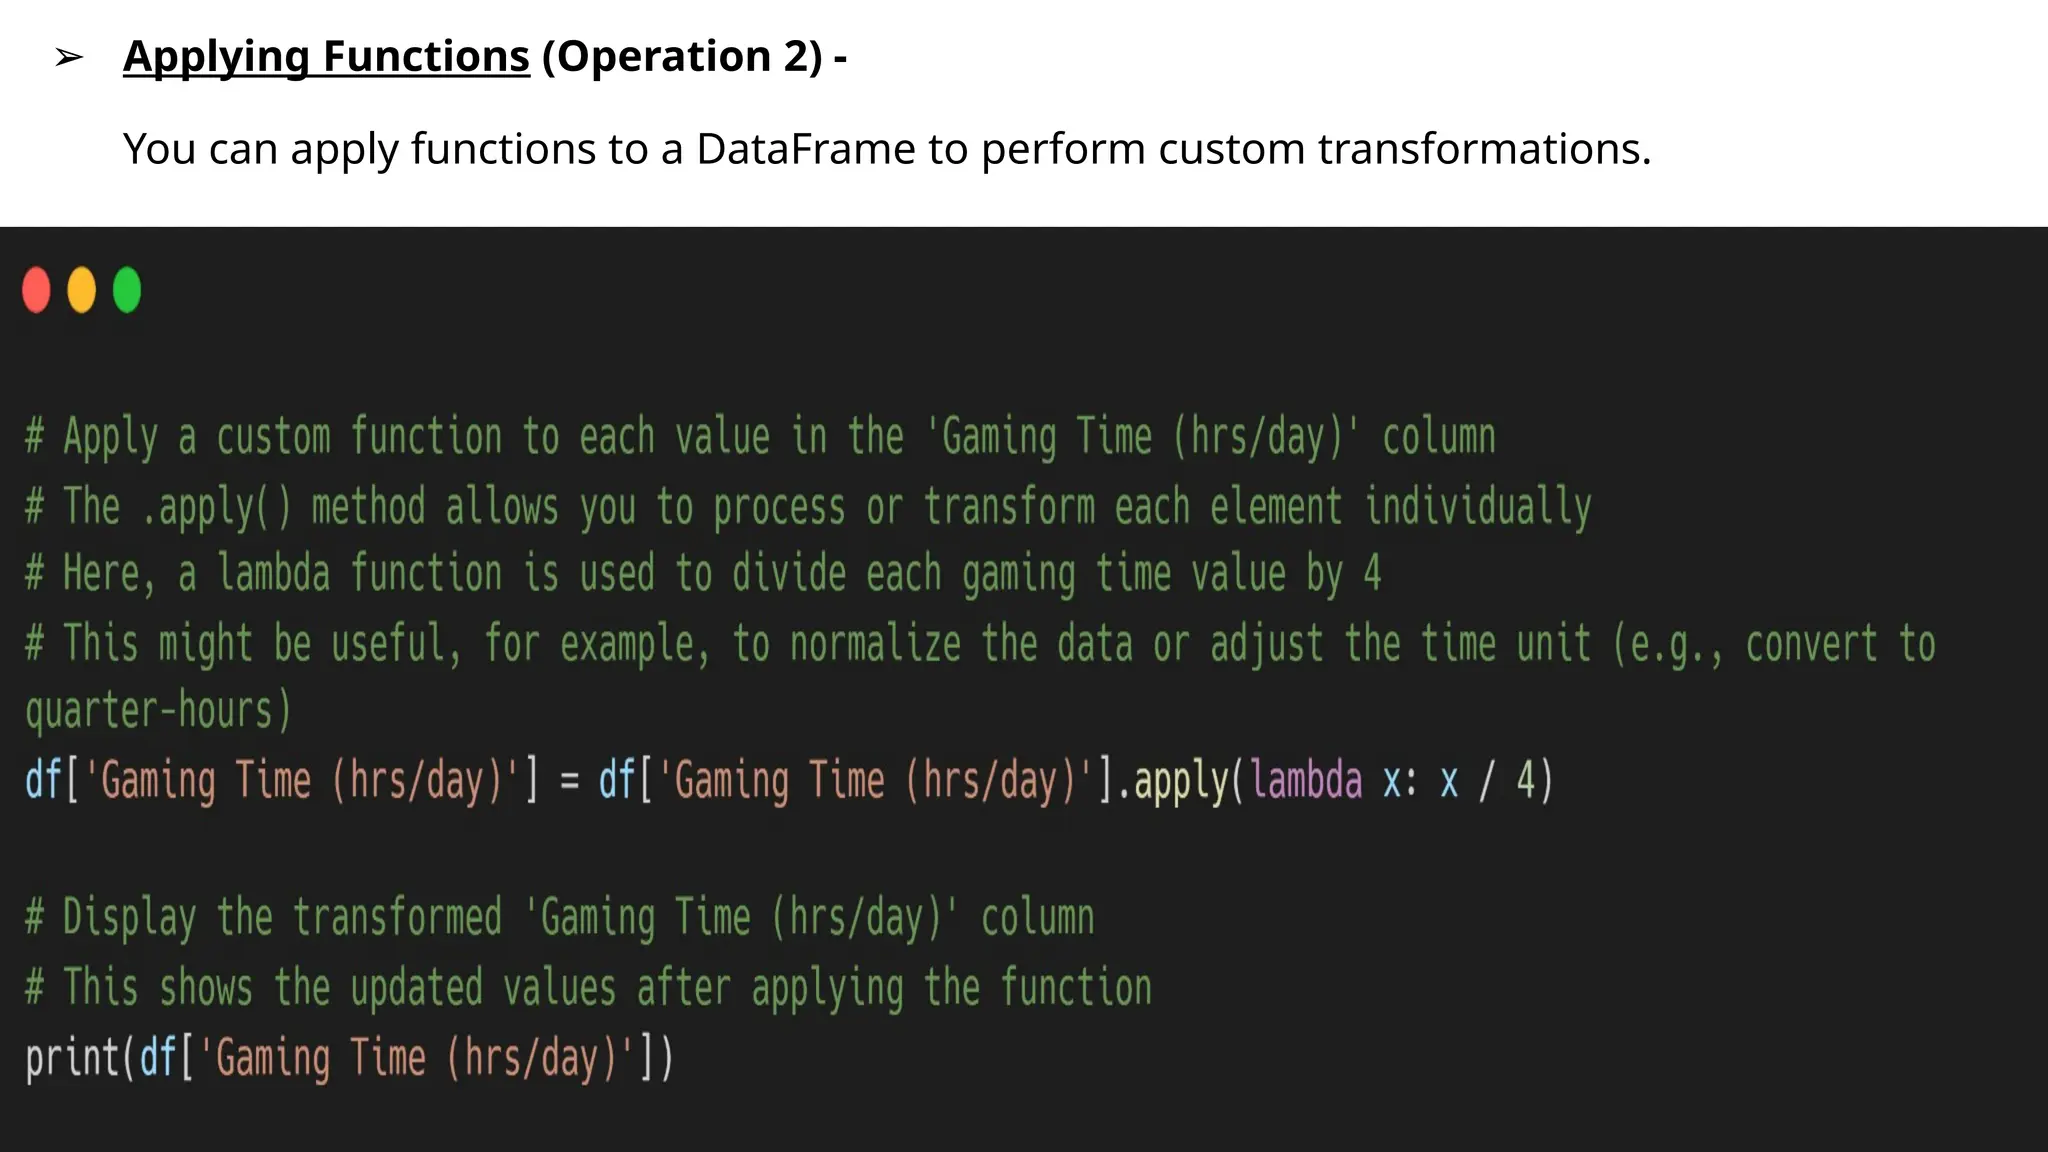
➢ Applying Functions(Operation 2) -
You can apply functions to a DataFrame to perform custom transformations.
20.
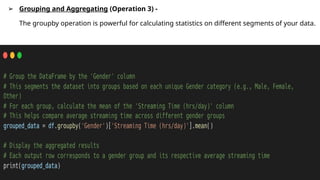
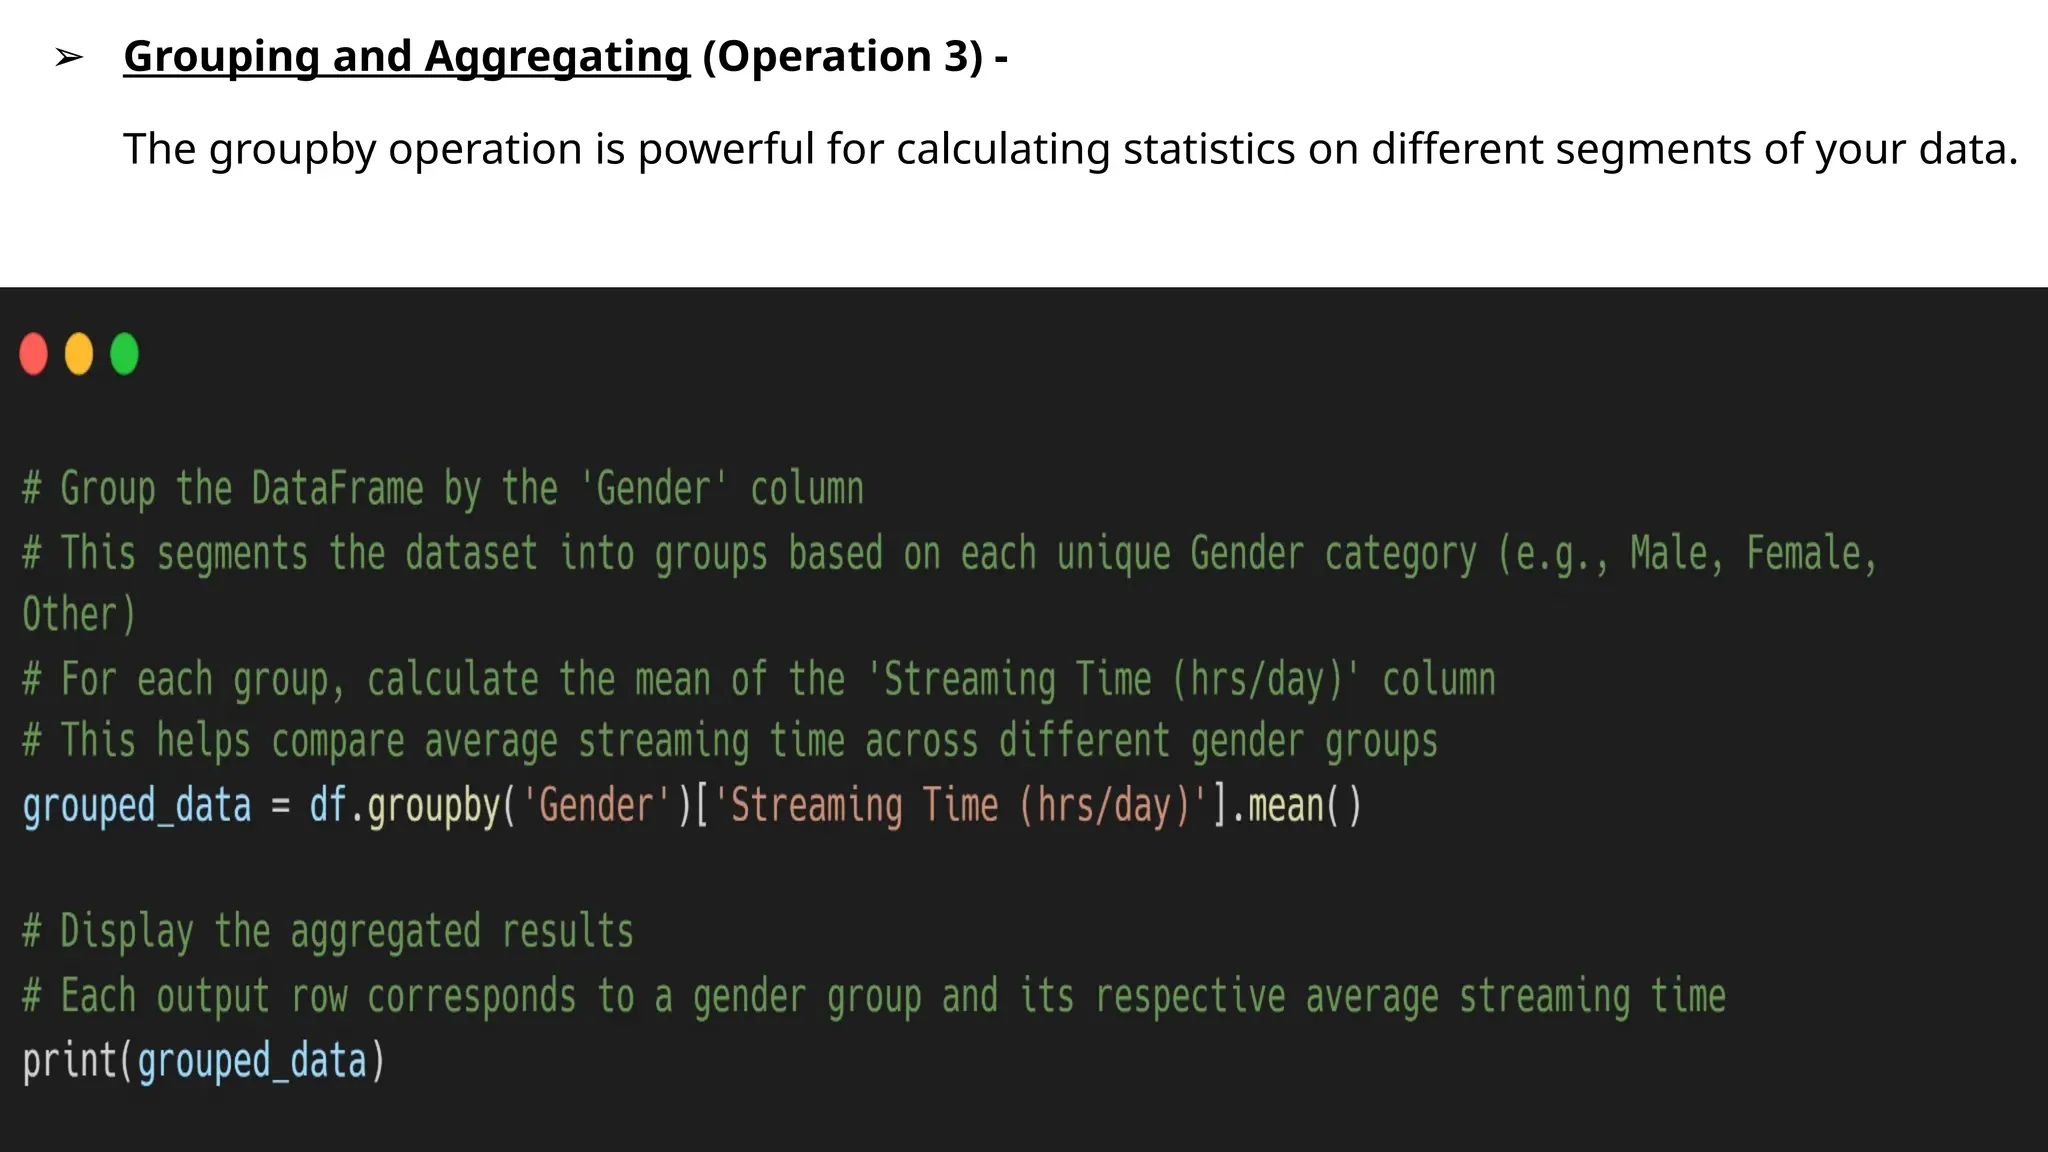
➢ Grouping andAggregating (Operation 3) -
The groupby operation is powerful for calculating statistics on different segments of your data.
21.
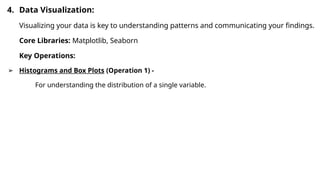
4. Data Visualization:
Visualizingyour data is key to understanding patterns and communicating your findings.
Core Libraries: Matplotlib, Seaborn
Key Operations:
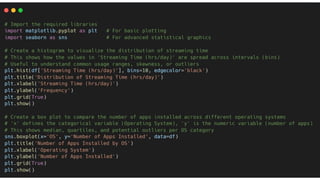
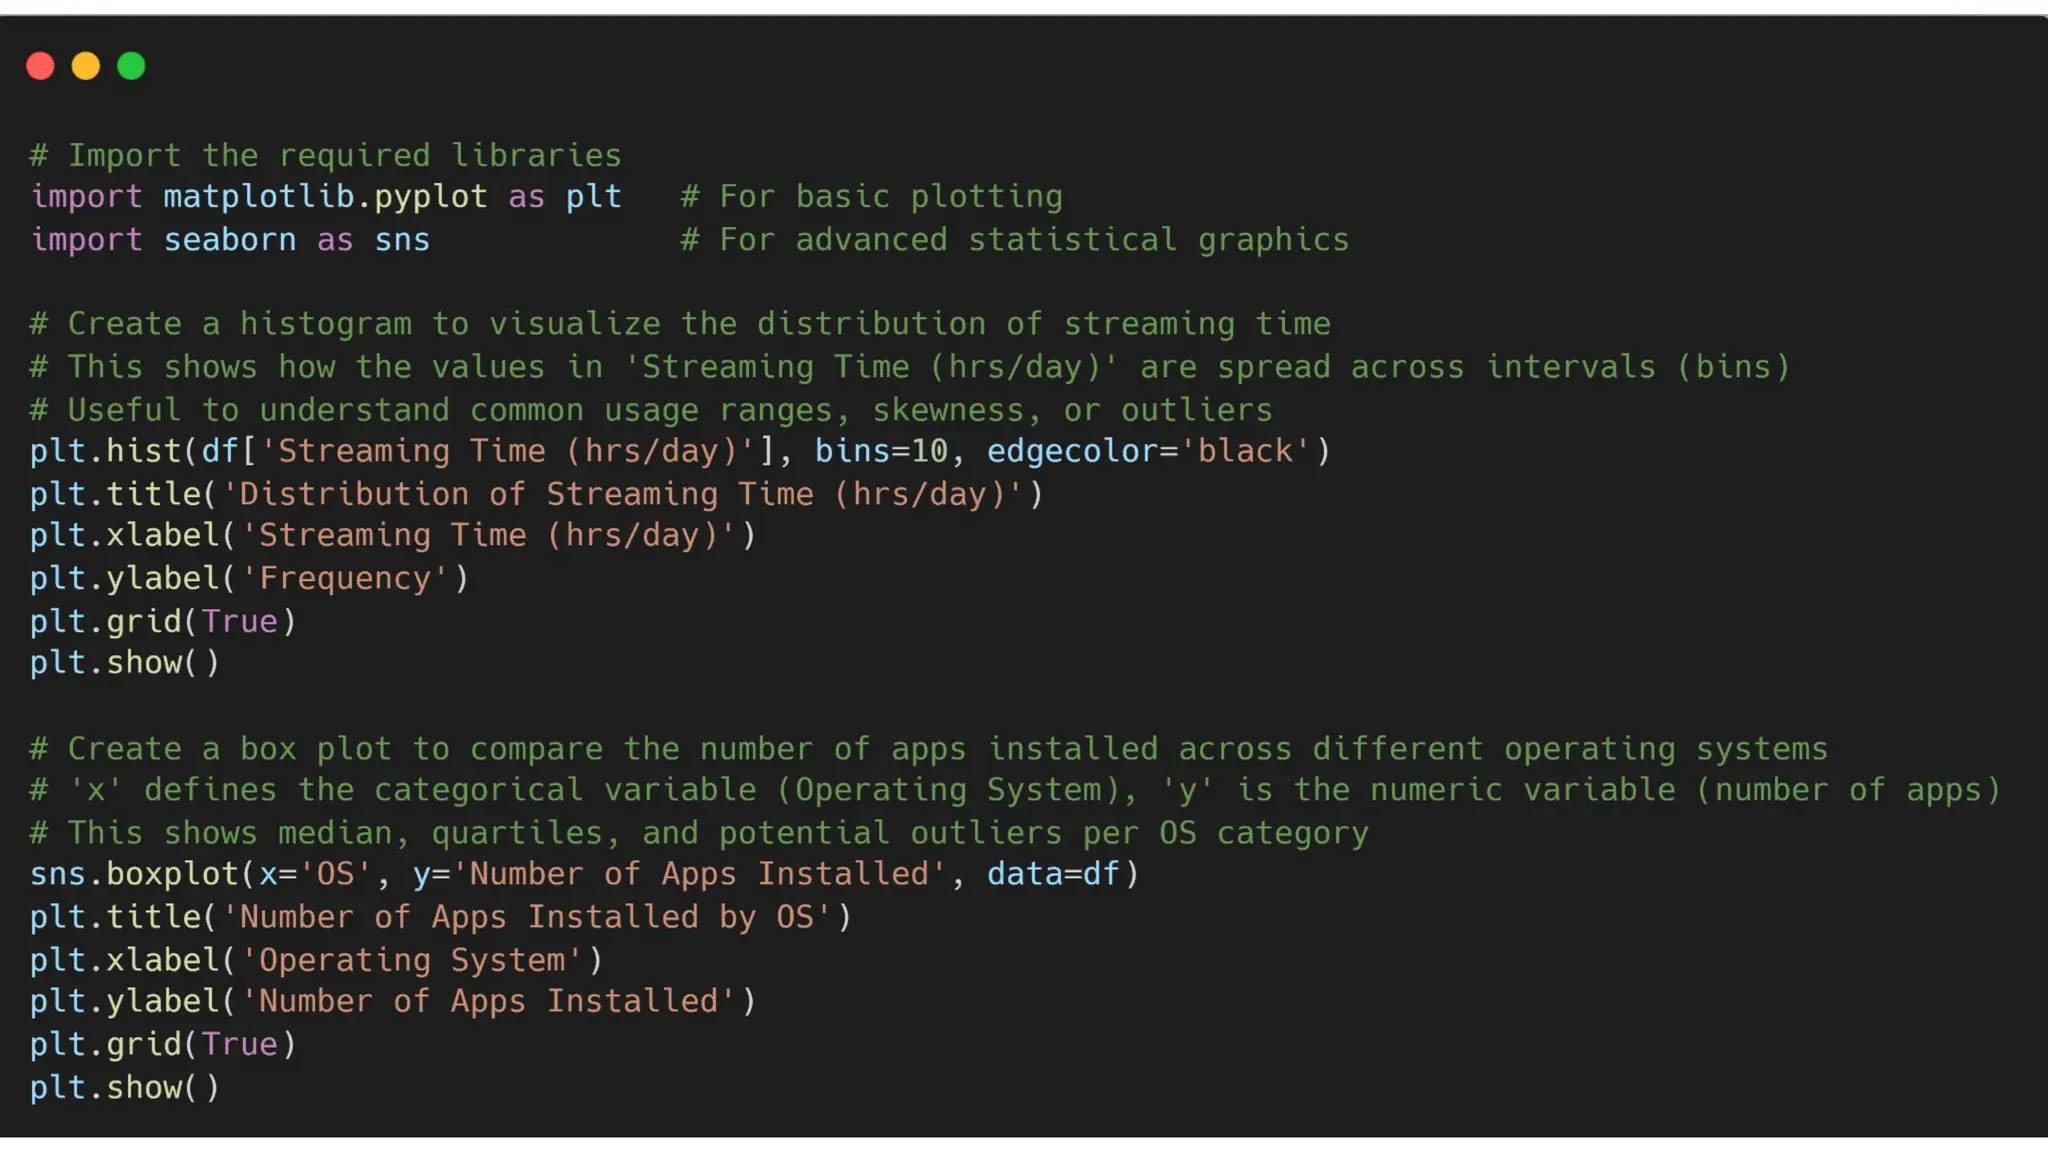
➢ Histograms and Box Plots (Operation 1) -
For understanding the distribution of a single variable.
23.
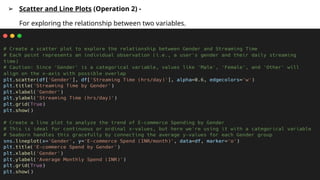
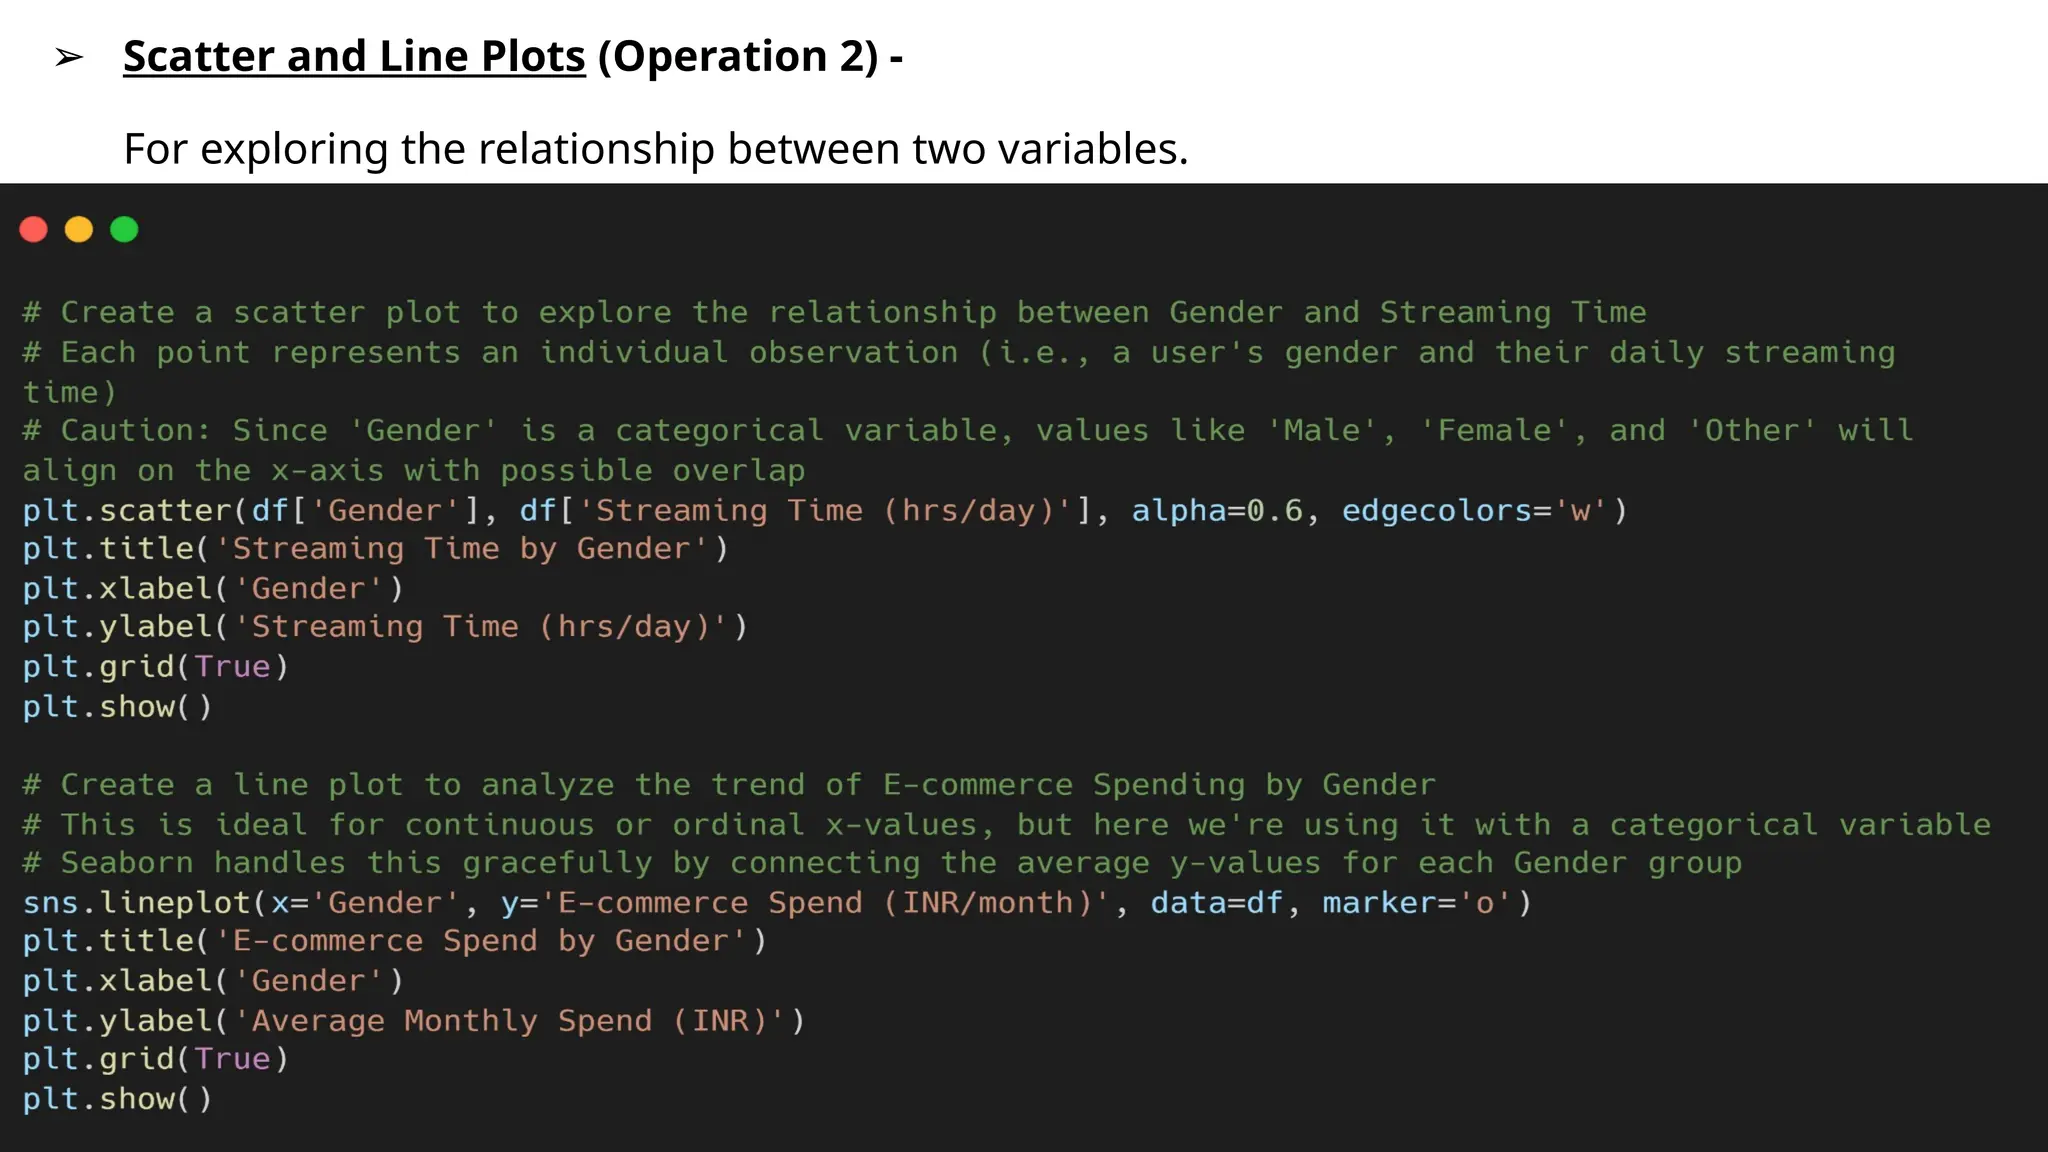
➢ Scatter andLine Plots (Operation 2) -
For exploring the relationship between two variables.