Downloaded 6,189 times


The document provides an introduction to geographic information systems (GIS) and remote sensing. It discusses how GIS organizes and analyzes spatial data through data management, analysis, and visualization. It describes different data types including vector, raster, and imagery data. It also explains key concepts such as layers, modeling geospatial reality, and coding vector and raster data. The document outlines advantages and disadvantages of vector and raster data models. It introduces remote sensing and describes platforms and sensors used to collect spatial data from aircraft and satellites.
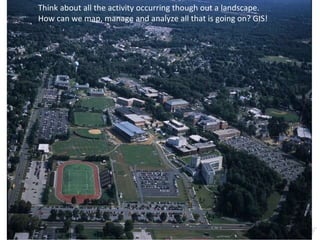
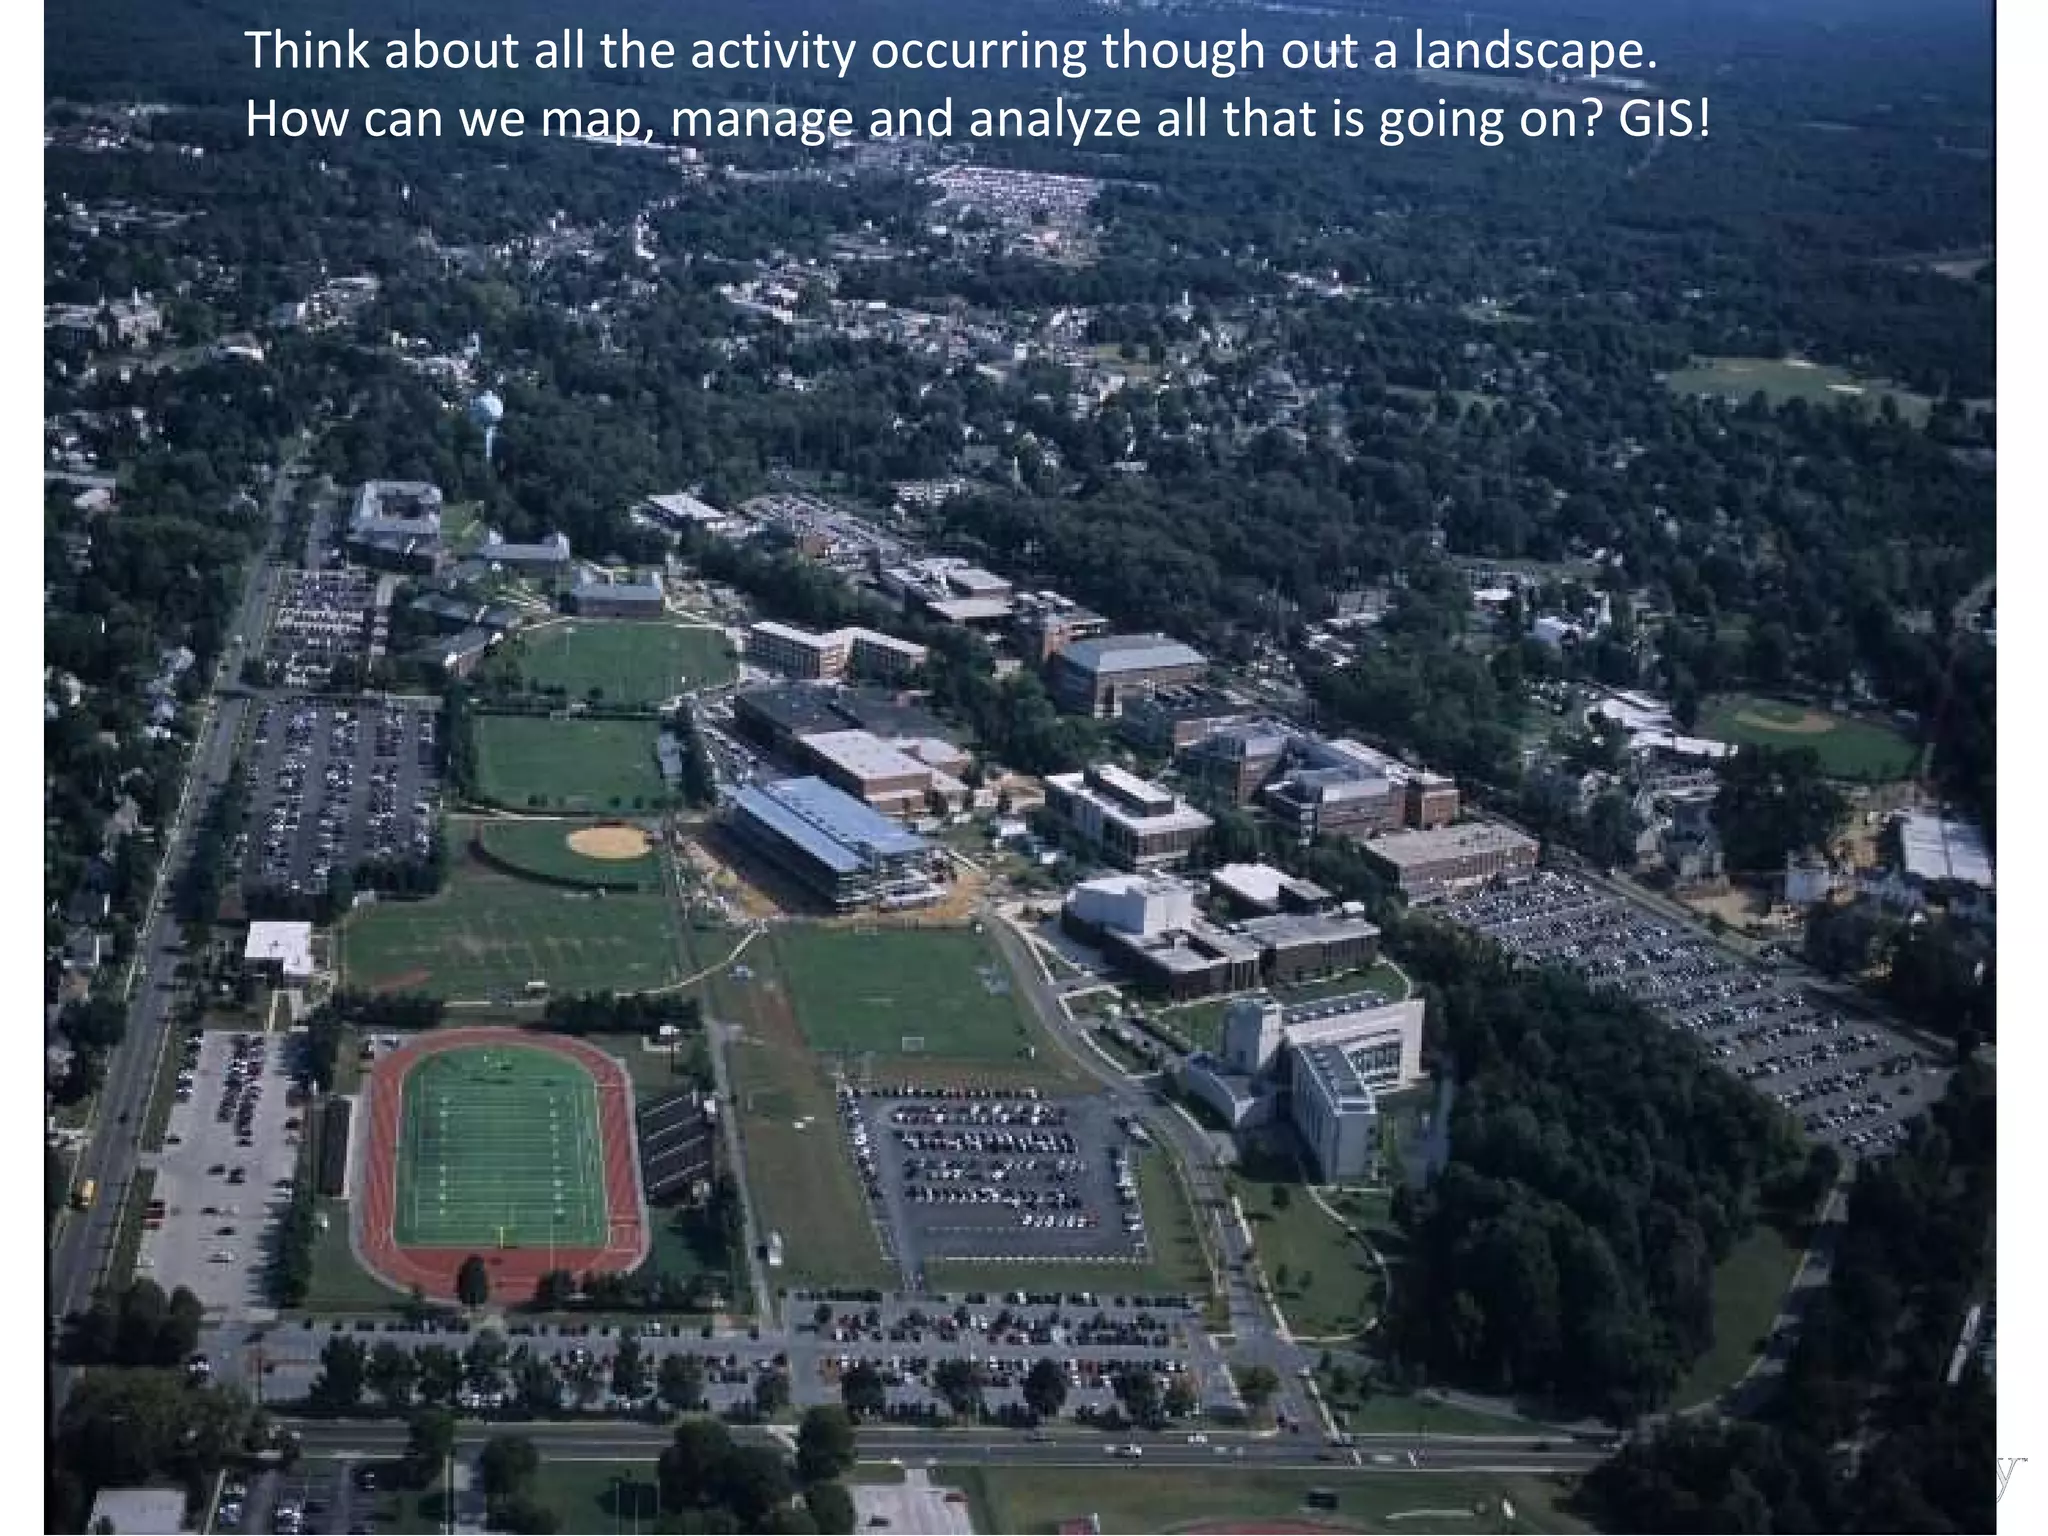
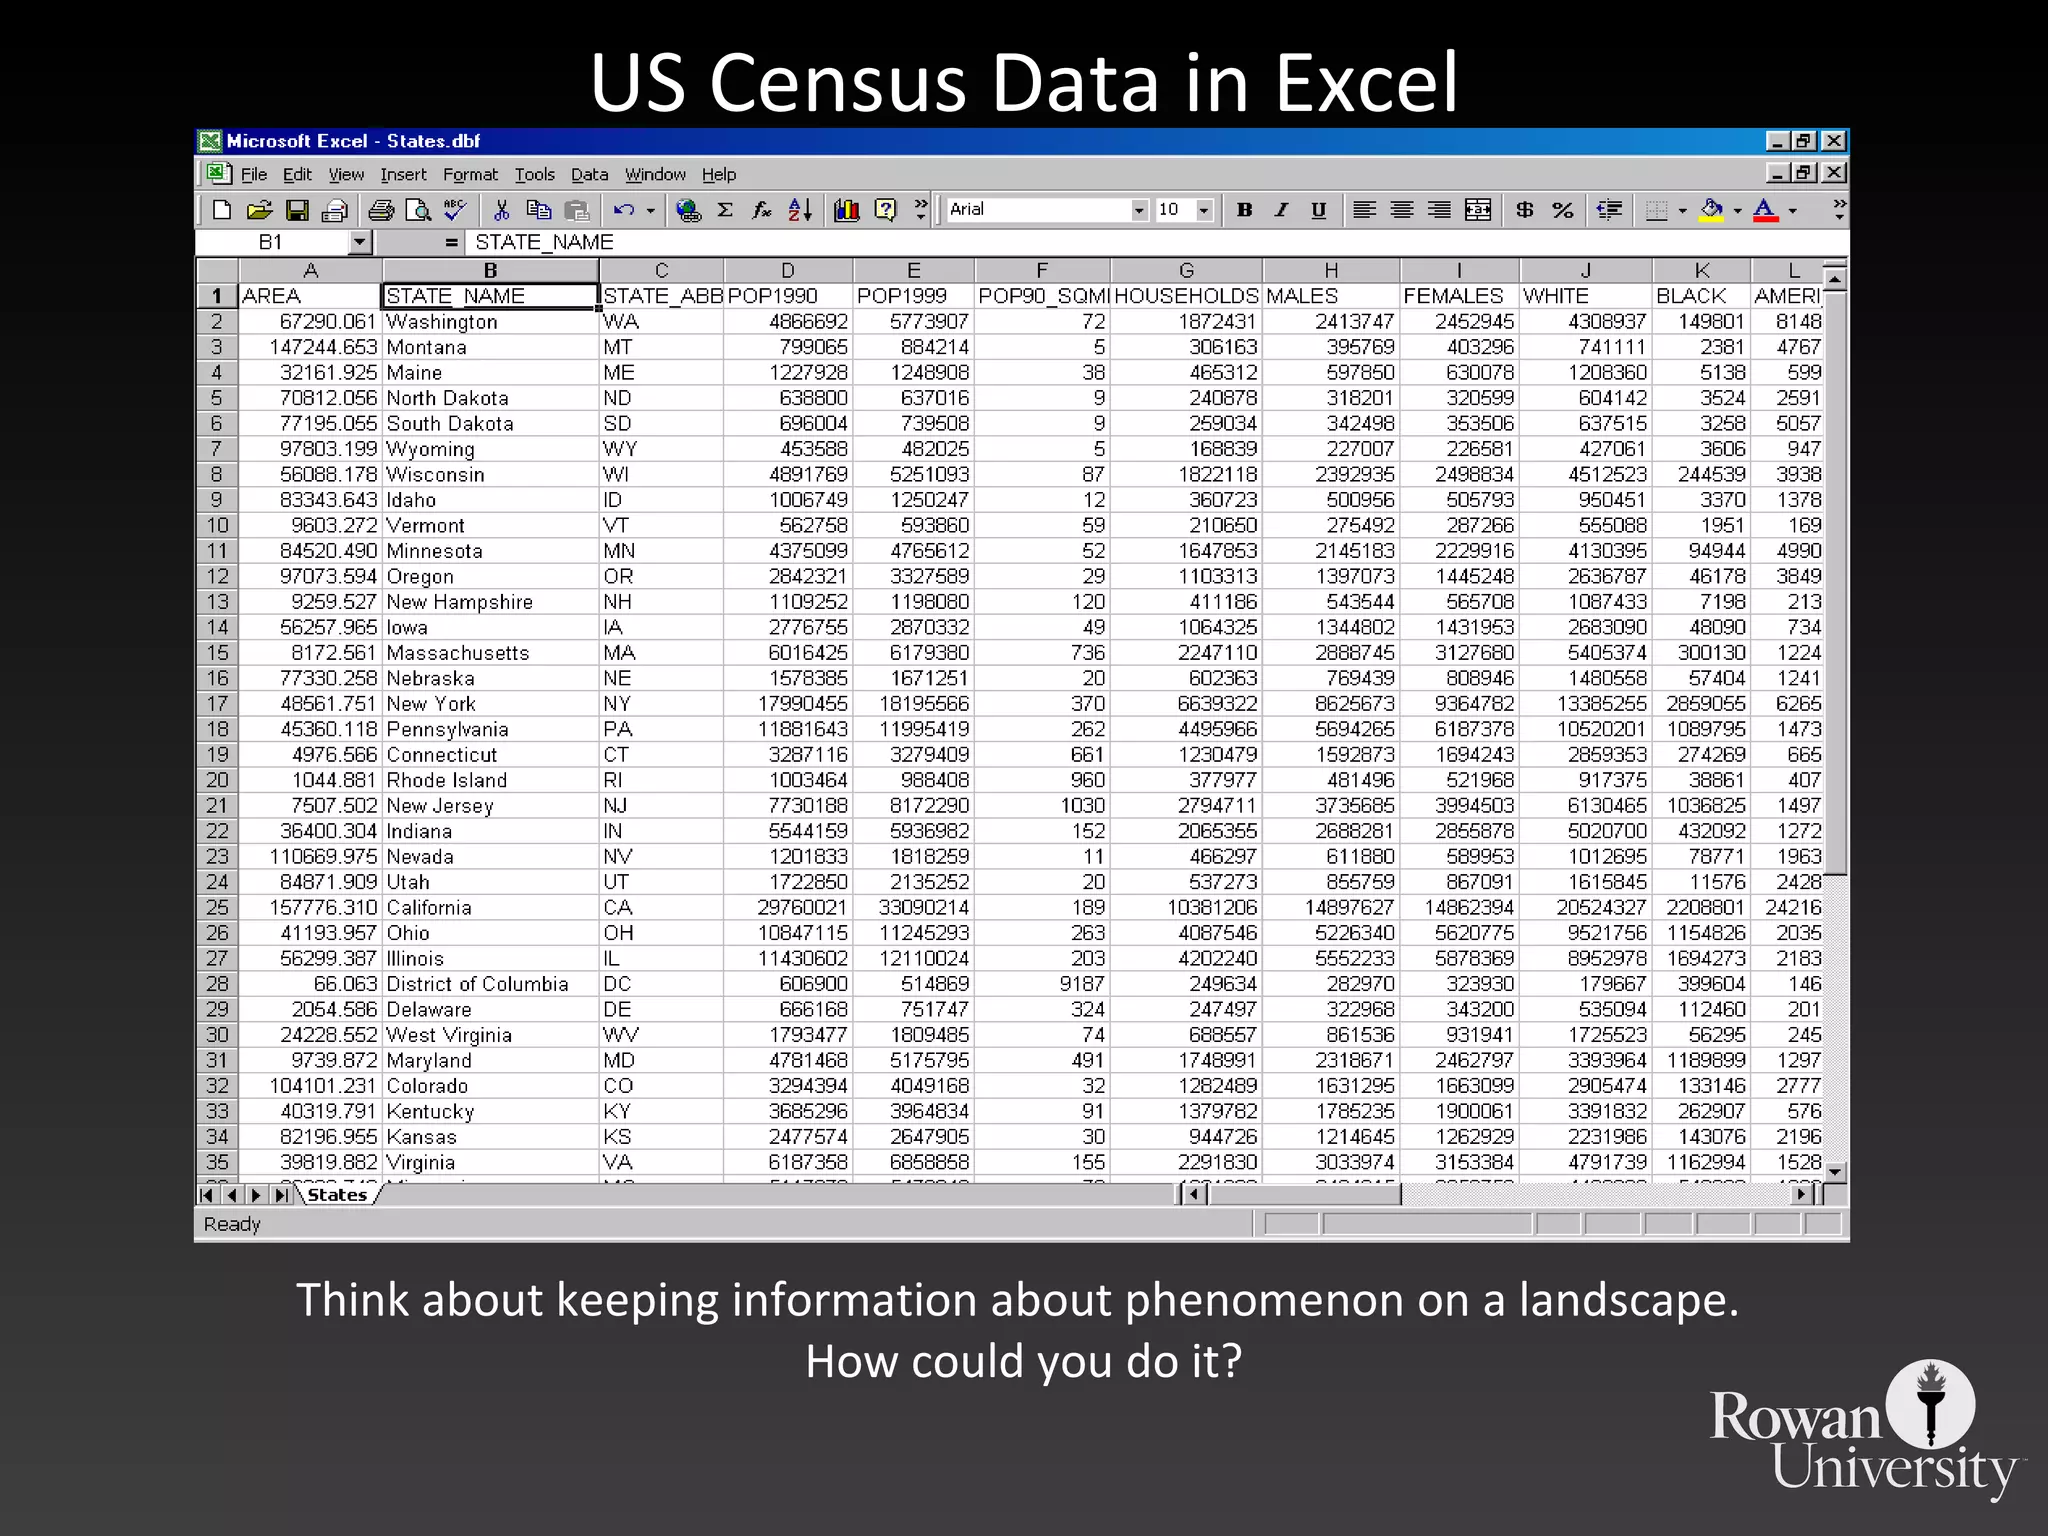
Introduces GIS as a tool for mapping and analyzing landscape activities. Explains the importance of GIS in managing geographical information.
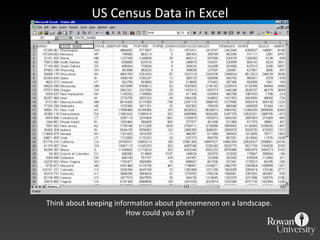
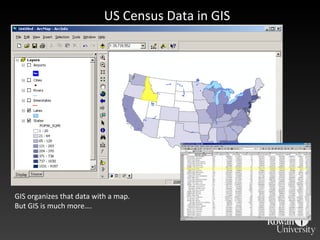
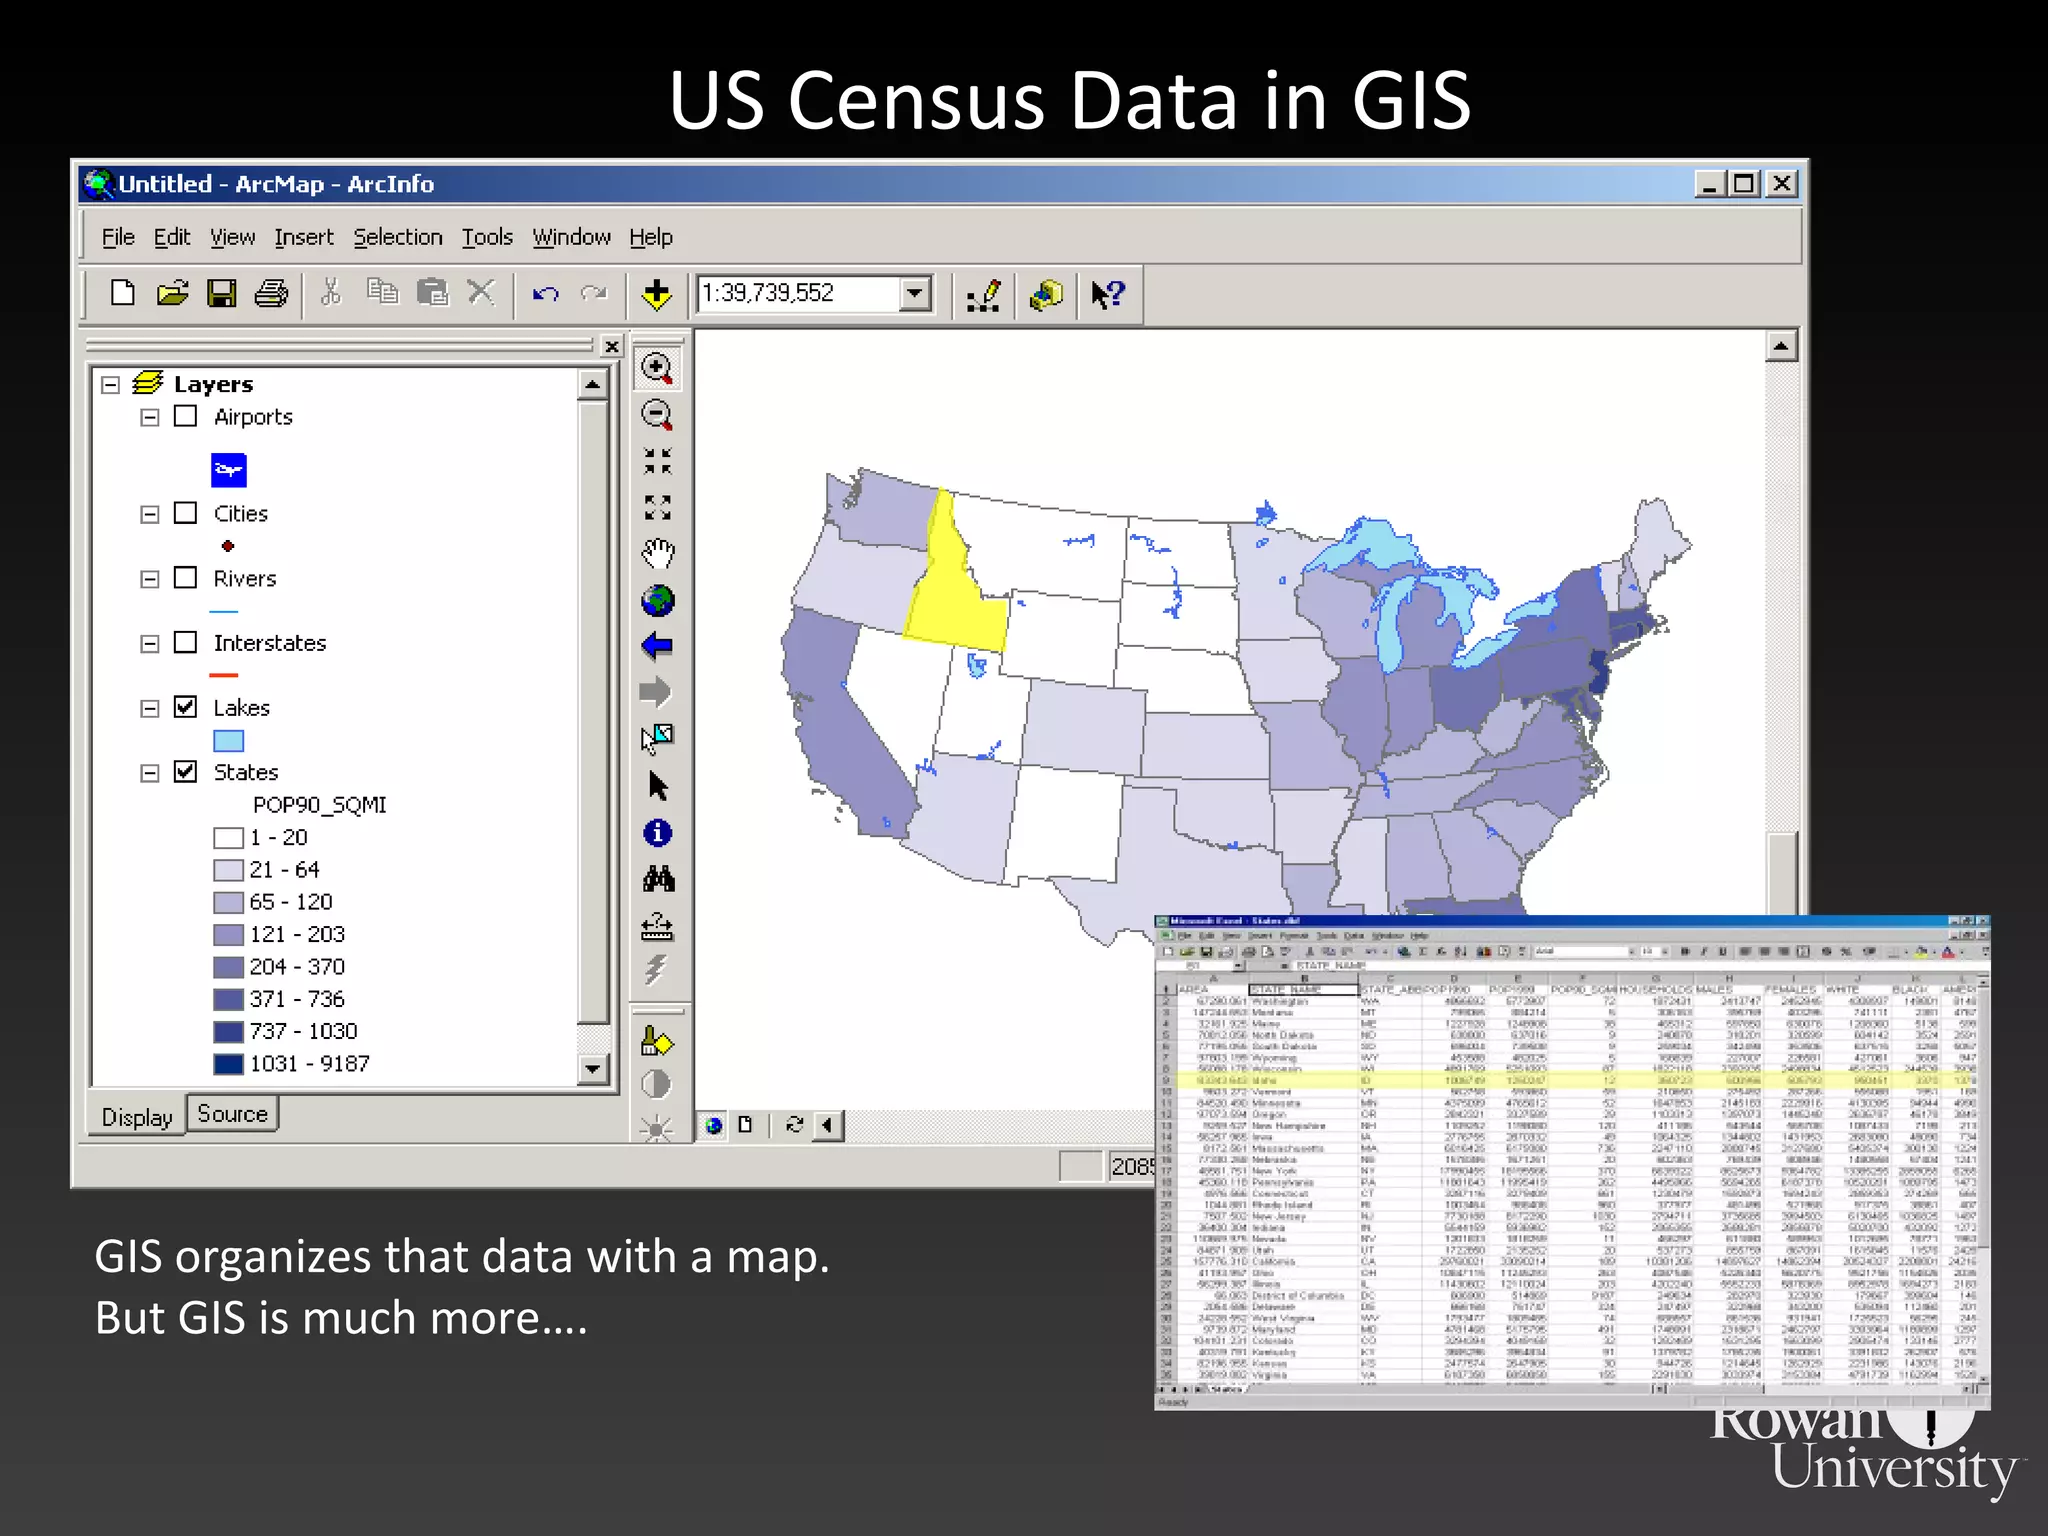
Highlights the significance of organizing Census data within GIS for better analysis while emphasizing the need for spatial data management.
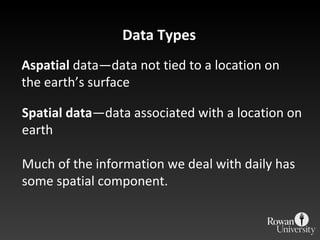
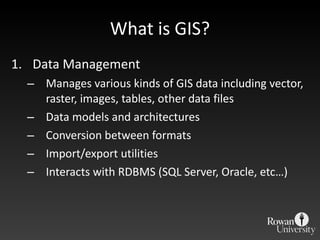
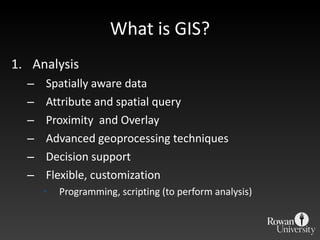
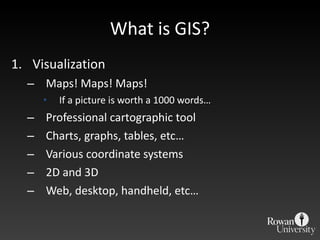
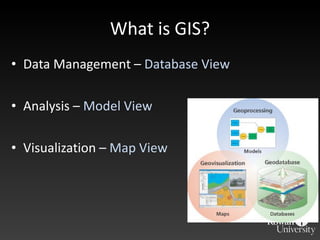
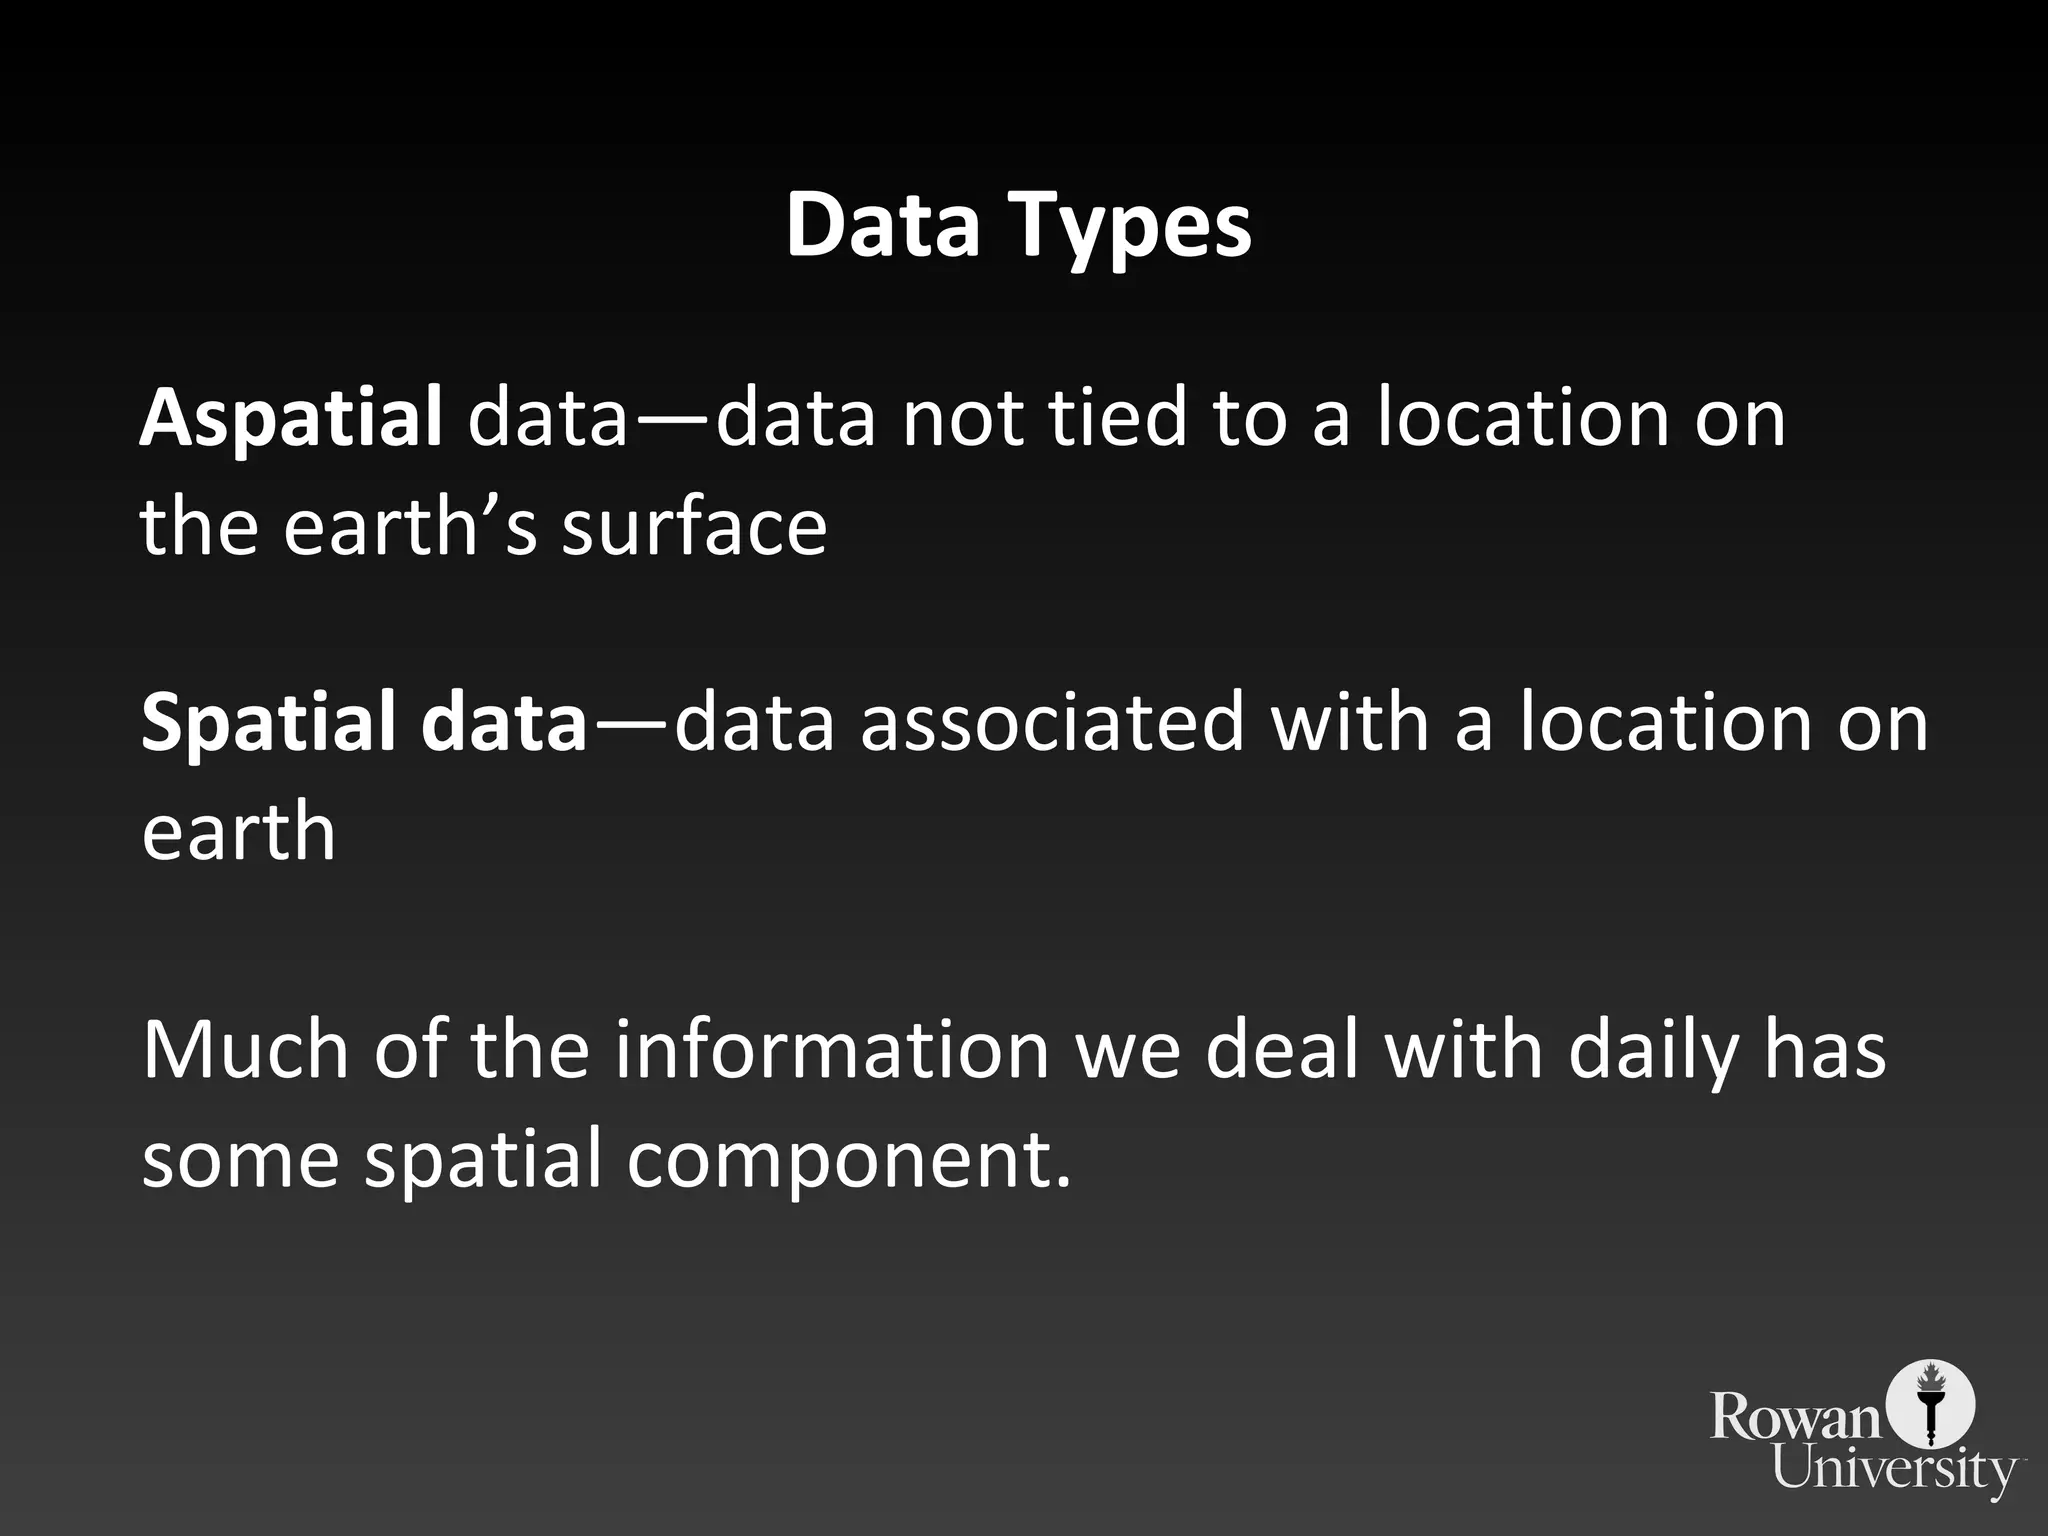
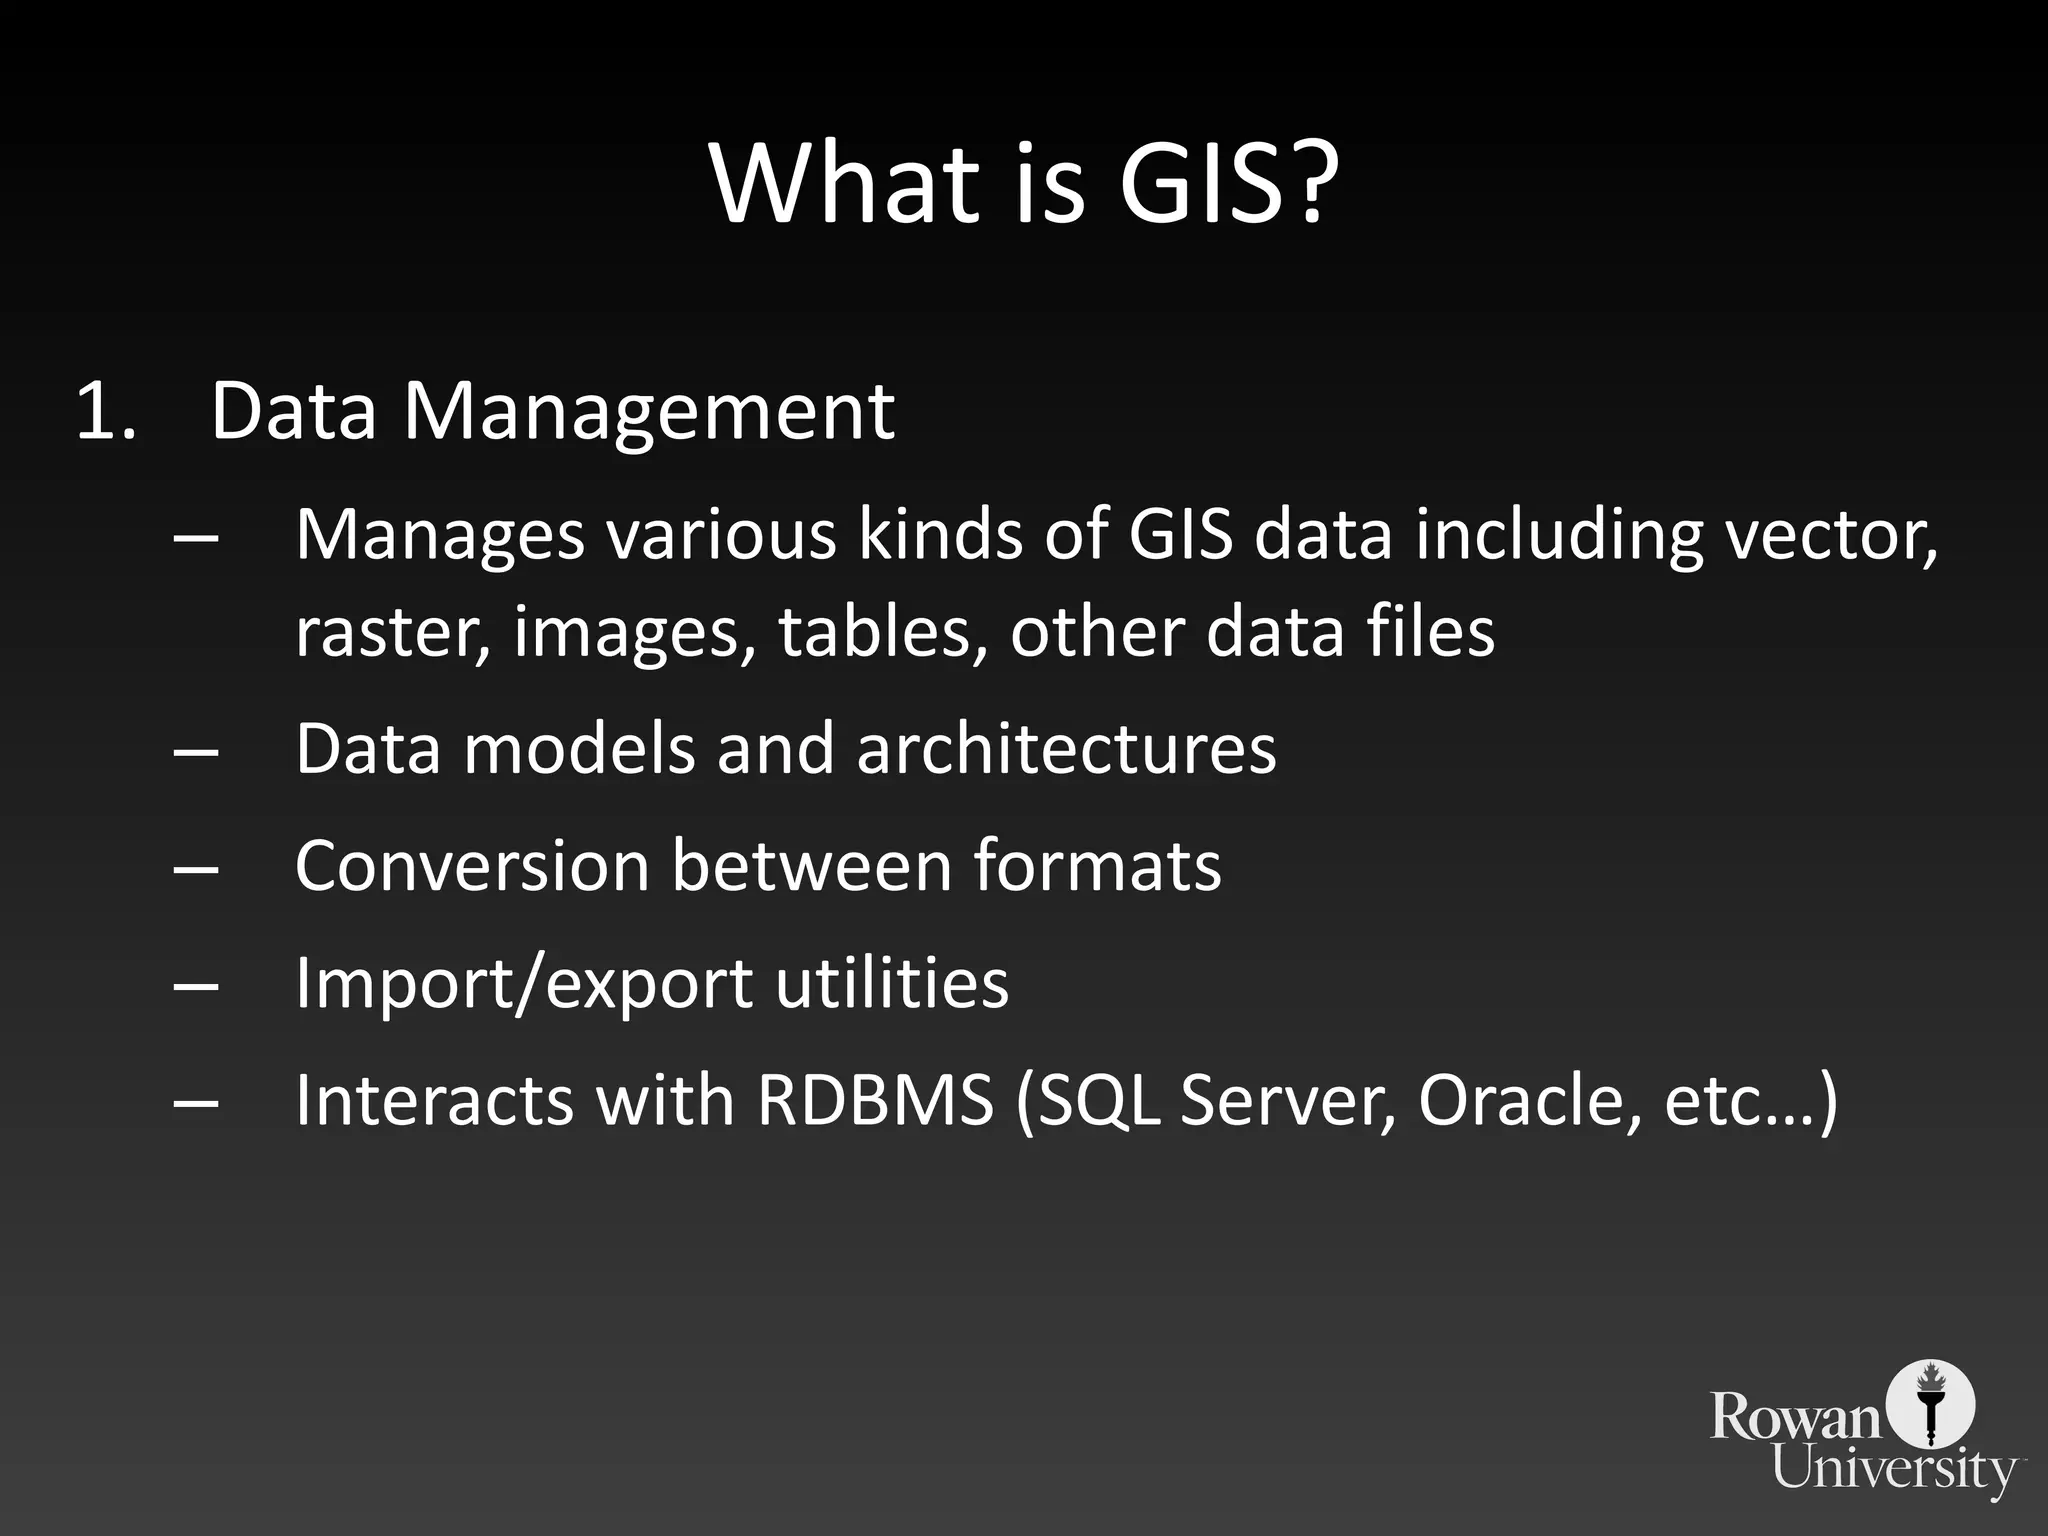
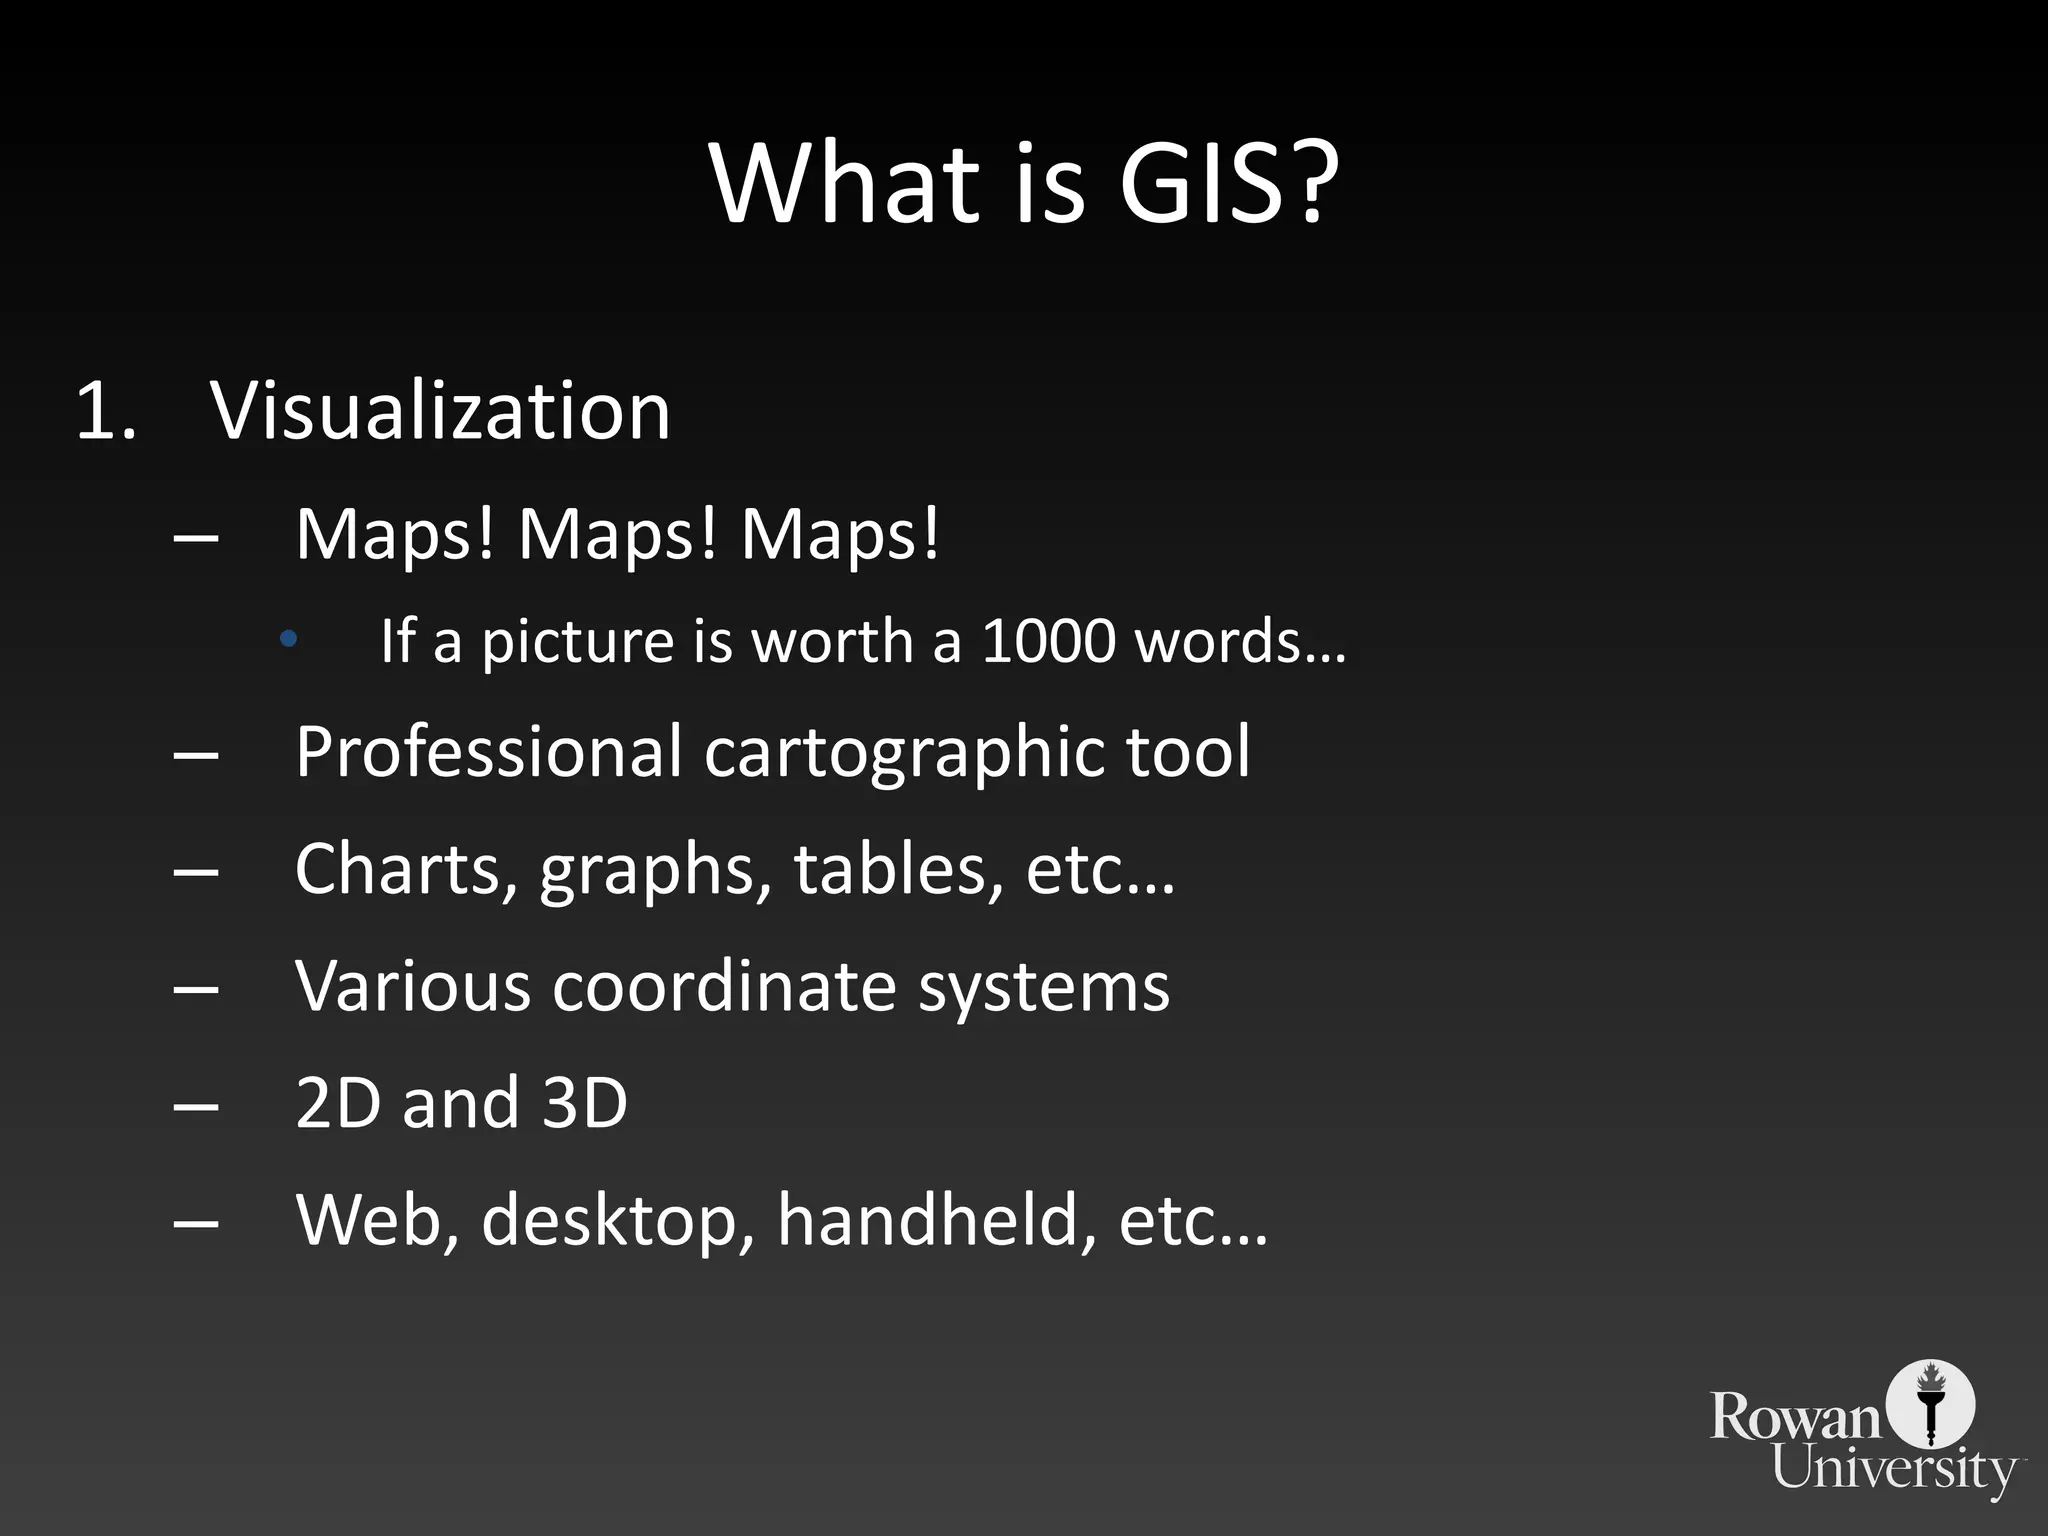
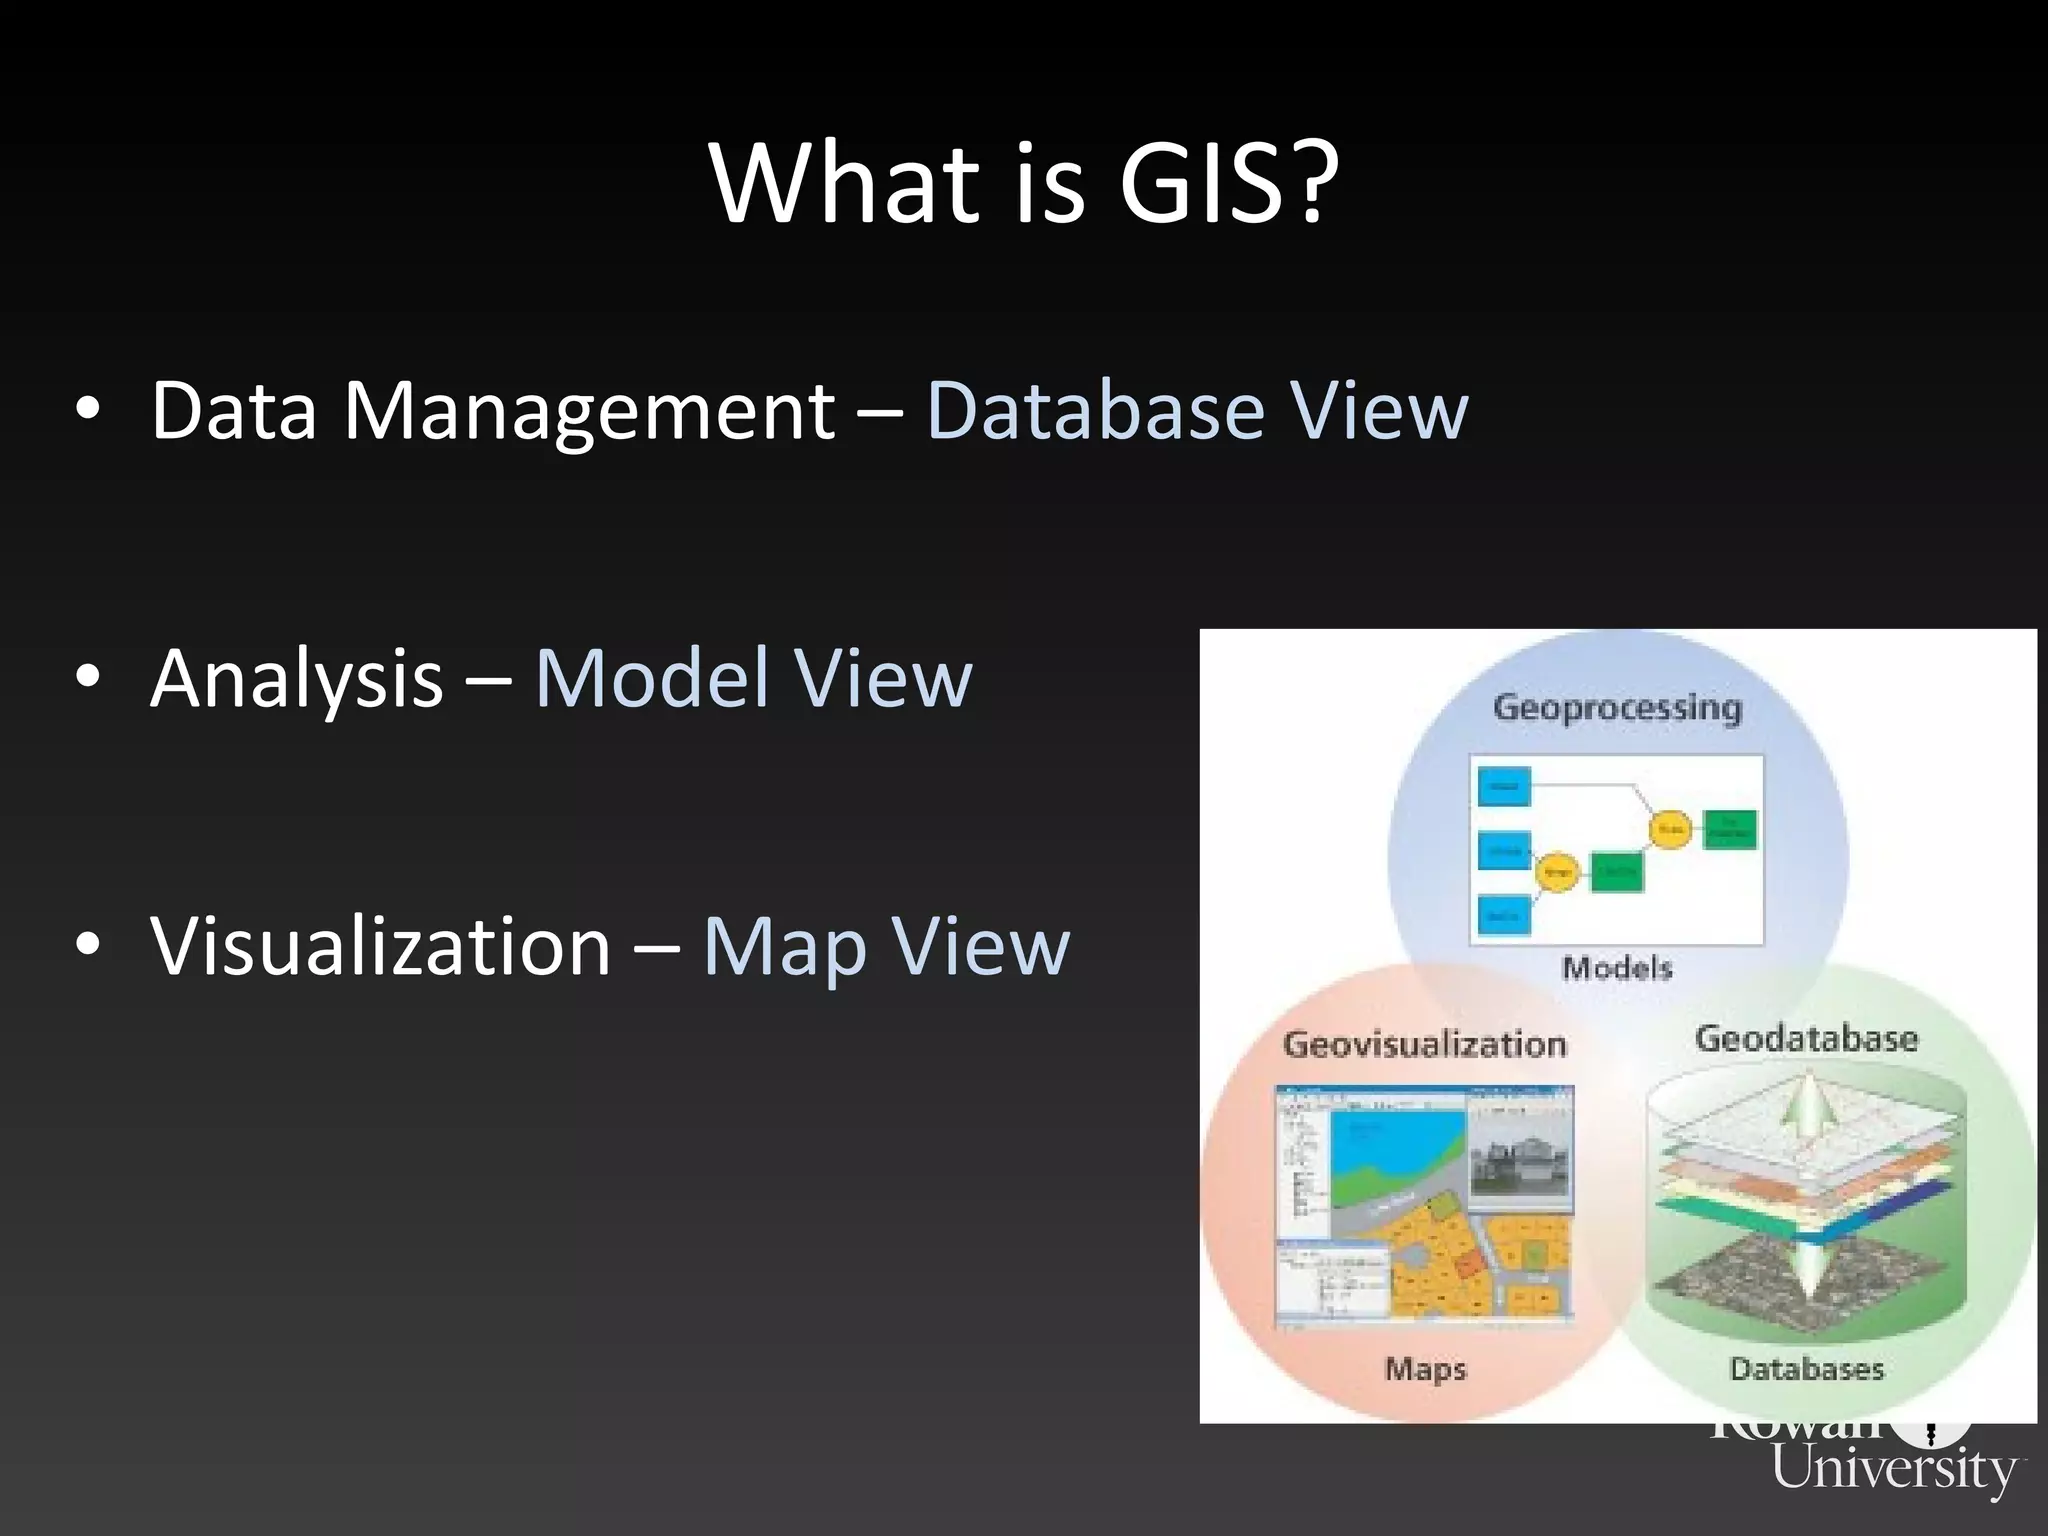
Defines spatial and aspatial data, explaining GIS data management, analysis capabilities, and visualization methods including maps and models.
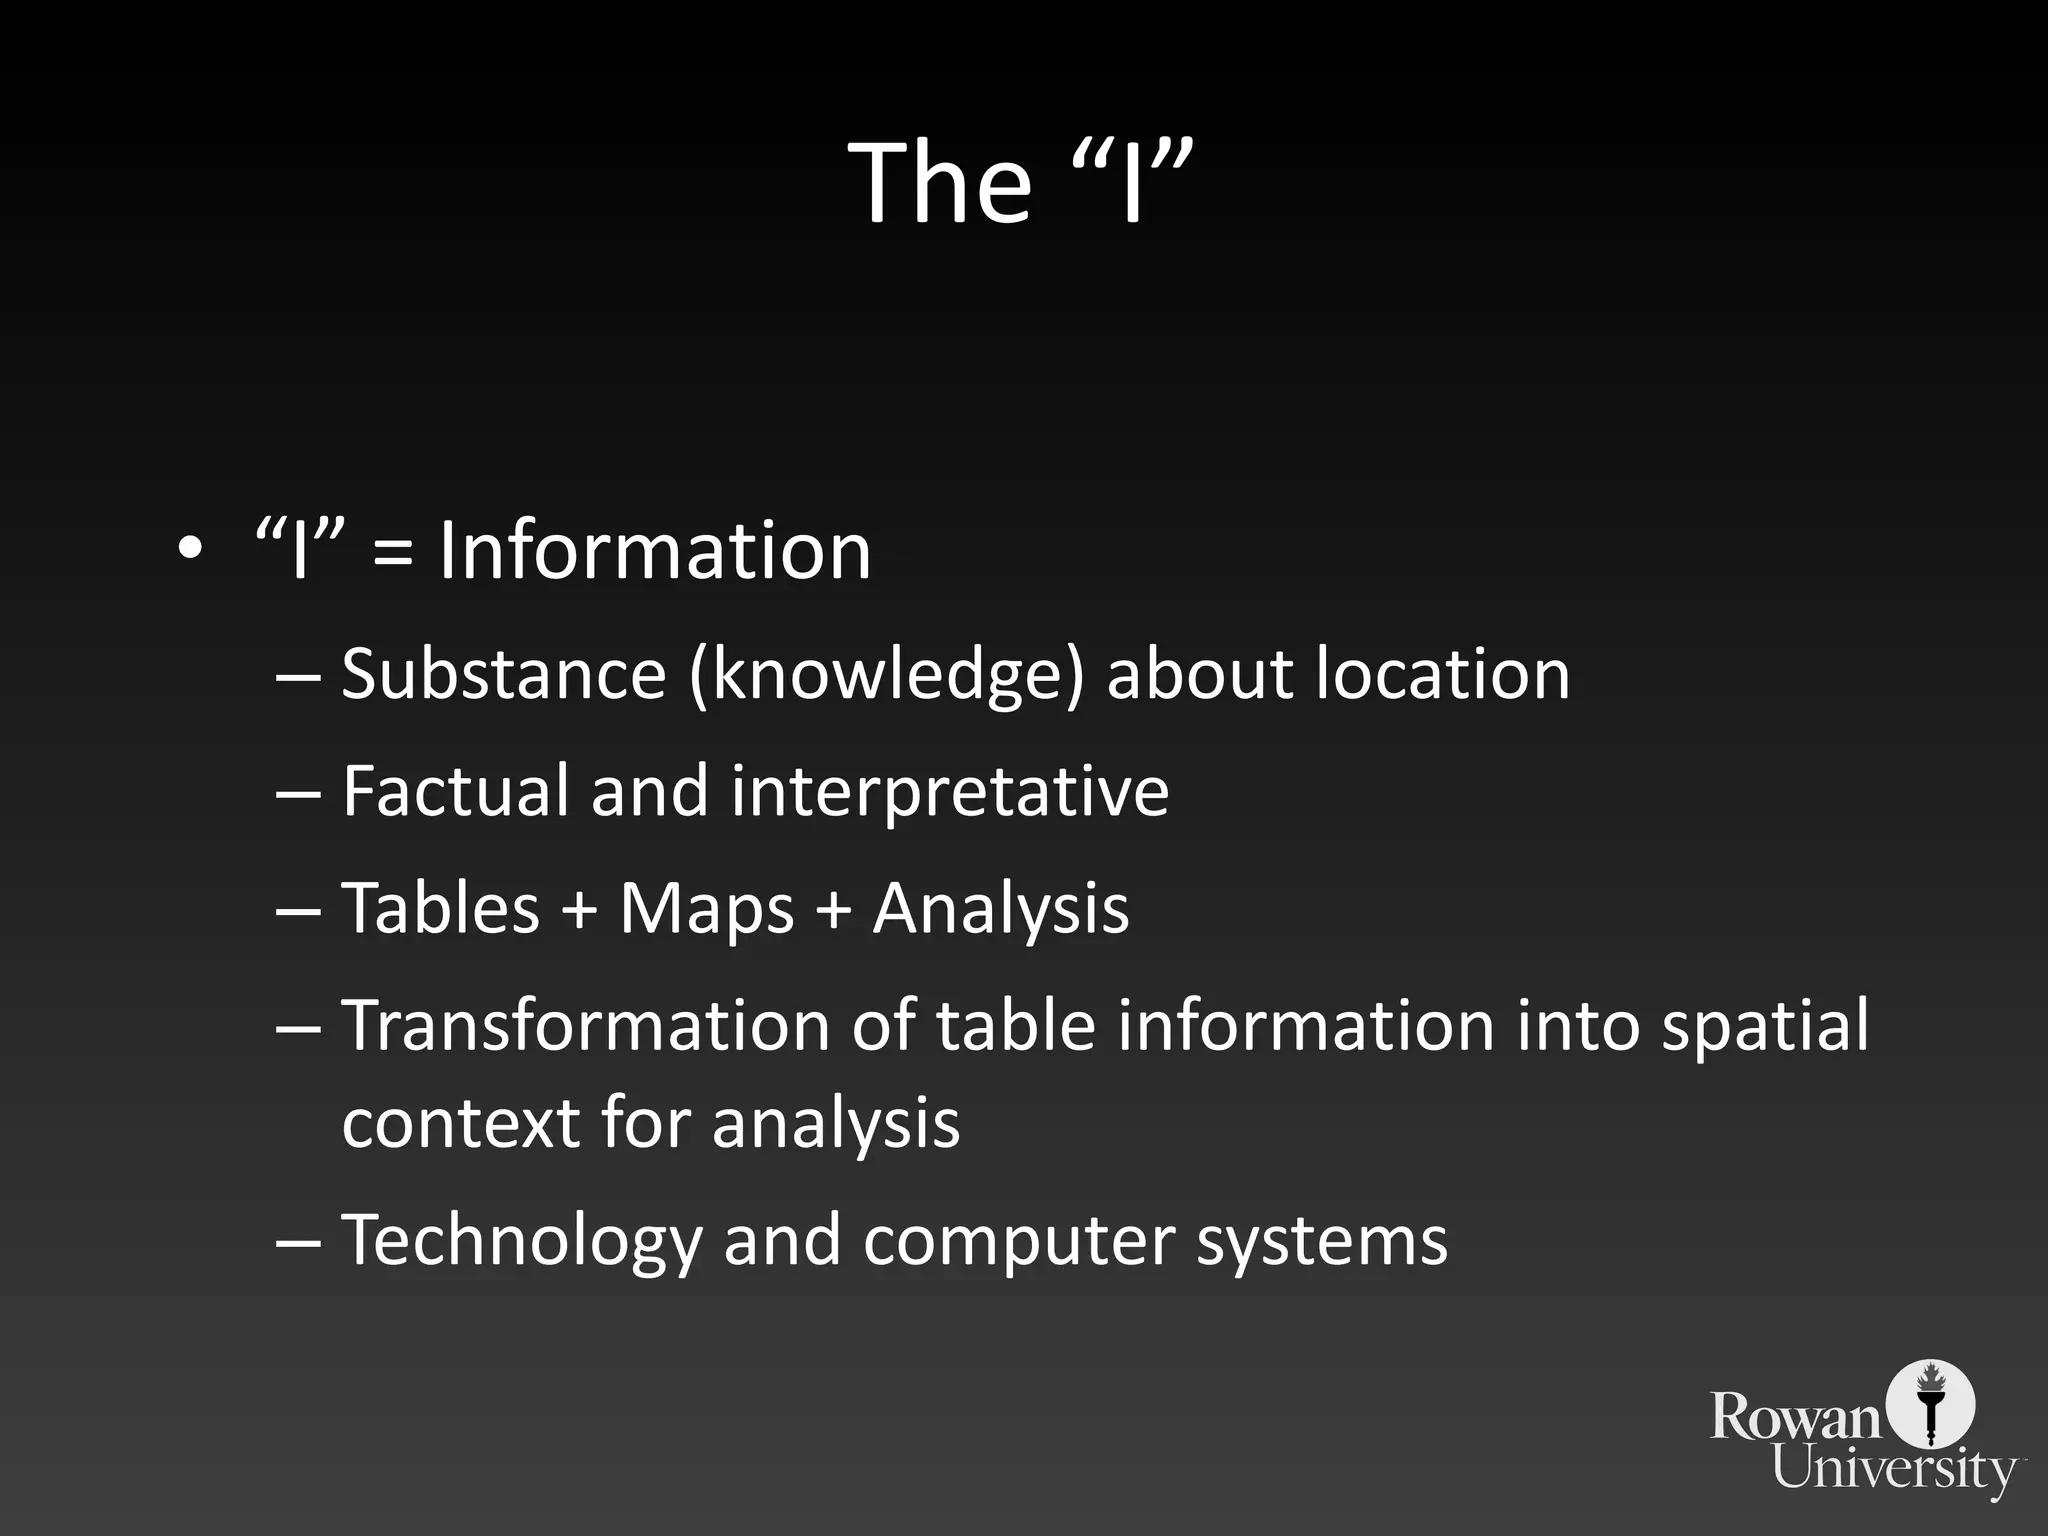
Describes GIS components: Geographic (spatial location), Information (knowledge about location), and Systems (structural integration of data).
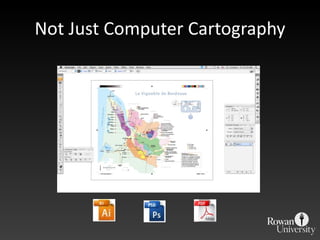
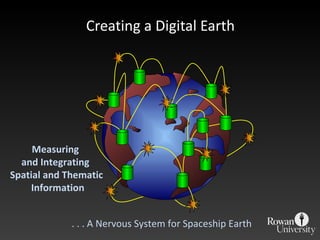
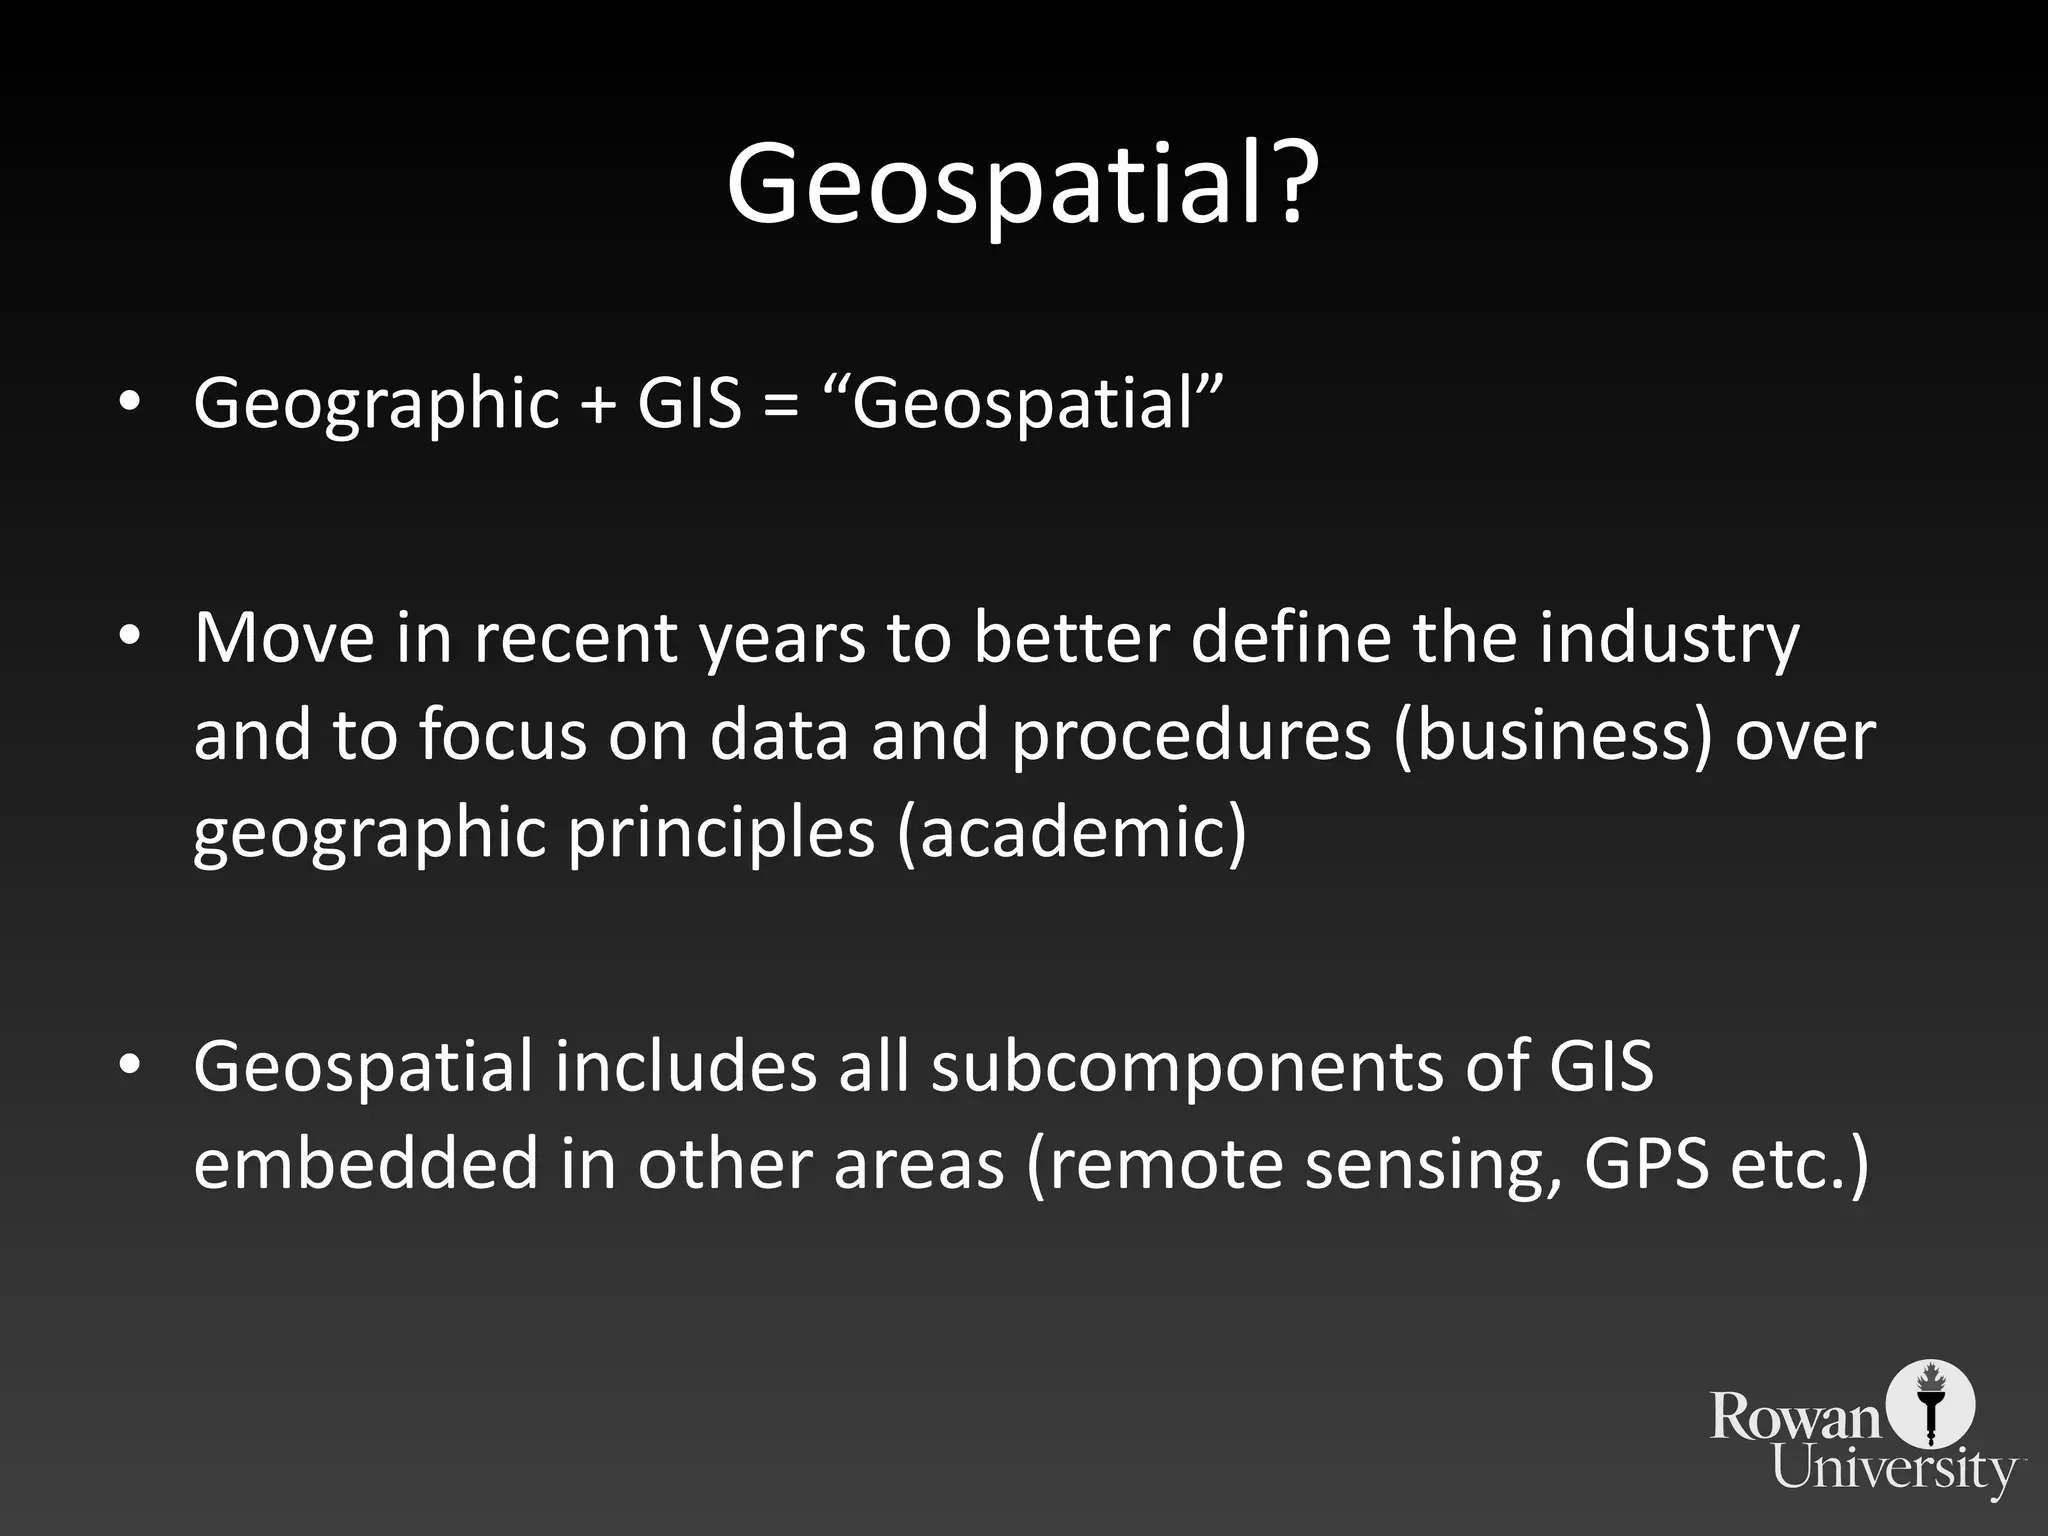
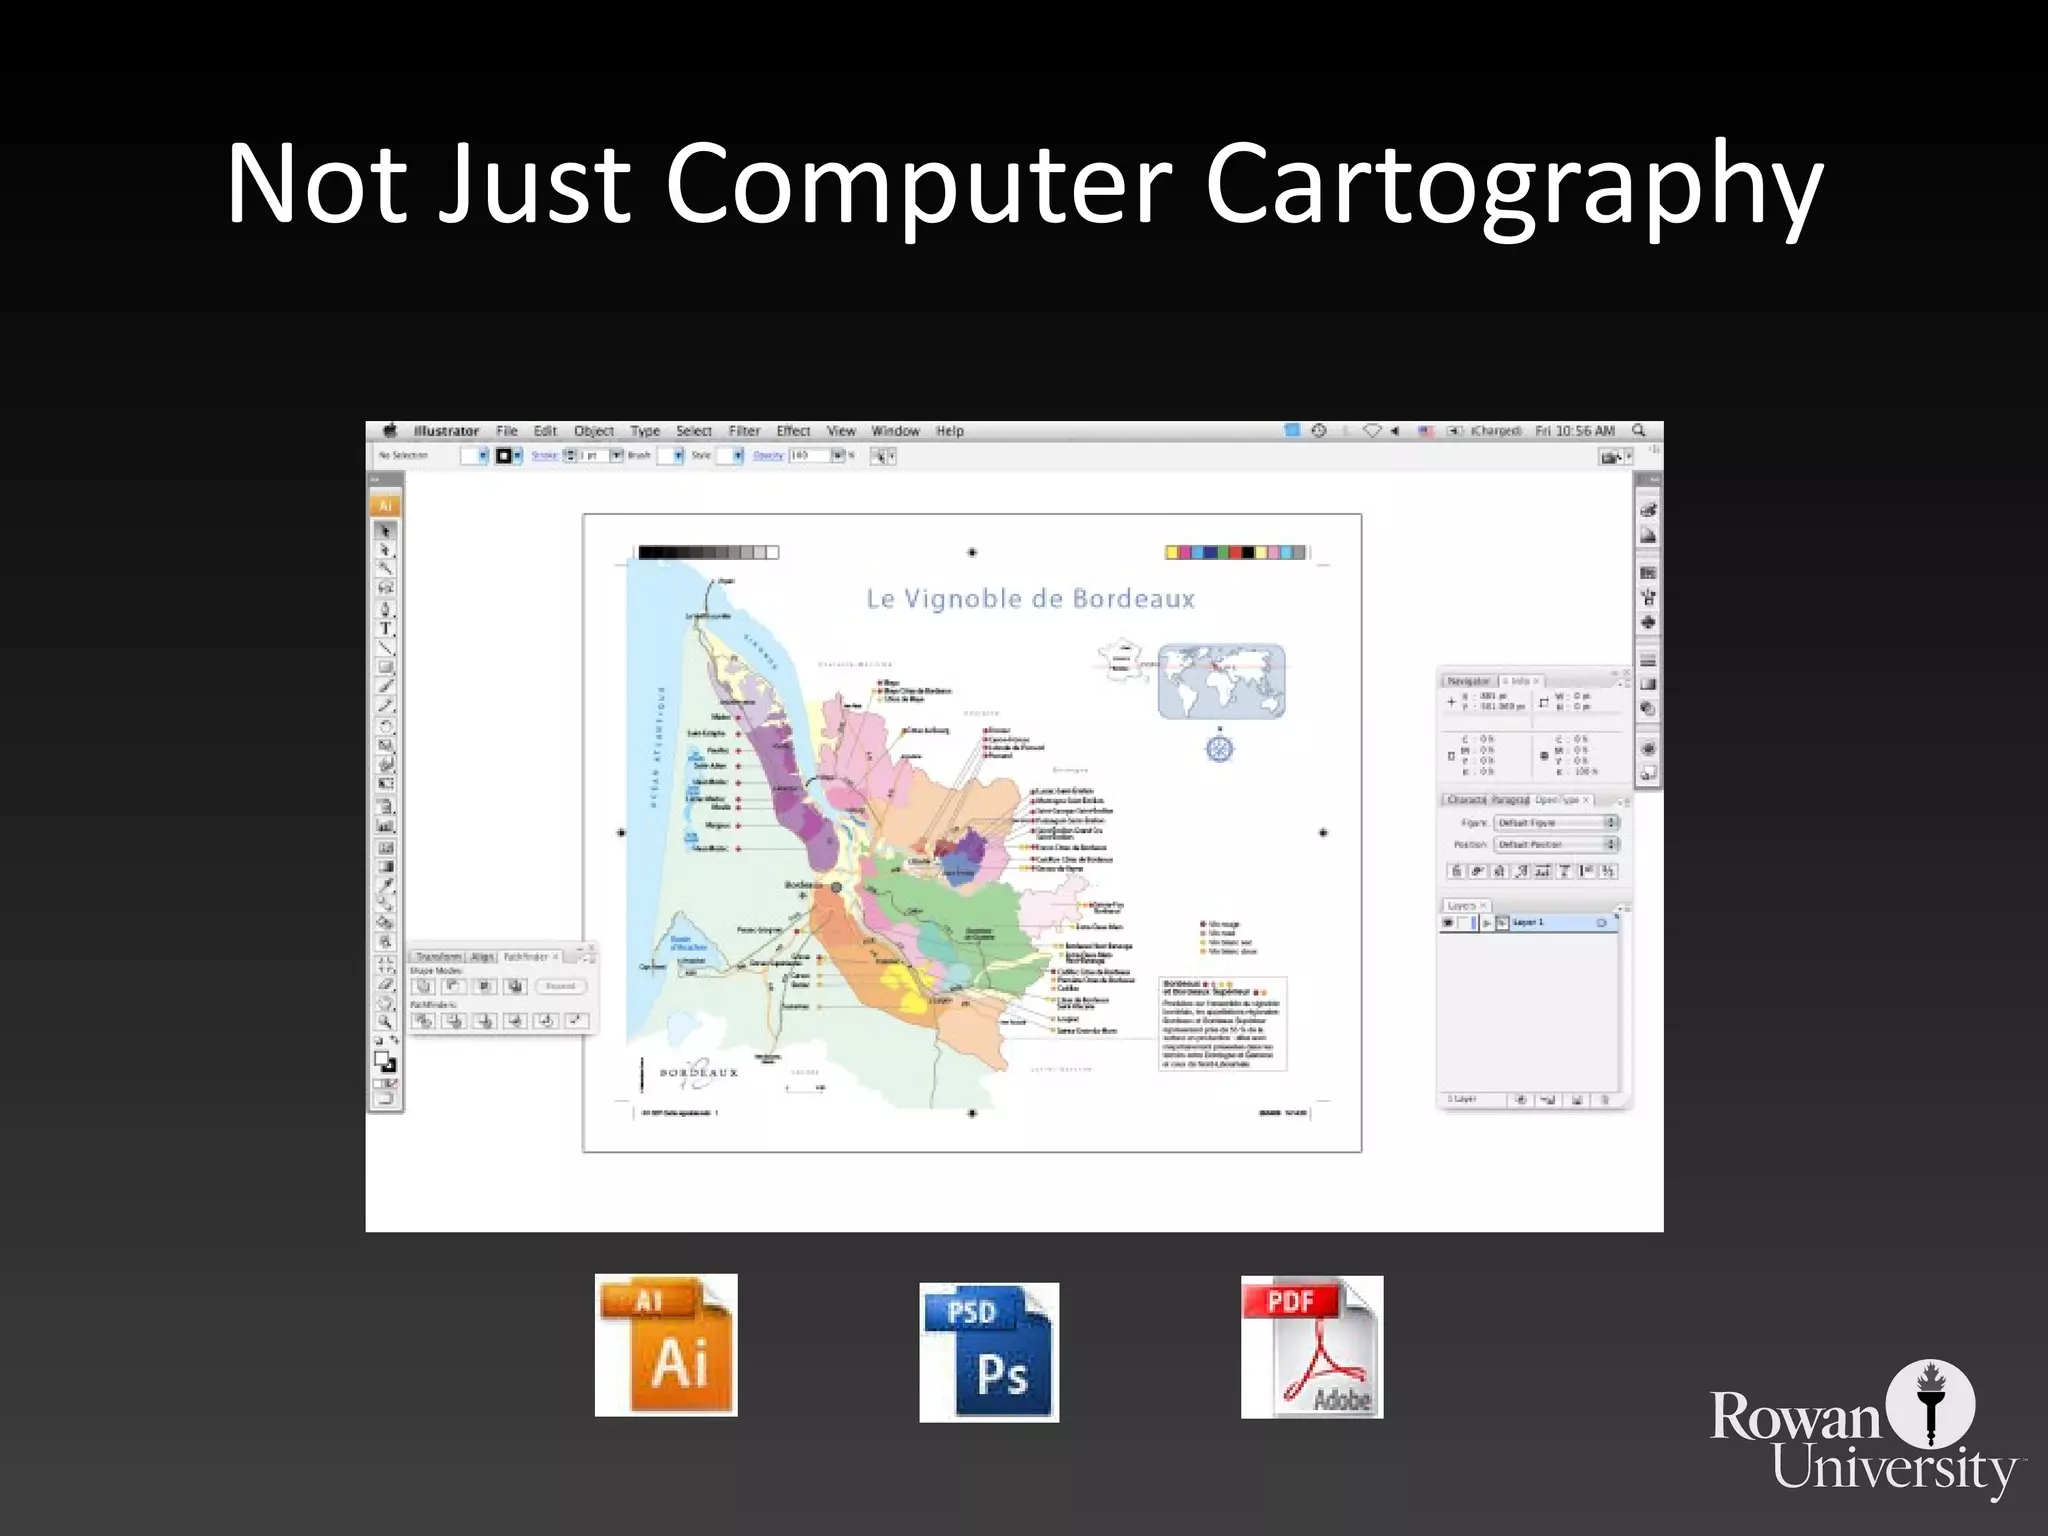
Explains the concept of geospatial, merging geography with GIS, and underscores its applications beyond traditional mapping.
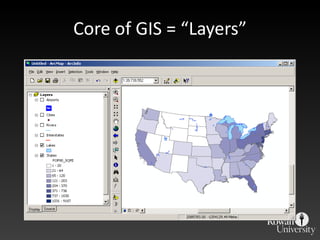
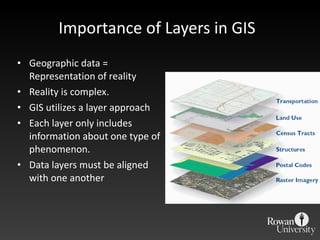
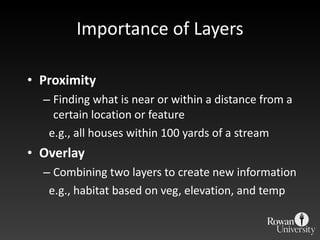
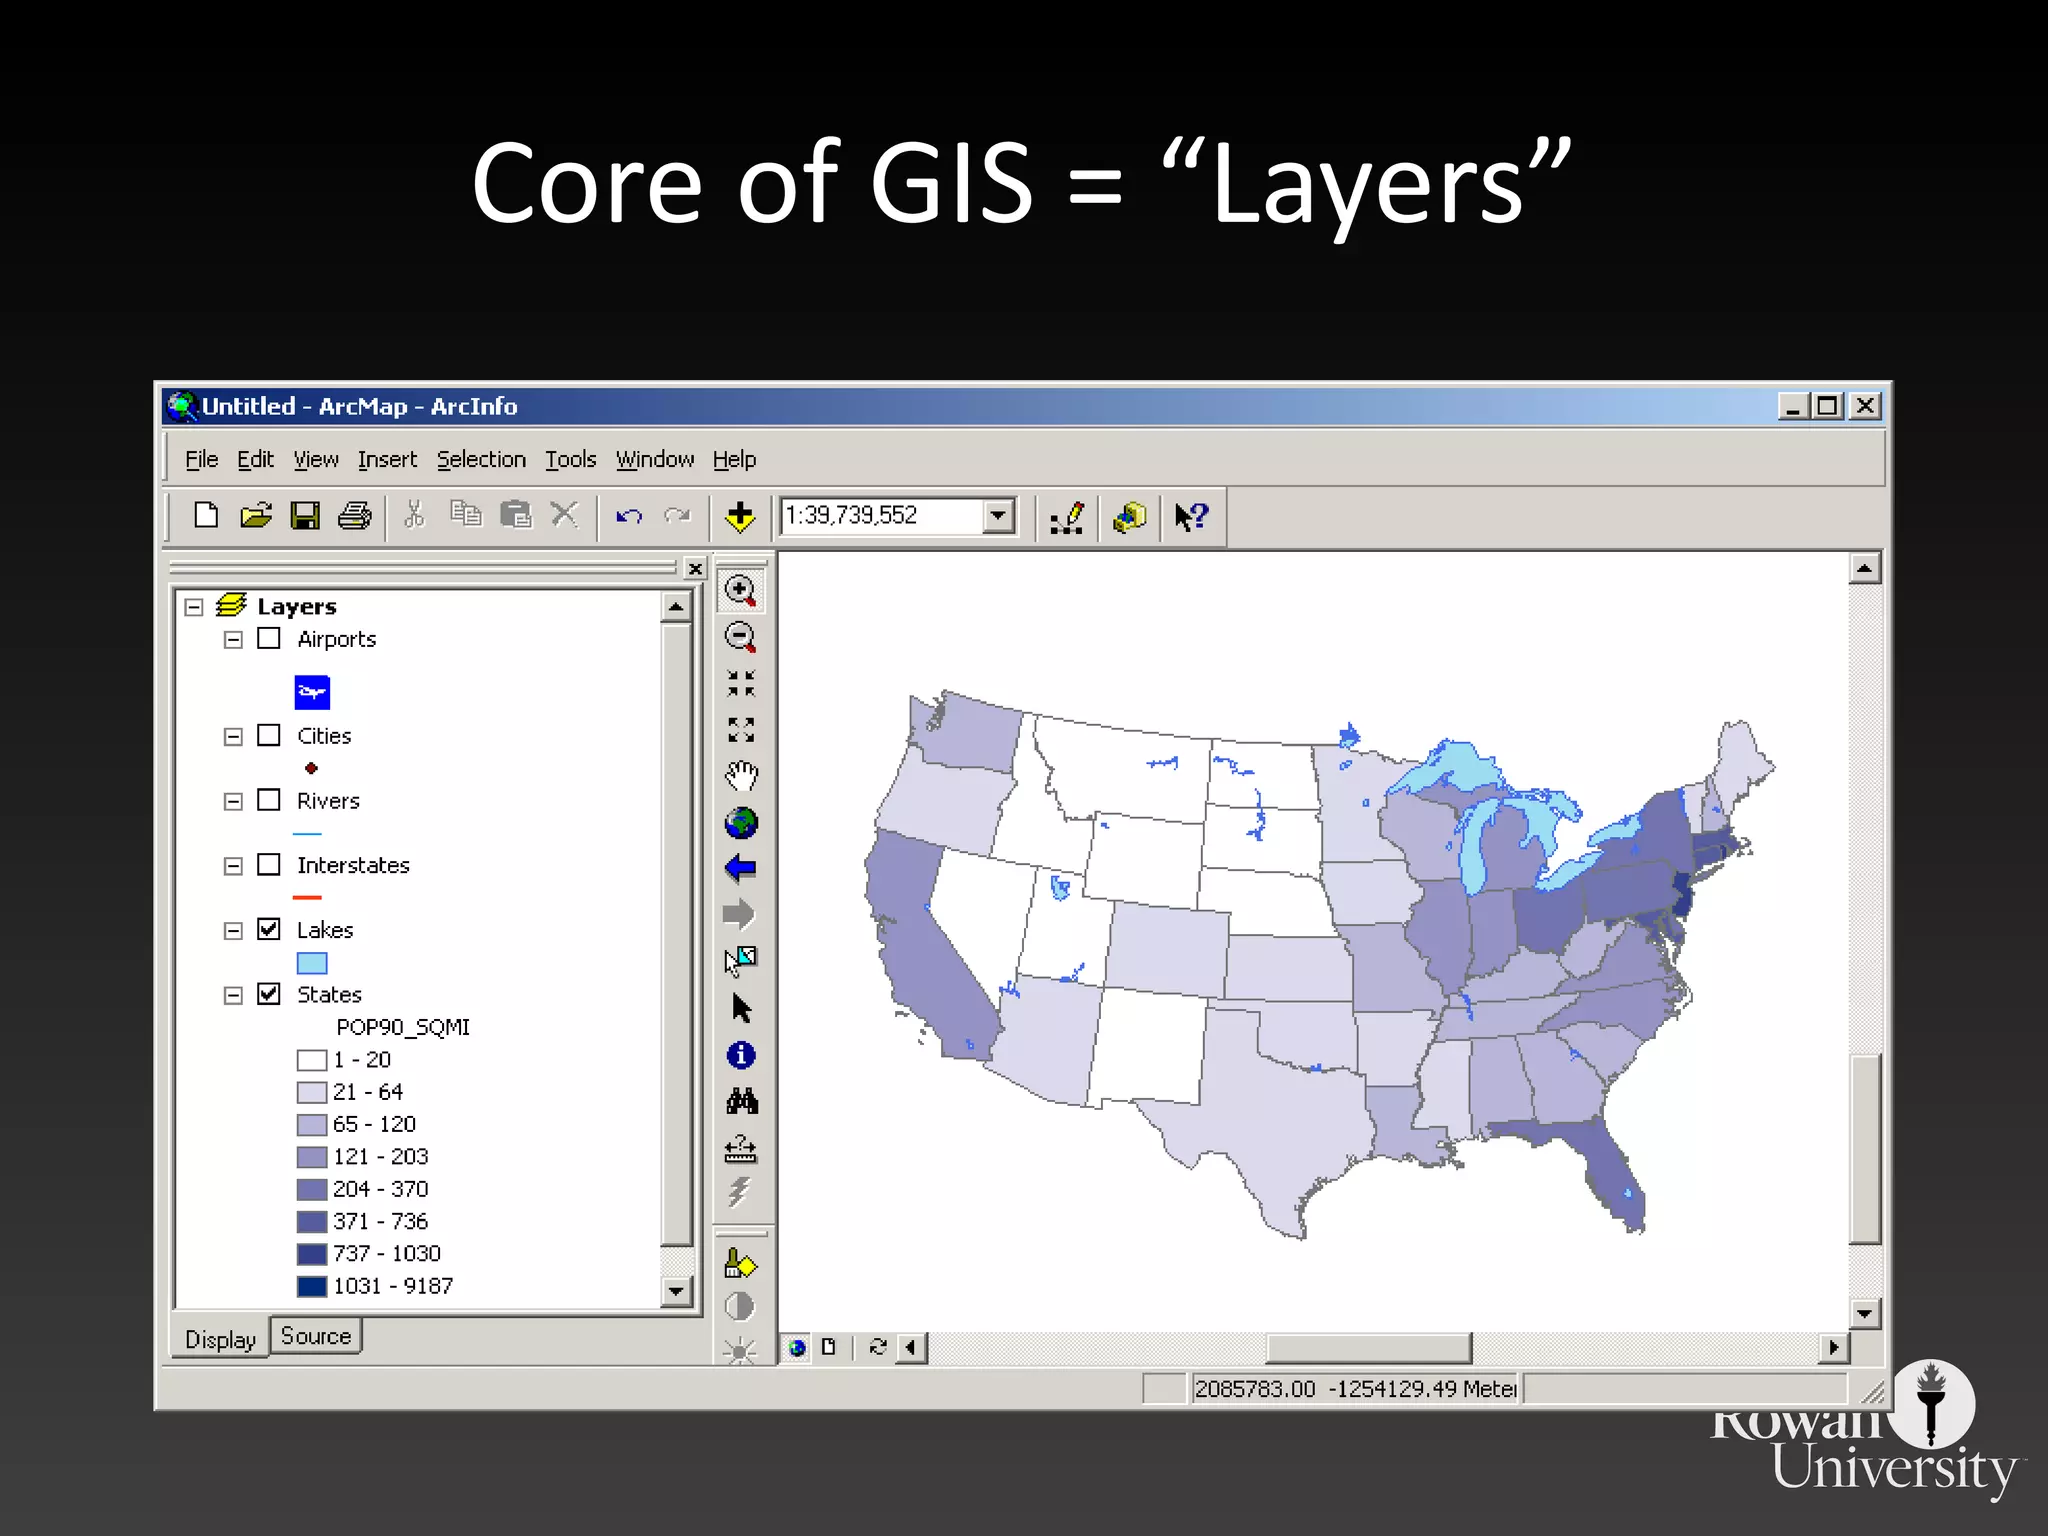
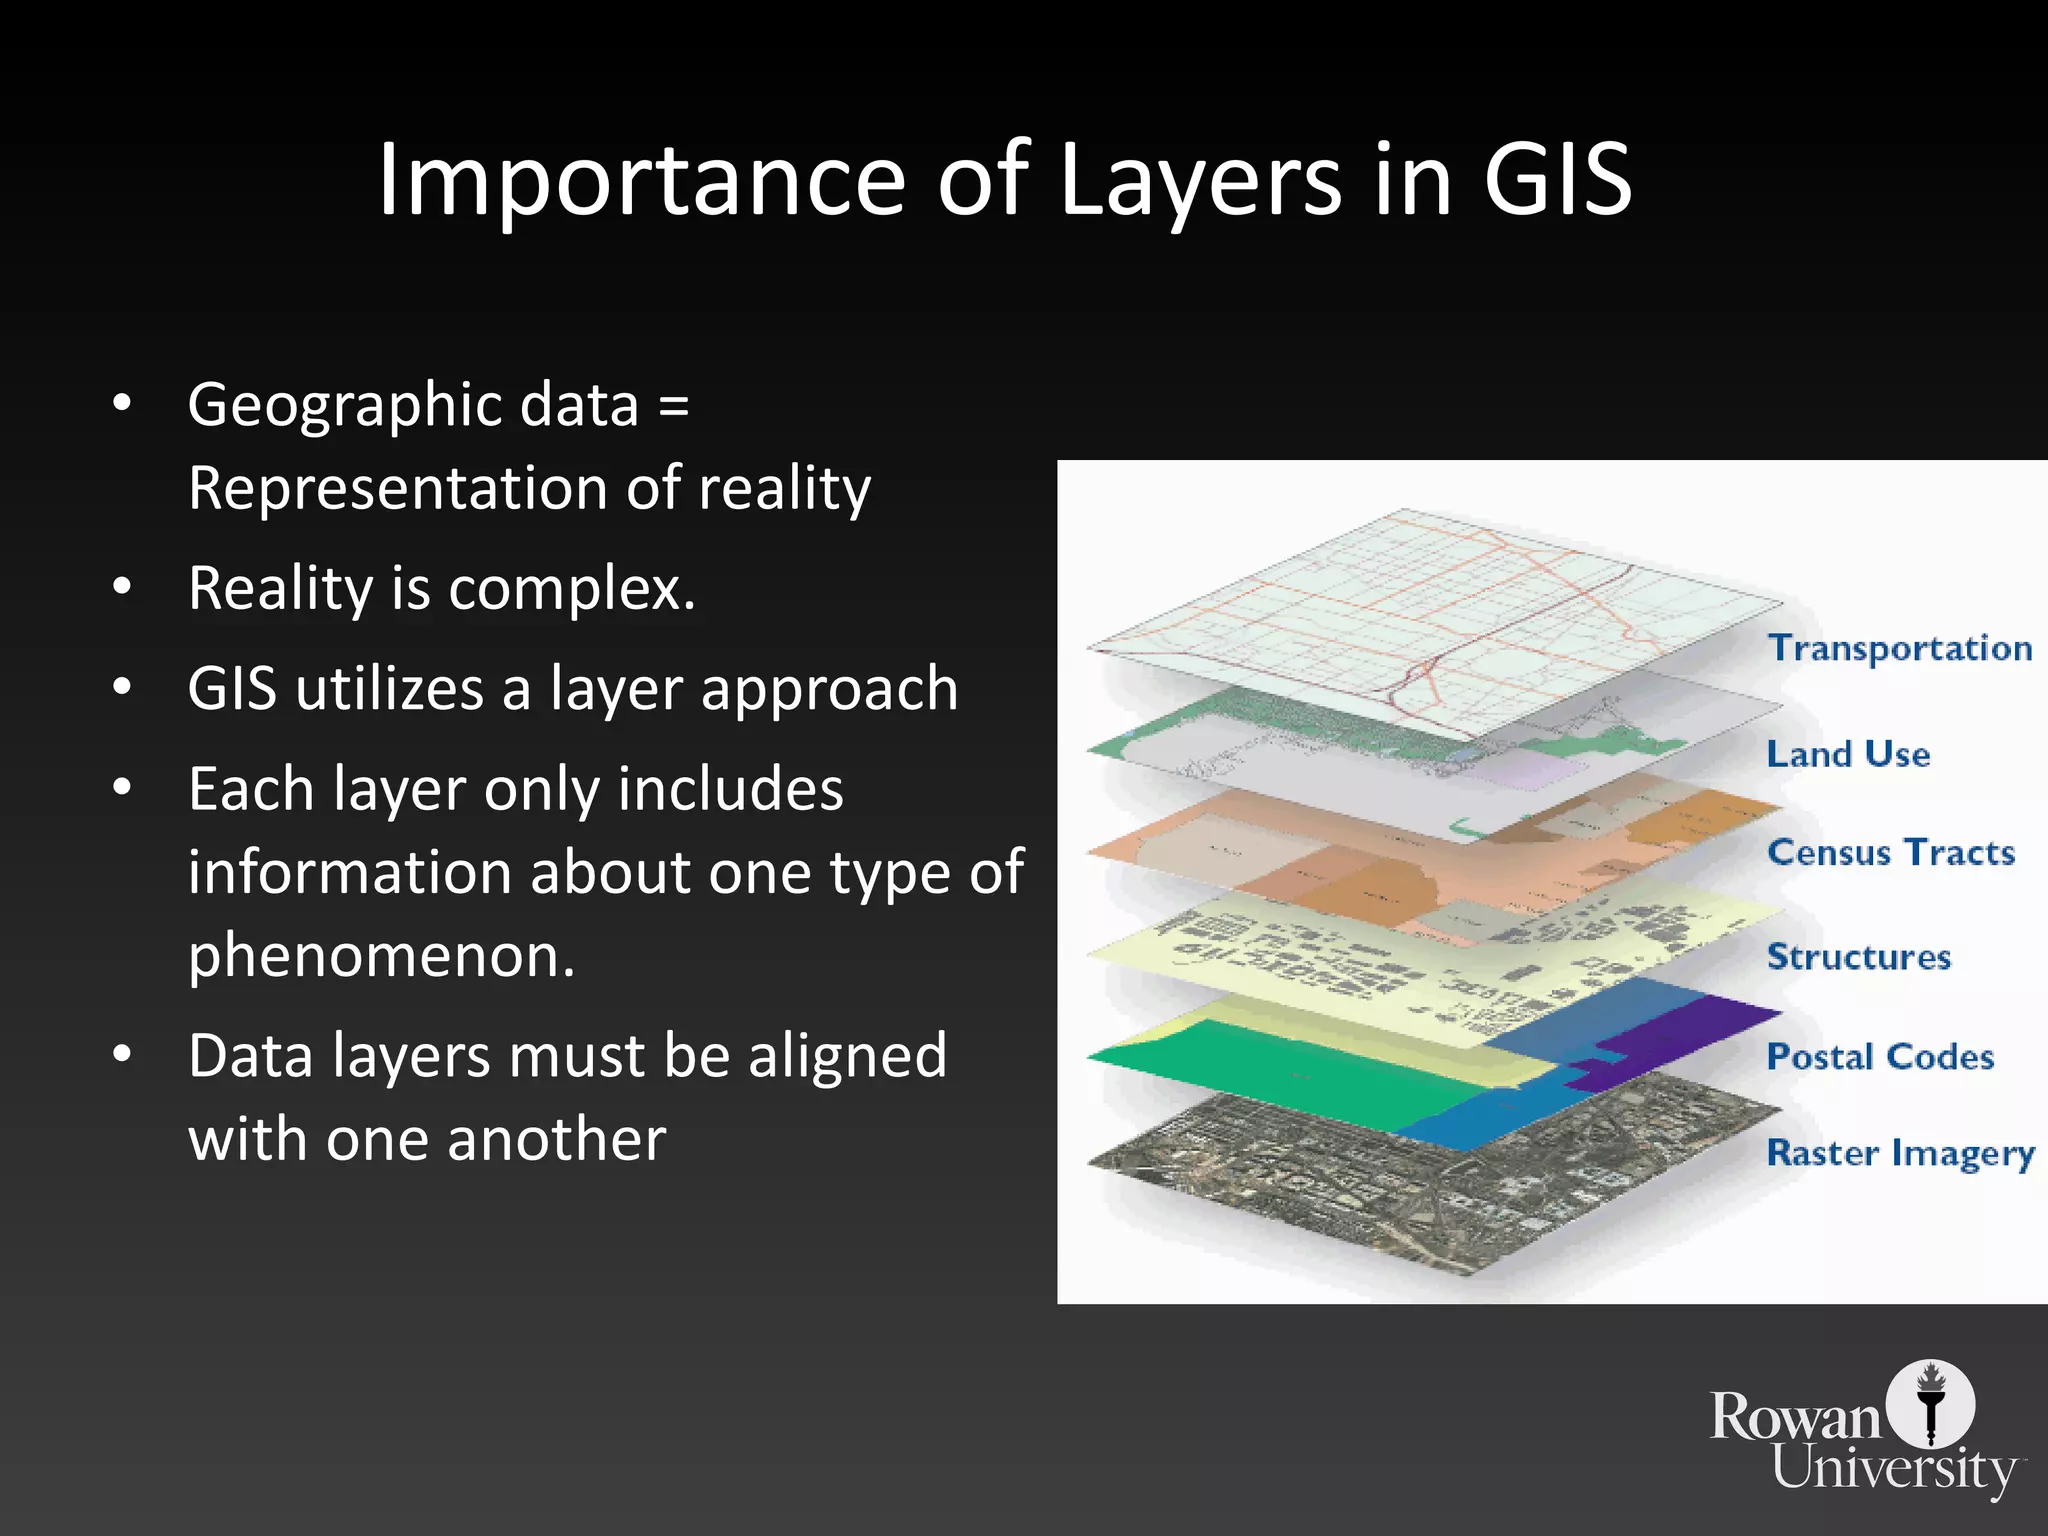
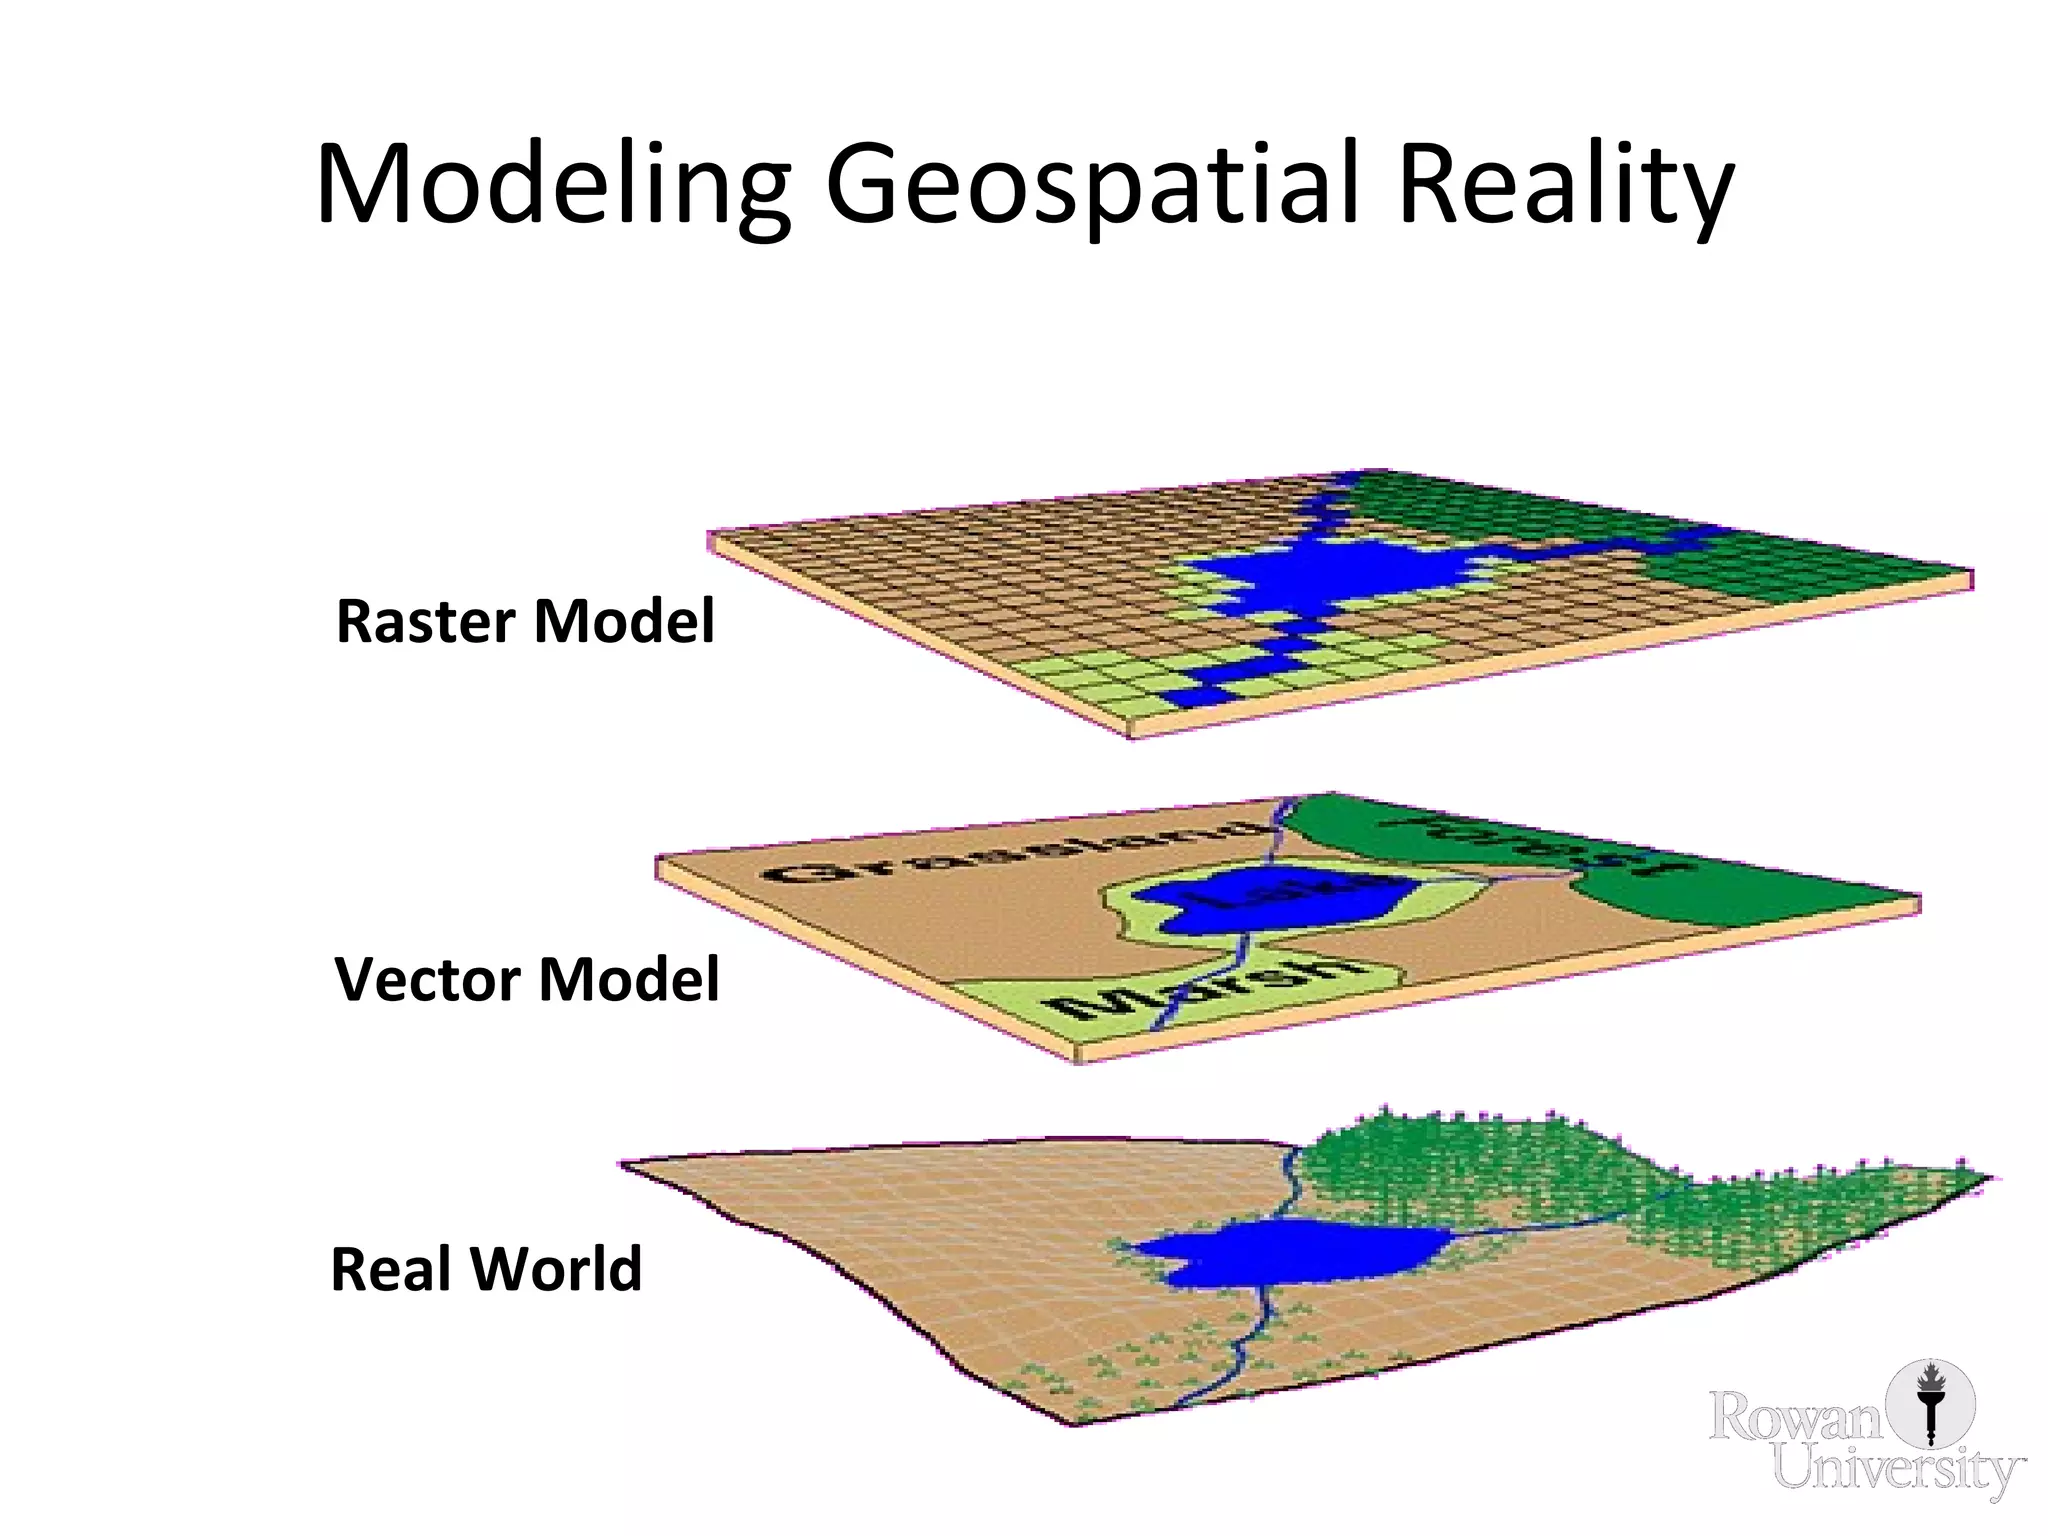
Discusses the importance of data layers in GIS for complex reality representation, including proximity and overlay analysis.
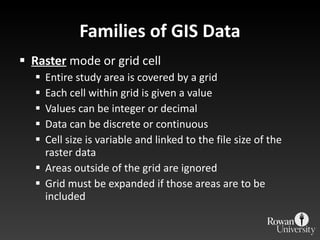
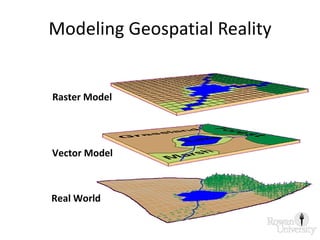
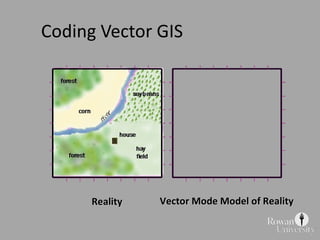
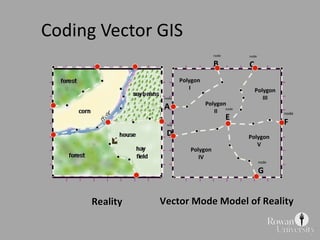
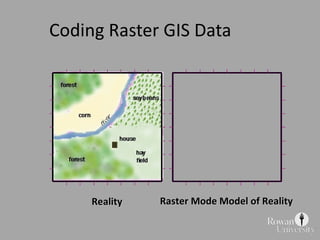
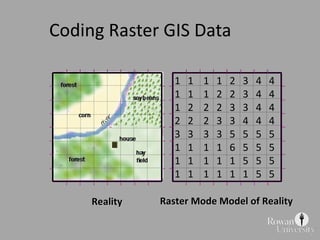
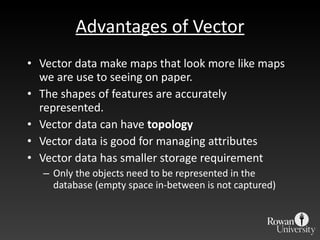
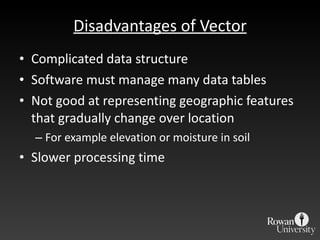
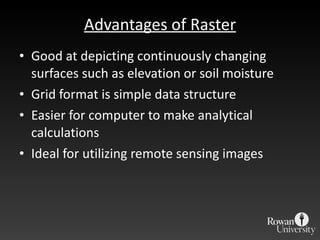
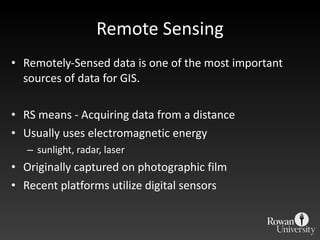
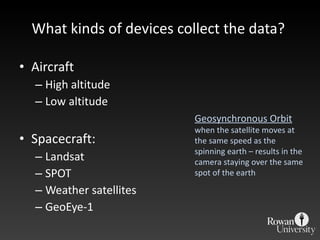
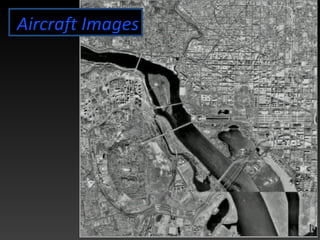
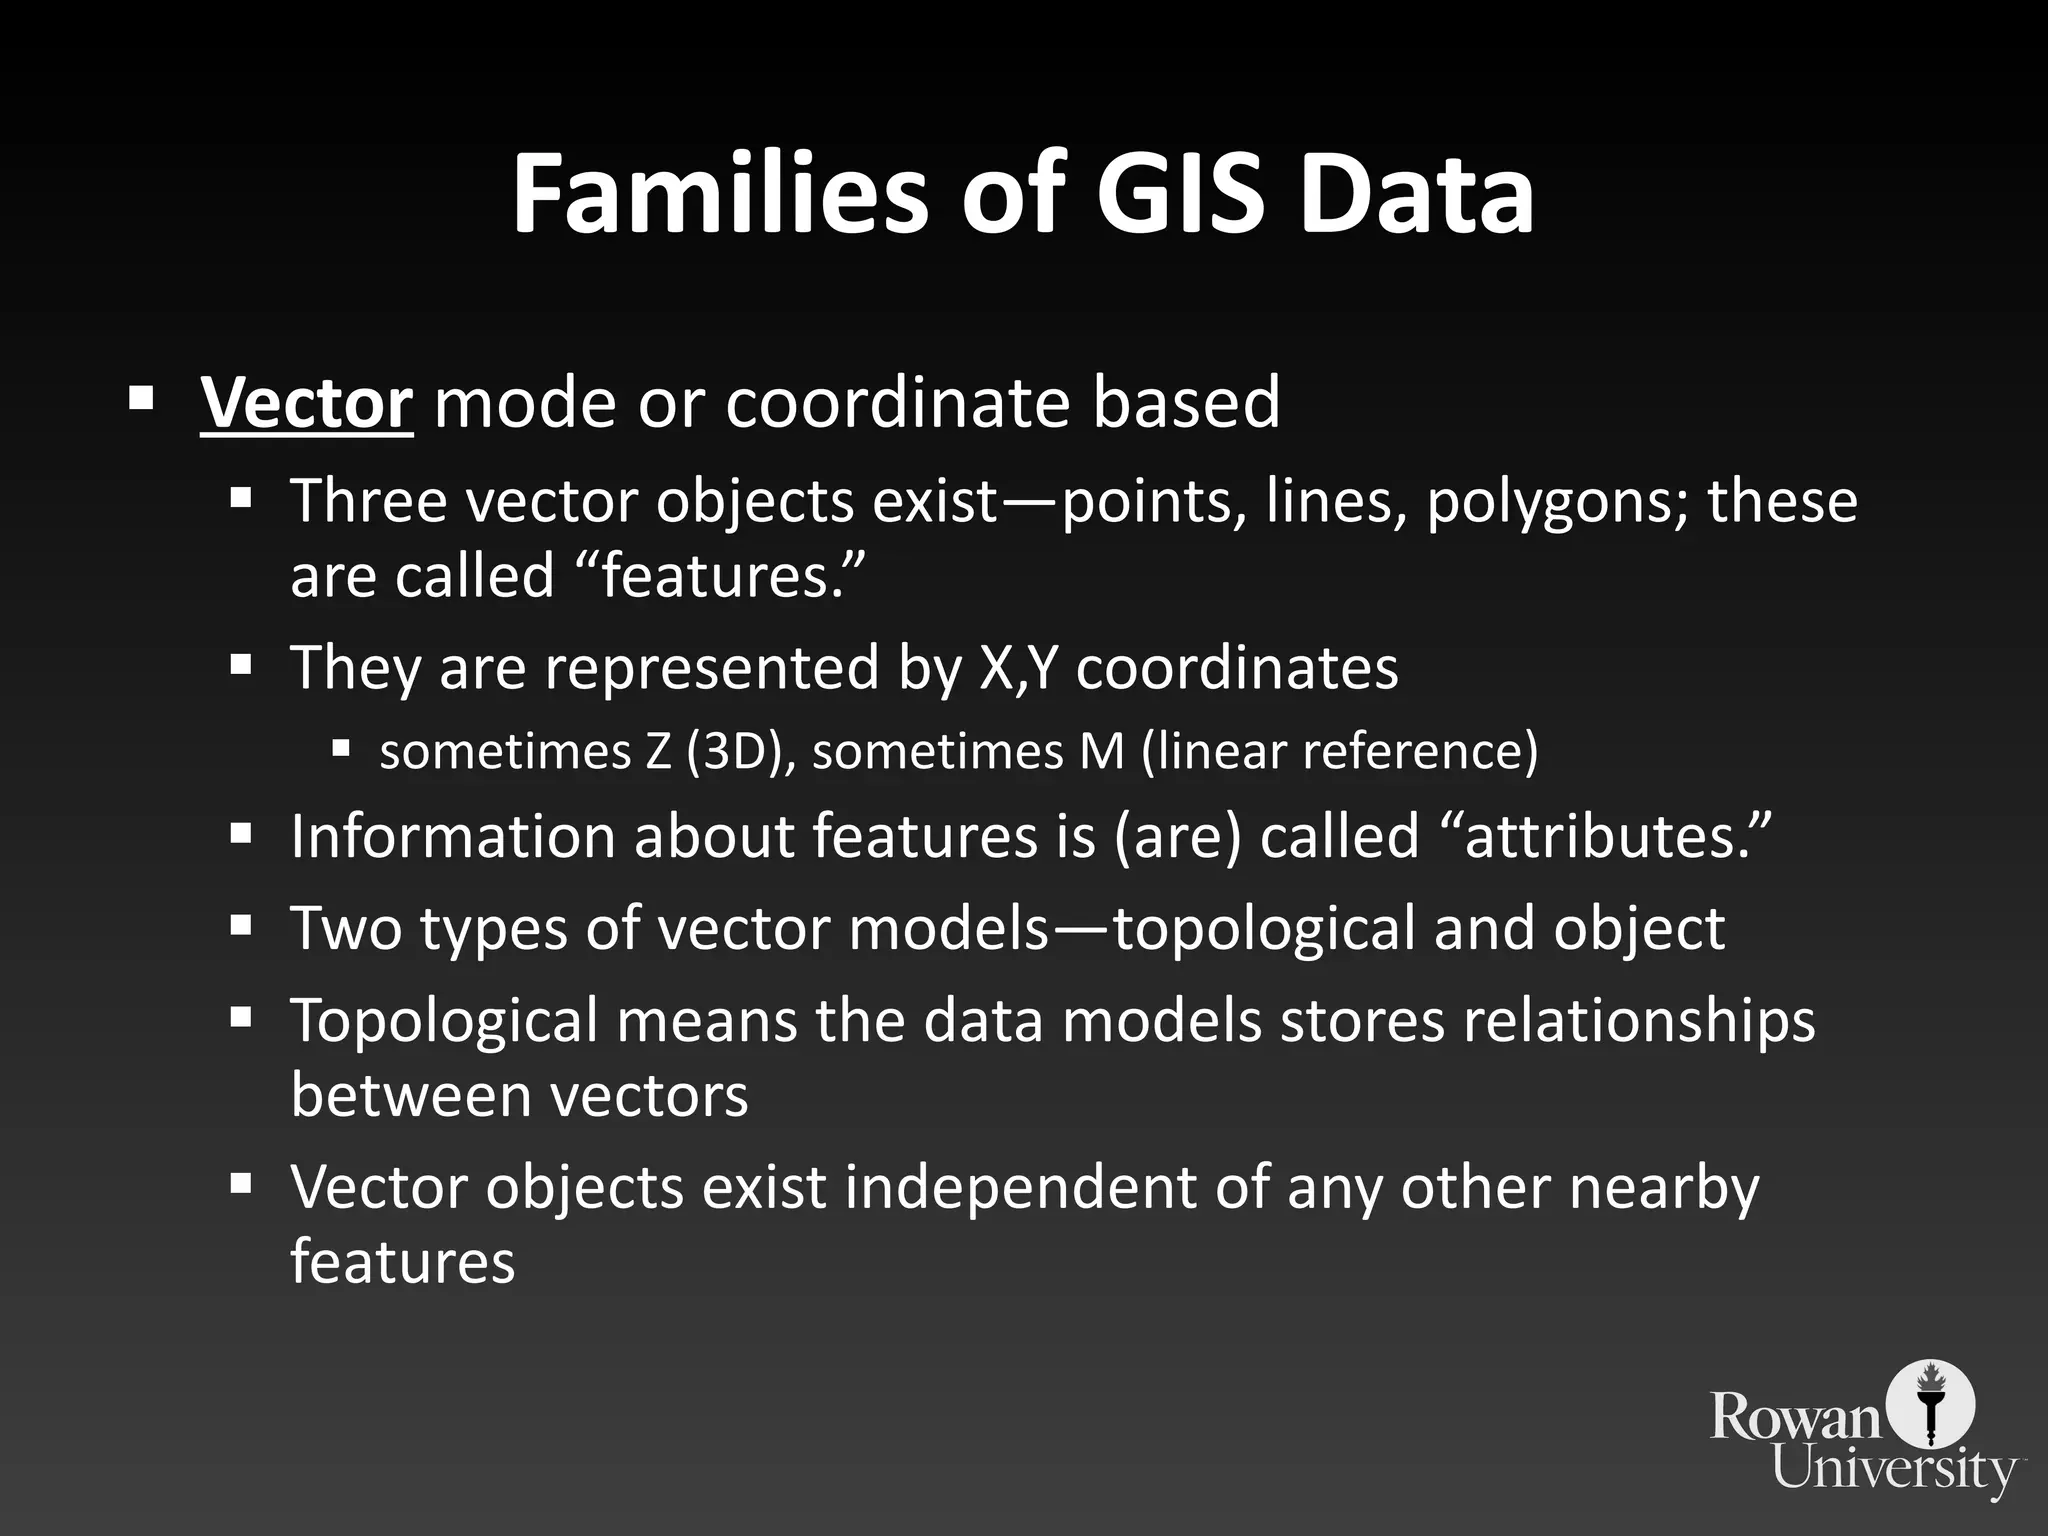
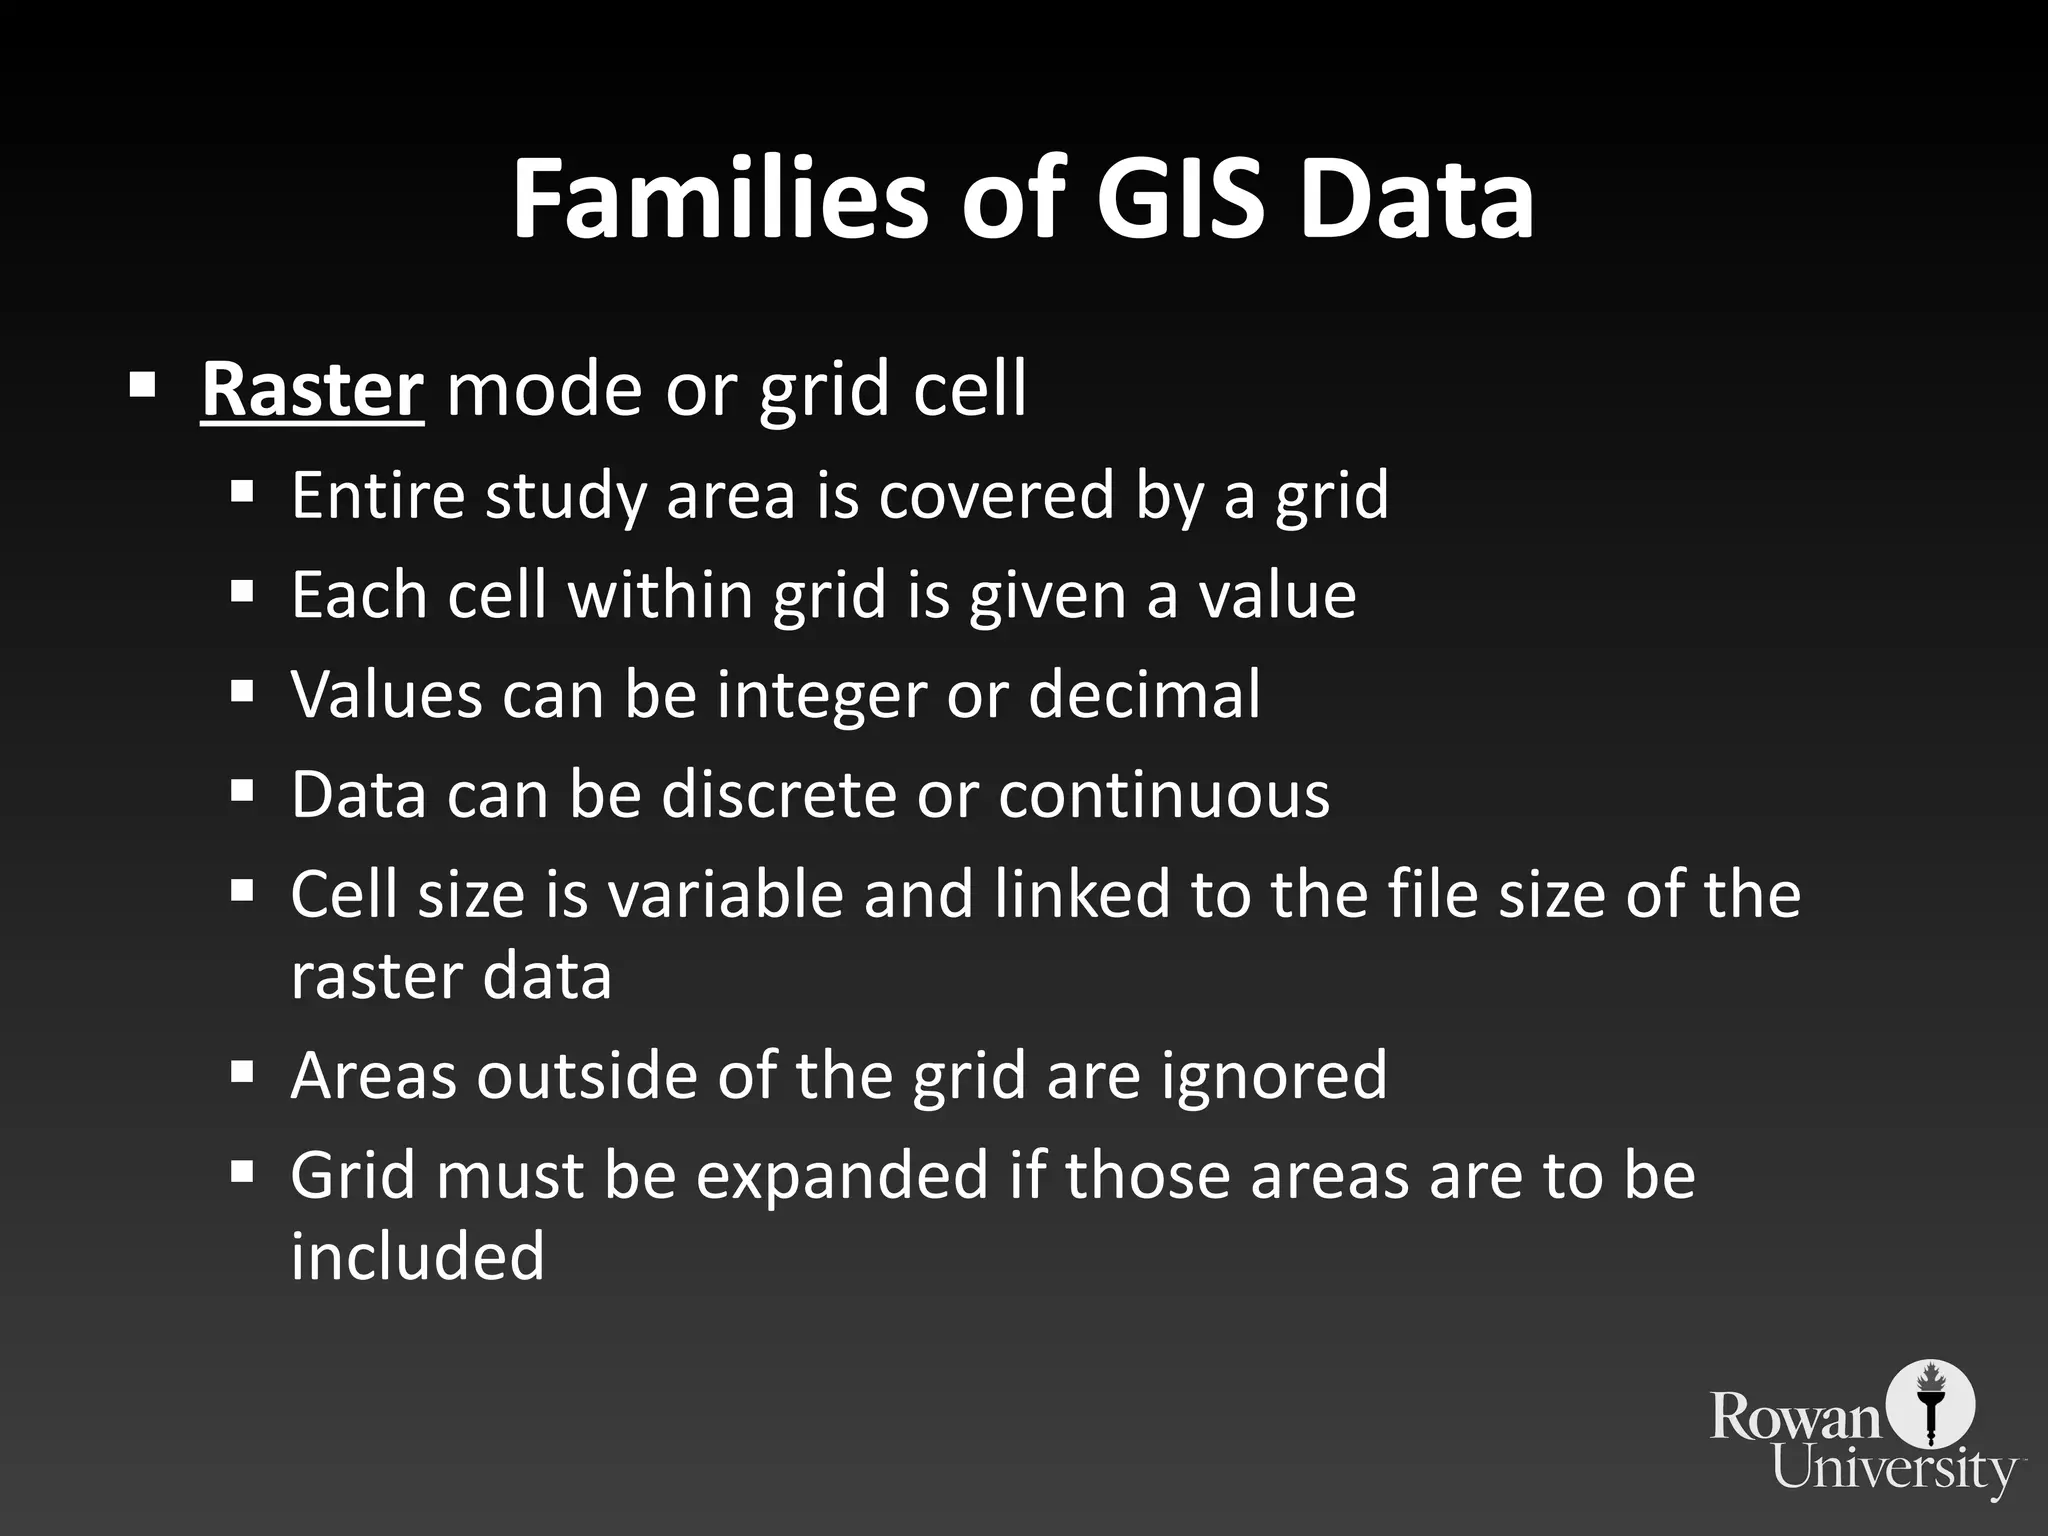
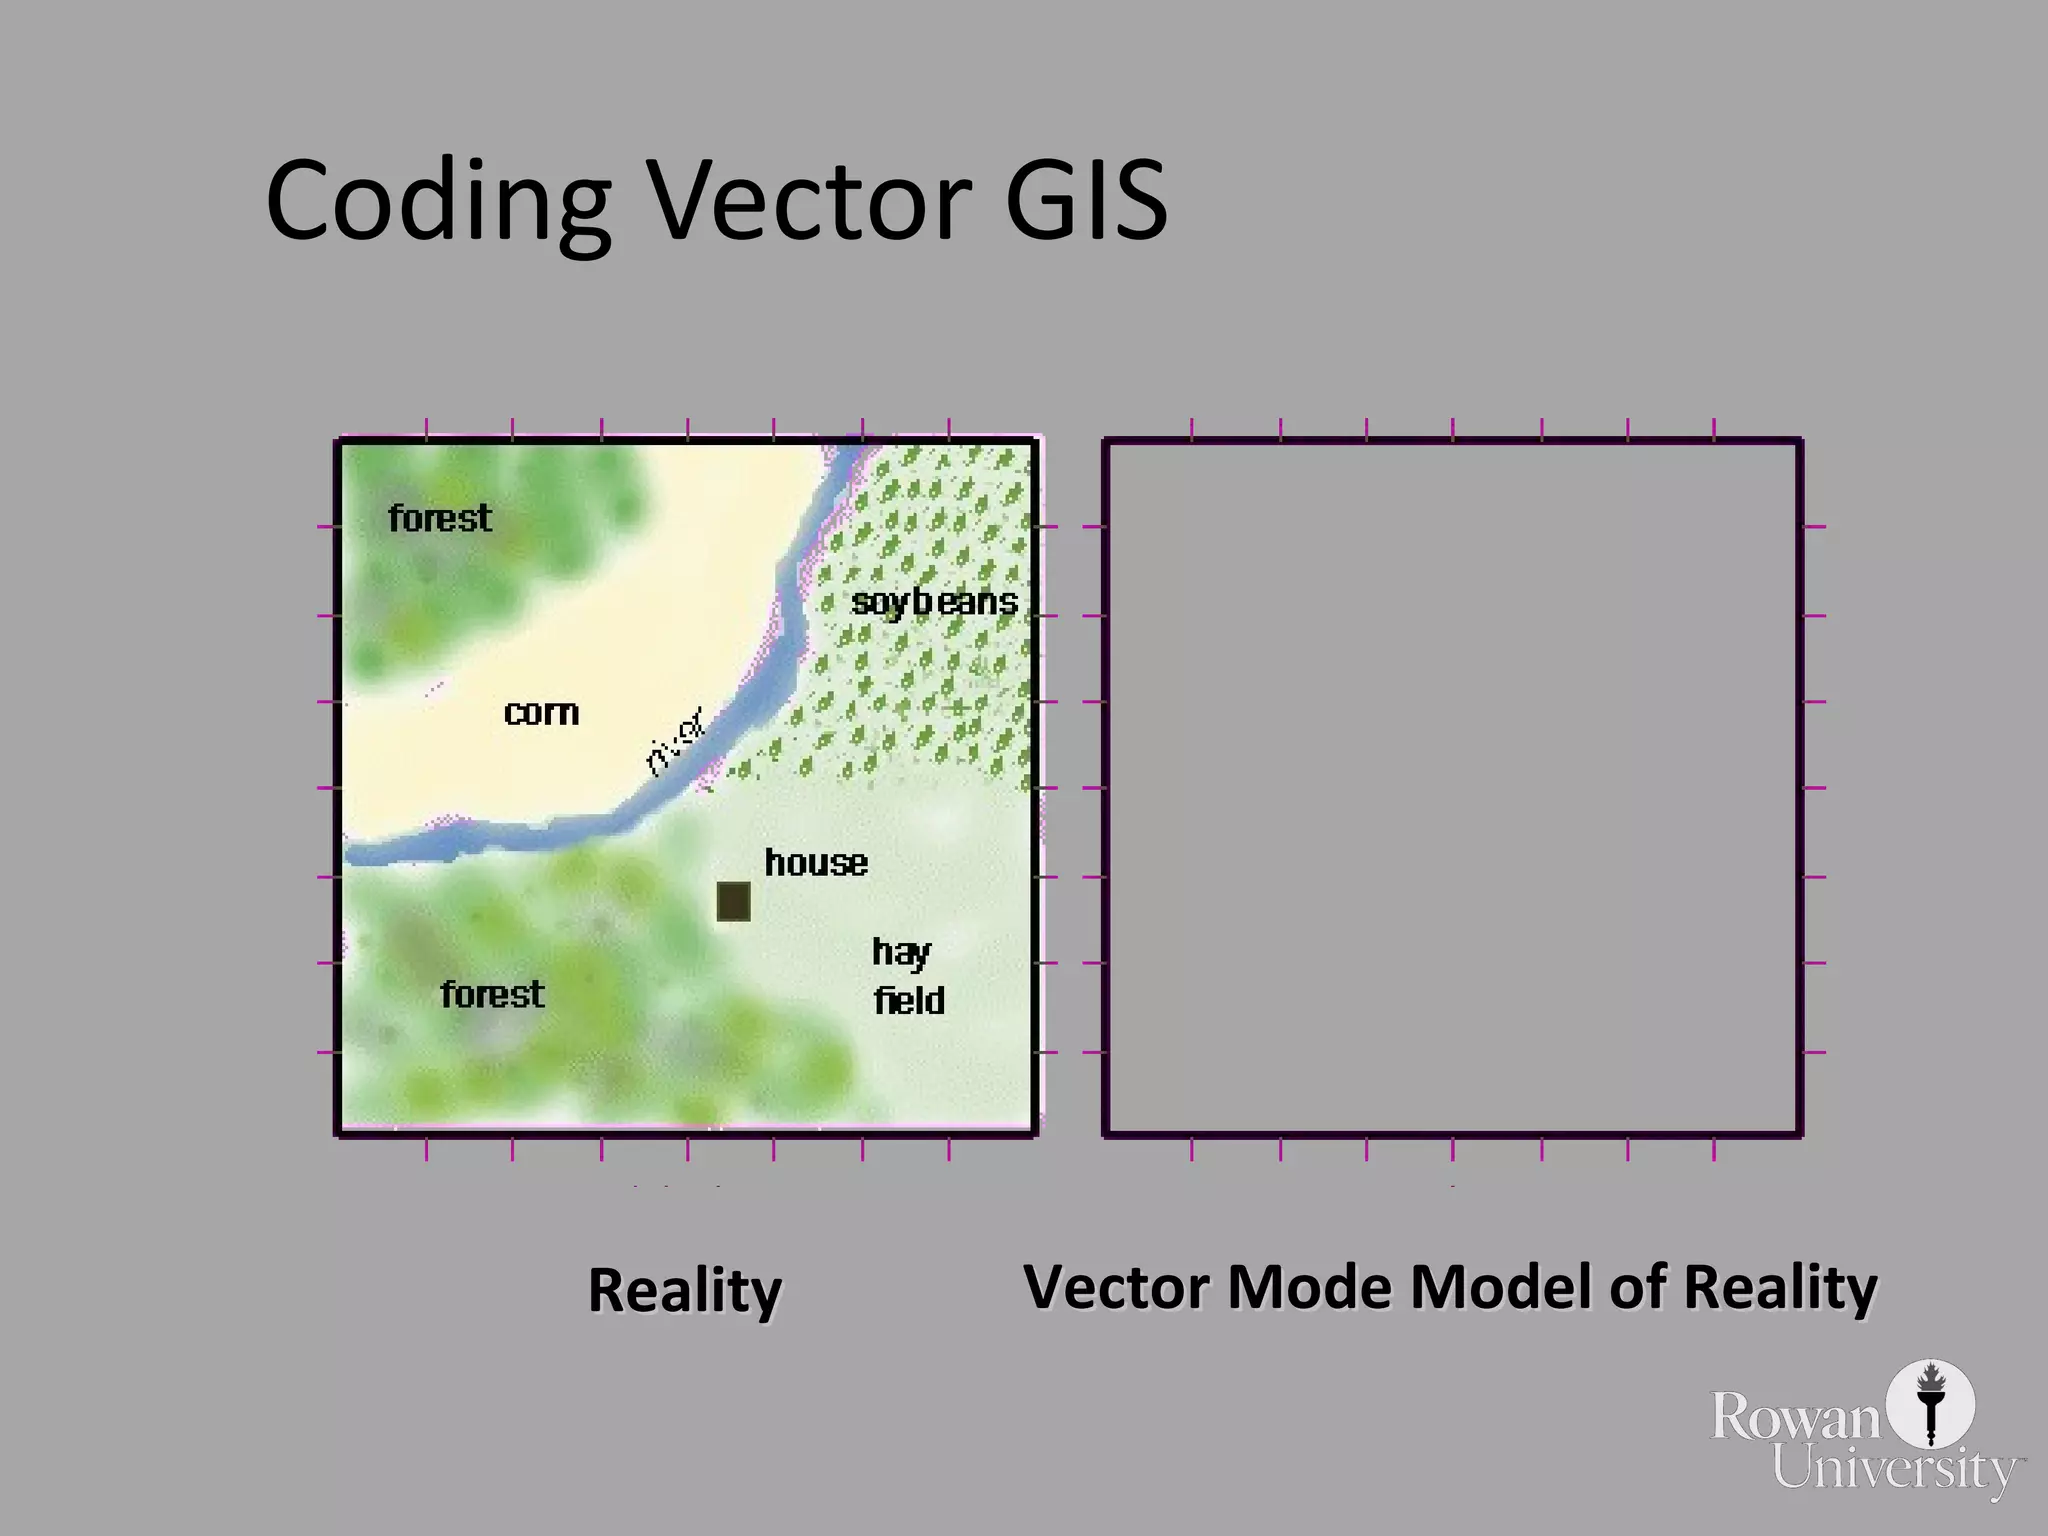
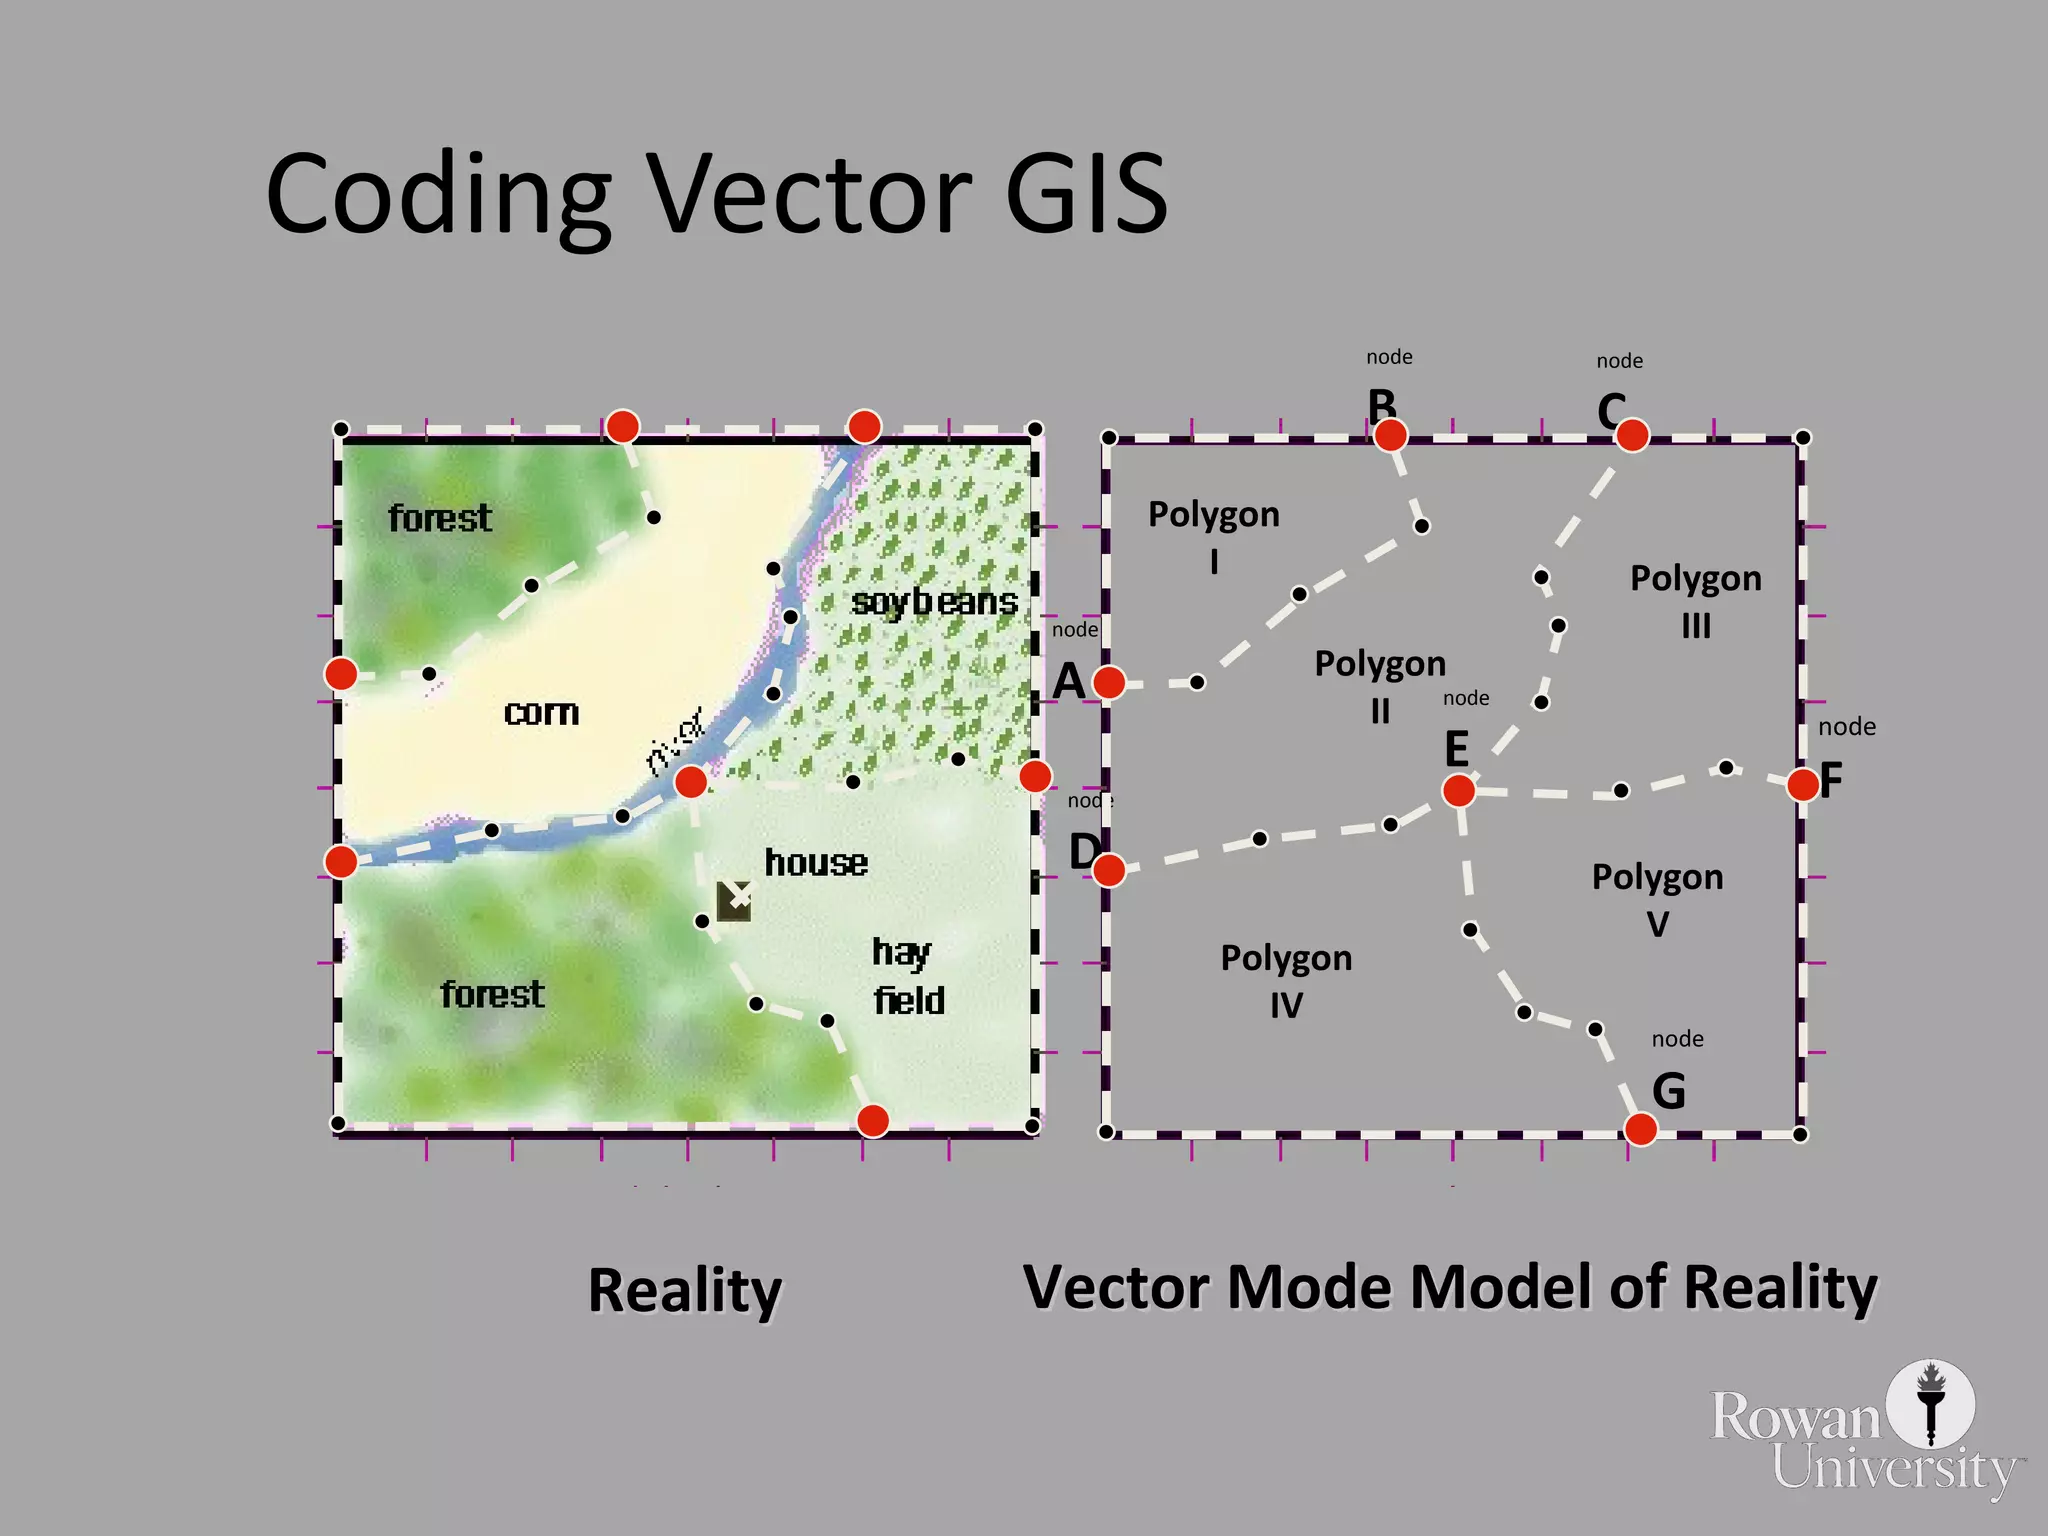
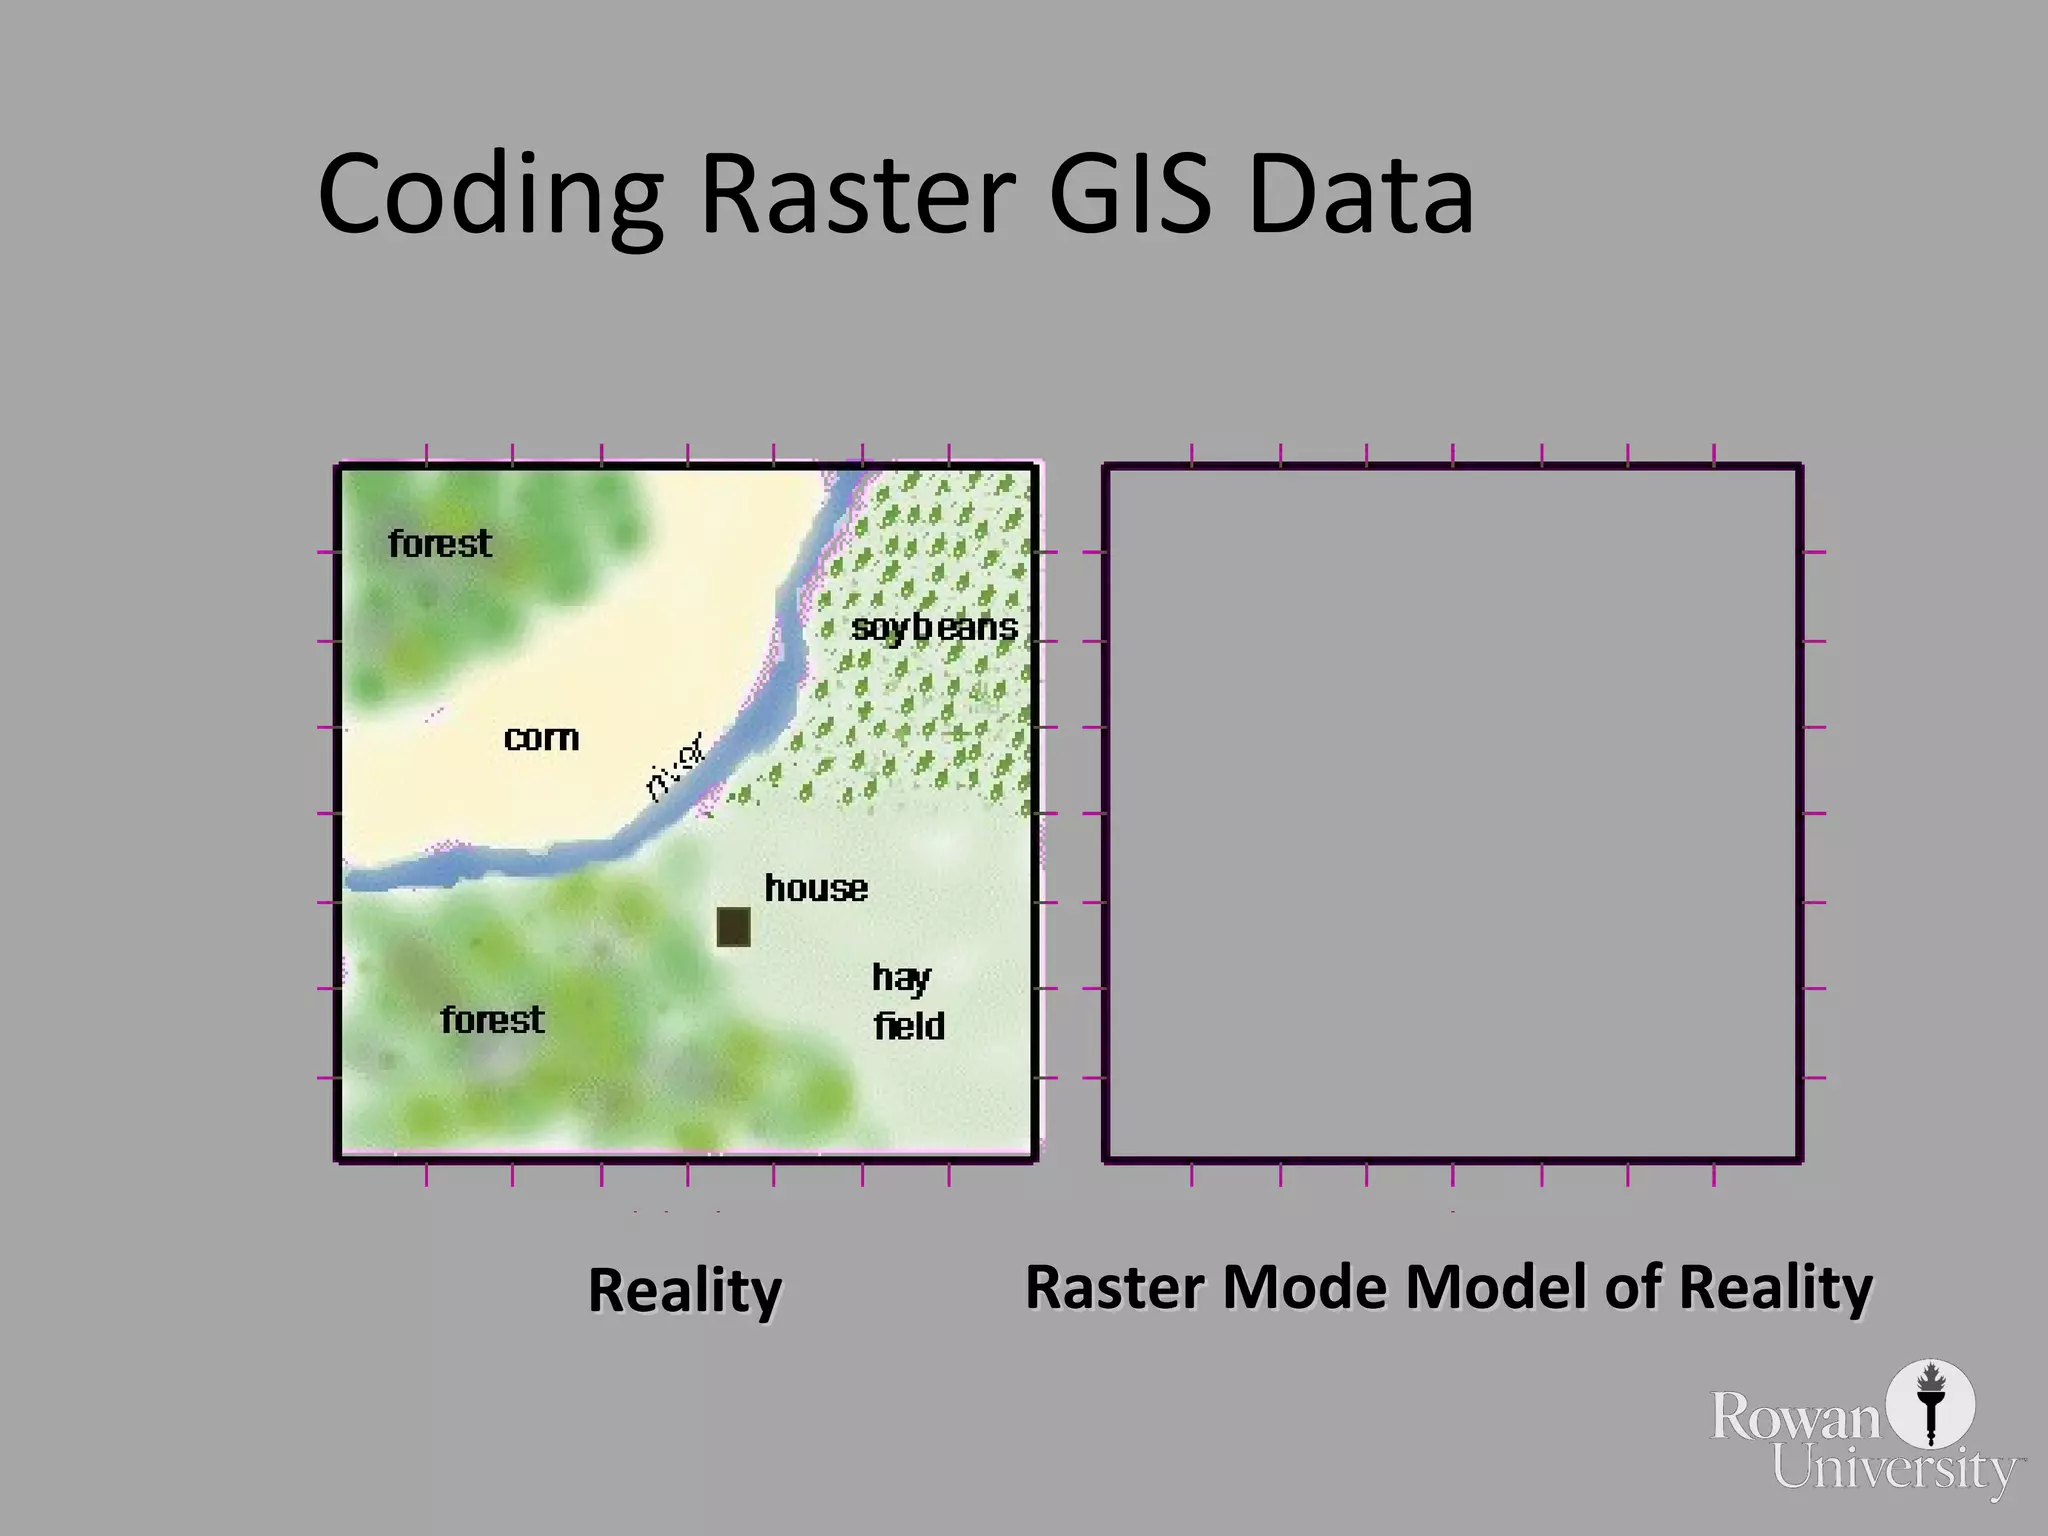
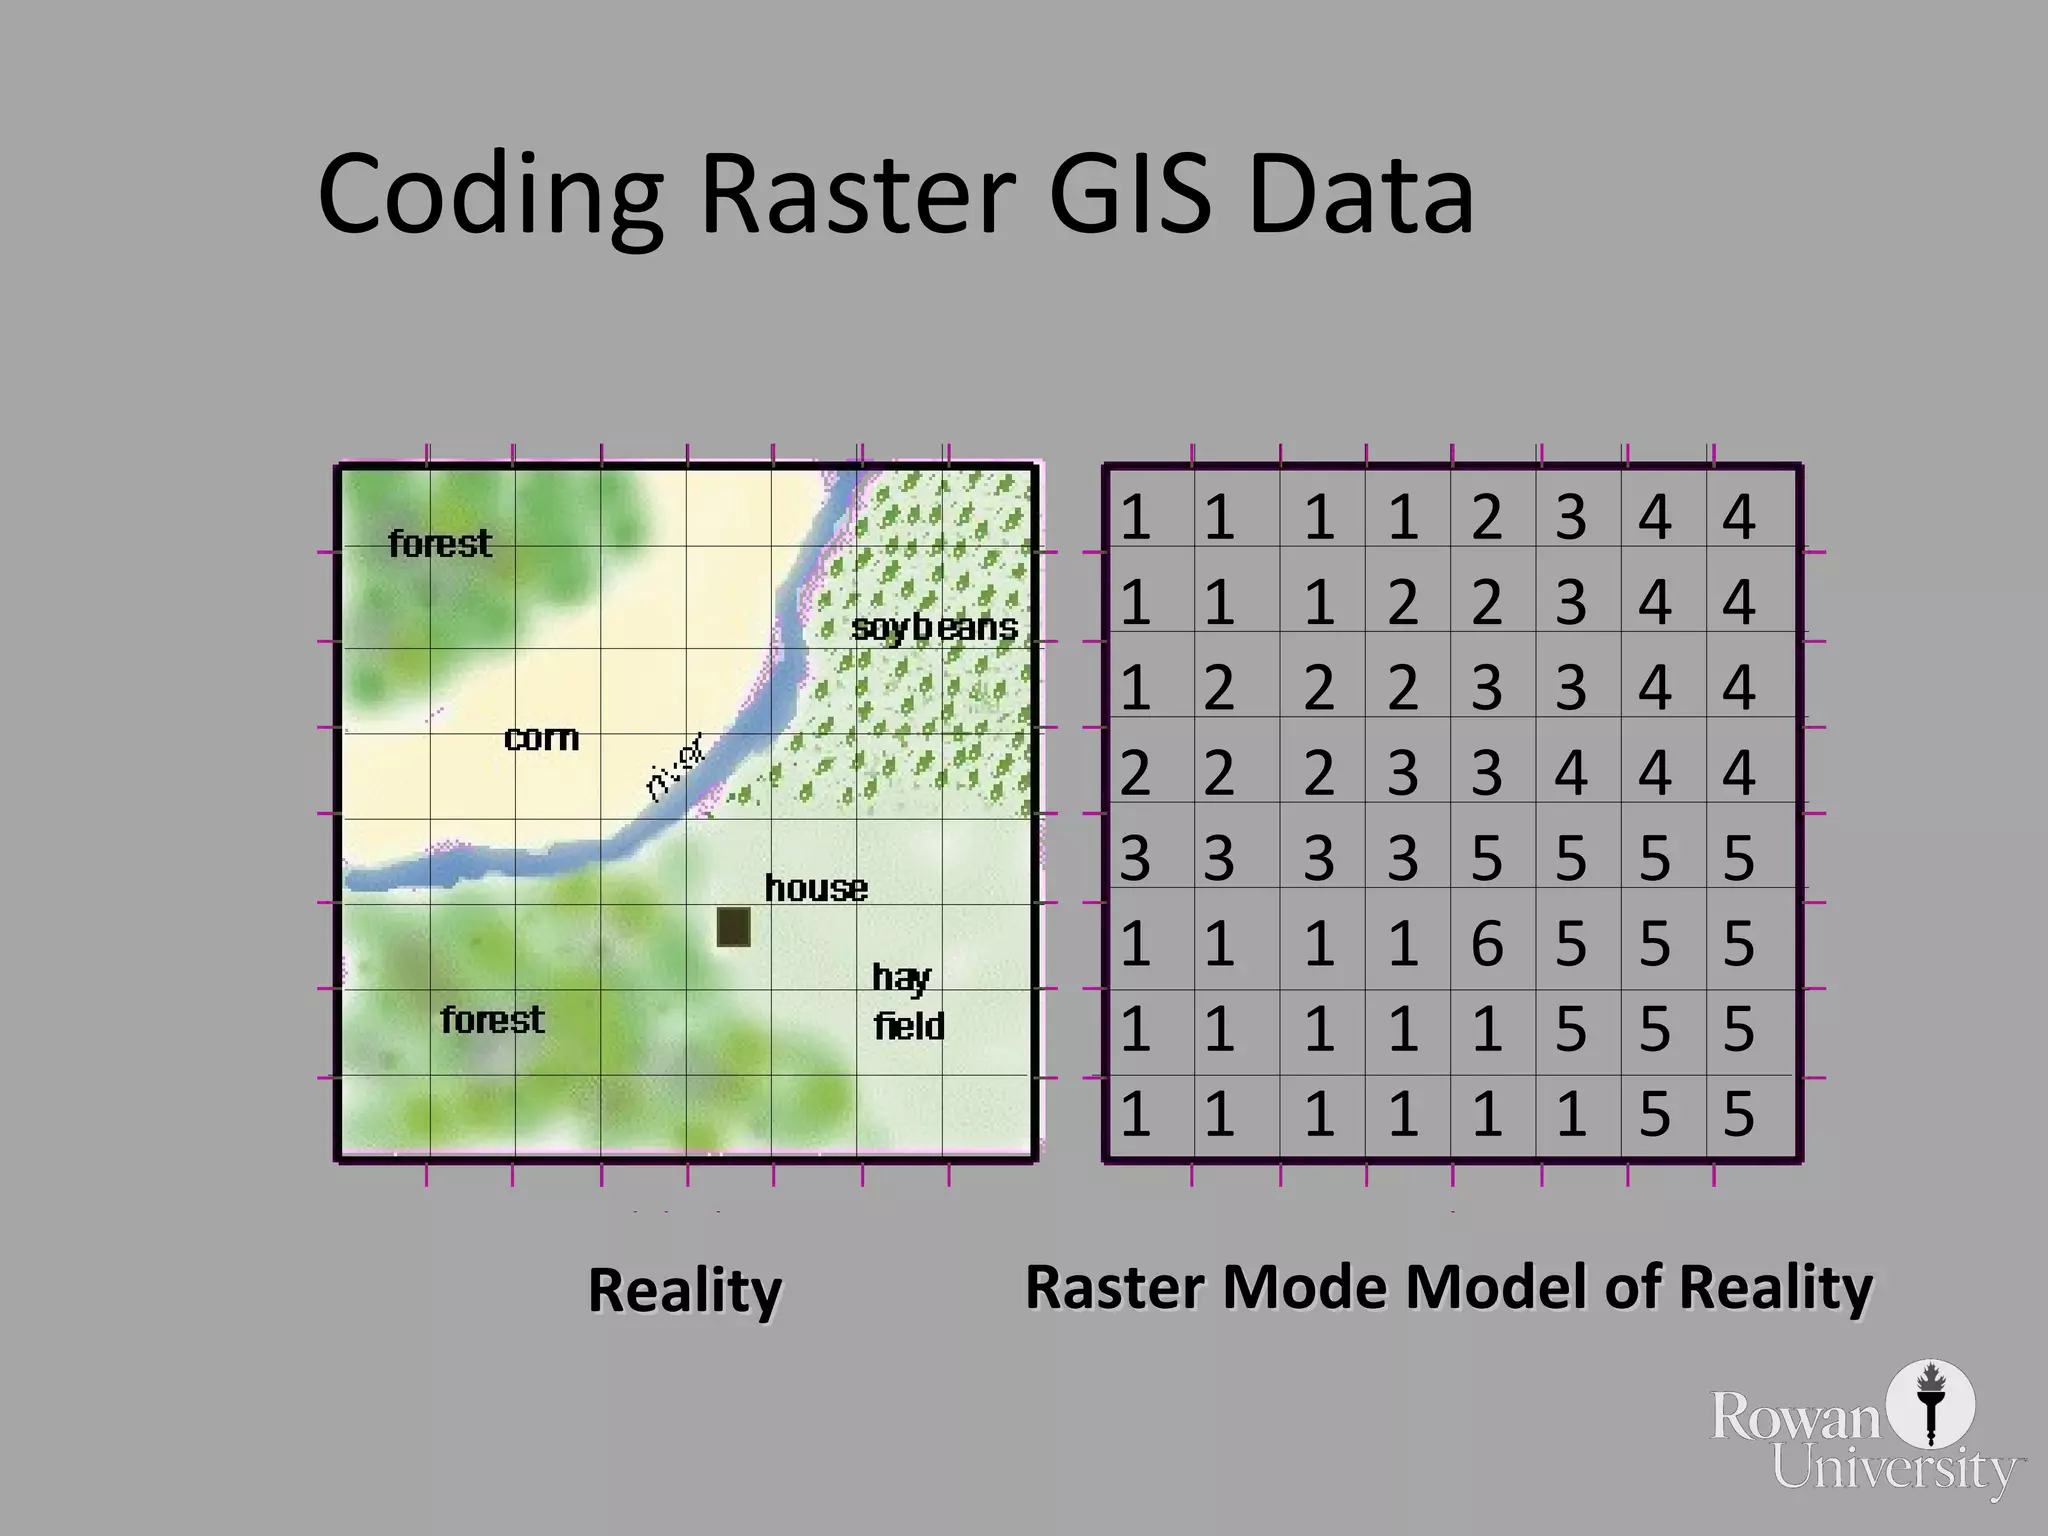
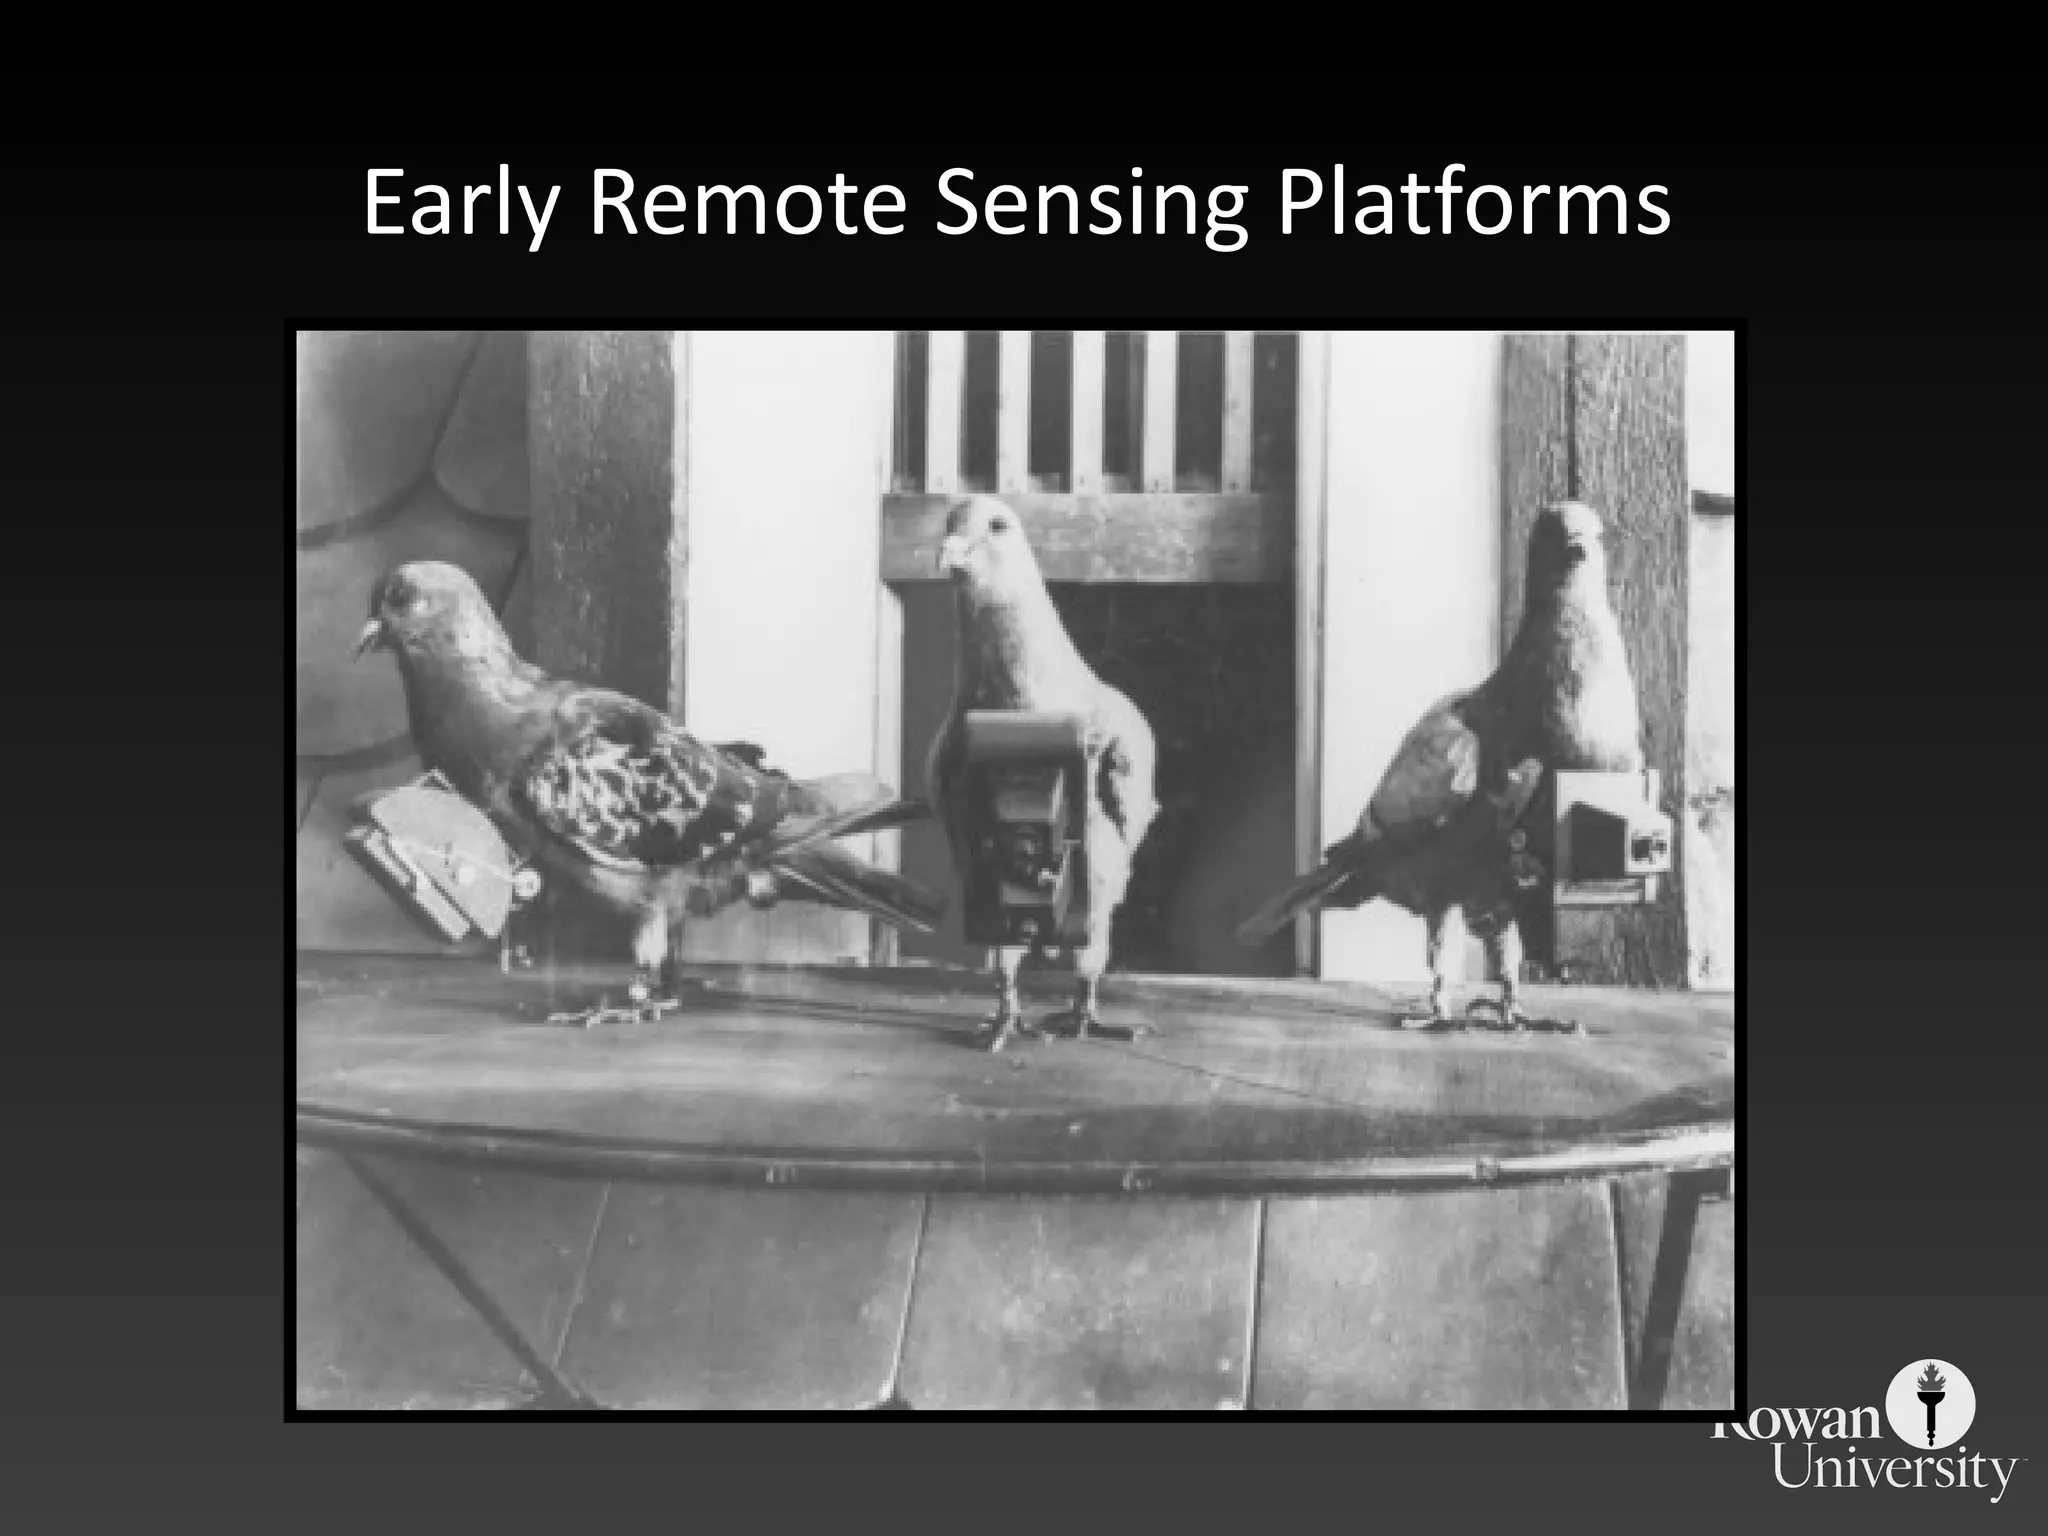
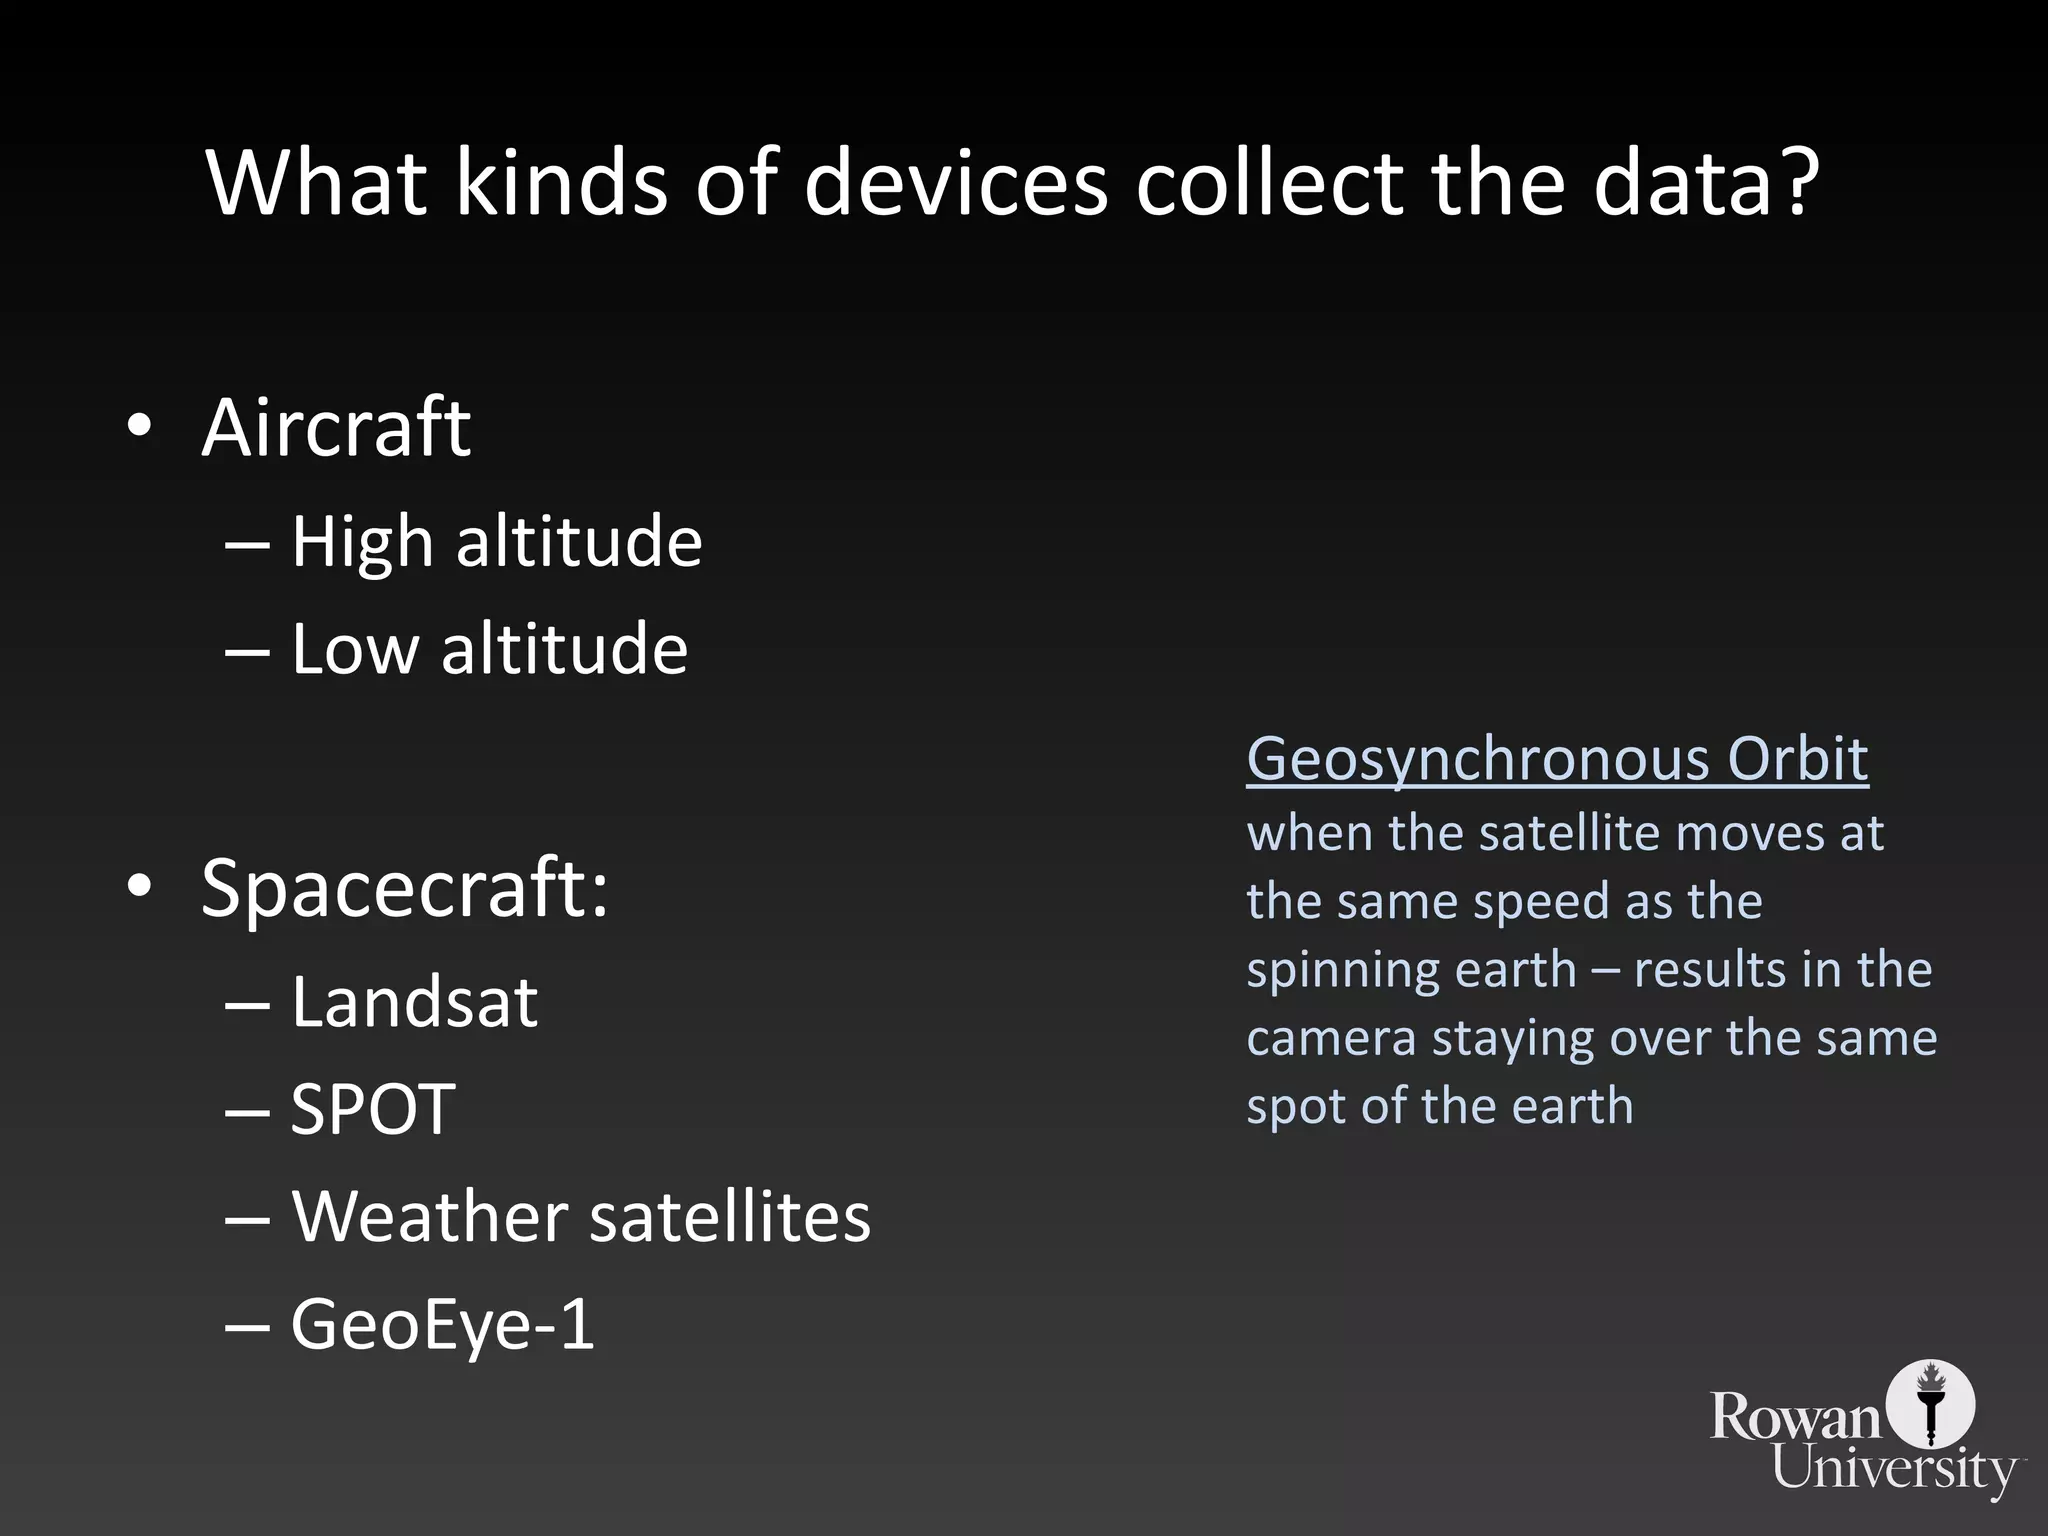
Illustrates the two main data models in GIS: vector (coordinate-based) and raster (grid-based), detailing their attributes and applications.Introduces remote sensing data collection from various platforms, emphasizing its significance for GIS applications and resolving geospatial issues.
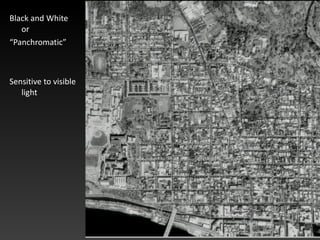
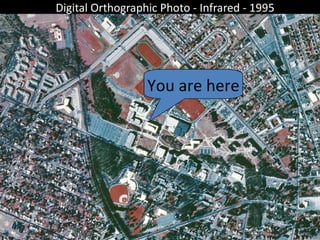
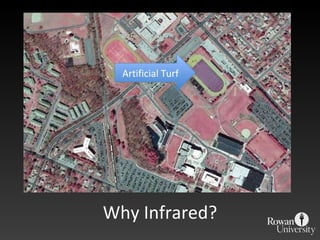
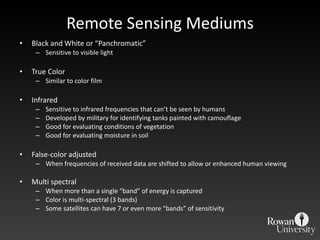
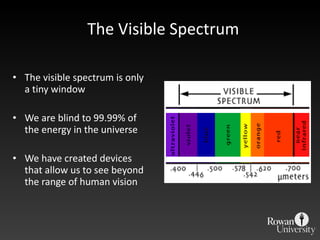
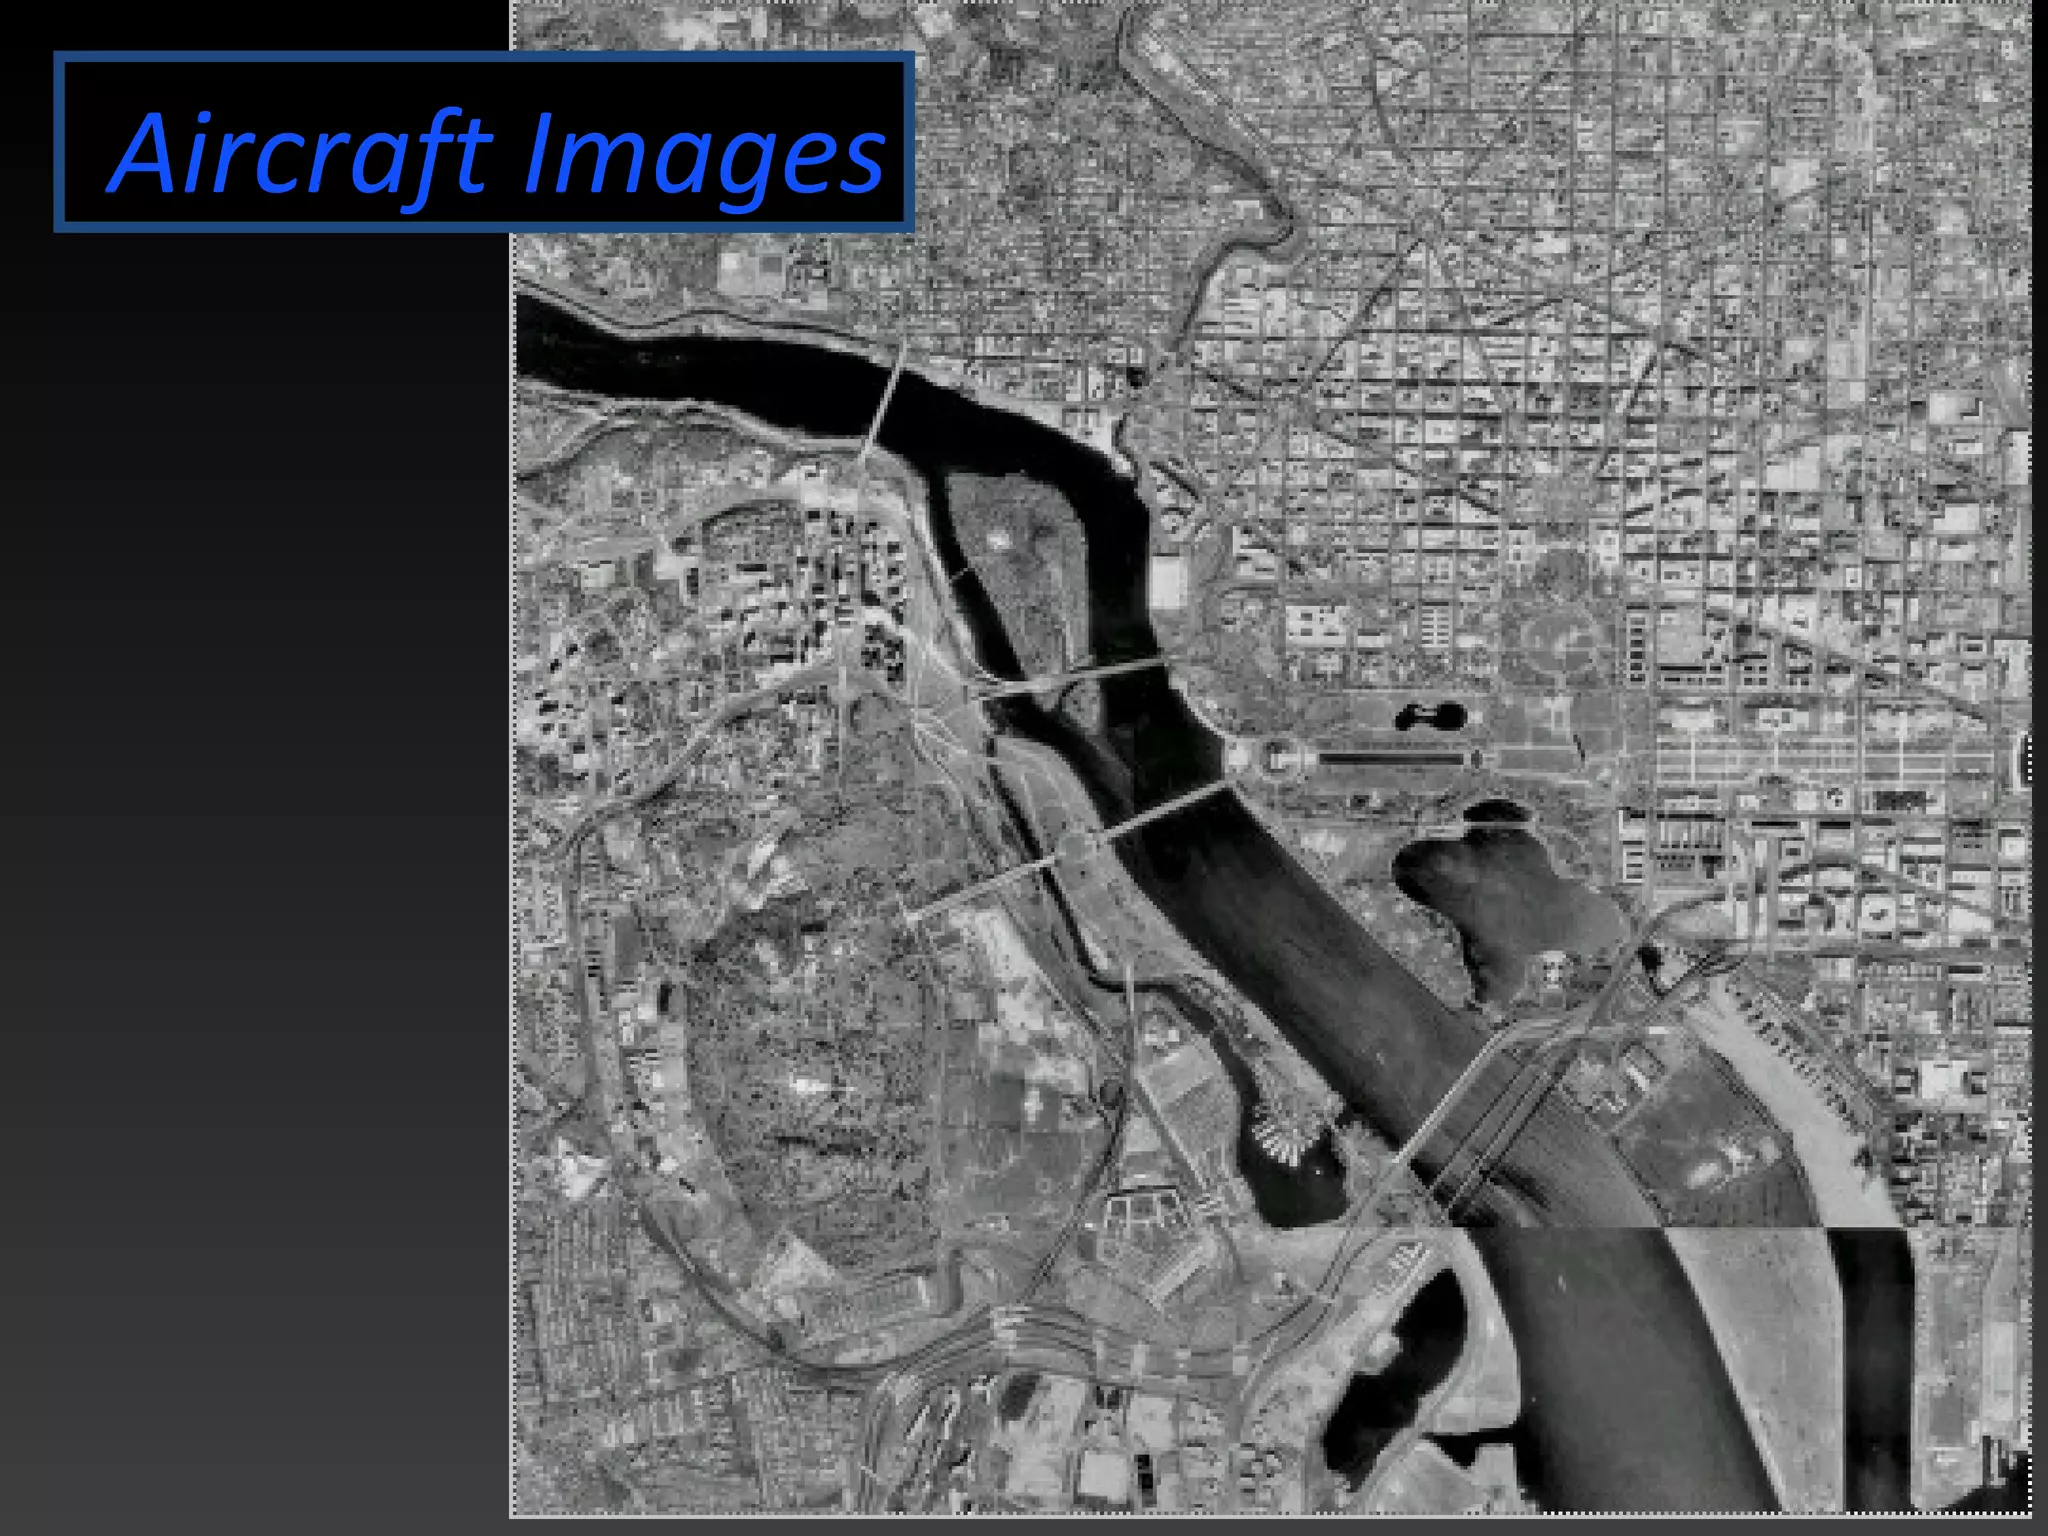
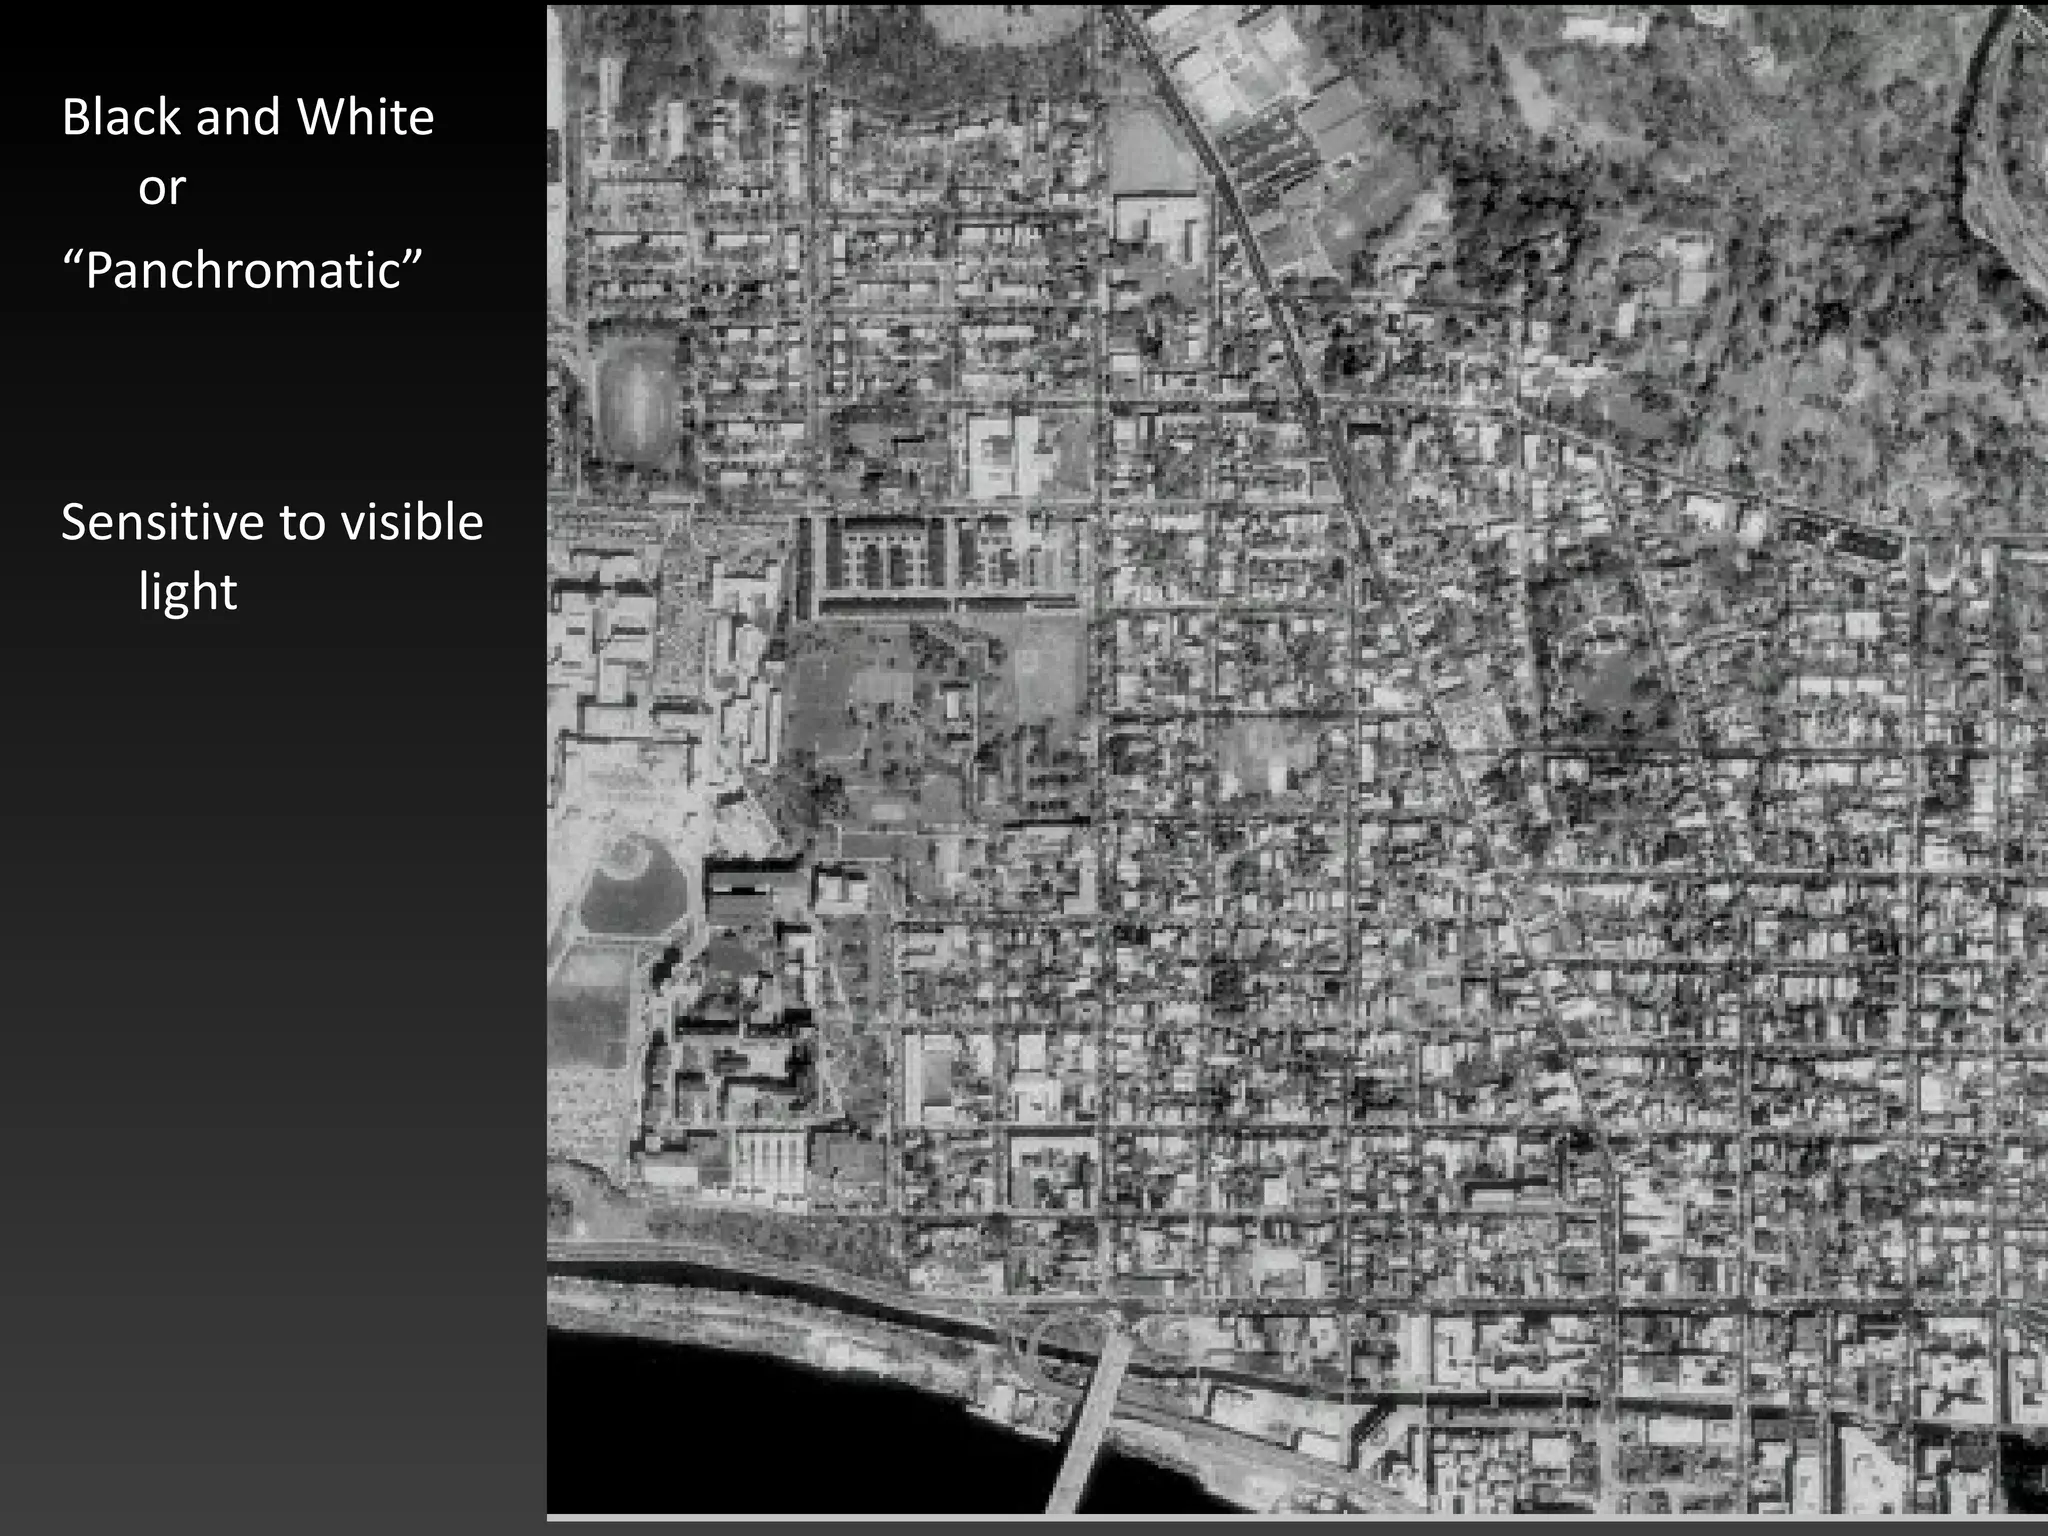
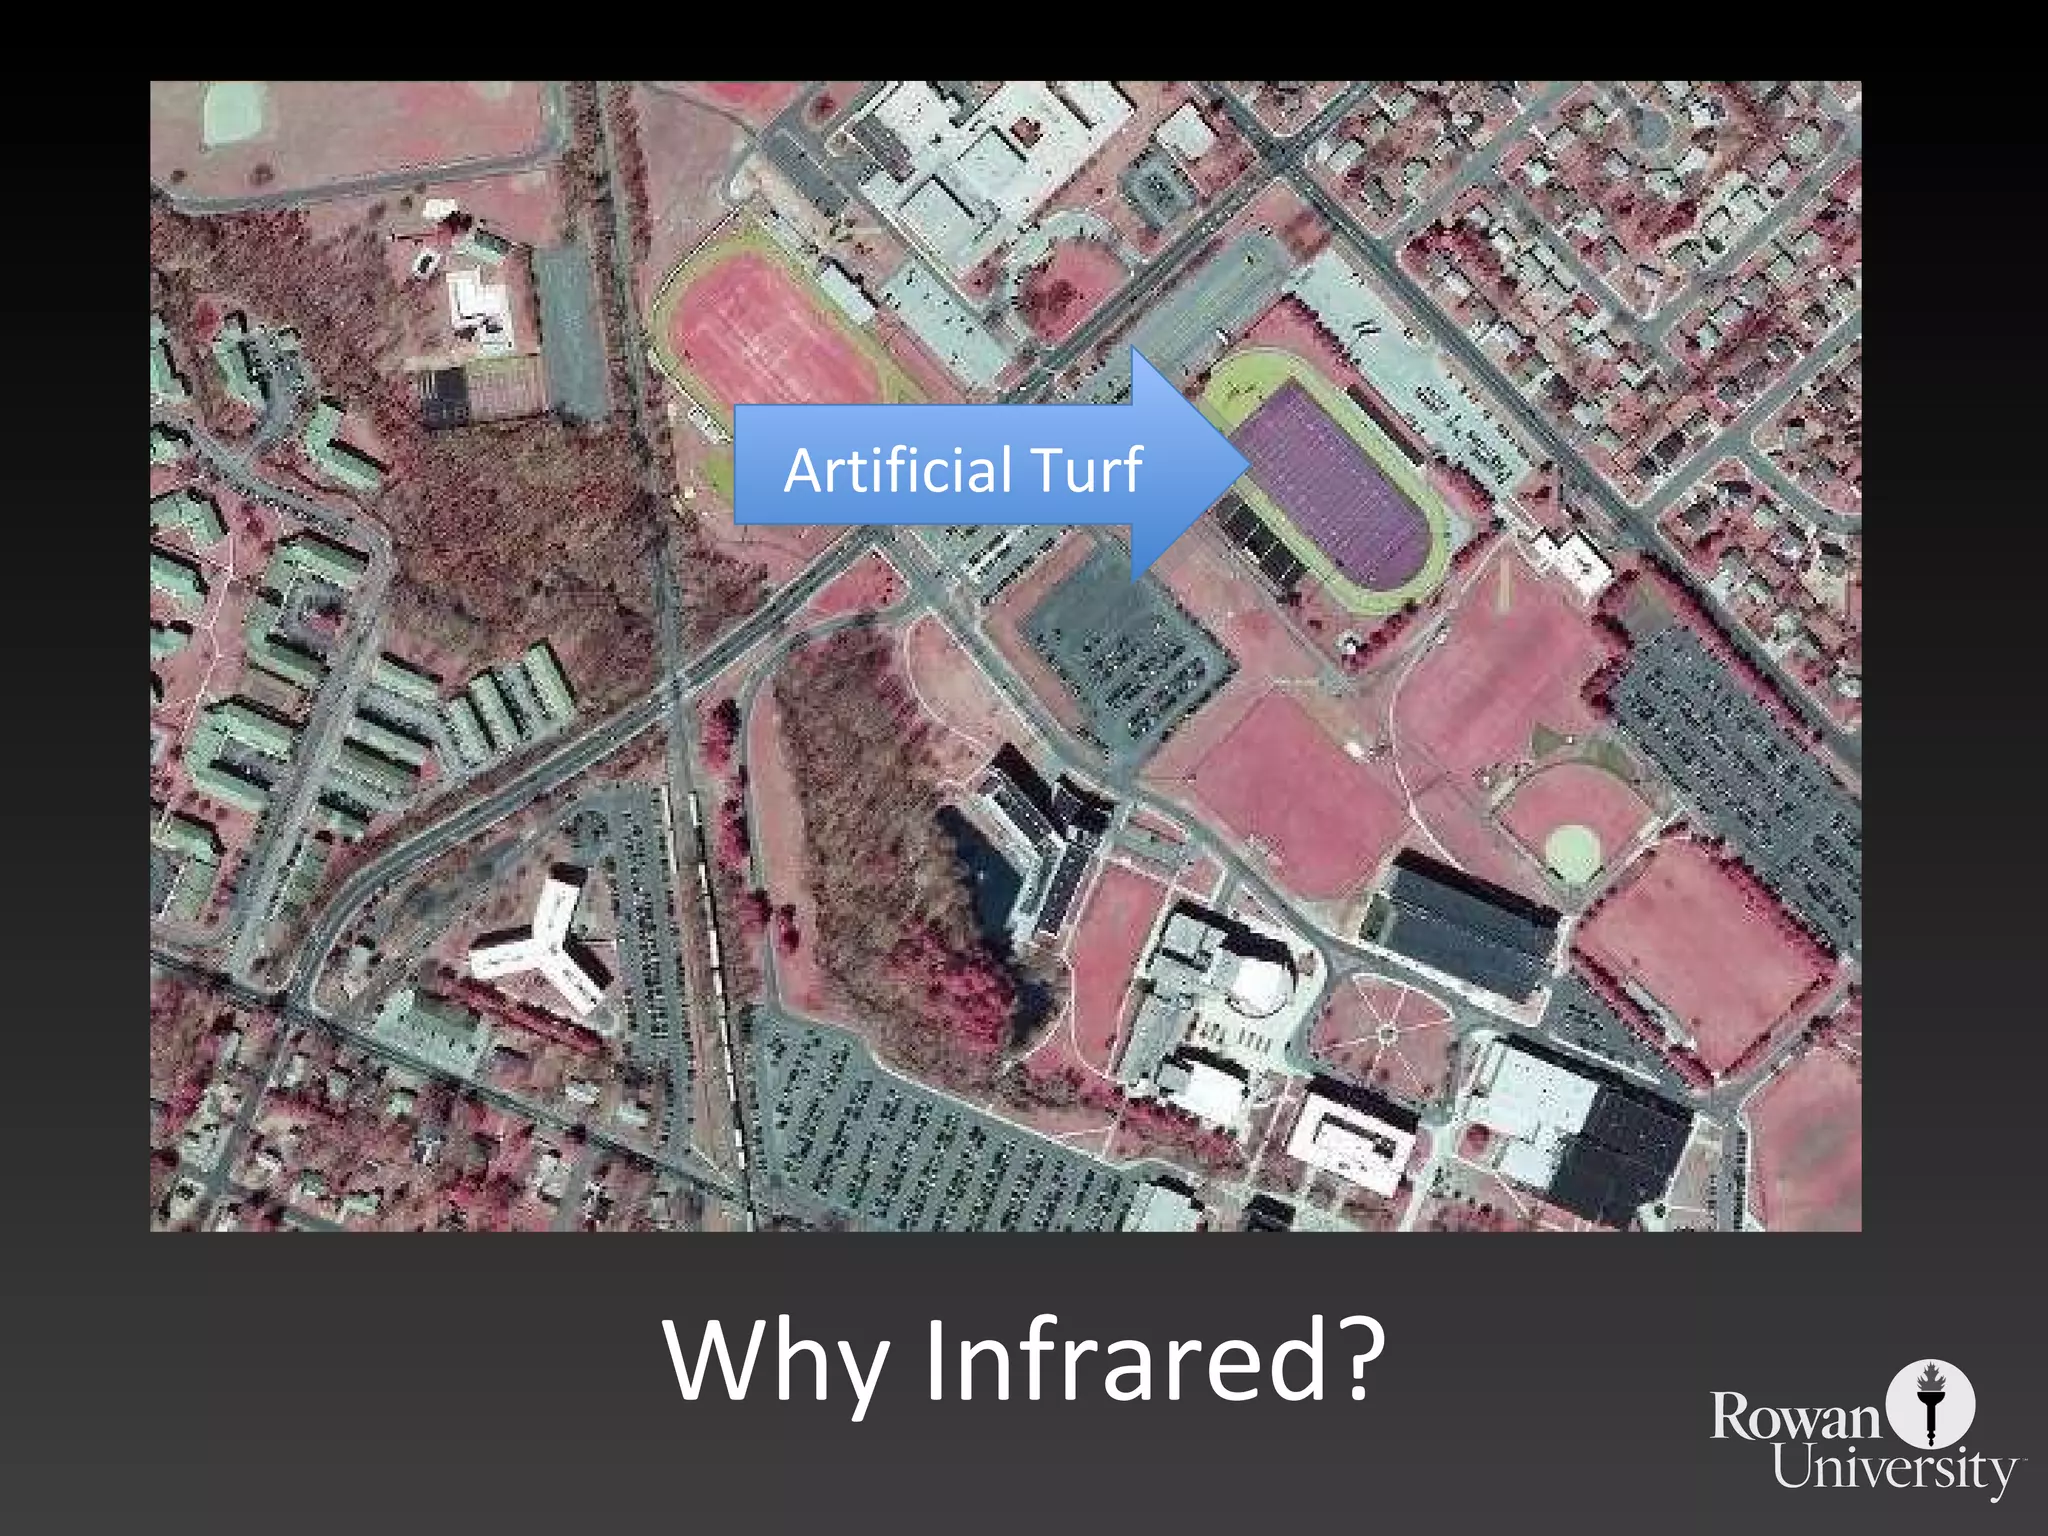
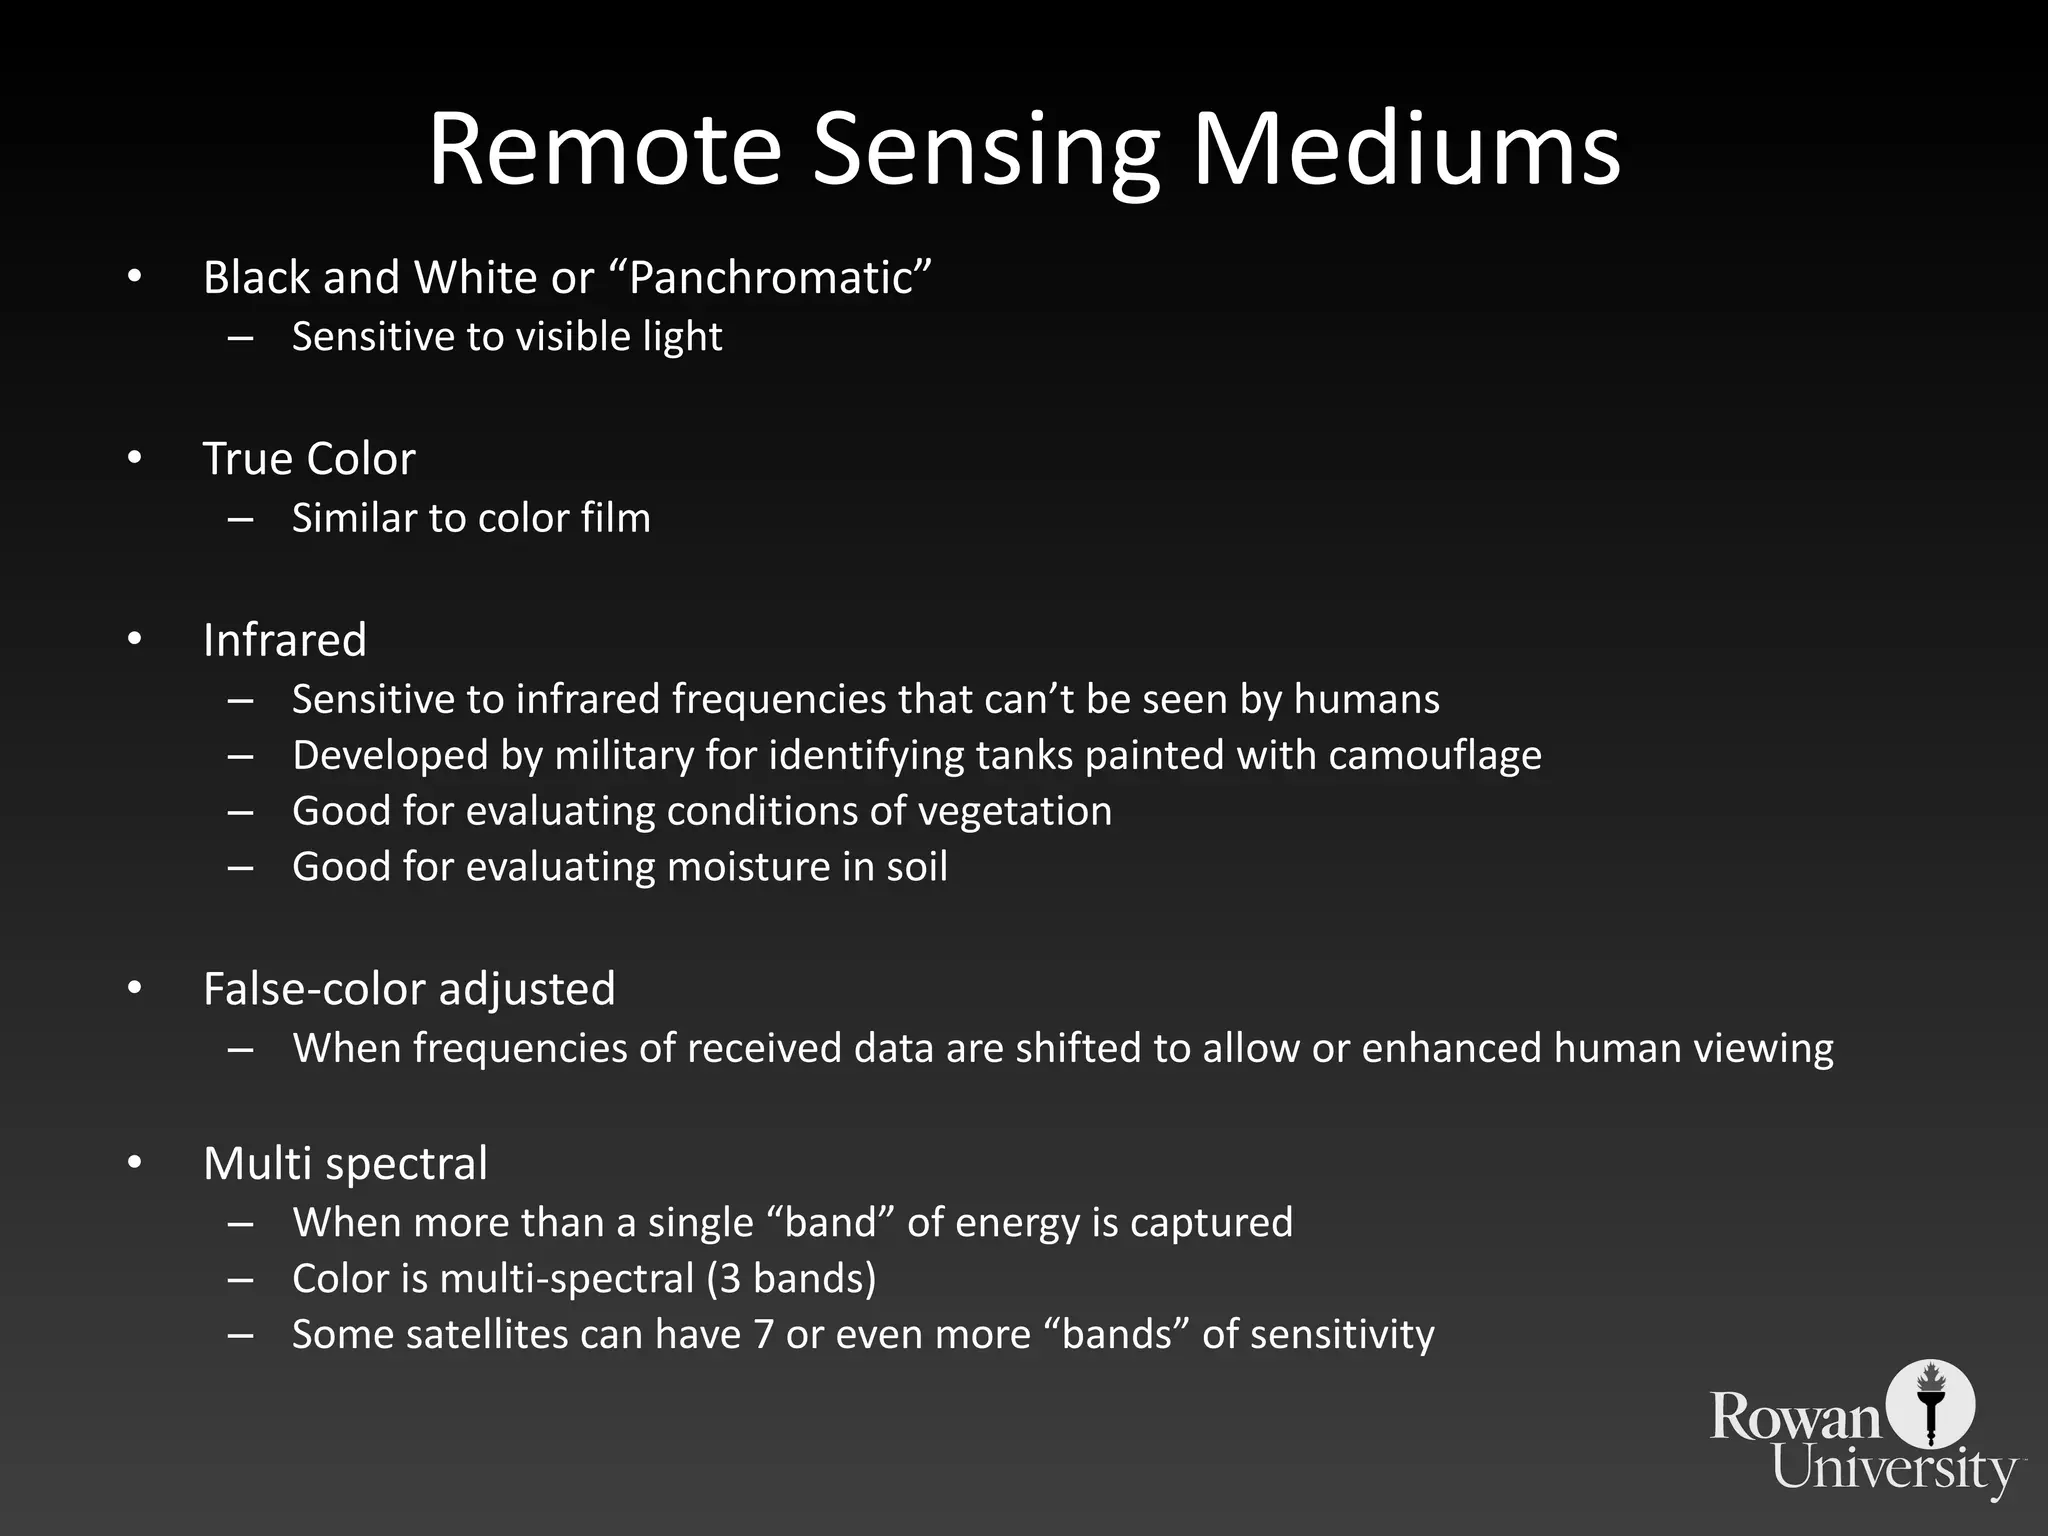
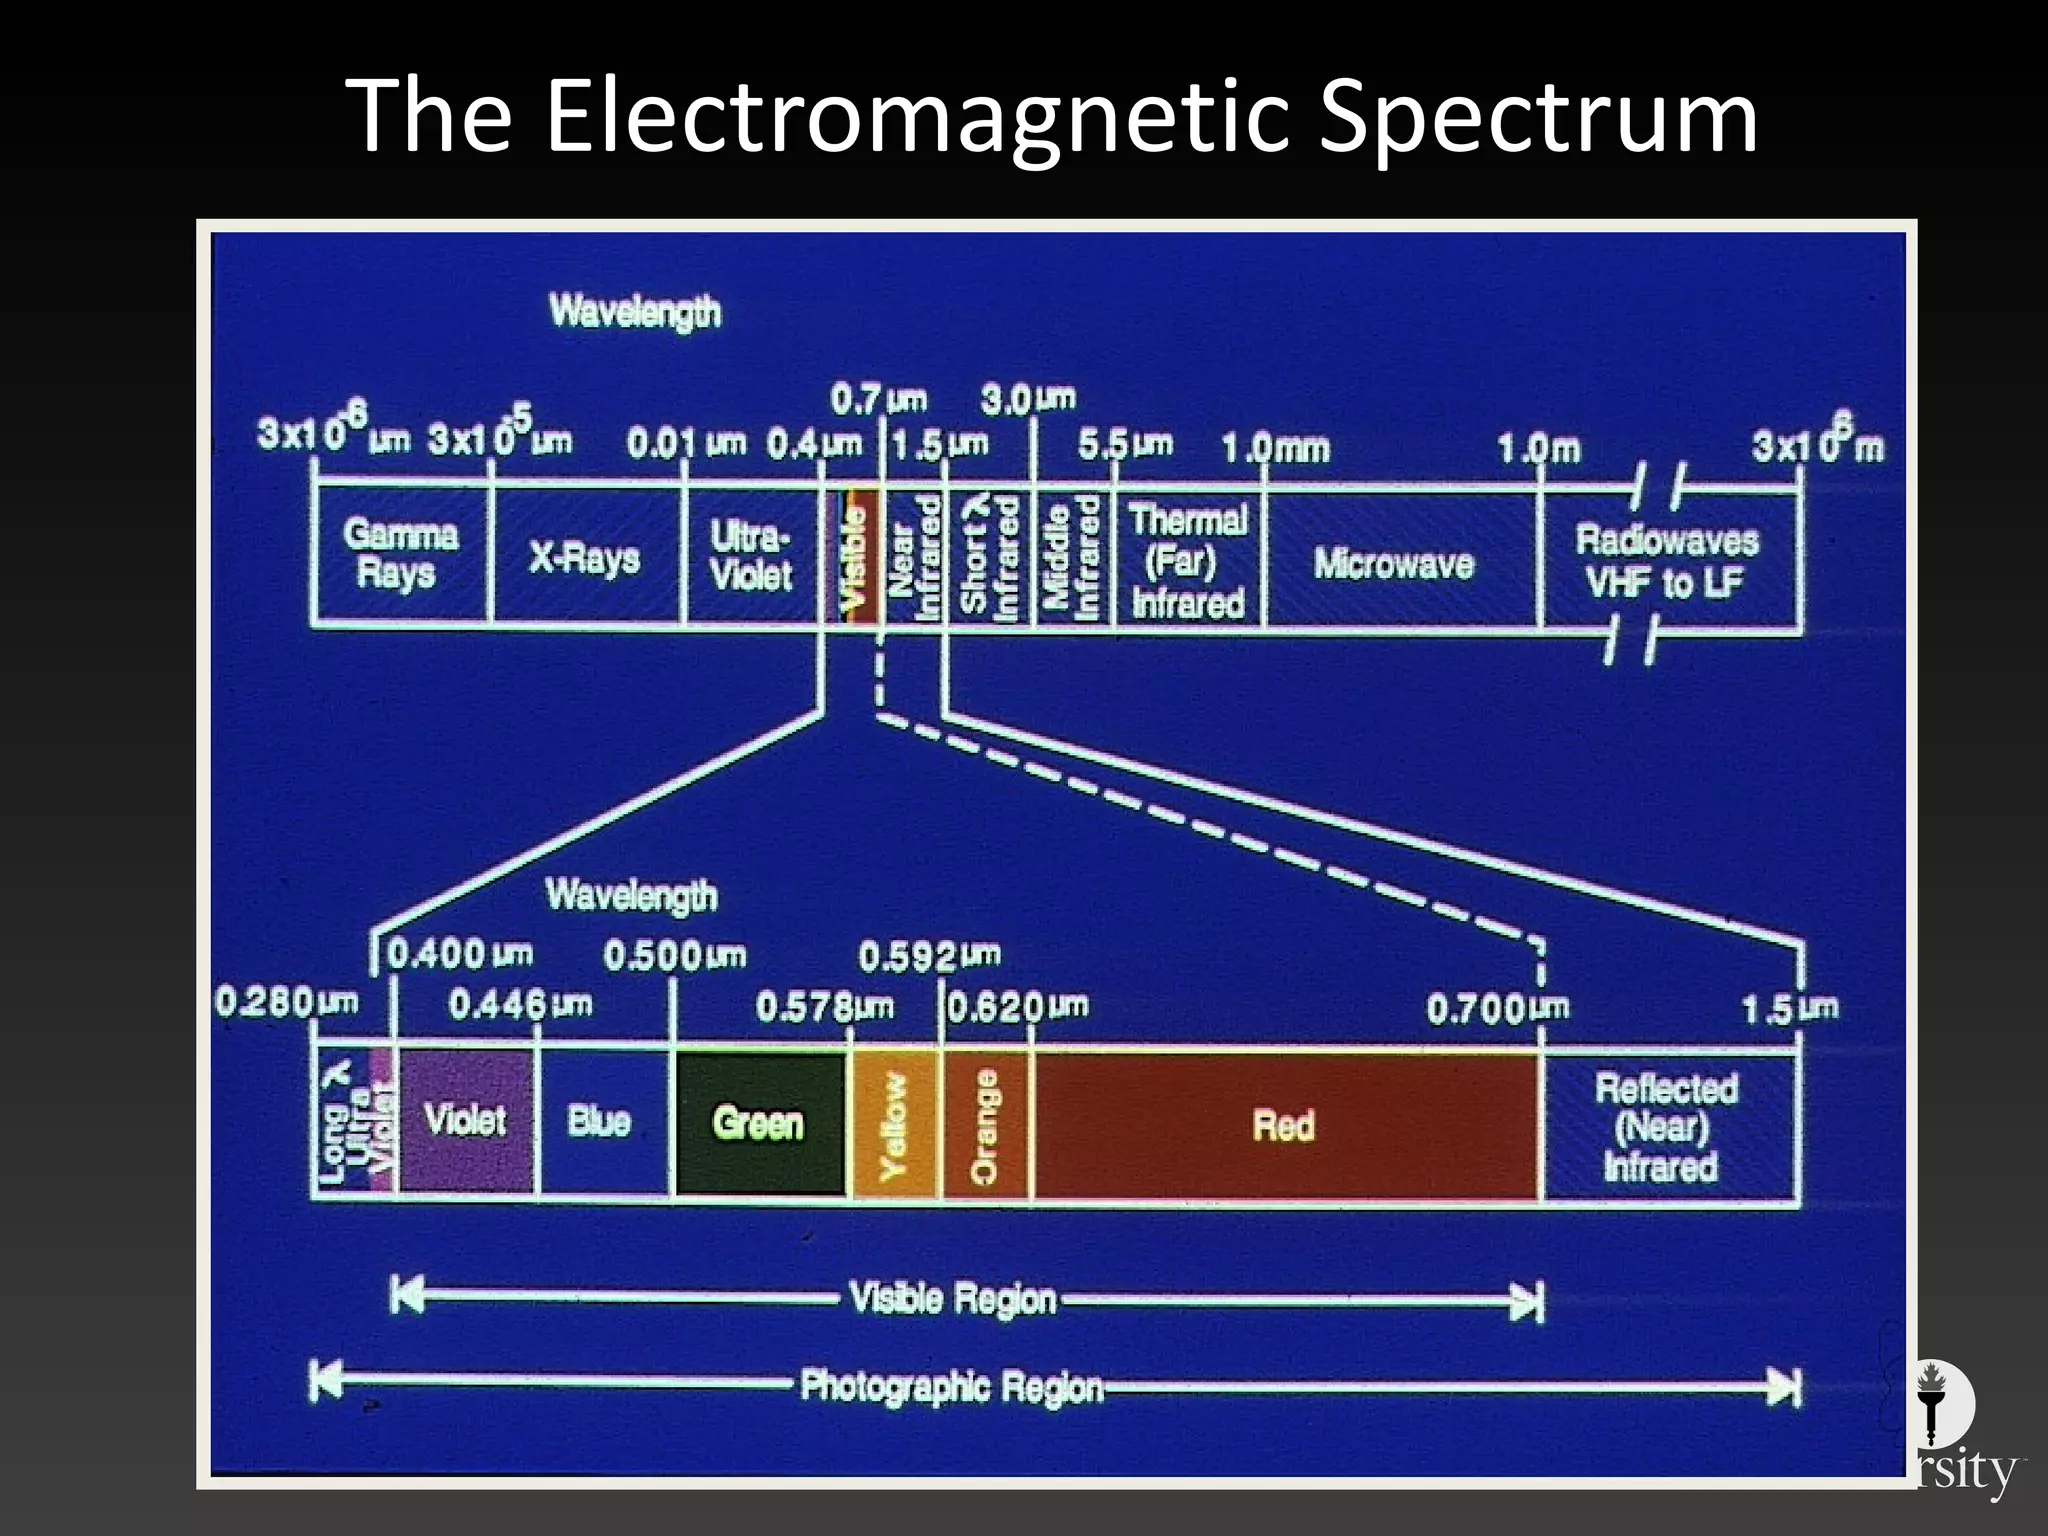
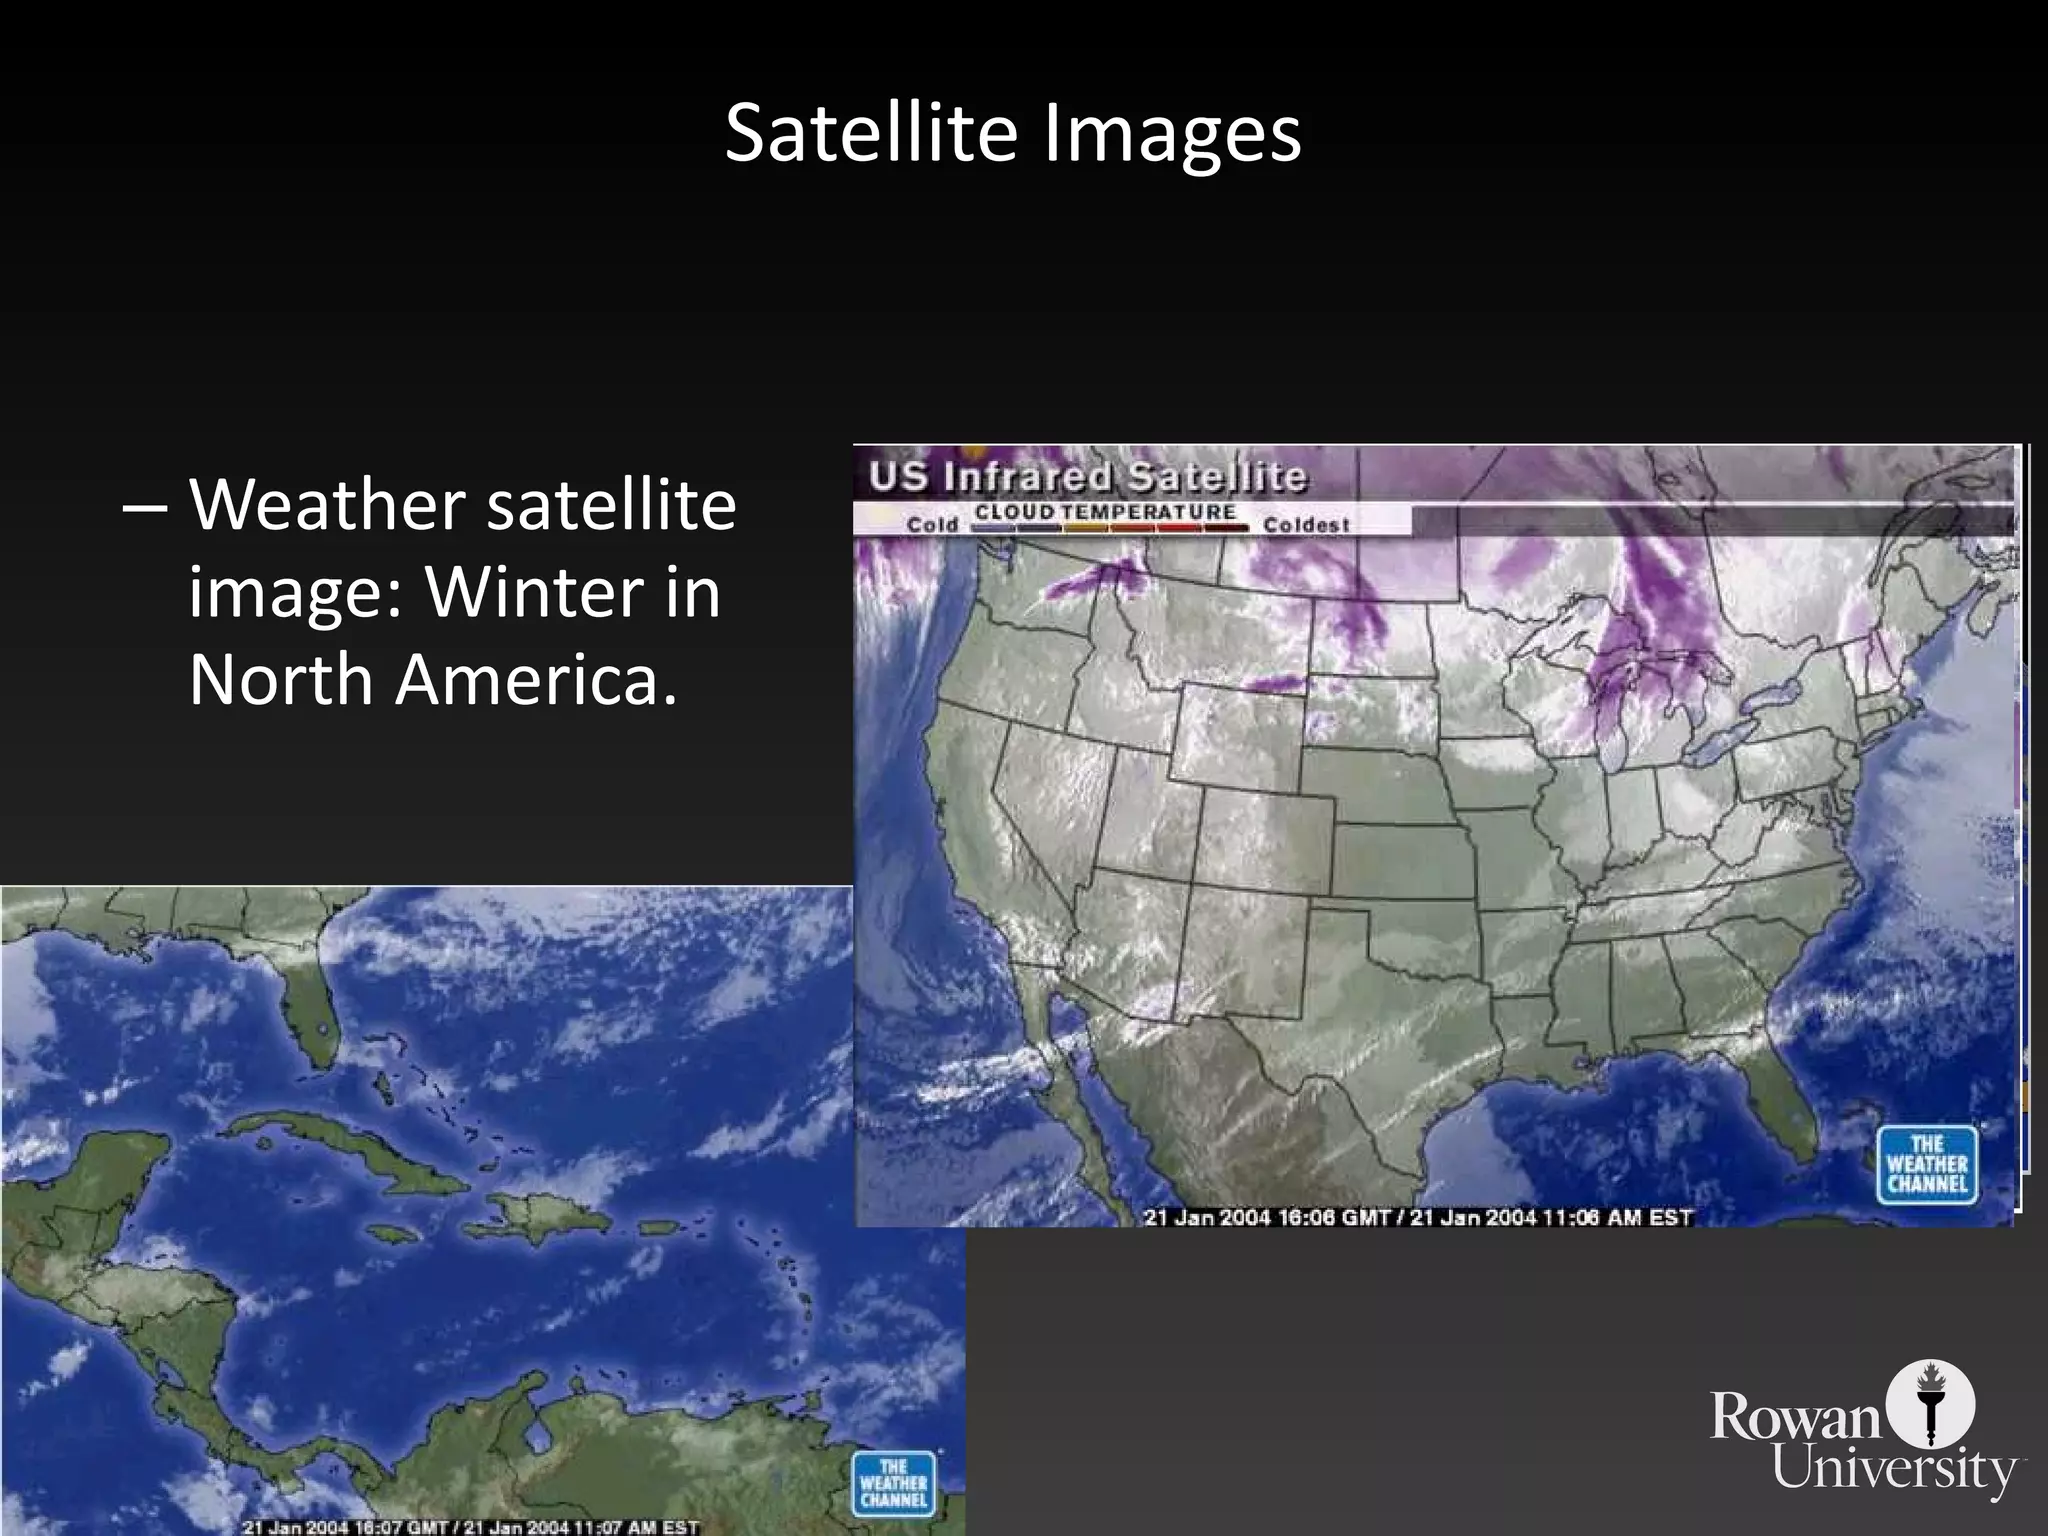
Describes various imaging techniques and devices used to capture data, detailing the visible spectrum and the importance of electromagnetic energy.
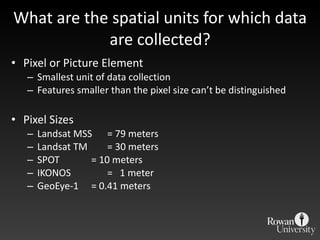
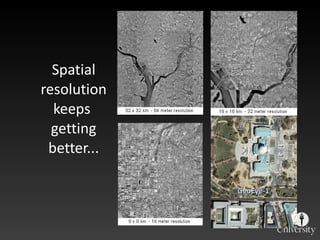
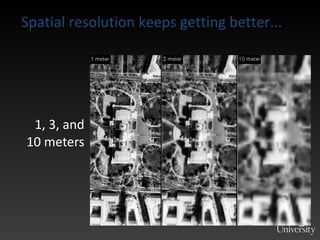
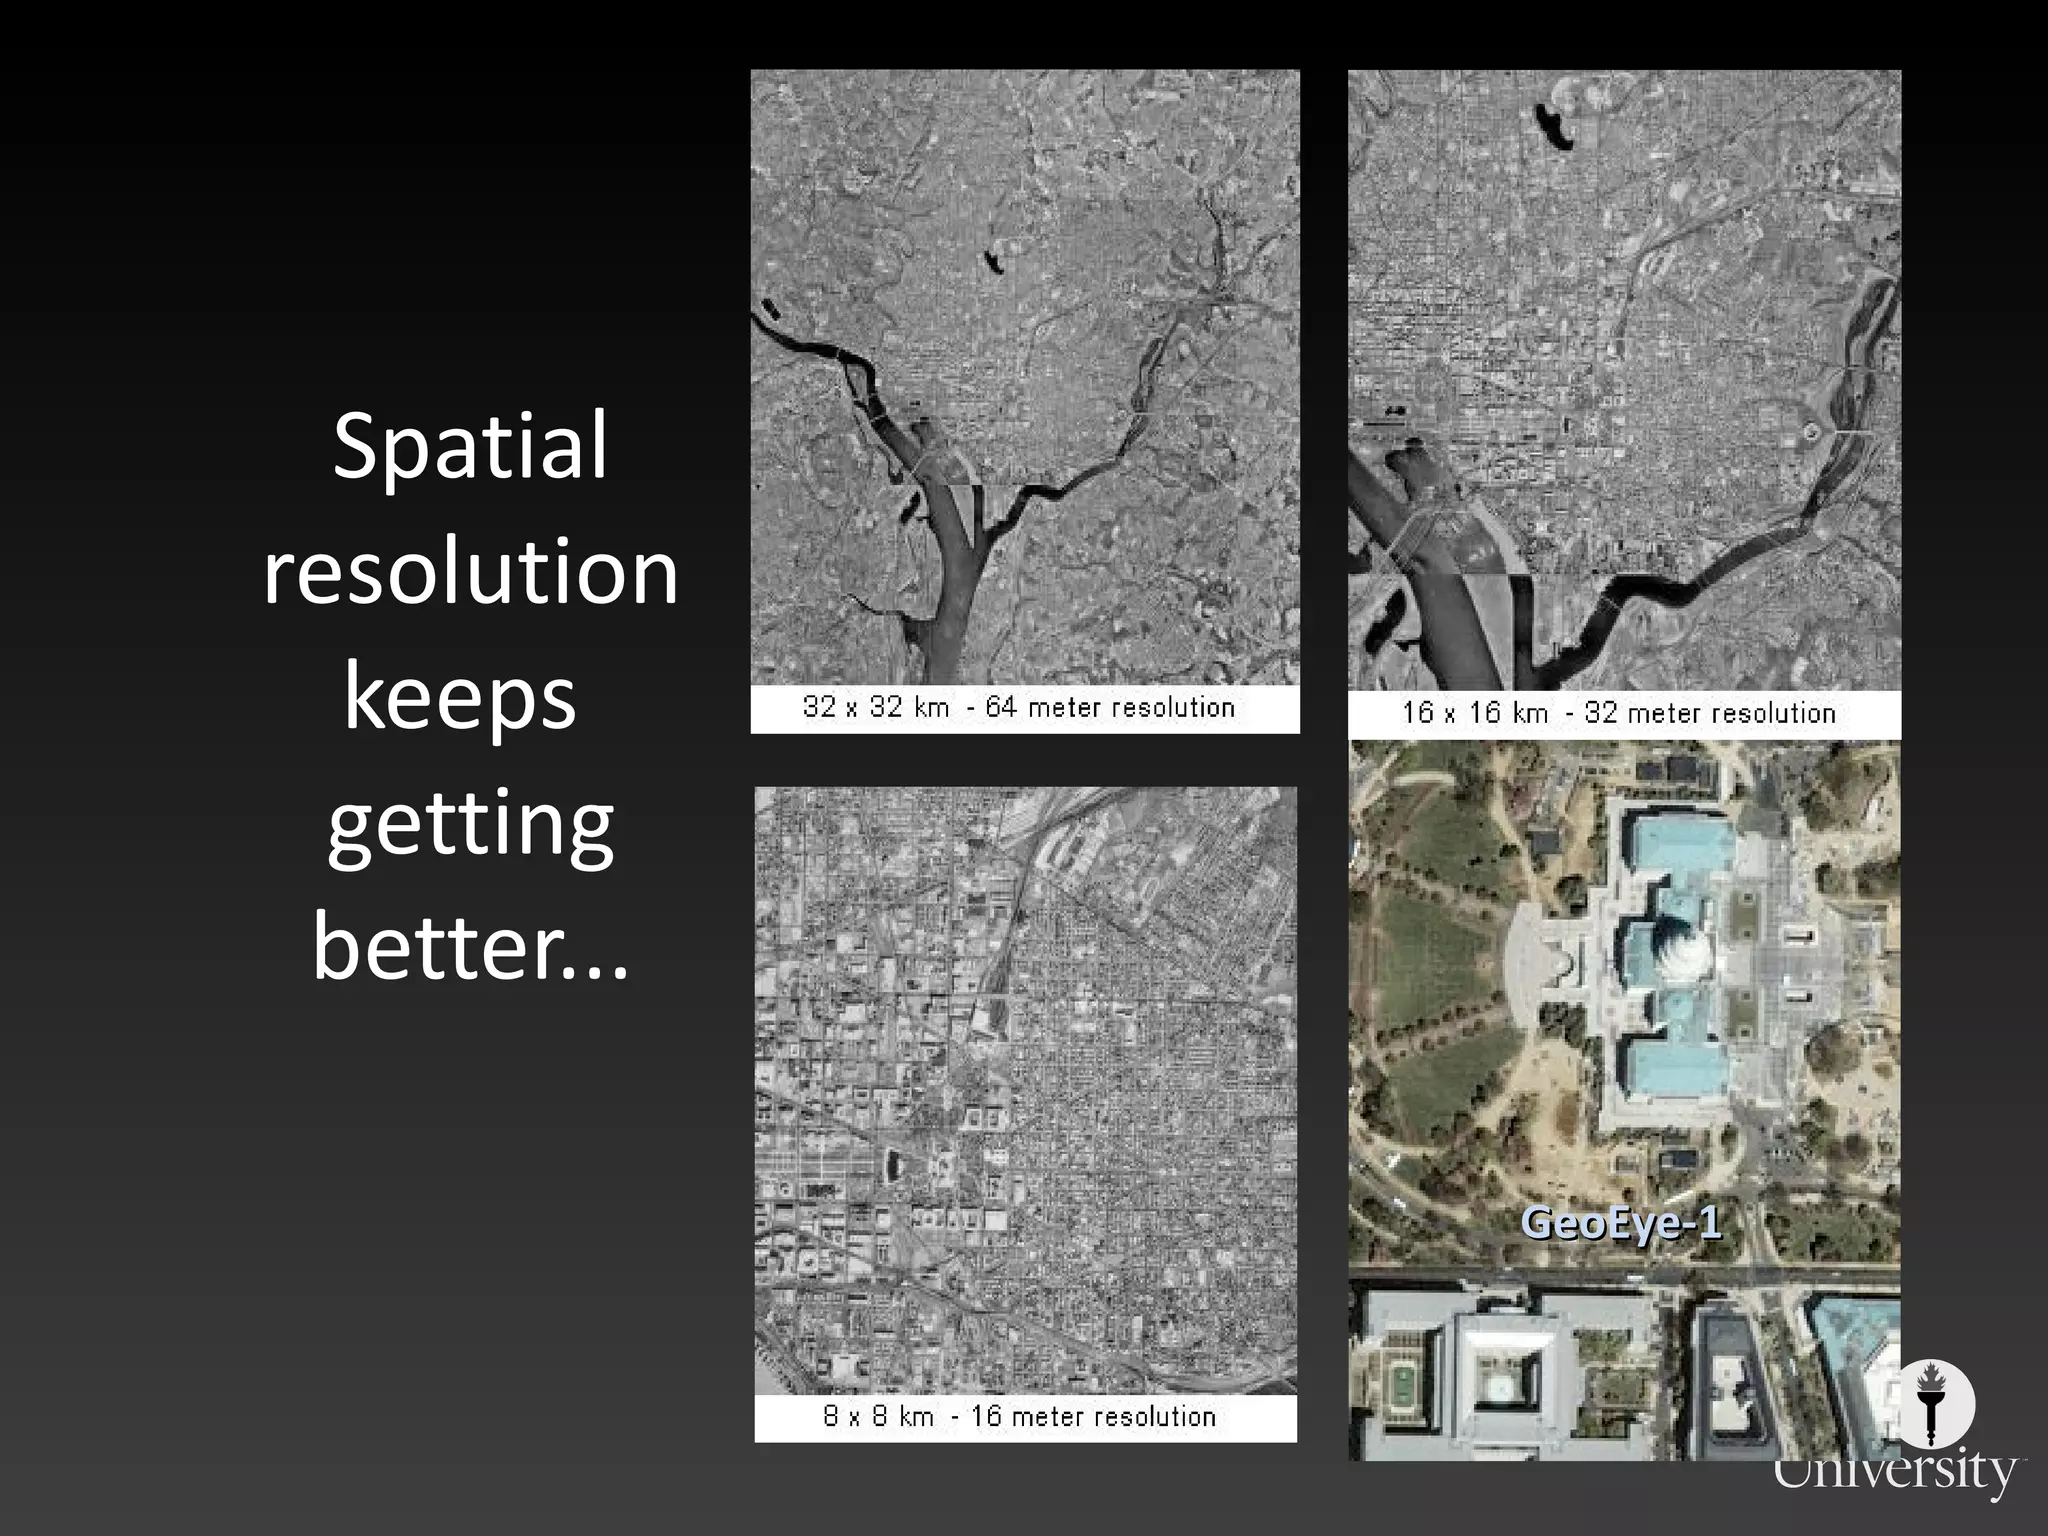
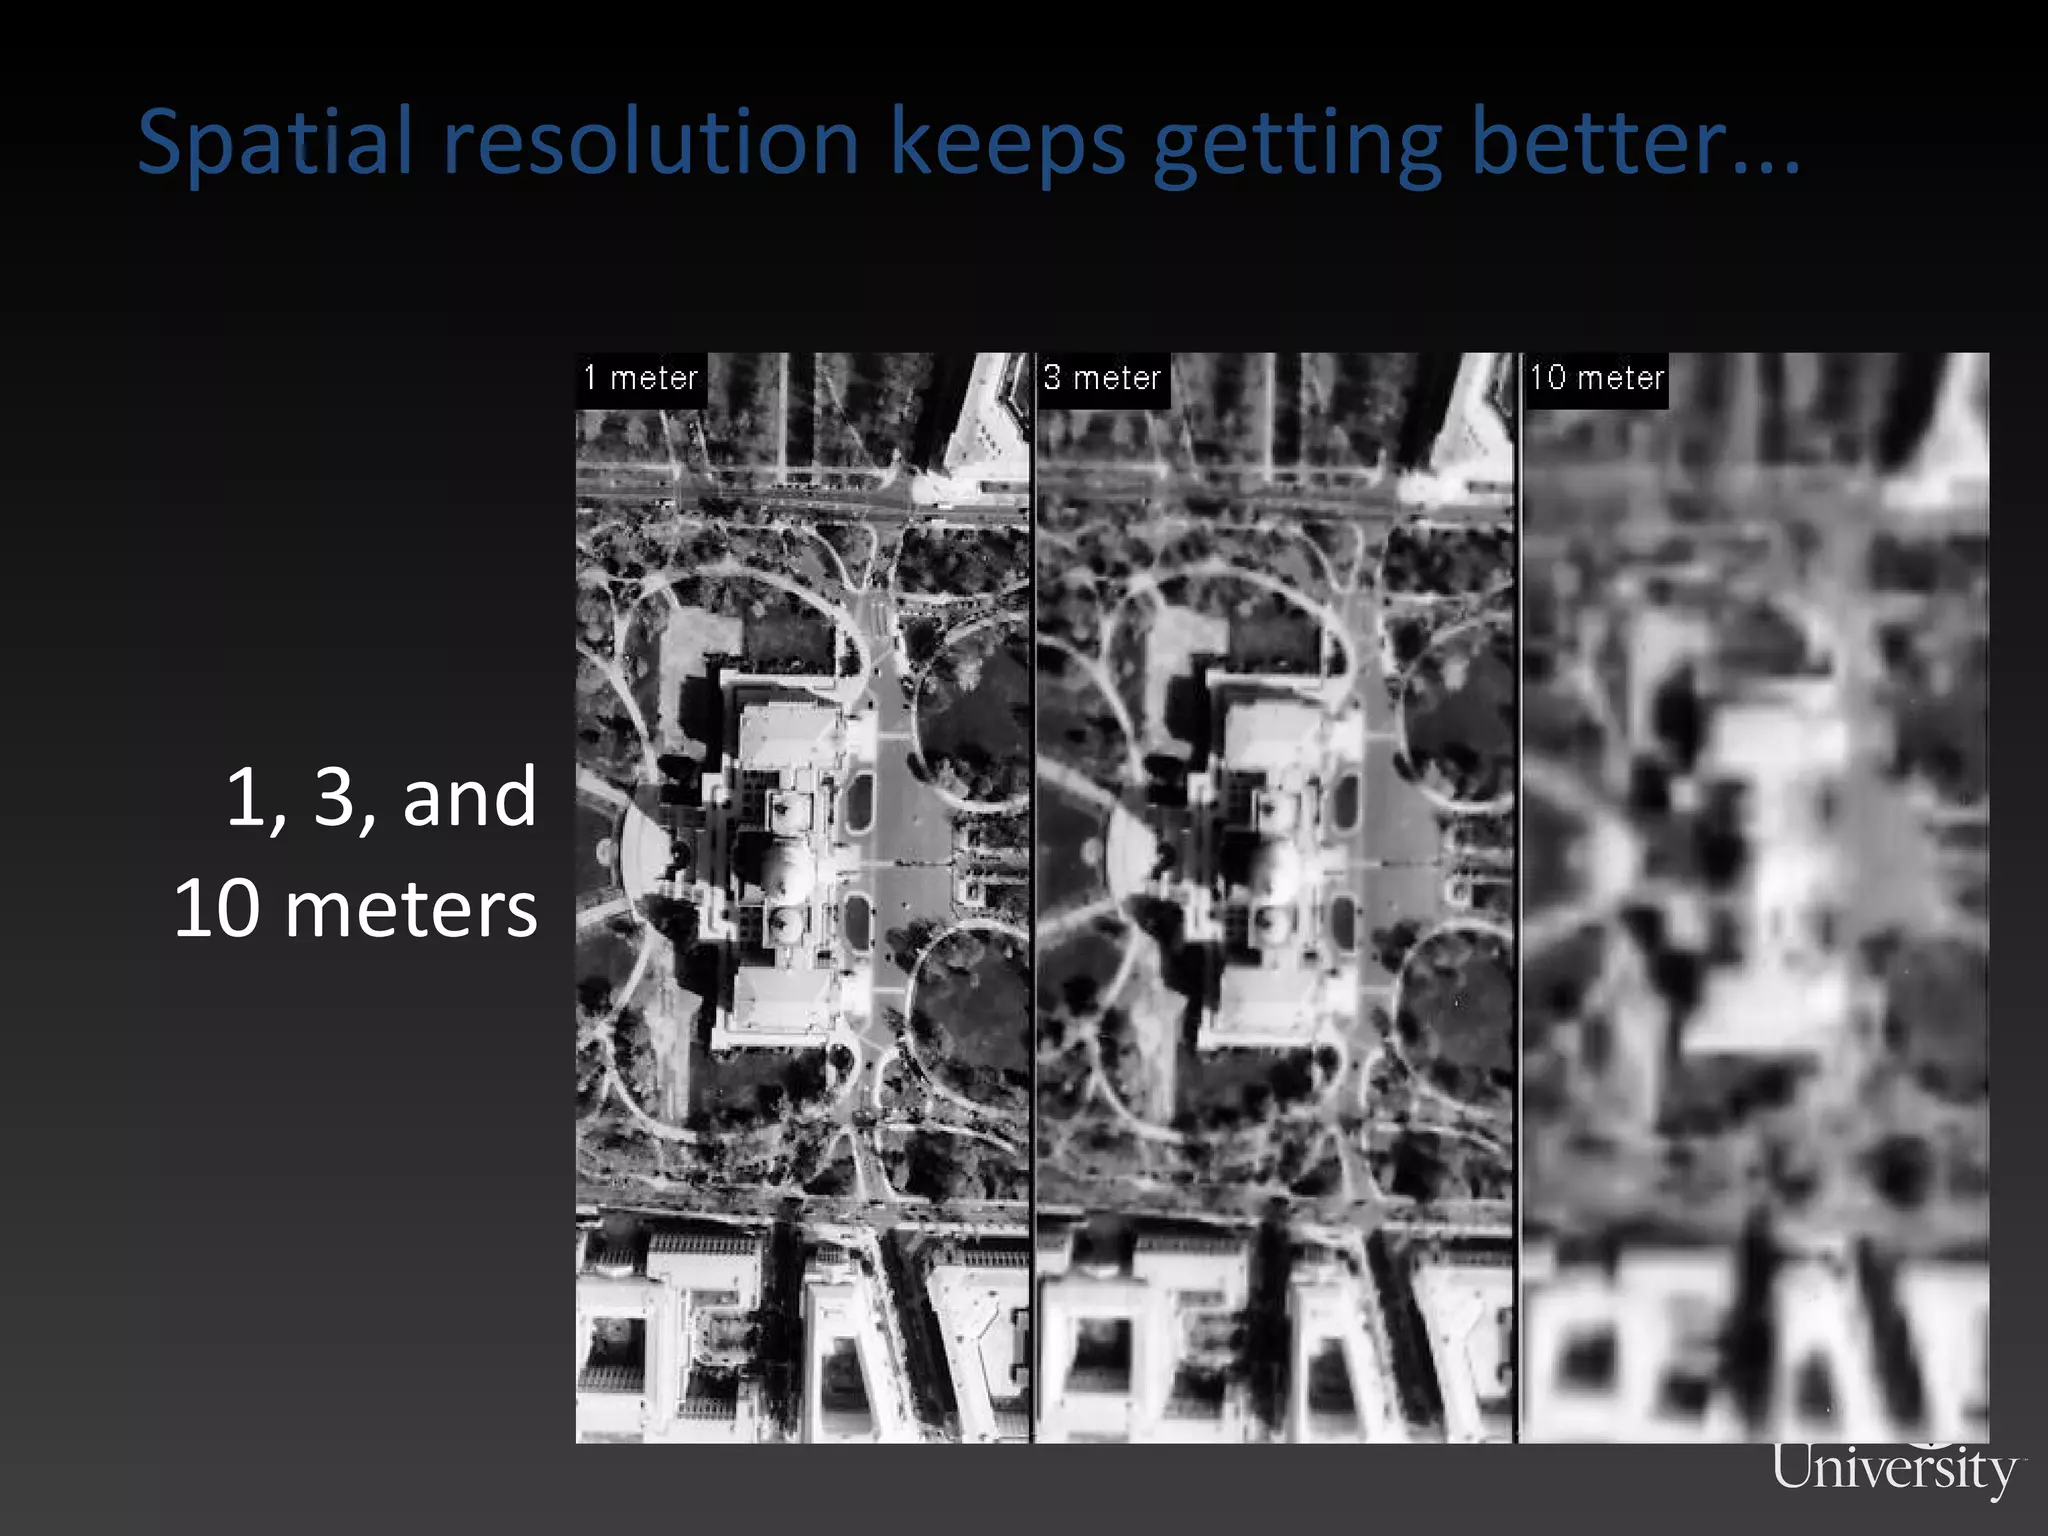
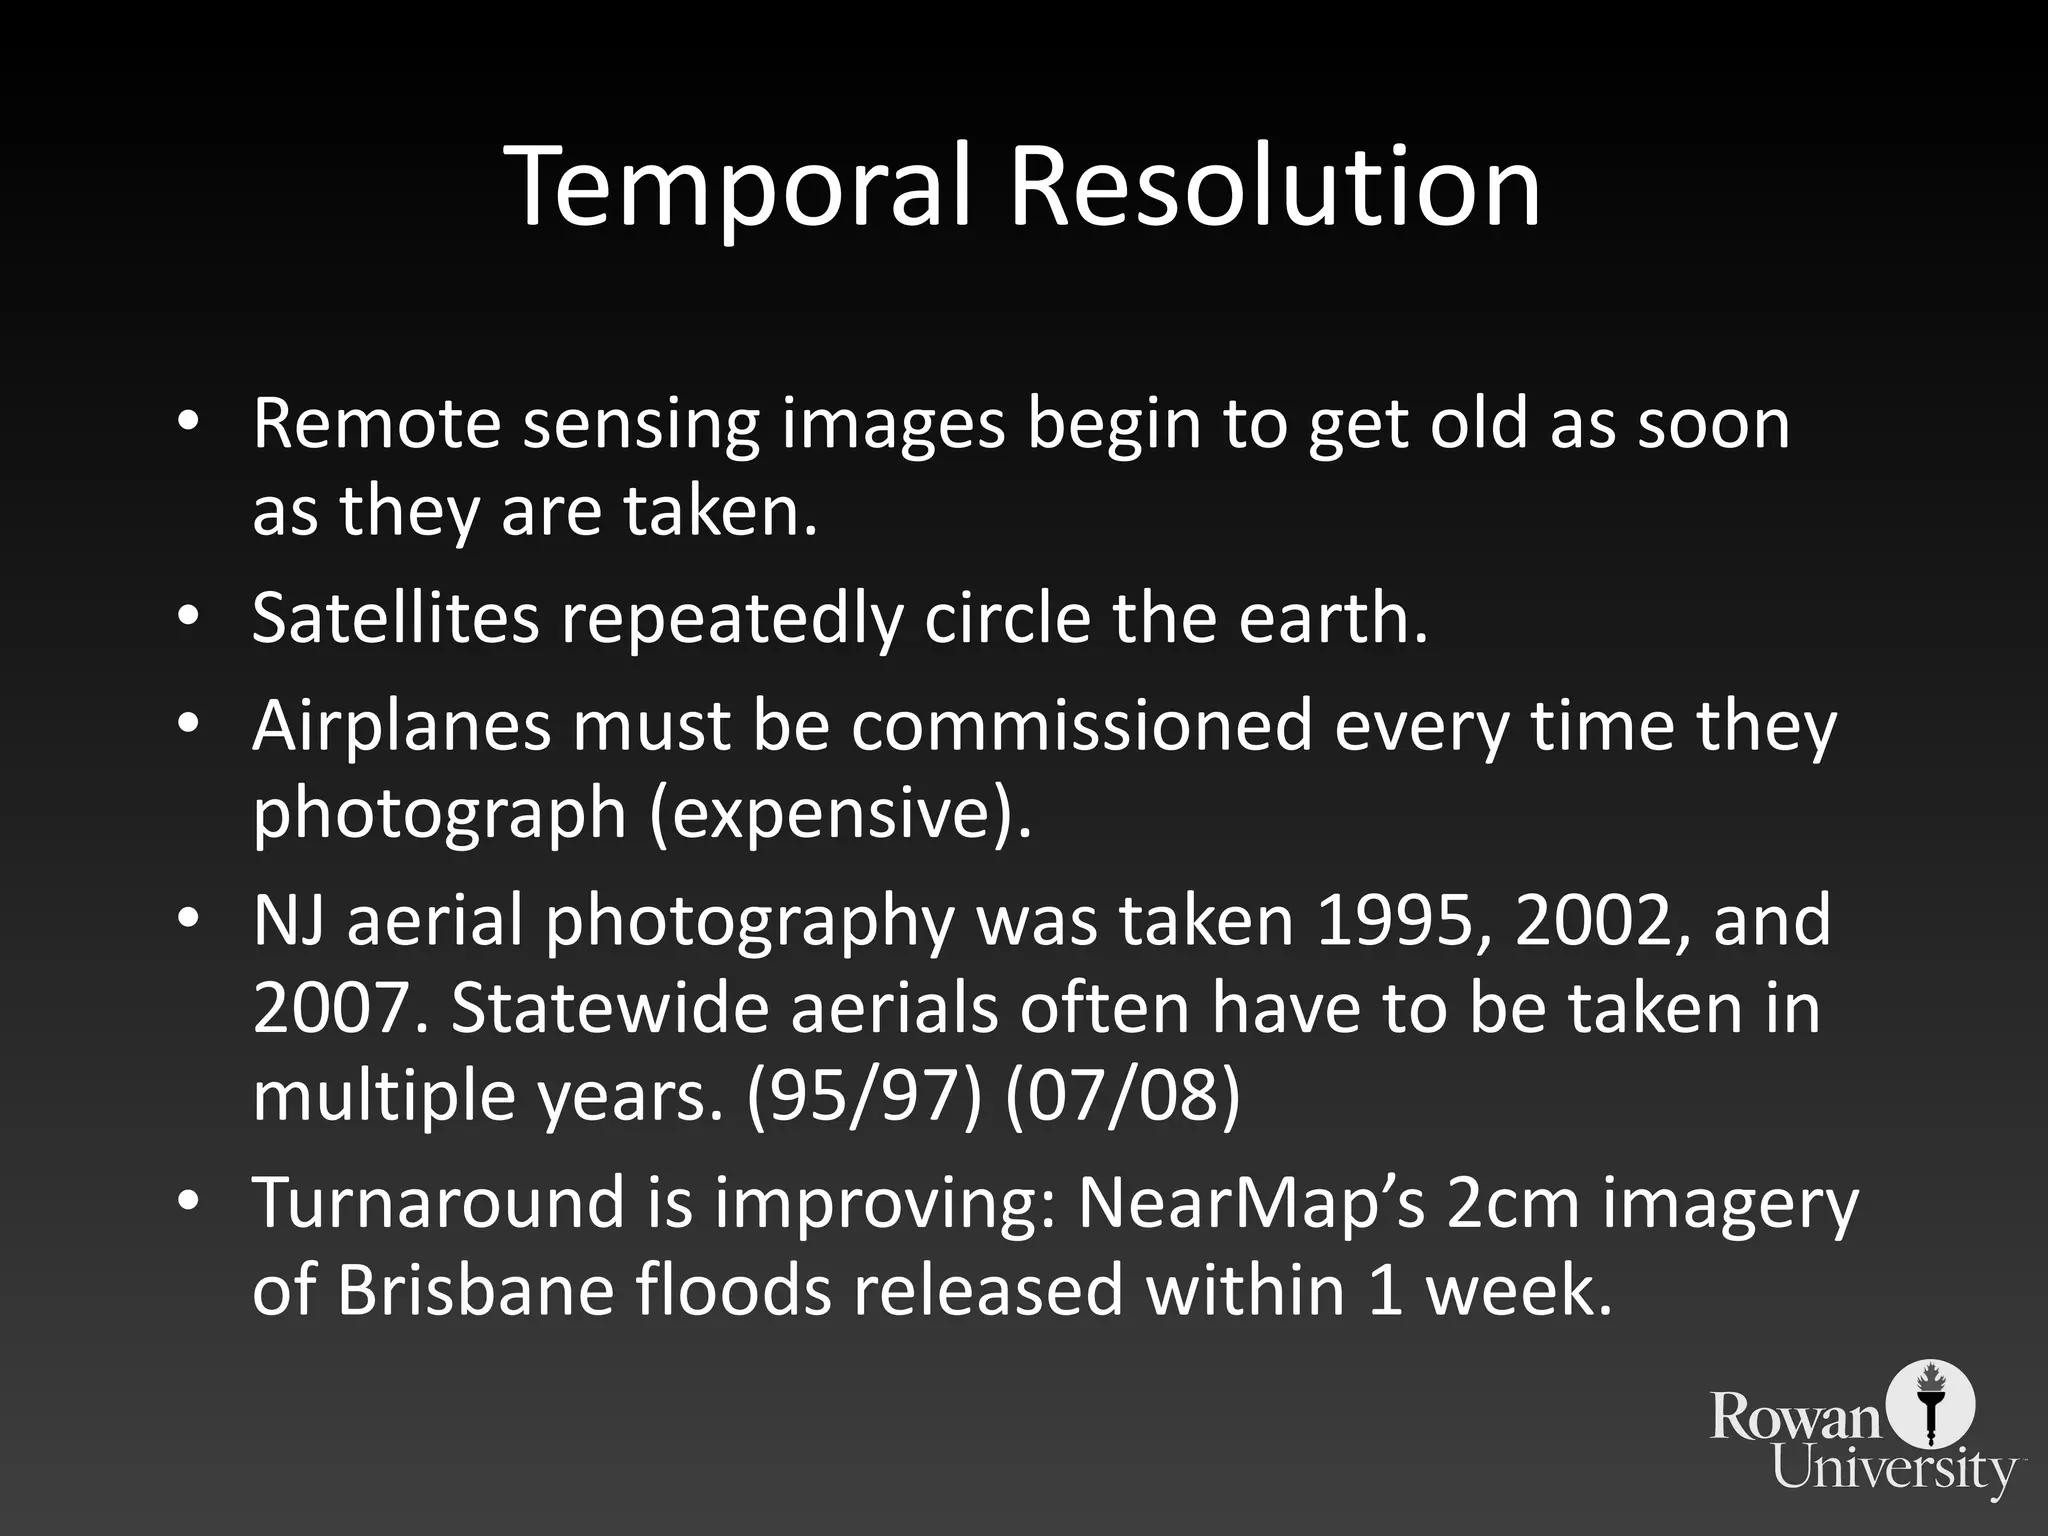
Outlines spatial units like pixels in data collection and the evolution of temporal resolution in remote sensing imagery.
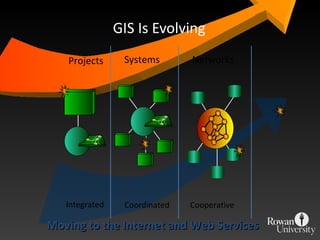
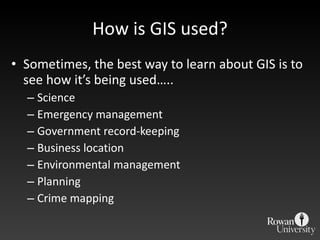
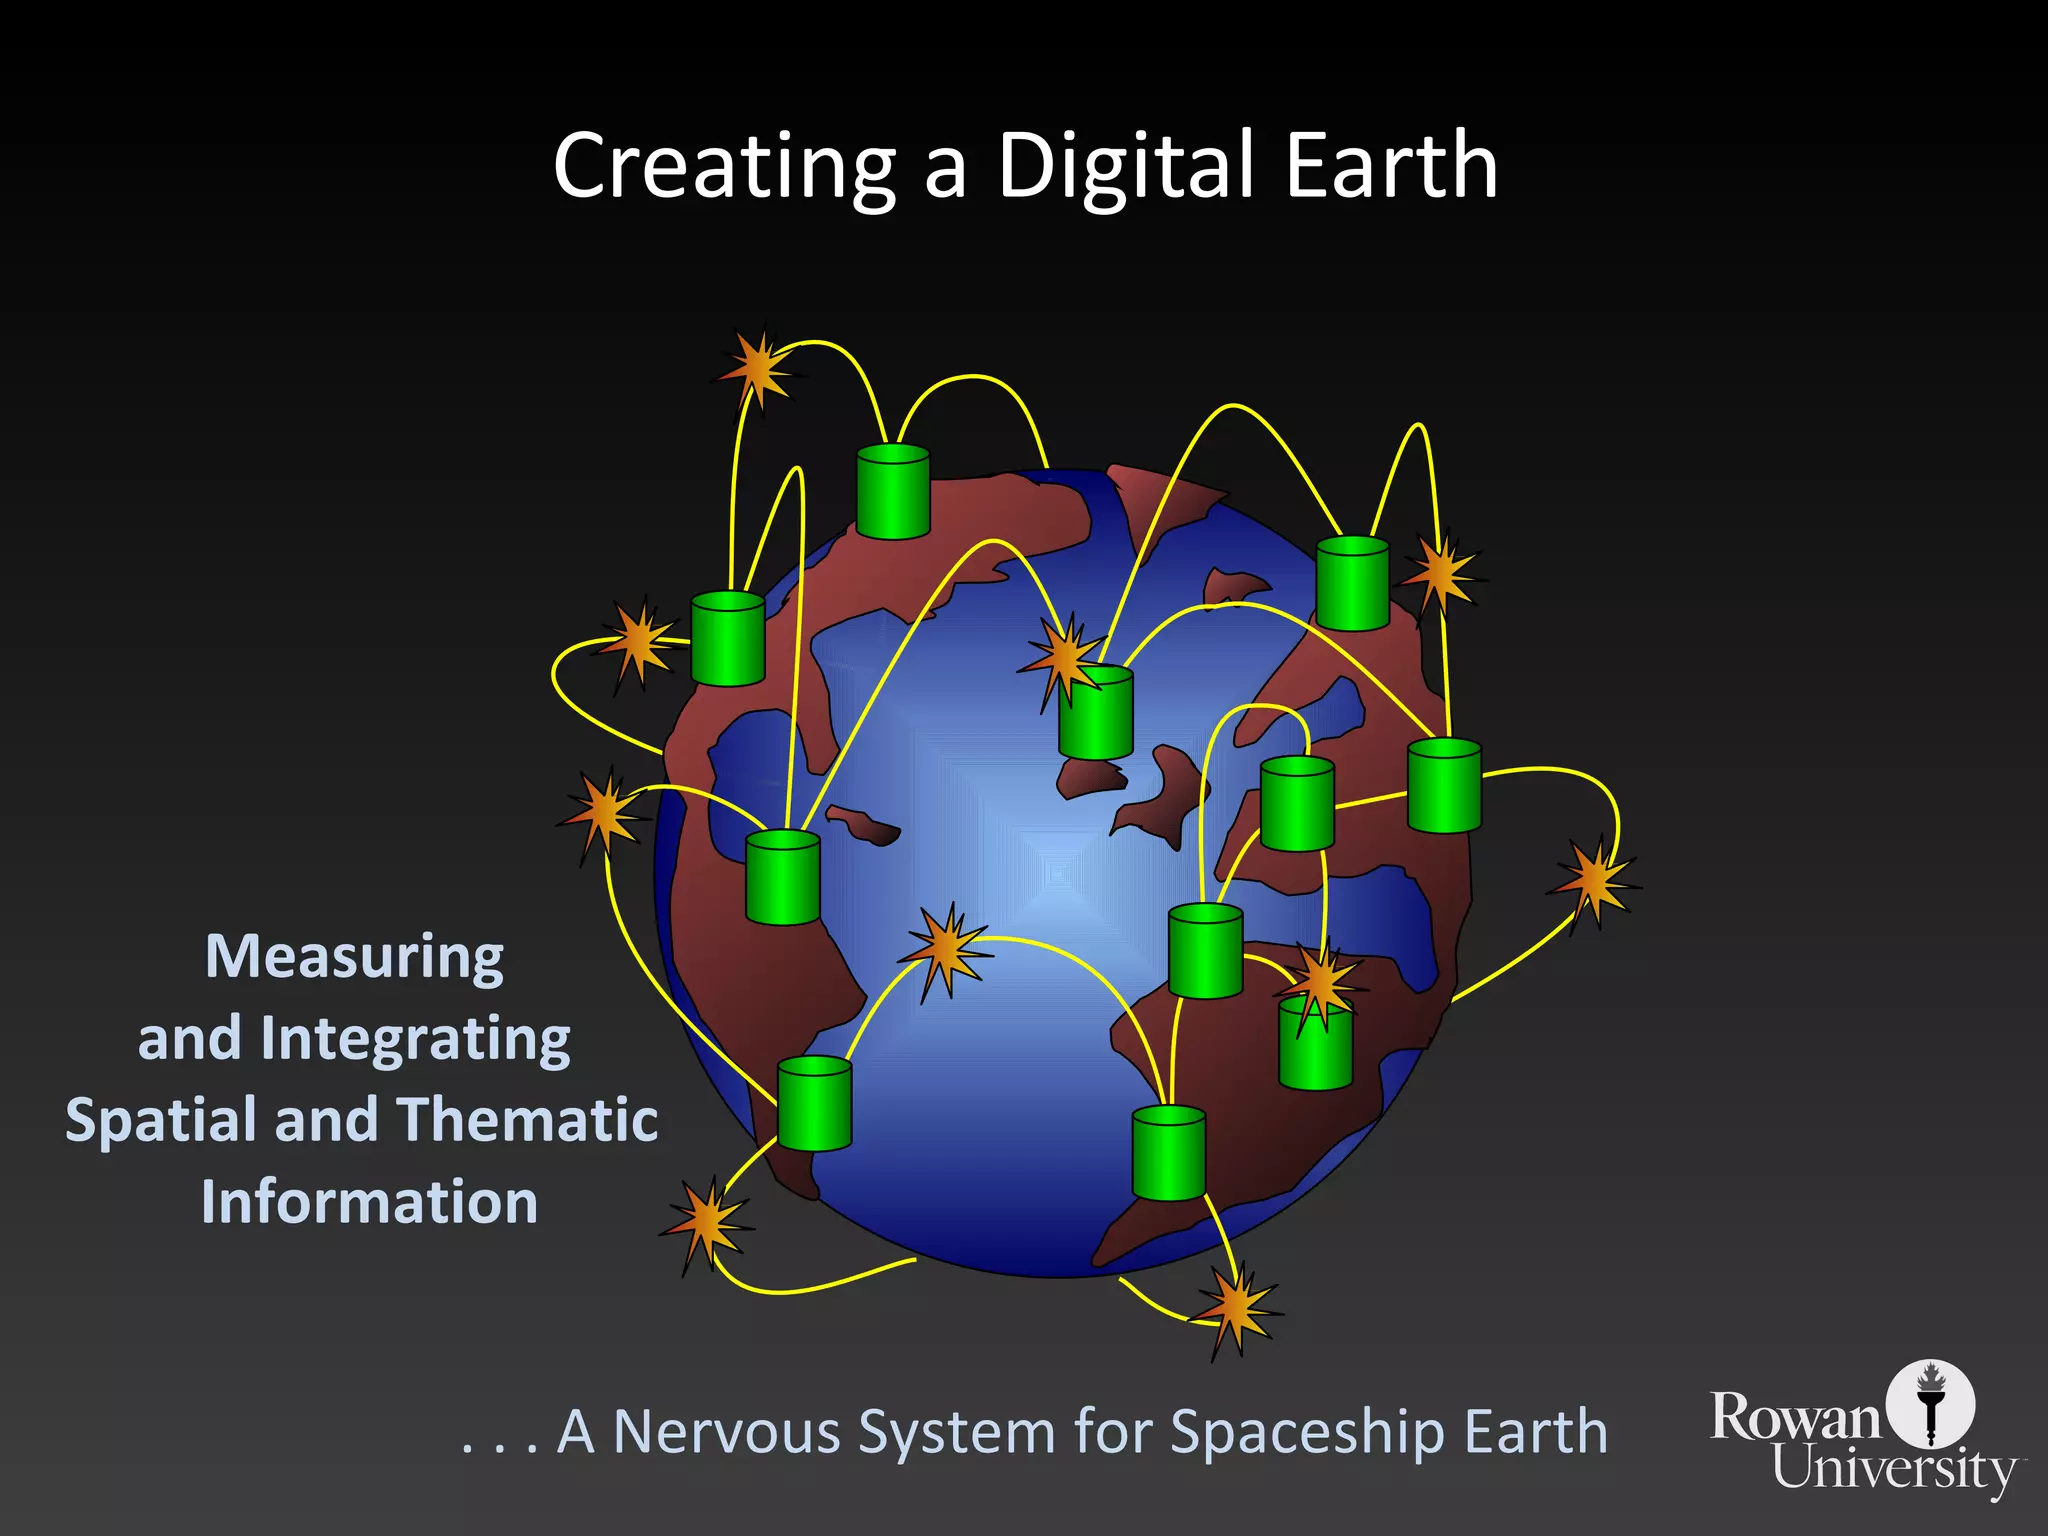
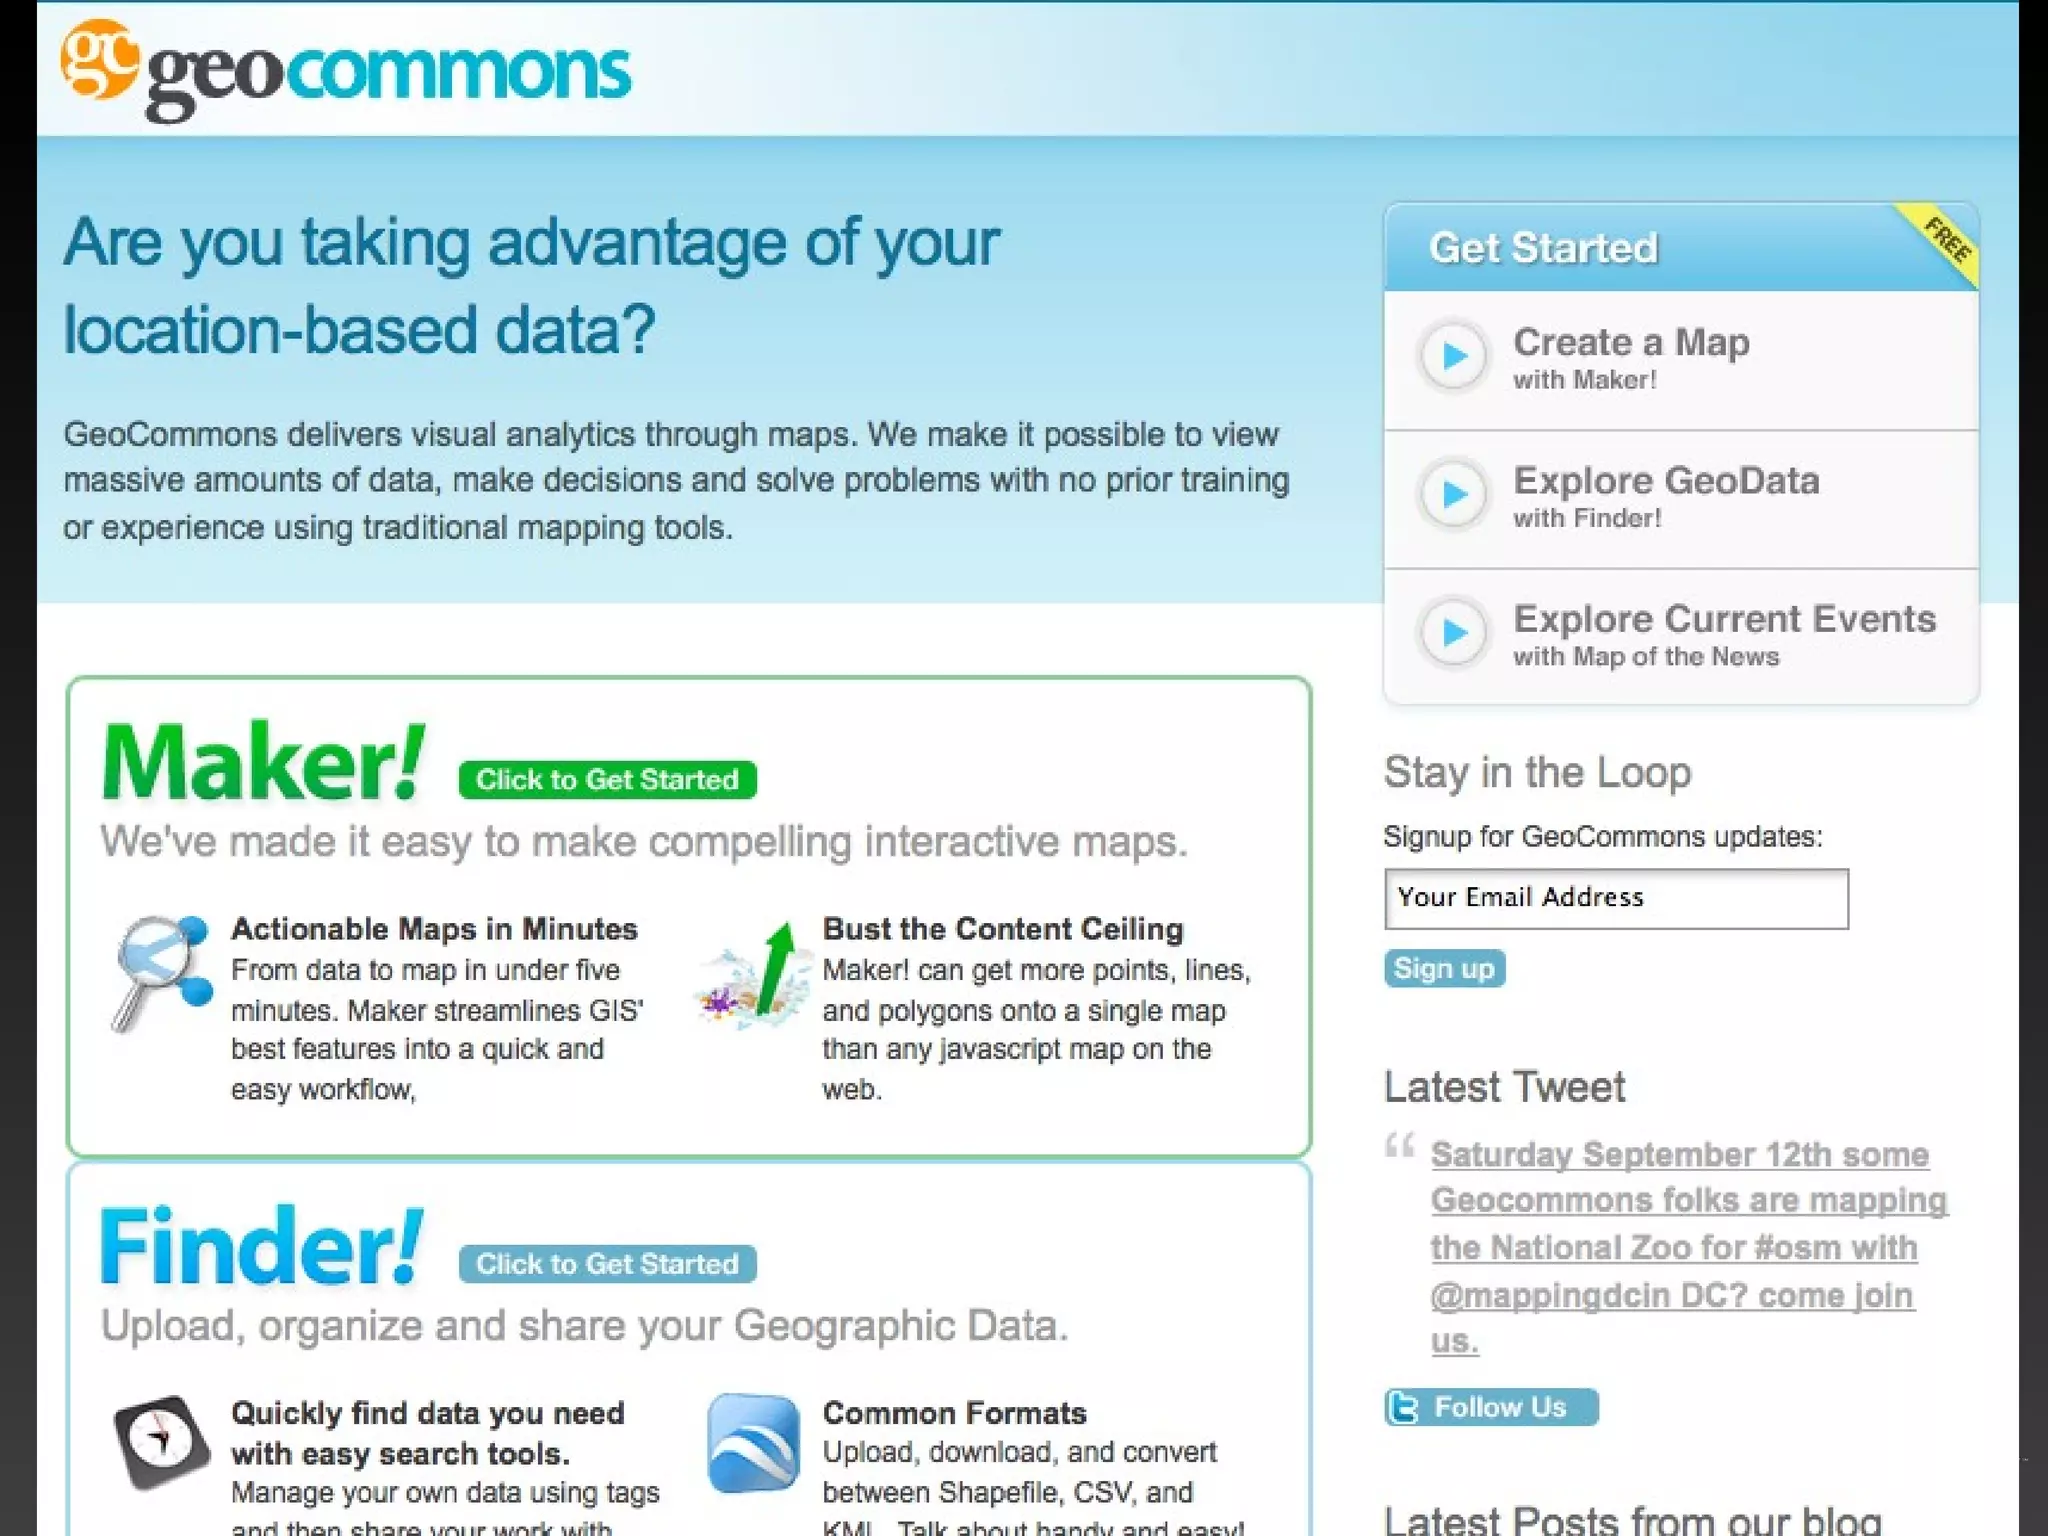
Explores the evolving nature of GIS, its integration into various projects, networks, and its application in multiple sectors.
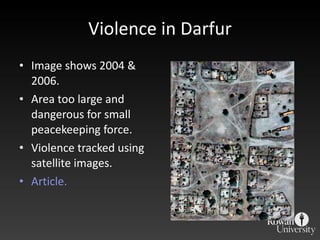
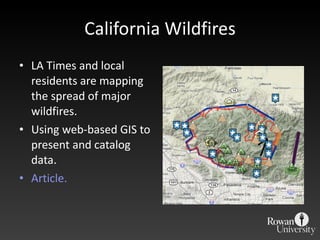
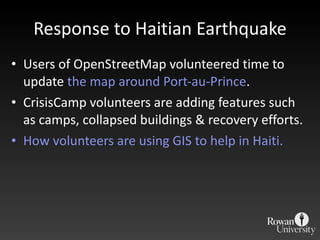
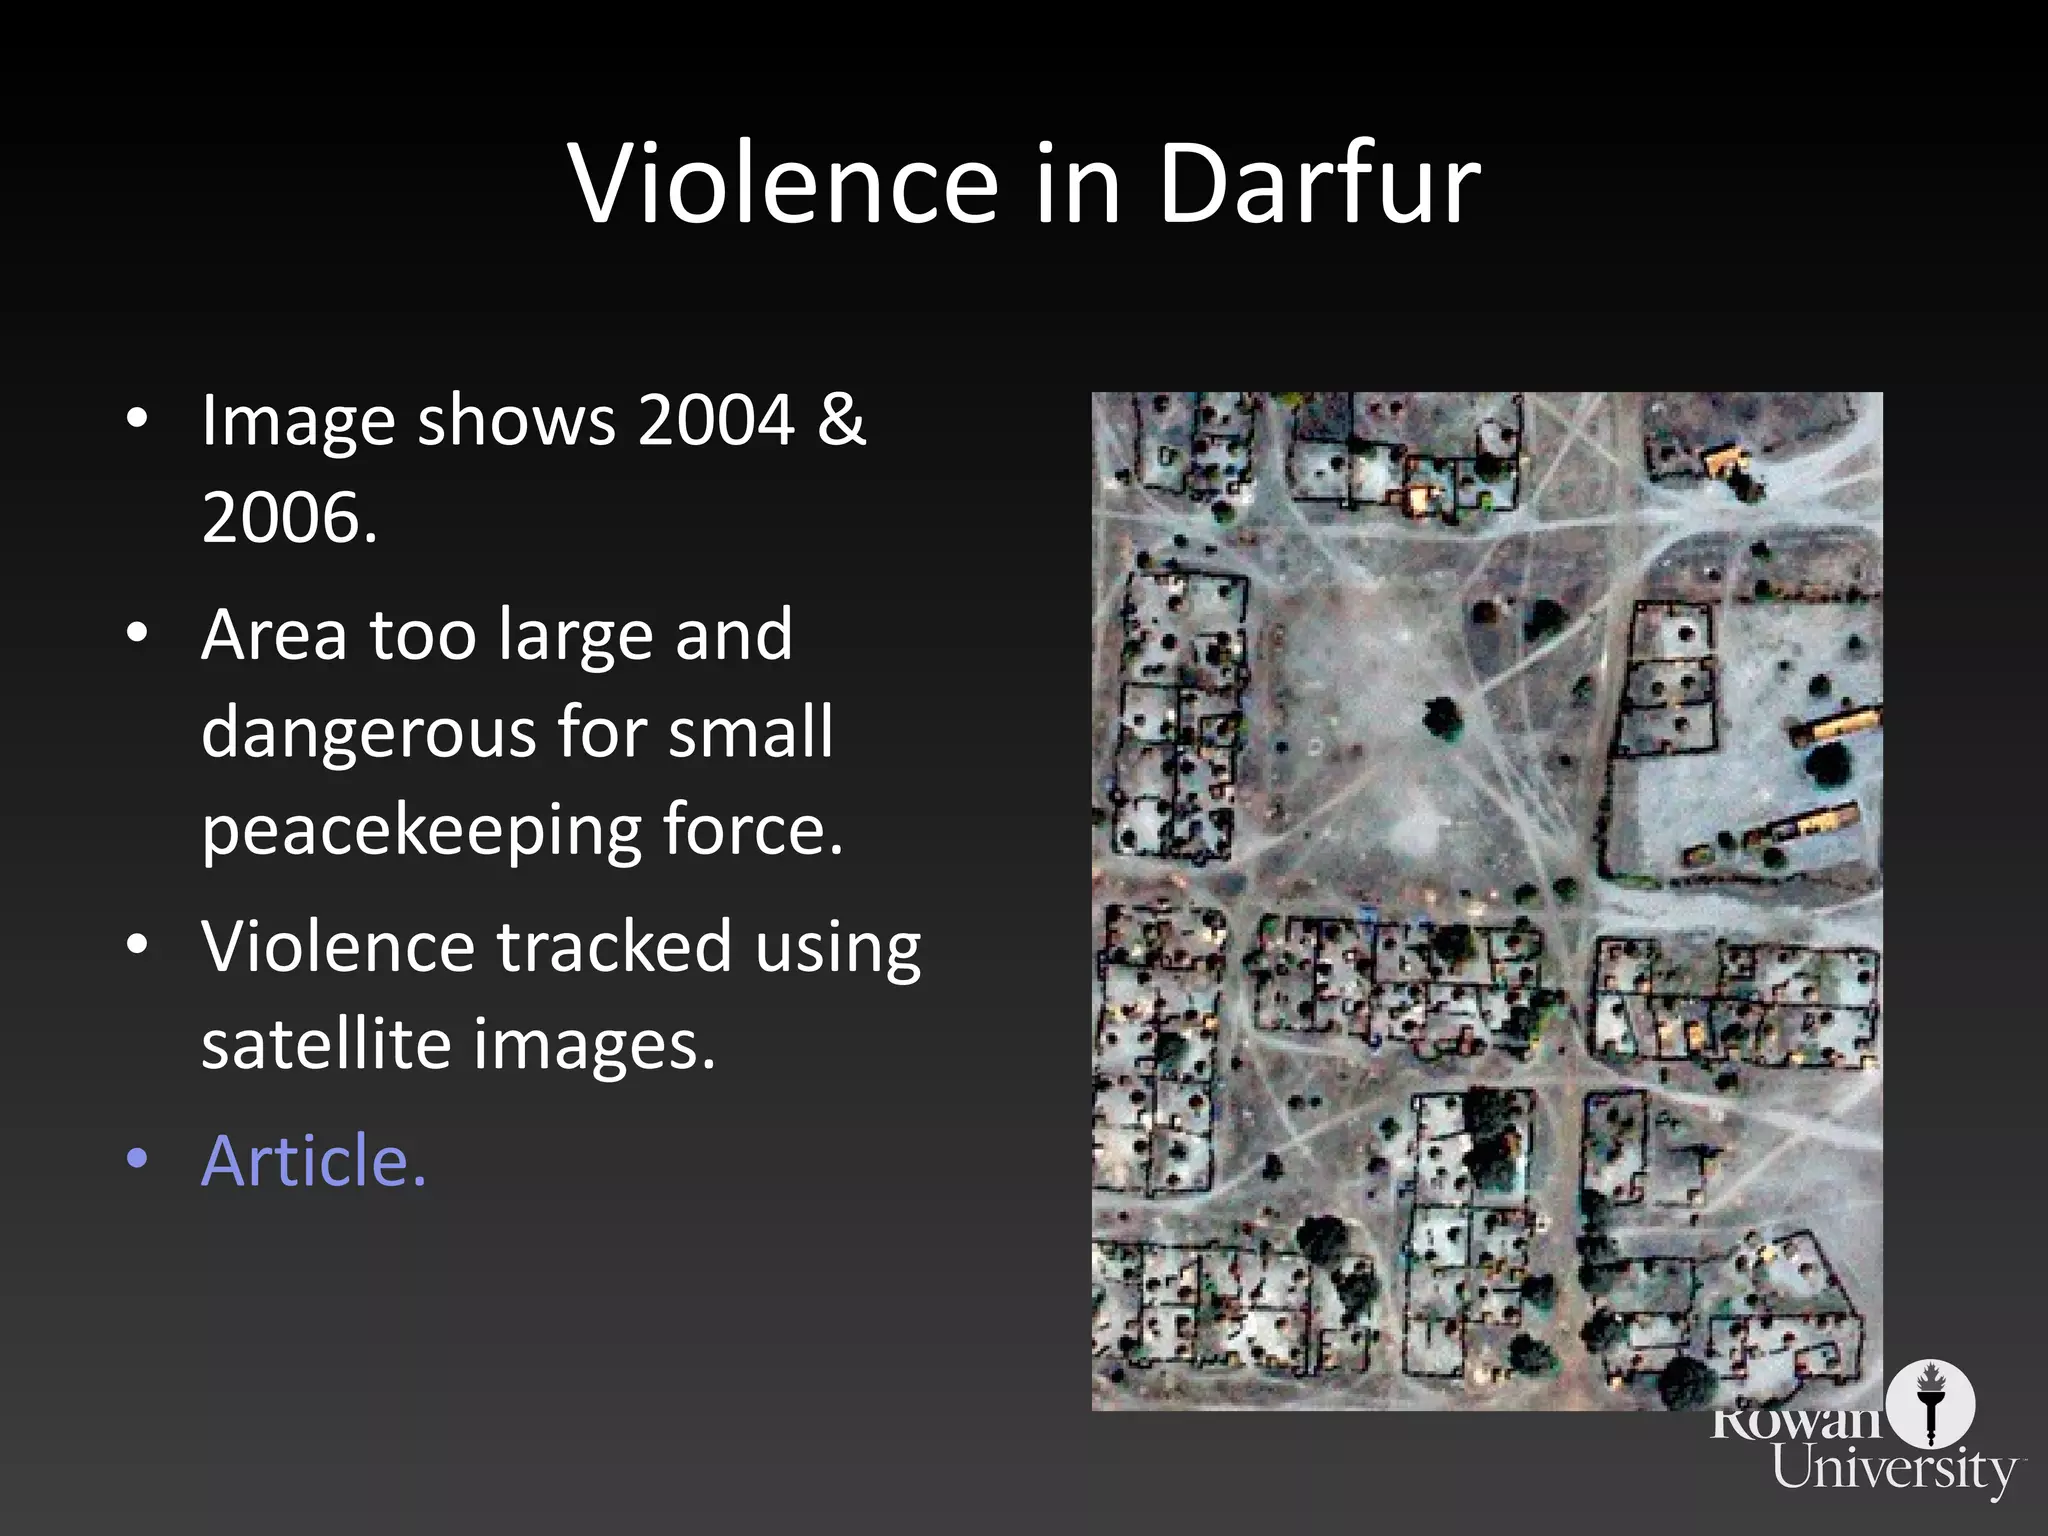
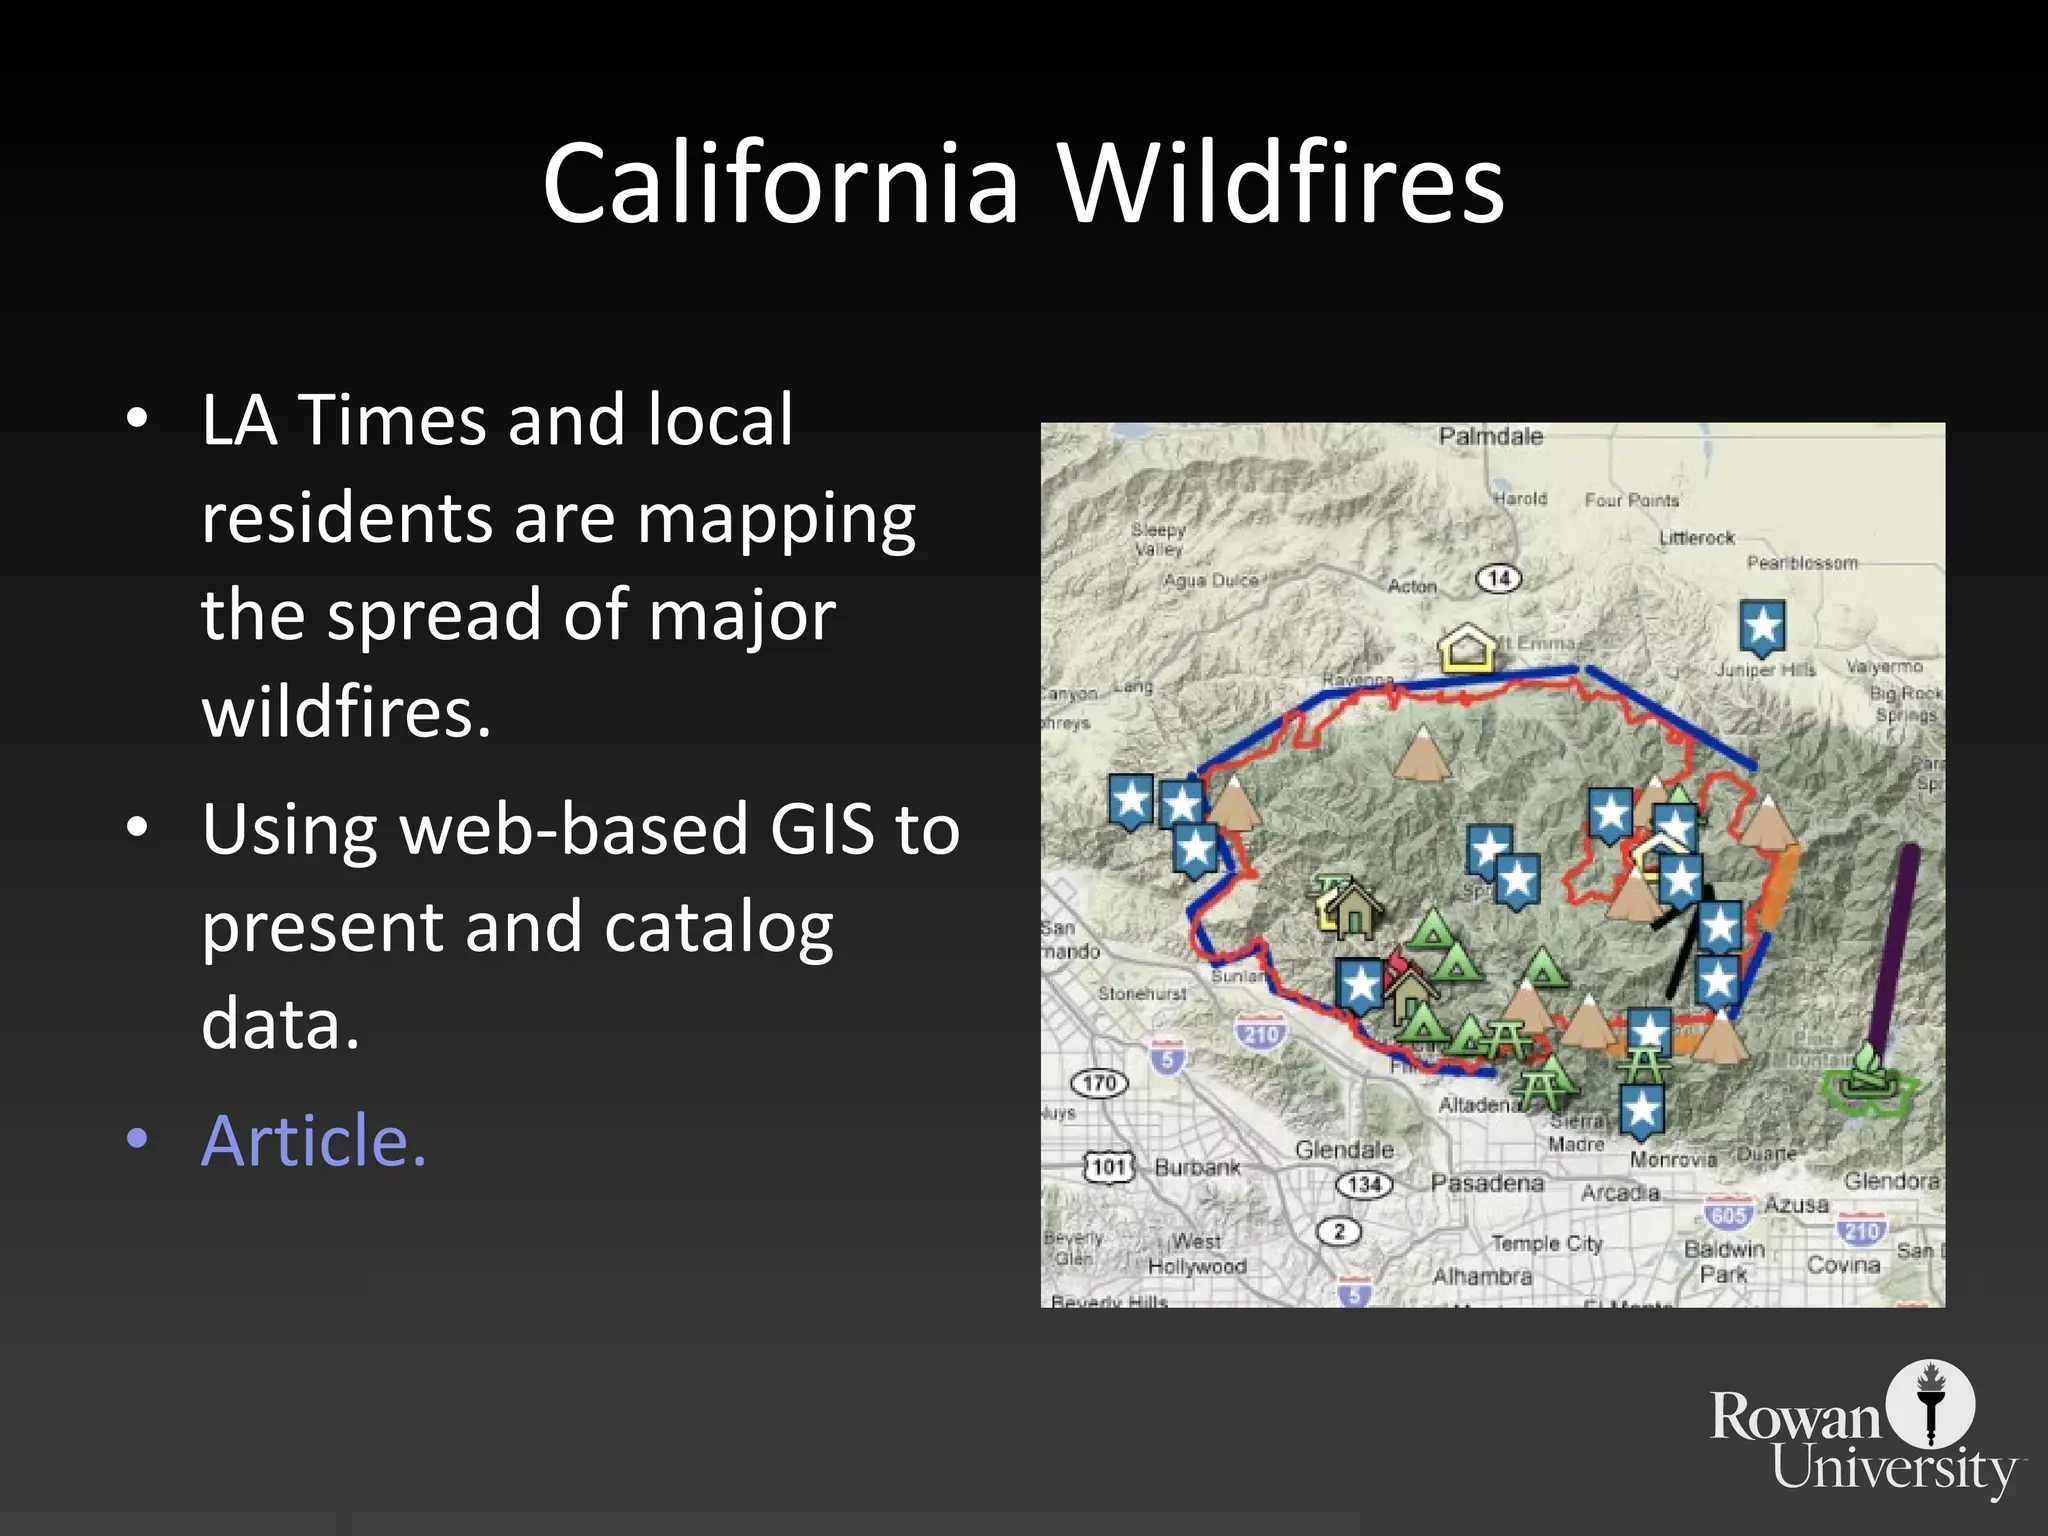
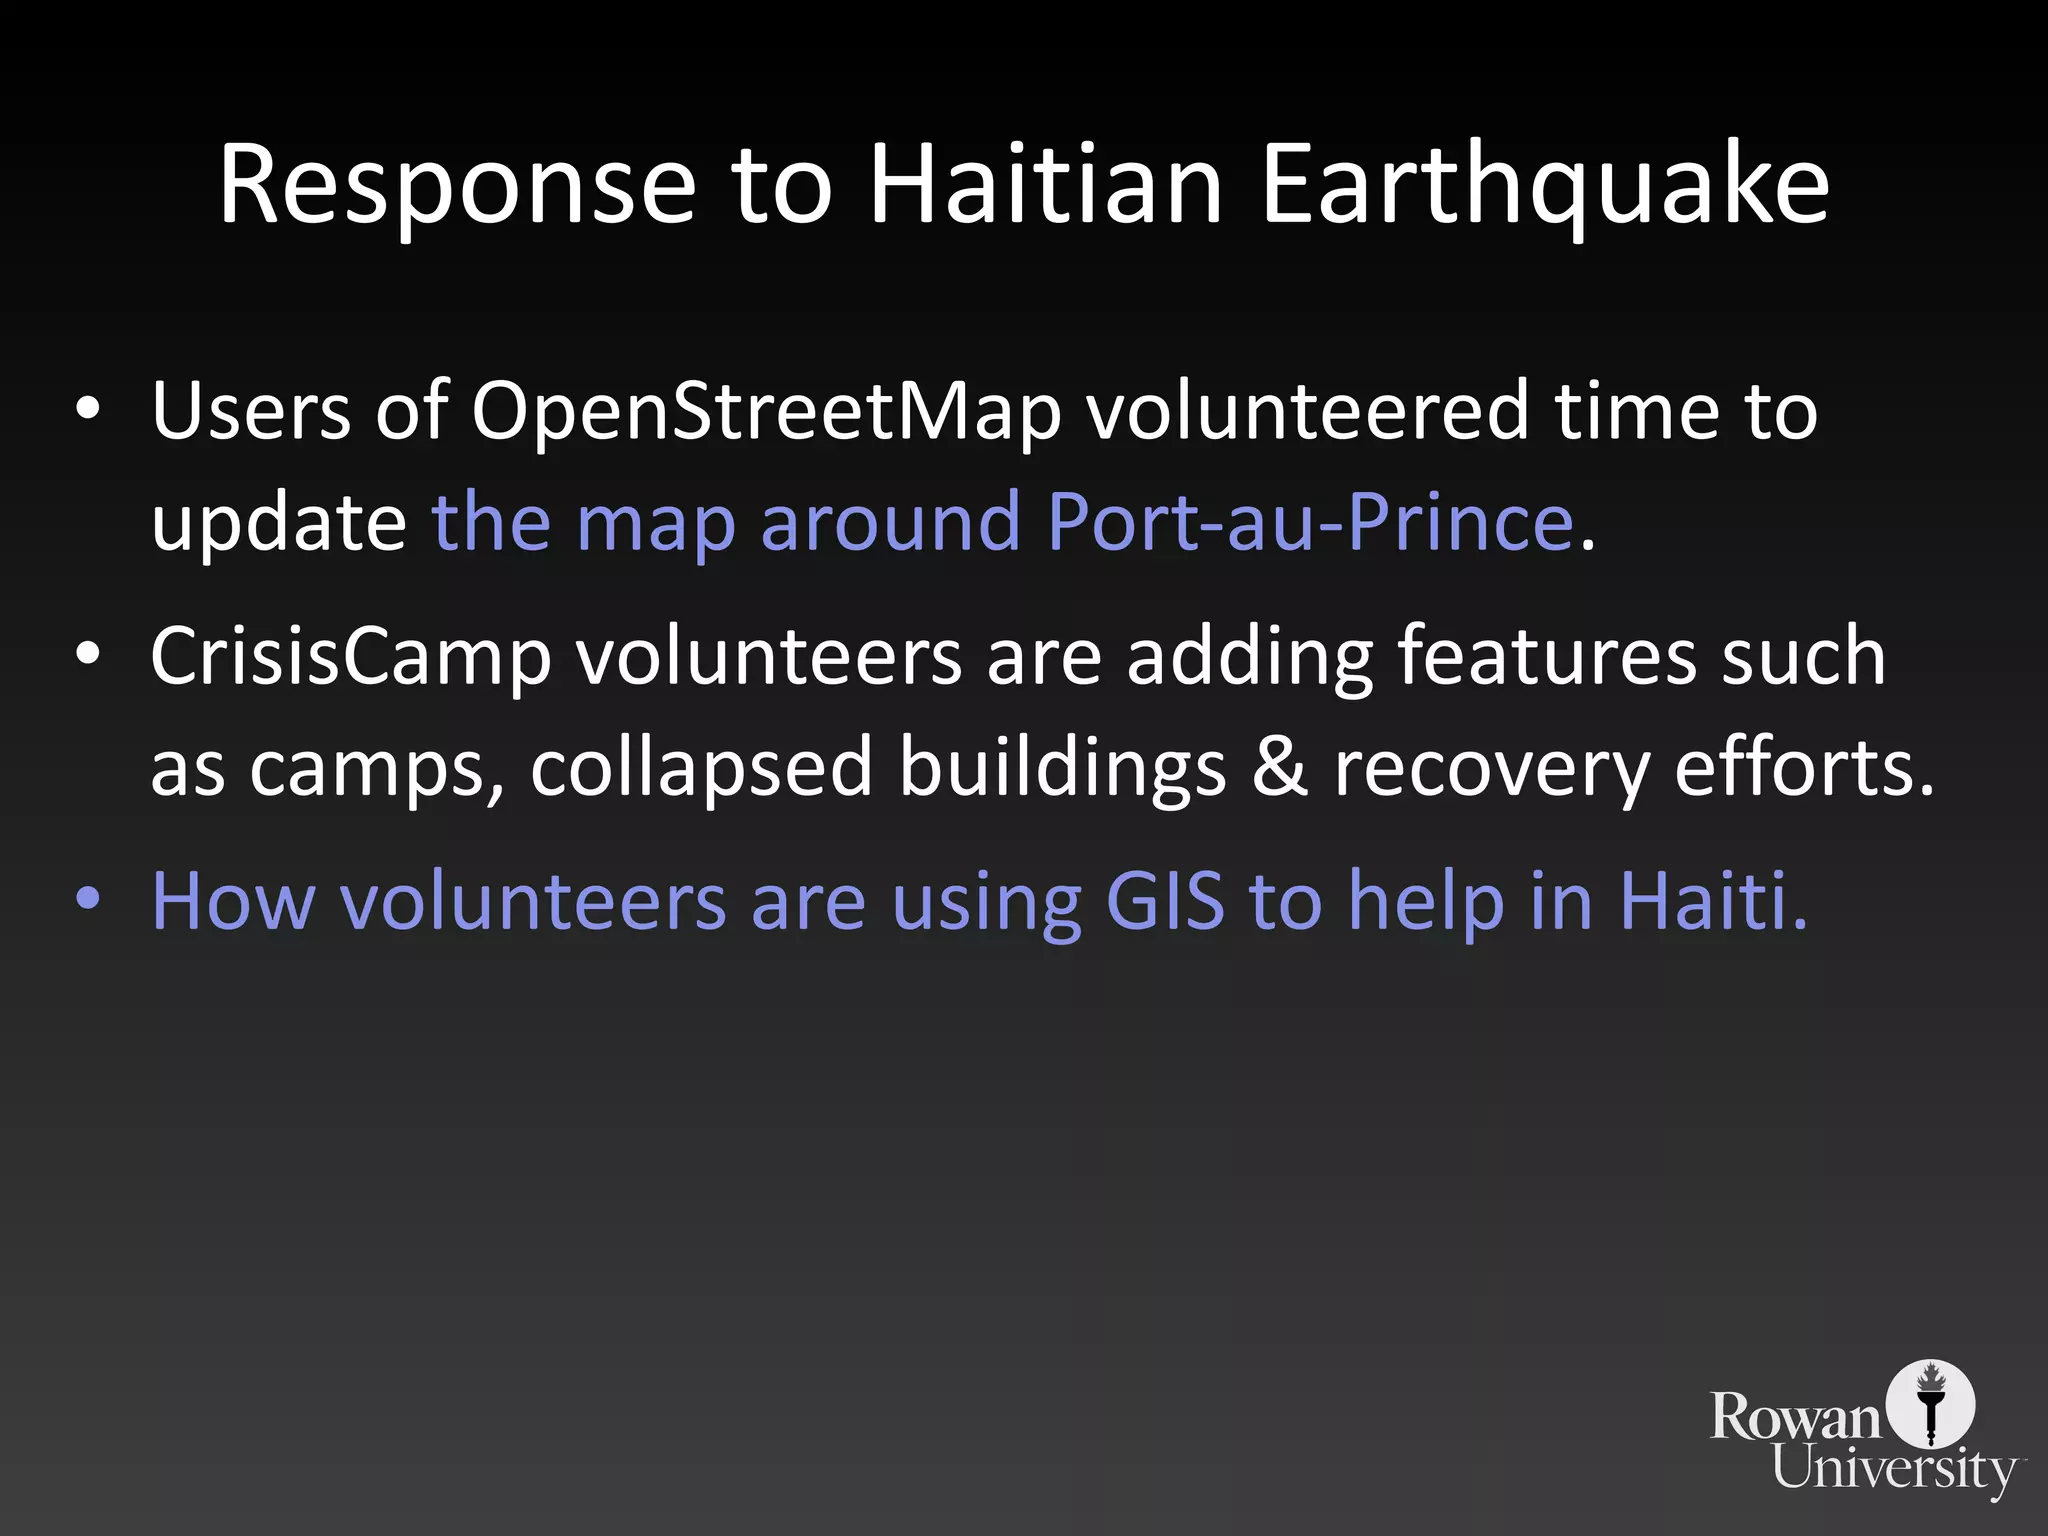
Demonstrates practical uses of GIS in humanitarian, environmental, and planning initiatives, including case studies on crises and mapping.


