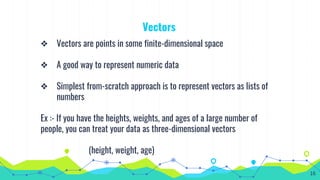
This document provides an overview of data science, including its definition, necessary skills, tools, and techniques. It covers essential topics such as data acquisition, linear algebra, statistics, probability, and data visualization methods. The content highlights the significance of understanding both mathematical concepts and programming languages like Python and R in the field of data science.


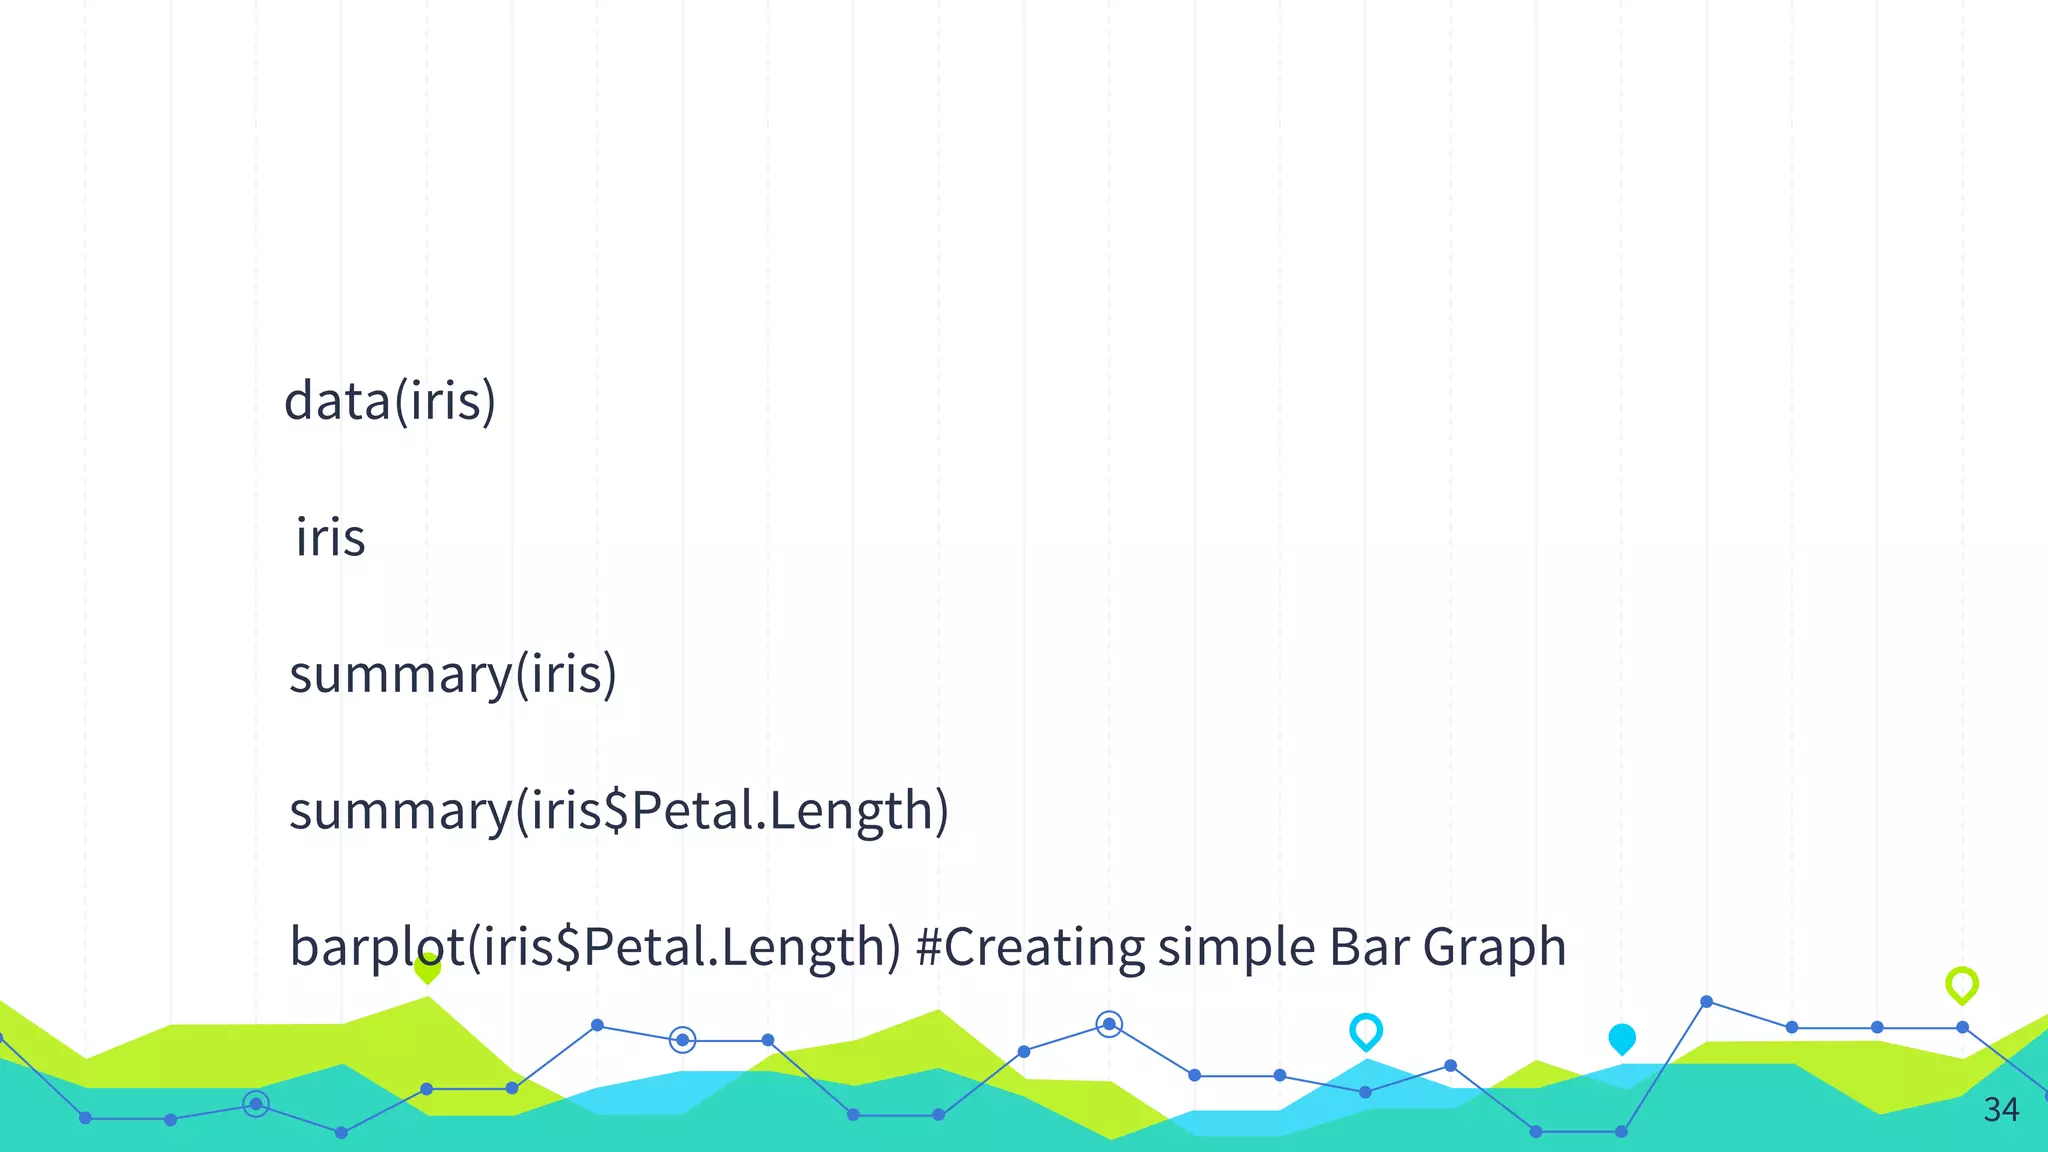
![plot(x=iris$Petal.Length) # Creating scatter plot
plot(iris$Petal.Length, iris$Petal.Width,
pch=c(23,24,25)[unclass(iris$Species)], main=" Iris Data")
plot(iris$Petal.Length, iris$Petal.Width, pch=21,
bg=c("red","green3","blue")[unclass(iris$Species)], main="Iris
Data")
pairs(iris[1:4], main = " Iris Data", pch = 21, bg = c("red",
"green3", "blue")[unclass(iris$Species)])
35](https://image.slidesharecdn.com/introductiontodatascience-170511153434/85/Introduction-to-data-science-35-320.jpg)


![plot(x=iris$Petal.Length) # Creating scatter plot
plot(iris$Petal.Length, iris$Petal.Width,
pch=c(23,24,25)[unclass(iris$Species)], main=" Iris Data")
plot(iris$Petal.Length, iris$Petal.Width, pch=21,
bg=c("red","green3","blue")[unclass(iris$Species)], main="Iris
Data")
pairs(iris[1:4], main = " Iris Data", pch = 21, bg = c("red",
"green3", "blue")[unclass(iris$Species)])
35](https://image.slidesharecdn.com/introductiontodatascience-170511153434/75/Introduction-to-data-science-35-2048.jpg)


![RTP_AR_Basic_Learners' Workbook_KS2 [FOR REPRODUCTION] (1).pdf](https://cdn.slidesharecdn.com/ss_thumbnails/rtparbasiclearnersworkbookks2forreproduction1-251016024943-e51a16ac-thumbnail.jpg?width=600ounds&width=560&fit=bounds)


