Download as PDF, PPTX


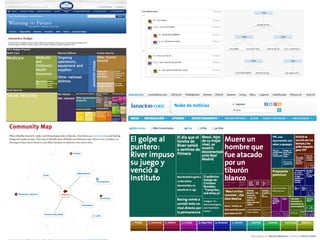


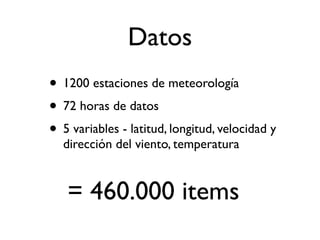
![Datos
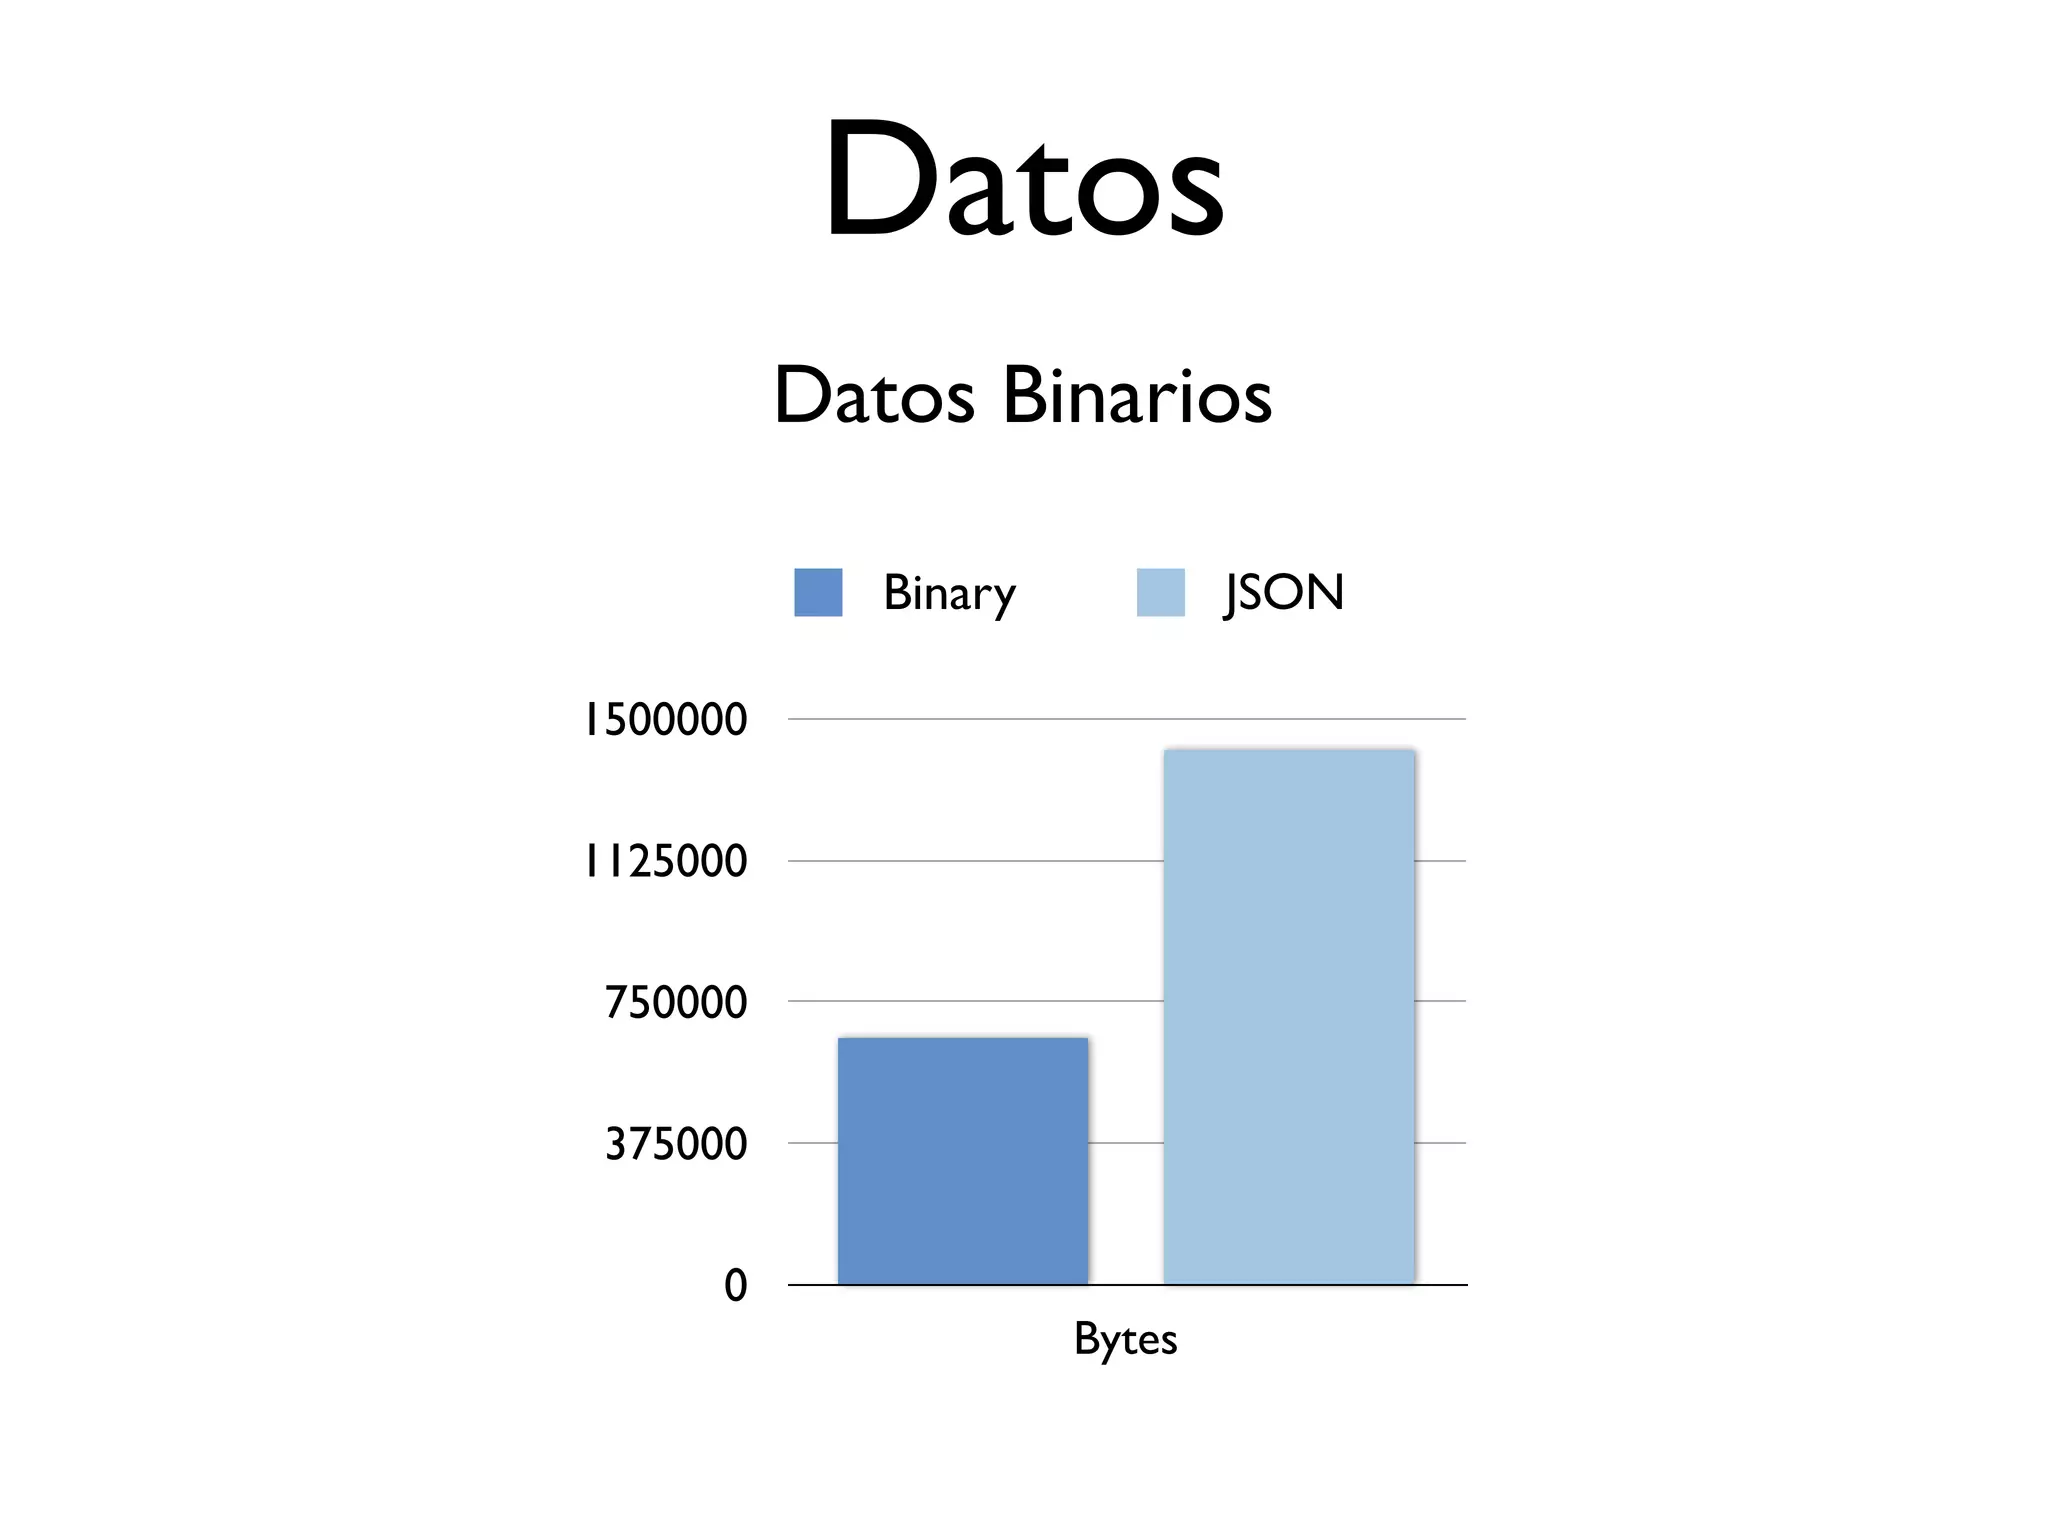
Datos Binarios
direction speed temperature direction speed temperature
unsigned ints
[10, 1, 100, ...]
JSON](https://image.slidesharecdn.com/talk-may2012-jsconfar-120519222841-phpapp01/85/JavaScript-para-Graficos-y-Visualizacion-de-Datos-18-320.jpg)

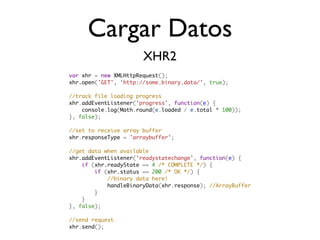
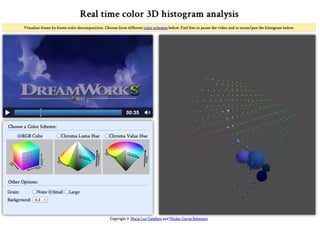
![Cargar Datos
Typed Arrays: Ultra rápidos Arrays
function handleBinaryData(arraybuffer) {
var typedArray = new Uint16Array(arraybuffer);
//do stuff like with a regular array
for (var i = 0, l = typedArray.length; i < l; ++i) {
typedArray[i] += 2;
}
}
Uint8Array
Float32Array
ArrayBuffer
Int16Array
etc.](https://image.slidesharecdn.com/talk-may2012-jsconfar-120519222841-phpapp01/85/JavaScript-para-Graficos-y-Visualizacion-de-Datos-21-320.jpg)
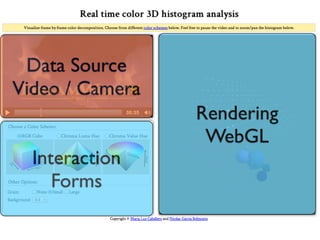
![//Create application
PhiloGL('canvasId', {
program: {
from: 'uris',
vs: 'shader.vs.glsl',
WebGL / PhiloGL
fs: 'shader.fs.glsl'
}, Rendering
camera: {
position: {
x: 0, y: 0, z: -50
}
},
textures: {
src: ['arroway.jpg', 'earth.jpg']
},
events: {
onDragMove: function(e) {
//do things...
},
onMouseWheel: function(e) {
//do things...
}
},
onError: function() {
alert("There was an error creating the app.");
},
onLoad: function(app) {
/* Do things here */
}
});](https://image.slidesharecdn.com/talk-may2012-jsconfar-120519222841-phpapp01/85/JavaScript-para-Graficos-y-Visualizacion-de-Datos-23-320.jpg)


![Datos
Datos Binarios
direction speed temperature direction speed temperature
unsigned ints
[10, 1, 100, ...]
JSON](https://image.slidesharecdn.com/talk-may2012-jsconfar-120519222841-phpapp01/75/JavaScript-para-Graficos-y-Visualizacion-de-Datos-18-2048.jpg)
![Cargar Datos
Typed Arrays: Ultra rápidos Arrays
function handleBinaryData(arraybuffer) {
var typedArray = new Uint16Array(arraybuffer);
//do stuff like with a regular array
for (var i = 0, l = typedArray.length; i < l; ++i) {
typedArray[i] += 2;
}
}
Uint8Array
Float32Array
ArrayBuffer
Int16Array
etc.](https://image.slidesharecdn.com/talk-may2012-jsconfar-120519222841-phpapp01/75/JavaScript-para-Graficos-y-Visualizacion-de-Datos-21-2048.jpg)
![//Create application
PhiloGL('canvasId', {
program: {
from: 'uris',
vs: 'shader.vs.glsl',
WebGL / PhiloGL
fs: 'shader.fs.glsl'
}, Rendering
camera: {
position: {
x: 0, y: 0, z: -50
}
},
textures: {
src: ['arroway.jpg', 'earth.jpg']
},
events: {
onDragMove: function(e) {
//do things...
},
onMouseWheel: function(e) {
//do things...
}
},
onError: function() {
alert("There was an error creating the app.");
},
onLoad: function(app) {
/* Do things here */
}
});](https://image.slidesharecdn.com/talk-may2012-jsconfar-120519222841-phpapp01/75/JavaScript-para-Graficos-y-Visualizacion-de-Datos-23-2048.jpg)
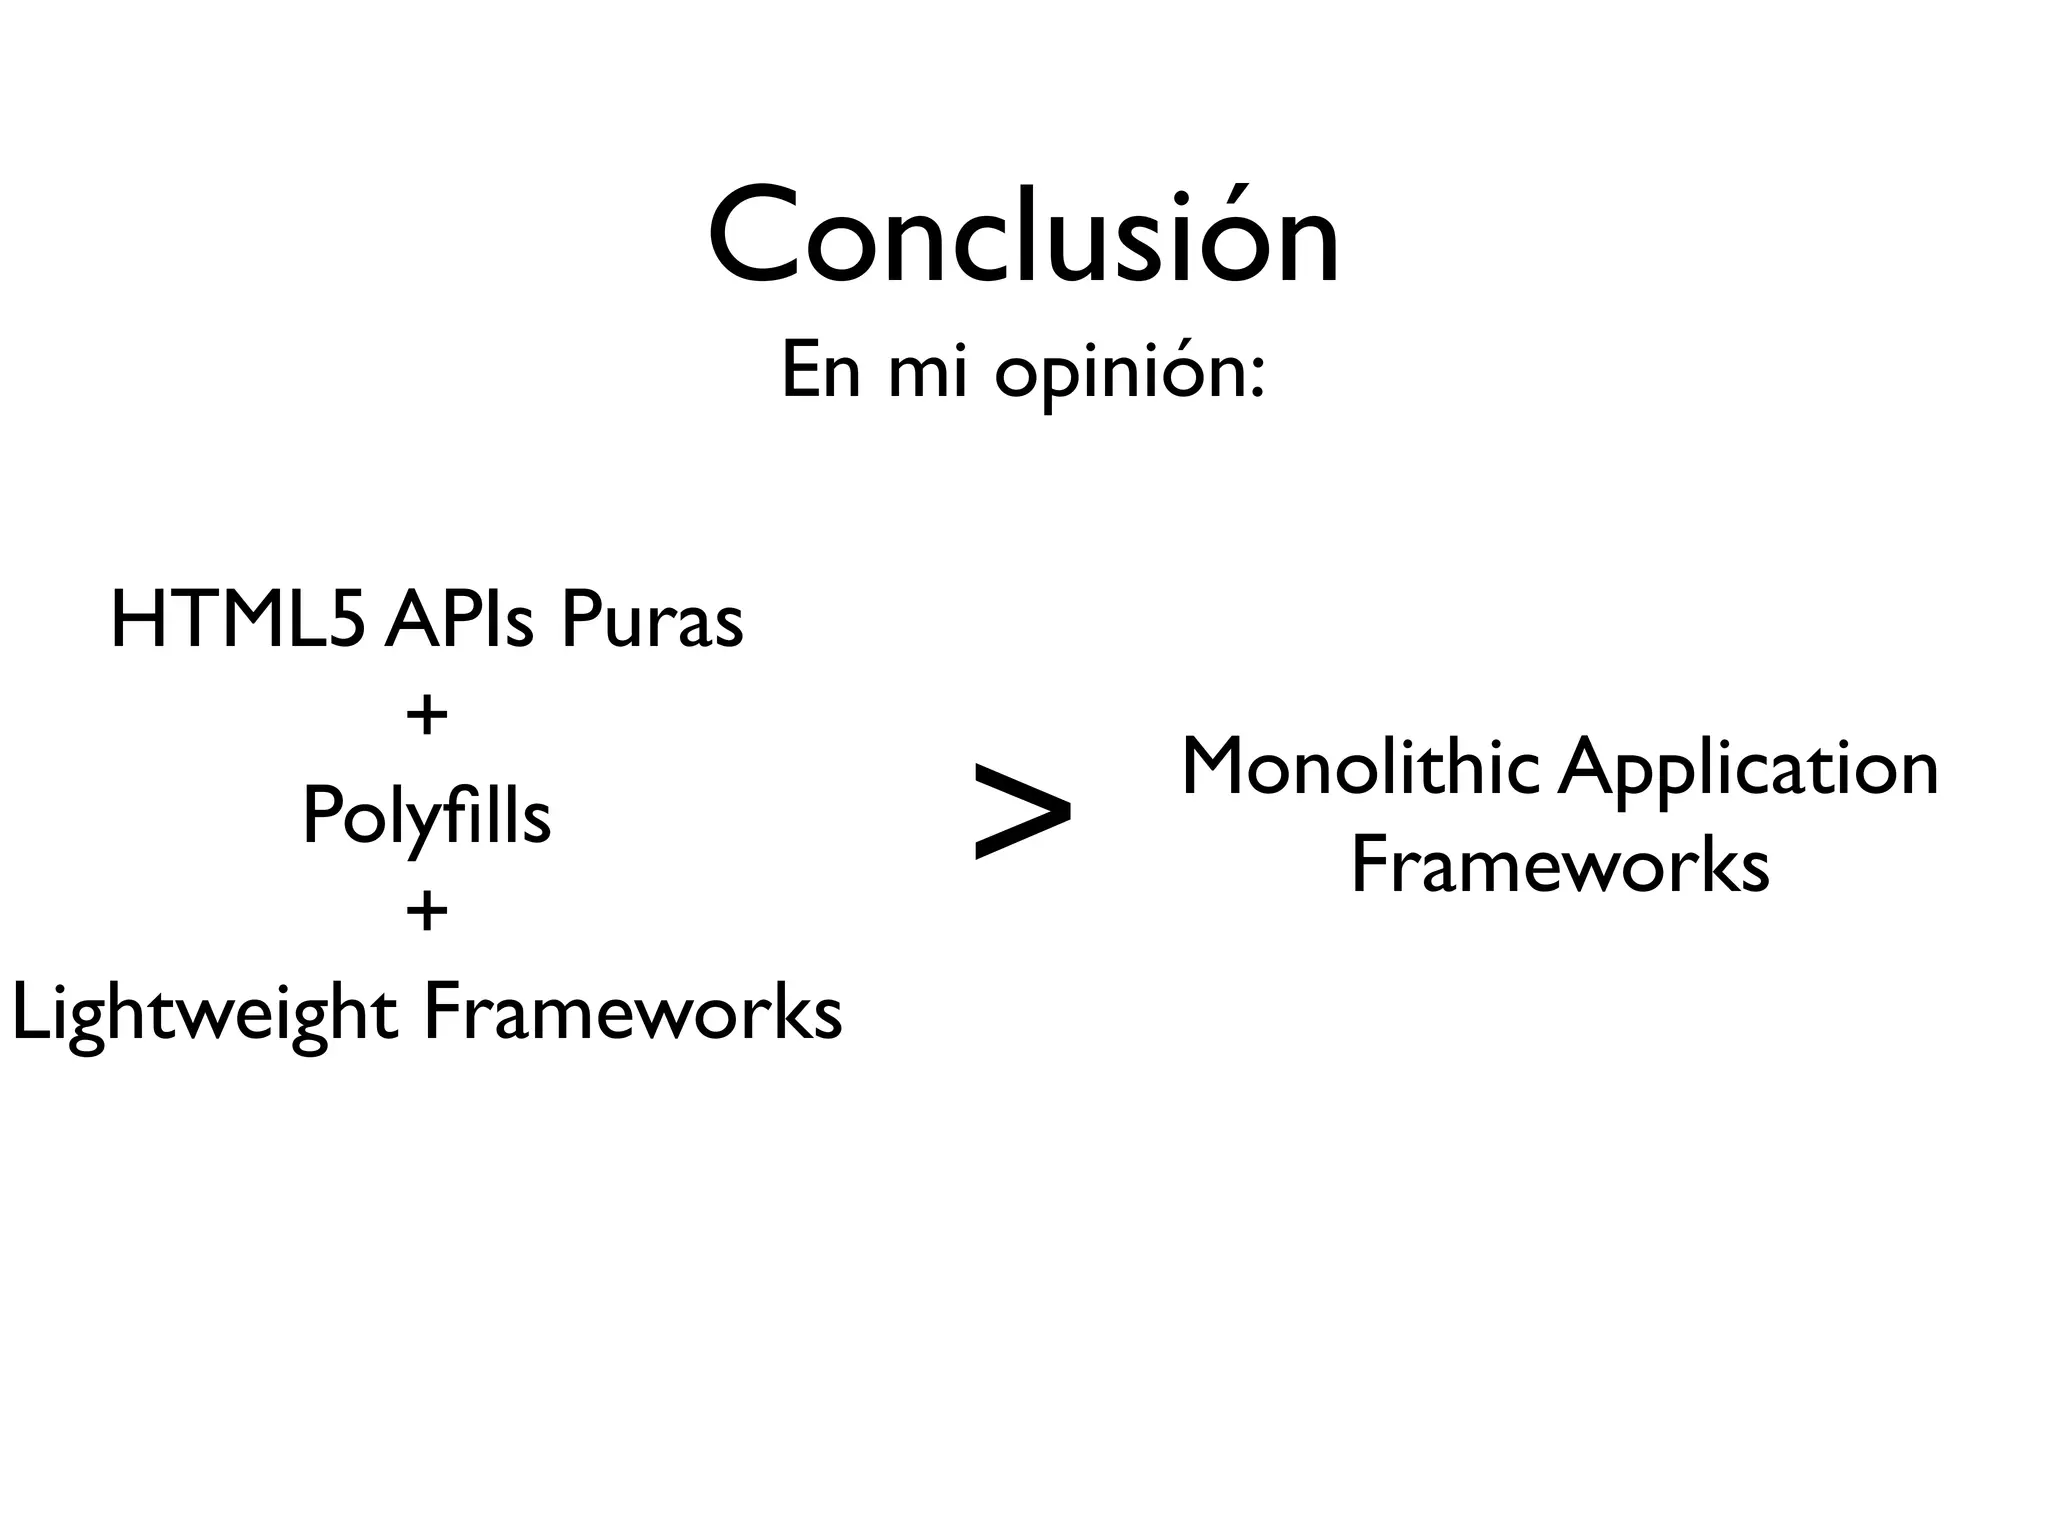


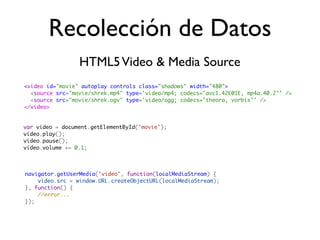
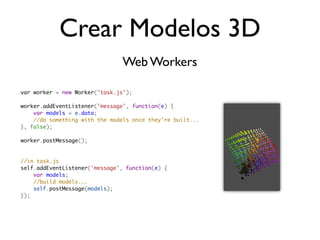
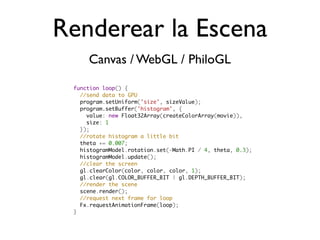
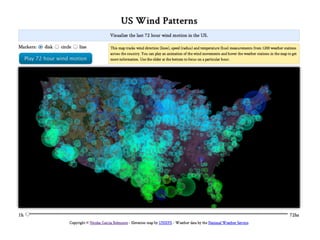
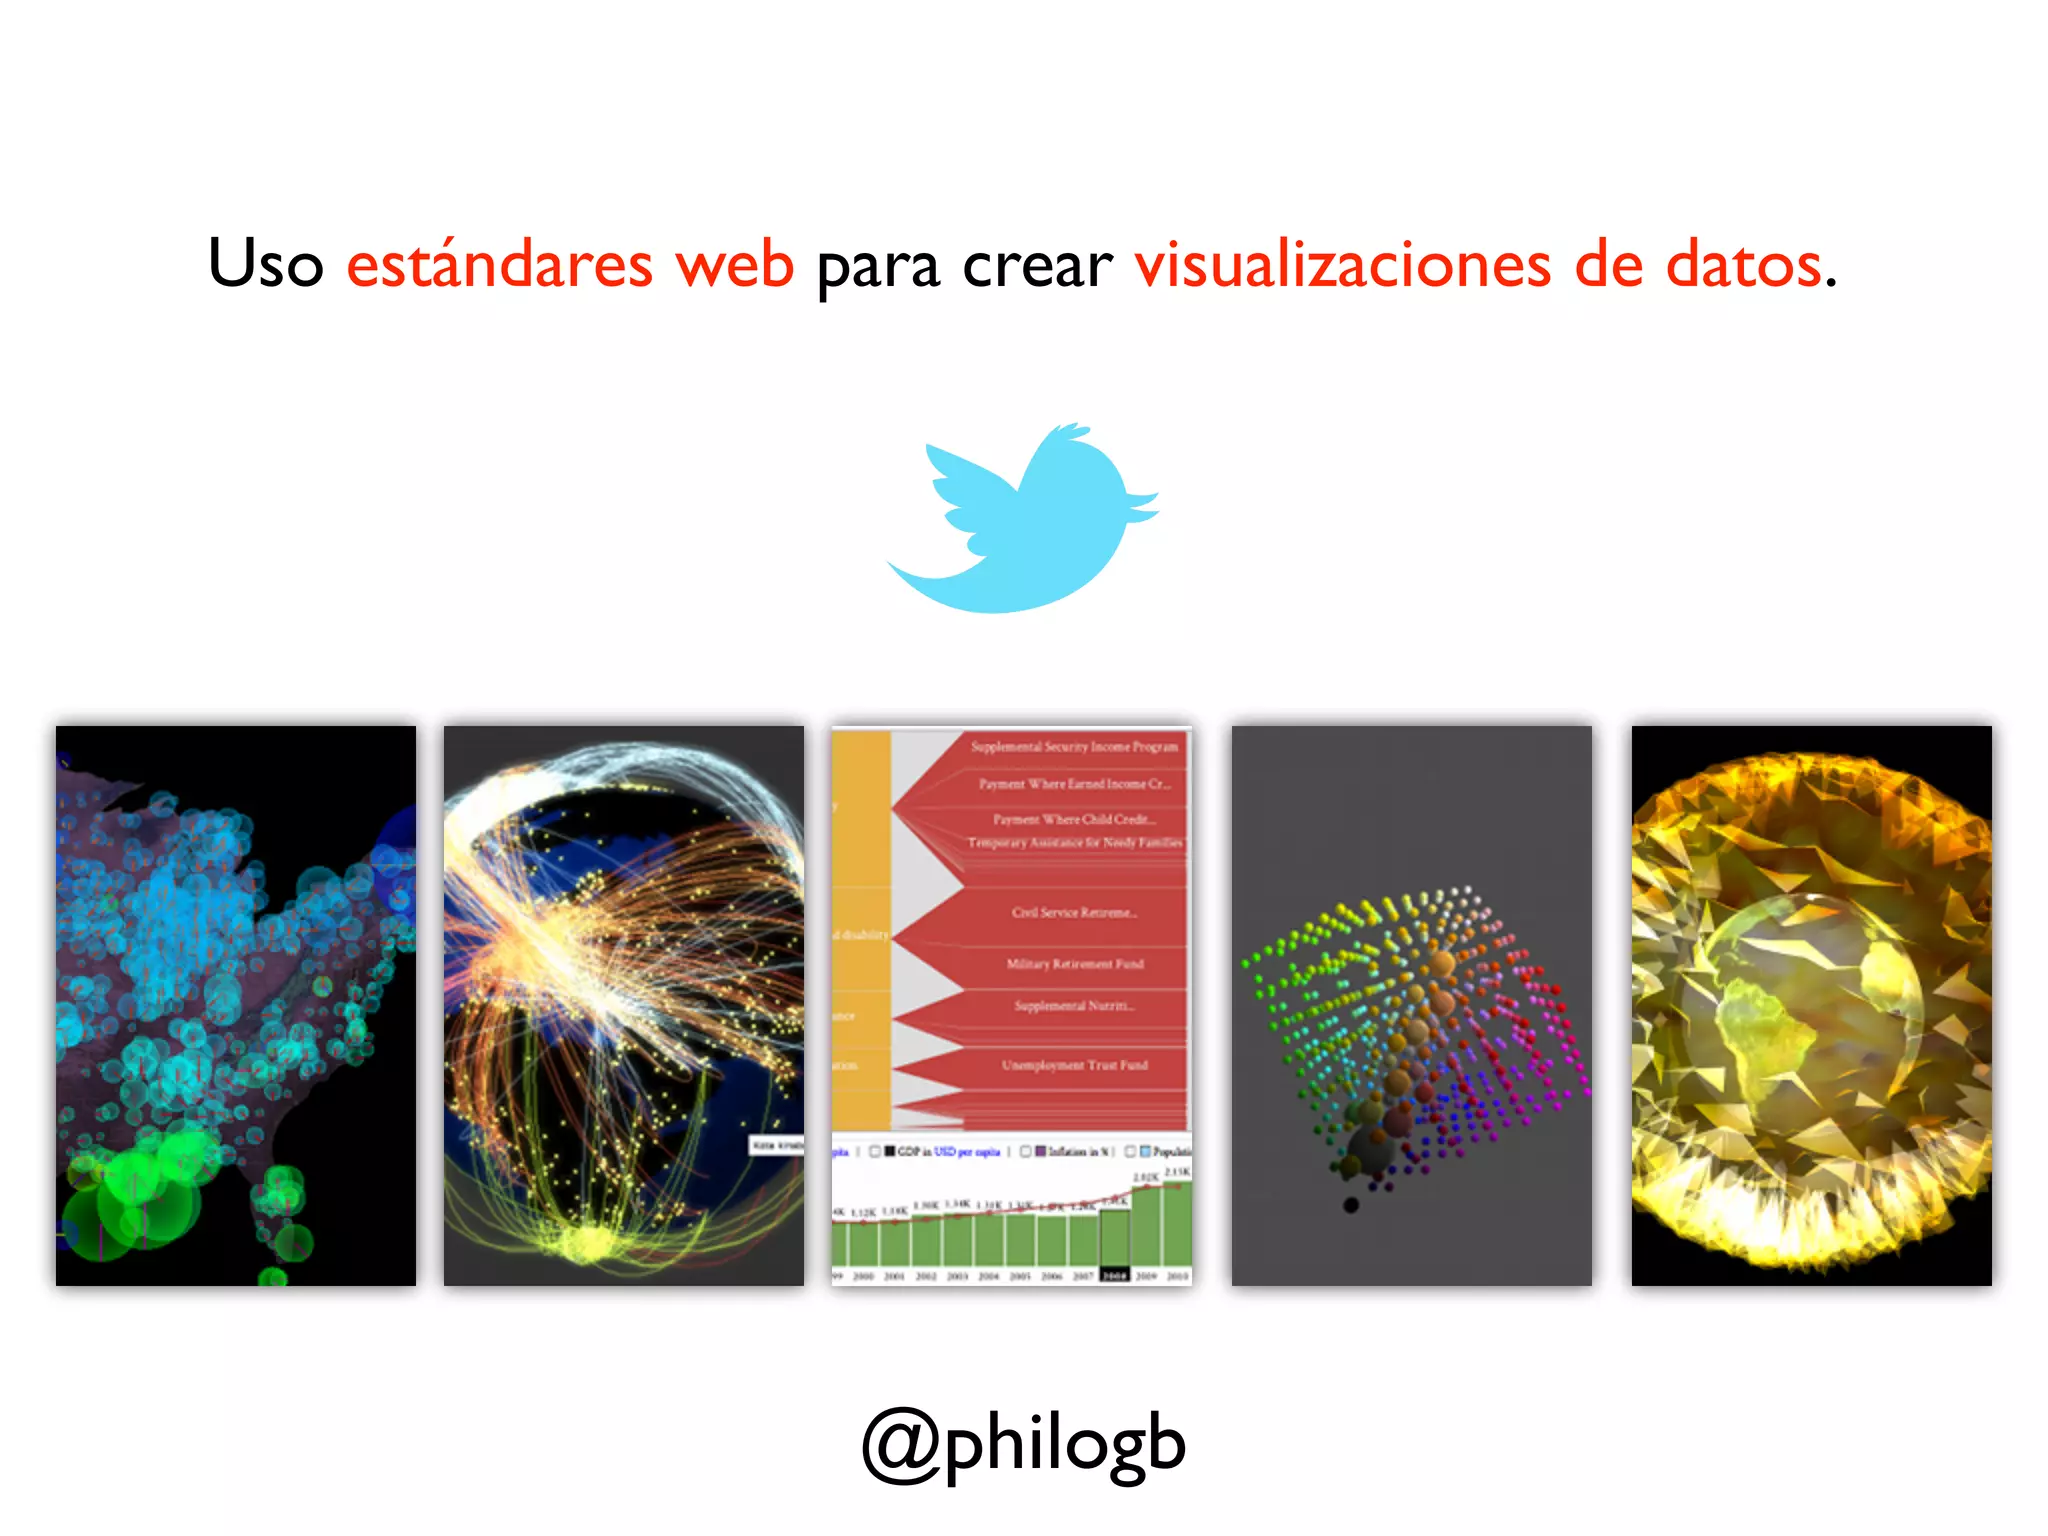
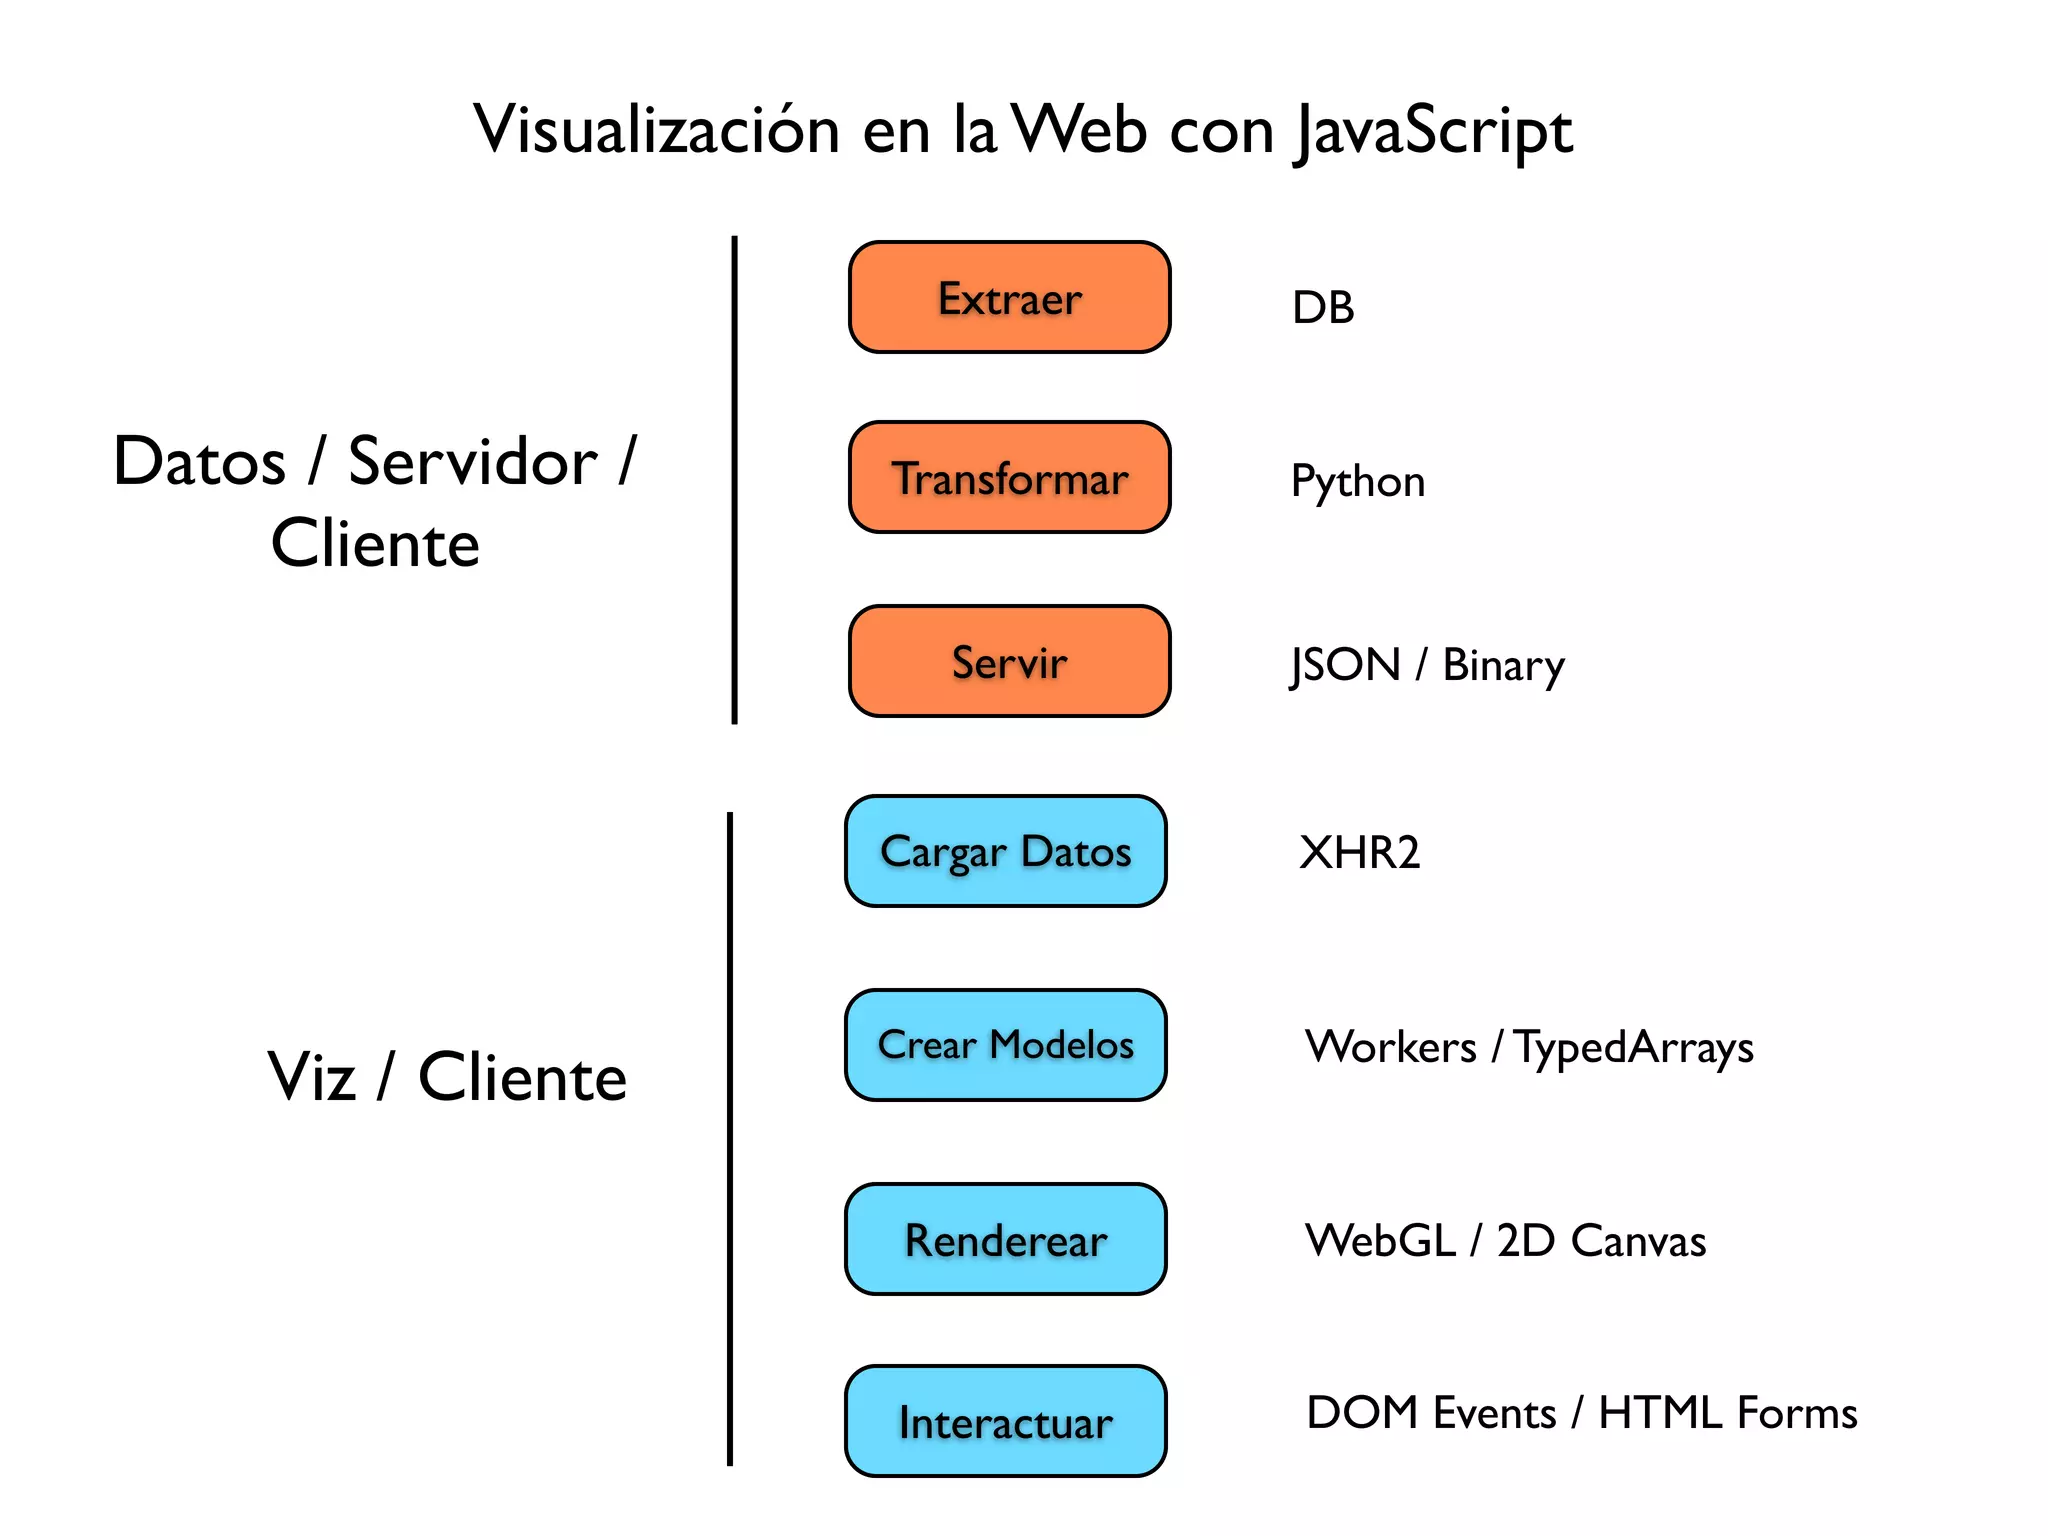
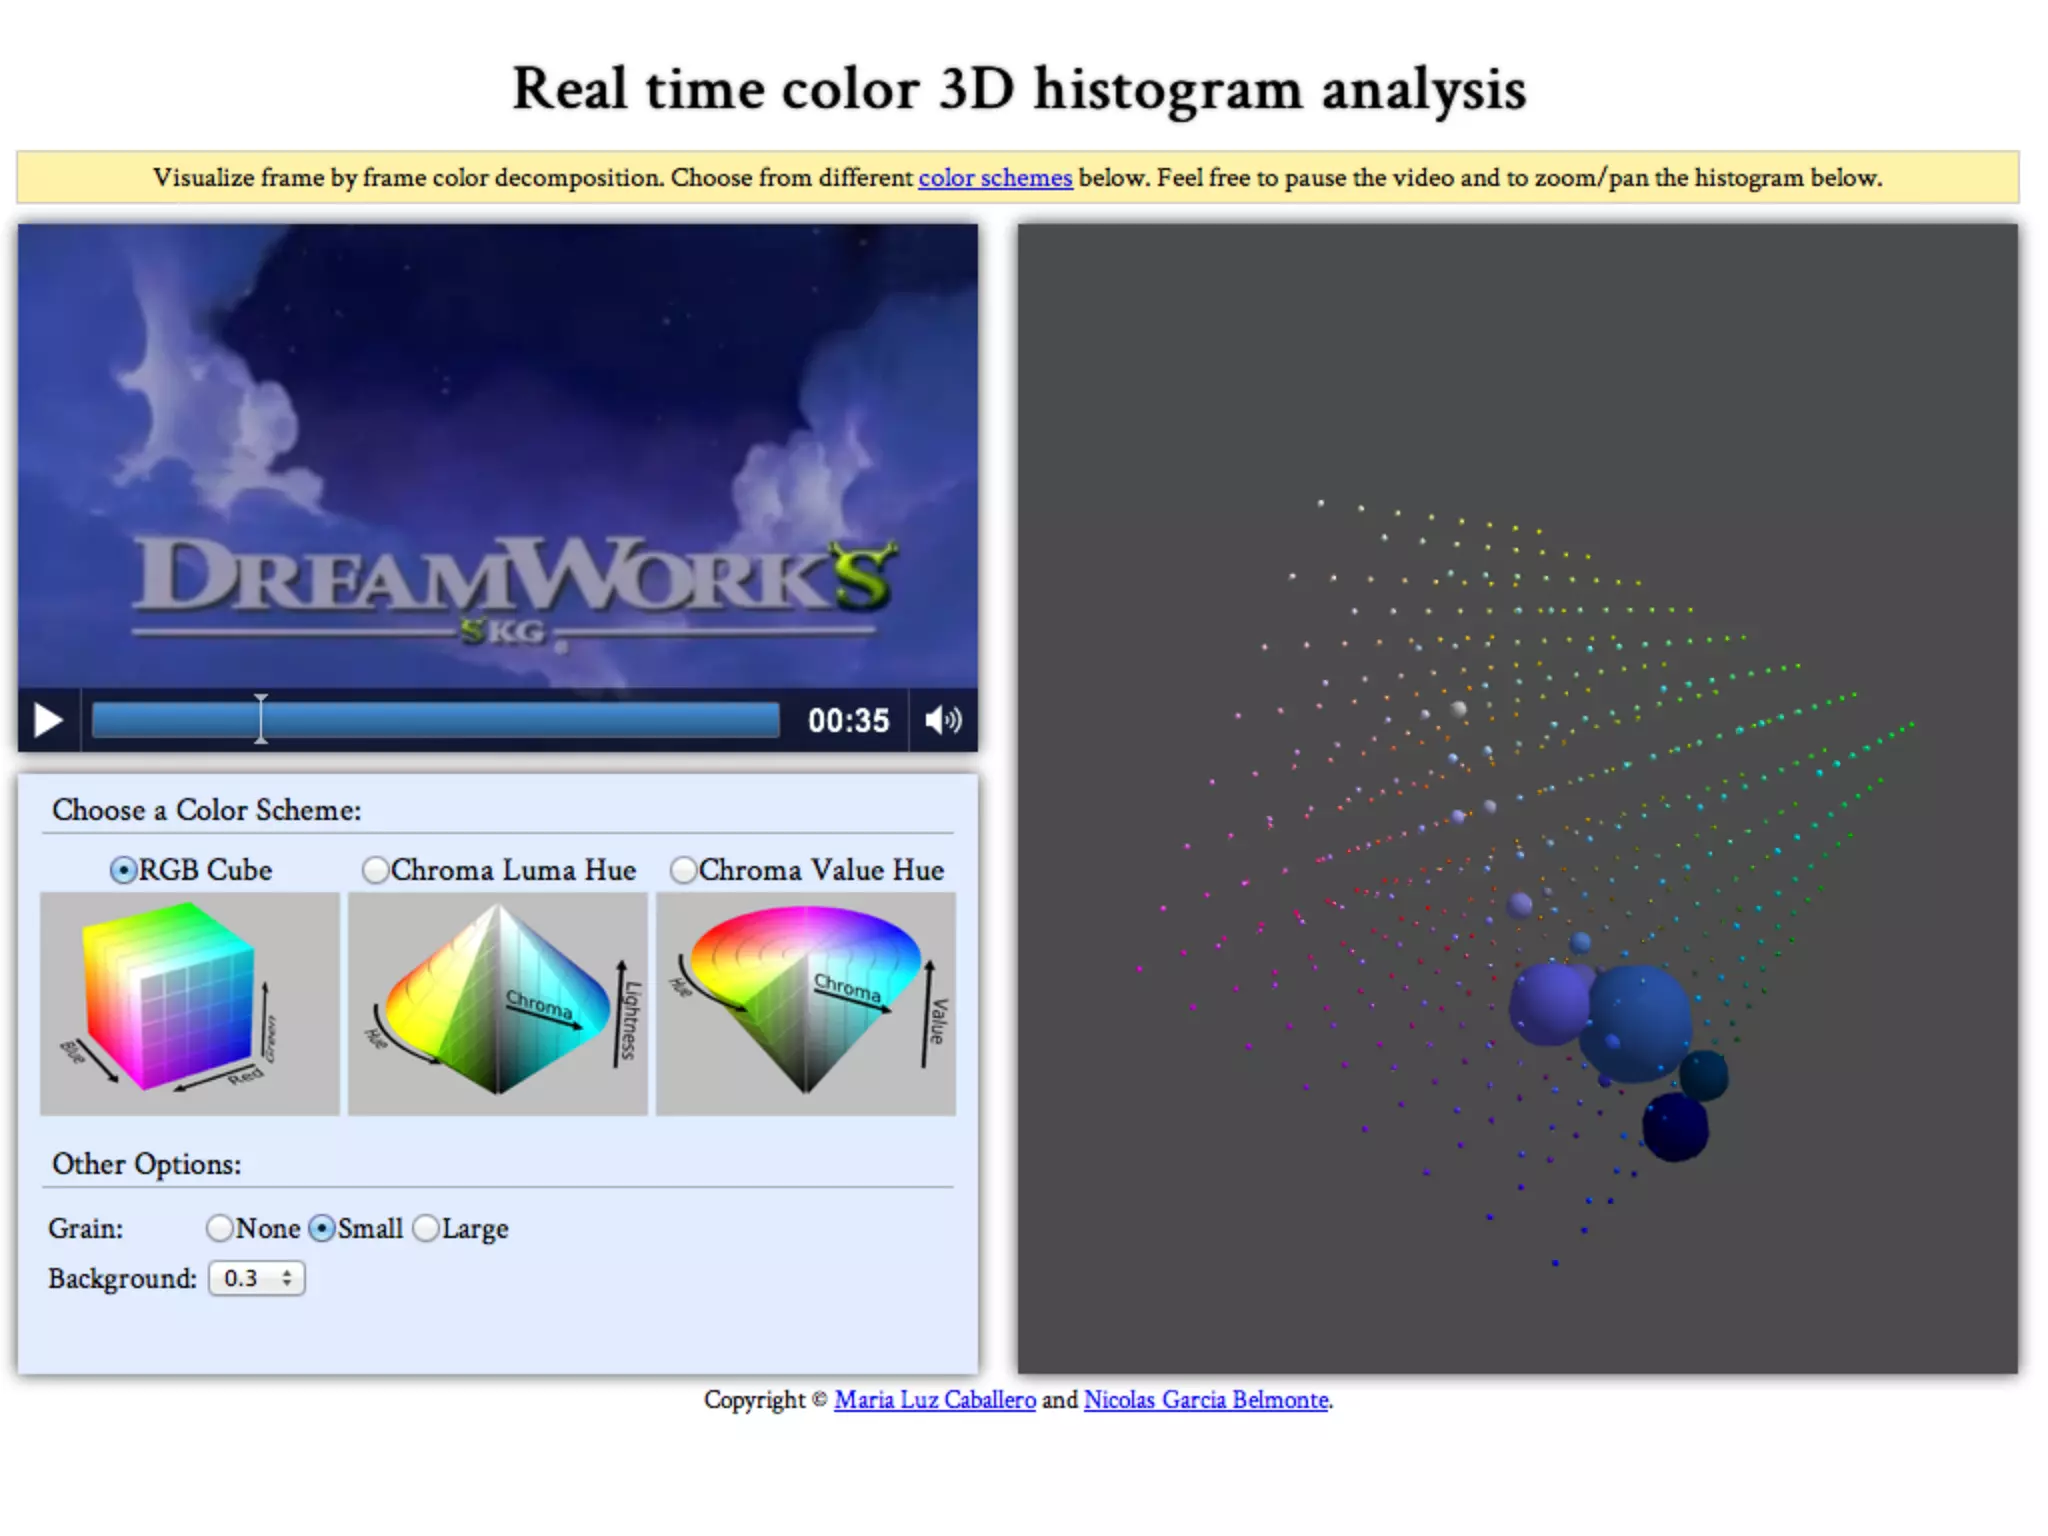
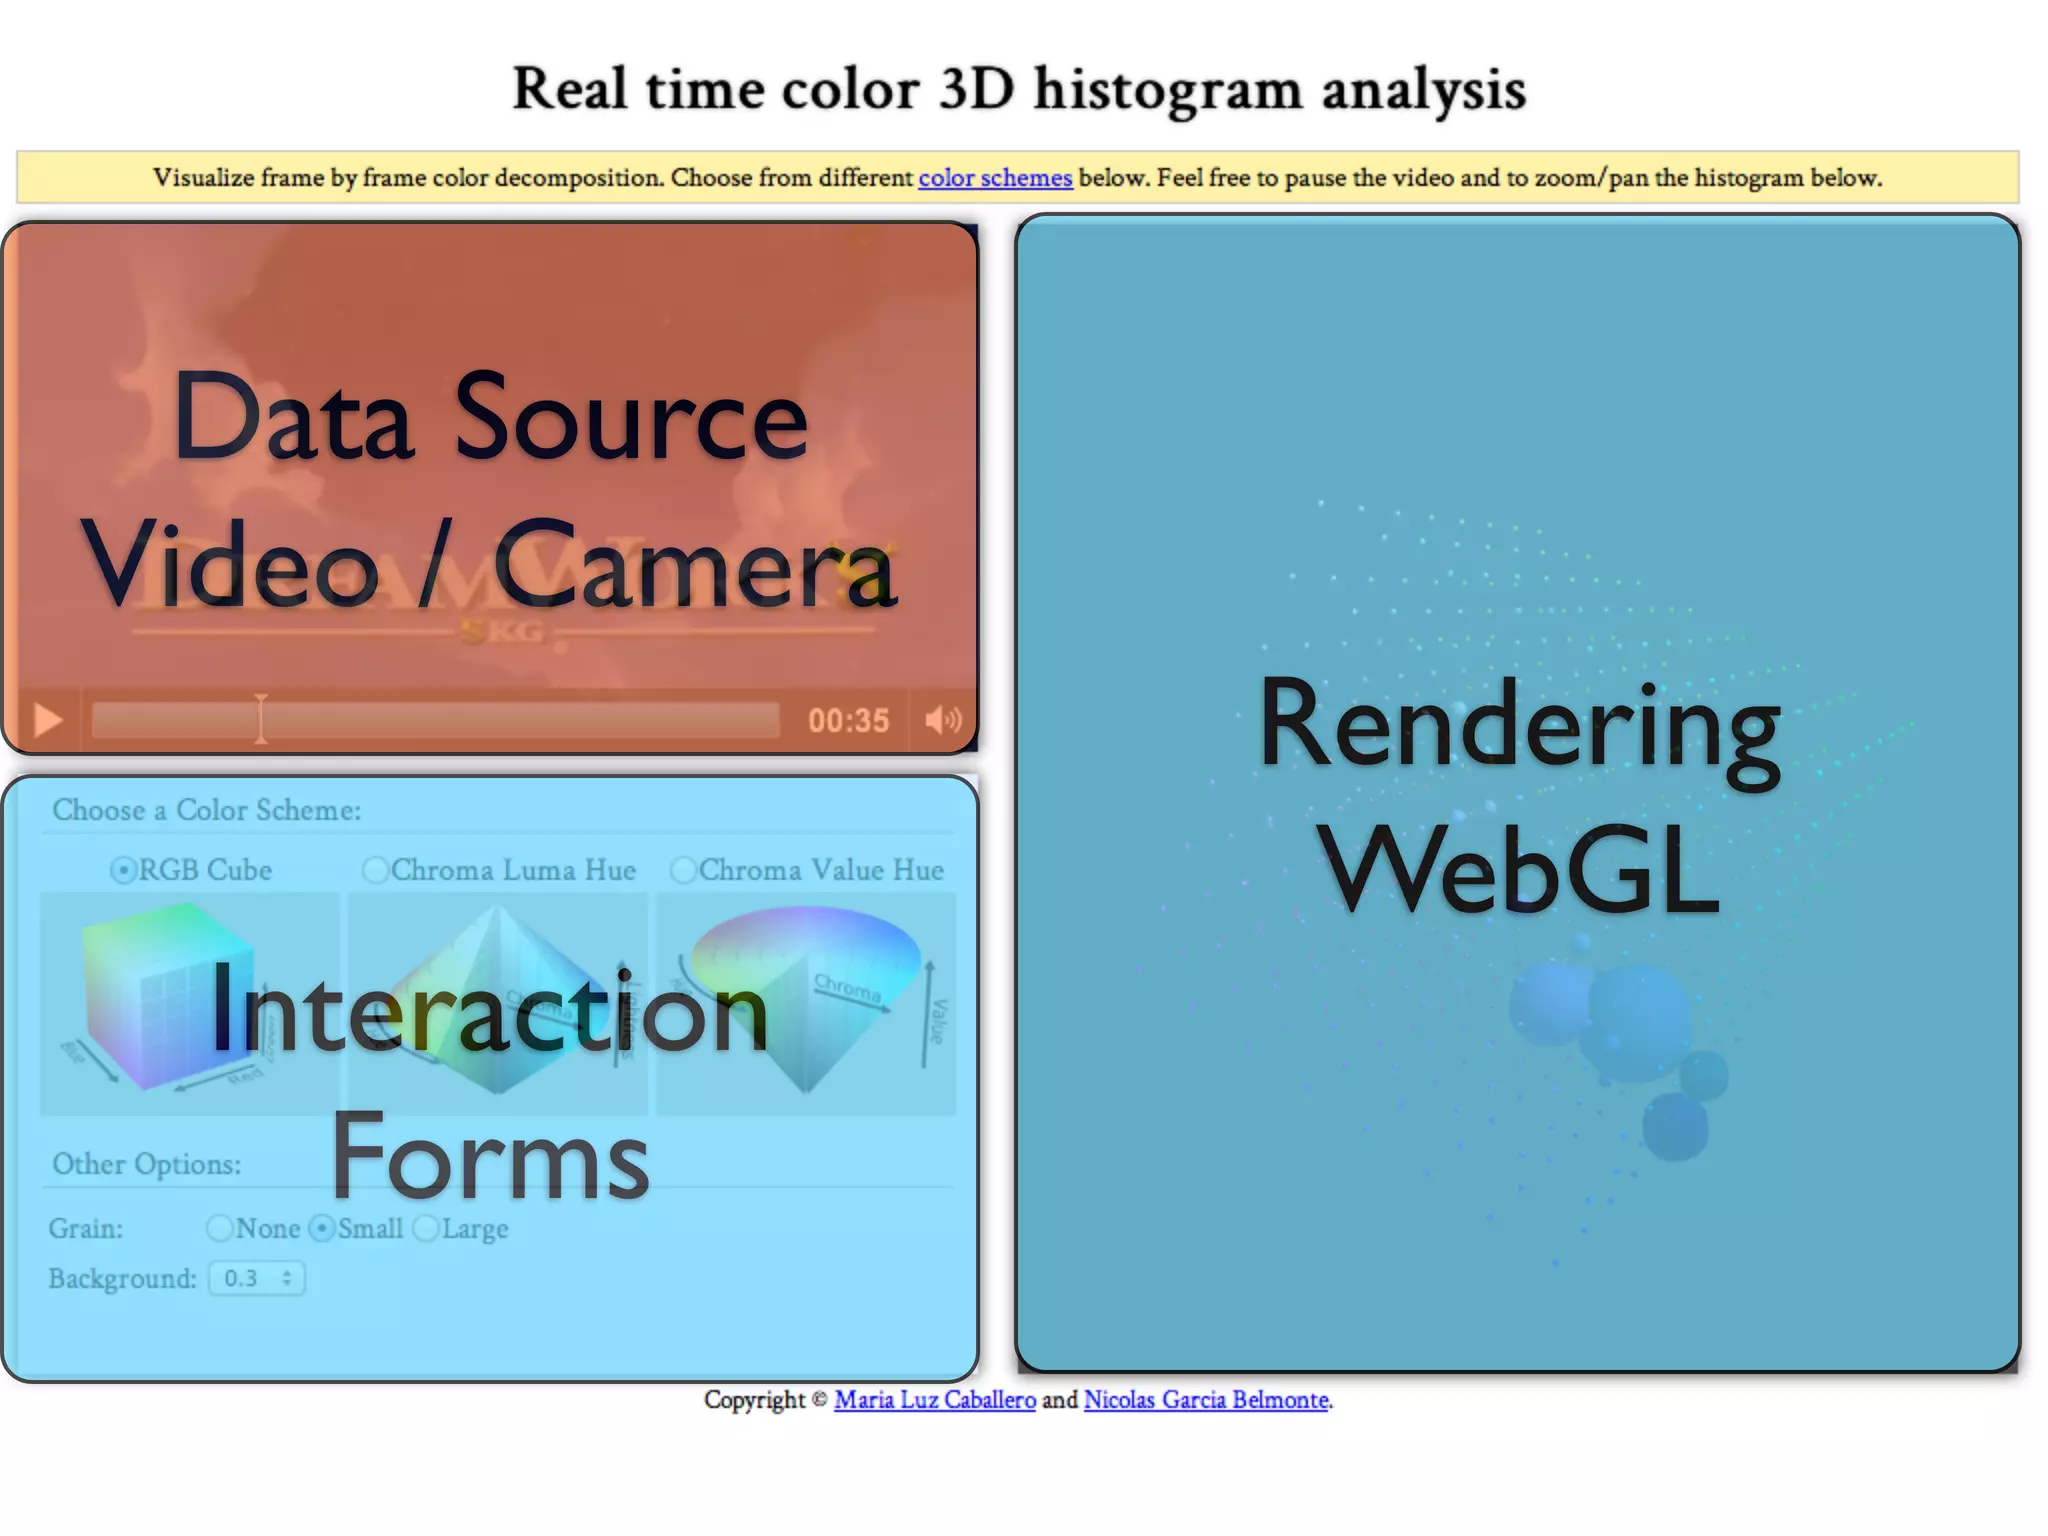
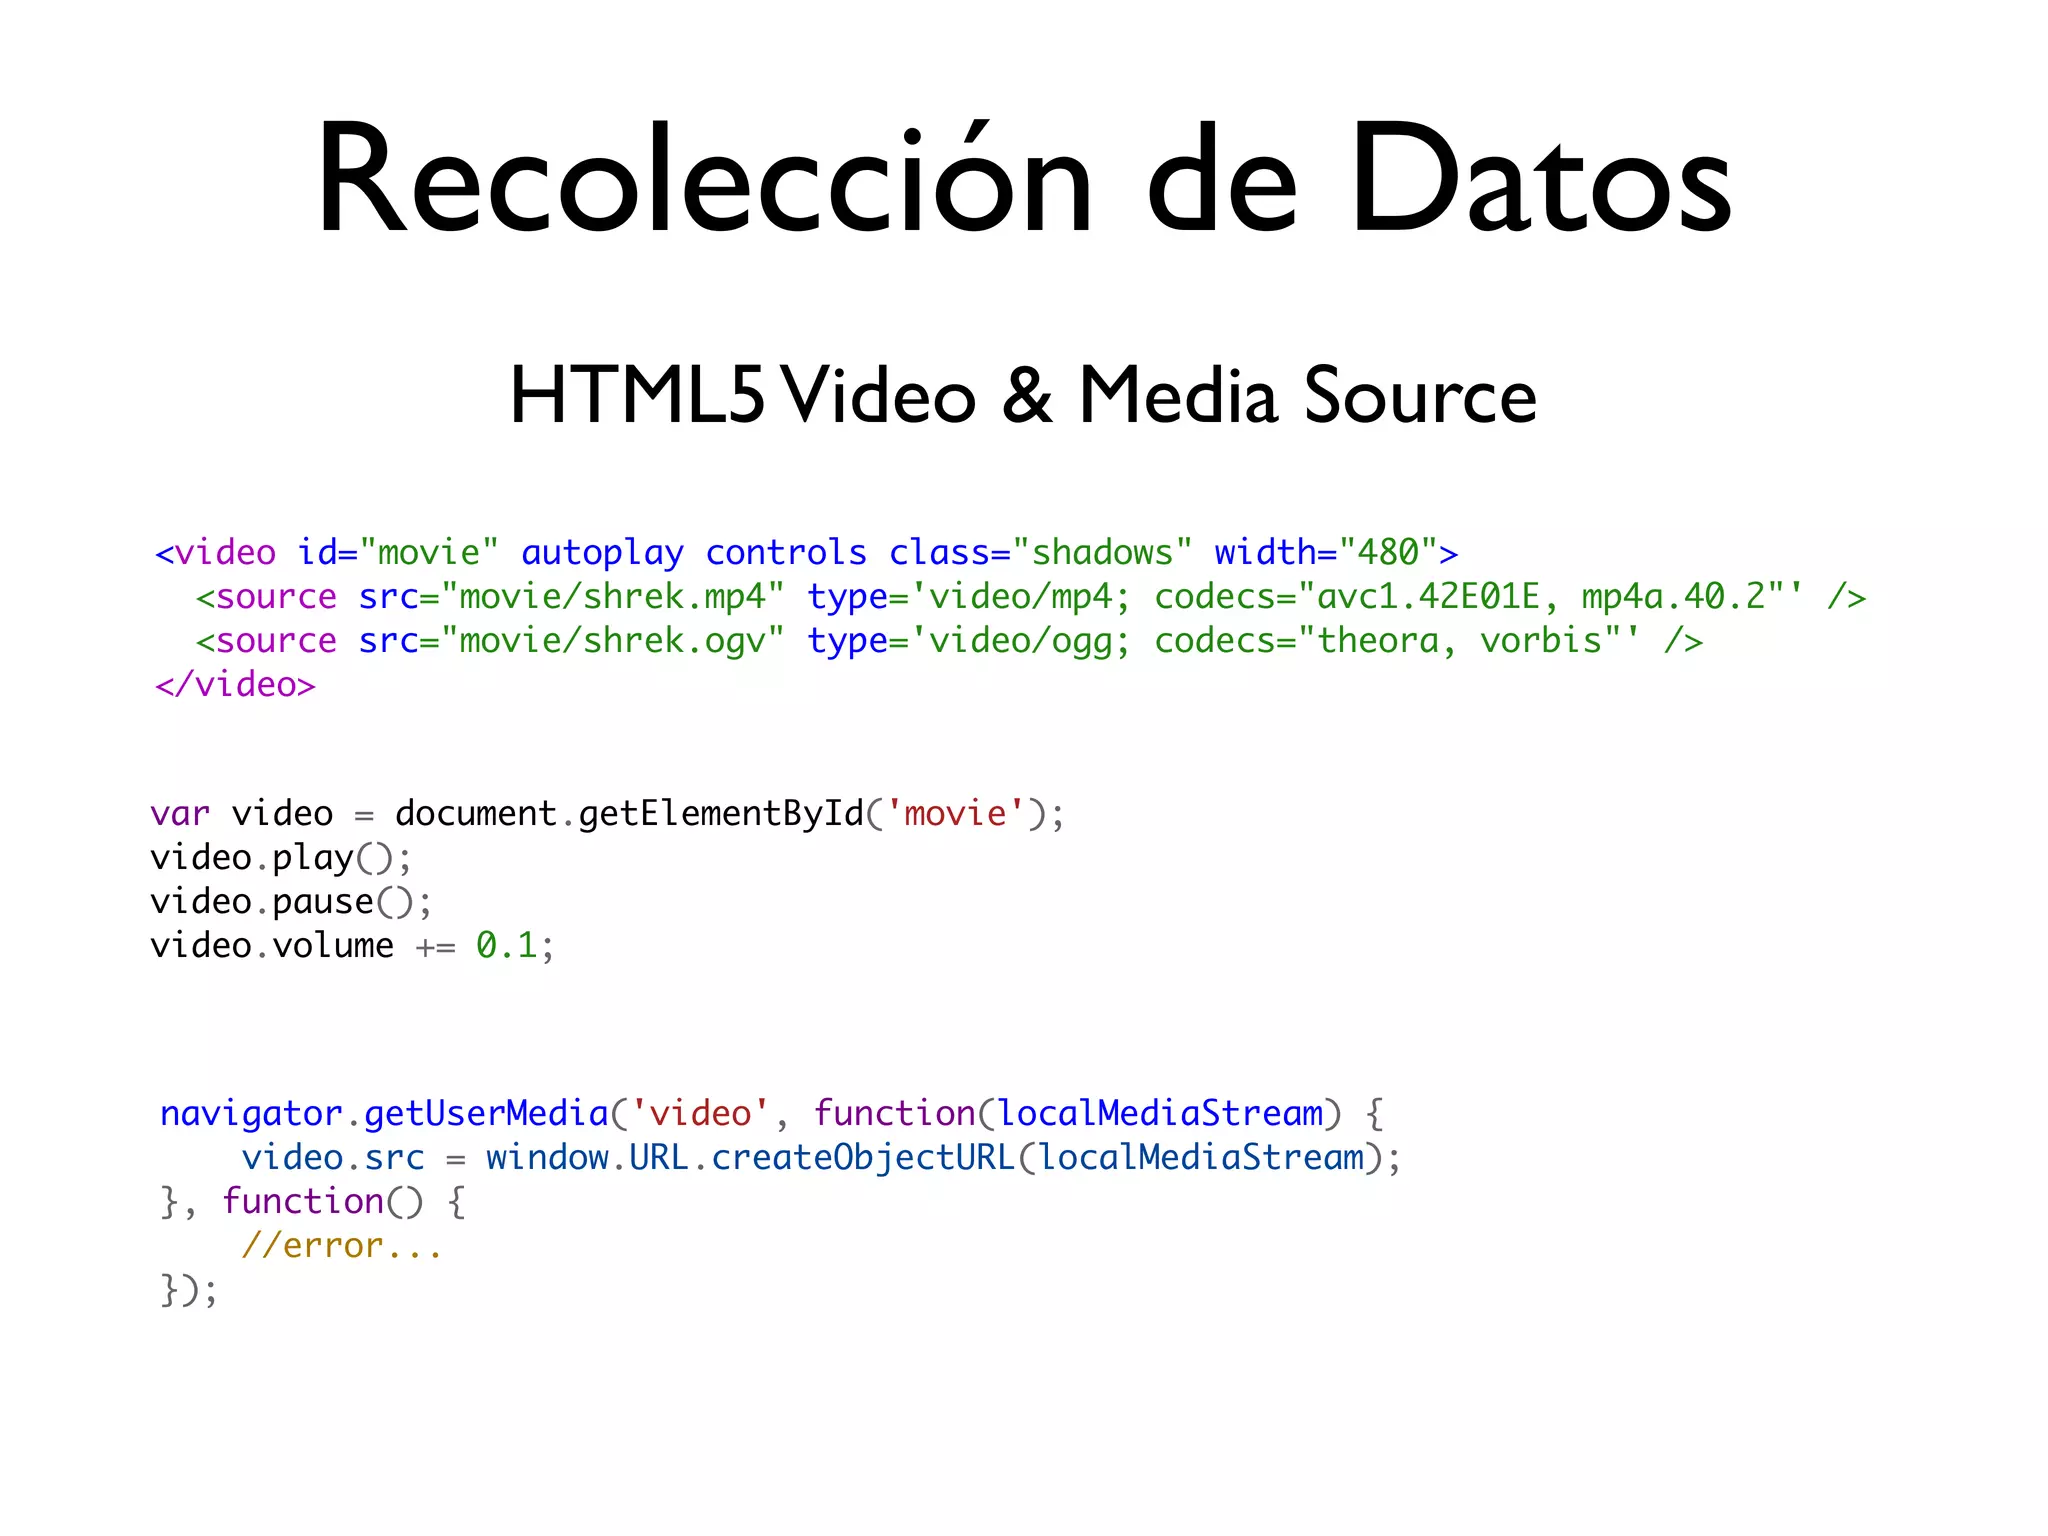
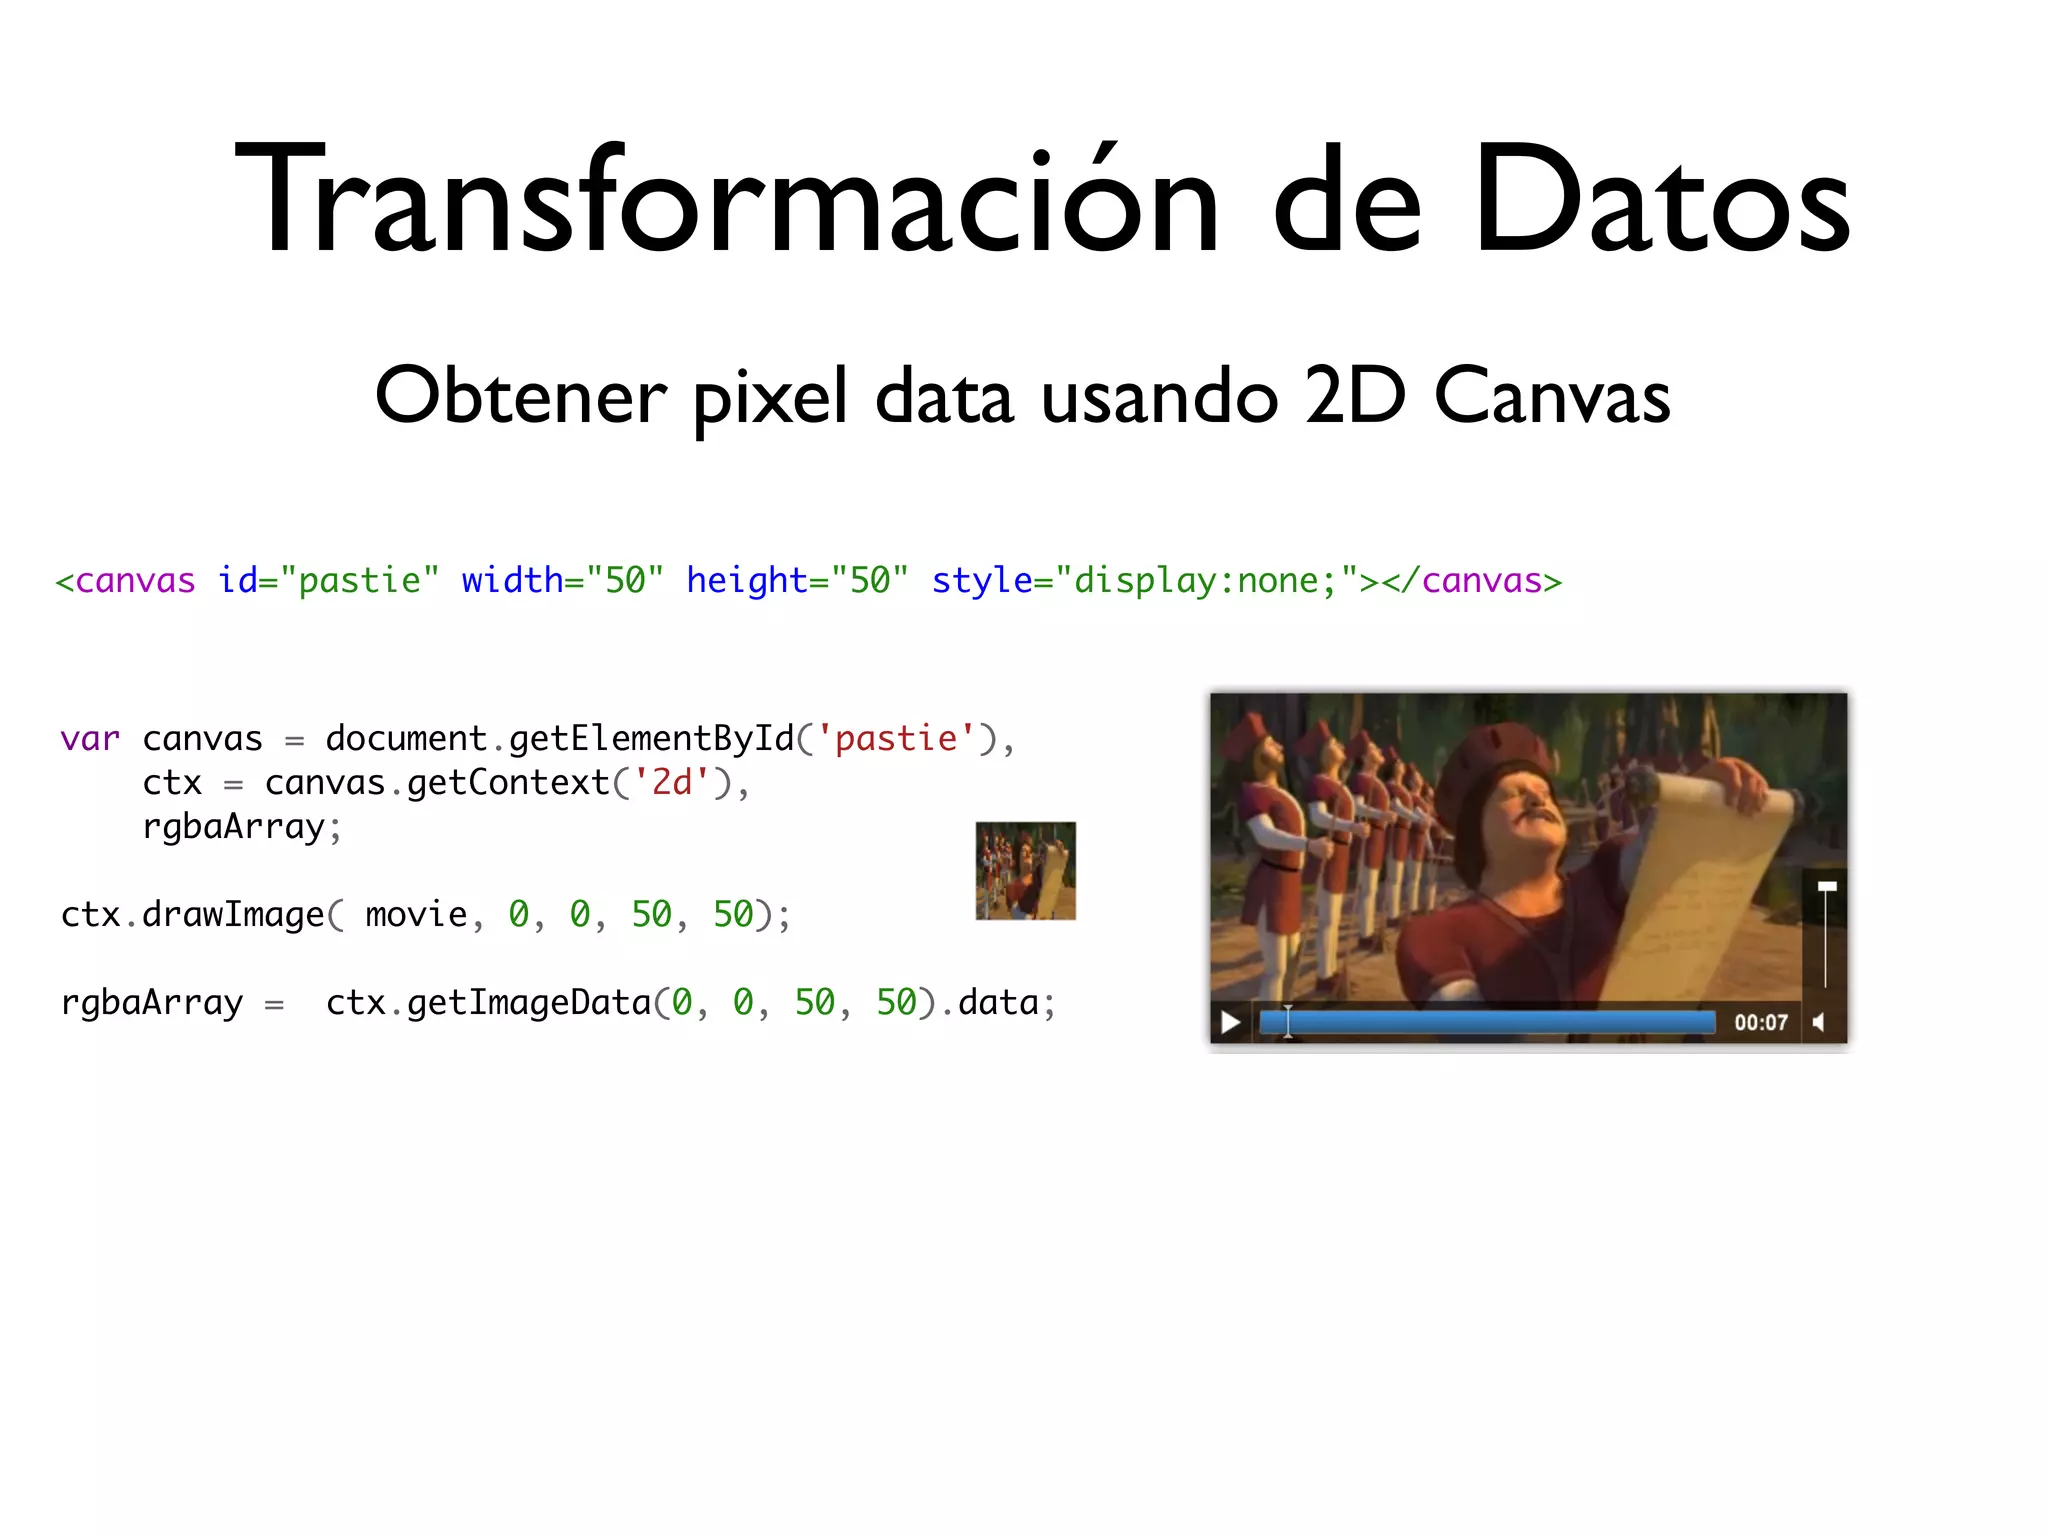
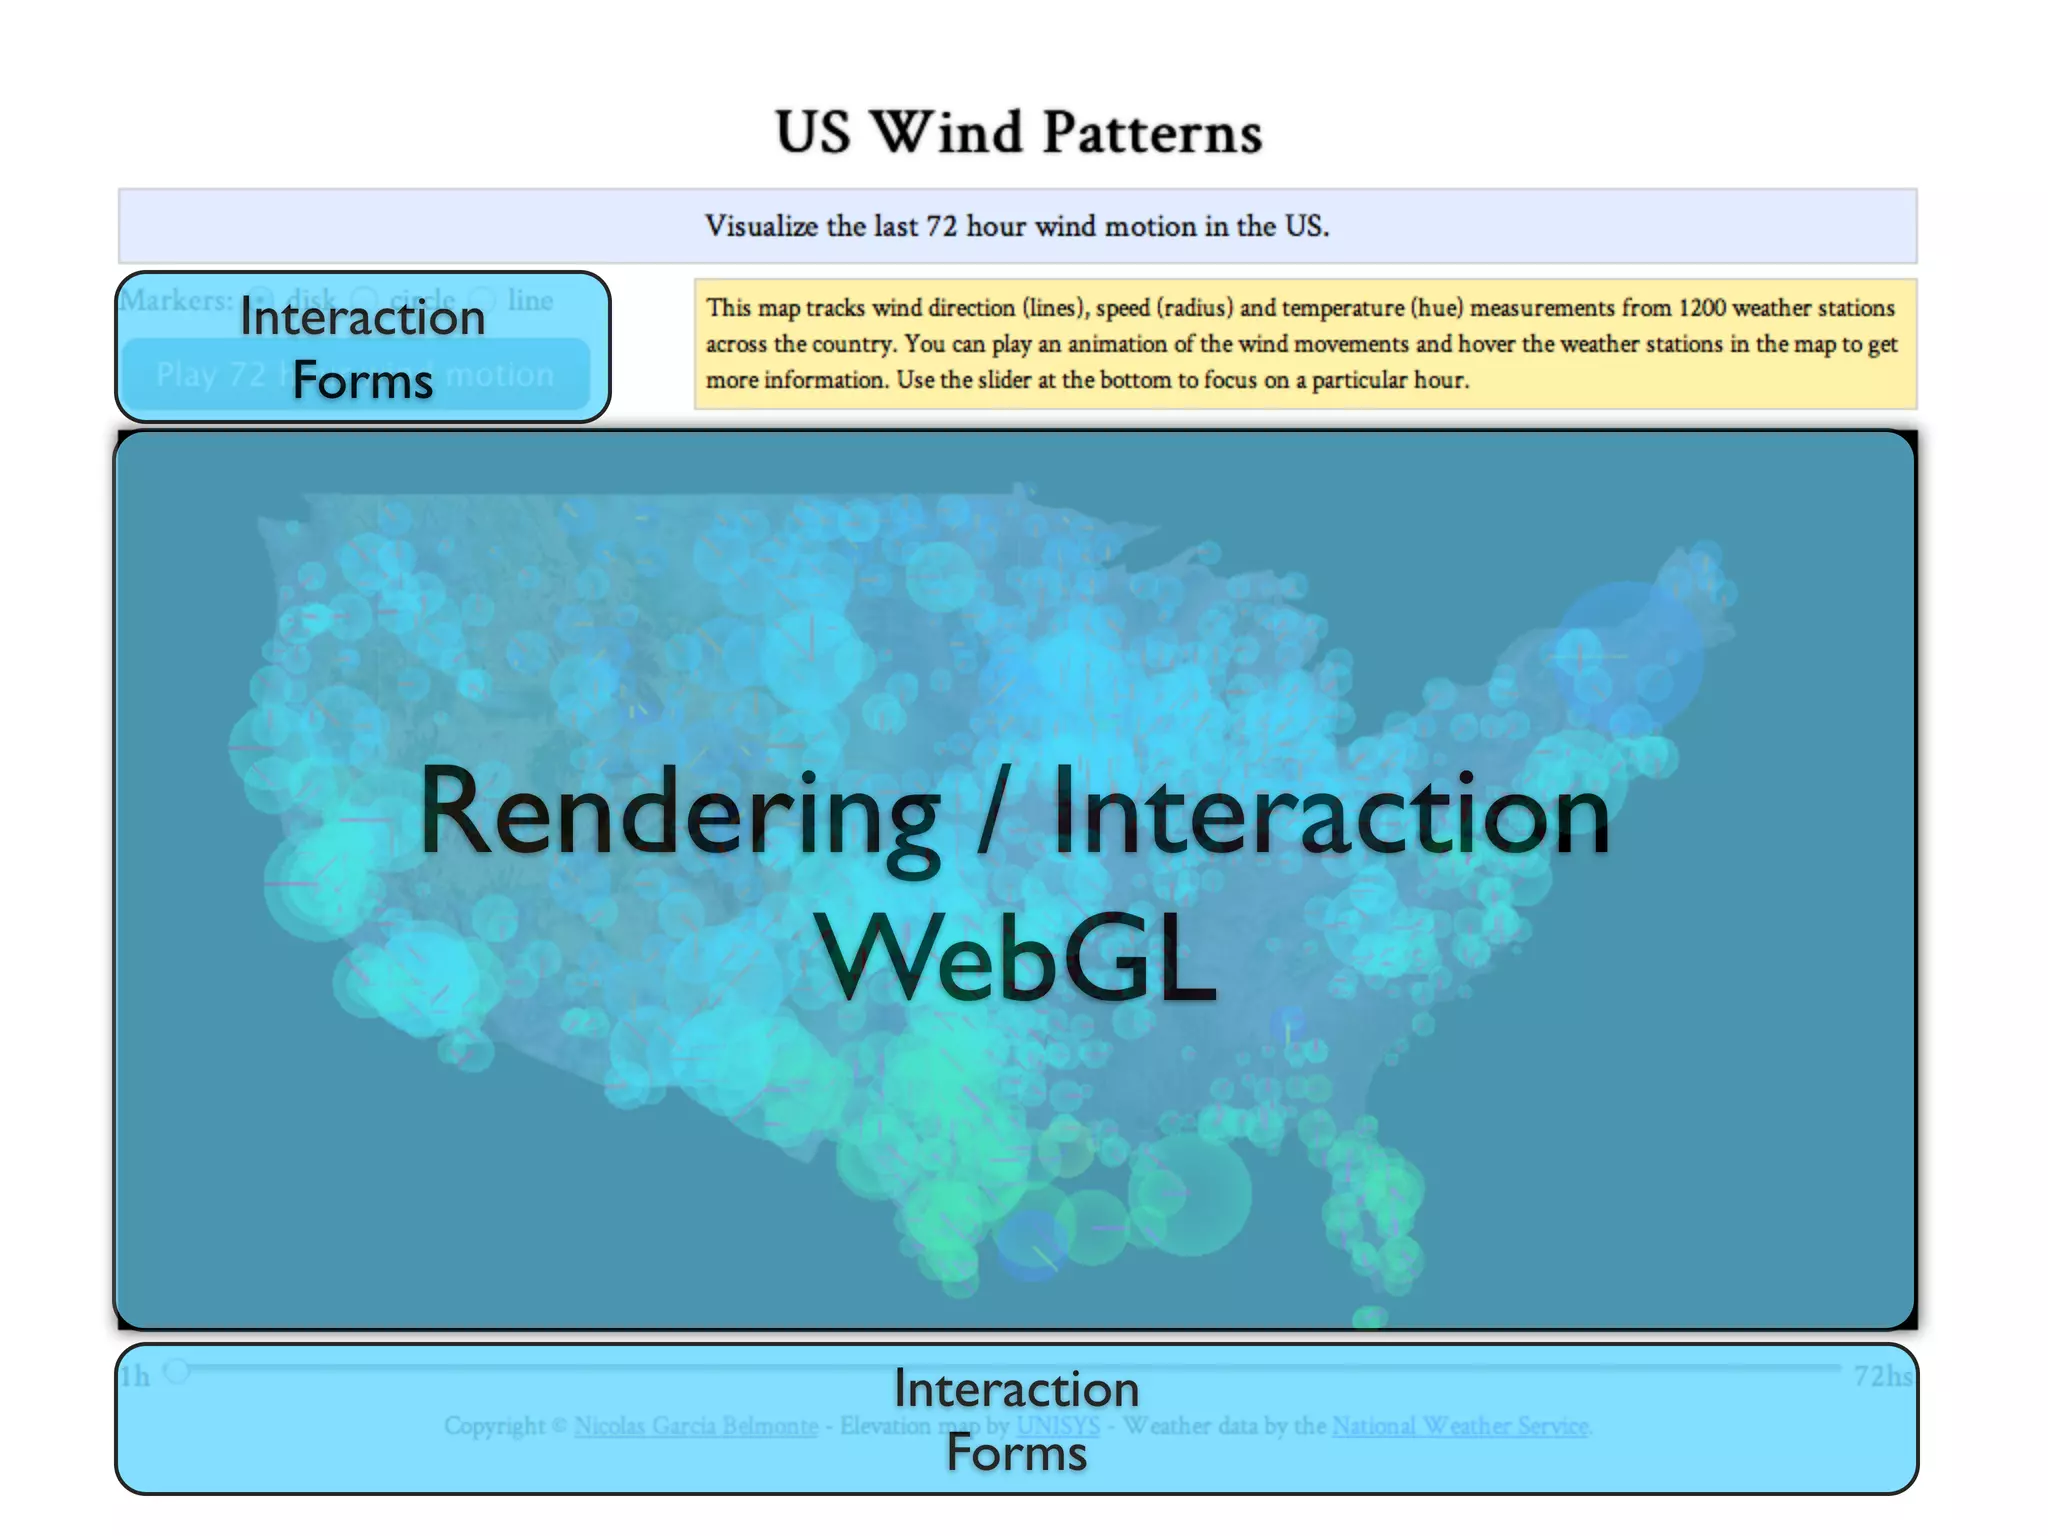
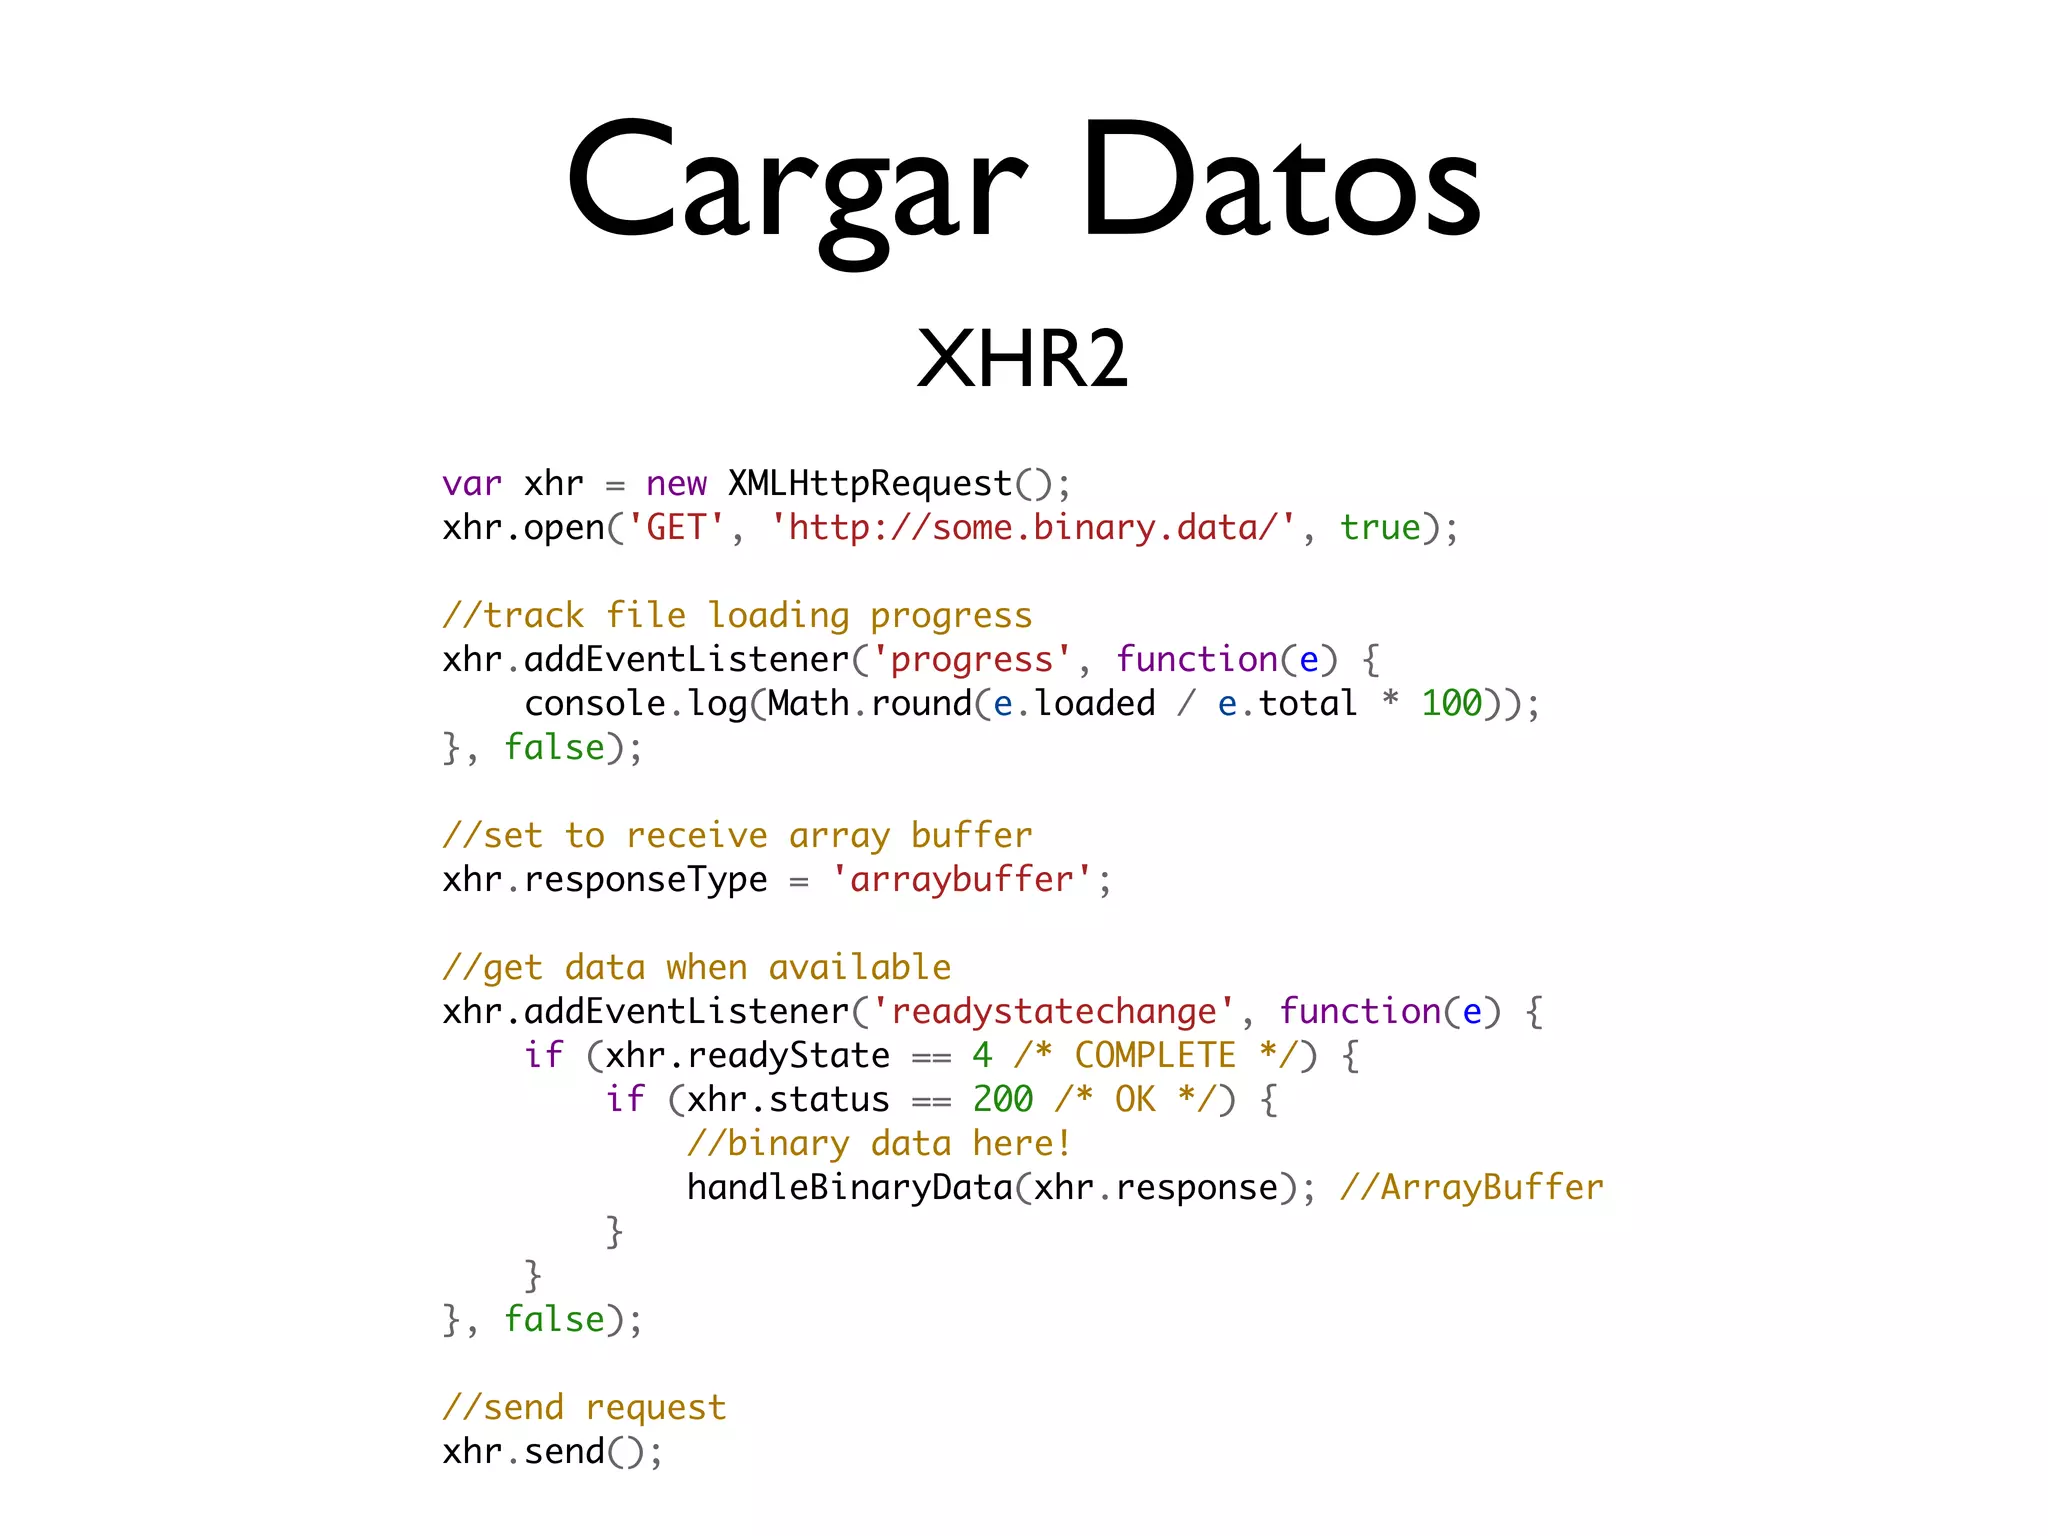
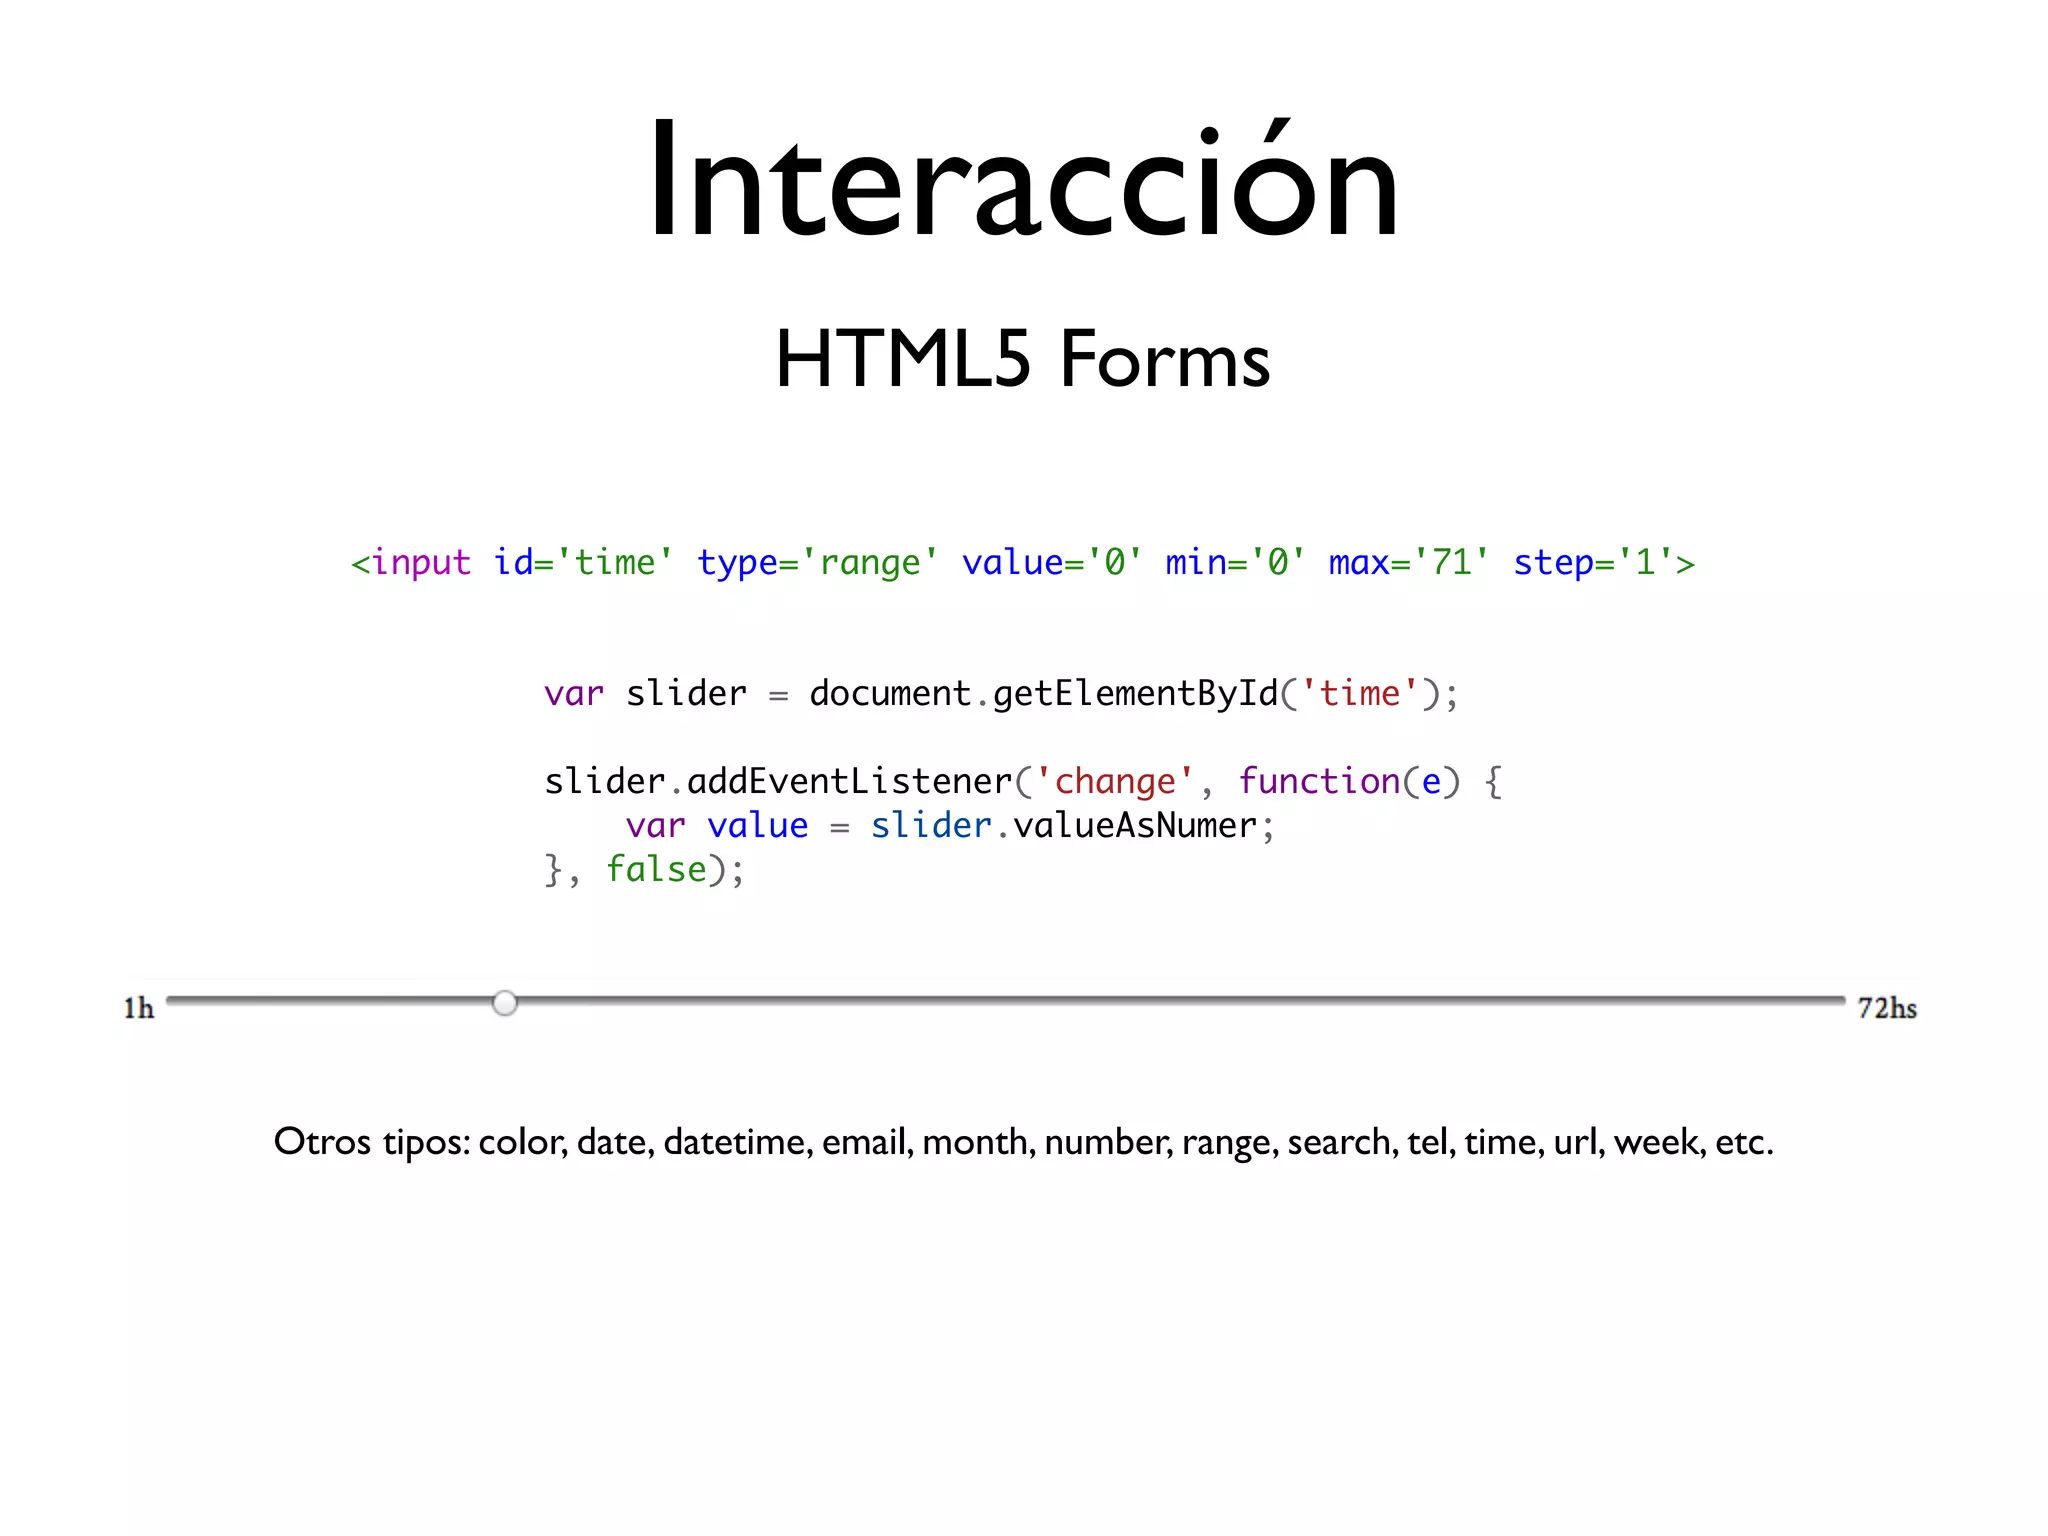
This document discusses using JavaScript for data visualization and graphics. It presents examples of collecting video data using HTML5 APIs, transforming the data with Web Workers and typed arrays, rendering 3D scenes with WebGL and PhiloGL, and interacting with forms. The examples show loading weather data and manipulating it to render an interactive 3D histogram in the browser. The document argues that using modern HTML5 APIs and lightweight frameworks directly provides more power and control than monolithic application frameworks.


