Download to read offline
![[Type the document title]
JMeter JMX Script Creation
via BlazeMeter](https://image.slidesharecdn.com/jmeterjmxscriptcreation-pdf-200429184933/85/JMeter-JMX-Script-Creation-via-BlazeMeter-1-320.jpg)


![[Type the document title]
JMeter JMX Script Creation
via BlazeMeter](https://image.slidesharecdn.com/jmeterjmxscriptcreation-pdf-200429184933/75/JMeter-JMX-Script-Creation-via-BlazeMeter-1-2048.jpg)
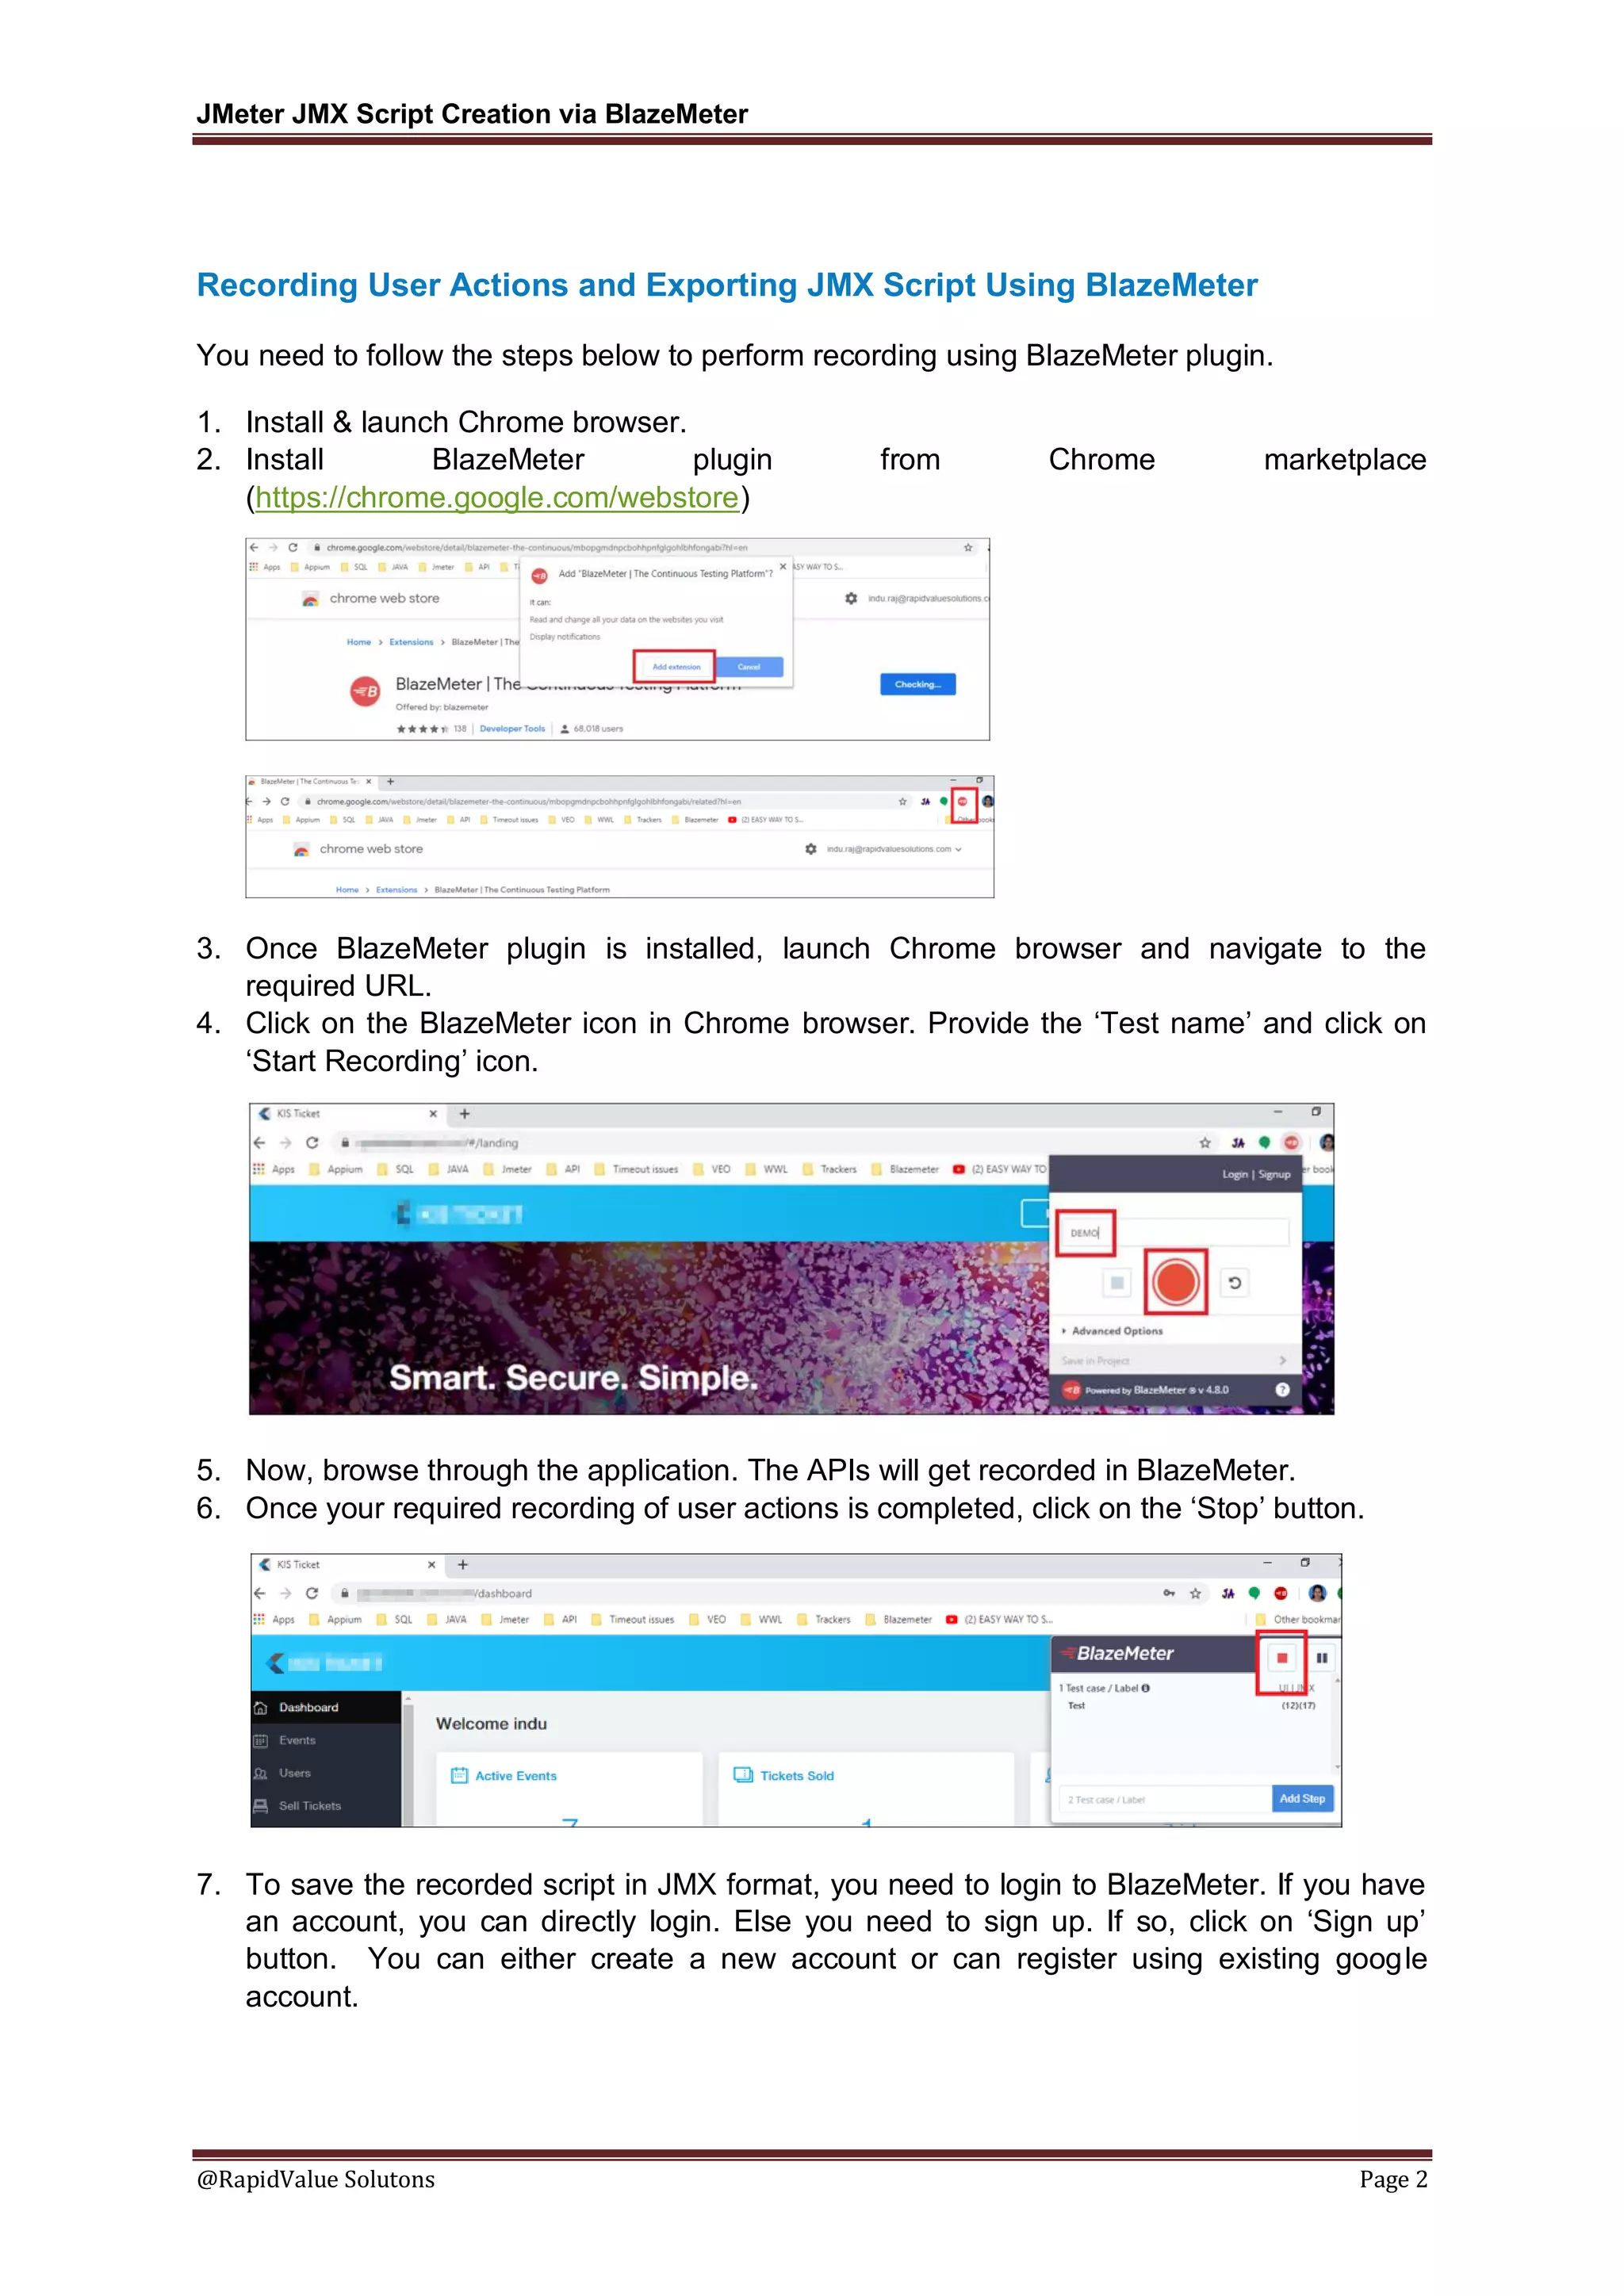


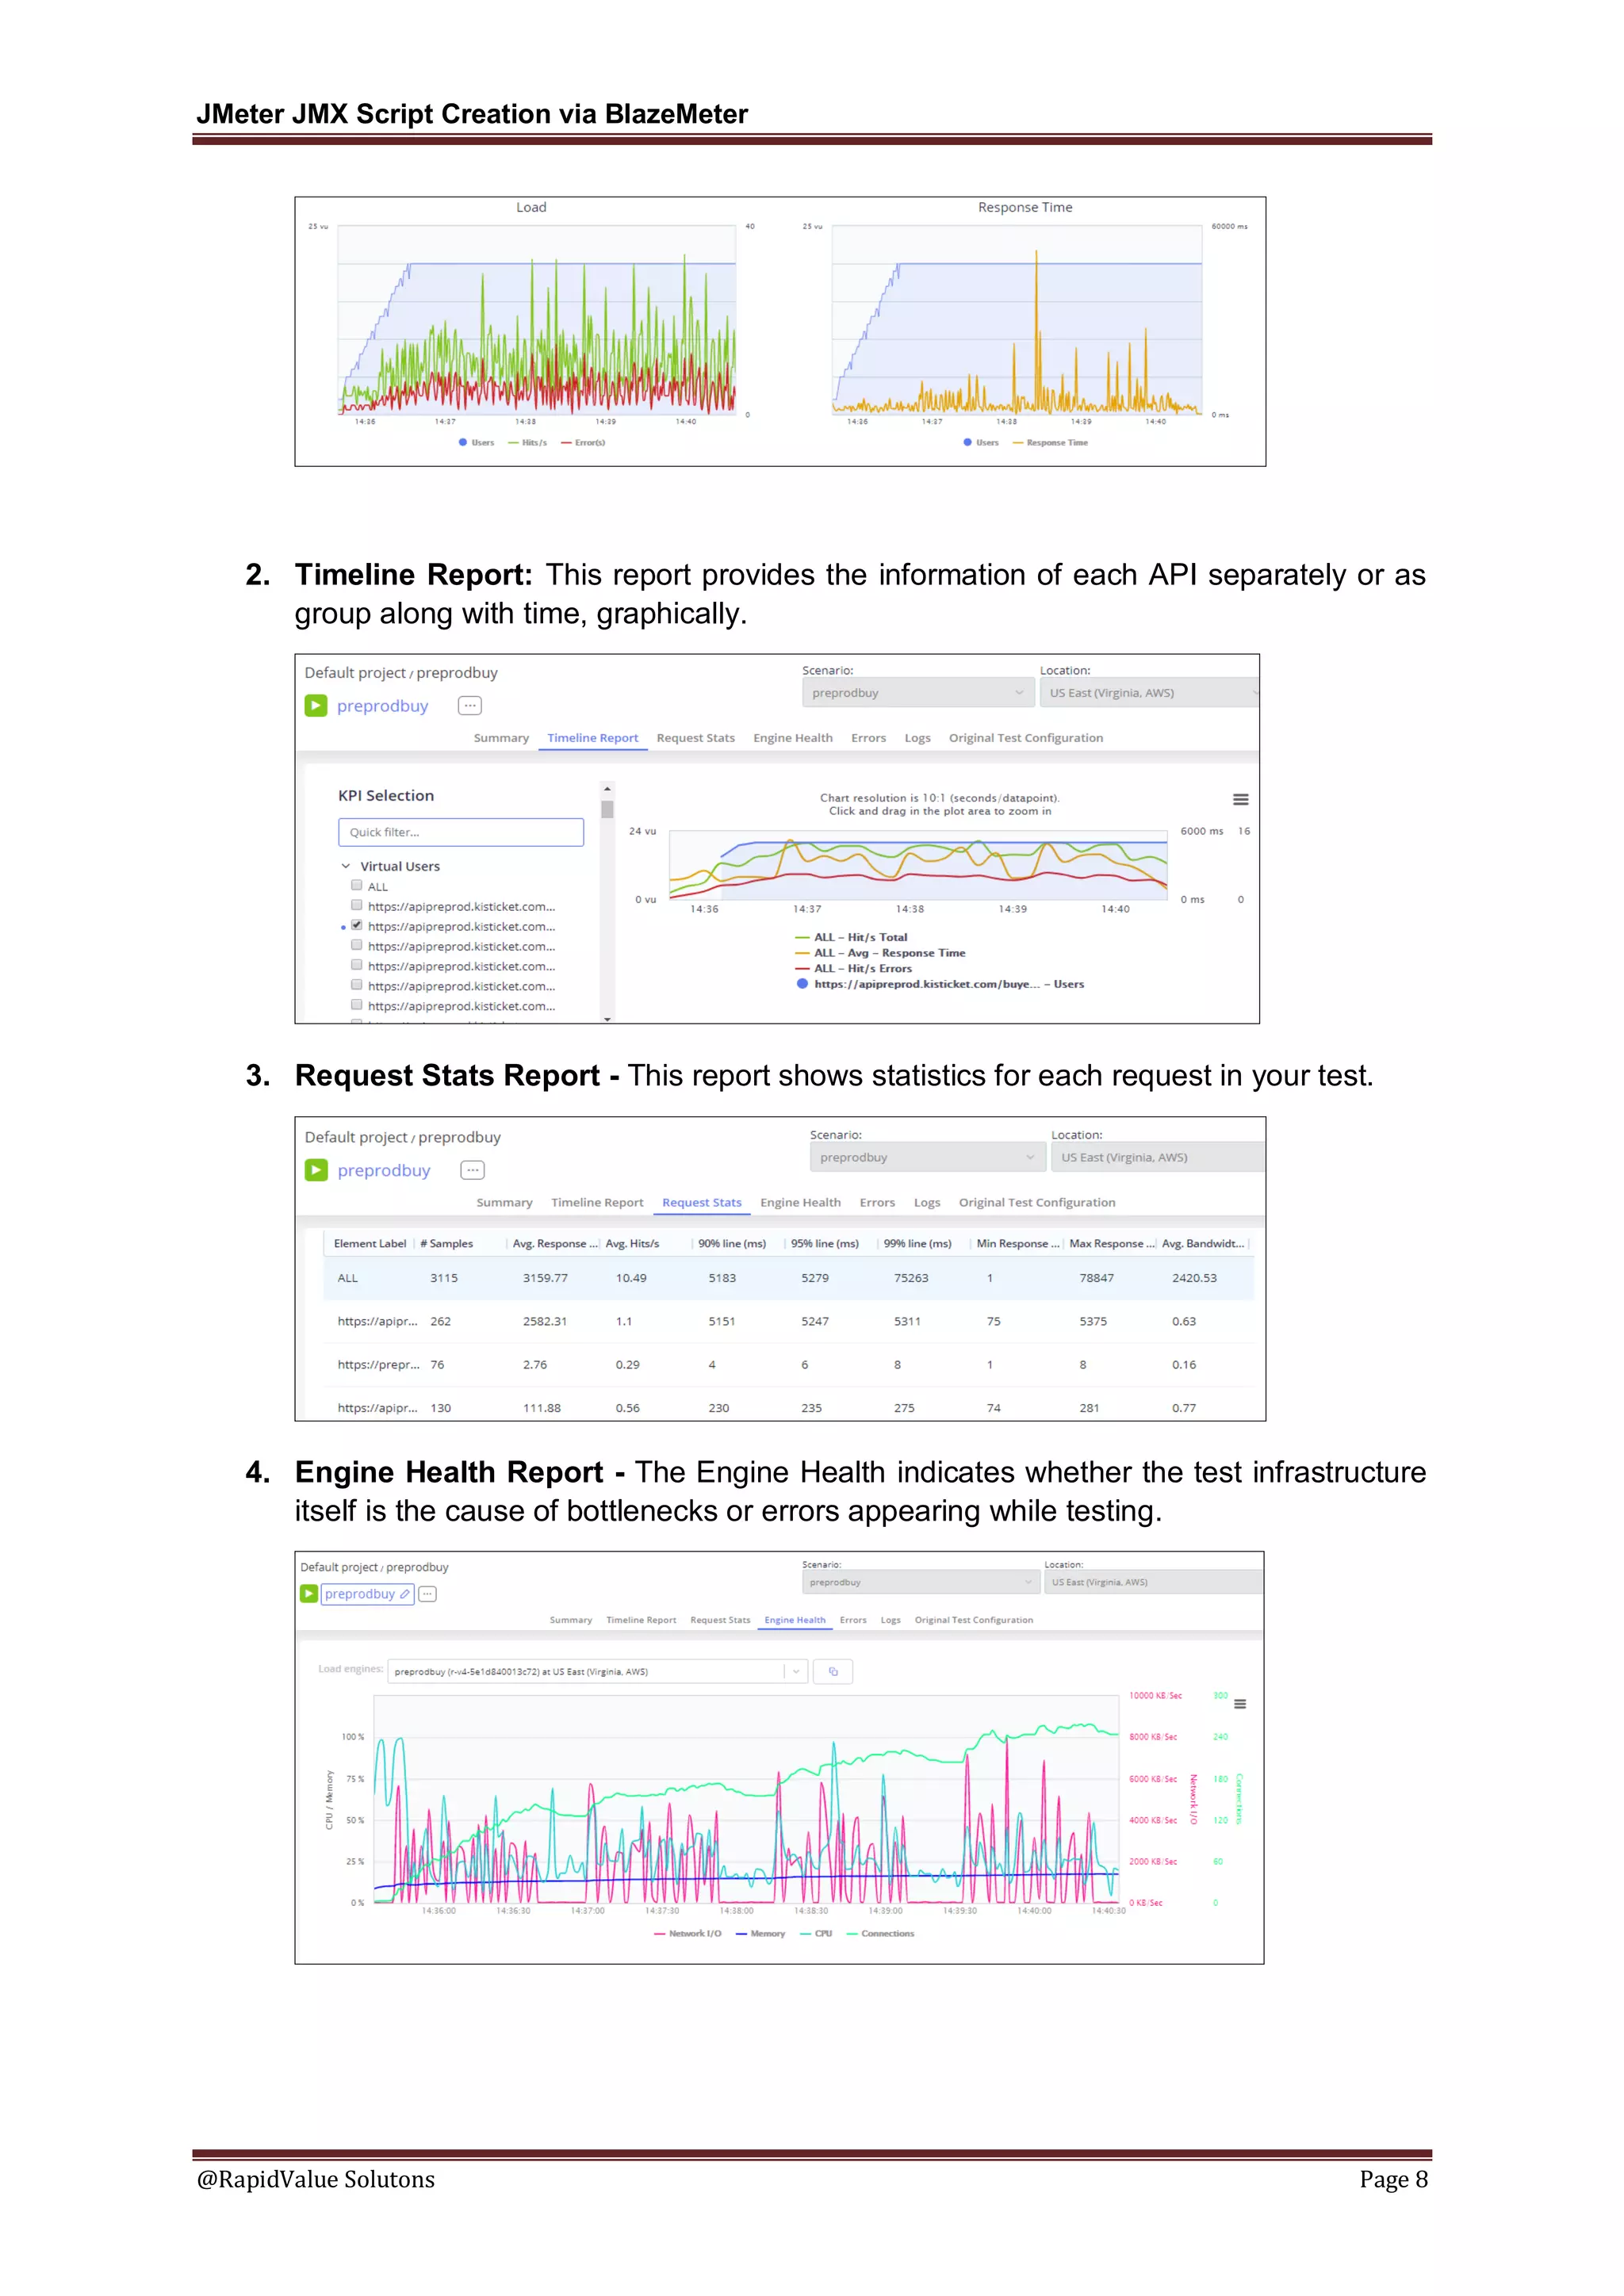


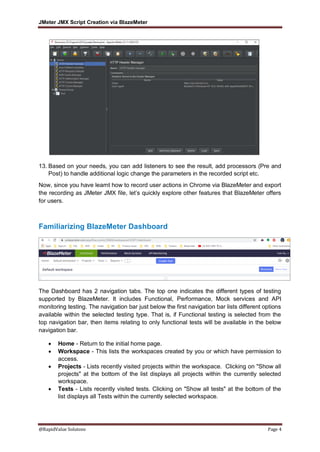
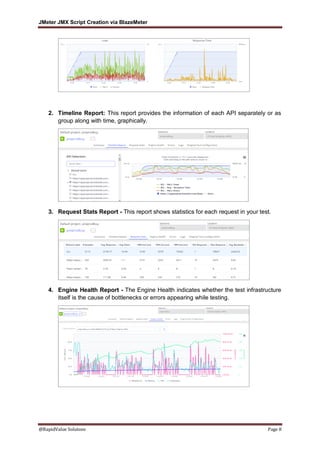
The document outlines the steps for recording user actions and exporting a JMeter JMX script using the BlazeMeter plugin in Chrome. It covers installation, recording, and saving the script in JMX format, along with an overview of BlazeMeter's dashboard and various testing types including functional, performance, and API monitoring. Additionally, it discusses reporting features available in BlazeMeter to analyze testing results.


