오픈소스 모니터링 알아보기 Learn about opensource monitoring Grafana, Prometheus, Graphite 넷앱 스토리지 성능 모니터링 NetApp storage performance monitoring with grafana and graphite ONTAP performance monitoring with grafana and graphite


![구성 1 – 노드(서버) 모니터링 with Grafana, Prometheus
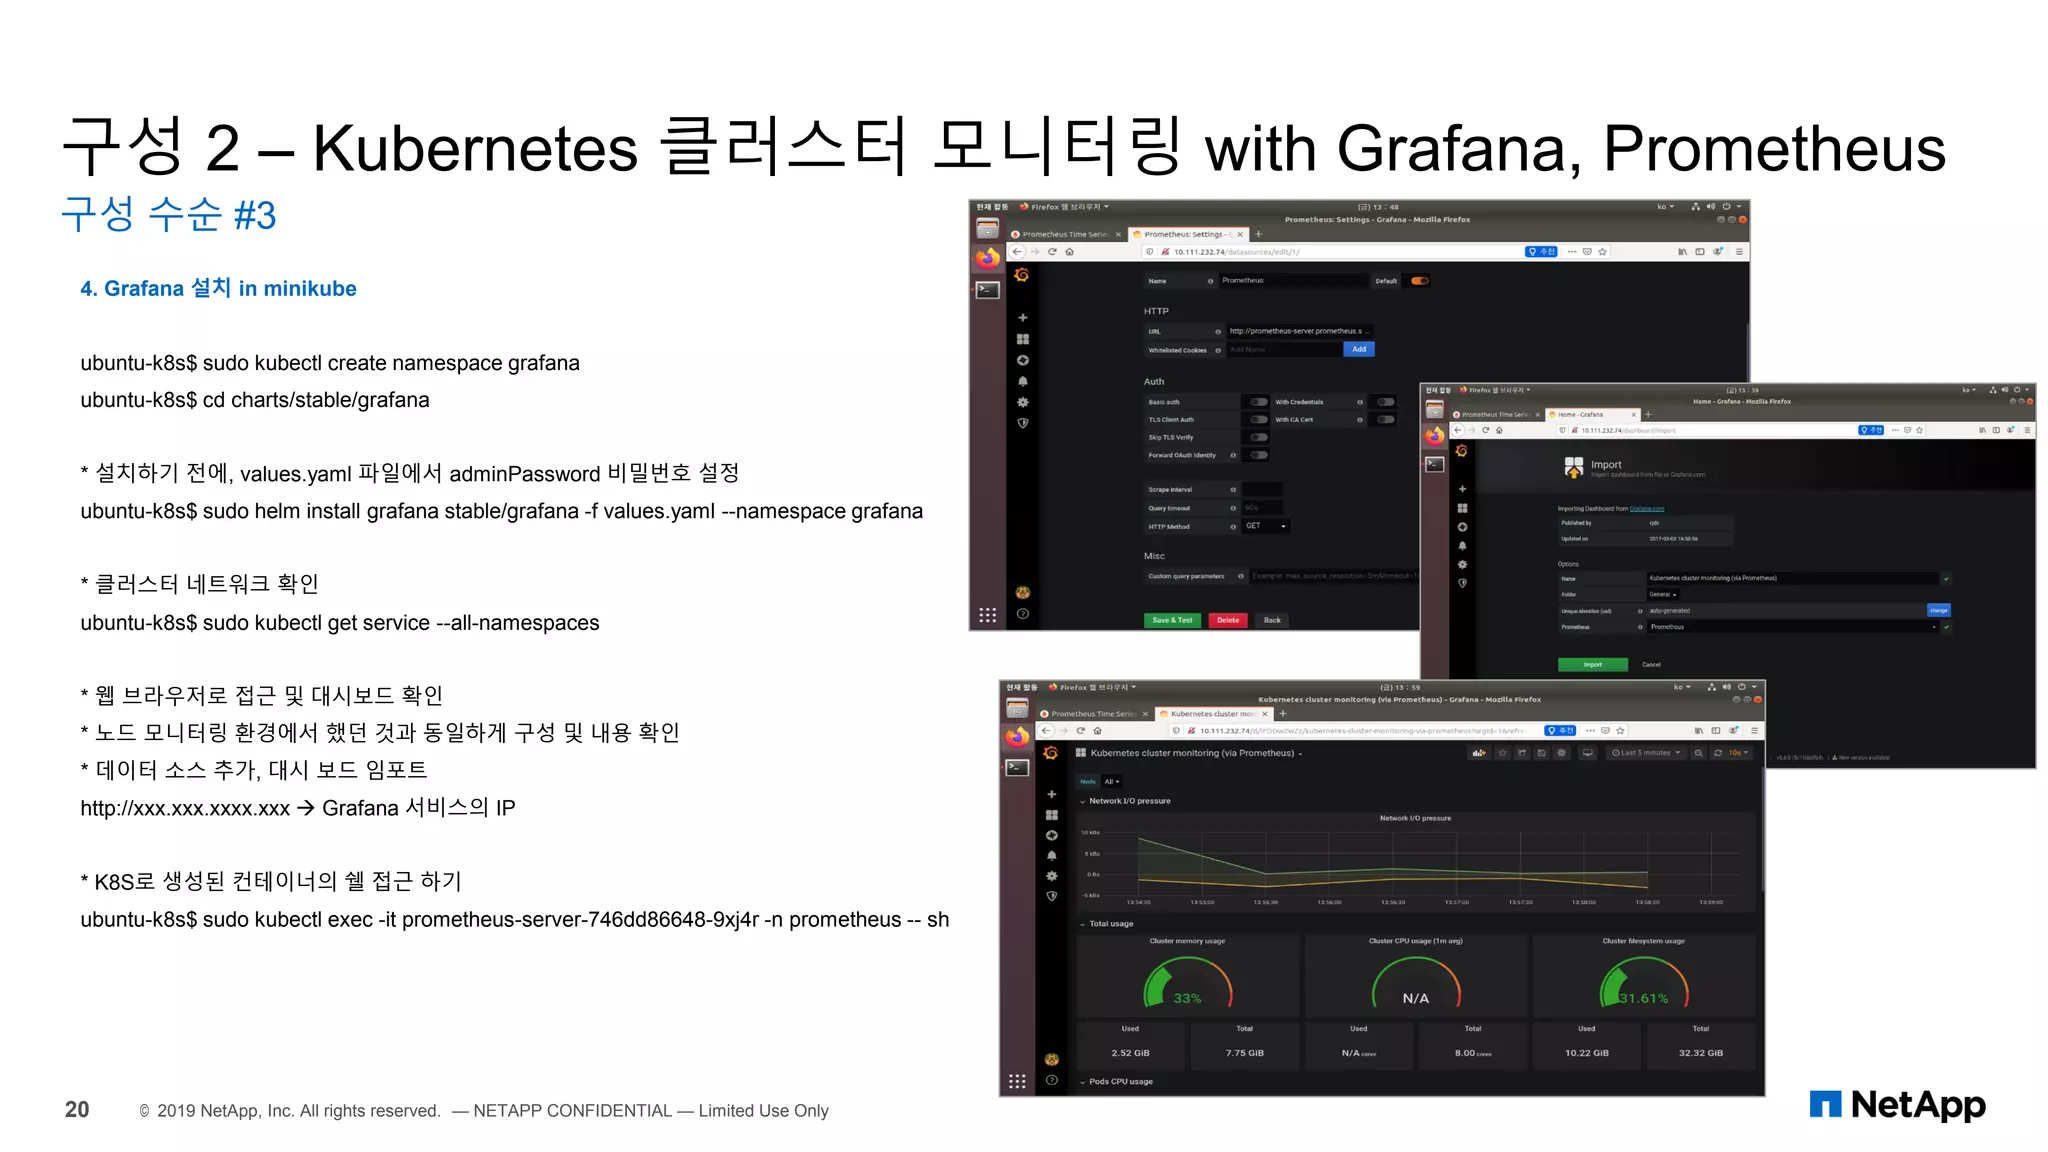
구성 수순 #3
14 © 2019 NetApp, Inc. All rights reserved. — NETAPP CONFIDENTIAL — Limited Use Only
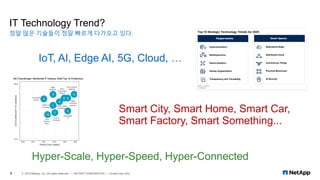
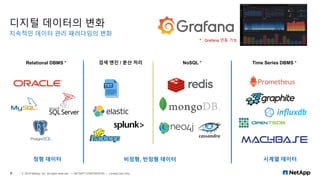
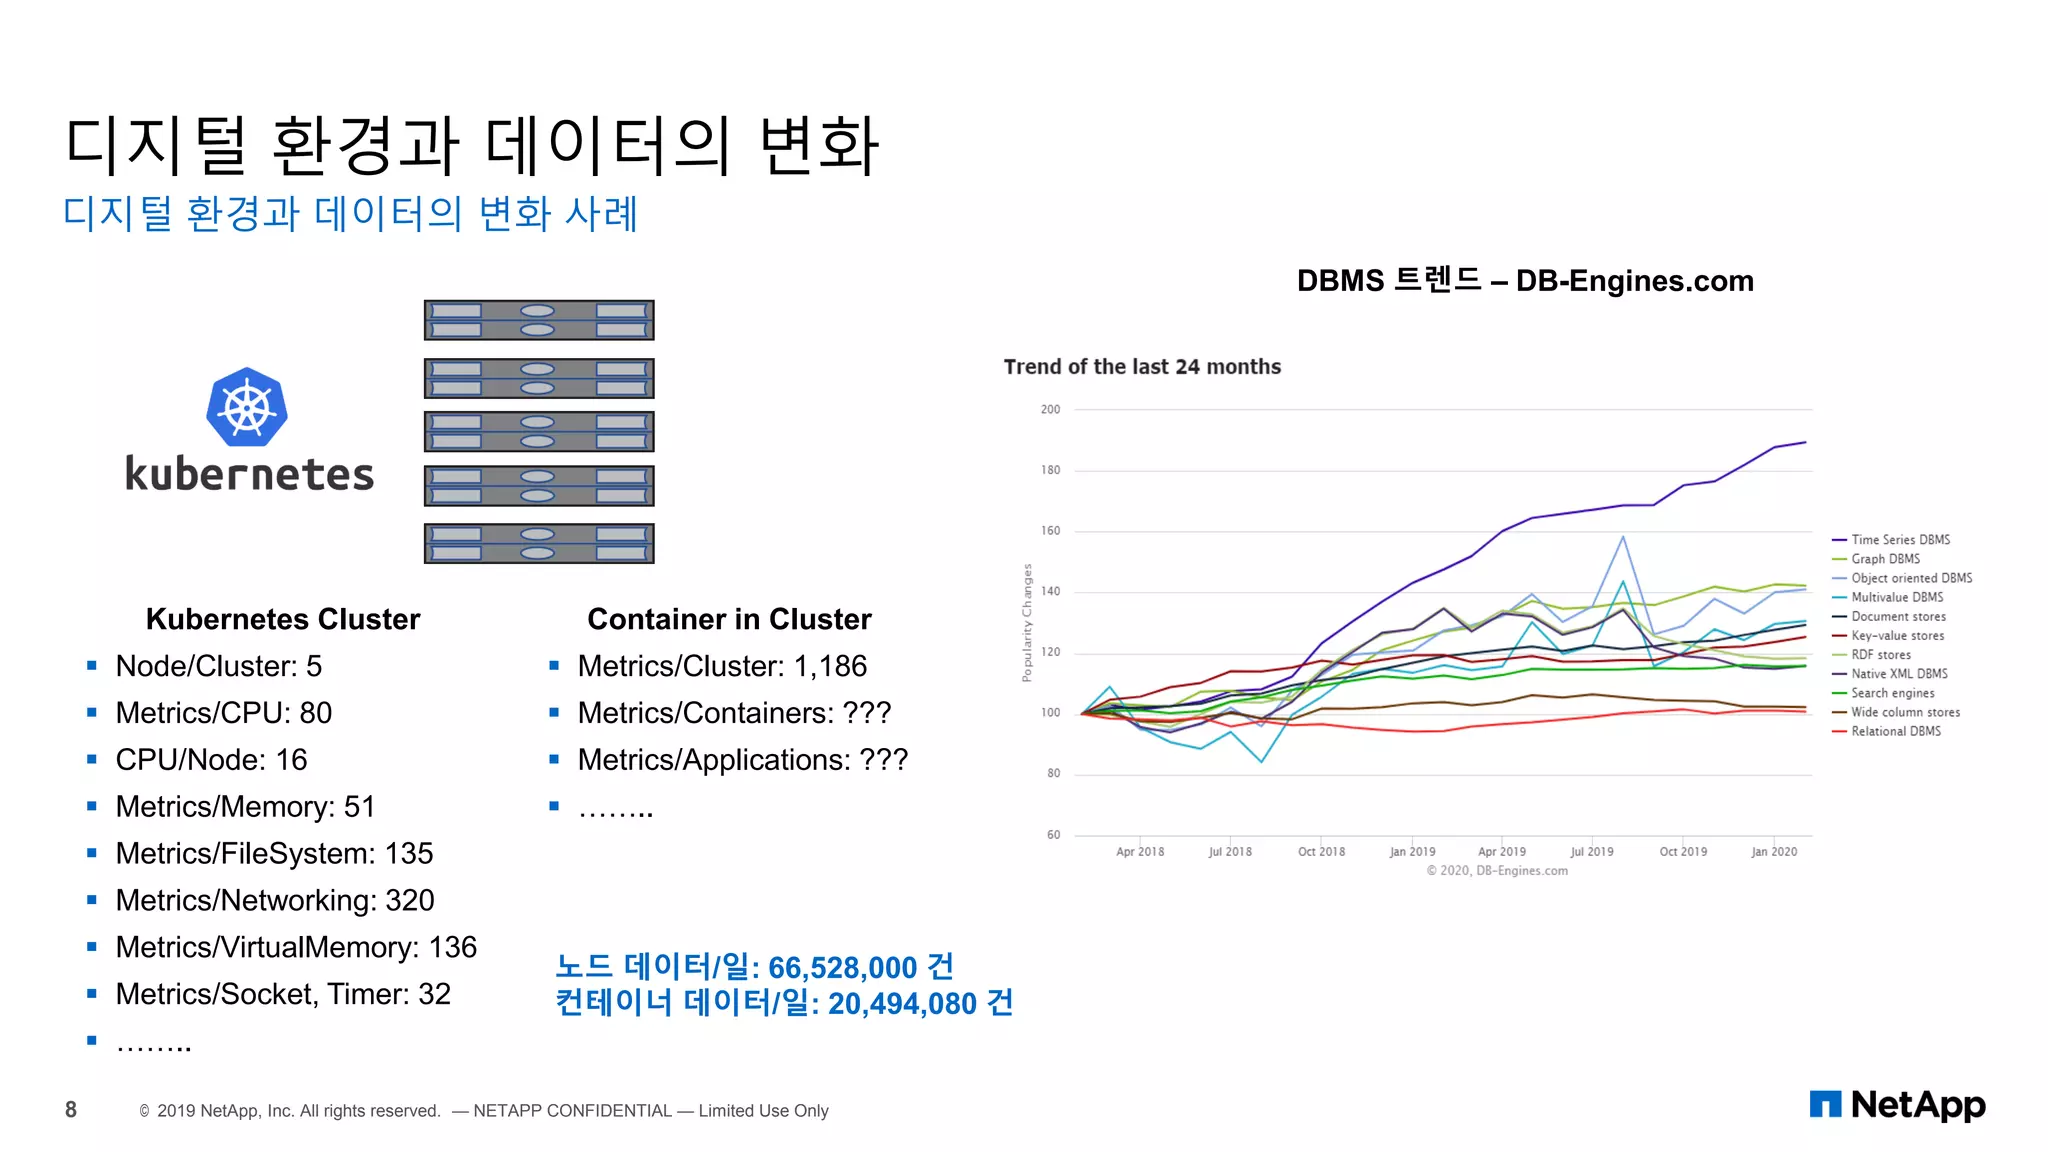
6. 기본 그래프 그려 보기
* 그래프 창에 아래의 쿼리를 입력하여 그래프가 잘 그려지는지 확인
rate(node_cpu{mode="system"}[1m])
7. Prometheus와 Grafana 연결
* Grafana에서 데이터 소스 추가
8. 대시보드 임포트 및 확인
* 초기 대시보드를 자체적으로 만드는 것은 조금 어려움
* Grafana 사이트 가입하고 메트릭에 맞는 대시보드 검색
* 적절한 대시보드 json 파일 다운로드 또는 ID를 입력
* node-exporter 버전에 따라 대시보드 호환성 확인 필요
https://grafana.com/grafana/dashboards
* Grafana에서 제공되는 기본 대시보드를 임포트해 사용
* 다운로드 받은 json을 업로드
http://192.168.232.130:3000/dashboard/import](https://image.slidesharecdn.com/netappgrafana-200508124923/85/Learn-about-opensource-monitoring-14-320.jpg)
![구성 1 – 노드(서버) 모니터링 with Grafana, Prometheus
구성 수순 #3
15 © 2019 NetApp, Inc. All rights reserved. — NETAPP CONFIDENTIAL — Limited Use Only
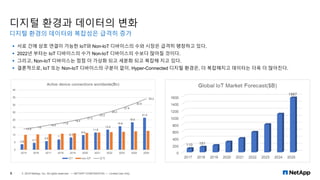
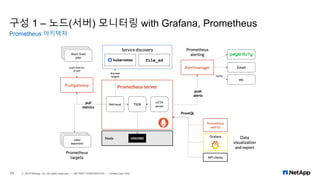
6. 기본 그래프 그려 보기
* 그래프 창에 아래의 쿼리를 입력하여 그래프가 잘 그려지는지 확인
rate(node_cpu{mode="system"}[1m])
7. Prometheus와 Grafana 연결
* Grafana에서 데이터 소스 추가
8. 대시보드 임포트 및 확인
* 초기 대시보드를 자체적으로 만드는 것은 조금 어려움
* Grafana 사이트 가입하고 메트릭에 맞는 대시보드 검색
* 적절한 대시보드 json 파일 다운로드 또는 ID를 입력
* node-exporter 버전에 따라 대시보드 호환성 확인 필요
https://grafana.com/grafana/dashboards
* Grafana에서 제공되는 기본 대시보드를 임포트해 사용
* 다운로드 받은 json을 업로드
http://192.168.232.130:3000/dashboard/import](https://image.slidesharecdn.com/netappgrafana-200508124923/85/Learn-about-opensource-monitoring-15-320.jpg)
![구성 1 – 노드(서버) 모니터링 with Grafana, Prometheus
구성 수순 #4
16 © 2019 NetApp, Inc. All rights reserved. — NETAPP CONFIDENTIAL — Limited Use Only
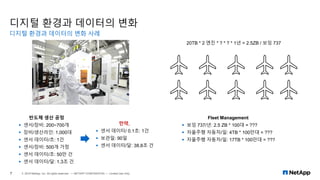
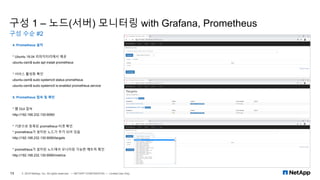
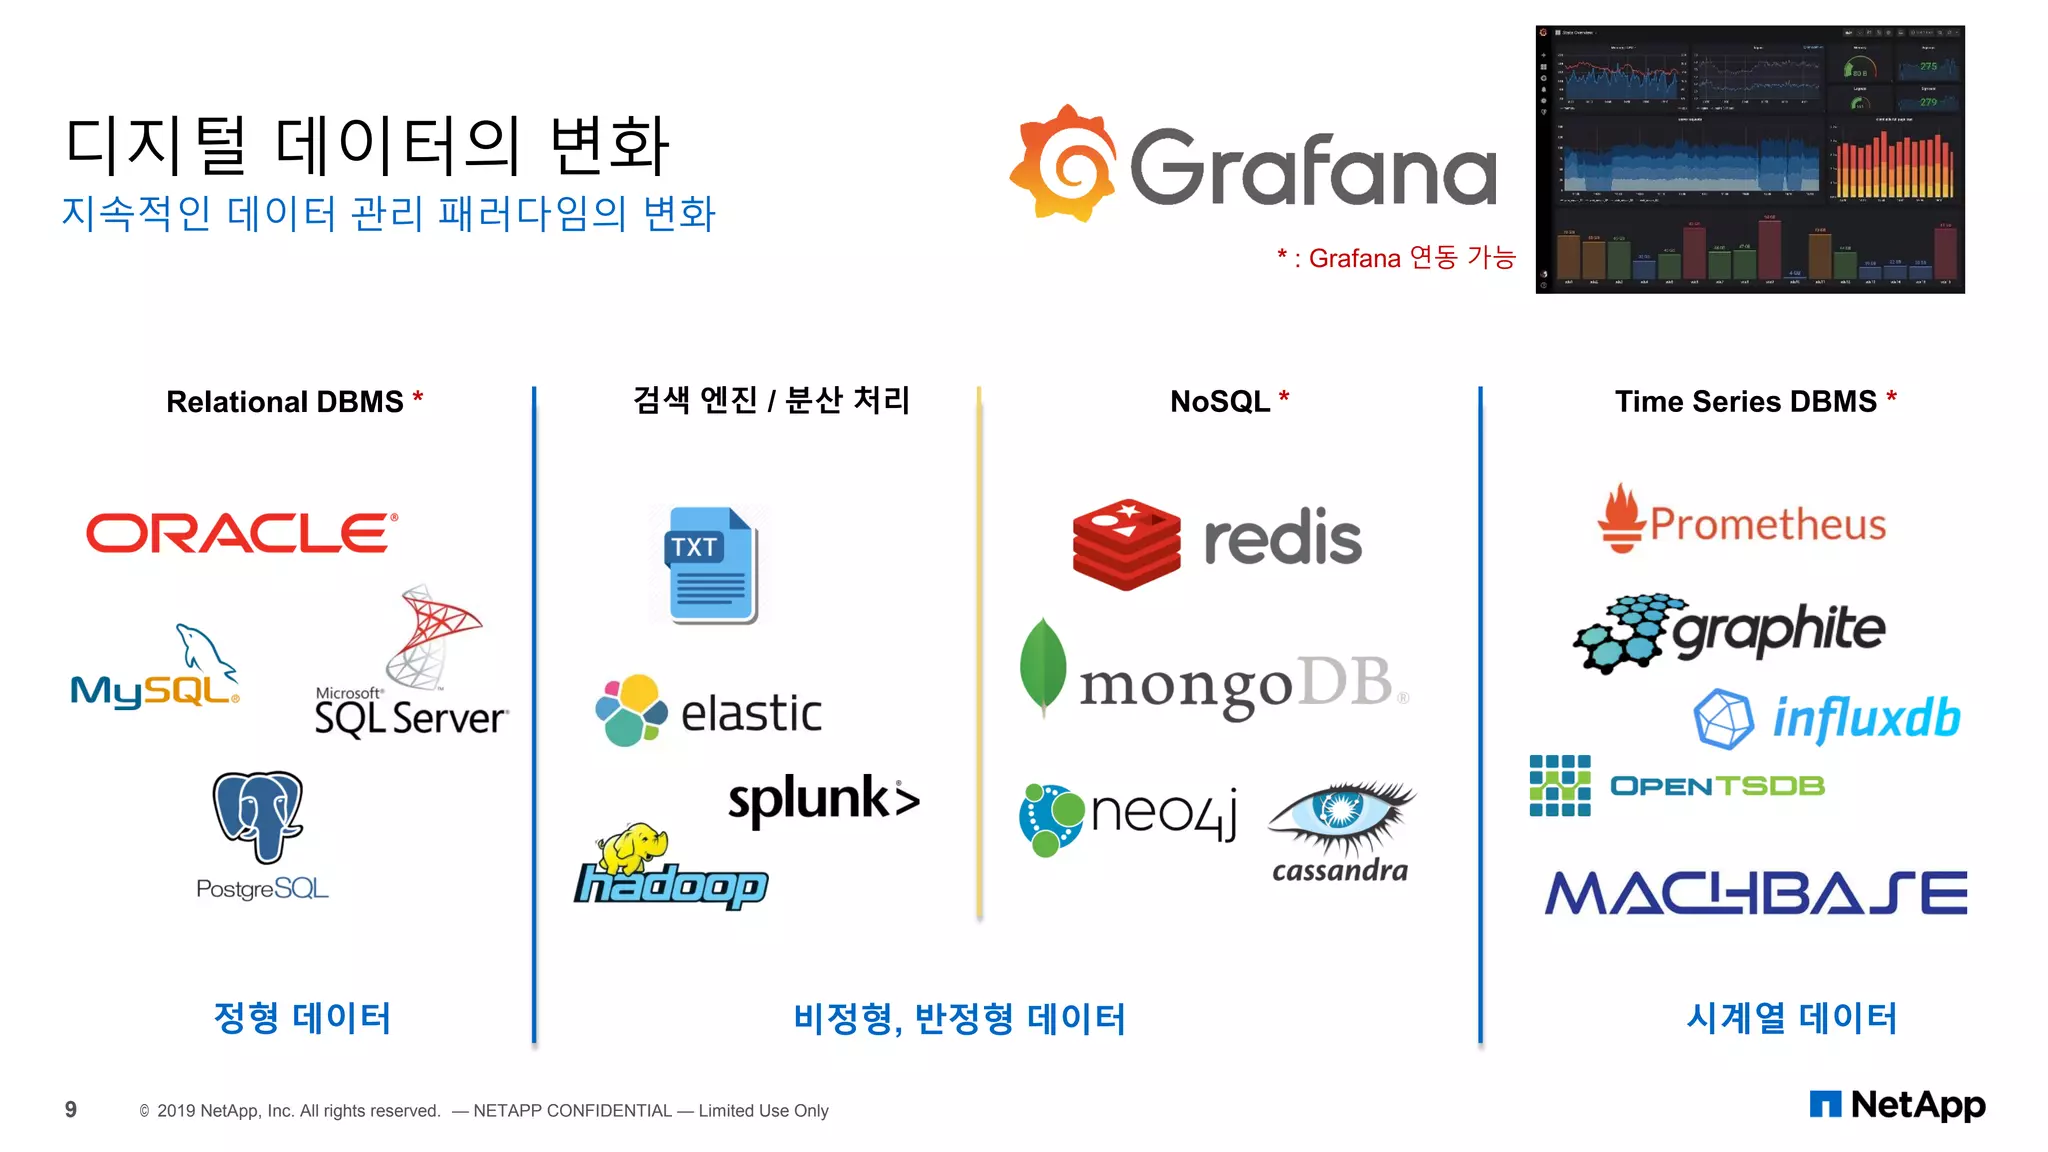
9. 추가 관리 대상 호스트 추가
* node-exporter 설치, node-exporter는 관리 대상인 호스트에서 데이터를 보내주는 모듈
* 관리 대상 호스트에는 모두 설치해야 하며, 이 데모는 minikube가 설치된 호스트를 타겟으로 함
ubuntu-k8s$ sudo apt install prometheus-node-exporter
ubuntu-osm$ sudo vi /etc/prometheus/prometheus.yml
* 아래 노드 메트릭 수정 - 노드 추가
* /etc/prometheus/prometheus.yml
----------------------------------------------------------------------------
- job_name: node
# If prometheus-node-exporter is installed, grab stats about the local
# machine by default.
static_configs:
- targets: ['localhost:9100', '192.168.232.131:9100']
----------------------------------------------------------------------------
* prometheus 서비스 재 로드
ubuntu-osm$ sudo systemctl reload prometheus.service
* grafana 대시보드에서 추가된 노드 모니터링 확인
http://192.168.232.130:3000/](https://image.slidesharecdn.com/netappgrafana-200508124923/85/Learn-about-opensource-monitoring-16-320.jpg)

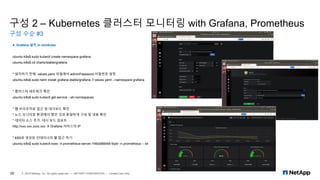
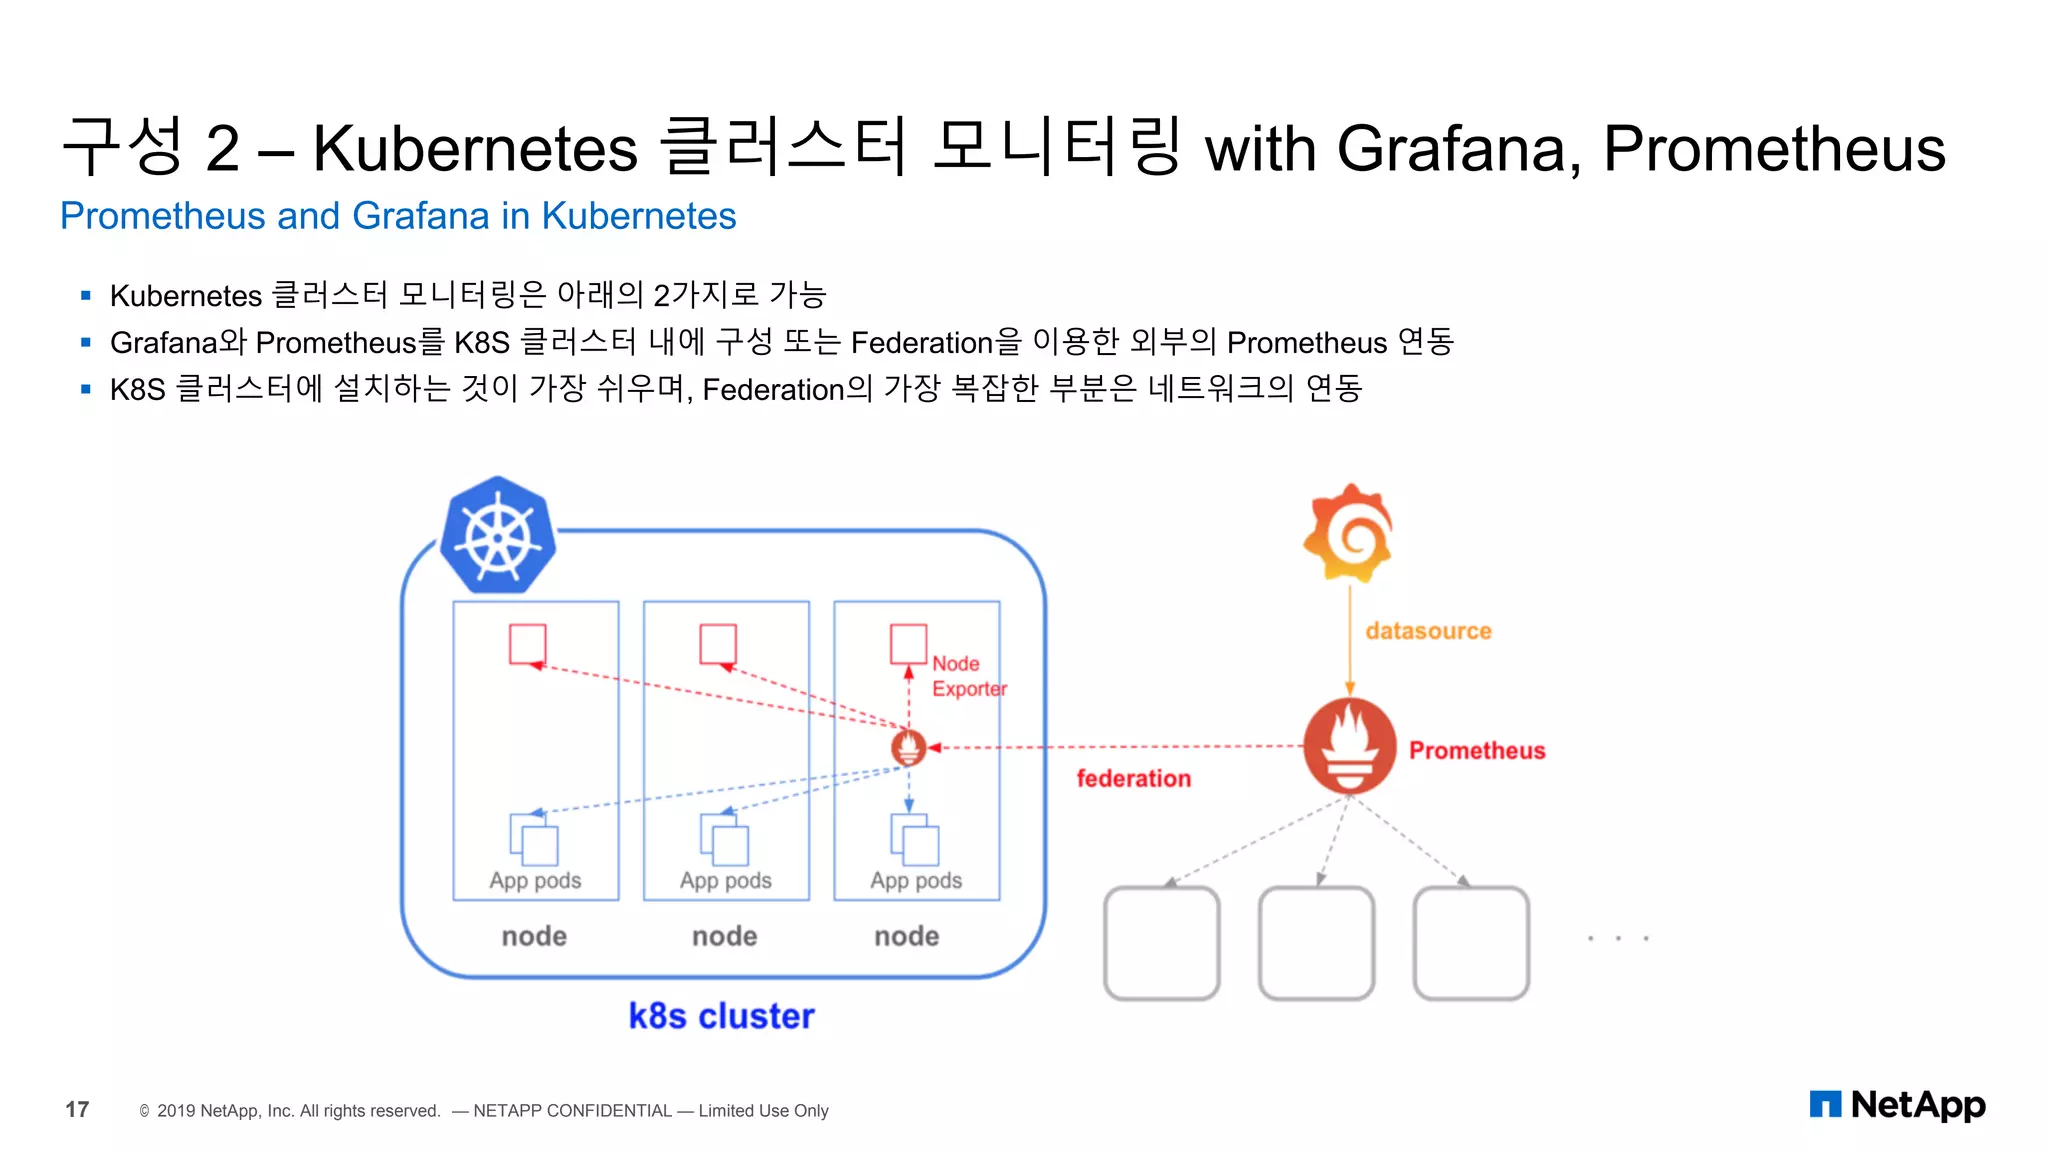
![구성 2 – Kubernetes 클러스터 모니터링 with Grafana, Prometheus
구성 수순 #2
19 © 2019 NetApp, Inc. All rights reserved. — NETAPP CONFIDENTIAL — Limited Use Only
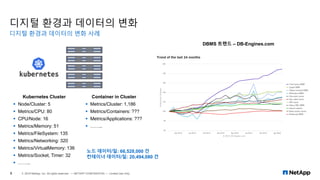
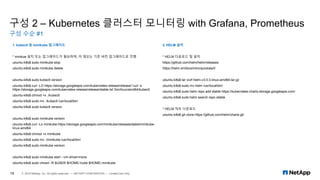
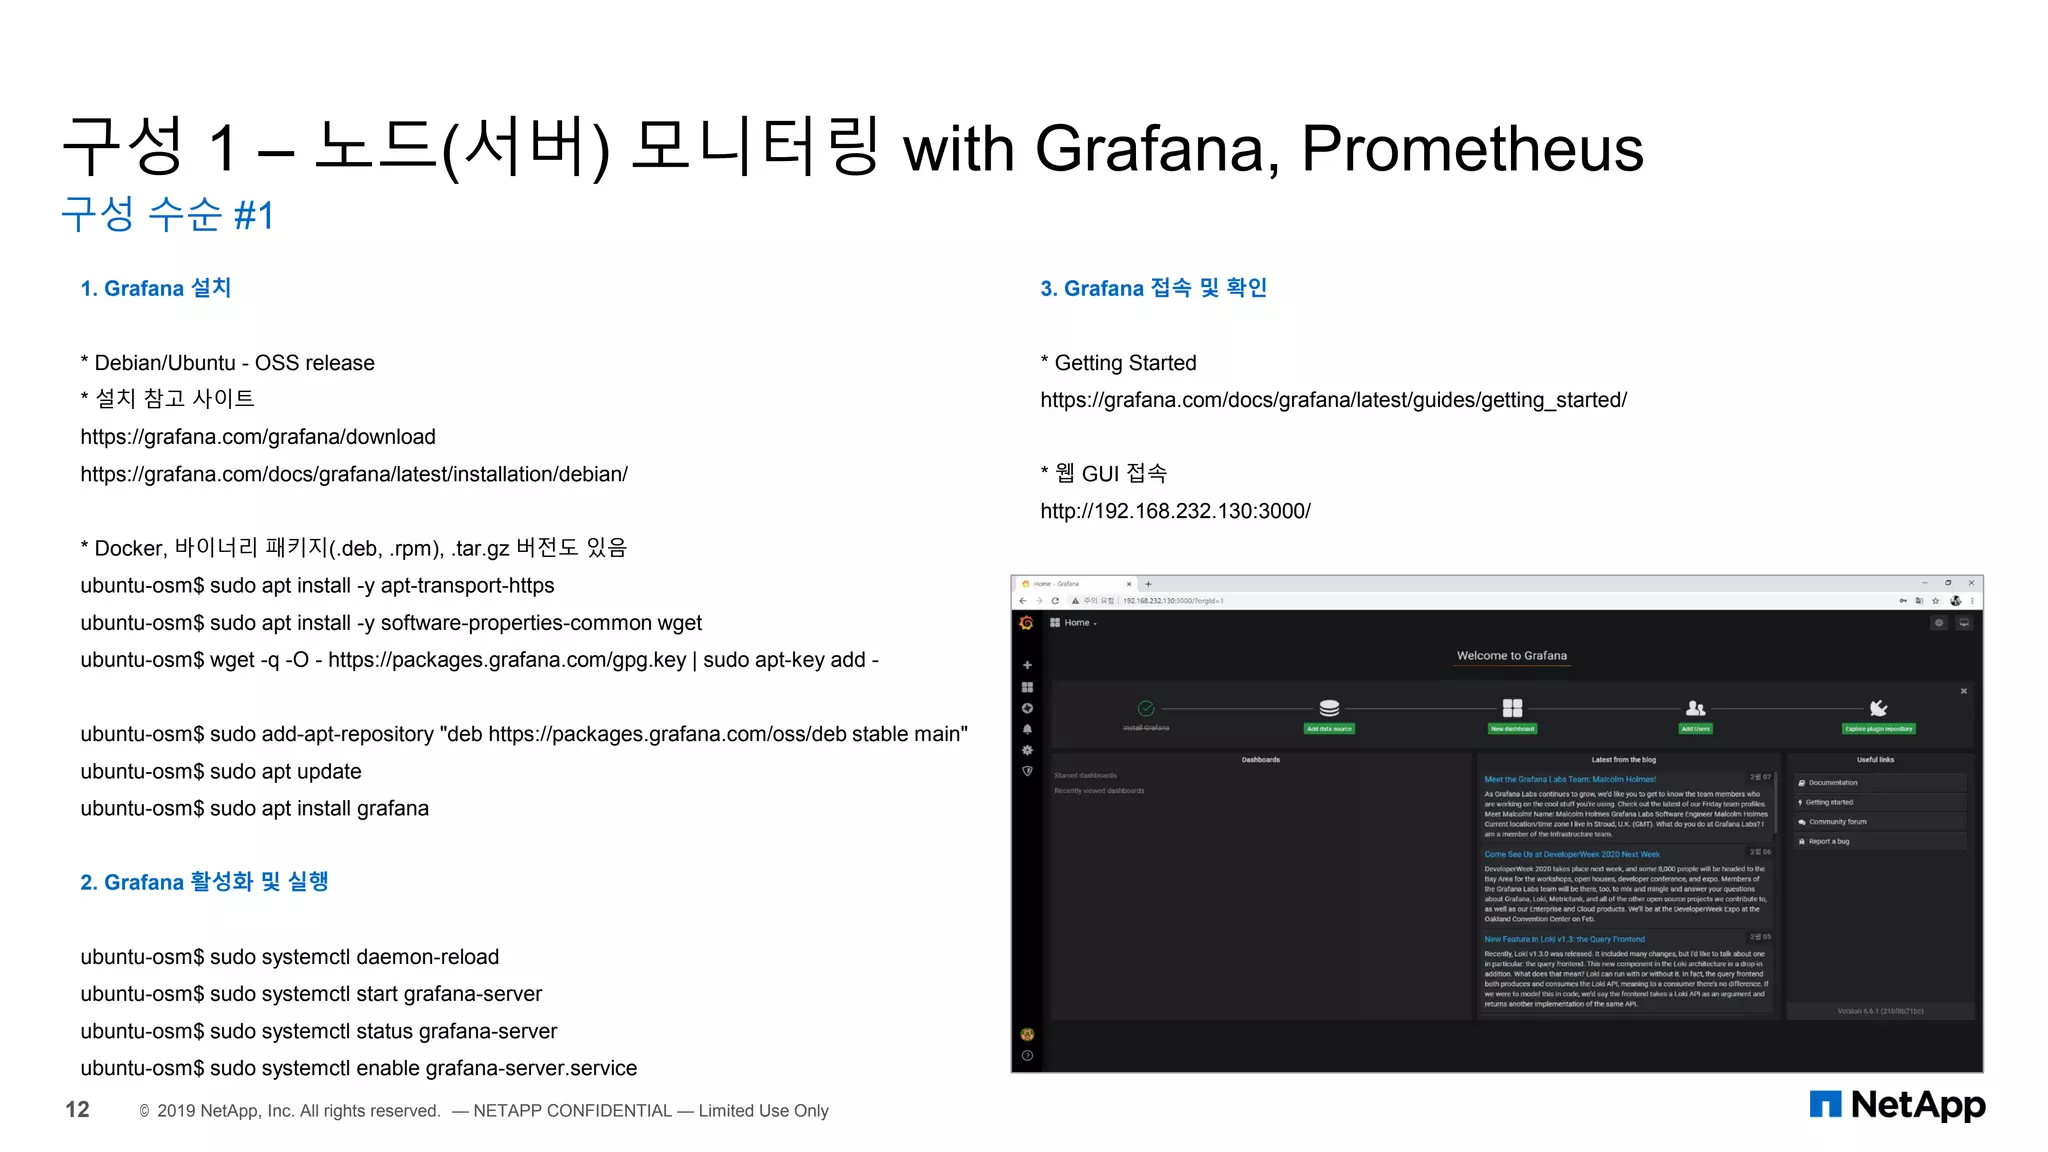
3. Prometheus 설치 in minikube
* 노드에 설치된 node-exporter 때문에, K8S내의 exporter에서 이슈가 발생함
* 노드에 설치된 exporter는 삭제 해 줌
ubuntu-k8s$ sudo apt purge prometheus-node-exporter
ubuntu-k8s$ sudo kubectl create namespace prometheus
ubuntu-k8s$ cd charts/stable/prometheus
ubuntu-k8s$ sudo helm install prometheus stable/prometheus -f values.yaml --namespace
prometheus
* 파드에 구성이 되었기 때문에, K8S 클러스터 네트워크로 접속이 가능
* prometheus-server 서비스의 IP를 확인하고 웹 브라우저로 접속
ubuntu-k8s$ sudo kubectl get service --all-namespaces
* 클러스터 네트워크를 사용하지 않을 경우 포트 포워딩하여 로컬 호스트에서 접근
ubuntu-k8s$ export POD_NAME=$(kubectl get pods --namespace prometheus -l
"app=prometheus,component=server" -o jsonpath="{.items[0].metadata.name}")
ubuntu-k8s$ sudo kubectl --namespace prometheus port-forward $POD_NAME 9090
* 하기의 에러 메시지 발생 시에는 패키지 추가 설치
E0214 11:43:21.906268 51591 portforward.go:400] an error occurred forwarding 9090 -> 9090:
error forwarding port 9090 to pod
a1d83b392a0806385a92619f9354446122e6adc86ba0e3afc578eb01bfb5d73b, uid : unable to do
port forwarding: socat not found
ubuntu-k8s$ sudo apt install socat
* 웹 브라우저로 확인
http://xxx.xxx.xxxx.xxx → prometheus-server 서비스의 IP](https://image.slidesharecdn.com/netappgrafana-200508124923/85/Learn-about-opensource-monitoring-19-320.jpg)
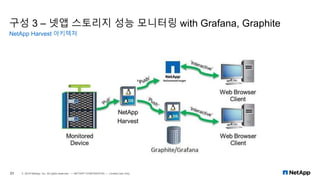
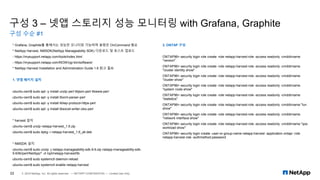
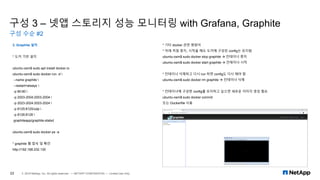
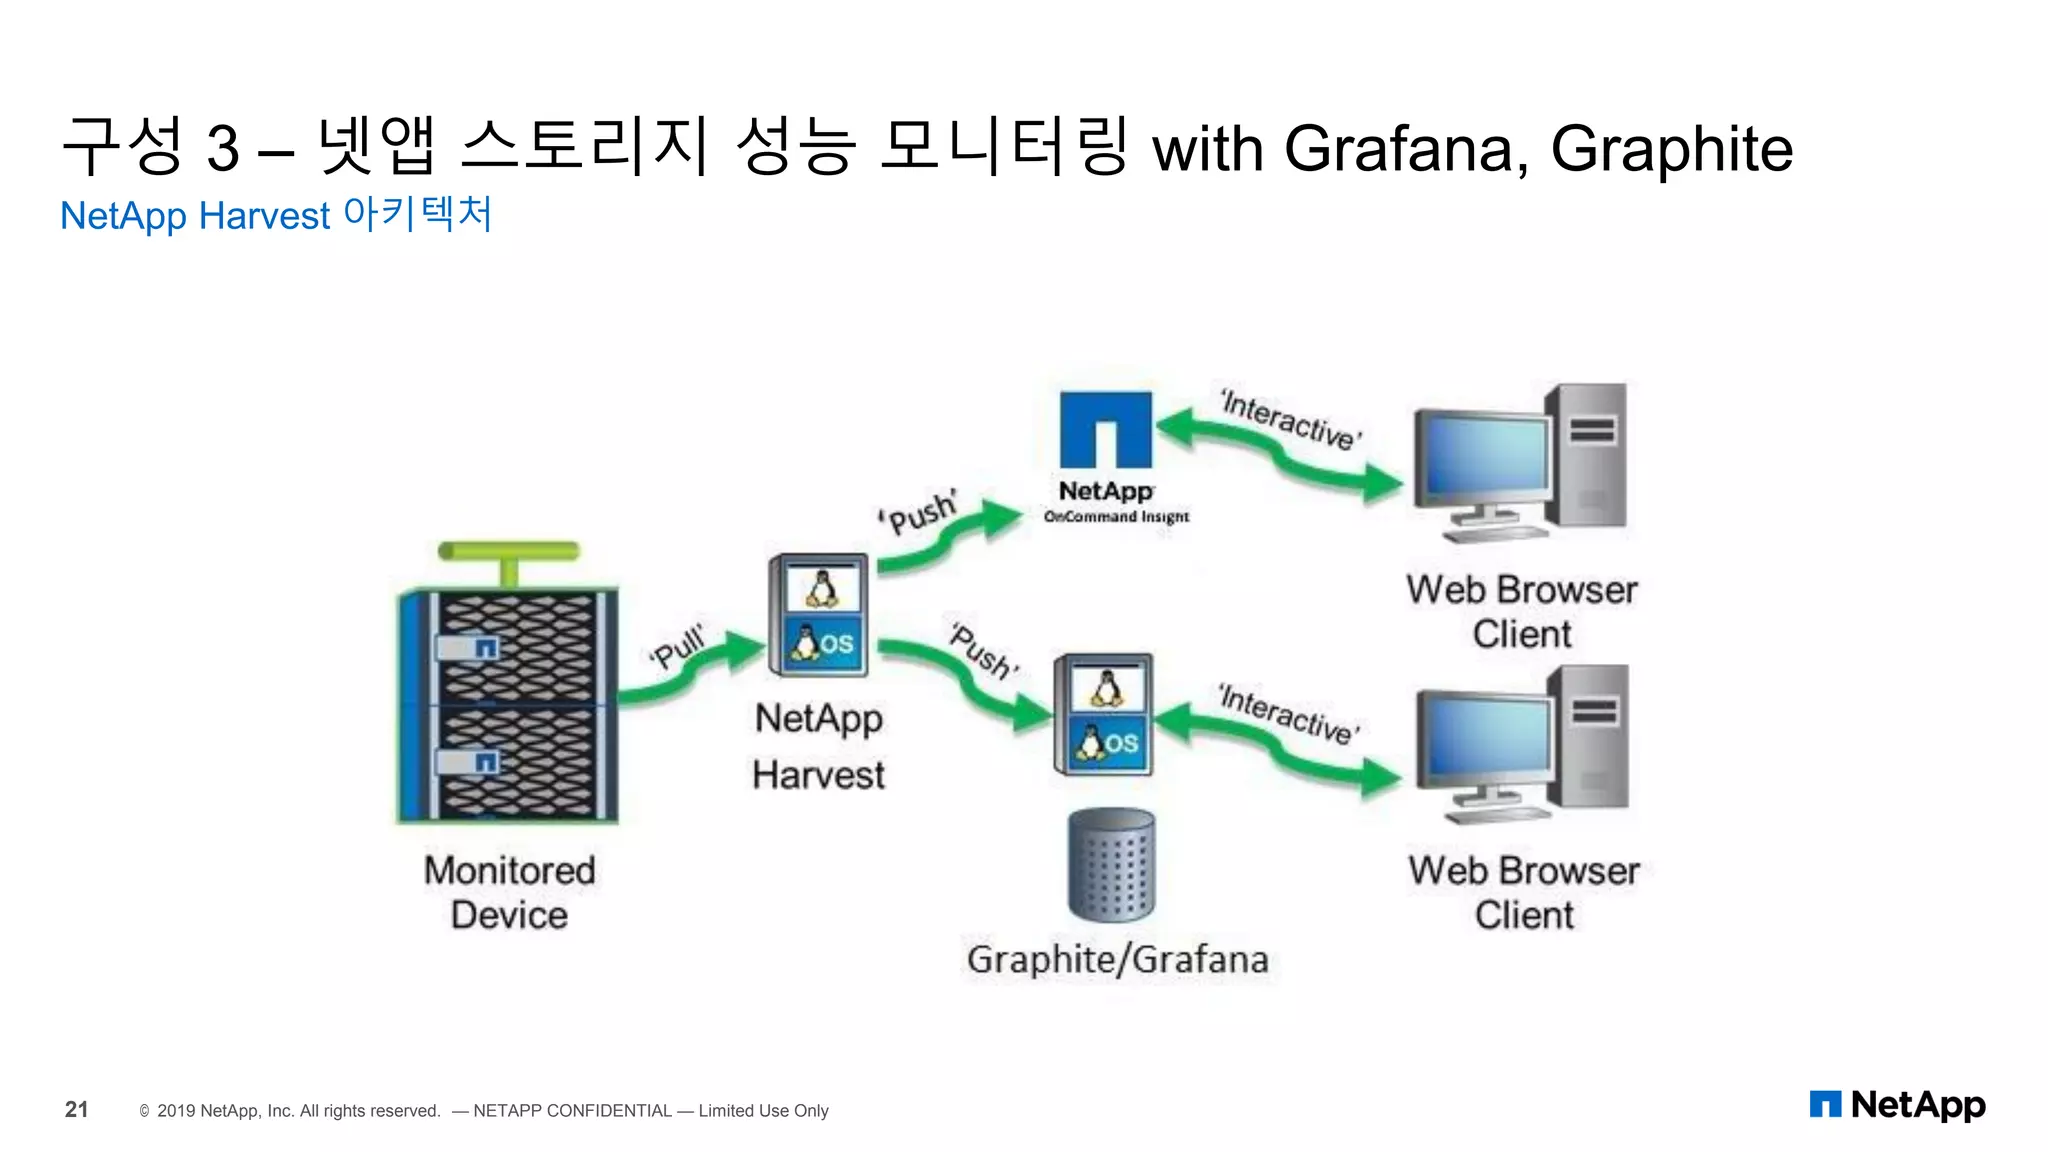
![구성 3 – 넷앱 스토리지 성능 모니터링 with Grafana, Graphite
구성 수순 #3
24 © 2019 NetApp, Inc. All rights reserved. — NETAPP CONFIDENTIAL — Limited Use Only
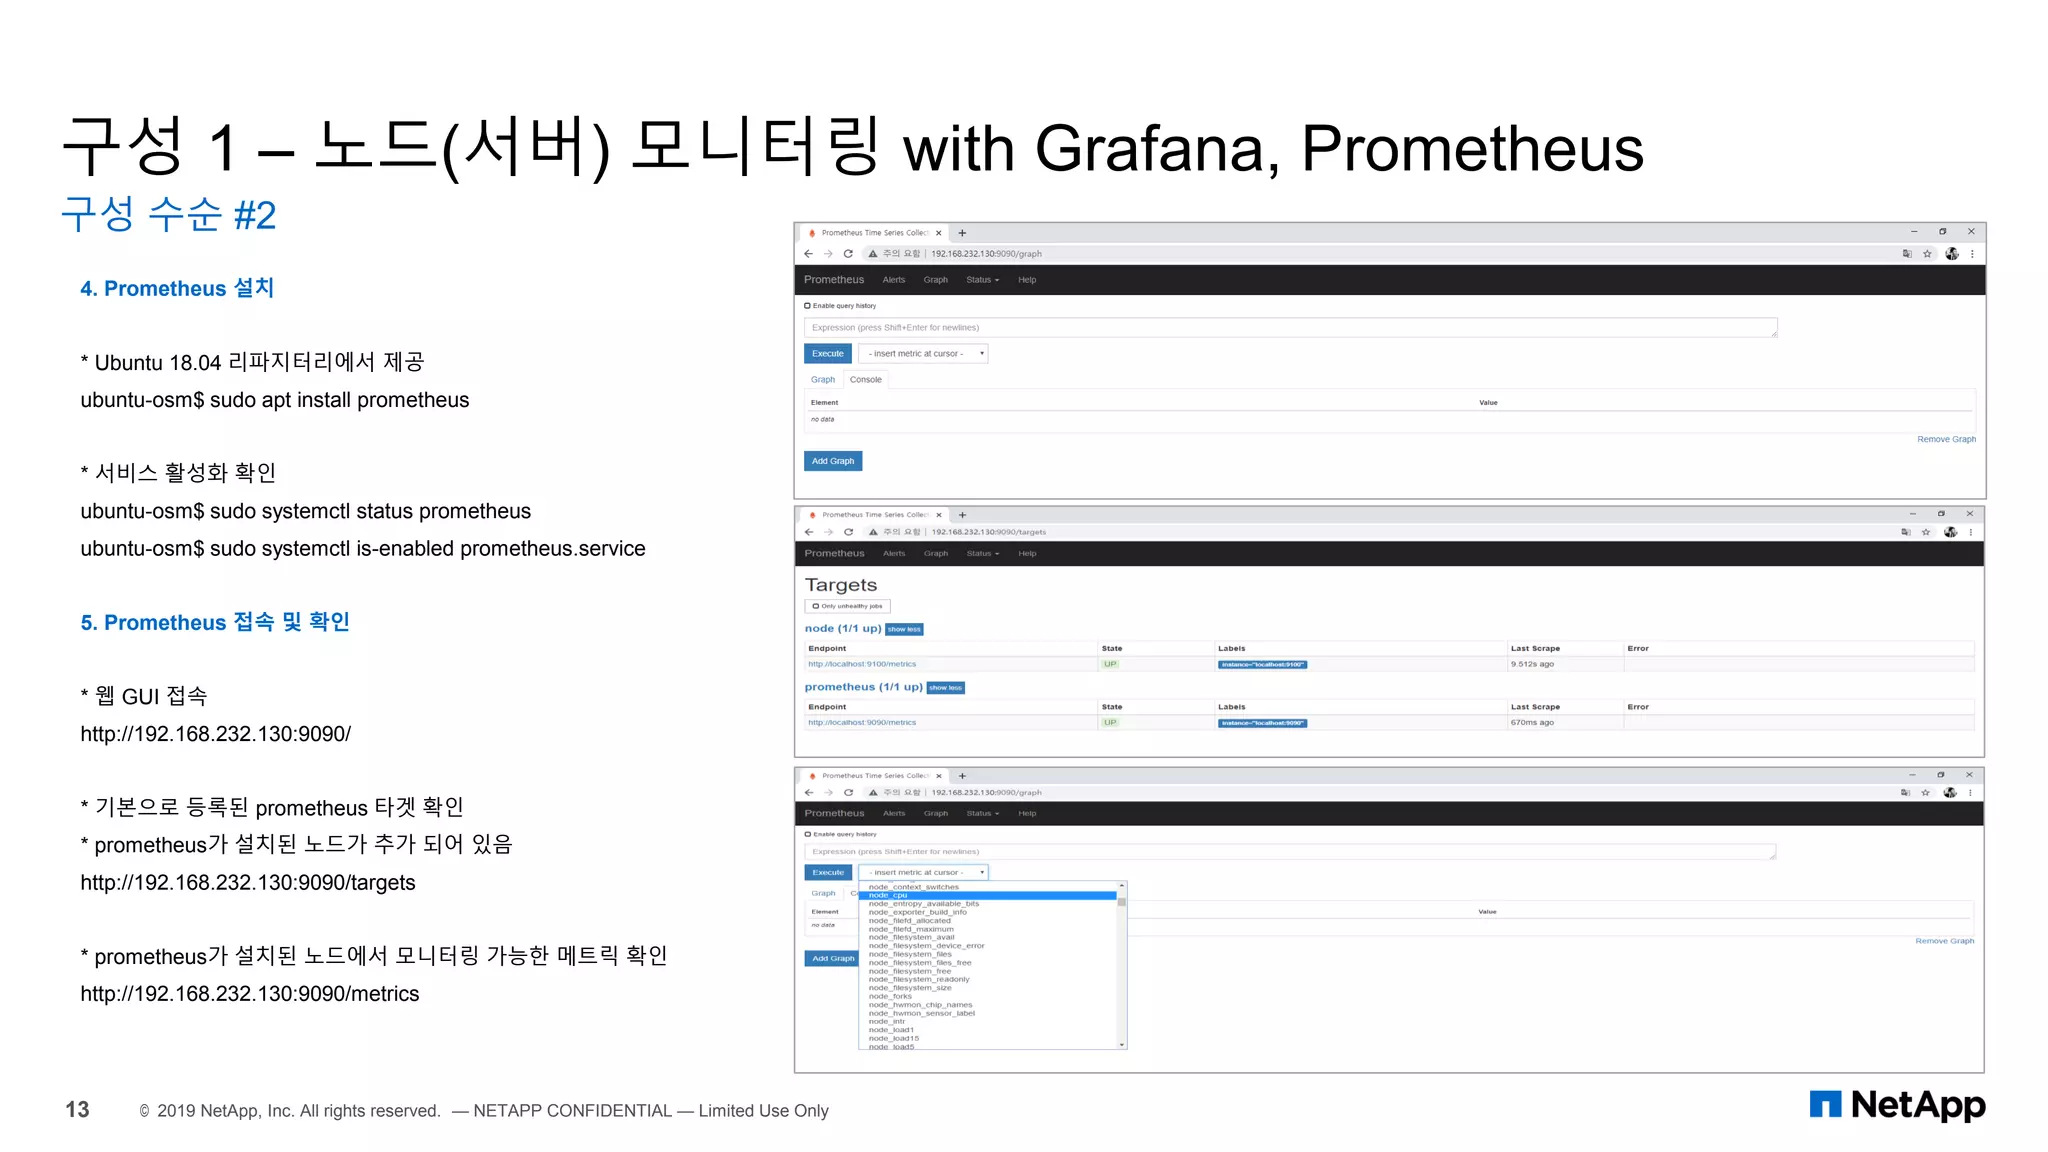
4. Harvest 환경 설정
* harvest.conf 수정
ubuntu-osm$ sudo cd /opt/netapp-harvest
ubuntu-osm$ sudo cp netapp-harvest.conf.example netapp-harvest.conf
ubuntu-osm$ sudo chown netapp-harvest:netapp-harvest netapp-harvest.conf
ubuntu-osm$ sudo vi netapp-harvest.conf
* 아래의 사항 수정
* [default] 수정 및 [ONTAP96] 모니터링 대상 수정 - [global] API 키는 추후에 등록 예정
* /opt/netapp-harvest/netapp-harvest.conf
----------------------------------------------------------------------------
##
[global]
grafana_api_key =
eyJrIjoibzVJa1k4dnBZTG03d0JMa1pJZmpWaEtsTFlDRDAzT3IiLCJuIjoibmV0YXBwLWhhcnZlc3
QiLCJpZCI6MX0=
grafana_url = http://localhost:3000
##
#### Default section to set defaults for any user created poller section
##
[default]
graphite_server = 192.168.232.130
username = netapp-harvest
password = mypassword
##
#### Poller sections; Add one section for each cDOT cluster, 7-mode node, or OCUM server
#### If any keys are different from those in default duplicate them in the poller section to override.
##
#
[INSERT_CLUSTER_OR_CONTROLLER_NAME_HERE_EXACTLY_AS_SHOWN_FROM_CLI_P
ROMPT]
[ONTAP96]
hostname = 192.168.232.129
group = ONTAP9
----------------------------------------------------------------------------](https://image.slidesharecdn.com/netappgrafana-200508124923/85/Learn-about-opensource-monitoring-24-320.jpg)
![구성 3 – 넷앱 스토리지 성능 모니터링 with Grafana, Graphite
구성 수순 #4
25 © 2019 NetApp, Inc. All rights reserved. — NETAPP CONFIDENTIAL — Limited Use Only
5. Graphite 환경 설정
* 컨테이너로 만들었기 때문에, 컨테이너 쉘 접근 필요
ubuntu-osm$ sudo docker exec -it graphite sh
* storage-schemas.conf 수정
docker/ # vi /opt/graphite/conf/storage-schemas.conf
* netapp_perf 항목 추가, /opt/graphite/conf/storage-schemas.conf
----------------------------------------------------------------------------
[carbon]
pattern = ^carbon.
retentions = 10s:6h,1m:90d
[netapp_perf]
pattern = ^netapp(.poller)?.perf7?.
retentions = 1m:35d,5m:100d,15m:395d,1h:5y
[default_1min_for_1day]
pattern = .*
retentions = 10s:6h,1m:6d,10m:1800d
----------------------------------------------------------------------------
* carbon.conf 수정
docker/ # vi /opt/graphite/conf/carbon.conf
* 아래 옵션으로 수정 - 50 → 600
* /opt/graphite/conf/carbon.conf
----------------------------------------------------------------------------
MAX_CREATES_PER_MINUTE = 600
----------------------------------------------------------------------------
* 서비스 재시작을 위해서 컨테이너 재기동
ubuntu-osm$ sudo docker stop graphite
ubuntu-osm$ sudo docker start graphite](https://image.slidesharecdn.com/netappgrafana-200508124923/85/Learn-about-opensource-monitoring-25-320.jpg)
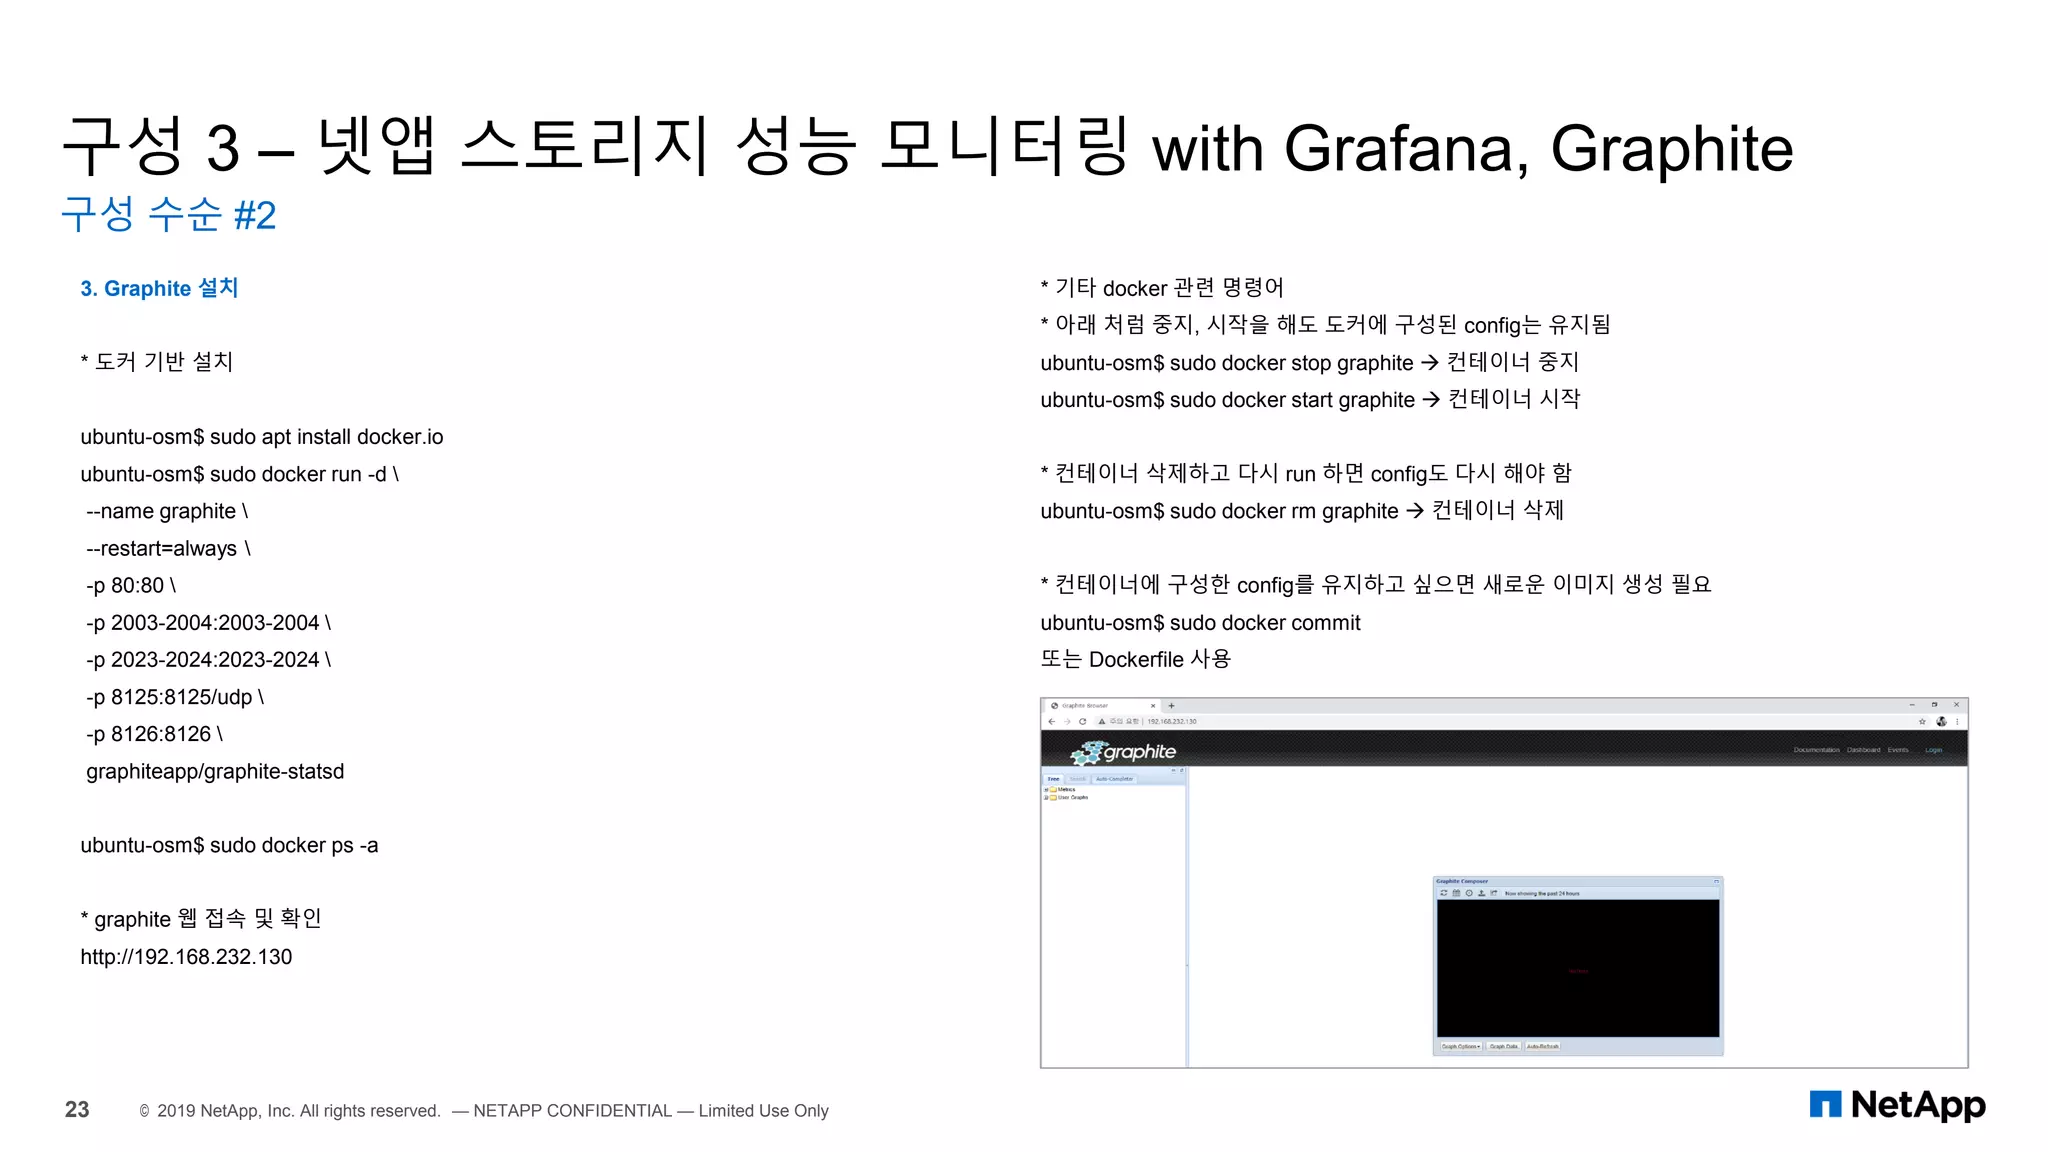
![구성 3 – 넷앱 스토리지 성능 모니터링 with Grafana, Graphite
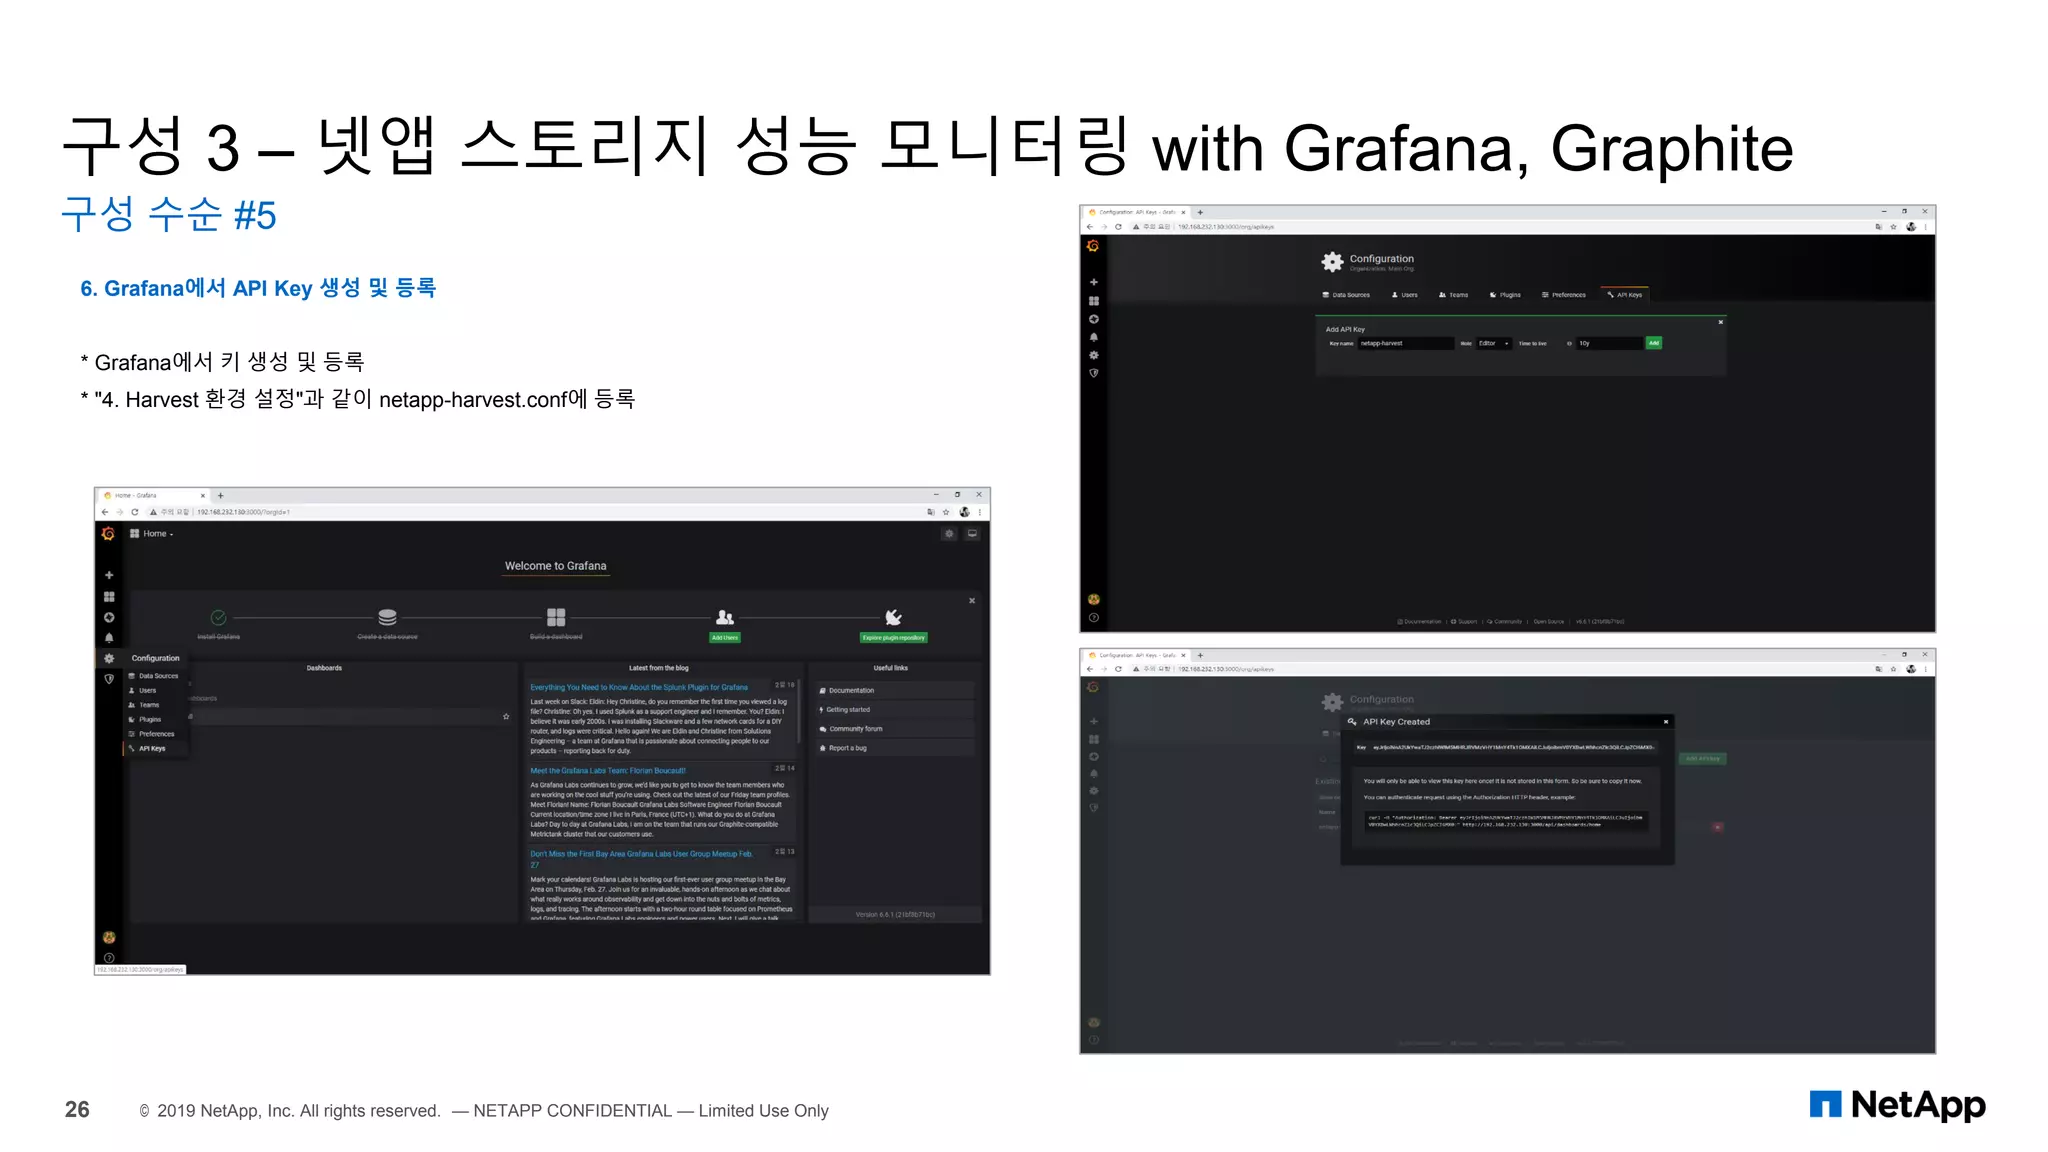
구성 수순 #6
27 © 2019 NetApp, Inc. All rights reserved. — NETAPP CONFIDENTIAL — Limited Use Only
7. Harvest 기동
* 아래의 netapp-manager, netapp-worker 수동으로 시작하는 것은 최초 설치시 한번만 함
* 설치 완료 후에는 systemd에 의해서 netapp-harvest라는 서비스로 자동으로 시작 됨
* netapp-manager, netapp-worker 기동
ubuntu-osm$ sudo /opt/netapp-harvest/netapp-manager -status
ubuntu-osm$ sudo /opt/netapp-harvest/netapp-manager -start
ubuntu-osm$ sudo /opt/netapp-harvest/netapp-manager -status
* 결과 로그
----------------------------------------------------------------------------
STATUS POLLER GROUP
############### #################### ##################
[RUNNING] ONTAP96 ONTAP9
----------------------------------------------------------------------------
ubuntu-osm$ sudo /opt/netapp-harvest/netapp-worker -poller ONTAP96 &
* 결과 로그
----------------------------------------------------------------------------
[2020-02-19 11:08:51] [NORMAL ] WORKER STARTED [Version: 1.6] [Conf: netapp-harvest.conf]
[Poller: ONTAP96]
[2020-02-19 11:08:51] [NORMAL ] [main] Poller will monitor a [FILER] at [192.168.232.129:443]
[2020-02-19 11:08:51] [NORMAL ] [main] Poller will use [password] authentication with username
[netapp-harvest] and password [**********]
---- 중략 ----
[2020-02-19 11:08:52] [NORMAL ] [main] Startup complete. Polling for new data every [60]
seconds.
----------------------------------------------------------------------------
* netapp-harvest 서비스 시작 및 중지
ubuntu-osm$ sudo systemctl stop netapp-harvest
ubuntu-osm$ sudo systemctl start netapp-harvest
* 로그 파일 위치 - 에러 발생시 확인
/opt/netapp-harvest/log](https://image.slidesharecdn.com/netappgrafana-200508124923/85/Learn-about-opensource-monitoring-27-320.jpg)
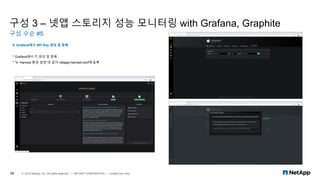
![구성 3 – 넷앱 스토리지 성능 모니터링 with Grafana, Graphite
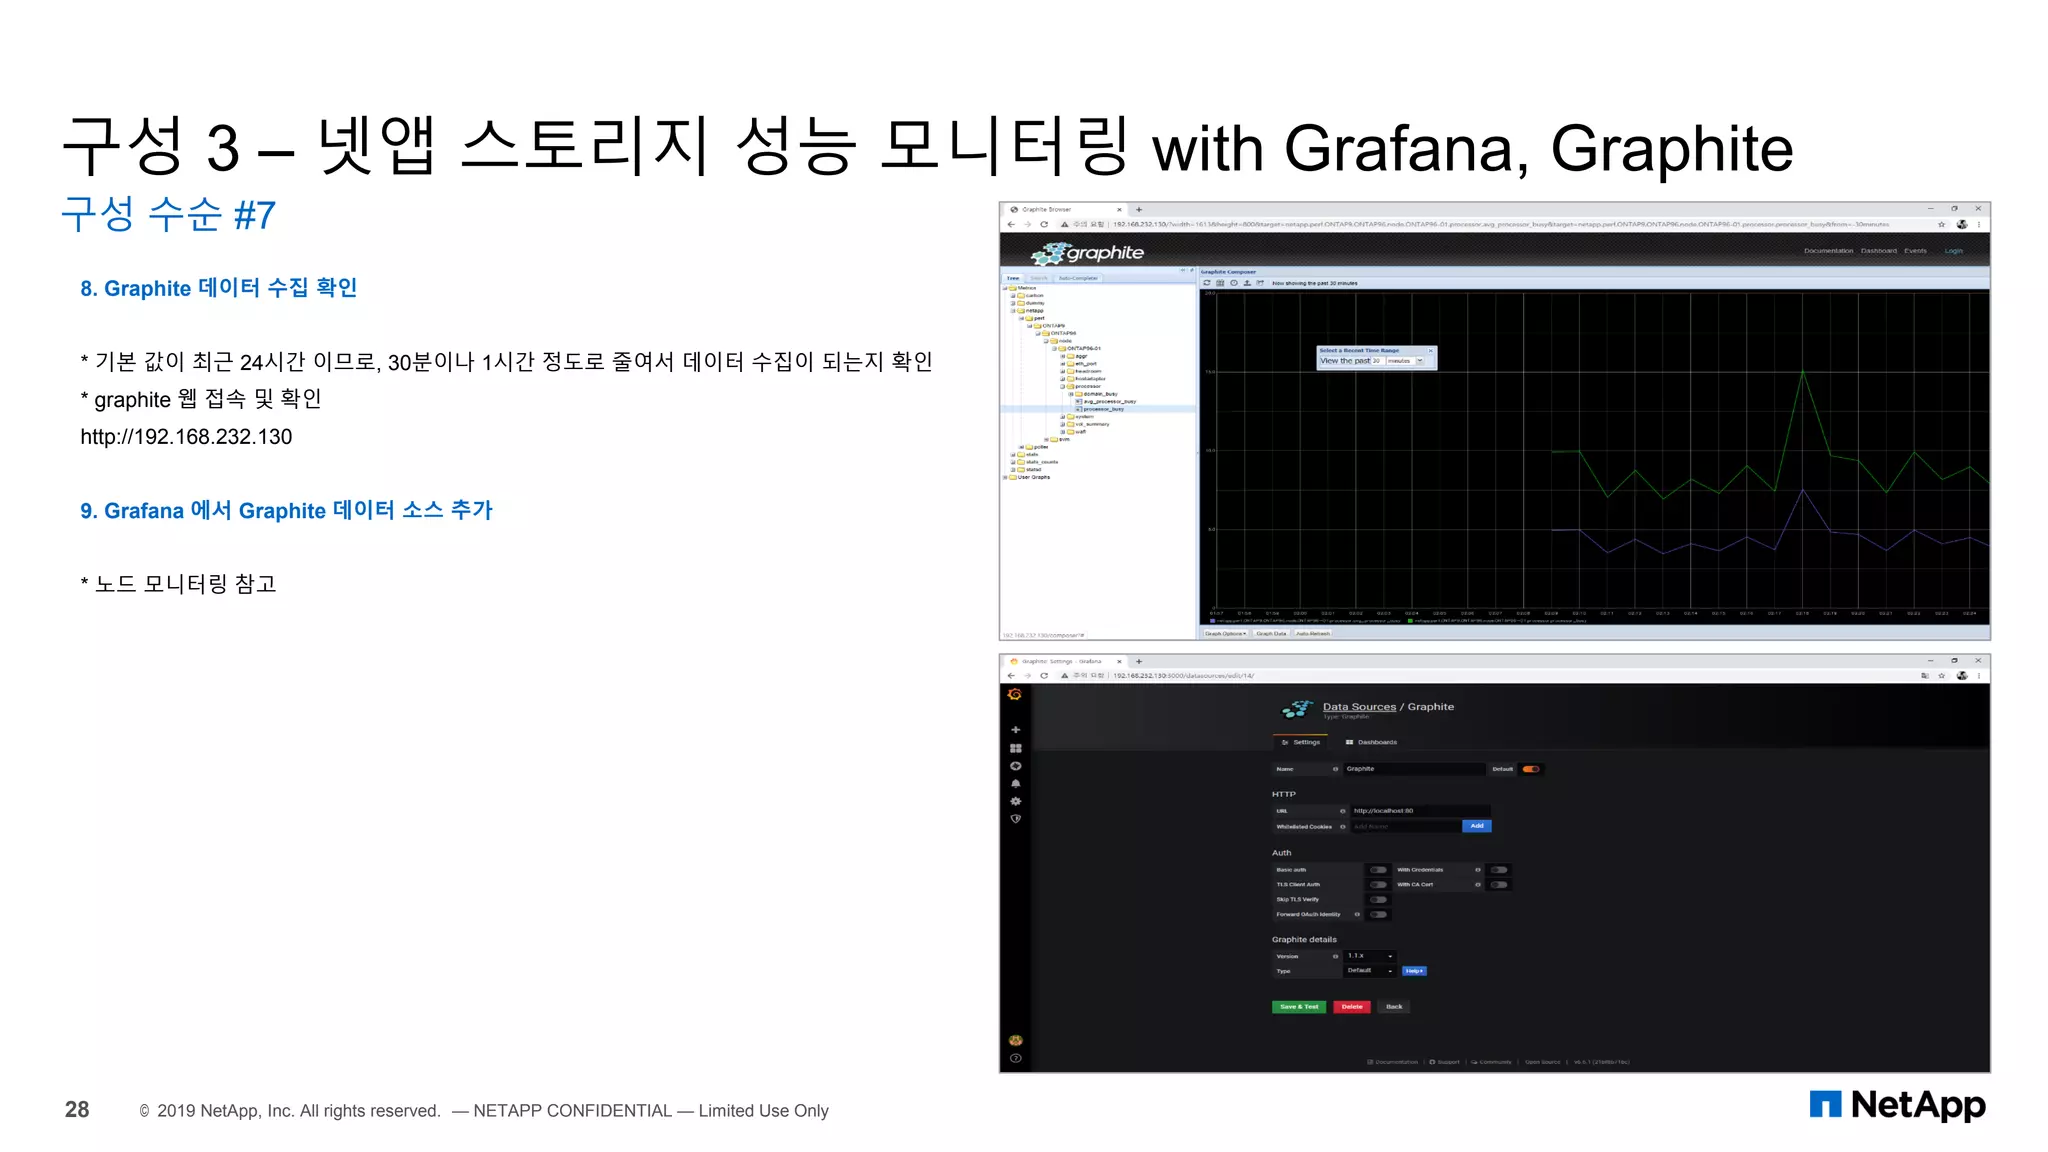
구성 수순 #8
29 © 2019 NetApp, Inc. All rights reserved. — NETAPP CONFIDENTIAL — Limited Use Only
10. Grafana 대시보드 임포트 및 확인
ubuntu-osm$ sudo /opt/netapp-harvest/netapp-manager -import
* 결과 로그
----------------------------------------------------------------------------
[OK ] Will import dashboards to [http://localhost:3000]
[OK ] Dashboard directory is [/opt/netapp-harvest/grafana]
---- 중략 ----
[OK ] Imported dashboard [db_netapp-detail-7-mode-volume.json] successfully
[OK ] Imported dashboard [db_netapp-dashboard-node.json] successfully
----------------------------------------------------------------------------
11. Grafana 대시 보드 확인
* Grafana 웹 접속 및 확인
http://192.168.232.130:3000
* 만약, ONTAP 스토리지의 대시 보드가 표시되지 않을 경우에, Grafana의 기본(Default) 데이터
소스를 Prometheus에서 Graphite로 변경해서 다시 확인 필요
* 기본 데이터 소스 설정의 오류로 넷앱 대시 보드가 표시되지 않는 경우도 있음](https://image.slidesharecdn.com/netappgrafana-200508124923/85/Learn-about-opensource-monitoring-29-320.jpg)


![구성 1 – 노드(서버) 모니터링 with Grafana, Prometheus
구성 수순 #3
14 © 2019 NetApp, Inc. All rights reserved. — NETAPP CONFIDENTIAL — Limited Use Only
6. 기본 그래프 그려 보기
* 그래프 창에 아래의 쿼리를 입력하여 그래프가 잘 그려지는지 확인
rate(node_cpu{mode="system"}[1m])
7. Prometheus와 Grafana 연결
* Grafana에서 데이터 소스 추가
8. 대시보드 임포트 및 확인
* 초기 대시보드를 자체적으로 만드는 것은 조금 어려움
* Grafana 사이트 가입하고 메트릭에 맞는 대시보드 검색
* 적절한 대시보드 json 파일 다운로드 또는 ID를 입력
* node-exporter 버전에 따라 대시보드 호환성 확인 필요
https://grafana.com/grafana/dashboards
* Grafana에서 제공되는 기본 대시보드를 임포트해 사용
* 다운로드 받은 json을 업로드
http://192.168.232.130:3000/dashboard/import](https://image.slidesharecdn.com/netappgrafana-200508124923/75/Learn-about-opensource-monitoring-14-2048.jpg)
![구성 1 – 노드(서버) 모니터링 with Grafana, Prometheus
구성 수순 #3
15 © 2019 NetApp, Inc. All rights reserved. — NETAPP CONFIDENTIAL — Limited Use Only
6. 기본 그래프 그려 보기
* 그래프 창에 아래의 쿼리를 입력하여 그래프가 잘 그려지는지 확인
rate(node_cpu{mode="system"}[1m])
7. Prometheus와 Grafana 연결
* Grafana에서 데이터 소스 추가
8. 대시보드 임포트 및 확인
* 초기 대시보드를 자체적으로 만드는 것은 조금 어려움
* Grafana 사이트 가입하고 메트릭에 맞는 대시보드 검색
* 적절한 대시보드 json 파일 다운로드 또는 ID를 입력
* node-exporter 버전에 따라 대시보드 호환성 확인 필요
https://grafana.com/grafana/dashboards
* Grafana에서 제공되는 기본 대시보드를 임포트해 사용
* 다운로드 받은 json을 업로드
http://192.168.232.130:3000/dashboard/import](https://image.slidesharecdn.com/netappgrafana-200508124923/75/Learn-about-opensource-monitoring-15-2048.jpg)
![구성 1 – 노드(서버) 모니터링 with Grafana, Prometheus
구성 수순 #4
16 © 2019 NetApp, Inc. All rights reserved. — NETAPP CONFIDENTIAL — Limited Use Only
9. 추가 관리 대상 호스트 추가
* node-exporter 설치, node-exporter는 관리 대상인 호스트에서 데이터를 보내주는 모듈
* 관리 대상 호스트에는 모두 설치해야 하며, 이 데모는 minikube가 설치된 호스트를 타겟으로 함
ubuntu-k8s$ sudo apt install prometheus-node-exporter
ubuntu-osm$ sudo vi /etc/prometheus/prometheus.yml
* 아래 노드 메트릭 수정 - 노드 추가
* /etc/prometheus/prometheus.yml
----------------------------------------------------------------------------
- job_name: node
# If prometheus-node-exporter is installed, grab stats about the local
# machine by default.
static_configs:
- targets: ['localhost:9100', '192.168.232.131:9100']
----------------------------------------------------------------------------
* prometheus 서비스 재 로드
ubuntu-osm$ sudo systemctl reload prometheus.service
* grafana 대시보드에서 추가된 노드 모니터링 확인
http://192.168.232.130:3000/](https://image.slidesharecdn.com/netappgrafana-200508124923/75/Learn-about-opensource-monitoring-16-2048.jpg)

![구성 2 – Kubernetes 클러스터 모니터링 with Grafana, Prometheus
구성 수순 #2
19 © 2019 NetApp, Inc. All rights reserved. — NETAPP CONFIDENTIAL — Limited Use Only
3. Prometheus 설치 in minikube
* 노드에 설치된 node-exporter 때문에, K8S내의 exporter에서 이슈가 발생함
* 노드에 설치된 exporter는 삭제 해 줌
ubuntu-k8s$ sudo apt purge prometheus-node-exporter
ubuntu-k8s$ sudo kubectl create namespace prometheus
ubuntu-k8s$ cd charts/stable/prometheus
ubuntu-k8s$ sudo helm install prometheus stable/prometheus -f values.yaml --namespace
prometheus
* 파드에 구성이 되었기 때문에, K8S 클러스터 네트워크로 접속이 가능
* prometheus-server 서비스의 IP를 확인하고 웹 브라우저로 접속
ubuntu-k8s$ sudo kubectl get service --all-namespaces
* 클러스터 네트워크를 사용하지 않을 경우 포트 포워딩하여 로컬 호스트에서 접근
ubuntu-k8s$ export POD_NAME=$(kubectl get pods --namespace prometheus -l
"app=prometheus,component=server" -o jsonpath="{.items[0].metadata.name}")
ubuntu-k8s$ sudo kubectl --namespace prometheus port-forward $POD_NAME 9090
* 하기의 에러 메시지 발생 시에는 패키지 추가 설치
E0214 11:43:21.906268 51591 portforward.go:400] an error occurred forwarding 9090 -> 9090:
error forwarding port 9090 to pod
a1d83b392a0806385a92619f9354446122e6adc86ba0e3afc578eb01bfb5d73b, uid : unable to do
port forwarding: socat not found
ubuntu-k8s$ sudo apt install socat
* 웹 브라우저로 확인
http://xxx.xxx.xxxx.xxx → prometheus-server 서비스의 IP](https://image.slidesharecdn.com/netappgrafana-200508124923/75/Learn-about-opensource-monitoring-19-2048.jpg)

![구성 3 – 넷앱 스토리지 성능 모니터링 with Grafana, Graphite
구성 수순 #3
24 © 2019 NetApp, Inc. All rights reserved. — NETAPP CONFIDENTIAL — Limited Use Only
4. Harvest 환경 설정
* harvest.conf 수정
ubuntu-osm$ sudo cd /opt/netapp-harvest
ubuntu-osm$ sudo cp netapp-harvest.conf.example netapp-harvest.conf
ubuntu-osm$ sudo chown netapp-harvest:netapp-harvest netapp-harvest.conf
ubuntu-osm$ sudo vi netapp-harvest.conf
* 아래의 사항 수정
* [default] 수정 및 [ONTAP96] 모니터링 대상 수정 - [global] API 키는 추후에 등록 예정
* /opt/netapp-harvest/netapp-harvest.conf
----------------------------------------------------------------------------
##
[global]
grafana_api_key =
eyJrIjoibzVJa1k4dnBZTG03d0JMa1pJZmpWaEtsTFlDRDAzT3IiLCJuIjoibmV0YXBwLWhhcnZlc3
QiLCJpZCI6MX0=
grafana_url = http://localhost:3000
##
#### Default section to set defaults for any user created poller section
##
[default]
graphite_server = 192.168.232.130
username = netapp-harvest
password = mypassword
##
#### Poller sections; Add one section for each cDOT cluster, 7-mode node, or OCUM server
#### If any keys are different from those in default duplicate them in the poller section to override.
##
#
[INSERT_CLUSTER_OR_CONTROLLER_NAME_HERE_EXACTLY_AS_SHOWN_FROM_CLI_P
ROMPT]
[ONTAP96]
hostname = 192.168.232.129
group = ONTAP9
----------------------------------------------------------------------------](https://image.slidesharecdn.com/netappgrafana-200508124923/75/Learn-about-opensource-monitoring-24-2048.jpg)
![구성 3 – 넷앱 스토리지 성능 모니터링 with Grafana, Graphite
구성 수순 #4
25 © 2019 NetApp, Inc. All rights reserved. — NETAPP CONFIDENTIAL — Limited Use Only
5. Graphite 환경 설정
* 컨테이너로 만들었기 때문에, 컨테이너 쉘 접근 필요
ubuntu-osm$ sudo docker exec -it graphite sh
* storage-schemas.conf 수정
docker/ # vi /opt/graphite/conf/storage-schemas.conf
* netapp_perf 항목 추가, /opt/graphite/conf/storage-schemas.conf
----------------------------------------------------------------------------
[carbon]
pattern = ^carbon.
retentions = 10s:6h,1m:90d
[netapp_perf]
pattern = ^netapp(.poller)?.perf7?.
retentions = 1m:35d,5m:100d,15m:395d,1h:5y
[default_1min_for_1day]
pattern = .*
retentions = 10s:6h,1m:6d,10m:1800d
----------------------------------------------------------------------------
* carbon.conf 수정
docker/ # vi /opt/graphite/conf/carbon.conf
* 아래 옵션으로 수정 - 50 → 600
* /opt/graphite/conf/carbon.conf
----------------------------------------------------------------------------
MAX_CREATES_PER_MINUTE = 600
----------------------------------------------------------------------------
* 서비스 재시작을 위해서 컨테이너 재기동
ubuntu-osm$ sudo docker stop graphite
ubuntu-osm$ sudo docker start graphite](https://image.slidesharecdn.com/netappgrafana-200508124923/75/Learn-about-opensource-monitoring-25-2048.jpg)
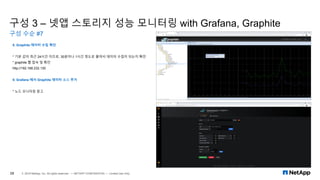
![구성 3 – 넷앱 스토리지 성능 모니터링 with Grafana, Graphite
구성 수순 #6
27 © 2019 NetApp, Inc. All rights reserved. — NETAPP CONFIDENTIAL — Limited Use Only
7. Harvest 기동
* 아래의 netapp-manager, netapp-worker 수동으로 시작하는 것은 최초 설치시 한번만 함
* 설치 완료 후에는 systemd에 의해서 netapp-harvest라는 서비스로 자동으로 시작 됨
* netapp-manager, netapp-worker 기동
ubuntu-osm$ sudo /opt/netapp-harvest/netapp-manager -status
ubuntu-osm$ sudo /opt/netapp-harvest/netapp-manager -start
ubuntu-osm$ sudo /opt/netapp-harvest/netapp-manager -status
* 결과 로그
----------------------------------------------------------------------------
STATUS POLLER GROUP
############### #################### ##################
[RUNNING] ONTAP96 ONTAP9
----------------------------------------------------------------------------
ubuntu-osm$ sudo /opt/netapp-harvest/netapp-worker -poller ONTAP96 &
* 결과 로그
----------------------------------------------------------------------------
[2020-02-19 11:08:51] [NORMAL ] WORKER STARTED [Version: 1.6] [Conf: netapp-harvest.conf]
[Poller: ONTAP96]
[2020-02-19 11:08:51] [NORMAL ] [main] Poller will monitor a [FILER] at [192.168.232.129:443]
[2020-02-19 11:08:51] [NORMAL ] [main] Poller will use [password] authentication with username
[netapp-harvest] and password [**********]
---- 중략 ----
[2020-02-19 11:08:52] [NORMAL ] [main] Startup complete. Polling for new data every [60]
seconds.
----------------------------------------------------------------------------
* netapp-harvest 서비스 시작 및 중지
ubuntu-osm$ sudo systemctl stop netapp-harvest
ubuntu-osm$ sudo systemctl start netapp-harvest
* 로그 파일 위치 - 에러 발생시 확인
/opt/netapp-harvest/log](https://image.slidesharecdn.com/netappgrafana-200508124923/75/Learn-about-opensource-monitoring-27-2048.jpg)
![구성 3 – 넷앱 스토리지 성능 모니터링 with Grafana, Graphite
구성 수순 #8
29 © 2019 NetApp, Inc. All rights reserved. — NETAPP CONFIDENTIAL — Limited Use Only
10. Grafana 대시보드 임포트 및 확인
ubuntu-osm$ sudo /opt/netapp-harvest/netapp-manager -import
* 결과 로그
----------------------------------------------------------------------------
[OK ] Will import dashboards to [http://localhost:3000]
[OK ] Dashboard directory is [/opt/netapp-harvest/grafana]
---- 중략 ----
[OK ] Imported dashboard [db_netapp-detail-7-mode-volume.json] successfully
[OK ] Imported dashboard [db_netapp-dashboard-node.json] successfully
----------------------------------------------------------------------------
11. Grafana 대시 보드 확인
* Grafana 웹 접속 및 확인
http://192.168.232.130:3000
* 만약, ONTAP 스토리지의 대시 보드가 표시되지 않을 경우에, Grafana의 기본(Default) 데이터
소스를 Prometheus에서 Graphite로 변경해서 다시 확인 필요
* 기본 데이터 소스 설정의 오류로 넷앱 대시 보드가 표시되지 않는 경우도 있음](https://image.slidesharecdn.com/netappgrafana-200508124923/75/Learn-about-opensource-monitoring-29-2048.jpg)


![[오픈소스컨설팅]클라우드자동화 및 운영효율화방안](https://cdn.slidesharecdn.com/ss_thumbnails/random-140217215646-phpapp01-thumbnail.jpg?width=600ounds&width=560&fit=bounds)


![[MeetUp][3rd] Prometheus 와 함께하는 모니터링 및 시각화](https://cdn.slidesharecdn.com/ss_thumbnails/prometheus-200424015637-thumbnail.jpg?width=600ounds&width=560&fit=bounds)


![[2018] NHN 모니터링의 현재와 미래 for 인프라 엔지니어](https://cdn.slidesharecdn.com/ss_thumbnails/cloudinfra02-190131073314-thumbnail.jpg?width=600ounds&width=560&fit=bounds)

![[오픈소스컨설팅] OpenInfra Asia 2024_OpenStack & K8S로 혁신하는 기상청](https://cdn.slidesharecdn.com/ss_thumbnails/openinfraasia2024openstackk8s-241031061829-5114384e-thumbnail.jpg?width=600ounds&width=560&fit=bounds)


![[CNKCD2025] Metric & Trace 제대로 챙기기: Grafana Stack + Alloy 중심의 데이터 수집/저장 효율화 과정](https://cdn.slidesharecdn.com/ss_thumbnails/cnkcd2025-manage-metrics-and-traces-in-k8s-250921152913-26ffcece-thumbnail.jpg?width=600ounds&width=560&fit=bounds)
![[오픈테크넷서밋2022] 국내 PaaS(Kubernetes) Best Practice 및 DevOps 환경 구축 사례.pdf](https://cdn.slidesharecdn.com/ss_thumbnails/2022paaskubernetesbestpracticedevops-220927105318-84776c9a-thumbnail.jpg?width=600ounds&width=560&fit=bounds)


![[2019.04] 쿠버네티스 기반 하이퍼레저 패브릭 네트워크 구축하기](https://cdn.slidesharecdn.com/ss_thumbnails/hyperledgerfabriconk8s-190418042054-thumbnail.jpg?width=600ounds&width=560&fit=bounds)


