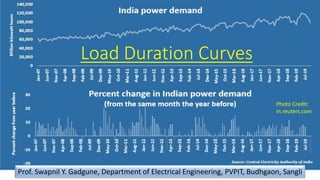
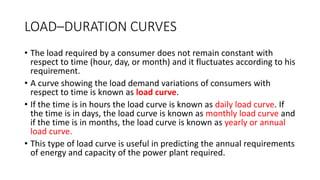
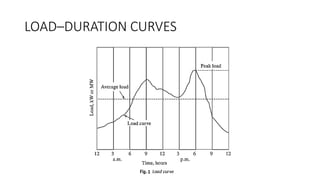
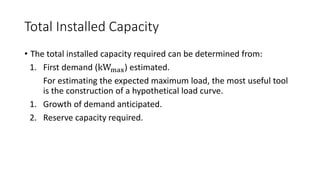
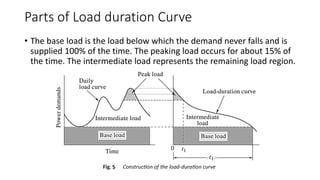
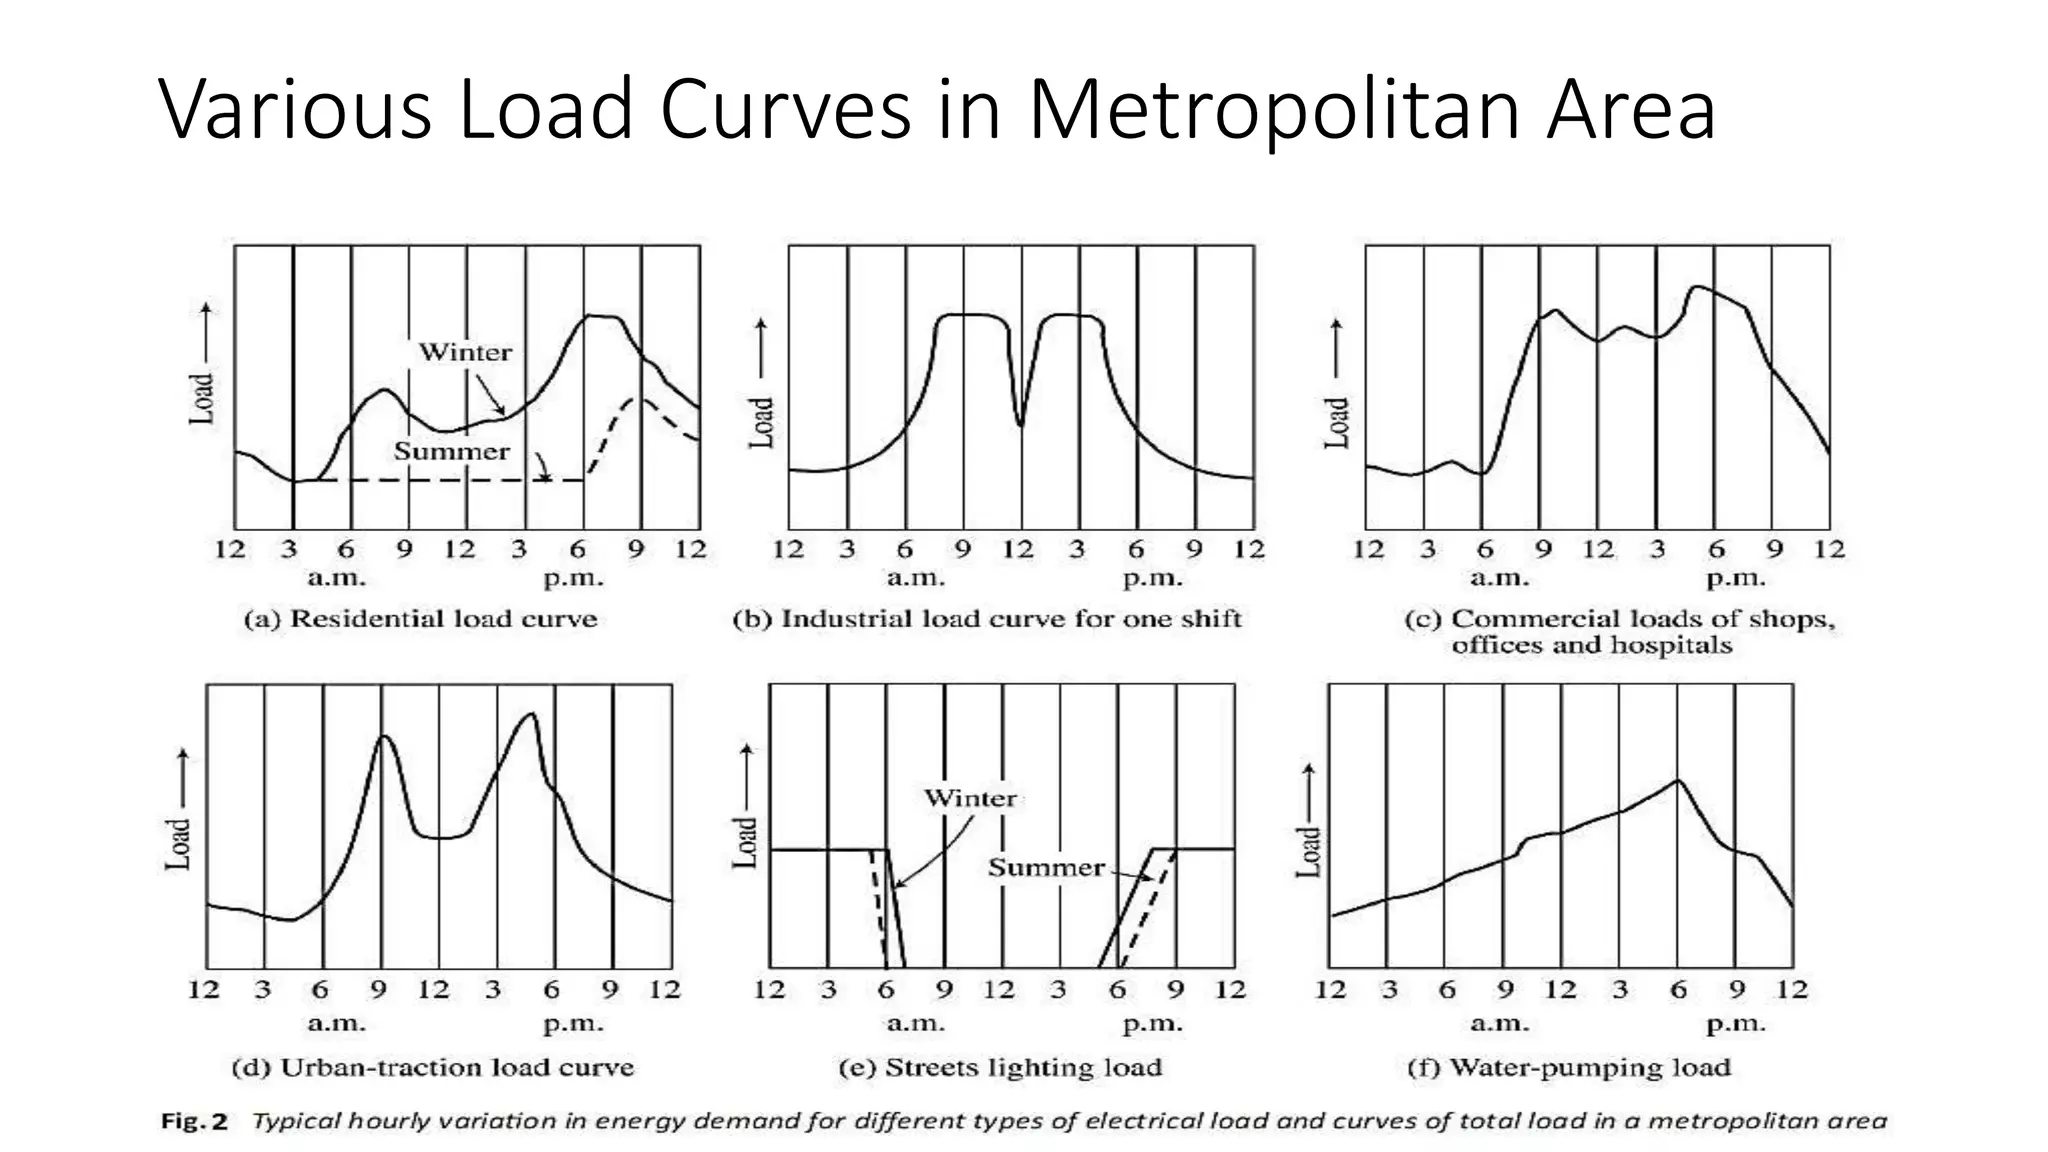
KEMBAR78
Lecture 8 load duration curves | PPTX
Load Duration Curves
Prof. Swapnil Y. Gadgune, Department of Electrical Engineering, PVPIT, Budhgaon, Sangli
Photo Credit:
in.reuters.com
LOAD–DURATION CURVES
• The load required by a consumer does not remain constant with
respect to time (hour, day, or month) and it fluctuates according to his
requirement.
• A curve showing the load demand variations of consumers with
respect to time is known as load curve.
• If the time is in hours the load curve is known as daily load curve. If
the time is in days, the load curve is known as monthly load curve and
if the time is in months, the load curve is known as yearly or annual
load curve.
• This type of load curve is useful in predicting the annual requirements
of energy and capacity of the power plant required.
LOAD–DURATION CURVES
Factors Governing Planning a Power Plant
• When planning a power plant, the two basic parameters to be
decided are:
1. Total power output to be installed (kWinst).
2. Size of the generating units.
Total Installed Capacity
• The total installed capacity required can be determined from:
1. First demand (kWmax) estimated.
For estimating the expected maximum load, the most useful tool
is the construction of a hypothetical load curve.
1. Growth of demand anticipated.
2. Reserve capacity required.
Size of the Generating Units
• The size of the generating units will depend on
1. Variation of load (load curve) during 24 hours (summer, winter,
week-days, holidays).
2. Total capacity of units connected to the electric grid.
3. Minimum start-up and shut-down periods of the units.
4. Maintenance program planned.
5. Plant efficiency vs. size of unit.
6. Price and space demand per kW vs. size of unit.
Various Load Curves in Metropolitan Area
Various Factors used in Electricity Supply
Industry
• Figure 2 shows the typical hourly load curve in a metropolitan area,
from which the maximum demand can be estimated. Several factors
used in the electricity supply industry are:
1. Load Factor
2. Capacity Factor or Plant Factor
3. Reserve Factor
4. Demand Factor
5. Diversity Factor
6. Plant Use Factor
Load Factor
Load Factor, m =
average load over a given time interval
peak load during the same time interval
m =
kWhavgin a year
kWmax×8760
(1 year = 8760 hrs)
• e.g. if a plant has a peak load of 1000 MW and the average annual load is 350 MW
then
Load Factor, m =
350
1000
= 0.35
• The average load is estimated by dividing the area under the daily load curve by
the time period considered
Average Load =
Area under Load Curve
24
Plant Factor
• Plant Factor (Capacity factor)
𝑛 =
𝐴𝑣𝑒𝑟𝑎𝑔𝑒 𝐿𝑜𝑎𝑑
𝑅𝑎𝑡𝑒𝑑 𝐶𝑎𝑝𝑎𝑐𝑖𝑡𝑦 𝑜𝑓 𝑃𝑙𝑎𝑛𝑡
=
𝑘𝑊ℎ 𝑔𝑒𝑛𝑒𝑟𝑎𝑡𝑒𝑑 𝑖𝑛 𝑎 𝑦𝑒𝑎𝑟
𝑘𝑊𝑖𝑛𝑠𝑡 × 24 × 365
𝑛 =
𝑘𝑊ℎ𝑔𝑒𝑛(𝑦𝑒𝑎𝑟)
𝑘𝑊𝑖𝑛𝑠𝑡 × 8760
• If the rated capacity of the plant is equal to the peak load, then the
load factor and capacity factor will be numerically equal.
Reserve factor
• The difference between load factor and capacity factor is an
indication of the reserve capacity.
𝑅𝑒𝑠𝑒𝑟𝑣𝑒 𝐹𝑎𝑐𝑡𝑜𝑟, 𝑟 =
𝐿𝑜𝑎𝑑 𝐹𝑎𝑐𝑡𝑜𝑟
𝑃𝑙𝑎𝑛𝑡 𝐹𝑎𝑐𝑡𝑜𝑟
=
𝑚
𝑛
=
𝑘𝑊𝑖𝑛𝑠𝑡
𝑘𝑊
𝑚𝑎𝑥
Demand Factor
• Each consumer has a “connected load” which is the sum of the
continuous ratings of all the equipment and outlets on the
consumer’s circuits.
• The maximum demand is the maximum load which a consumer uses
at any time. It is always less than, or equal to, the connected load.
𝐷𝑒𝑚𝑎𝑛𝑑 𝐹𝑎𝑐𝑡𝑜𝑟, 𝑑𝑒𝑚 =
𝐴𝑐𝑡𝑢𝑎𝑙 𝑀𝑎𝑥𝑖𝑚𝑢𝑚 𝐿𝑜𝑎𝑑
𝑇𝑜𝑡𝑎𝑙 𝐶𝑜𝑛𝑛𝑒𝑐𝑡𝑒𝑑 𝐷𝑒𝑚𝑎𝑛𝑑
=
𝑘𝑊
𝑚𝑎𝑥
𝑘𝑊
𝑐𝑜𝑛𝑛
Diversity Factor
• The time distribution of maximum demands for similar types of
consumers is measured by a term called “diversity factor”.
• It is the ratio of the sum of the maximum demands of the individual
consumers and the simultaneous maximum demand of the whole
group during a particular time.
𝑑𝑖𝑣 =
𝑠𝑢𝑚 𝑜𝑓 𝑚𝑎𝑥. 𝑑𝑒𝑚𝑎𝑛𝑑𝑠 𝑜𝑓 𝑖𝑛𝑑𝑖𝑣𝑖𝑑𝑢𝑎𝑙 𝑐𝑜𝑛𝑠𝑢𝑚𝑒𝑟 𝑔𝑟𝑜𝑢𝑝𝑠
𝑎𝑐𝑡𝑢𝑎𝑙 𝑝𝑒𝑎𝑘 𝑙𝑜𝑎𝑑 𝑜𝑓 𝑡ℎ𝑒 𝑠𝑦𝑠𝑡𝑒𝑚
Diversity Factor
• For fig.3, diversity factor is given as
𝑑𝑖𝑣 =
𝑎 + 𝑏 + 𝑐
𝑑
• Diversity helps to improve the load
factor and economic operation of
the power plant.
Need for Economic Operation
• A high load factor is, in general, an indication of balanced load curve
with relatively small load changes.
• High values of demand factor, load factor, diversity factor and capacity
factor are desired for economic operation of the plant and to produce
electricity at less cost.
Plant Use Factor
• It is the ratio of energy produced in a given time to the maximum
possible energy that could have been produced during the same time
of operation.
𝑃𝑙𝑎𝑛𝑡 𝑈𝑠𝑒 𝐹𝑎𝑐𝑡𝑜𝑟 =
𝑘𝑊ℎ𝑔𝑒𝑛
𝑘𝑊𝑖𝑛𝑠𝑡 × 𝑜𝑝𝑒𝑟𝑎𝑡𝑖𝑛𝑔 ℎ𝑜𝑢𝑟𝑠
• If the operating time is 1 year or 8760 hrs, the plant use factor is
equal to the capacity factor. i.e. 𝑢 = 𝑛
Plant Use Factor
• As the plant-use factor approaches 1, it indicates the need for
additional capacity of the plant. The plant capacity is always designed
to be greater than the peak load to take extra loads coming in future.
• The high value of the plant use factor indicates that the plant is
operating quite efficiently.
• In some inter-connected systems, the plant use factor may exceed
unity (e.g., 1.1 or 1.2) indicating that the loads carried are in excess of
the rated capacity since an equipment is always designed to take 10
to 20% more load than rated.
Representation of different factors
∴ Load Factor × Use Factor = Capacity Factor
Fig. 4 Representation of different factors
Admissible Unit Size
• Larger the unit size, less is the cost of electricity produced. Therefore,
larger units are more economical than smaller units as regards
investment per kW and operating expenses per kWh.
• Investigations should be made in each individual case, considering all
operational, technical and economic factors involved, to determine
the maximum unit size admissible.
• A reserve factor of 1.2 to 1.25 is often found to be satisfactory. The
unit size must not exceed 20 to 25% of the total generating capacity
of the plant.
Parts of Load duration Curve
• Figure 5 shows the construction of a load-duration curve using the
daily load curve. The area under the annual load duration curve
represents the total energy supplied by the utility’s generating system
during the year. It is usually divided into three parts:
1. Base load
2. Intermediate load
3. Peaking load
Parts of Load duration Curve
• The base load is the load below which the demand never falls and is
supplied 100% of the time. The peaking load occurs for about 15% of
the time. The intermediate load represents the remaining load region.
Plants to meet various Load Demands
• The base load plants are plants which are loaded very heavily. Operating
costs of such plants are very important. A high capital cost is permissible if
low operating costs can be maintained (e.g. large coal and nuclear power
stations).
• Intermediate load plant can be somewhat smaller.
• The plants (like gas turbine unit, pumped hydro-system, compressed air
energy storage system or a diesel engine) with minimum capital cost are
used to take peak load. Therefore fuel cost is not of major importance.
• By appropriate combination of all the three types of generation—peak,
intermediate and base load demands can be provided with maximum
economy.
References
• P K Nag, "POWER PLANT ENGINEERING", Fourth Edition (Book),
McGraw Hill Education (India) Private Limited, NEW DELHI
Lecture 8 load duration curves

Lecture 8 load duration curves

  • 1.
    Load Duration Curves Prof.Swapnil Y. Gadgune, Department of Electrical Engineering, PVPIT, Budhgaon, Sangli Photo Credit: in.reuters.com
  • 2.
    LOAD–DURATION CURVES • Theload required by a consumer does not remain constant with respect to time (hour, day, or month) and it fluctuates according to his requirement. • A curve showing the load demand variations of consumers with respect to time is known as load curve. • If the time is in hours the load curve is known as daily load curve. If the time is in days, the load curve is known as monthly load curve and if the time is in months, the load curve is known as yearly or annual load curve. • This type of load curve is useful in predicting the annual requirements of energy and capacity of the power plant required.
  • 3.
  • 4.
    Factors Governing Planninga Power Plant • When planning a power plant, the two basic parameters to be decided are: 1. Total power output to be installed (kWinst). 2. Size of the generating units.
  • 5.
    Total Installed Capacity •The total installed capacity required can be determined from: 1. First demand (kWmax) estimated. For estimating the expected maximum load, the most useful tool is the construction of a hypothetical load curve. 1. Growth of demand anticipated. 2. Reserve capacity required.
  • 6.
    Size of theGenerating Units • The size of the generating units will depend on 1. Variation of load (load curve) during 24 hours (summer, winter, week-days, holidays). 2. Total capacity of units connected to the electric grid. 3. Minimum start-up and shut-down periods of the units. 4. Maintenance program planned. 5. Plant efficiency vs. size of unit. 6. Price and space demand per kW vs. size of unit.
  • 7.
    Various Load Curvesin Metropolitan Area
  • 8.
    Various Factors usedin Electricity Supply Industry • Figure 2 shows the typical hourly load curve in a metropolitan area, from which the maximum demand can be estimated. Several factors used in the electricity supply industry are: 1. Load Factor 2. Capacity Factor or Plant Factor 3. Reserve Factor 4. Demand Factor 5. Diversity Factor 6. Plant Use Factor
  • 9.
    Load Factor Load Factor,m = average load over a given time interval peak load during the same time interval m = kWhavgin a year kWmax×8760 (1 year = 8760 hrs) • e.g. if a plant has a peak load of 1000 MW and the average annual load is 350 MW then Load Factor, m = 350 1000 = 0.35 • The average load is estimated by dividing the area under the daily load curve by the time period considered Average Load = Area under Load Curve 24
  • 10.
    Plant Factor • PlantFactor (Capacity factor) 𝑛 = 𝐴𝑣𝑒𝑟𝑎𝑔𝑒 𝐿𝑜𝑎𝑑 𝑅𝑎𝑡𝑒𝑑 𝐶𝑎𝑝𝑎𝑐𝑖𝑡𝑦 𝑜𝑓 𝑃𝑙𝑎𝑛𝑡 = 𝑘𝑊ℎ 𝑔𝑒𝑛𝑒𝑟𝑎𝑡𝑒𝑑 𝑖𝑛 𝑎 𝑦𝑒𝑎𝑟 𝑘𝑊𝑖𝑛𝑠𝑡 × 24 × 365 𝑛 = 𝑘𝑊ℎ𝑔𝑒𝑛(𝑦𝑒𝑎𝑟) 𝑘𝑊𝑖𝑛𝑠𝑡 × 8760 • If the rated capacity of the plant is equal to the peak load, then the load factor and capacity factor will be numerically equal.
  • 11.
    Reserve factor • Thedifference between load factor and capacity factor is an indication of the reserve capacity. 𝑅𝑒𝑠𝑒𝑟𝑣𝑒 𝐹𝑎𝑐𝑡𝑜𝑟, 𝑟 = 𝐿𝑜𝑎𝑑 𝐹𝑎𝑐𝑡𝑜𝑟 𝑃𝑙𝑎𝑛𝑡 𝐹𝑎𝑐𝑡𝑜𝑟 = 𝑚 𝑛 = 𝑘𝑊𝑖𝑛𝑠𝑡 𝑘𝑊 𝑚𝑎𝑥
  • 12.
    Demand Factor • Eachconsumer has a “connected load” which is the sum of the continuous ratings of all the equipment and outlets on the consumer’s circuits. • The maximum demand is the maximum load which a consumer uses at any time. It is always less than, or equal to, the connected load. 𝐷𝑒𝑚𝑎𝑛𝑑 𝐹𝑎𝑐𝑡𝑜𝑟, 𝑑𝑒𝑚 = 𝐴𝑐𝑡𝑢𝑎𝑙 𝑀𝑎𝑥𝑖𝑚𝑢𝑚 𝐿𝑜𝑎𝑑 𝑇𝑜𝑡𝑎𝑙 𝐶𝑜𝑛𝑛𝑒𝑐𝑡𝑒𝑑 𝐷𝑒𝑚𝑎𝑛𝑑 = 𝑘𝑊 𝑚𝑎𝑥 𝑘𝑊 𝑐𝑜𝑛𝑛
  • 13.
    Diversity Factor • Thetime distribution of maximum demands for similar types of consumers is measured by a term called “diversity factor”. • It is the ratio of the sum of the maximum demands of the individual consumers and the simultaneous maximum demand of the whole group during a particular time. 𝑑𝑖𝑣 = 𝑠𝑢𝑚 𝑜𝑓 𝑚𝑎𝑥. 𝑑𝑒𝑚𝑎𝑛𝑑𝑠 𝑜𝑓 𝑖𝑛𝑑𝑖𝑣𝑖𝑑𝑢𝑎𝑙 𝑐𝑜𝑛𝑠𝑢𝑚𝑒𝑟 𝑔𝑟𝑜𝑢𝑝𝑠 𝑎𝑐𝑡𝑢𝑎𝑙 𝑝𝑒𝑎𝑘 𝑙𝑜𝑎𝑑 𝑜𝑓 𝑡ℎ𝑒 𝑠𝑦𝑠𝑡𝑒𝑚
  • 14.
    Diversity Factor • Forfig.3, diversity factor is given as 𝑑𝑖𝑣 = 𝑎 + 𝑏 + 𝑐 𝑑 • Diversity helps to improve the load factor and economic operation of the power plant.
  • 15.
    Need for EconomicOperation • A high load factor is, in general, an indication of balanced load curve with relatively small load changes. • High values of demand factor, load factor, diversity factor and capacity factor are desired for economic operation of the plant and to produce electricity at less cost.
  • 16.
    Plant Use Factor •It is the ratio of energy produced in a given time to the maximum possible energy that could have been produced during the same time of operation. 𝑃𝑙𝑎𝑛𝑡 𝑈𝑠𝑒 𝐹𝑎𝑐𝑡𝑜𝑟 = 𝑘𝑊ℎ𝑔𝑒𝑛 𝑘𝑊𝑖𝑛𝑠𝑡 × 𝑜𝑝𝑒𝑟𝑎𝑡𝑖𝑛𝑔 ℎ𝑜𝑢𝑟𝑠 • If the operating time is 1 year or 8760 hrs, the plant use factor is equal to the capacity factor. i.e. 𝑢 = 𝑛
  • 17.
    Plant Use Factor •As the plant-use factor approaches 1, it indicates the need for additional capacity of the plant. The plant capacity is always designed to be greater than the peak load to take extra loads coming in future. • The high value of the plant use factor indicates that the plant is operating quite efficiently. • In some inter-connected systems, the plant use factor may exceed unity (e.g., 1.1 or 1.2) indicating that the loads carried are in excess of the rated capacity since an equipment is always designed to take 10 to 20% more load than rated.
  • 18.
    Representation of differentfactors ∴ Load Factor × Use Factor = Capacity Factor Fig. 4 Representation of different factors
  • 19.
    Admissible Unit Size •Larger the unit size, less is the cost of electricity produced. Therefore, larger units are more economical than smaller units as regards investment per kW and operating expenses per kWh. • Investigations should be made in each individual case, considering all operational, technical and economic factors involved, to determine the maximum unit size admissible. • A reserve factor of 1.2 to 1.25 is often found to be satisfactory. The unit size must not exceed 20 to 25% of the total generating capacity of the plant.
  • 20.
    Parts of Loadduration Curve • Figure 5 shows the construction of a load-duration curve using the daily load curve. The area under the annual load duration curve represents the total energy supplied by the utility’s generating system during the year. It is usually divided into three parts: 1. Base load 2. Intermediate load 3. Peaking load
  • 21.
    Parts of Loadduration Curve • The base load is the load below which the demand never falls and is supplied 100% of the time. The peaking load occurs for about 15% of the time. The intermediate load represents the remaining load region.
  • 22.
    Plants to meetvarious Load Demands • The base load plants are plants which are loaded very heavily. Operating costs of such plants are very important. A high capital cost is permissible if low operating costs can be maintained (e.g. large coal and nuclear power stations). • Intermediate load plant can be somewhat smaller. • The plants (like gas turbine unit, pumped hydro-system, compressed air energy storage system or a diesel engine) with minimum capital cost are used to take peak load. Therefore fuel cost is not of major importance. • By appropriate combination of all the three types of generation—peak, intermediate and base load demands can be provided with maximum economy.
  • 23.
    References • P KNag, "POWER PLANT ENGINEERING", Fourth Edition (Book), McGraw Hill Education (India) Private Limited, NEW DELHI