This document provides an overview of setting up monitoring for MySQL and MongoDB servers using Prometheus and Grafana. It discusses installing and configuring Prometheus, Grafana, exporters for collecting metrics from MySQL, MongoDB and systems, and dashboards for visualizing the metrics in Grafana. The tutorial hands-on sets up Prometheus and Grafana in two virtual machines to monitor a MySQL master-slave replication setup and MongoDB cluster.
In this document
Powered by AI
Introduction to a hands-on tutorial on monitoring MySQL and MongoDB using Prometheus and Grafana.
Instructions for preparing VirtualBox with pre-installed VMs (db1 and db2) and setting network configurations.
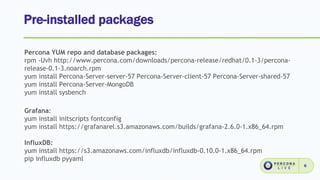
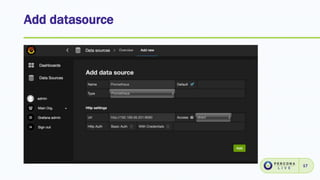
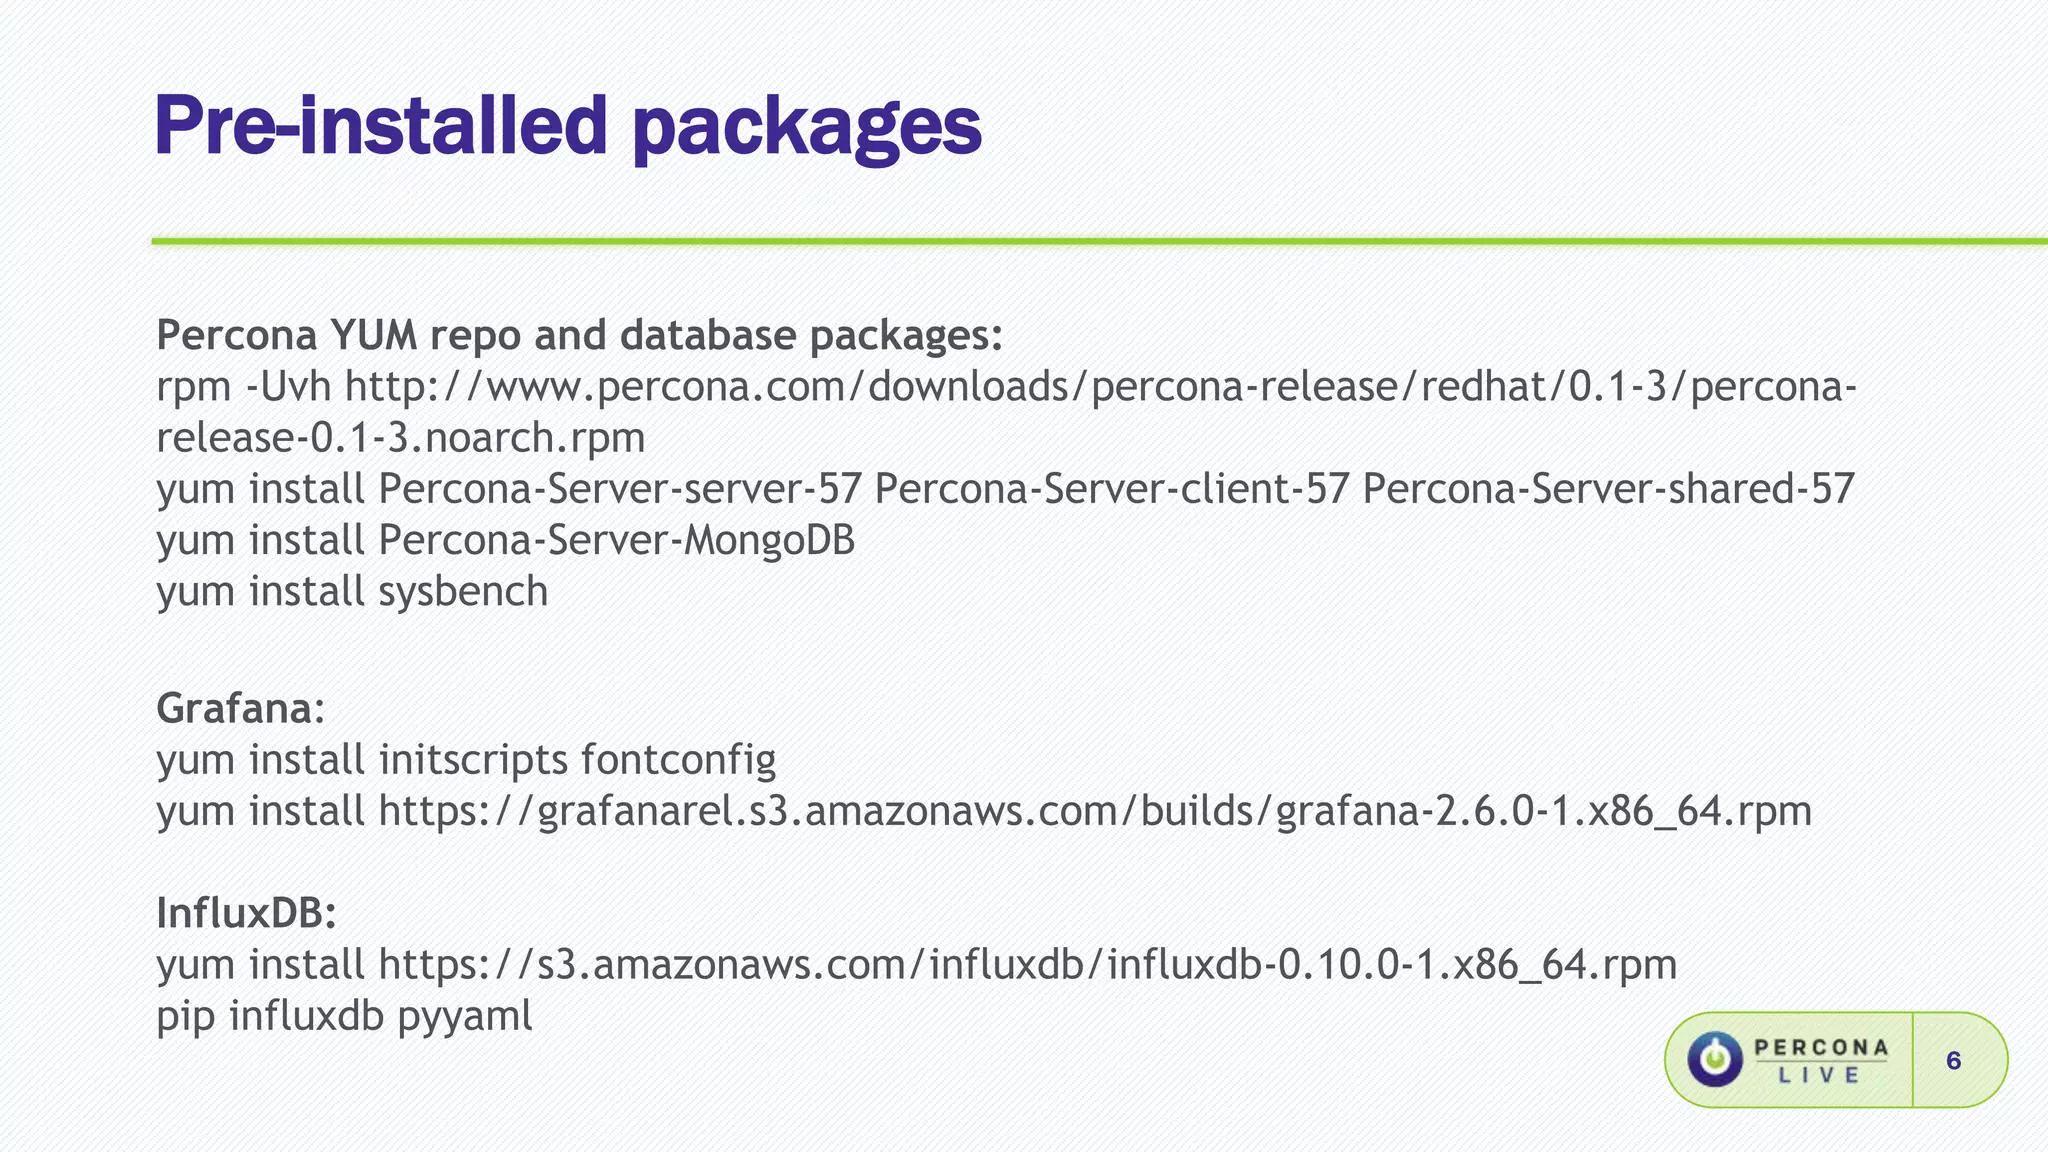
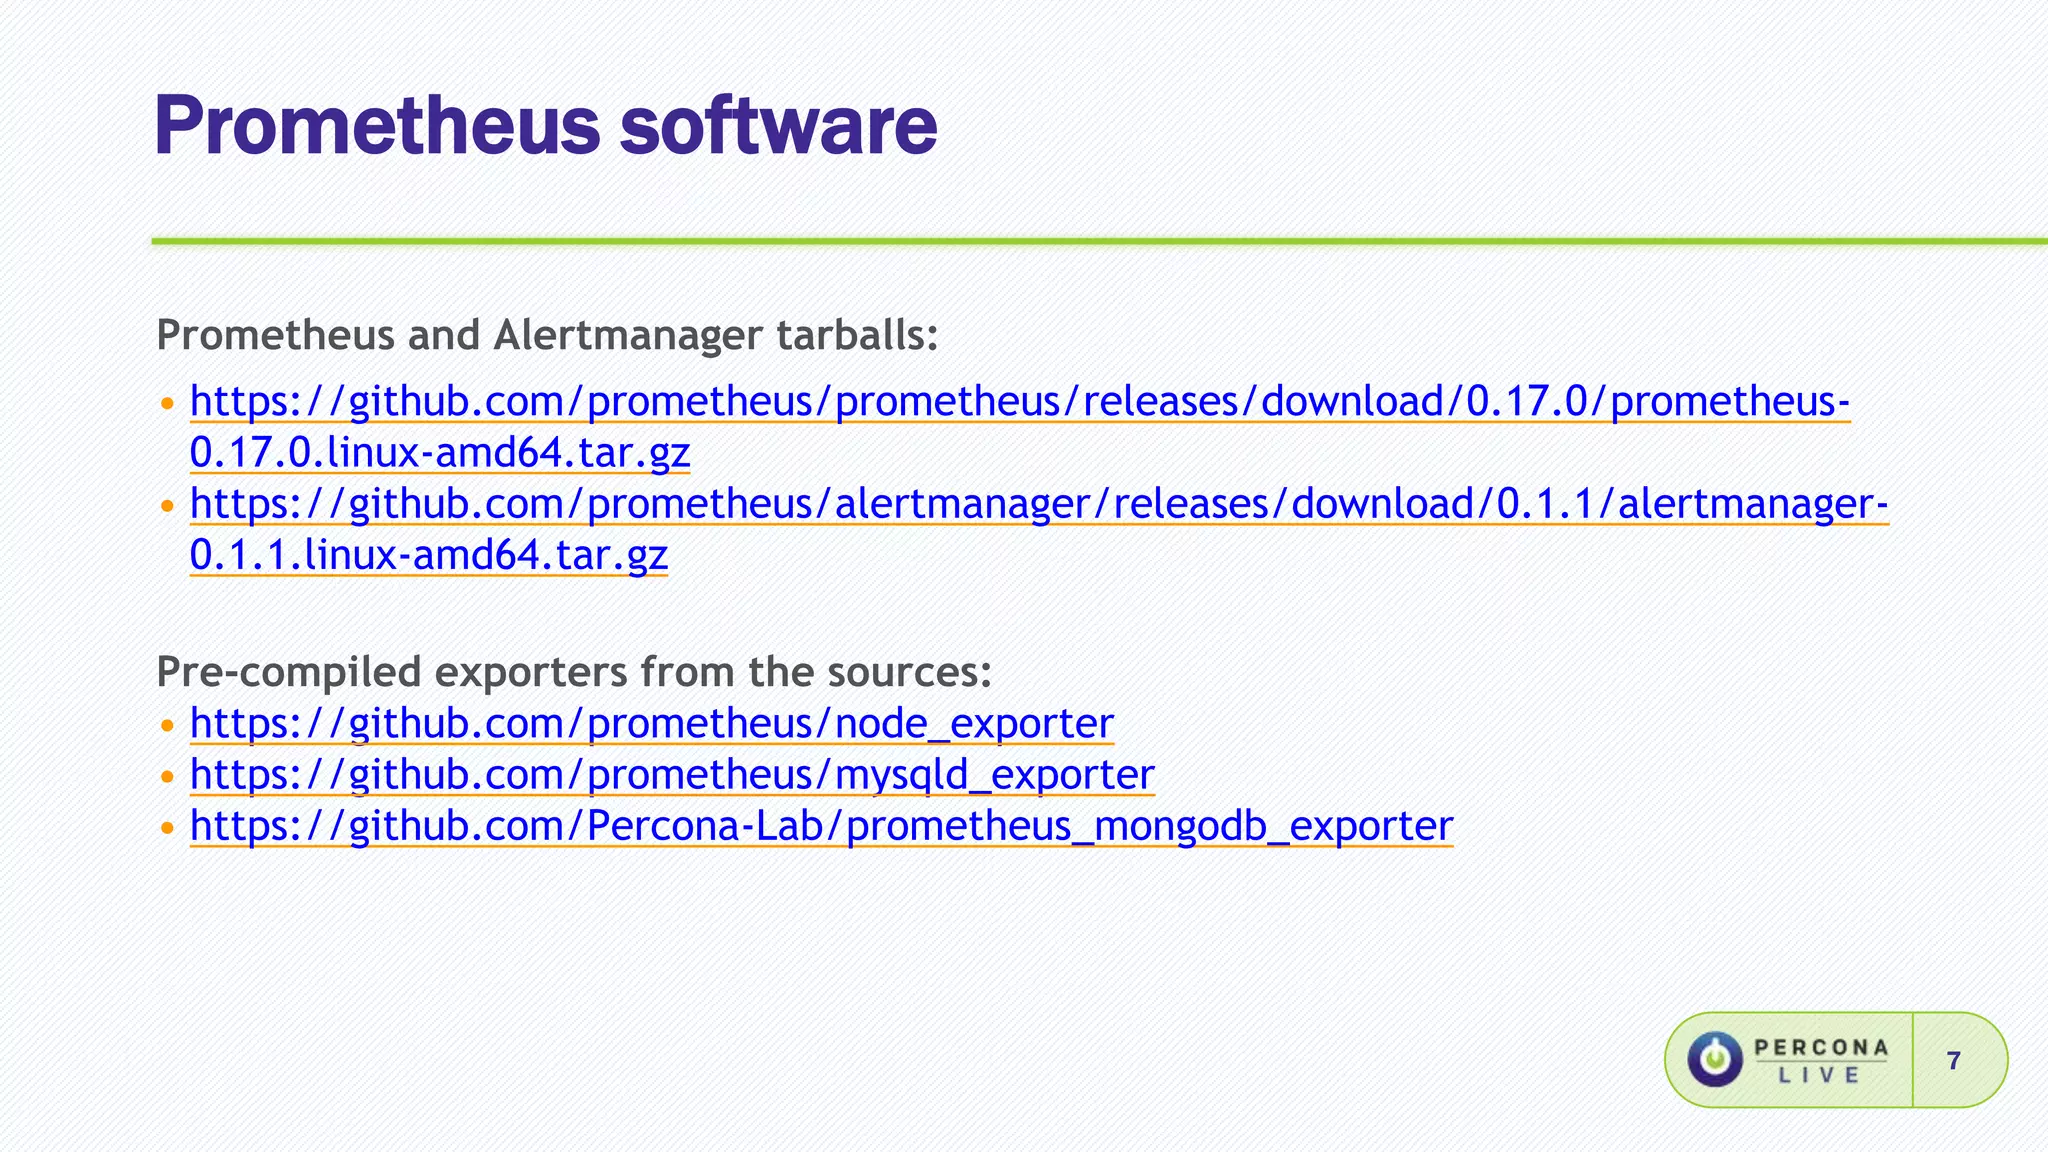
Steps to install necessary packages, Prometheus, Grafana, InfluxDB, and exporters from online repositories.
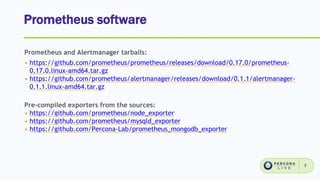
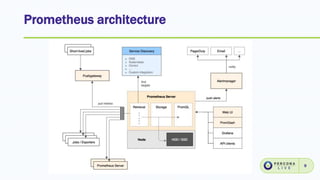
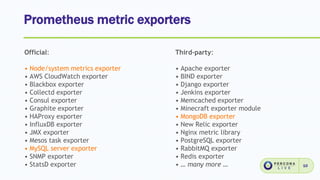
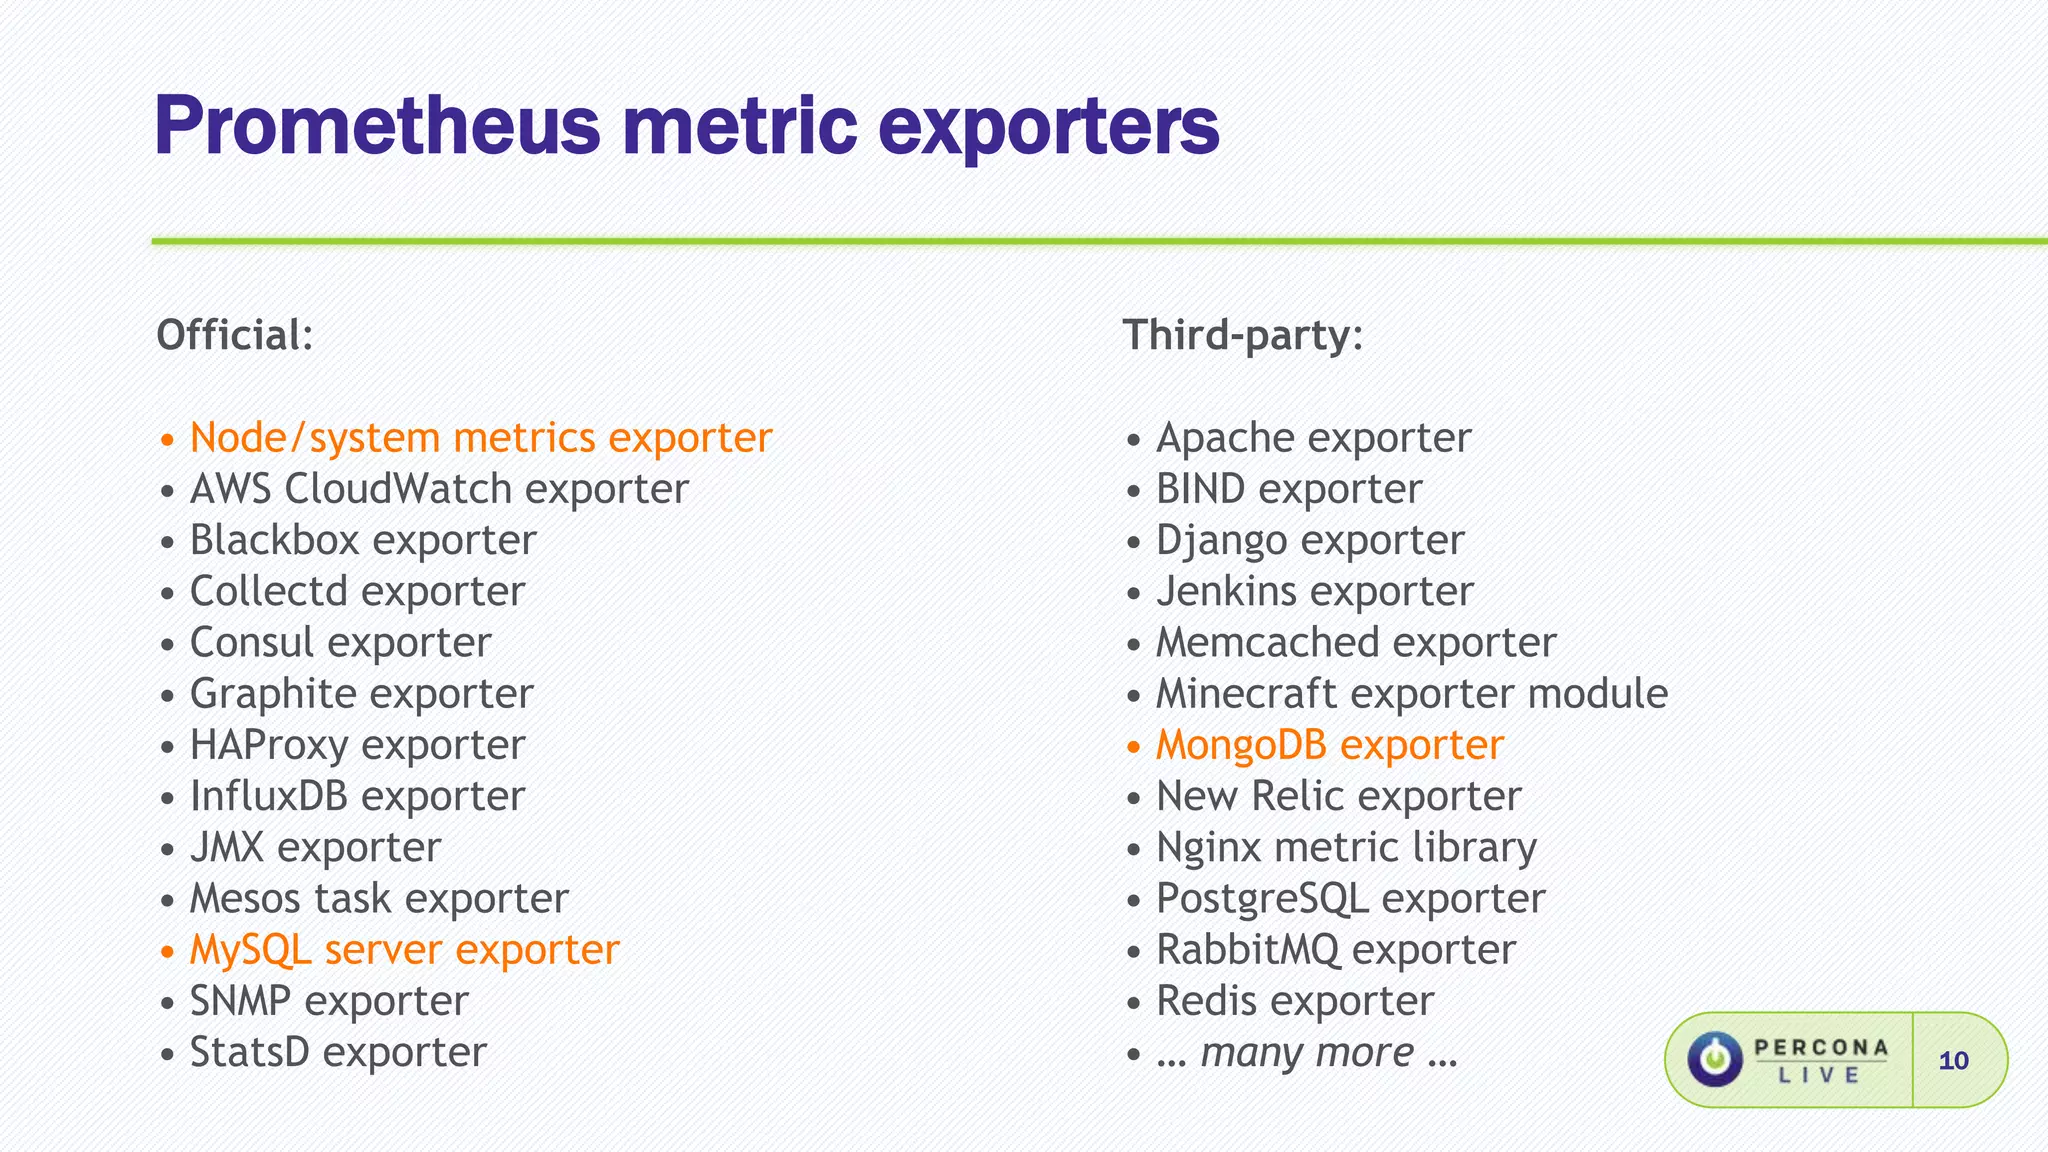
Introduction to Prometheus as an open-source monitoring system, its architecture, and metric exporters.
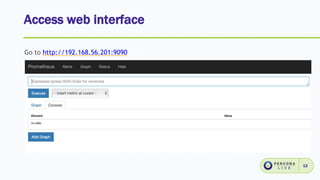
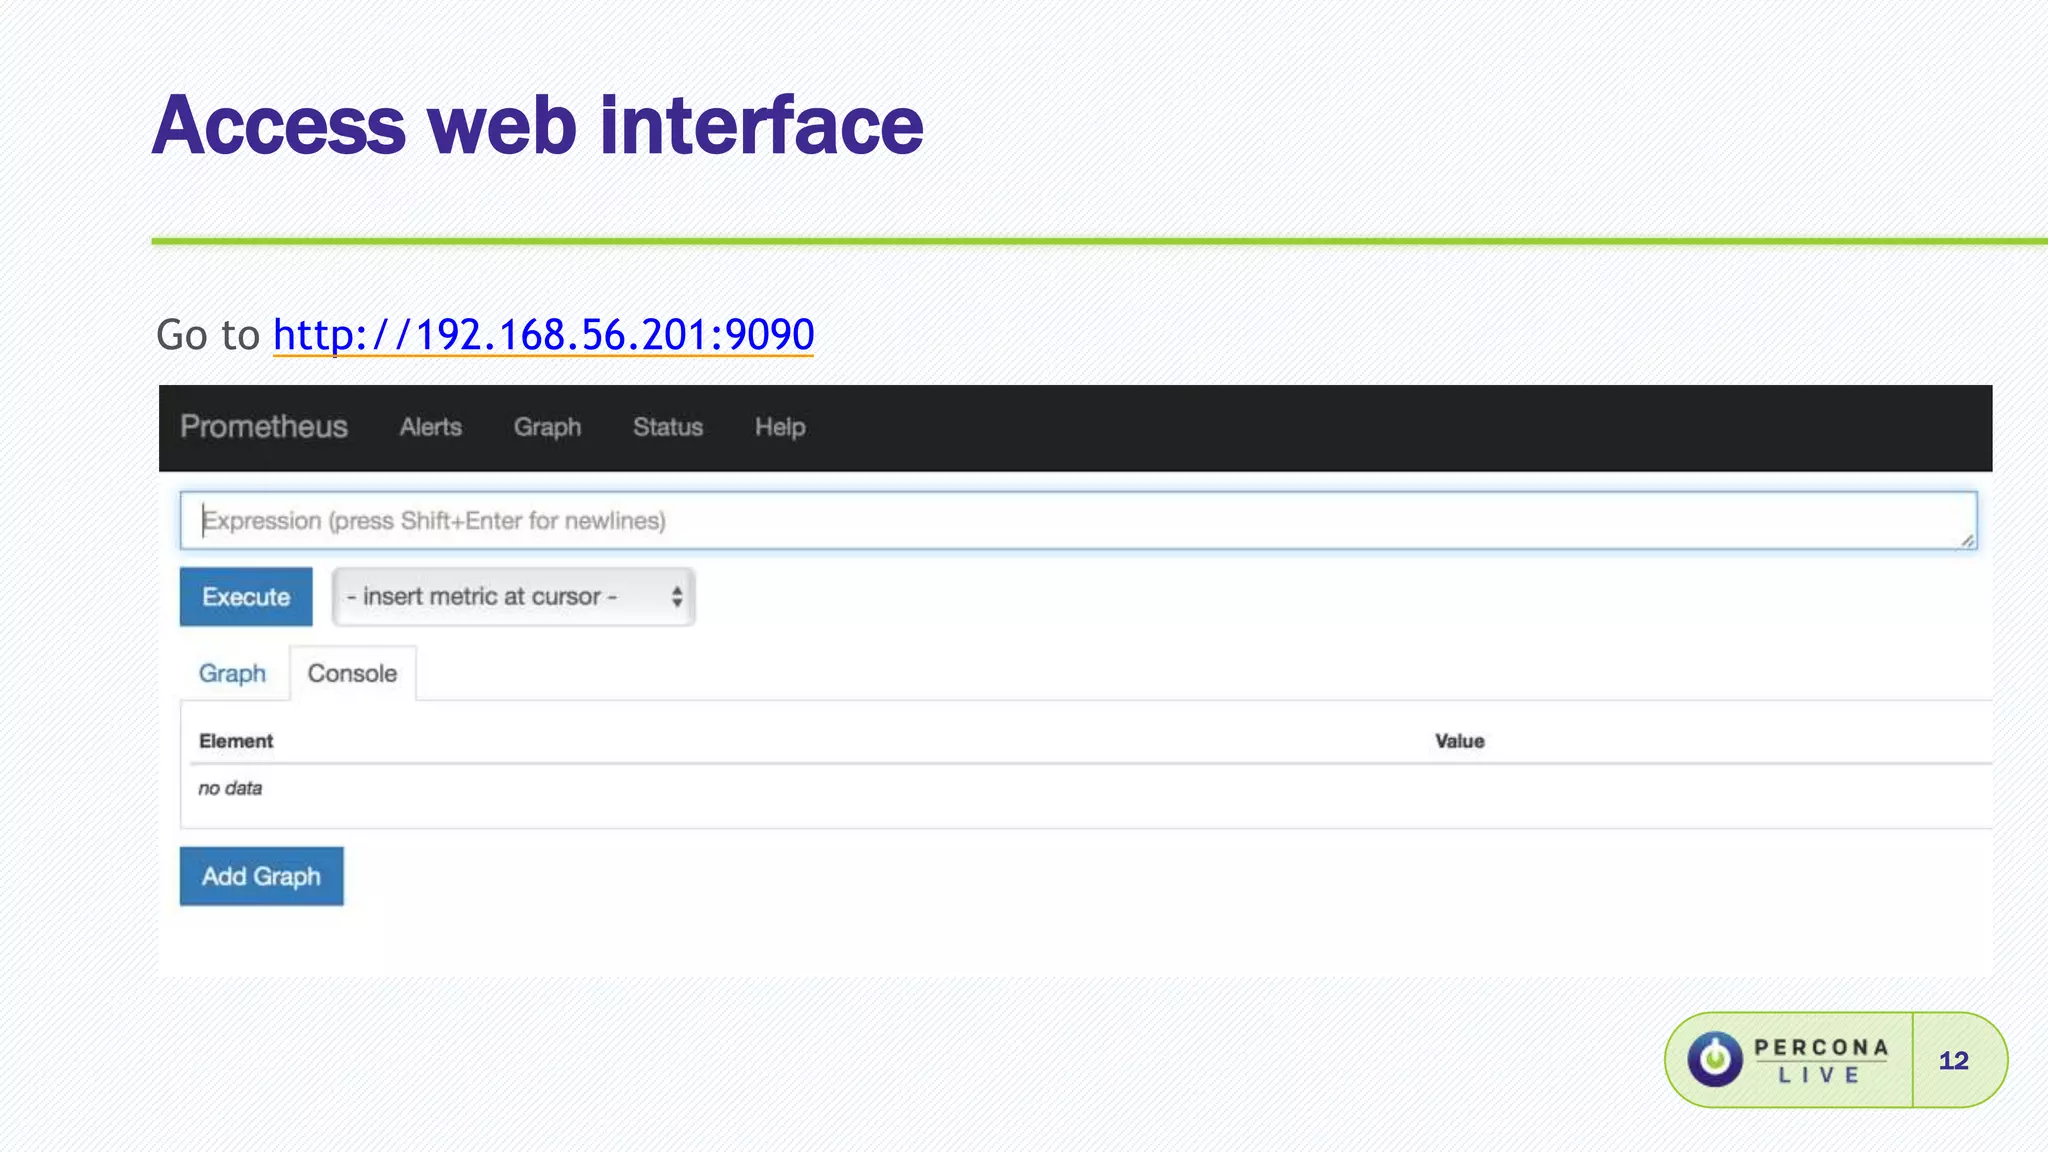
Instructions to start Prometheus and access its web interface for monitoring setup.
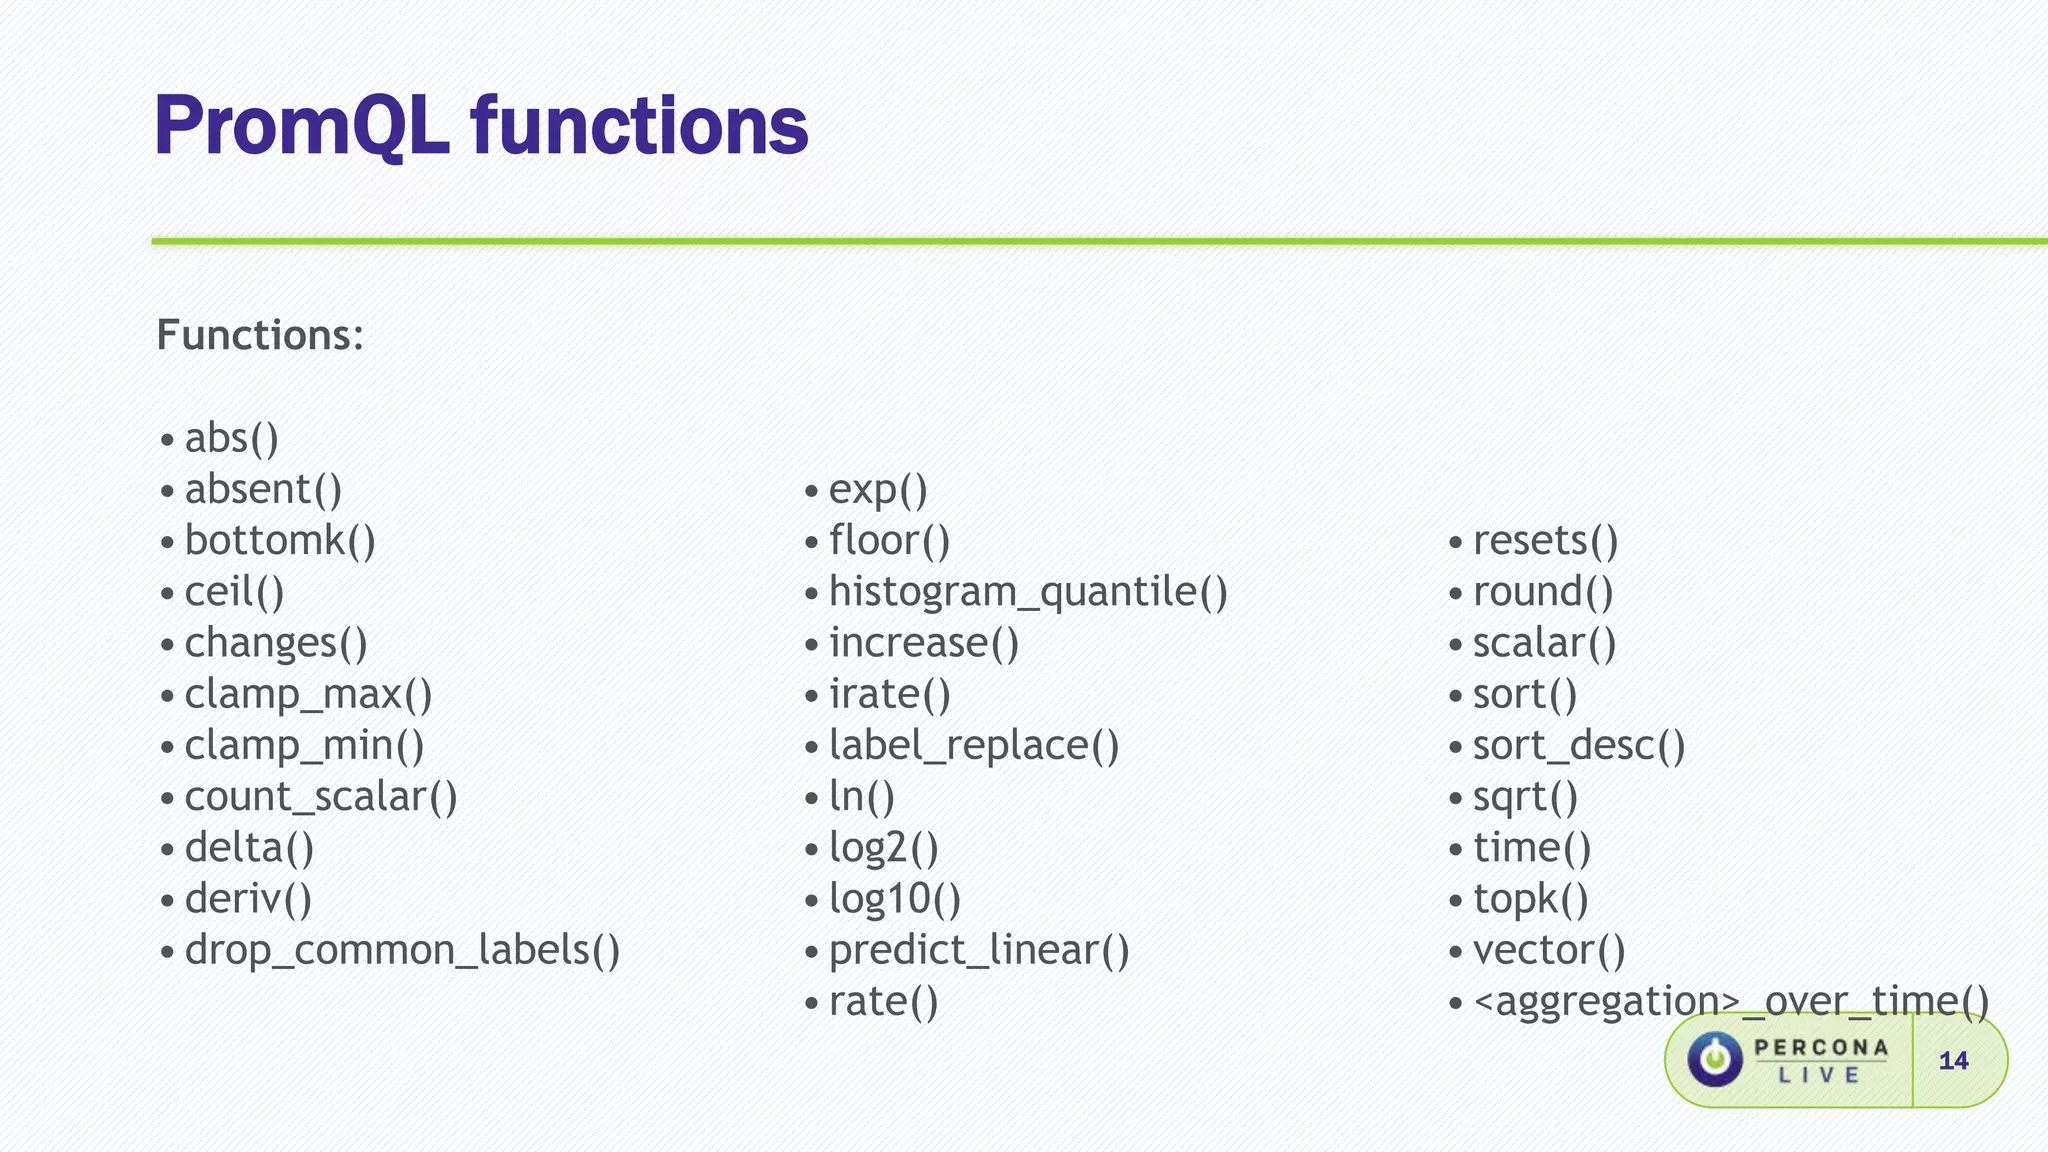
Details on using PromQL for querying time series data and functions available for data manipulation.
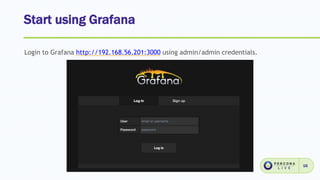
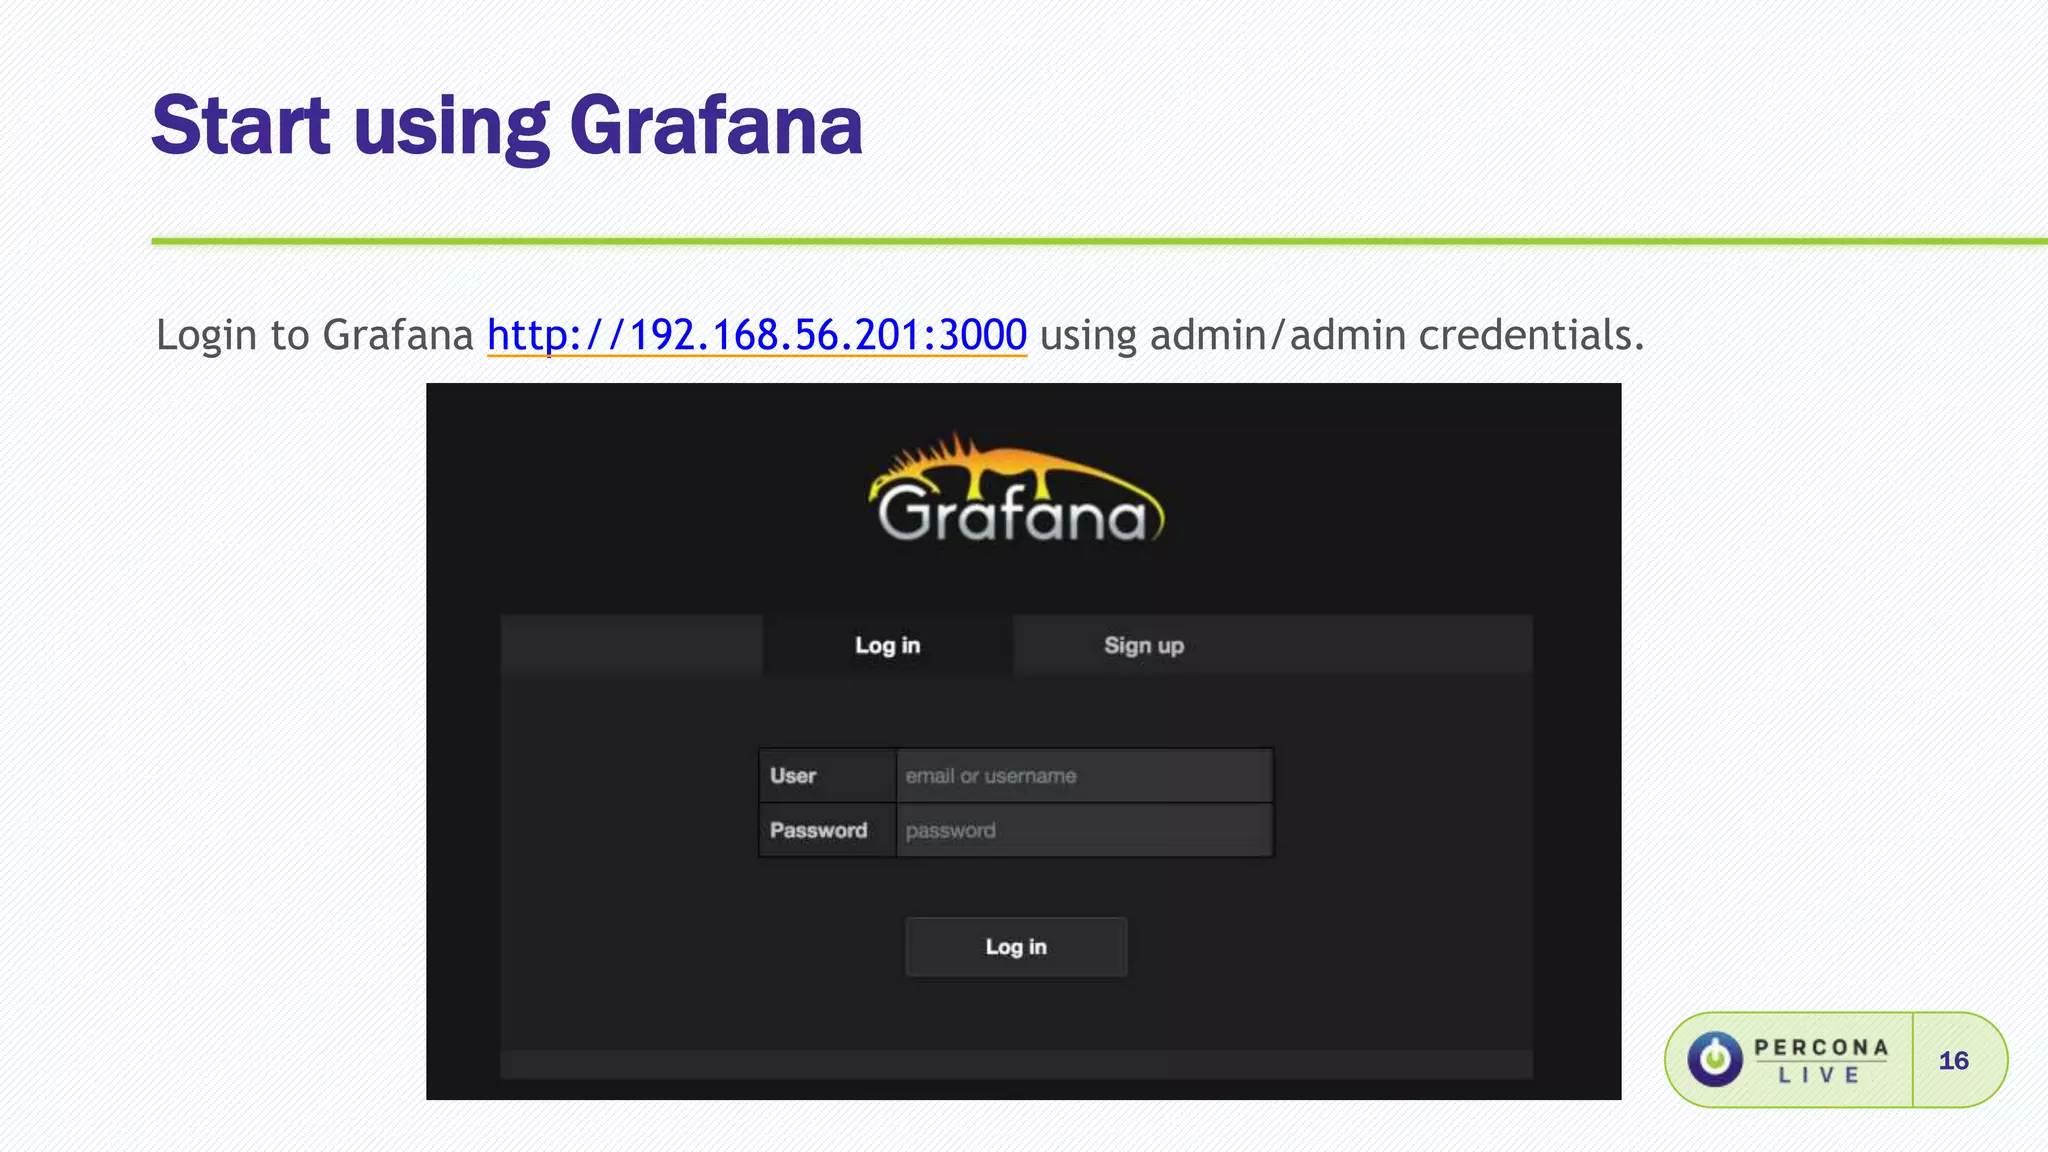
Introduction to Grafana as a metrics dashboard, steps to log in, and apply necessary patches.
Installation of Percona Grafana dashboards for monitoring MySQL and system performance.
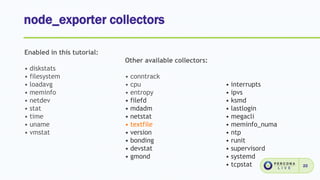
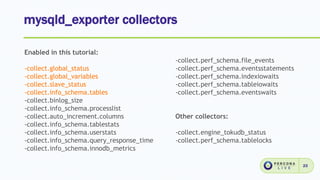
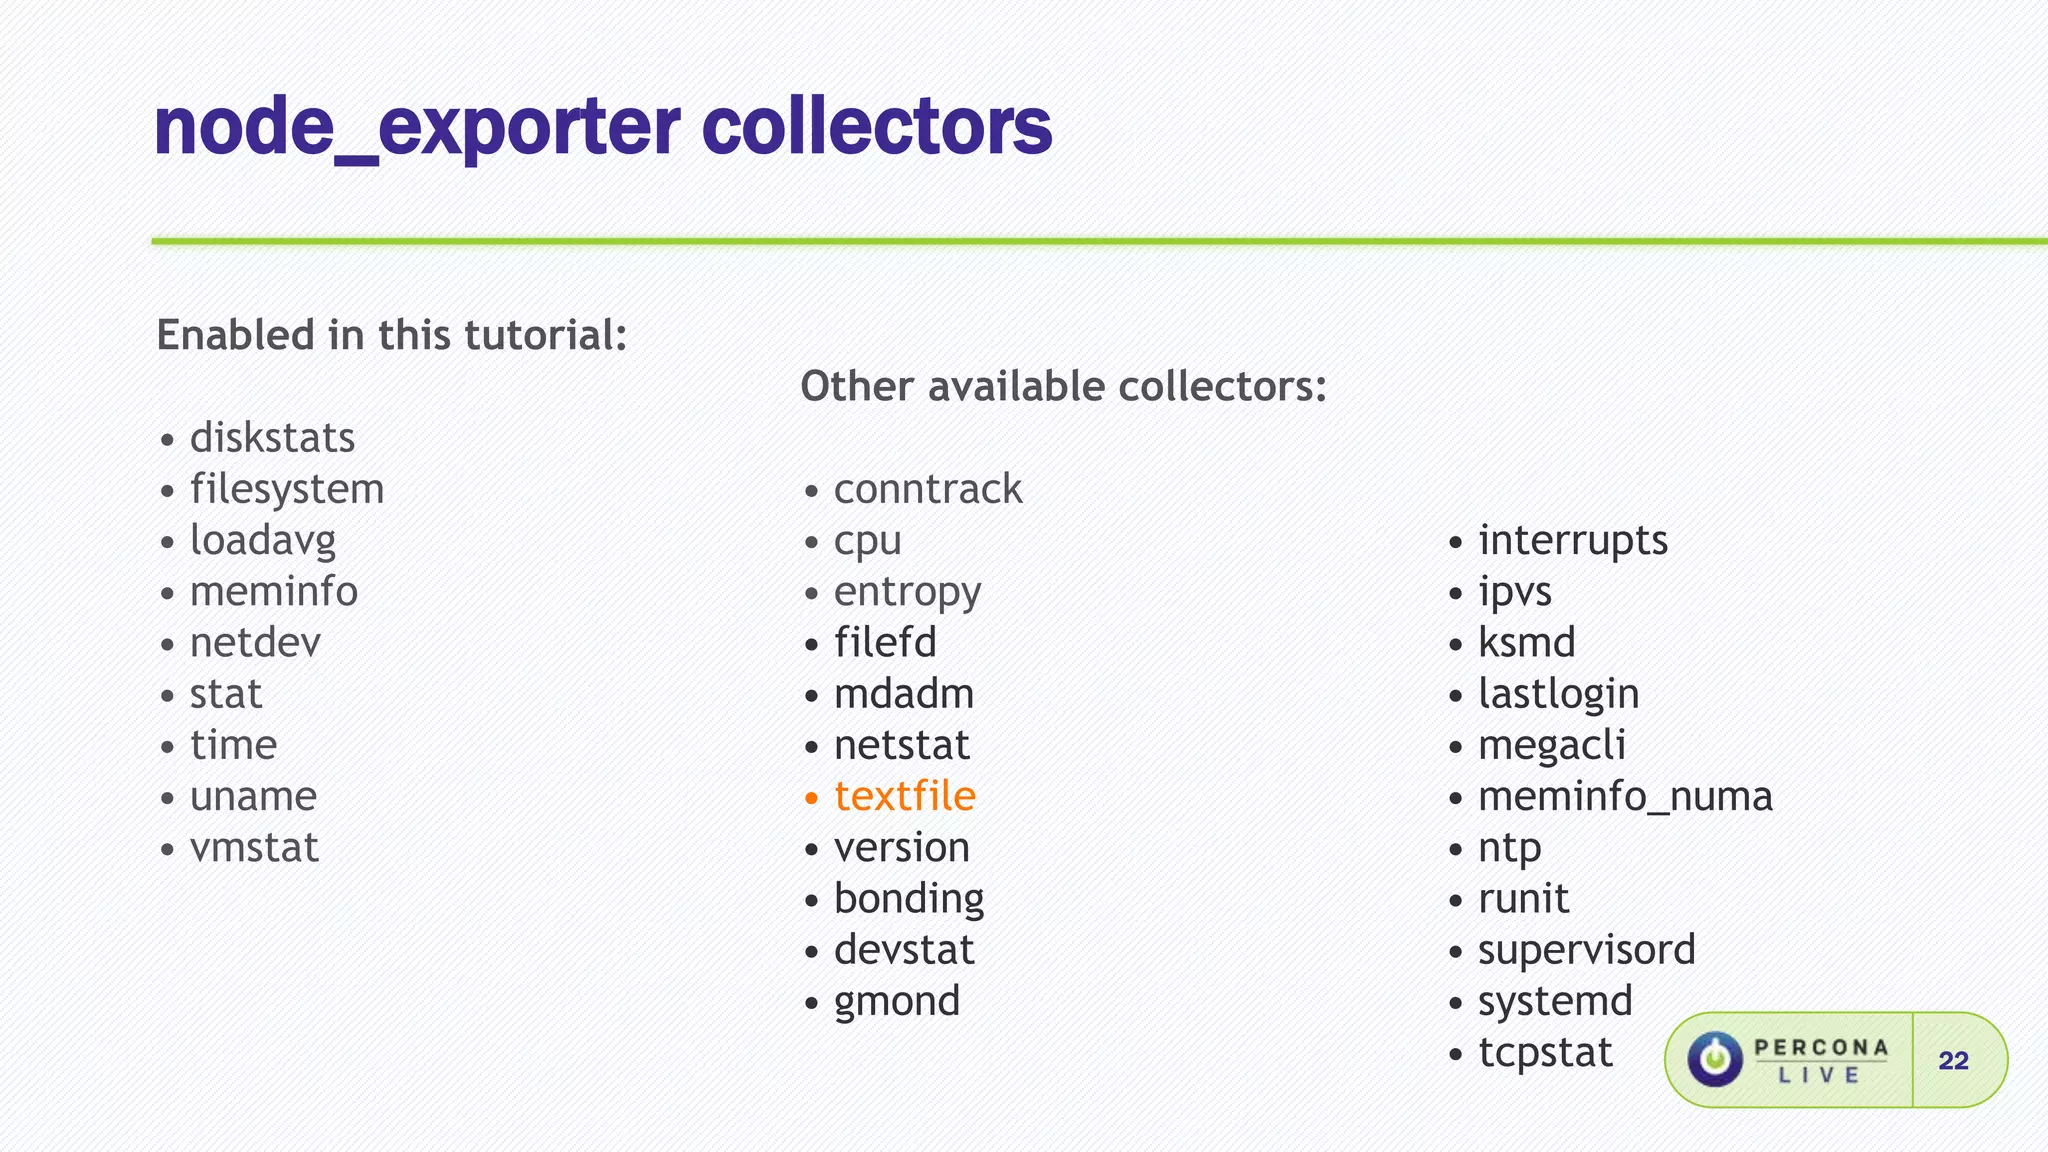
Details on enabled node_exporter collectors for tracking various system metrics.
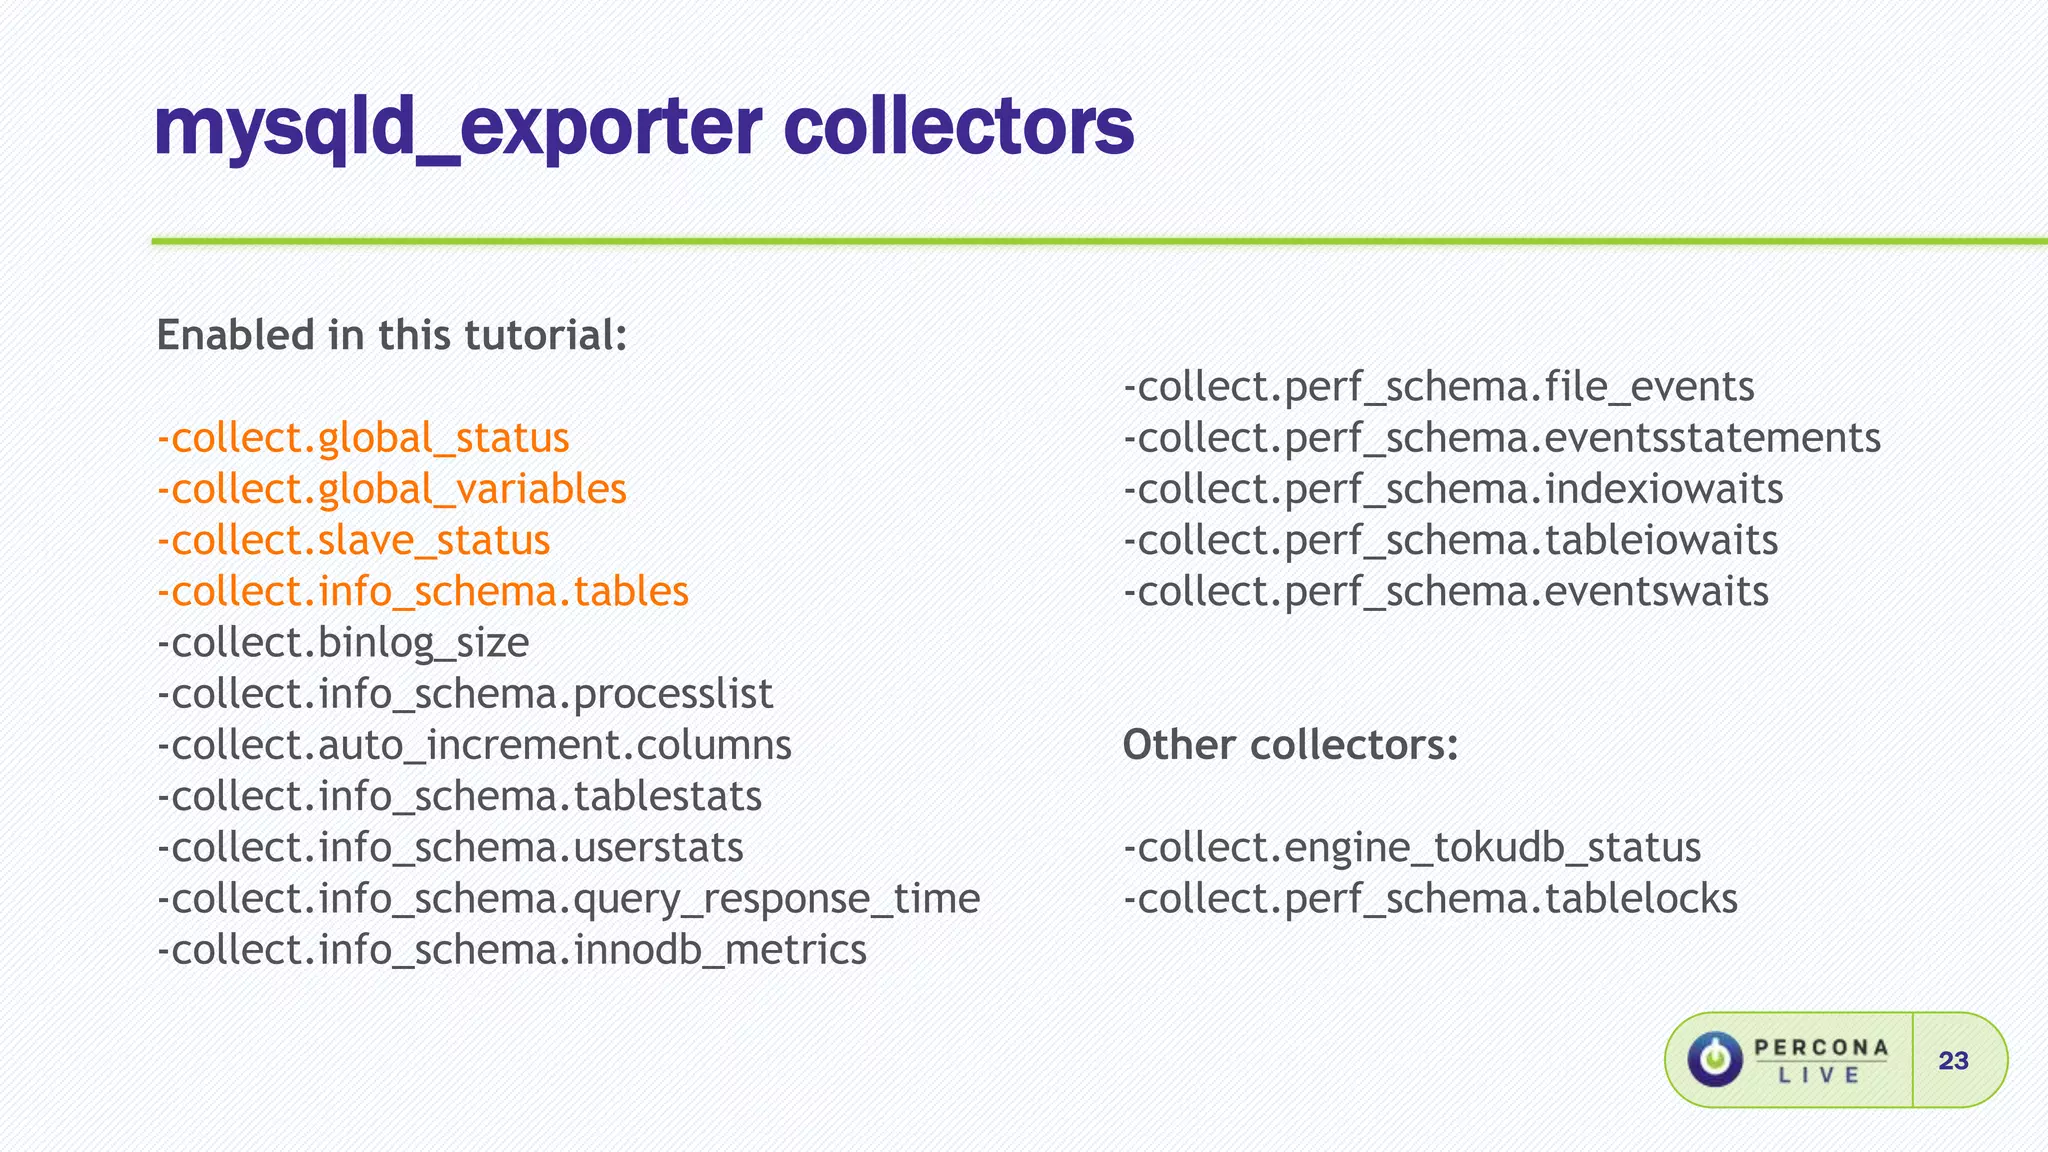
Instructions on enabling mysqld_exporter collectors and requirements for connecting to MySQL.
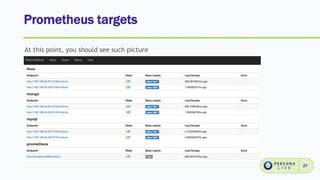
Verifying the status of exporters, Prometheus targets, and monitoring system metrics.
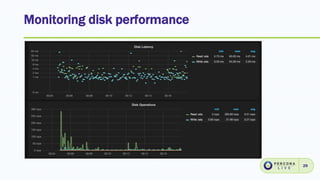
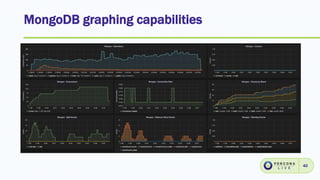
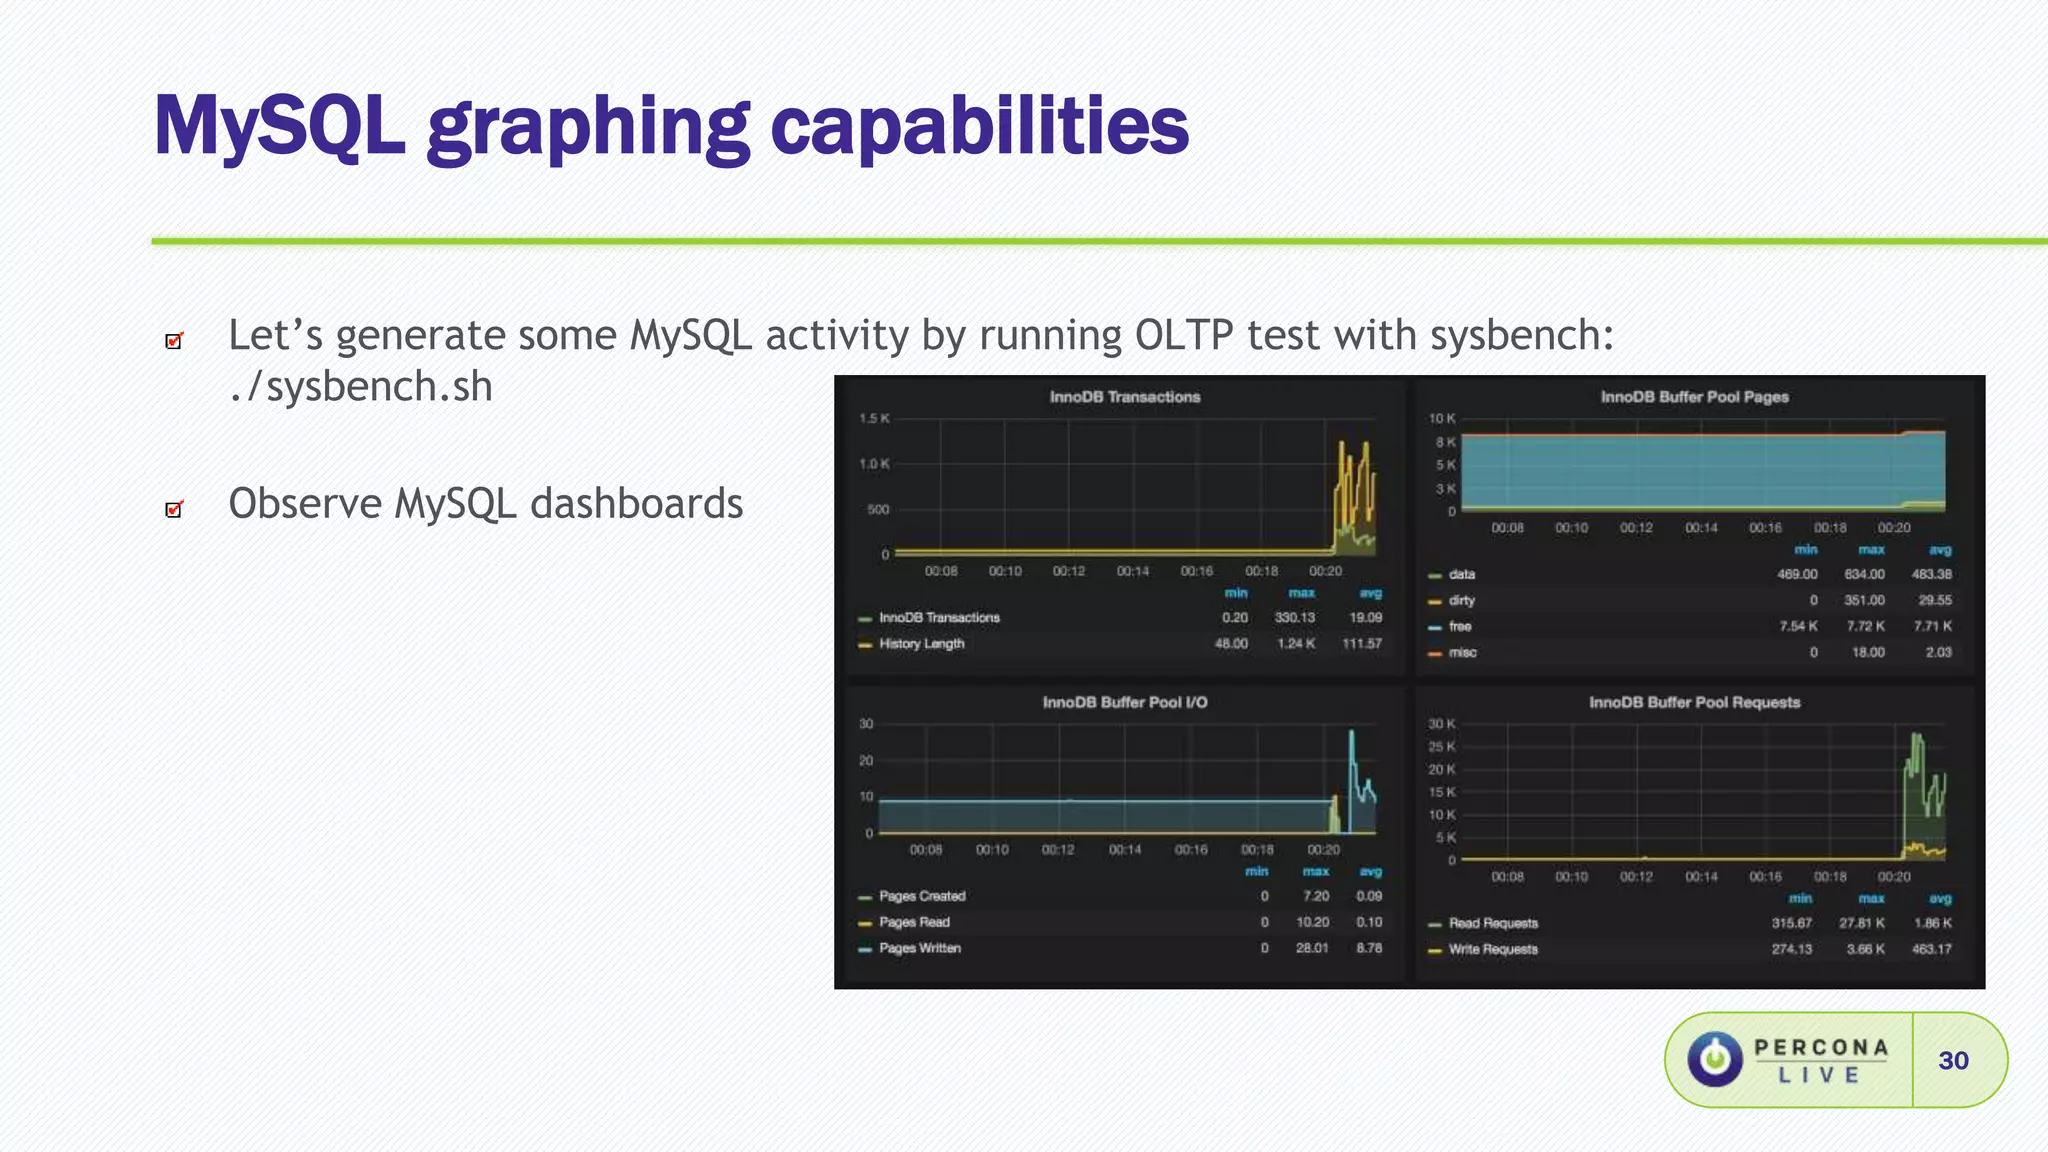
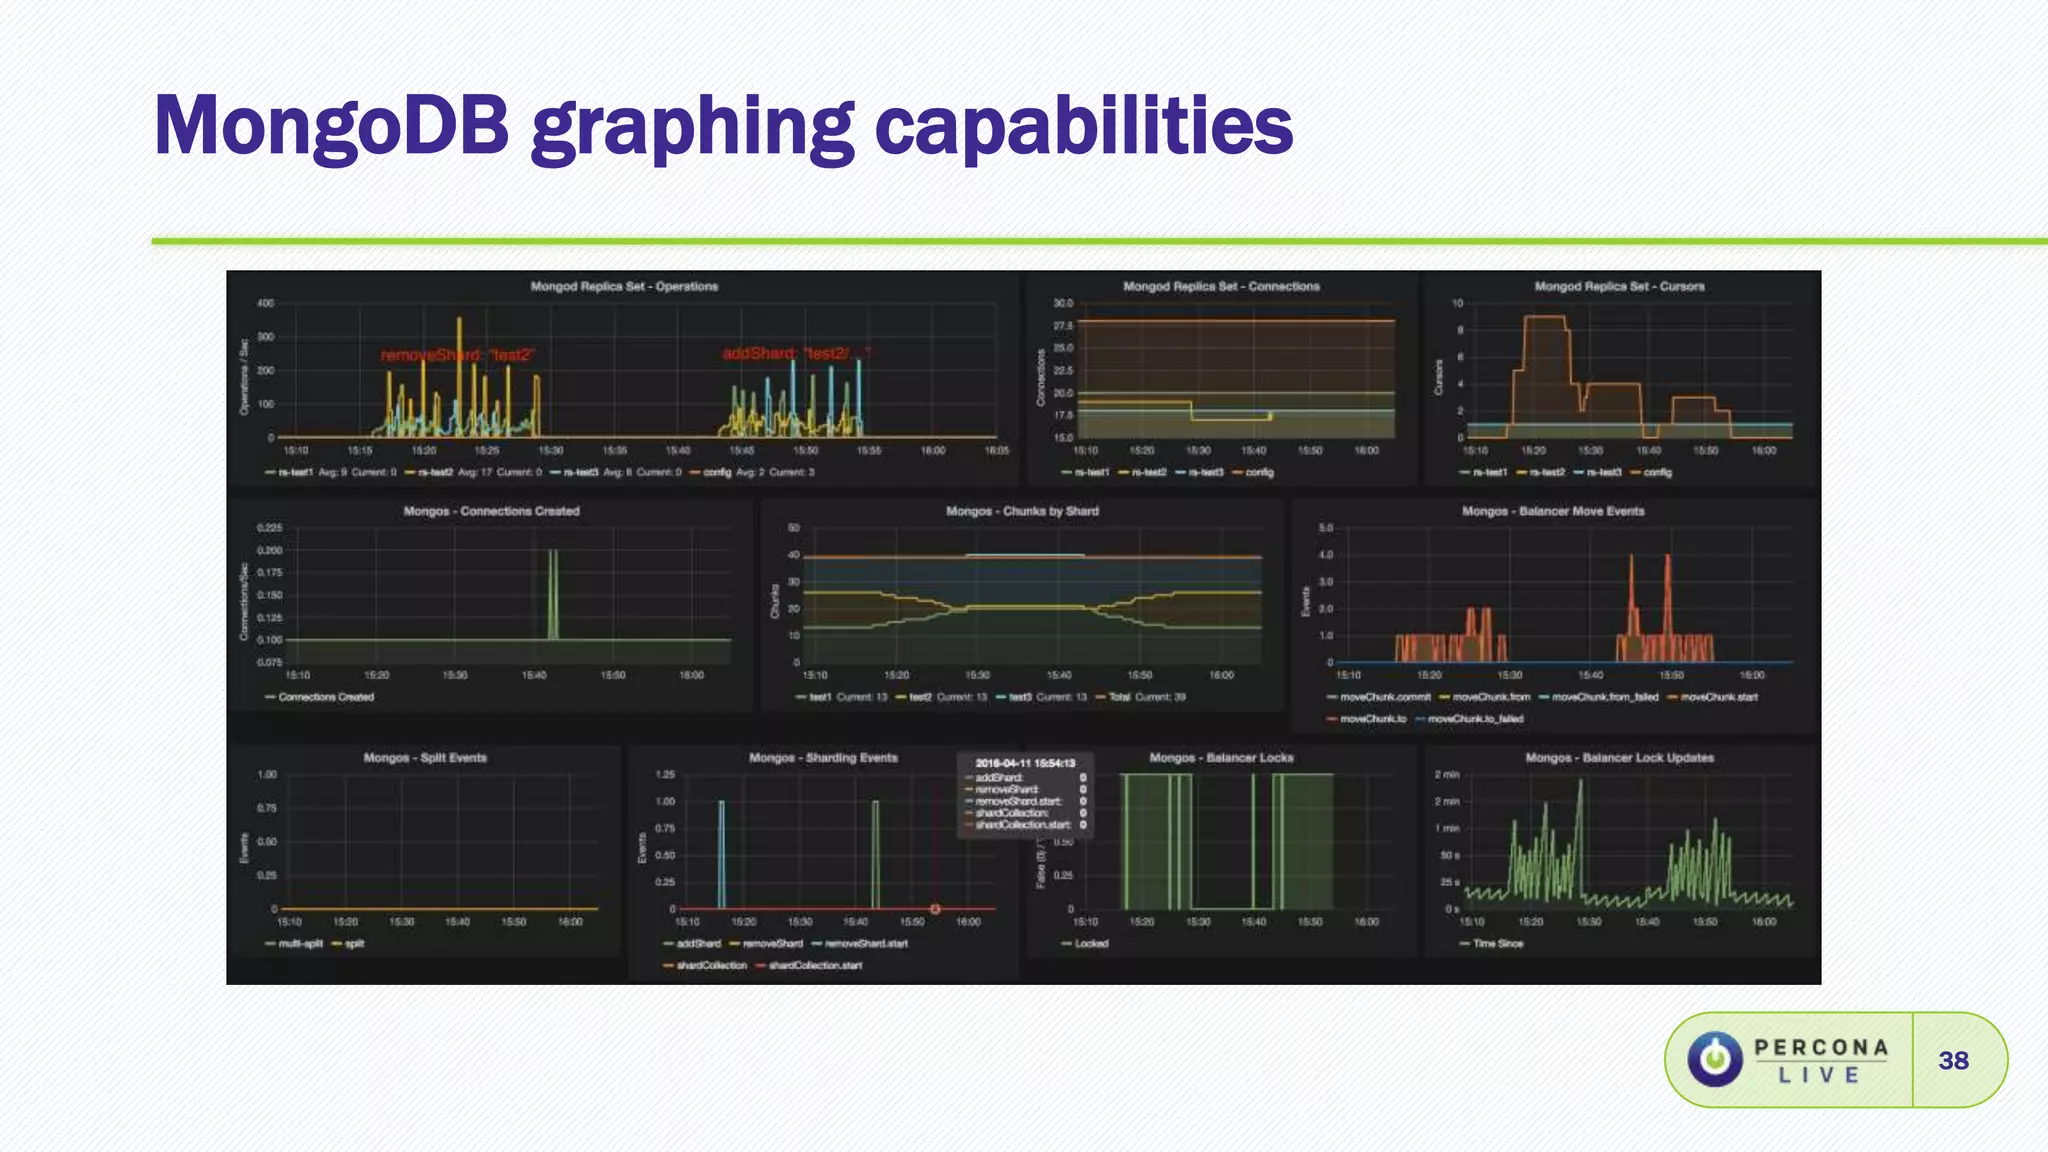
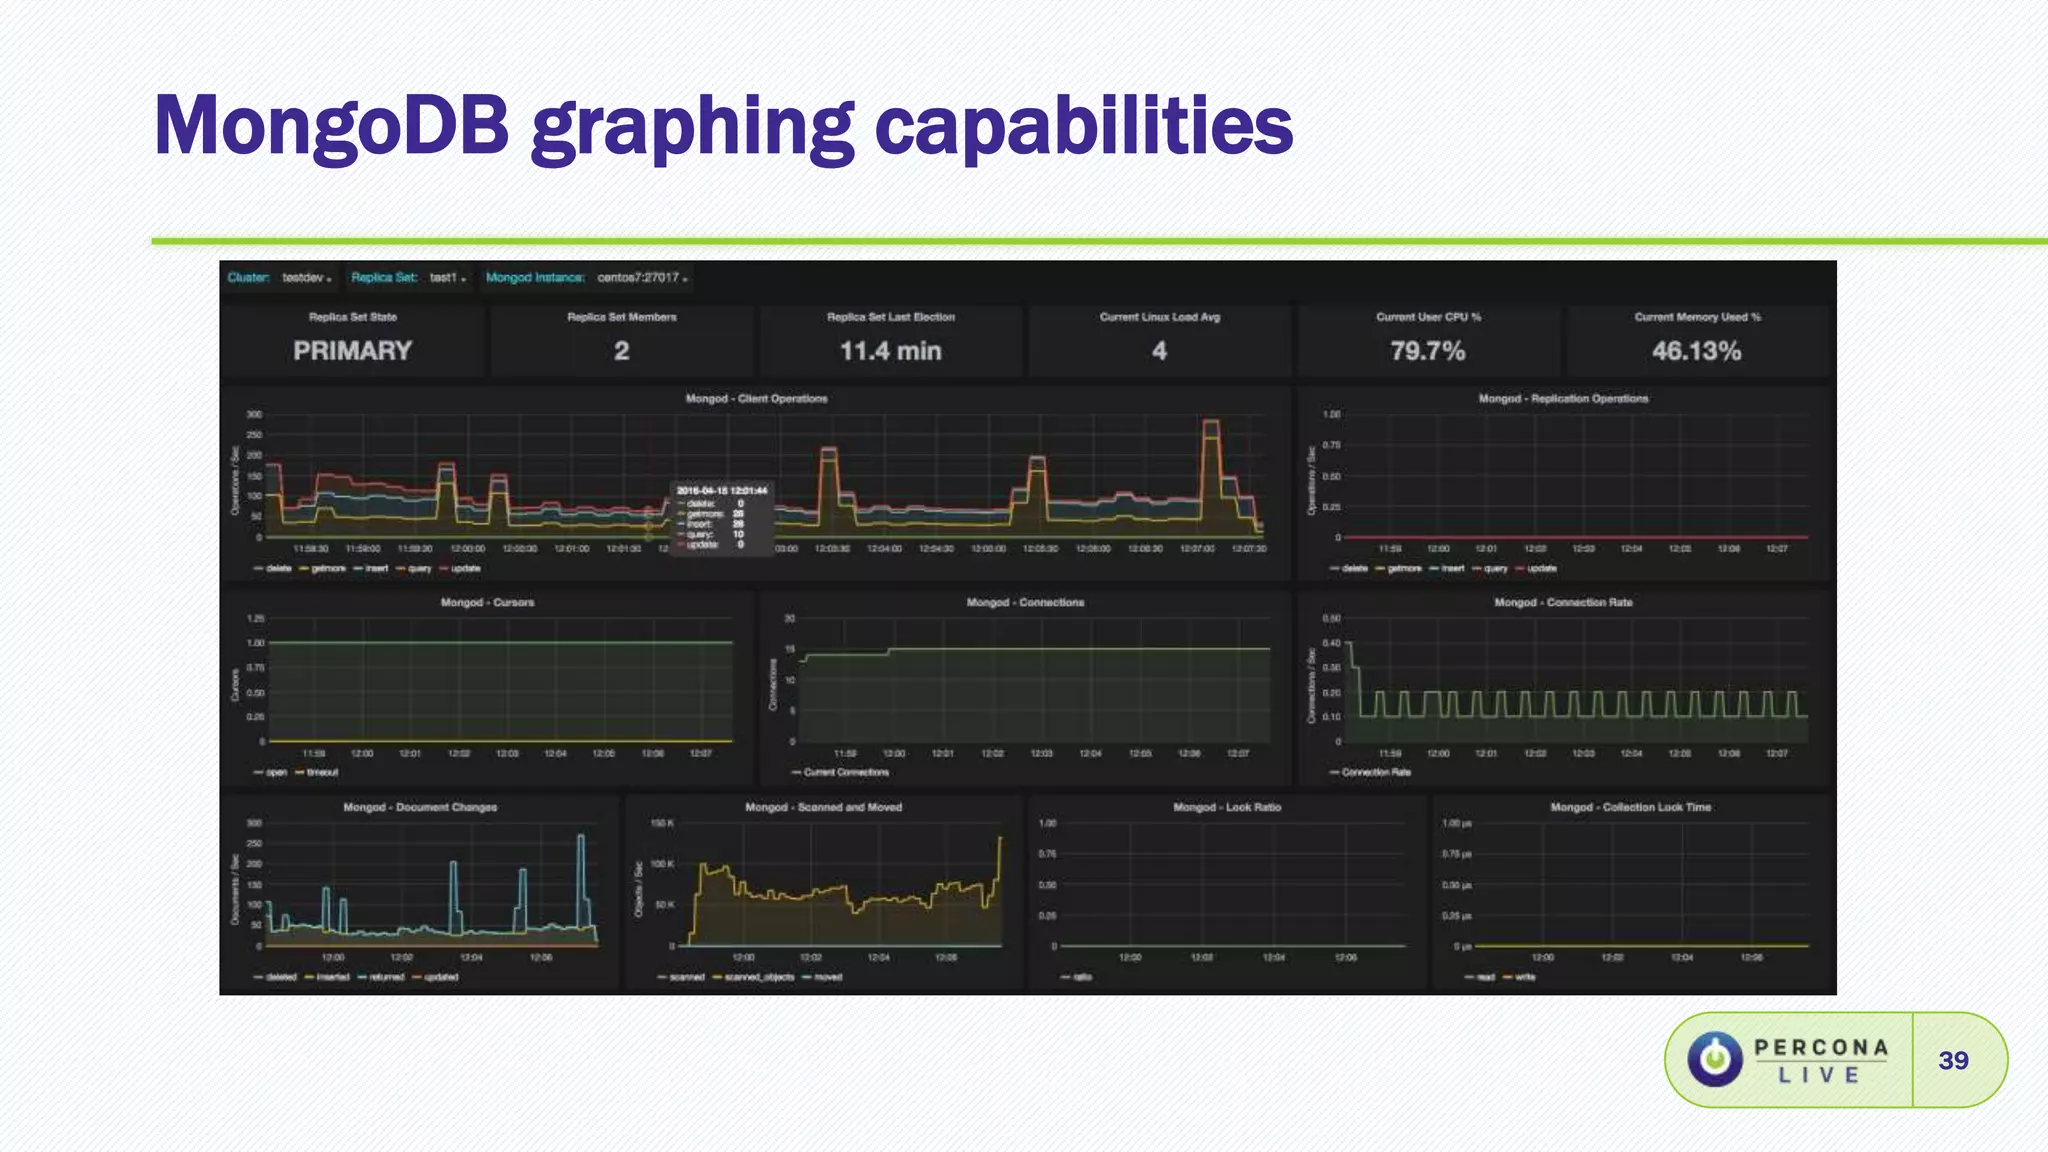
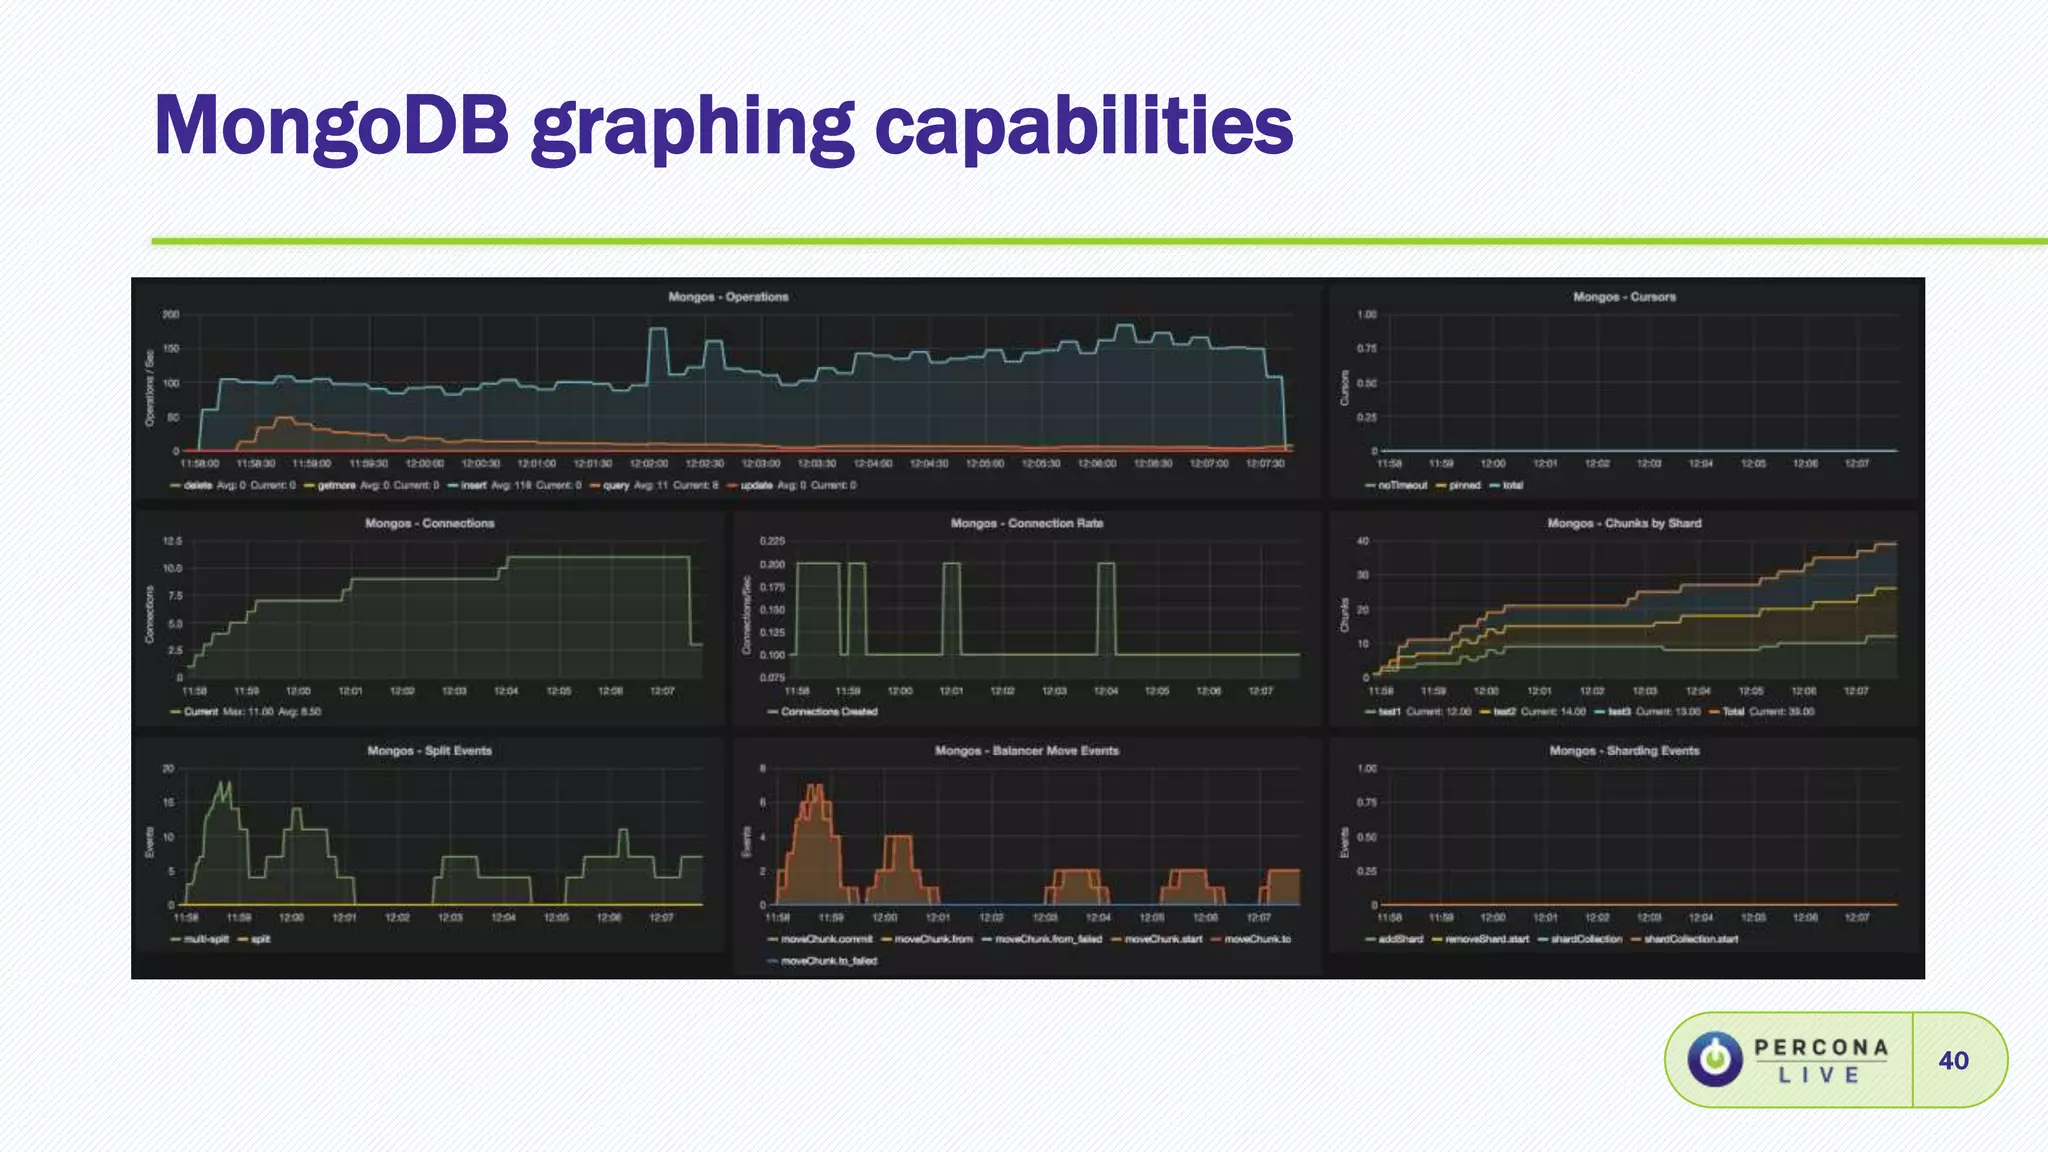
Explaining graphing capabilities for MySQL and MongoDB, with examples of metrics gathered.
Summary of metrics collected by MongoDB exporter and the structure for organizing them.
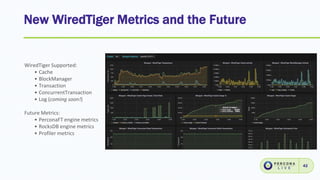
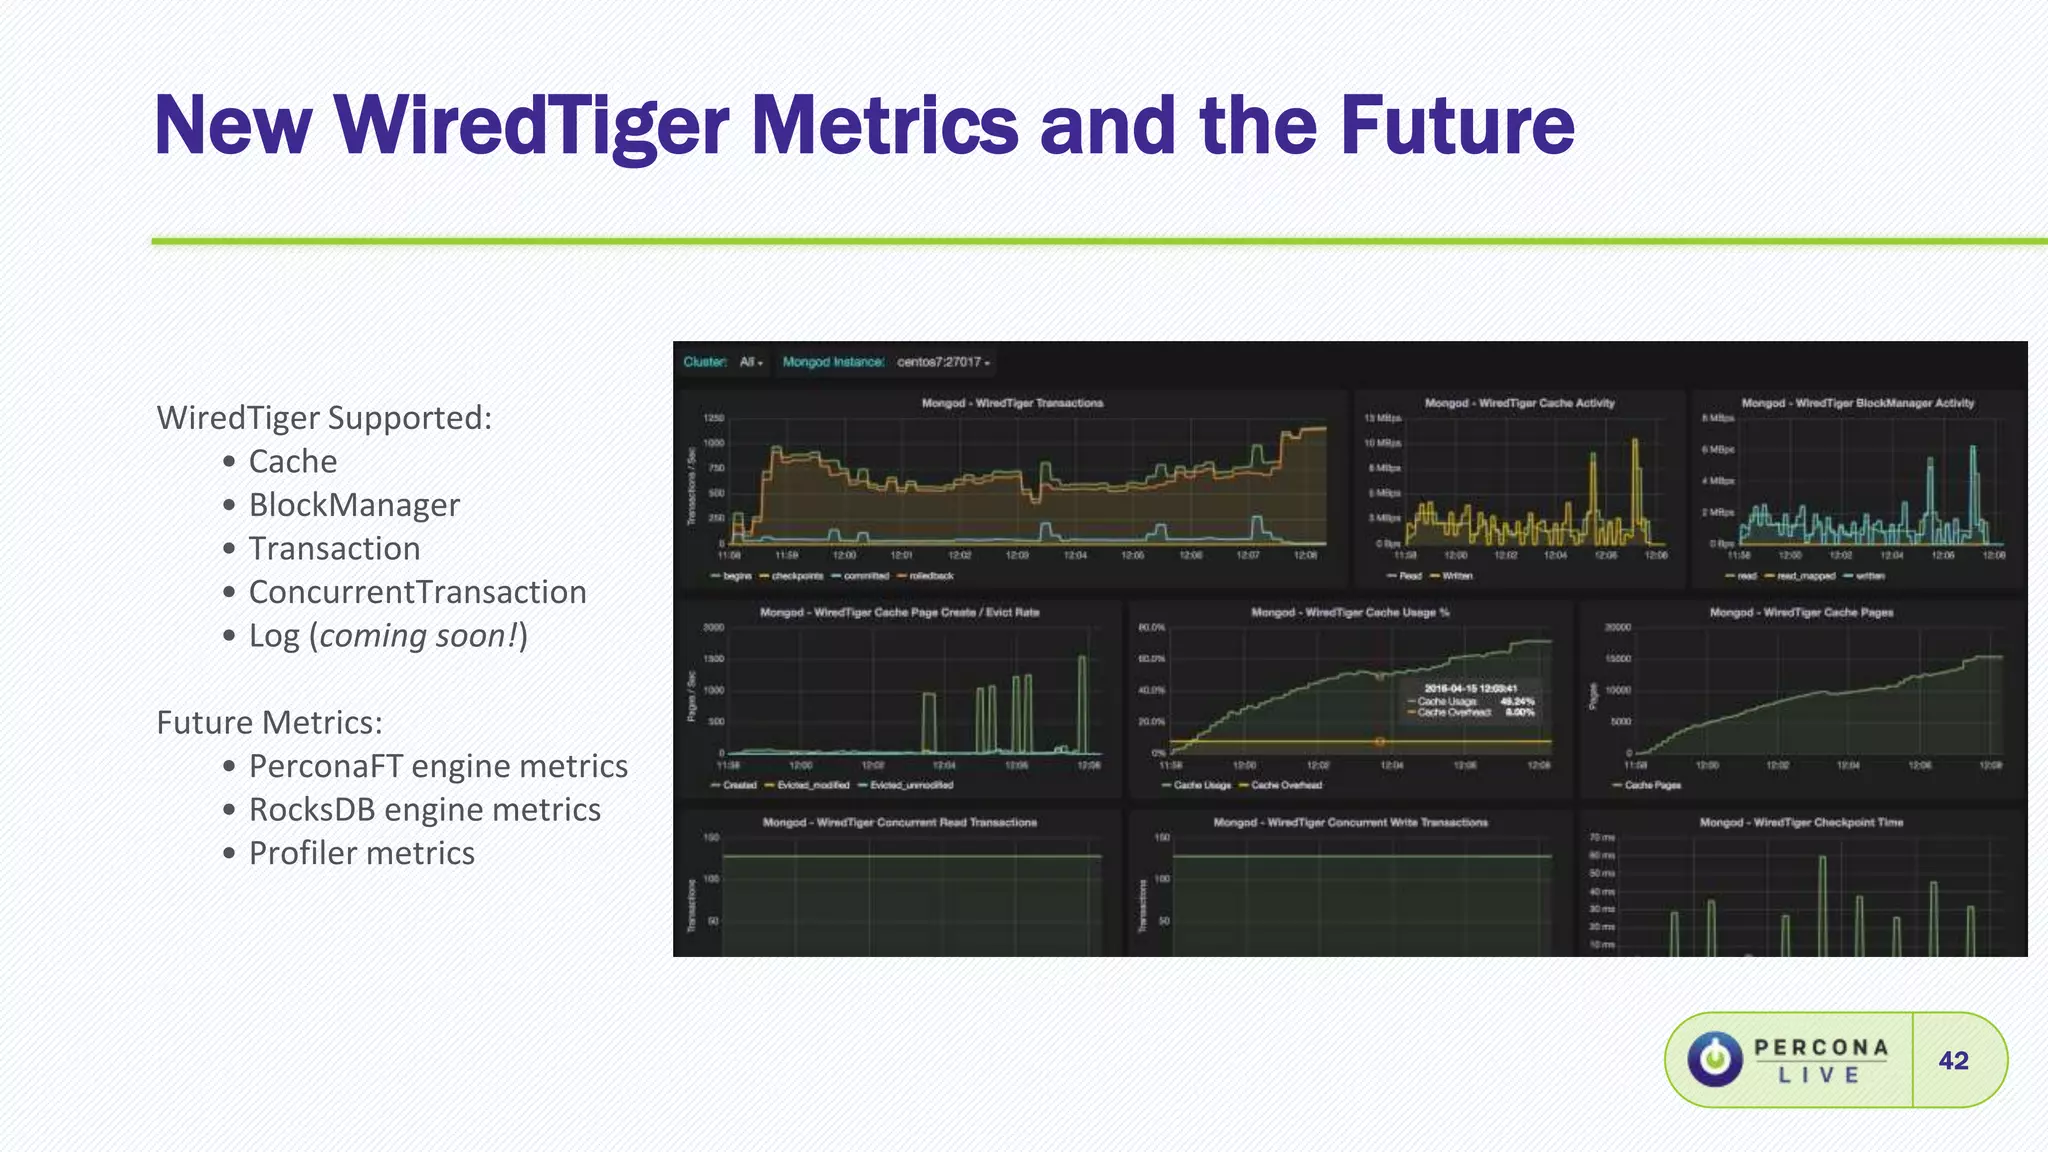
Discussion on future WiredTiger metrics and ongoing developments.
Overview of steps to make a Go-based Prometheus exporter focusing on metric collection.
Introduction to setting alerting rules, configuring Alertmanager, and managing alerts.
Instructions on the use of Prometheus HTTP API for querying and managing metrics.
Overview of InfluxDB's role as a time-series database for Prometheus with setup instructions.
Discussion points on potential future features of Grafana and Prometheus, followed by Q&A.
Roman Vynar, TimVaillancourt
Percona
Open Source Monitoring for MySQL and MongoDB with
Grafana and Prometheus
2.
Agenda
2
This is ahands-on tutorial on setting up the monitoring and graphing for MySQL and MongoDB
servers using Prometheus monitoring system and time-series database with Grafana feature
rich metrics dashboard.
• Prometheus overview
• Prometheus metric exporters
• Queries and expressions on Prometheus DB
• Grafana overview
• Creating graphs and dashboards in Grafana
• MySQL graphing capabilities
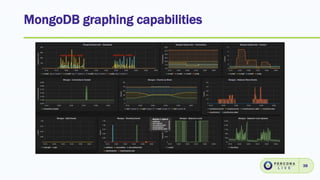
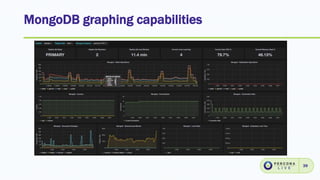
• MongoDB graphing capabilities
• Creating alerts in Prometheus
• Using Alertmanager for getting notifications
• Working with Prometheus HTTP API
• Using InfluxDB with Prometheus as a long-term storage option
3.
Virtualbox preparation
3
There isan appliance containing two pre-installed virtual machines:
• db1.vm - monitor and master db server
• db2.vm - slave db server
Copy the files from USB stick provided to your laptop
Double-click on the .OVA file to import appliance into Virtualbox
4.
Virtualbox network
4
Each instanceis configured with 2 network adapters:
• Host-only adapter
• NAT
Configure host-only network from the main menu:
Virtualbox > Preferences > Network > Host-only Networks > “vboxnet0” or “Virtualbox Host-
Only Ethernet Adapter” > edit and set: 192.168.56.1 / 255.255.255.0
Windows users only: open Setting > Network and click OK to re-save host-only network
adapter.
5.
Starting VMs
5
Internal staticIP addresses assigned:
• db1.vm - 192.168.56.201
• db2.vm - 192.168.56.202
Both instances are running CentOS 7 and have all the necessary packages pre-installed.
Unix and MySQL root password: PerconaLive_123
Start both machines
Verify network connectivity
IMPORTANT! The system time should be in sync:
systemctl restart ntpd.service
Prometheus overview
8
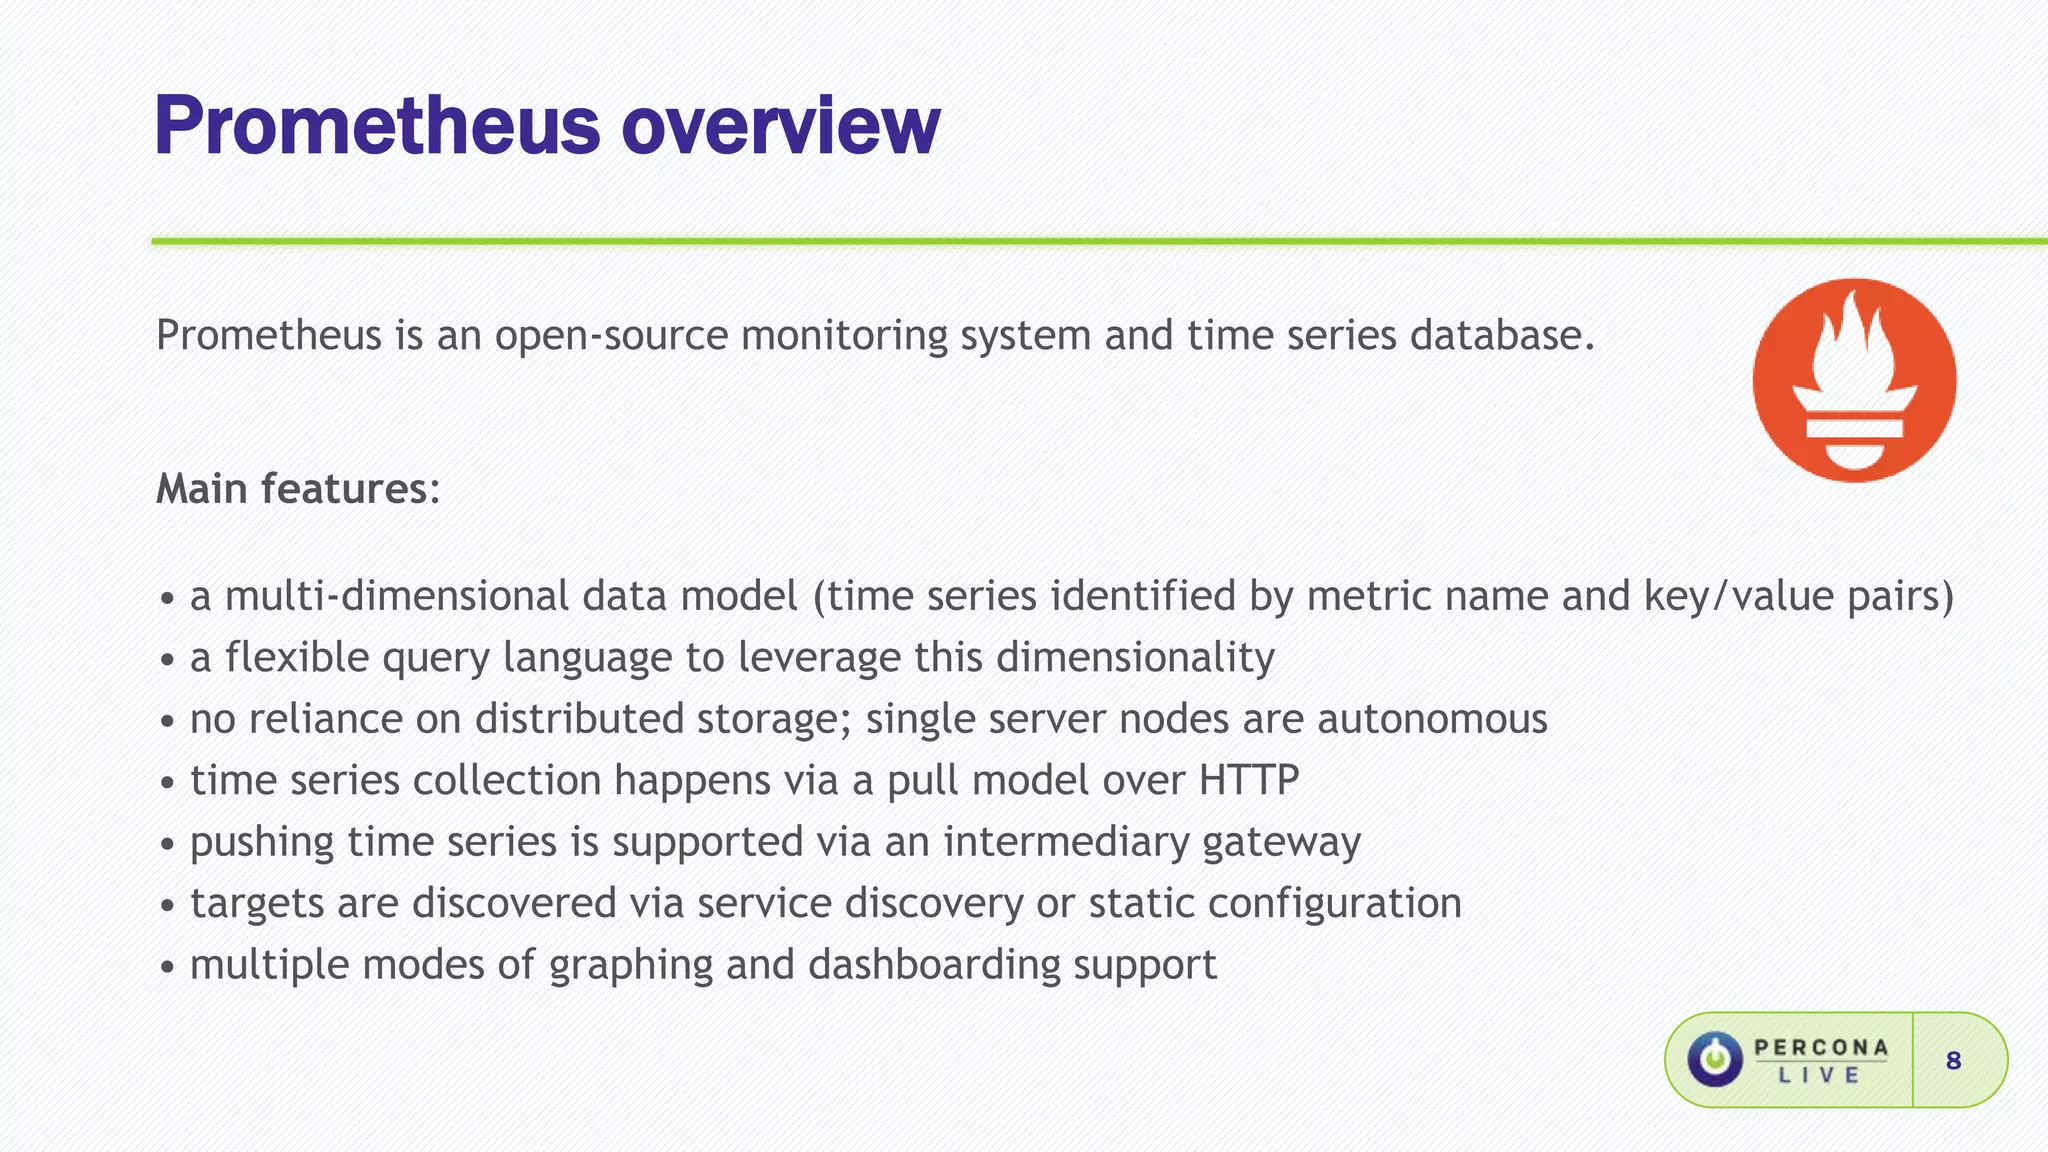
Prometheus isan open-source monitoring system and time series database.
Main features:
• a multi-dimensional data model (time series identified by metric name and key/value pairs)
• a flexible query language to leverage this dimensionality
• no reliance on distributed storage; single server nodes are autonomous
• time series collection happens via a pull model over HTTP
• pushing time series is supported via an intermediary gateway
• targets are discovered via service discovery or static configuration
• multiple modes of graphing and dashboarding support
Start Prometheus
11
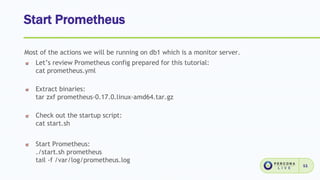
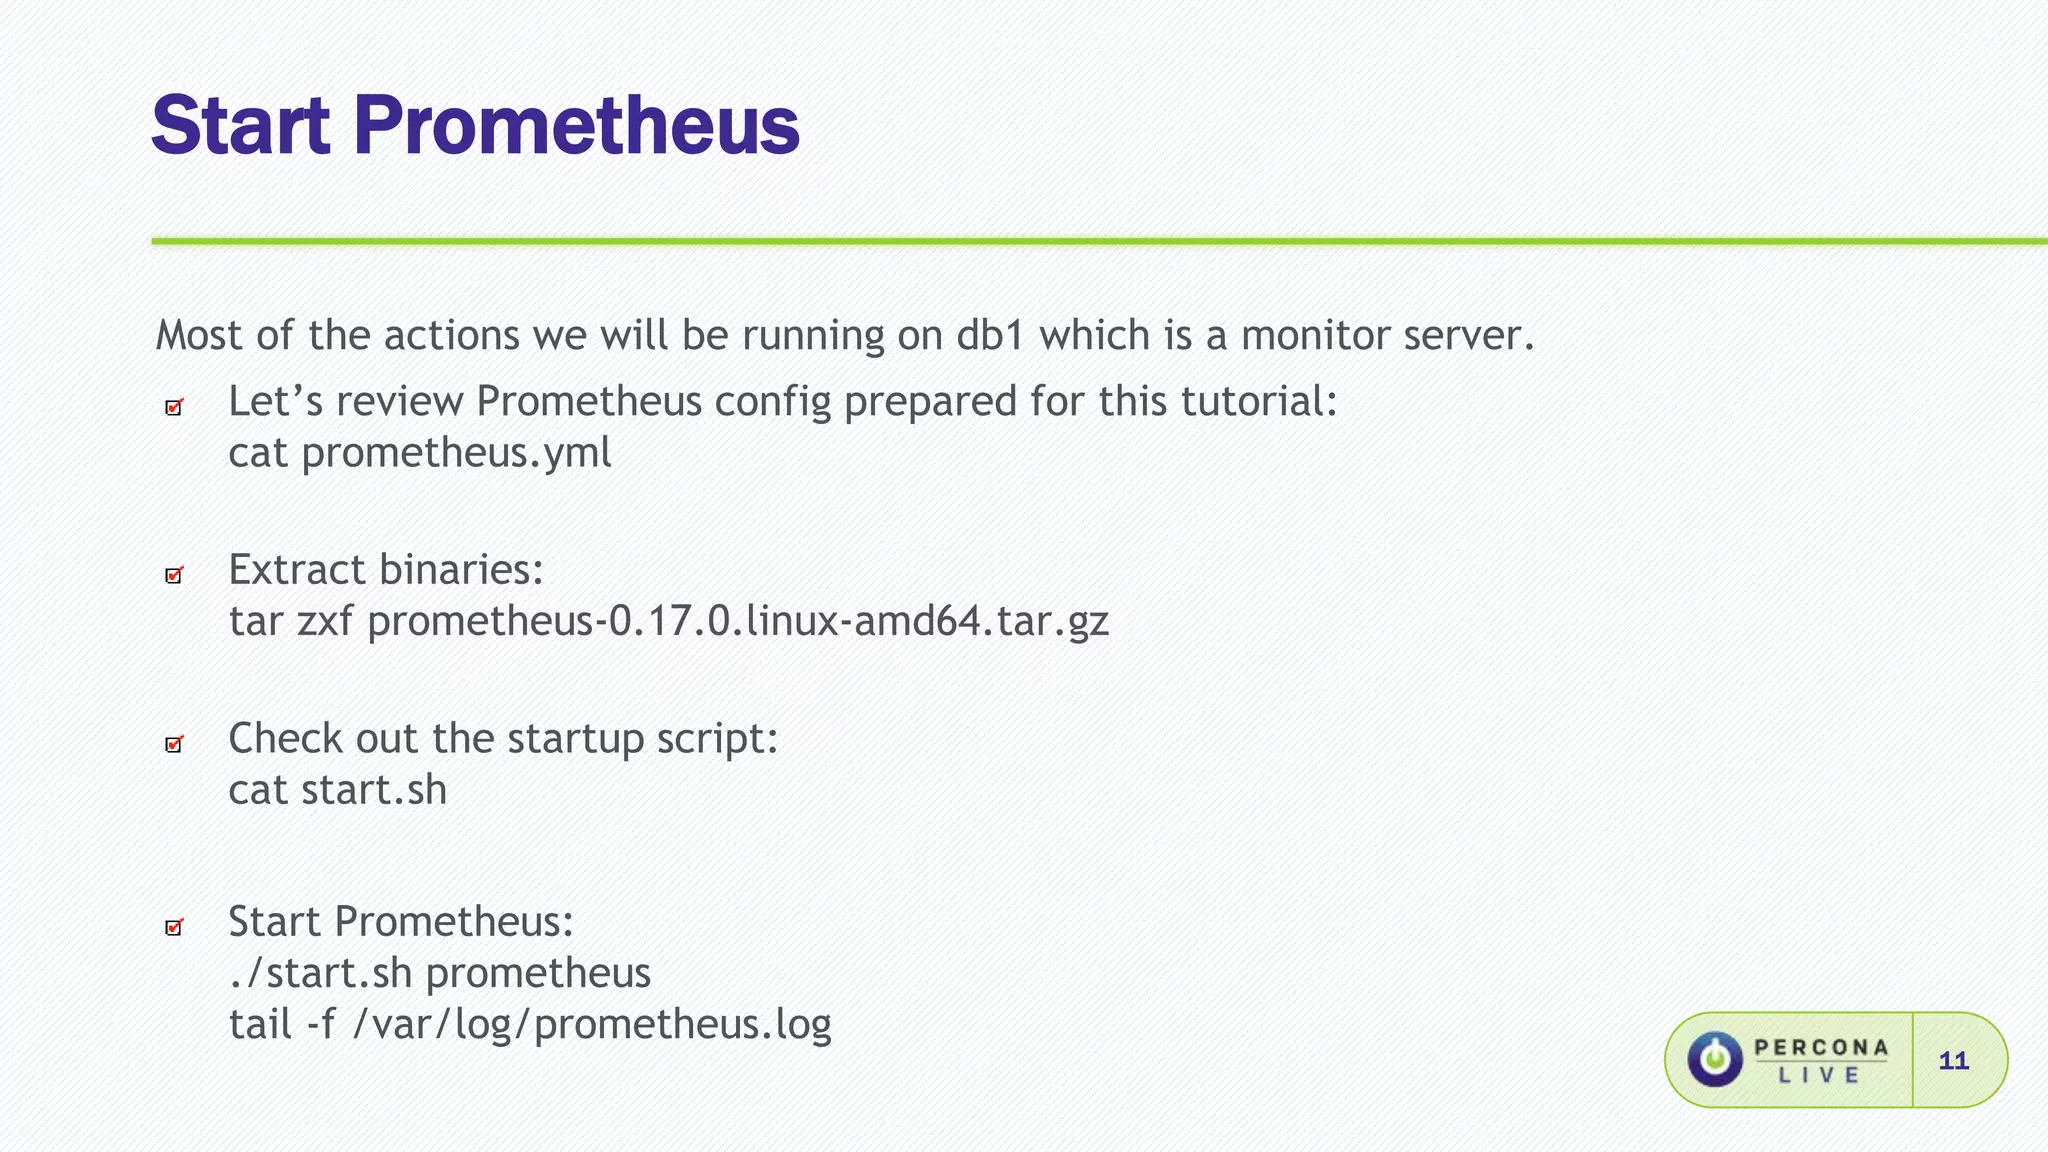
Most ofthe actions we will be running on db1 which is a monitor server.
Let’s review Prometheus config prepared for this tutorial:
cat prometheus.yml
Extract binaries:
tar zxf prometheus-0.17.0.linux-amd64.tar.gz
Check out the startup script:
cat start.sh
Start Prometheus:
./start.sh prometheus
tail -f /var/log/prometheus.log
Querying Prometheus DB
13
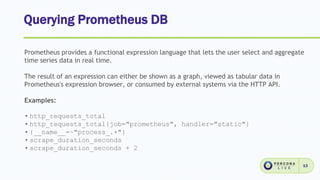
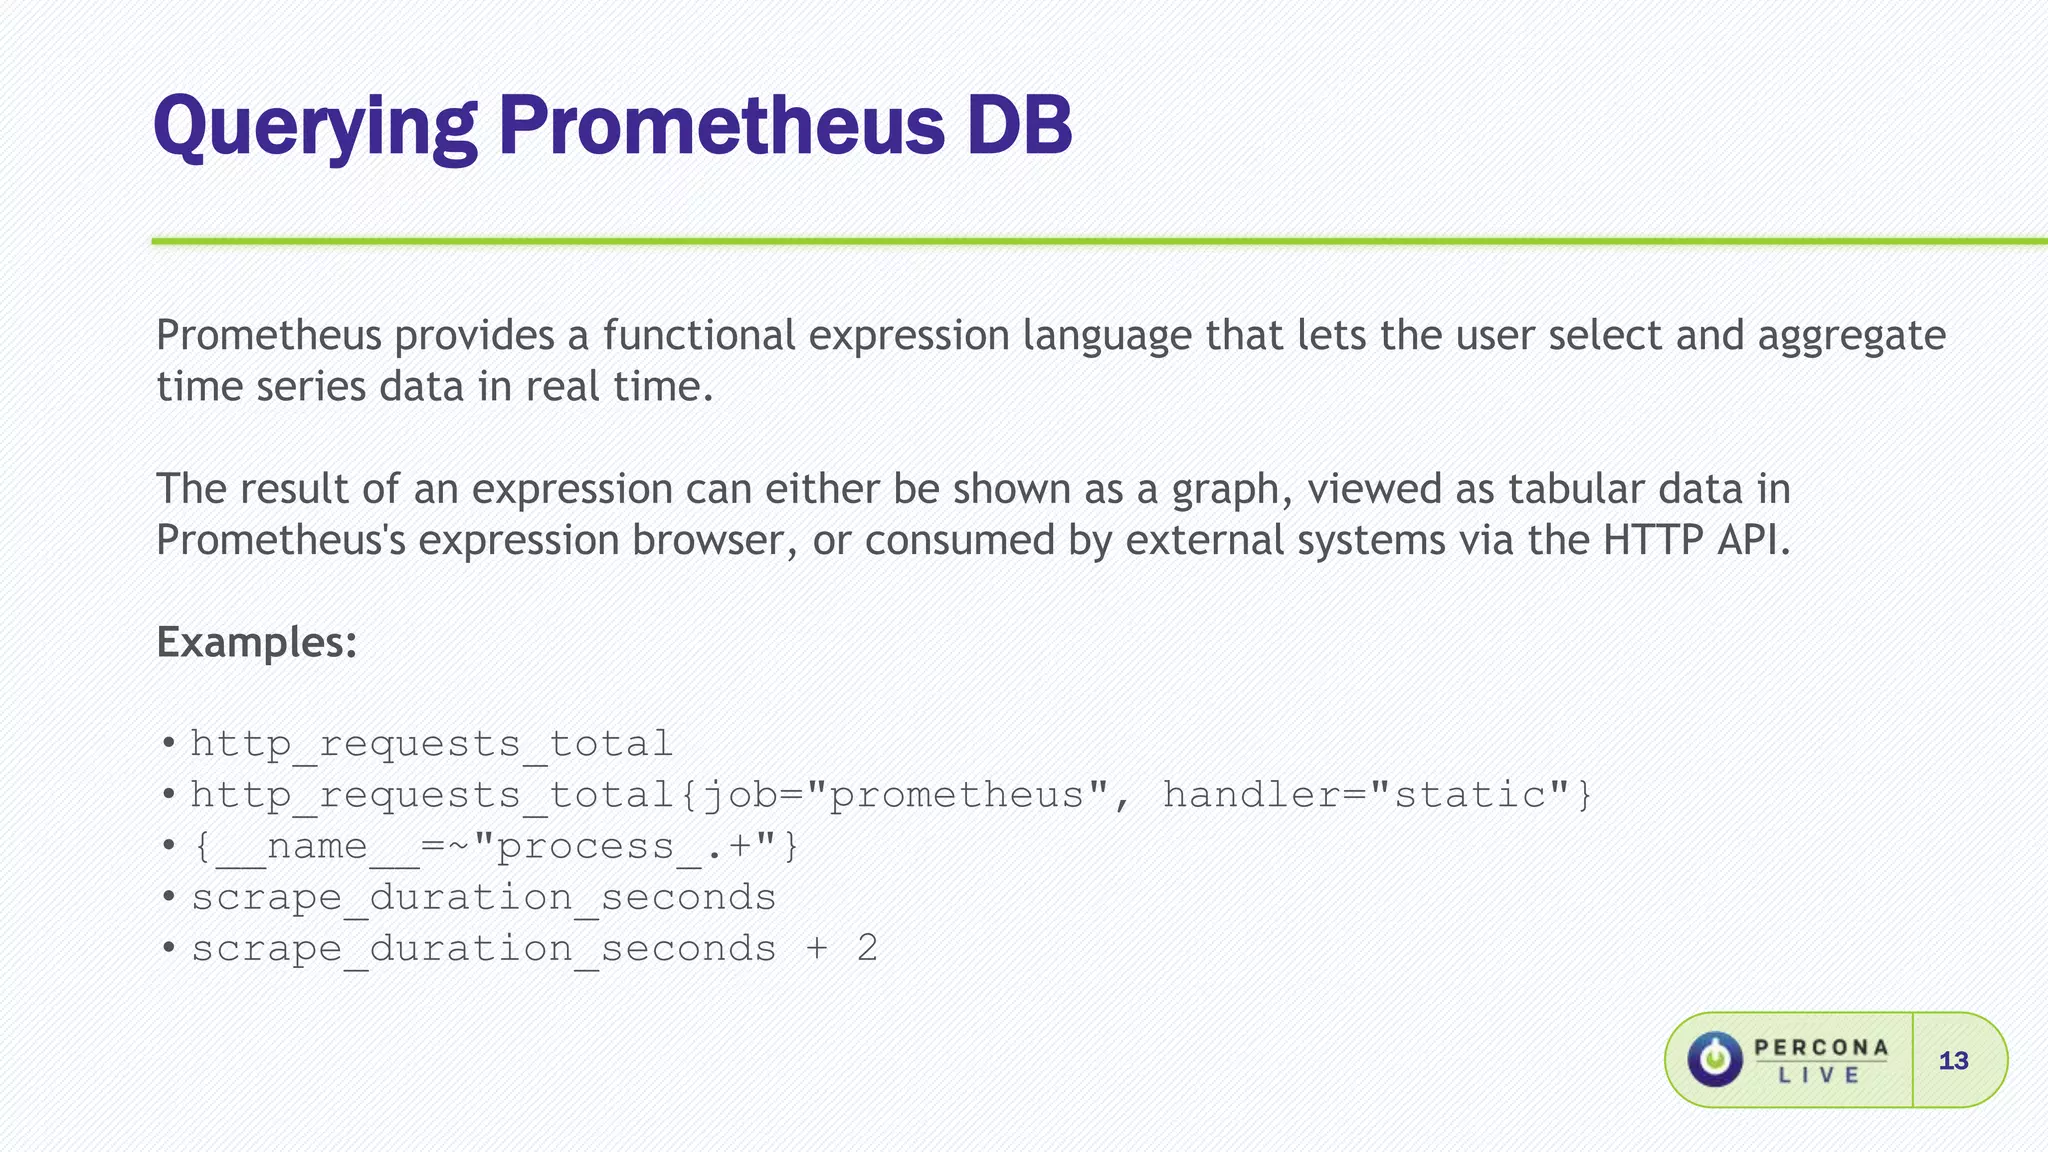
Prometheusprovides a functional expression language that lets the user select and aggregate
time series data in real time.
The result of an expression can either be shown as a graph, viewed as tabular data in
Prometheus's expression browser, or consumed by external systems via the HTTP API.
Examples:
• http_requests_total
• http_requests_total{job="prometheus", handler="static"}
• {__name__=~"process_.+"}
• scrape_duration_seconds
• scrape_duration_seconds + 2
Patch Grafana 2.6.0
18
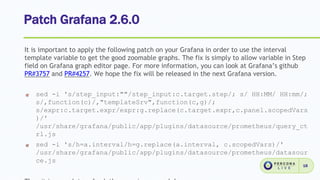
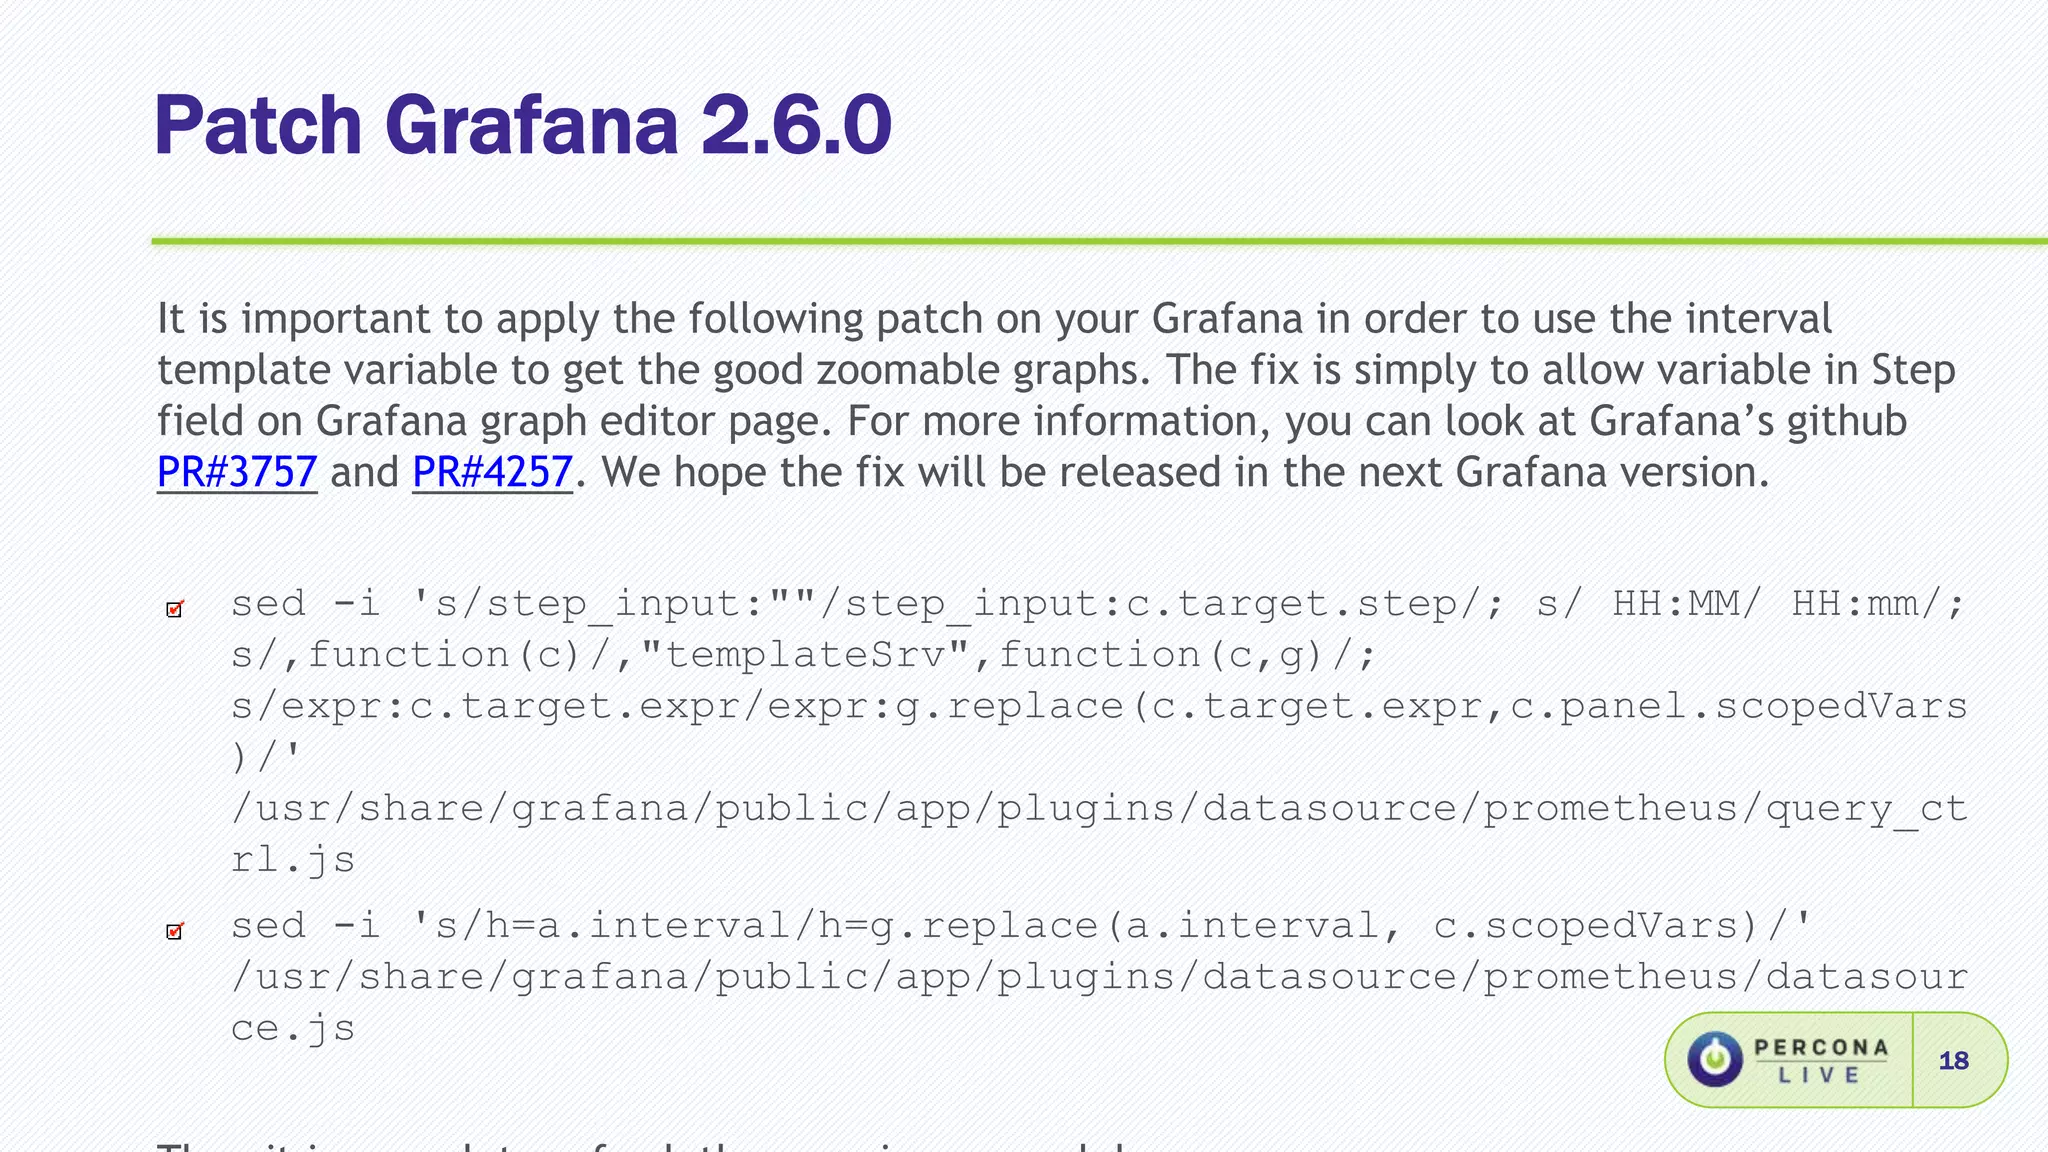
Itis important to apply the following patch on your Grafana in order to use the interval
template variable to get the good zoomable graphs. The fix is simply to allow variable in Step
field on Grafana graph editor page. For more information, you can look at Grafana’s github
PR#3757 and PR#4257. We hope the fix will be released in the next Grafana version.
sed -i 's/step_input:""/step_input:c.target.step/; s/ HH:MM/ HH:mm/;
s/,function(c)/,"templateSrv",function(c,g)/;
s/expr:c.target.expr/expr:g.replace(c.target.expr,c.panel.scopedVars
)/'
/usr/share/grafana/public/app/plugins/datasource/prometheus/query_ct
rl.js
sed -i 's/h=a.interval/h=g.replace(a.interval, c.scopedVars)/'
/usr/share/grafana/public/app/plugins/datasource/prometheus/datasour
ce.js
19.
Percona Grafana dashboards
19
Open-sourceand available @ https://github.com/percona/grafana-dashboards
This is a set of Grafana dashboards to be used with Prometheus and InfluxDB datasources for
MySQL and system monitoring. MongoDB dashboard to be shared separately.
MySQL:
• MySQL InnoDB Metrics
• MySQL MyISAM Metrics
• MySQL Overview
• MySQL Performance Schema
• MySQL Query Response Time
• MySQL Replication
• MySQL Table Statistics
• MySQL User Statistics
• Galera Graphs
• TokuDB Graphs
System:
• System Overview
• Disk Space
• Disk Performance
Mixed:
• Cross Server Graphs
• Summary Dashboard
• Trends Dashboard
• Prometheus
• [InfluxDB] 5m downsample
• [InfluxDB] 1h downsample
20.
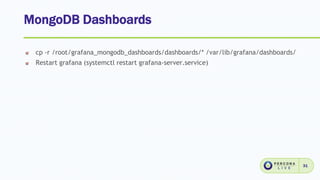
Install dashboards
20
Copy dashboardfiles:
cp -r grafana-dashboards/dashboards/ /var/lib/grafana/
Enable JSON dashboards by adding those lines to /etc/grafana/grafana.ini:
[dashboards.json]
enabled = true
path = /var/lib/grafana/dashboards
Restart Grafana:
systemctl restart grafana-server.service
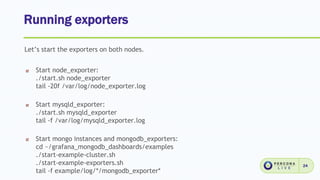
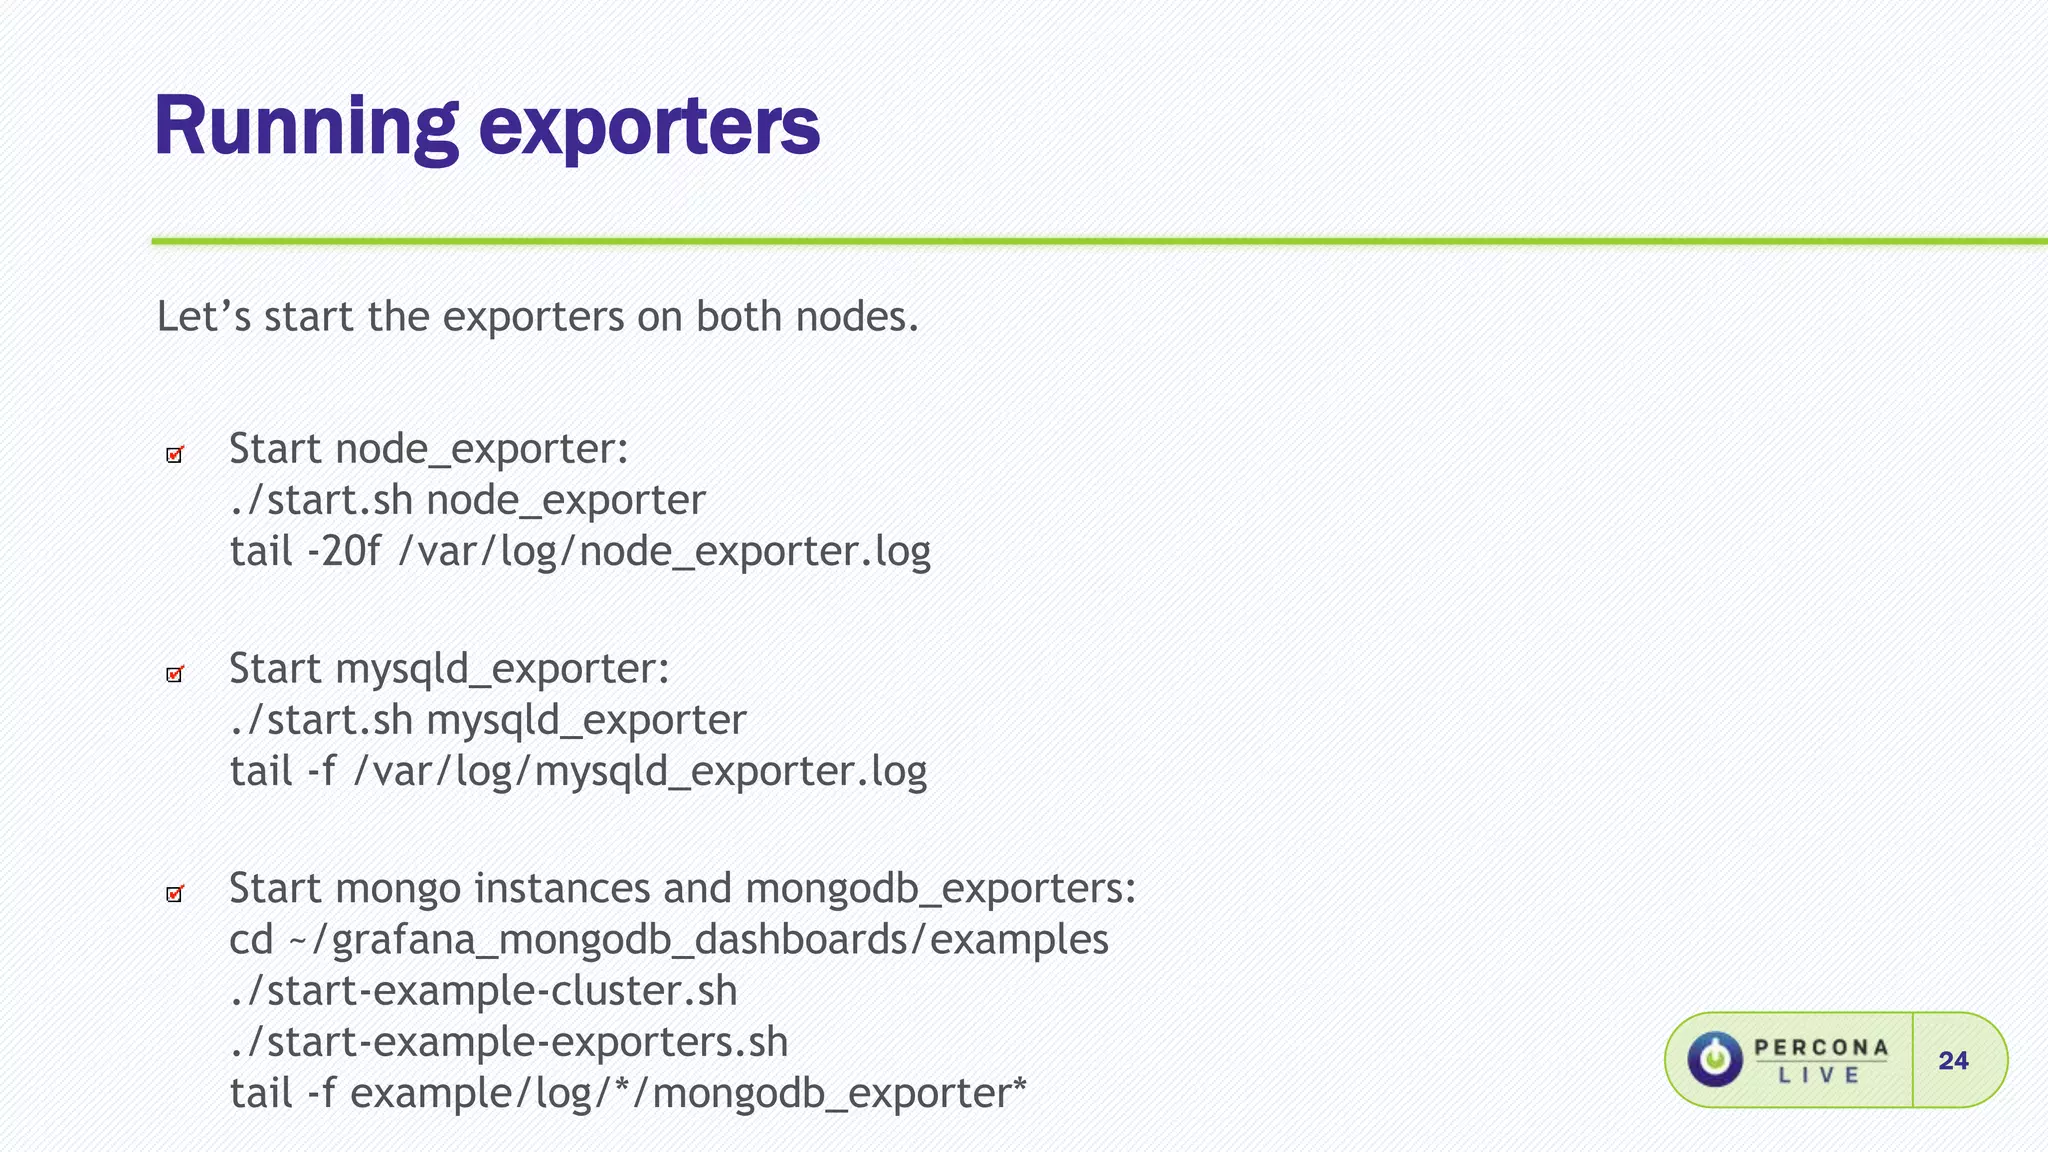
Running exporters
24
Let’s startthe exporters on both nodes.
Start node_exporter:
./start.sh node_exporter
tail -20f /var/log/node_exporter.log
Start mysqld_exporter:
./start.sh mysqld_exporter
tail -f /var/log/mysqld_exporter.log
Start mongo instances and mongodb_exporters:
cd ~/grafana_mongodb_dashboards/examples
./start-example-cluster.sh
./start-example-exporters.sh
tail -f example/log/*/mongodb_exporter*
25.
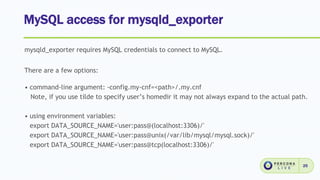
MySQL access formysqld_exporter
25
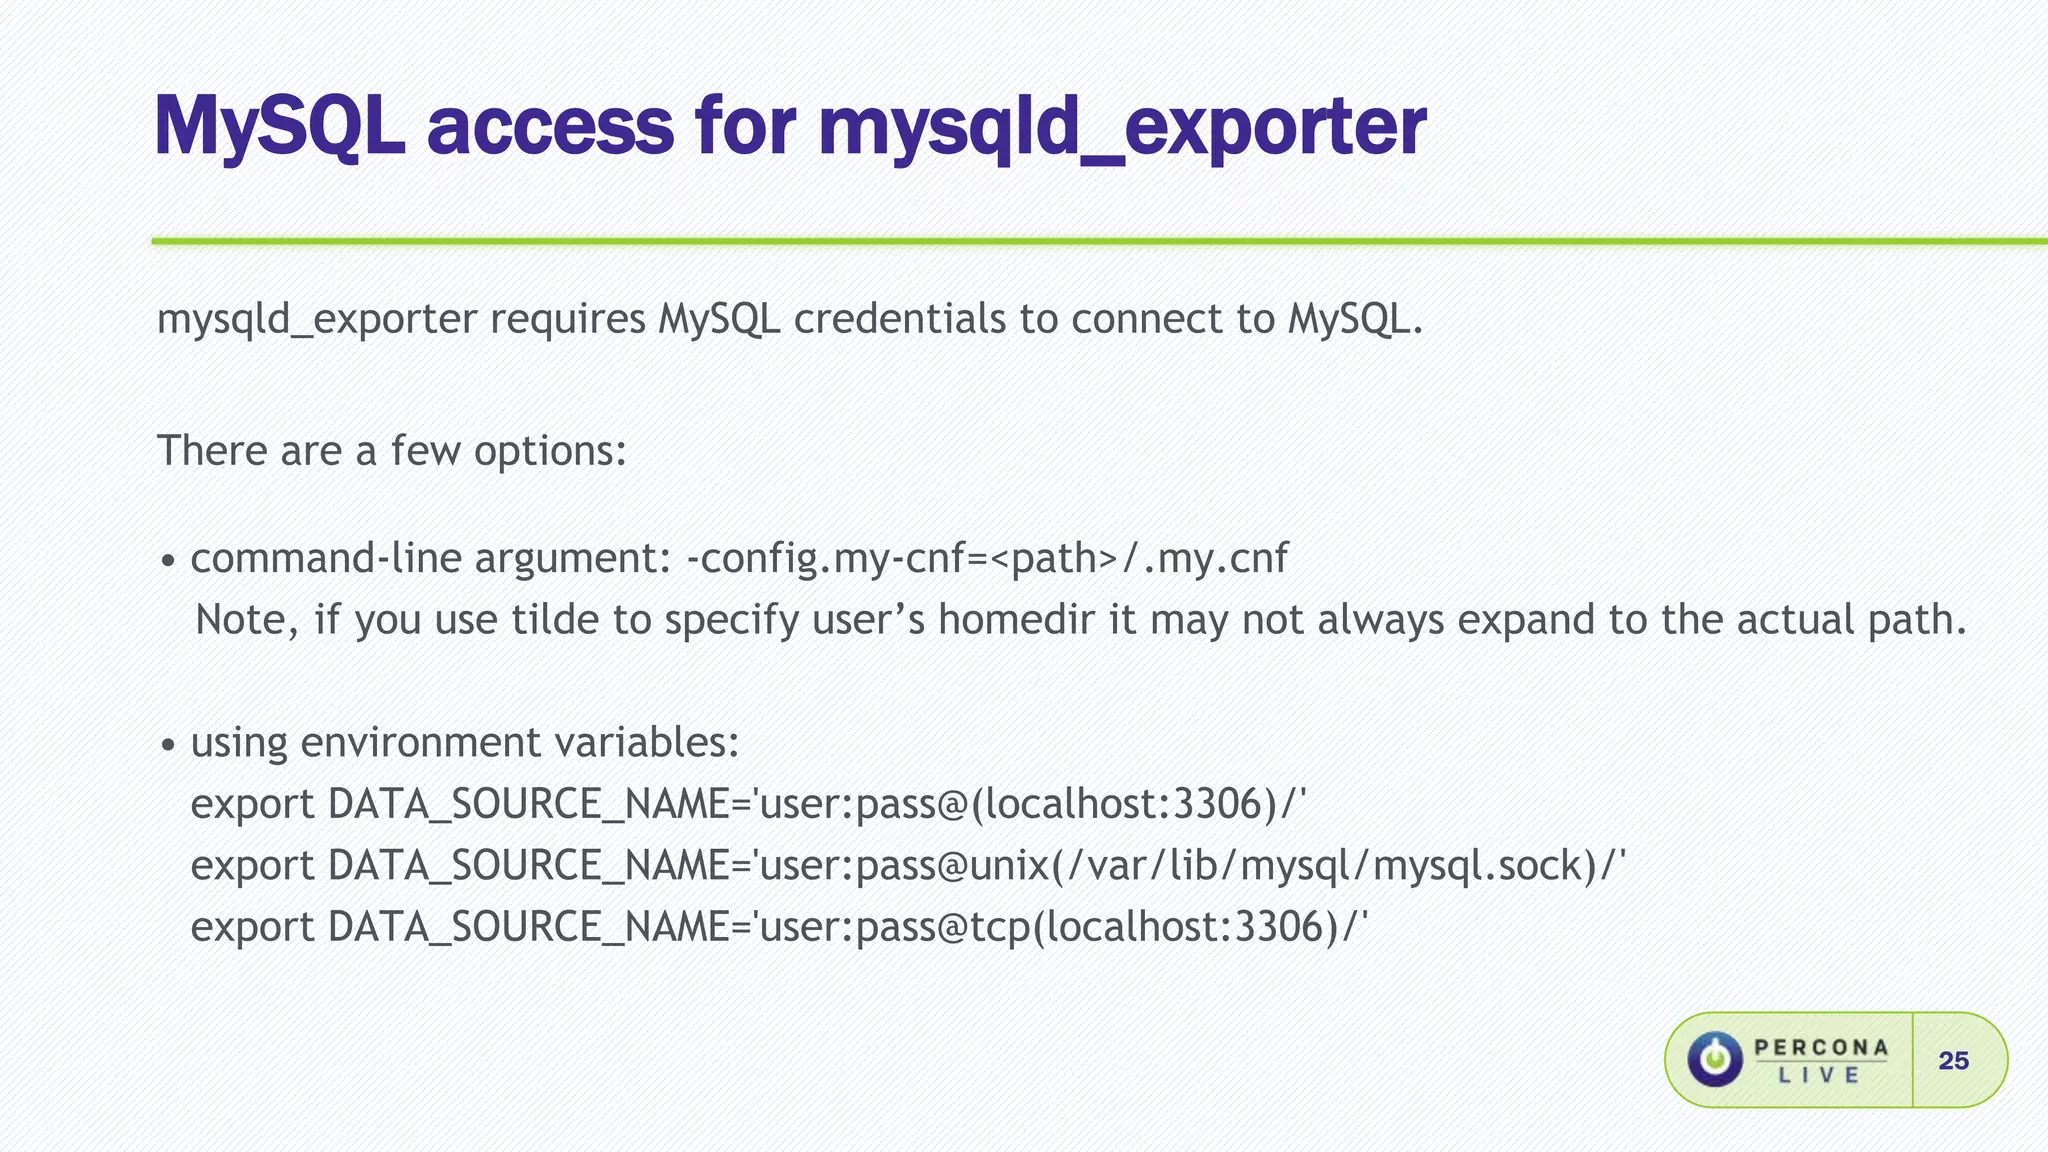
mysqld_exporter requires MySQL credentials to connect to MySQL.
There are a few options:
• command-line argument: -config.my-cnf=<path>/.my.cnf
Note, if you use tilde to specify user’s homedir it may not always expand to the actual path.
• using environment variables:
export DATA_SOURCE_NAME='user:pass@(localhost:3306)/'
export DATA_SOURCE_NAME='user:pass@unix(/var/lib/mysql/mysql.sock)/'
export DATA_SOURCE_NAME='user:pass@tcp(localhost:3306)/'
26.
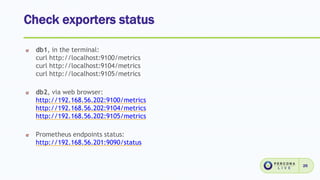
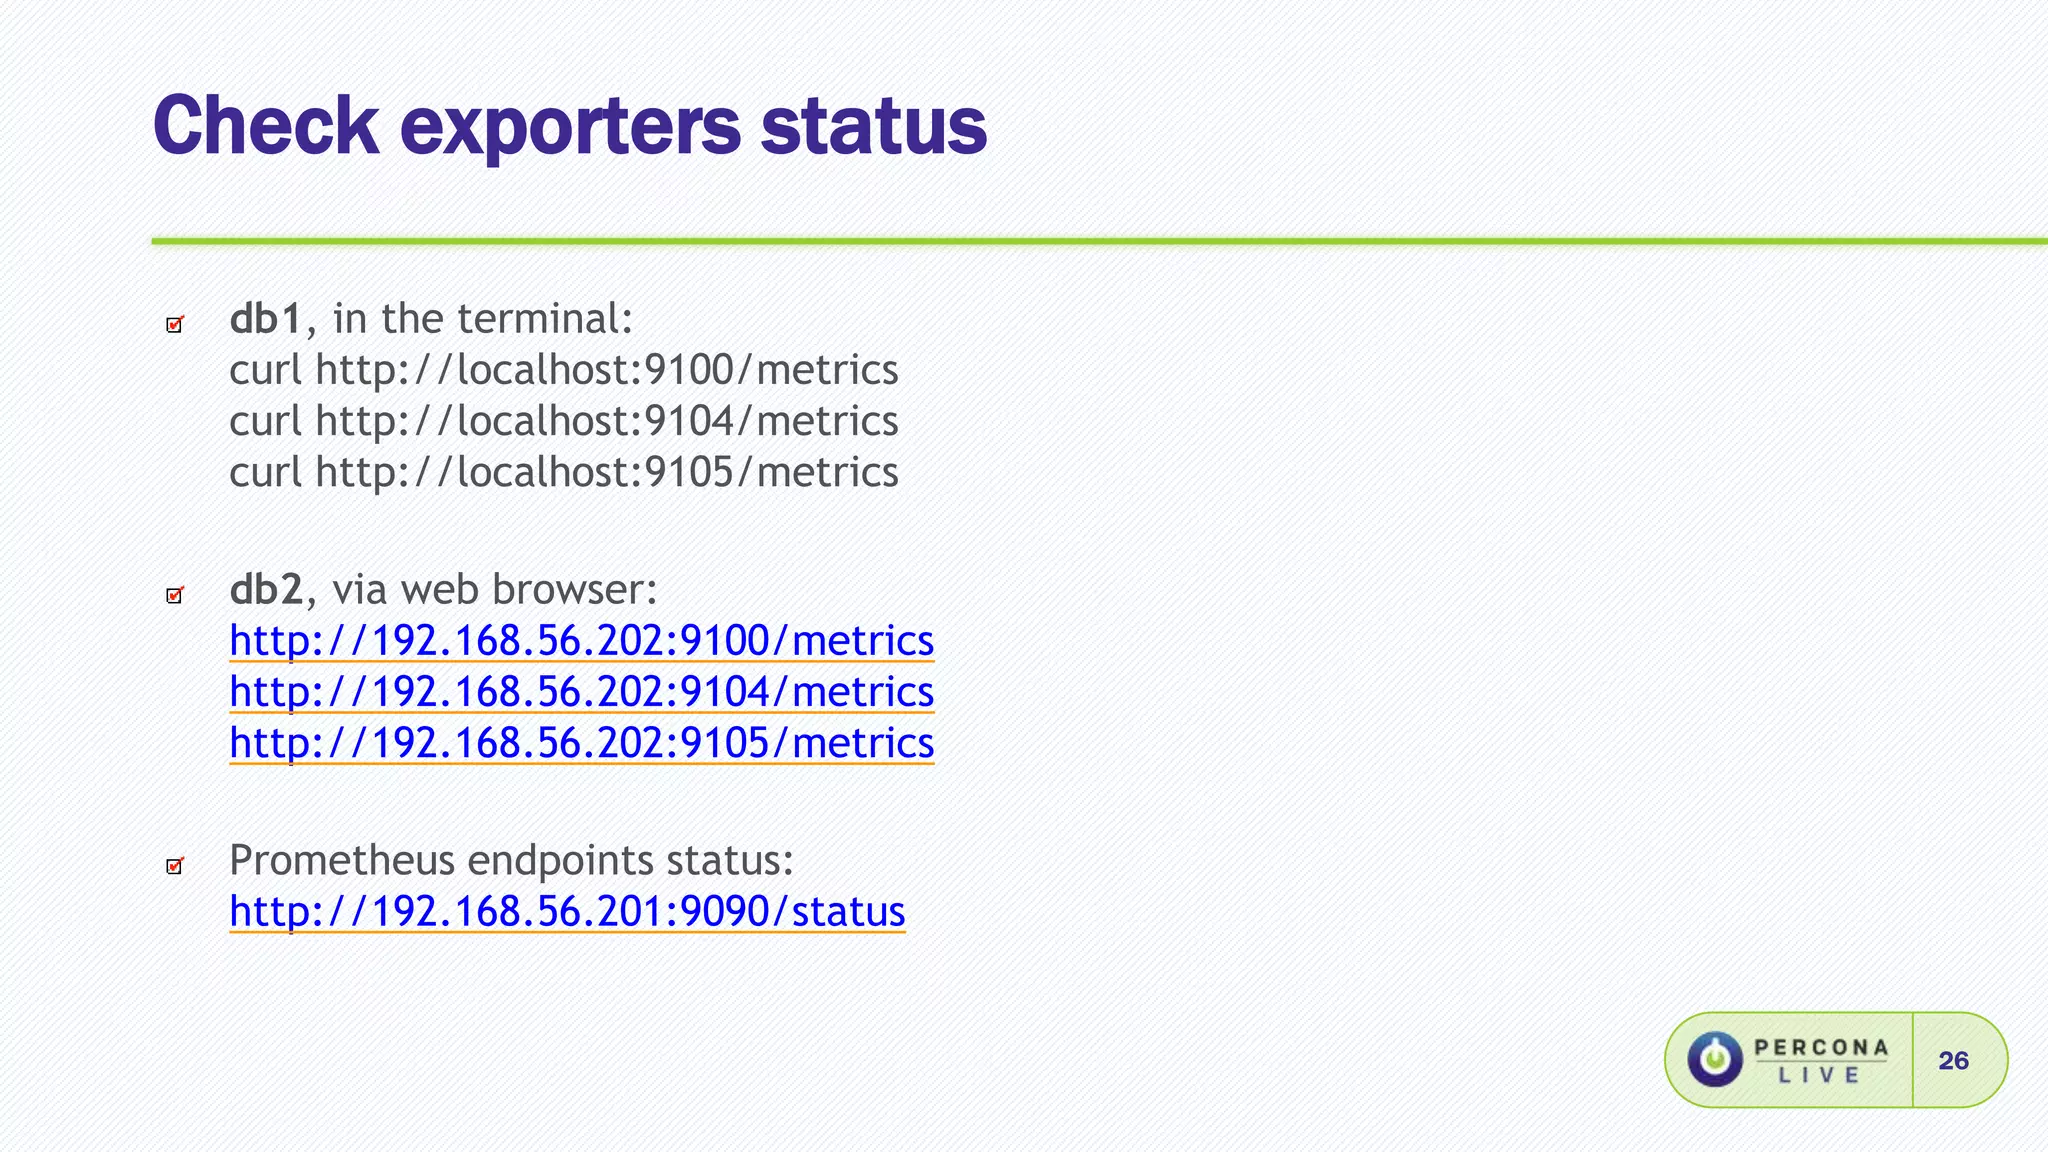
Check exporters status
26
db1,in the terminal:
curl http://localhost:9100/metrics
curl http://localhost:9104/metrics
curl http://localhost:9105/metrics
db2, via web browser:
http://192.168.56.202:9100/metrics
http://192.168.56.202:9104/metrics
http://192.168.56.202:9105/metrics
Prometheus endpoints status:
http://192.168.56.201:9090/status
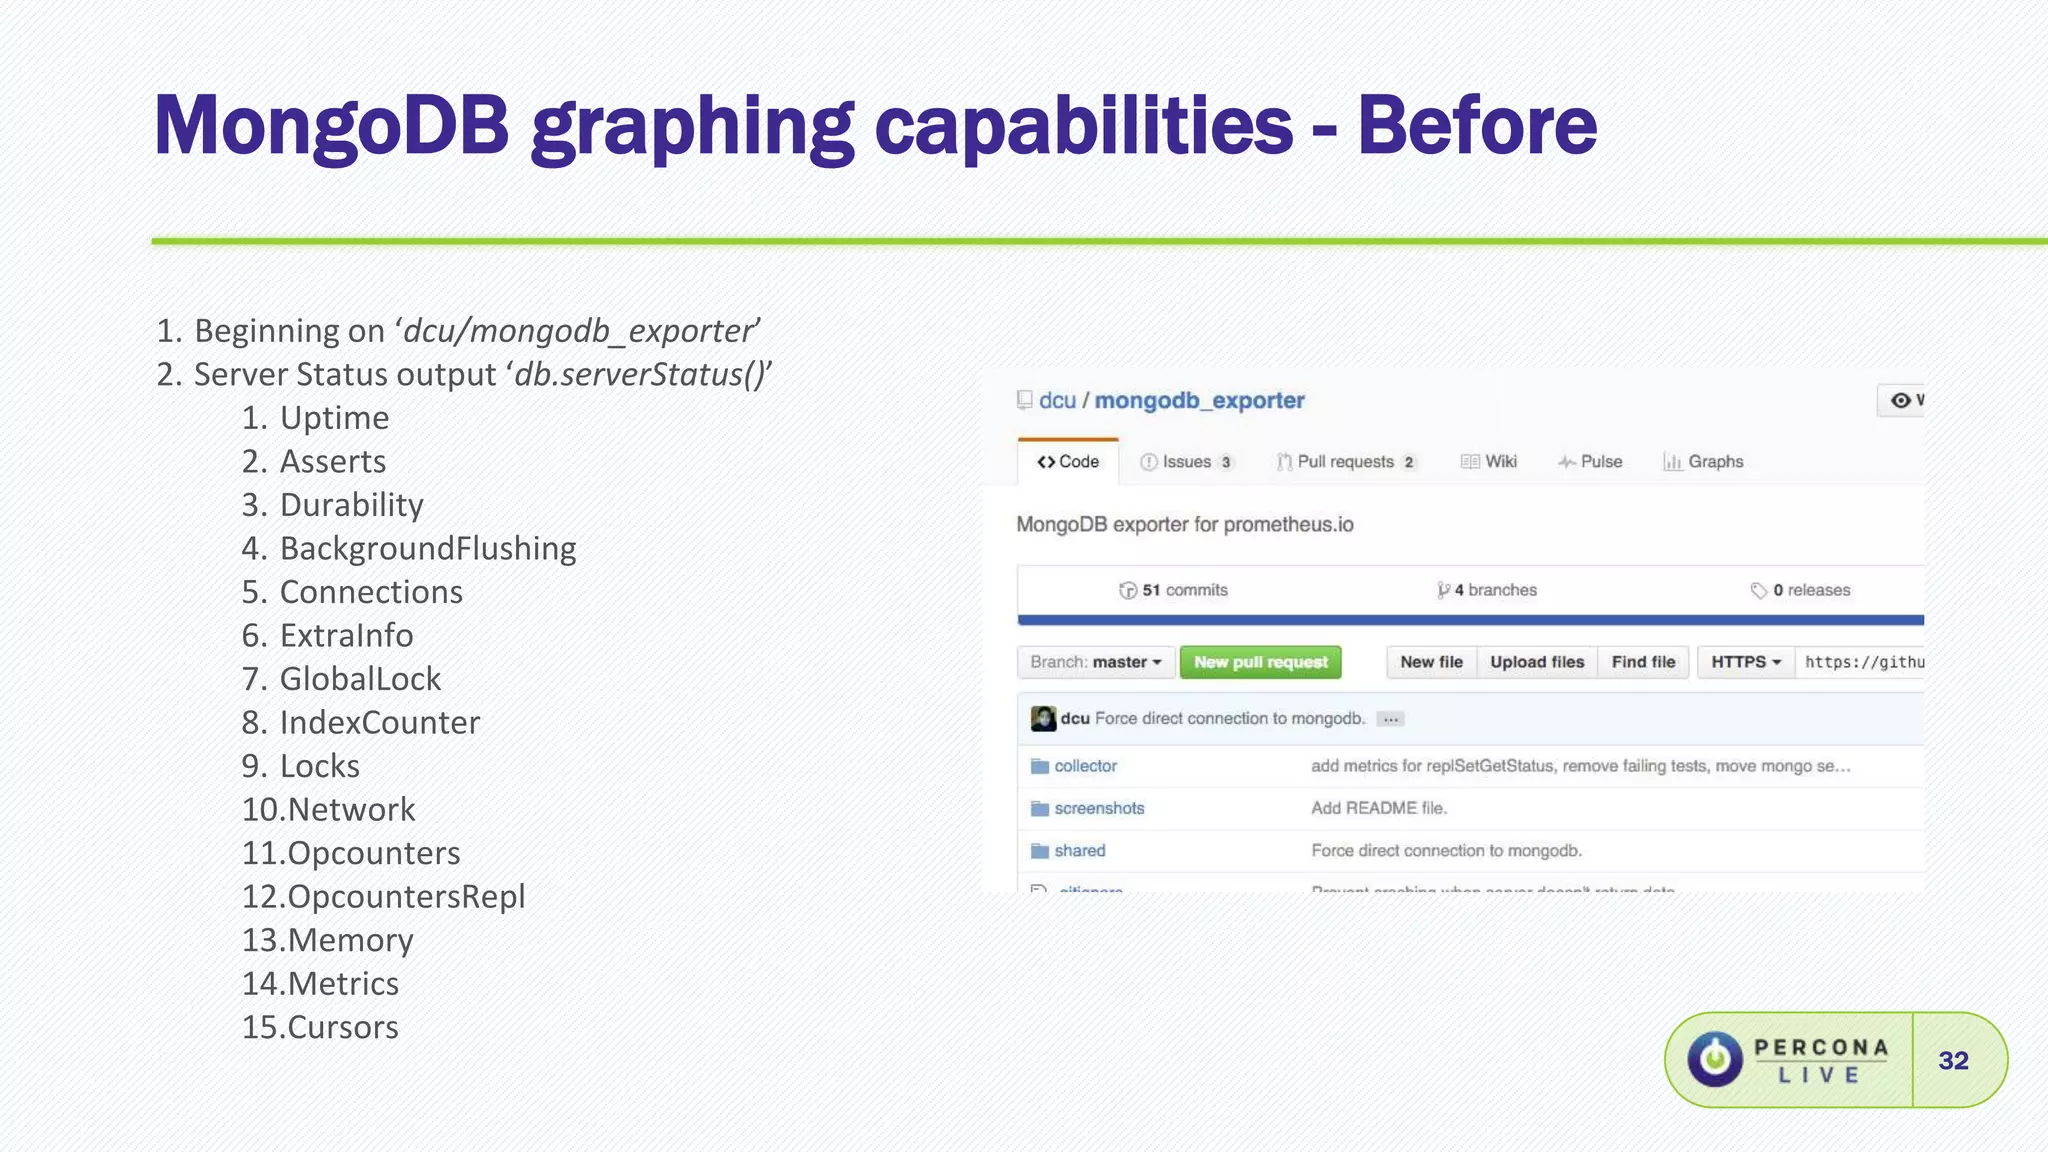
MongoDB graphing capabilities- Before
32
1. Beginning on ‘dcu/mongodb_exporter’
2. Server Status output ‘db.serverStatus()’
1. Uptime
2. Asserts
3. Durability
4. BackgroundFlushing
5. Connections
6. ExtraInfo
7. GlobalLock
8. IndexCounter
9. Locks
10.Network
11.Opcounters
12.OpcountersRepl
13.Memory
14.Metrics
15.Cursors
33.
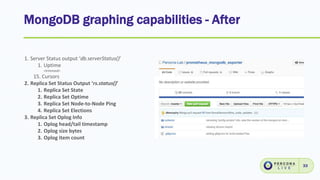
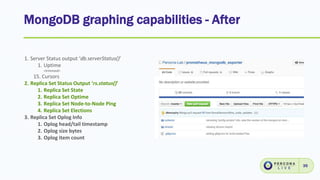
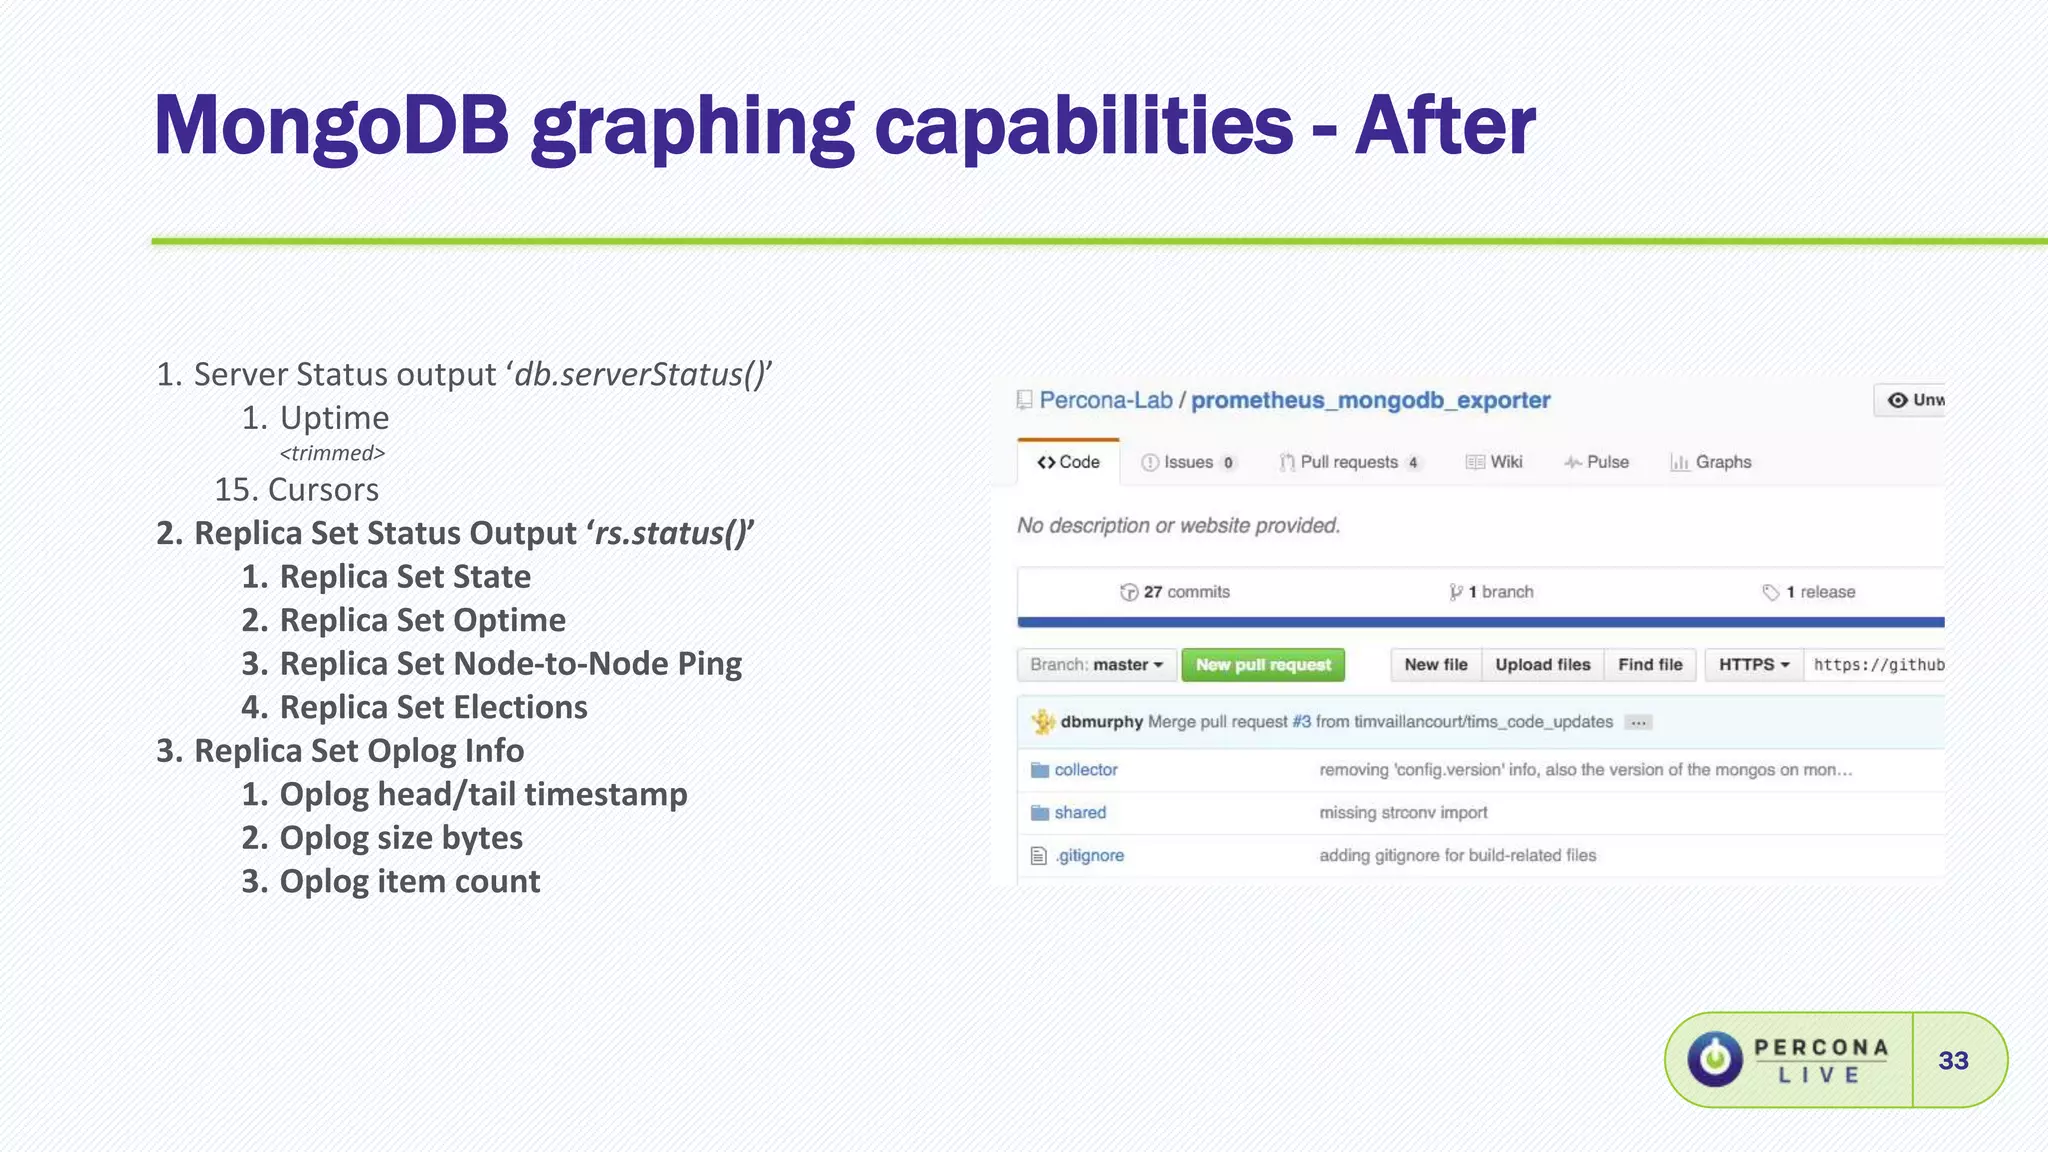
MongoDB graphing capabilities- After
33
1. Server Status output ‘db.serverStatus()’
1. Uptime
<trimmed>
15. Cursors
2. Replica Set Status Output ‘rs.status()’
1. Replica Set State
2. Replica Set Optime
3. Replica Set Node-to-Node Ping
4. Replica Set Elections
3. Replica Set Oplog Info
1. Oplog head/tail timestamp
2. Oplog size bytes
3. Oplog item count
34.
MongoDB graphing capabilities- After
34
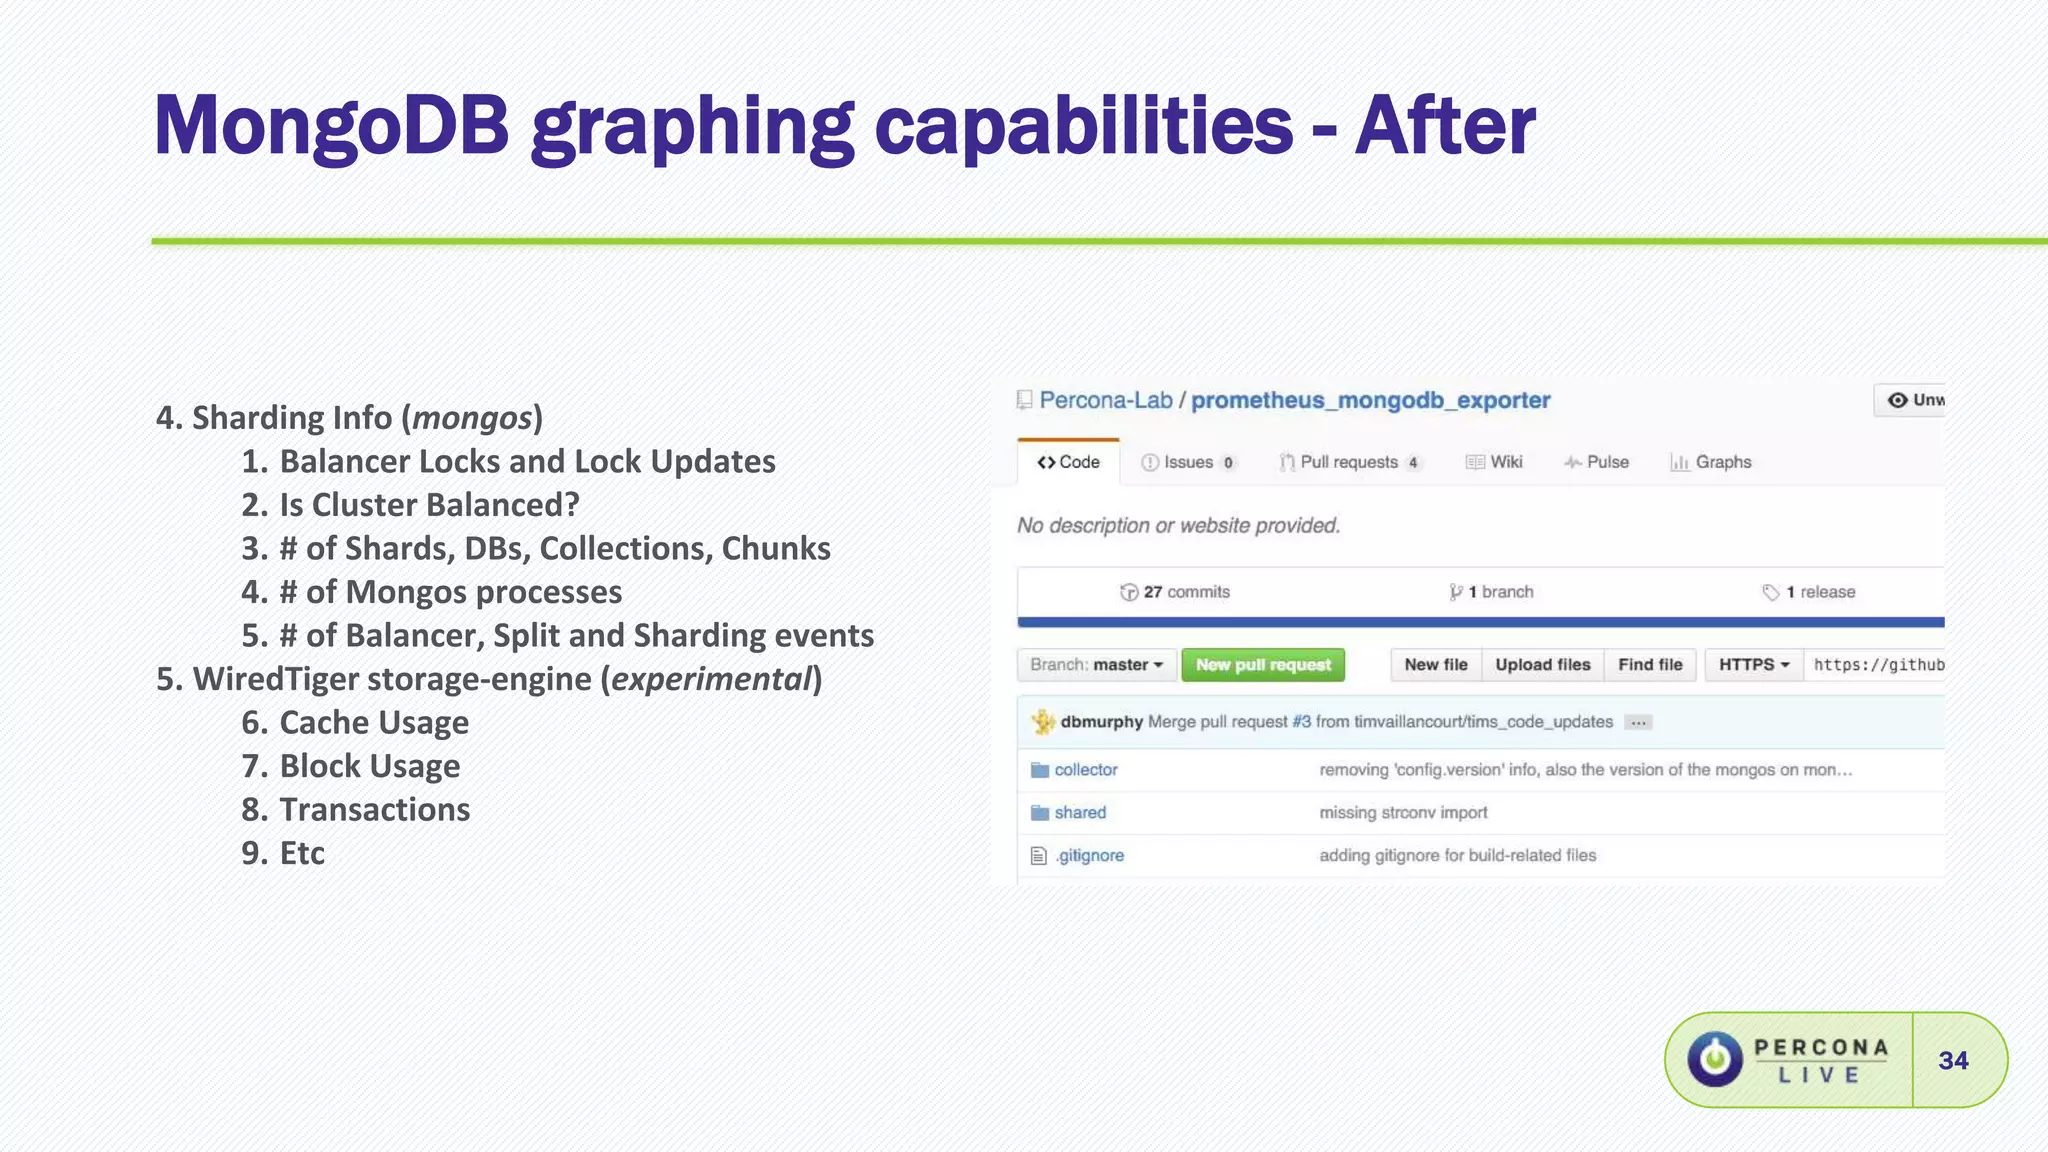
4. Sharding Info (mongos)
1. Balancer Locks and Lock Updates
2. Is Cluster Balanced?
3. # of Shards, DBs, Collections, Chunks
4. # of Mongos processes
5. # of Balancer, Split and Sharding events
5. WiredTiger storage-engine (experimental)
6. Cache Usage
7. Block Usage
8. Transactions
9. Etc
35.
MongoDB graphing capabilities- After
35
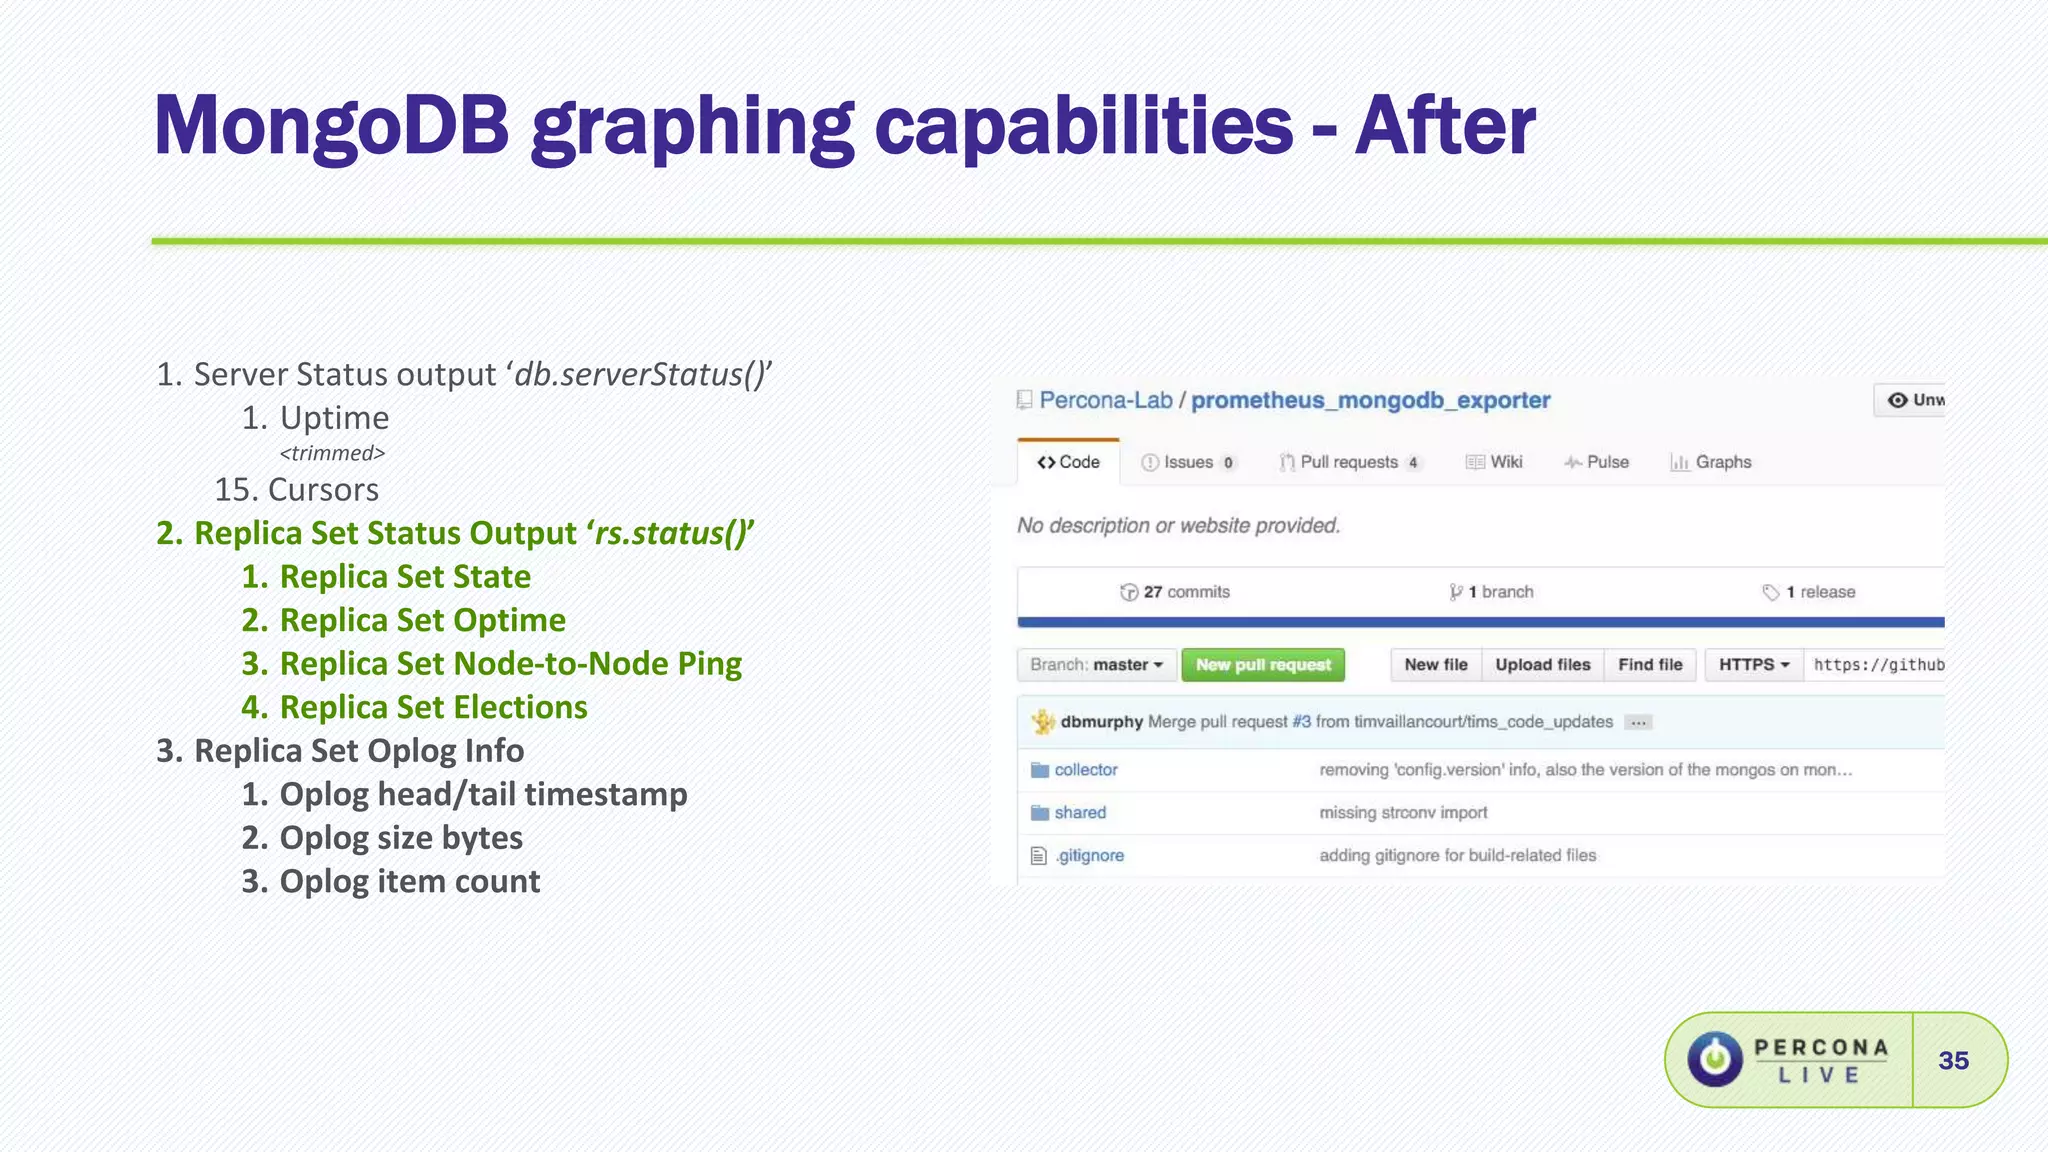
1. Server Status output ‘db.serverStatus()’
1. Uptime
<trimmed>
15. Cursors
2. Replica Set Status Output ‘rs.status()’
1. Replica Set State
2. Replica Set Optime
3. Replica Set Node-to-Node Ping
4. Replica Set Elections
3. Replica Set Oplog Info
1. Oplog head/tail timestamp
2. Oplog size bytes
3. Oplog item count
36.
MongoDB Exporter MetricSummary
36
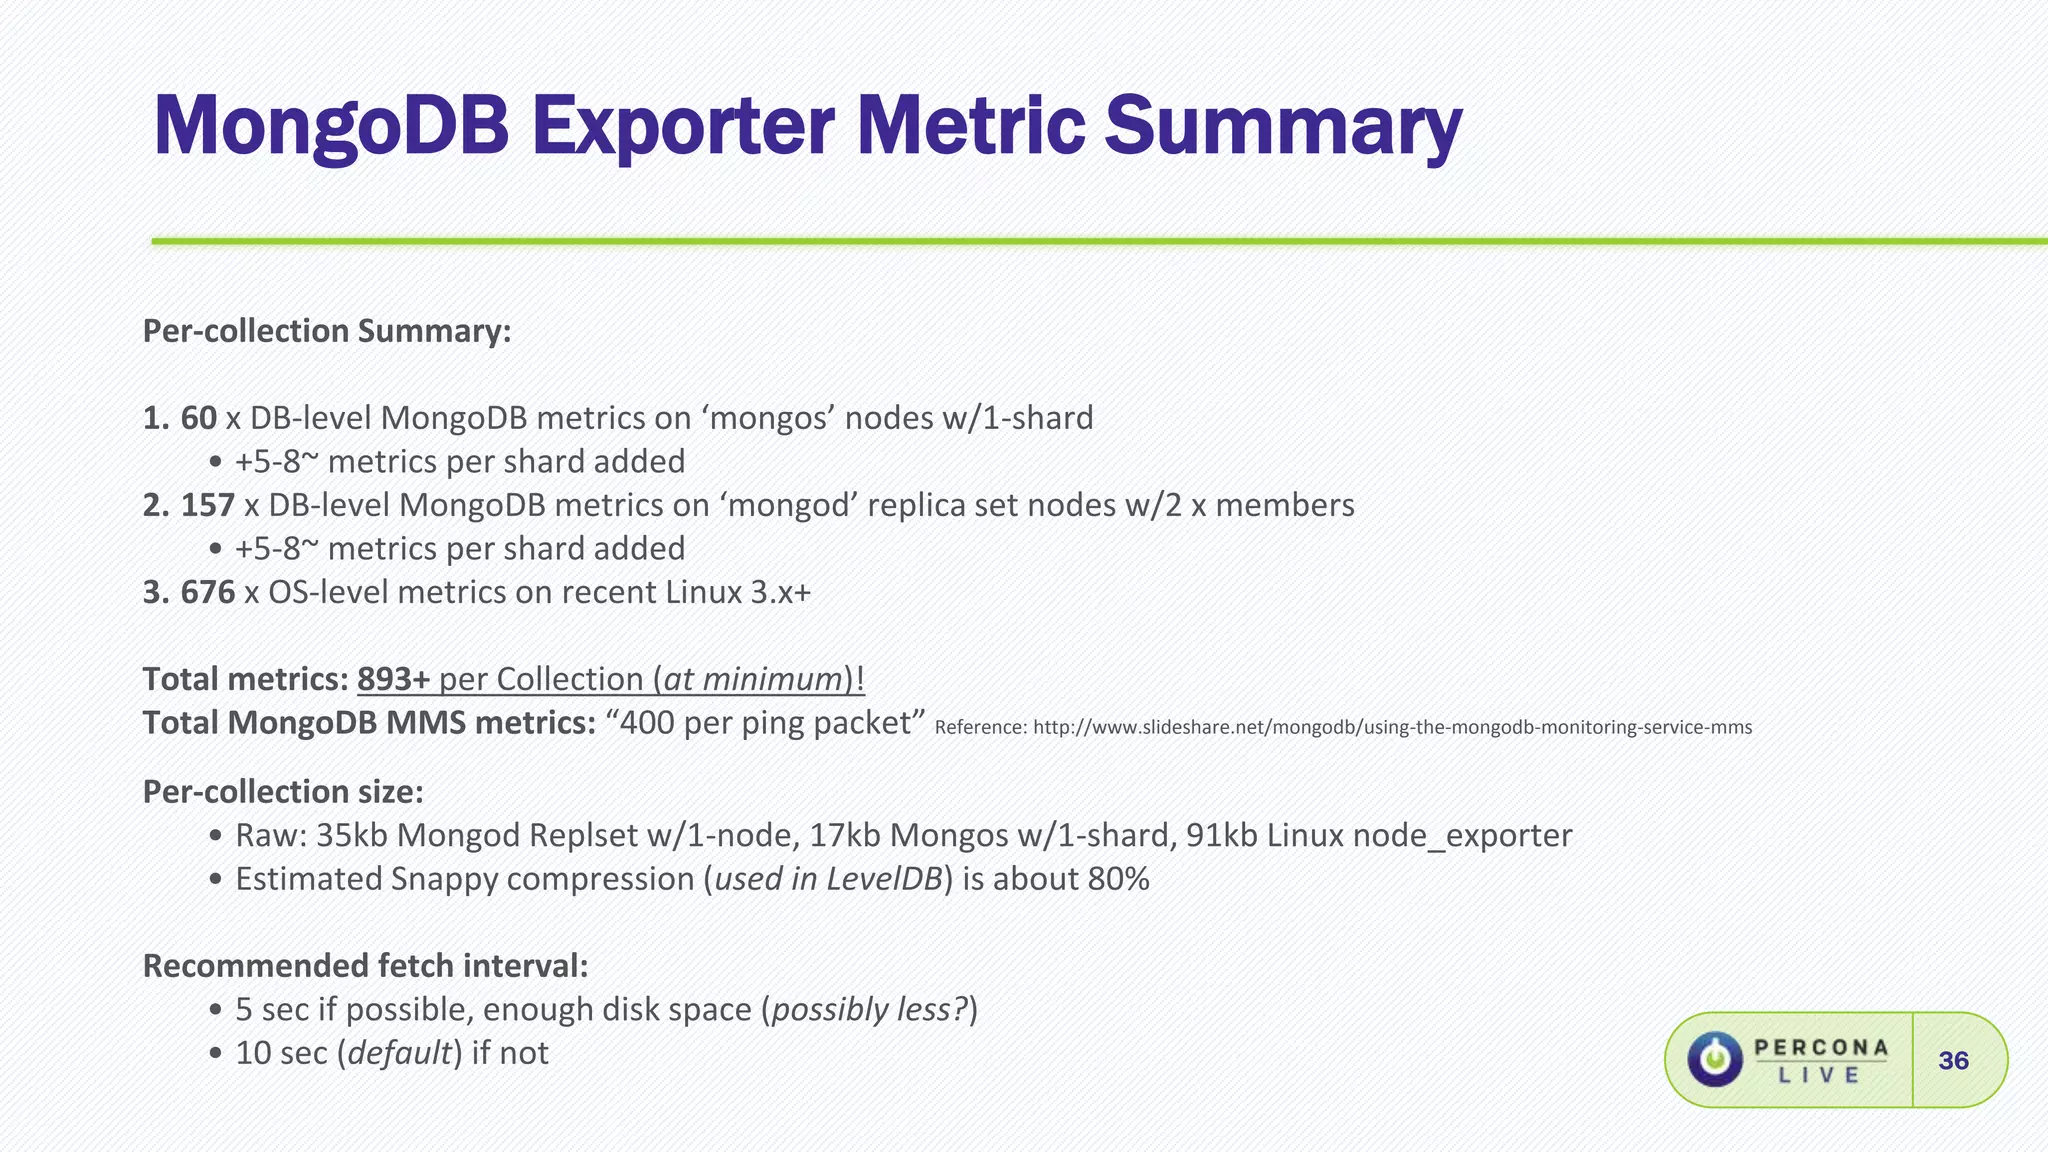
Per-collection Summary:
1. 60 x DB-level MongoDB metrics on ‘mongos’ nodes w/1-shard
• +5-8~ metrics per shard added
2. 157 x DB-level MongoDB metrics on ‘mongod’ replica set nodes w/2 x members
• +5-8~ metrics per shard added
3. 676 x OS-level metrics on recent Linux 3.x+
Total metrics: 893+ per Collection (at minimum)!
Total MongoDB MMS metrics: “400 per ping packet” Reference: http://www.slideshare.net/mongodb/using-the-mongodb-monitoring-service-mms
Per-collection size:
• Raw: 35kb Mongod Replset w/1-node, 17kb Mongos w/1-shard, 91kb Linux node_exporter
• Estimated Snappy compression (used in LevelDB) is about 80%
Recommended fetch interval:
• 5 sec if possible, enough disk space (possibly less?)
• 10 sec (default) if not
37.
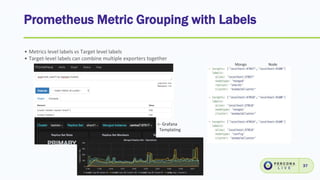
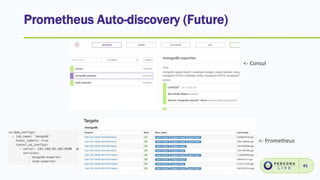
Prometheus Metric Groupingwith Labels
37
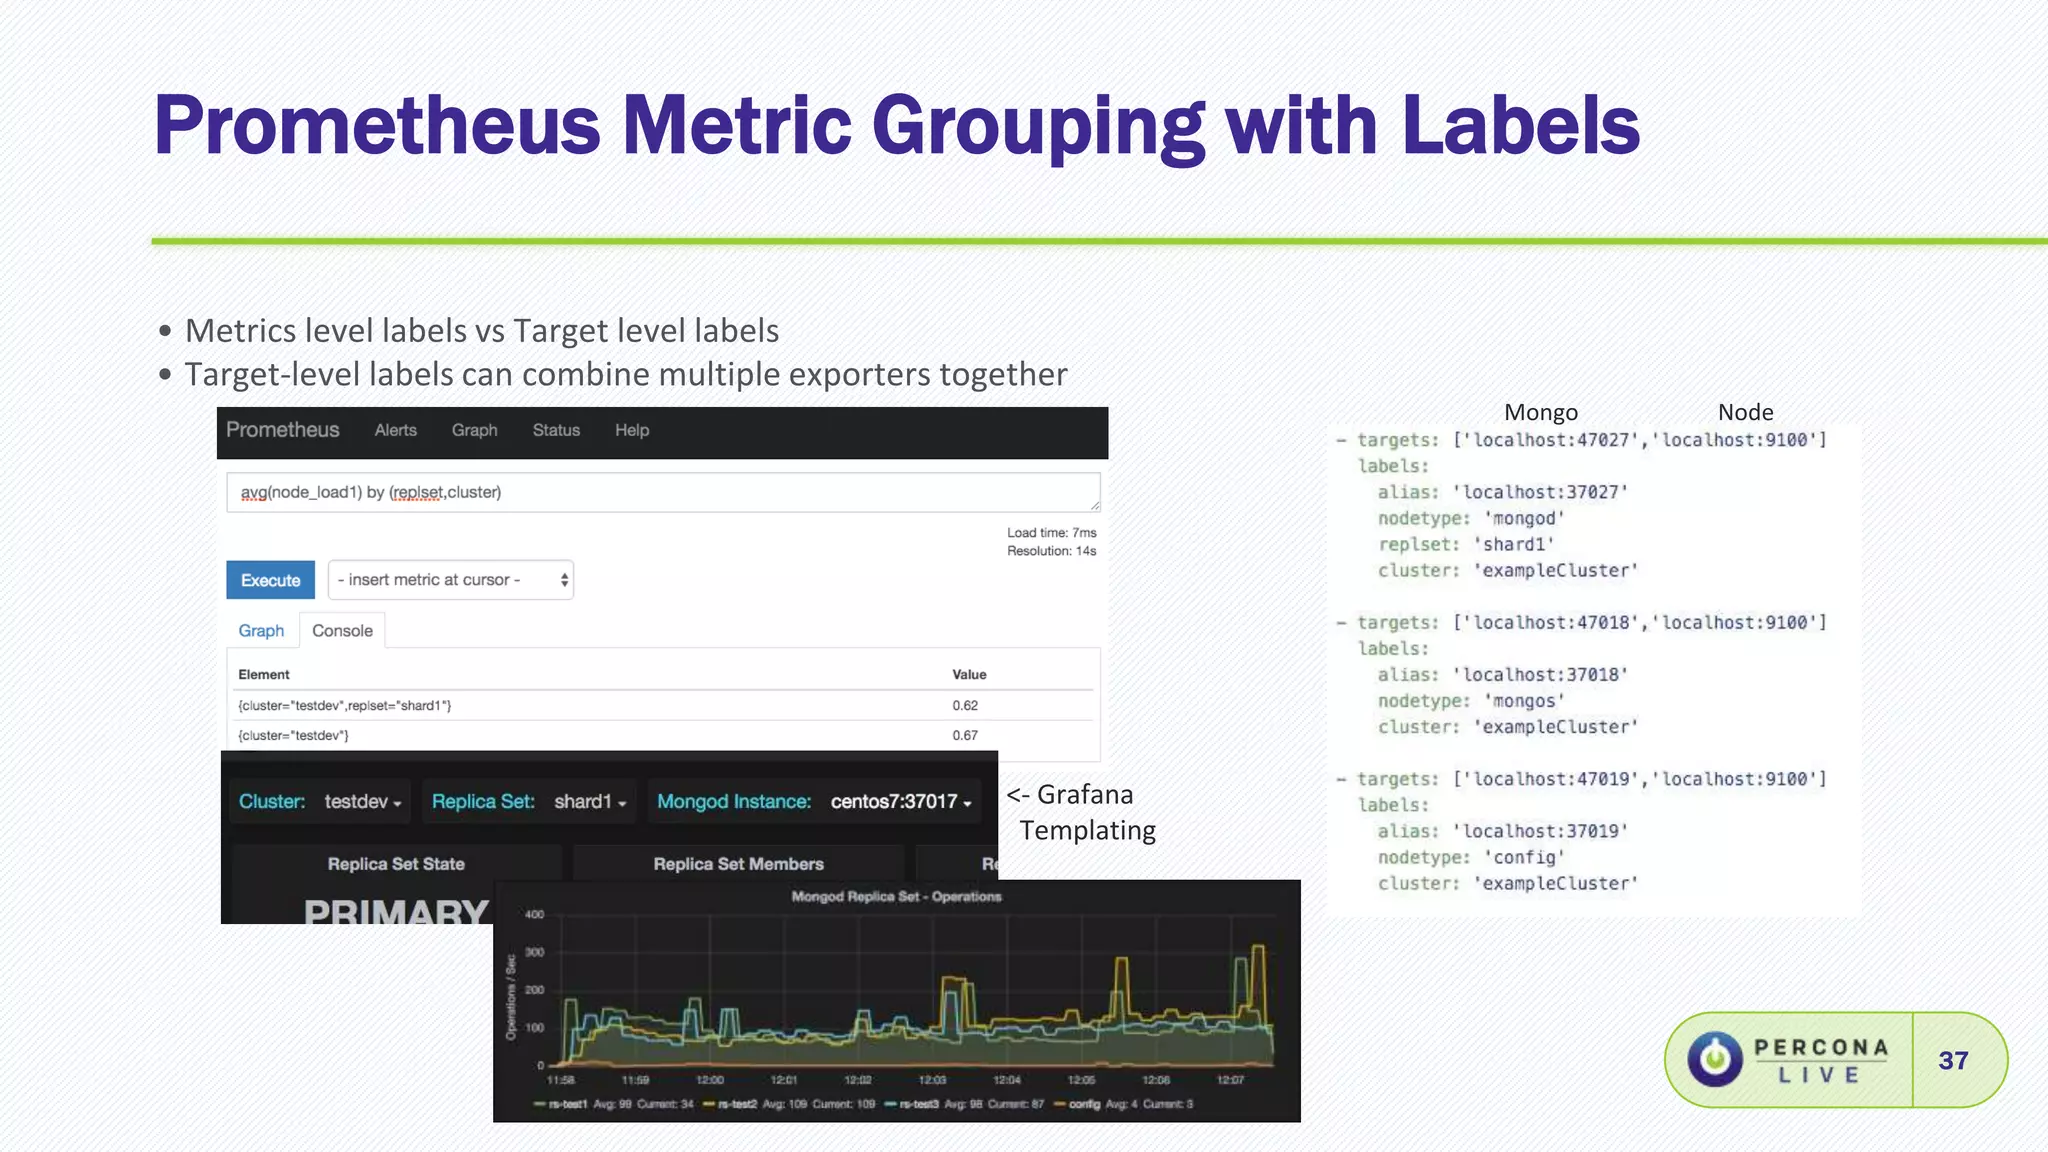
• Metrics level labels vs Target level labels
• Target-level labels can combine multiple exporters together
Mongo Node
<- Grafana
Templating
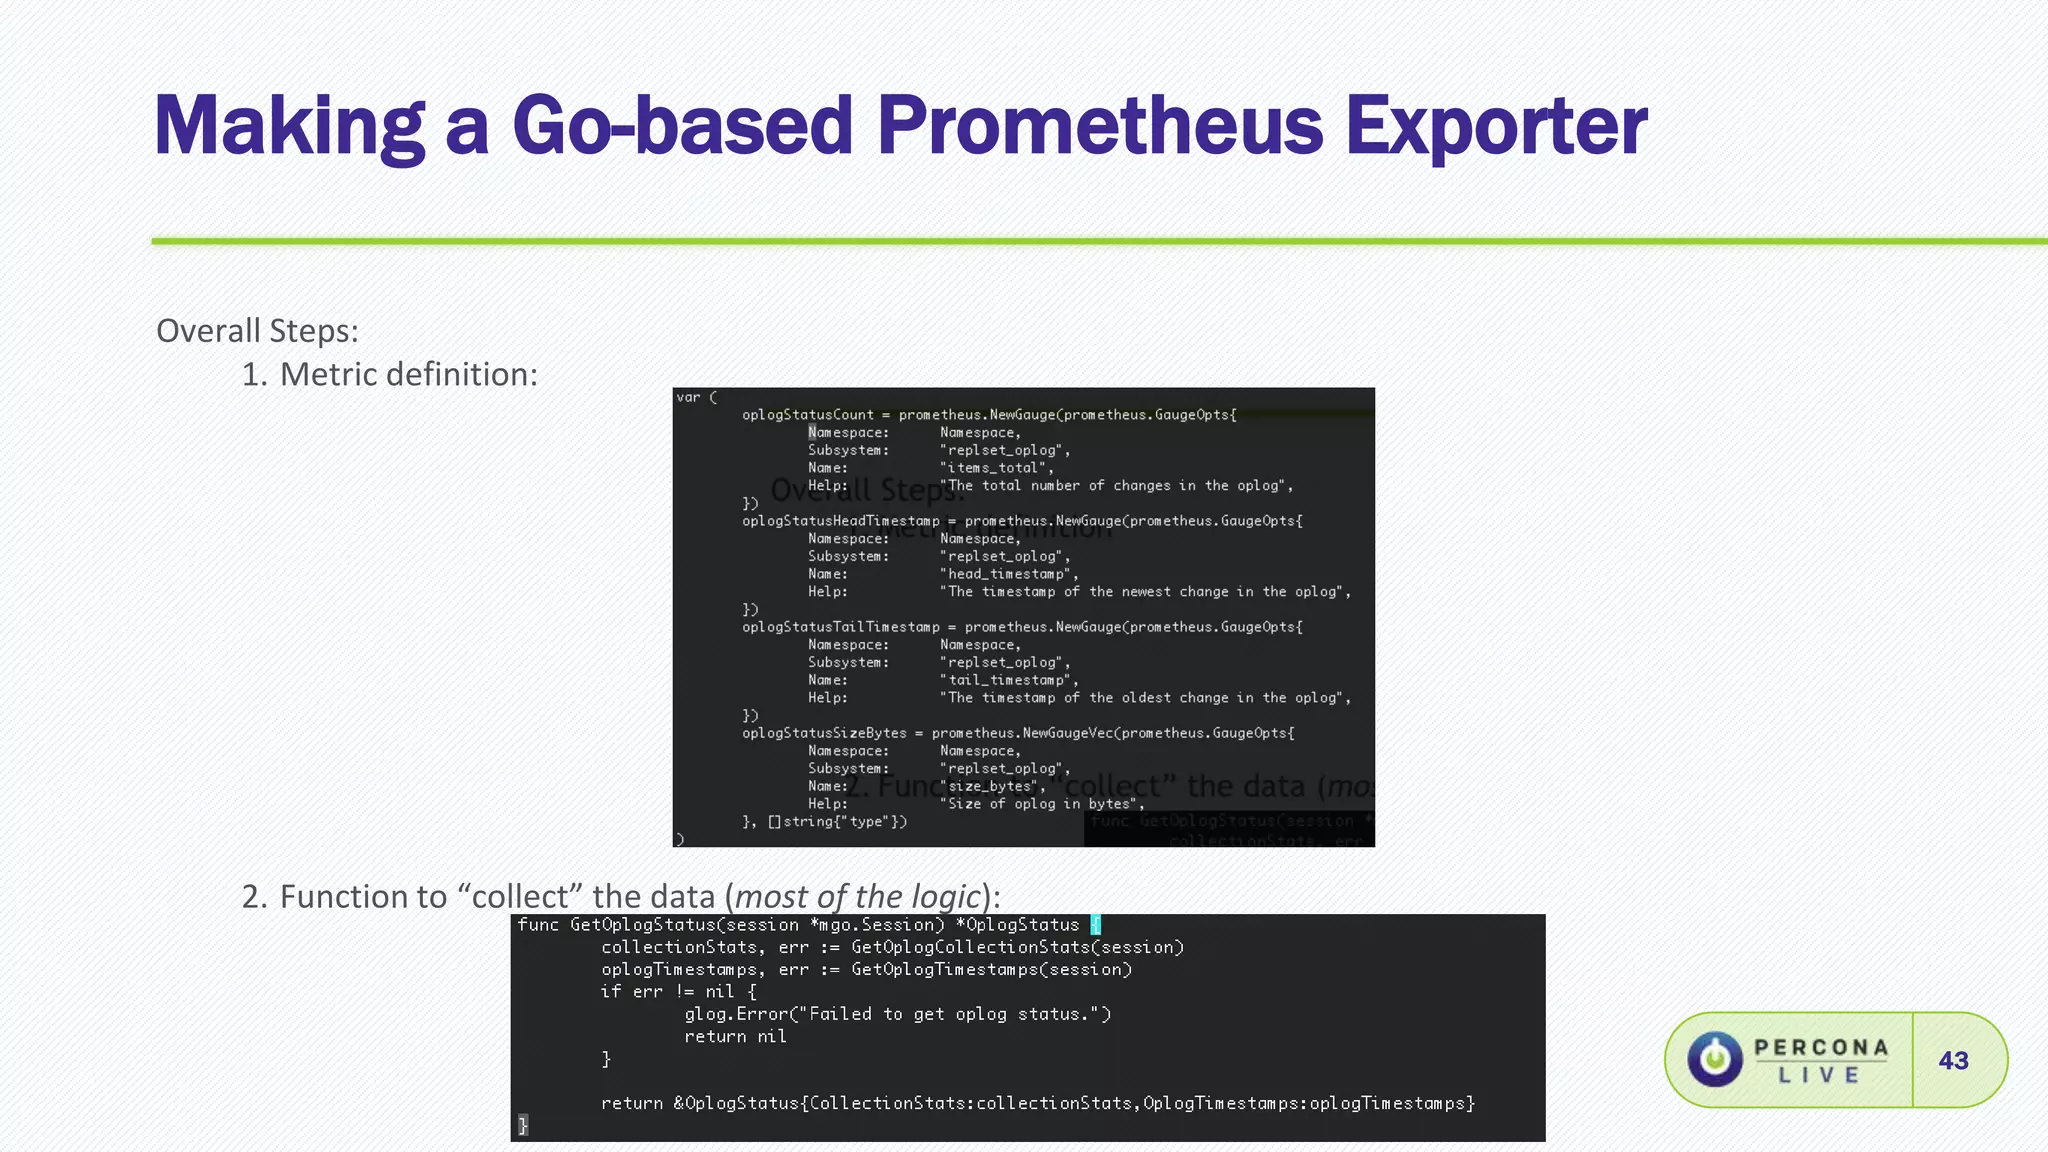
Making a Go-basedPrometheus Exporter
43
Overall Steps:
1. Metric definition:
2. Function to “collect” the data (most of the logic):
44.
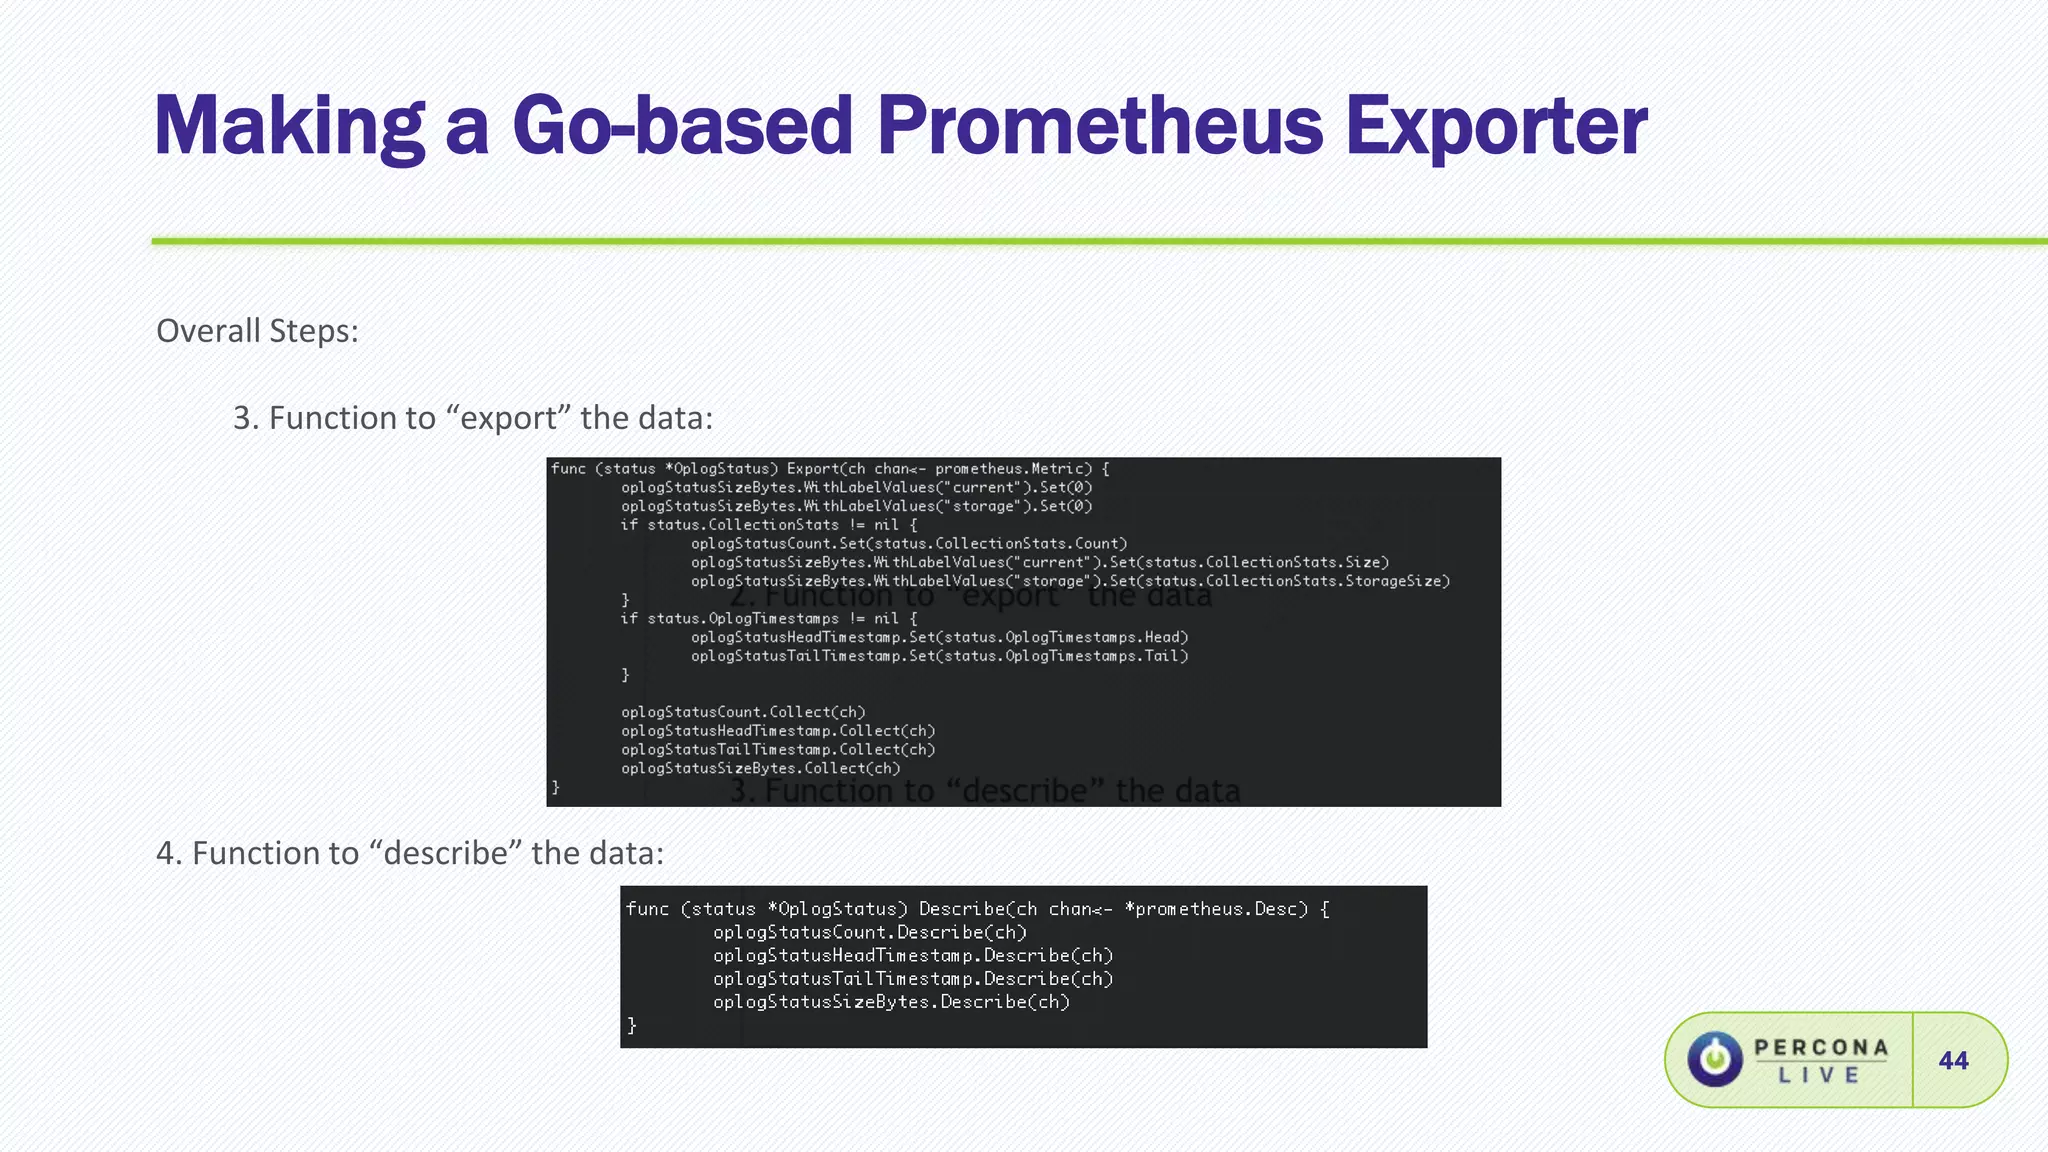
Making a Go-basedPrometheus Exporter
44
Overall Steps:
3. Function to “export” the data:
4. Function to “describe” the data:
45.
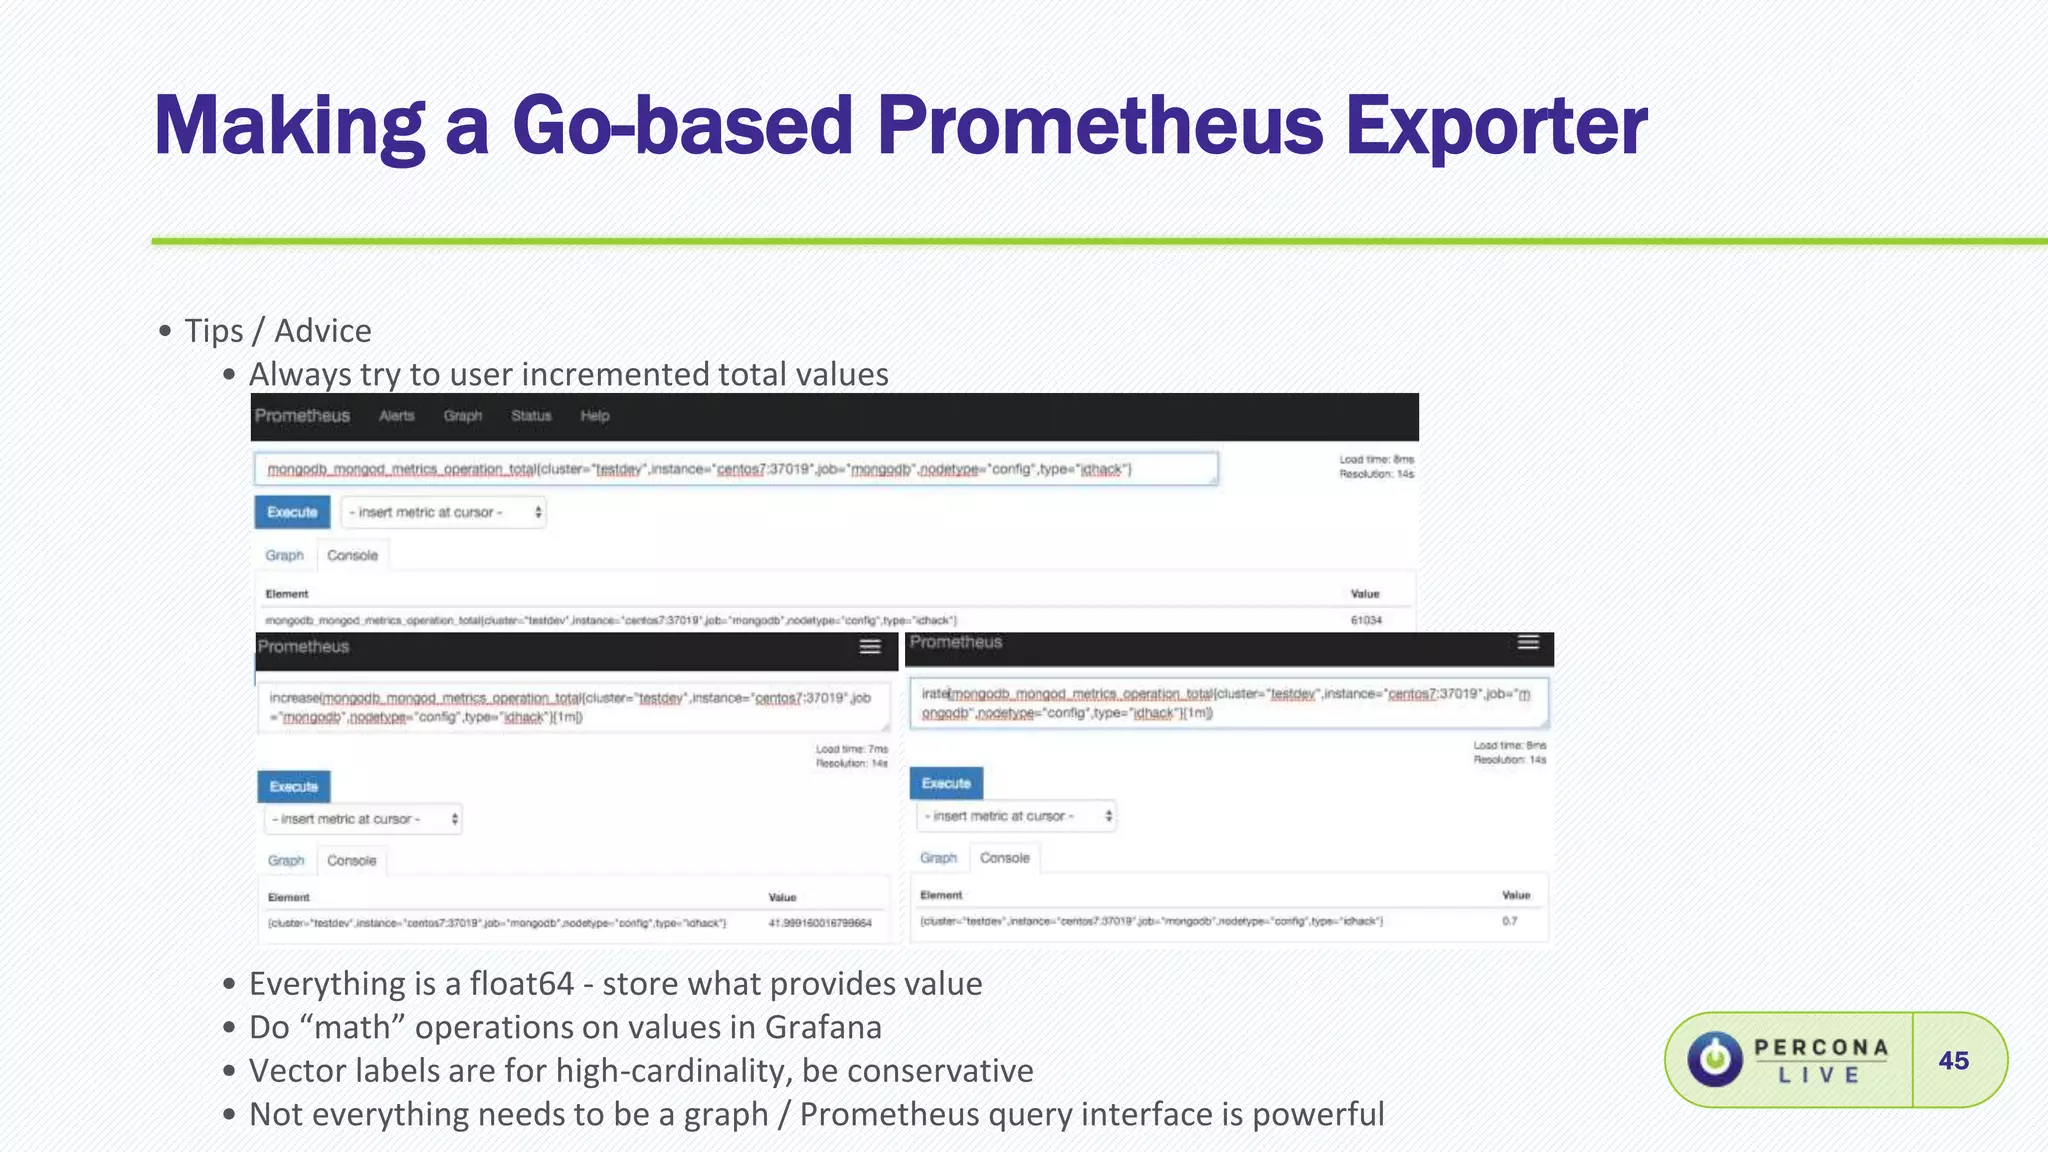
Making a Go-basedPrometheus Exporter
45
• Tips / Advice
• Always try to user incremented total values
• Everything is a float64 - store what provides value
• Do “math” operations on values in Grafana
• Vector labels are for high-cardinality, be conservative
• Not everything needs to be a graph / Prometheus query interface is powerful
46.
Alerting with Prometheus
46
Alertingwith Prometheus is separated into two parts. Alerting rules in Prometheus servers send
alerts to an Alertmanager.
The Alertmanager then manages those alerts, including silencing, inhibition, aggregation and
sending out notifications via methods such as email, PagerDuty, HipChat, Slack, Pushover.
The main steps to setting up alerting and notifications are:
• Create alerting rules in Prometheus
• Setup and configure the Alertmanager
• Configure Prometheus to talk to the Alertmanager with the -alertmanager.url flag
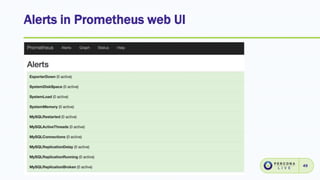
47.
Prometheus alerts
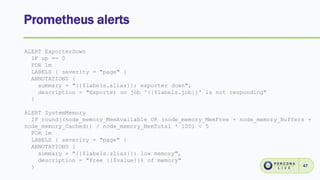
47
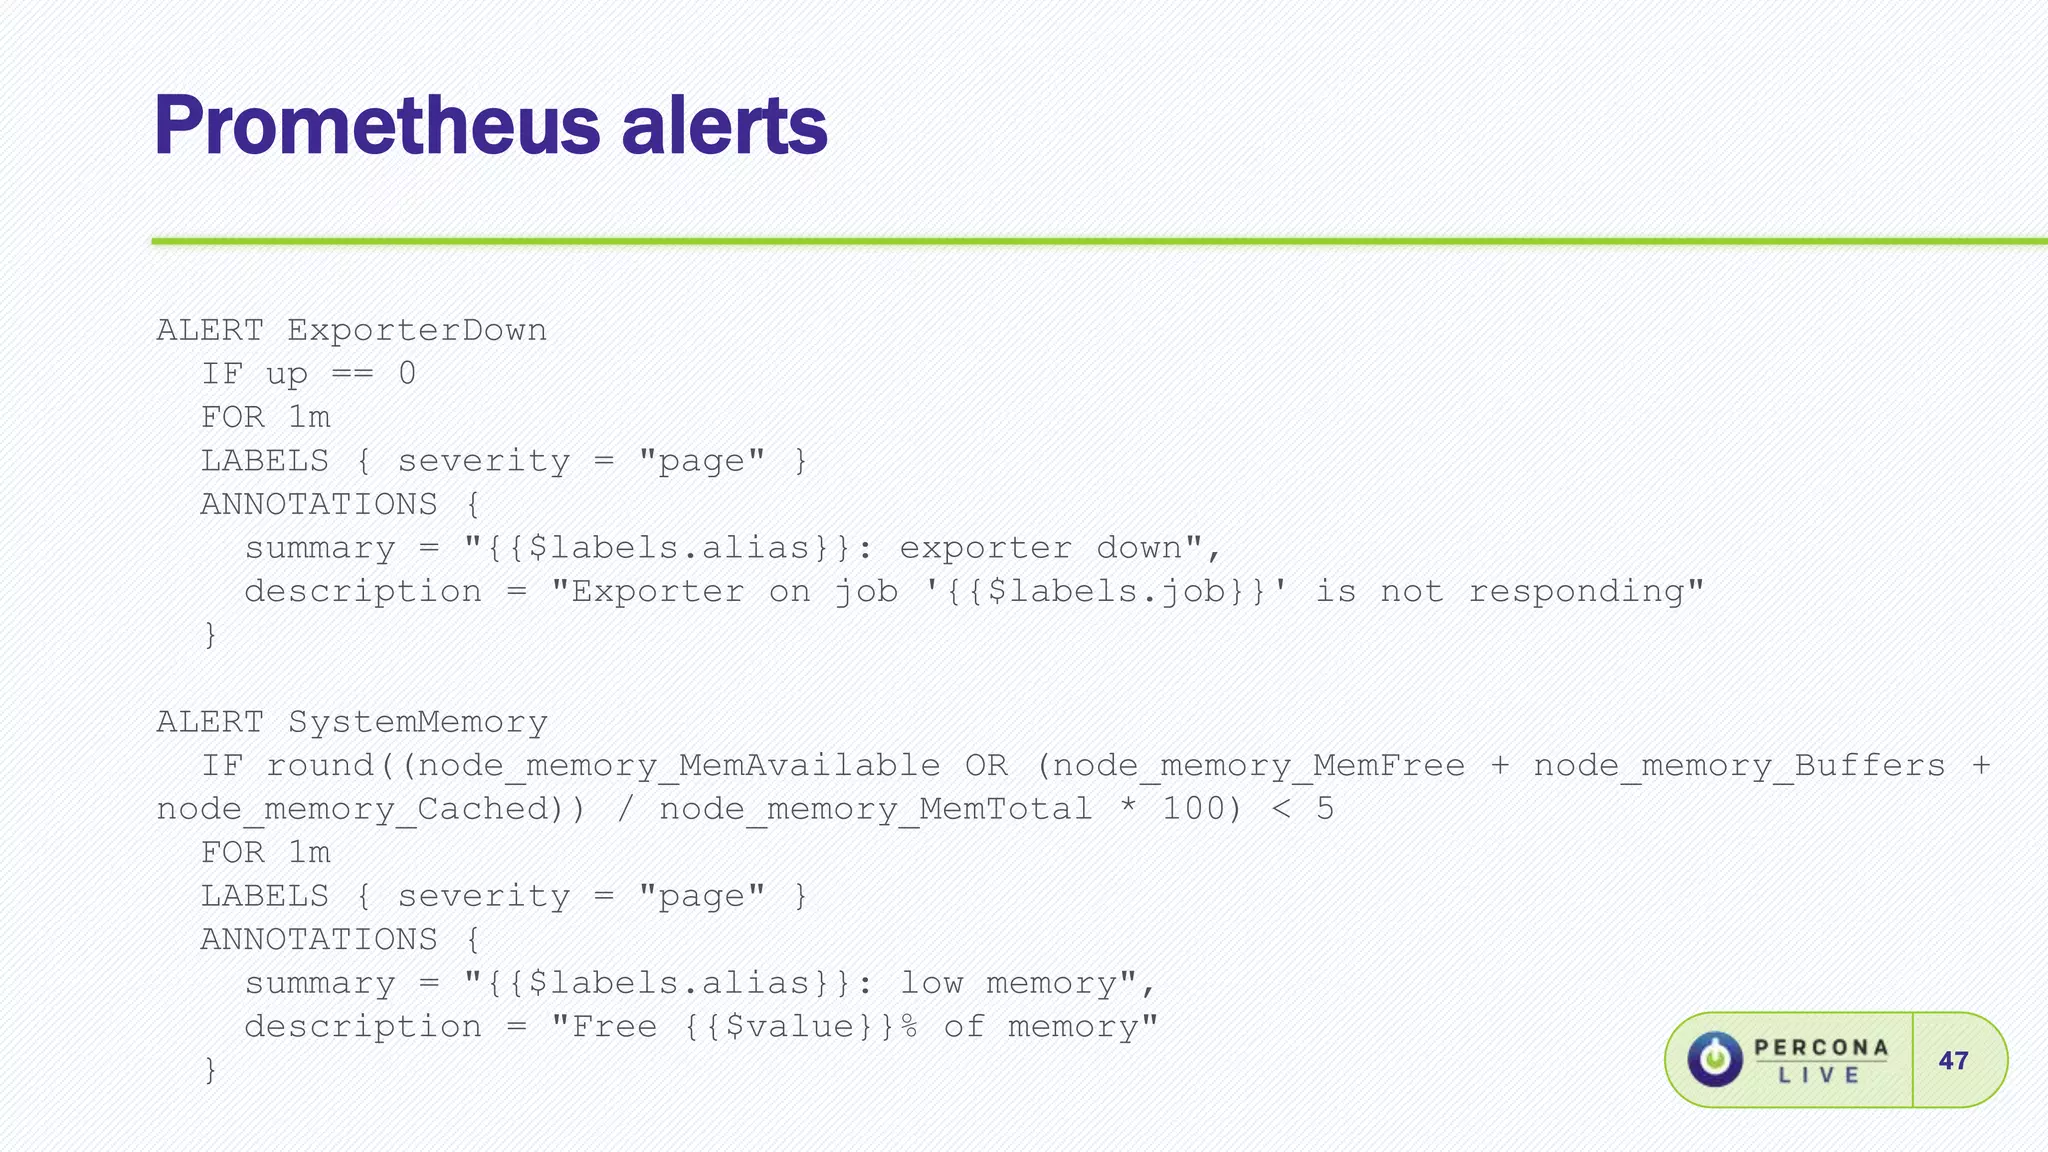
ALERT ExporterDown
IFup == 0
FOR 1m
LABELS { severity = "page" }
ANNOTATIONS {
summary = "{{$labels.alias}}: exporter down",
description = "Exporter on job '{{$labels.job}}' is not responding"
}
ALERT SystemMemory
IF round((node_memory_MemAvailable OR (node_memory_MemFree + node_memory_Buffers +
node_memory_Cached)) / node_memory_MemTotal * 100) < 5
FOR 1m
LABELS { severity = "page" }
ANNOTATIONS {
summary = "{{$labels.alias}}: low memory",
description = "Free {{$value}}% of memory"
}
48.
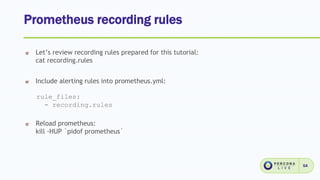
Configuring alerts inPrometheus
48
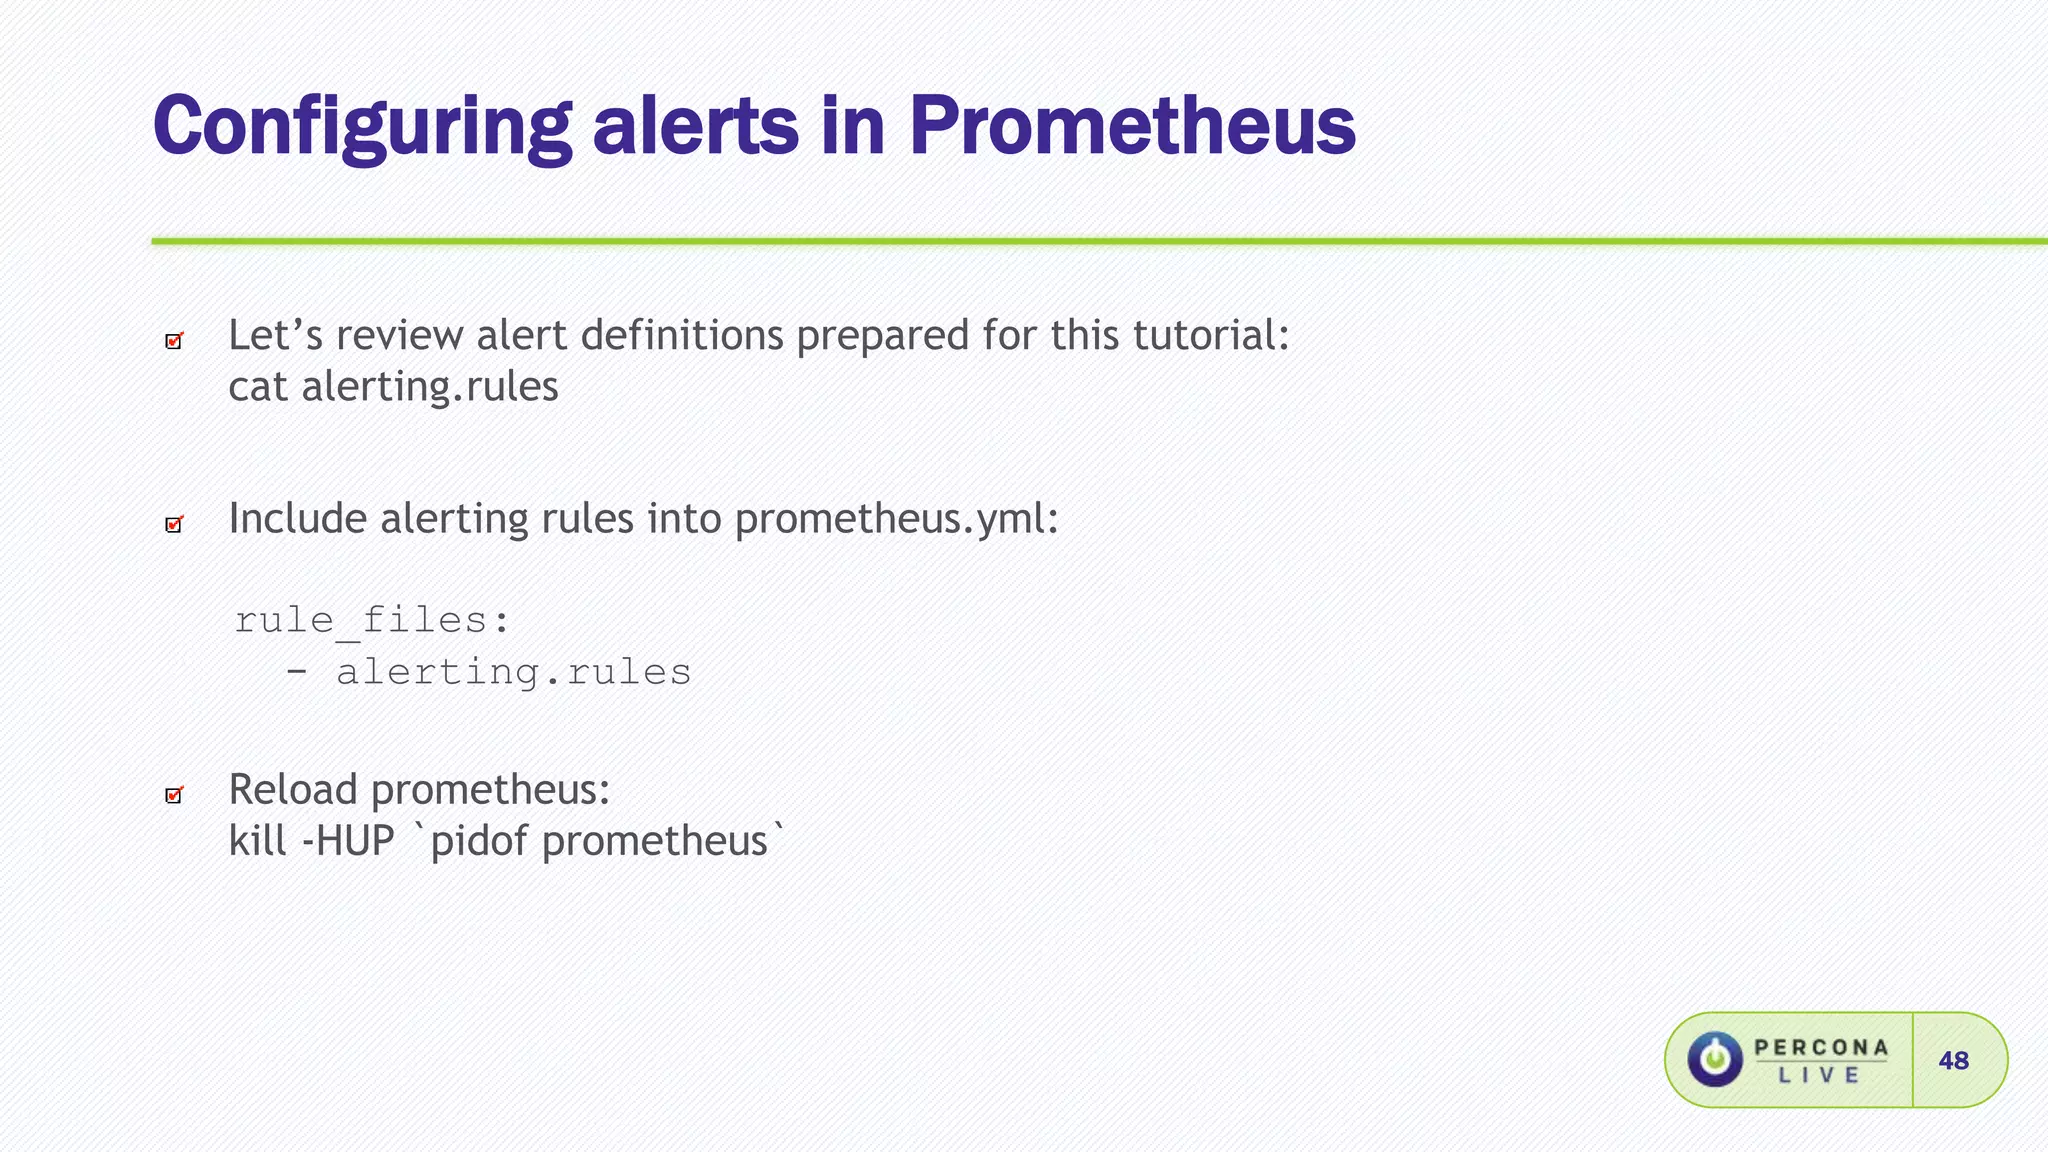
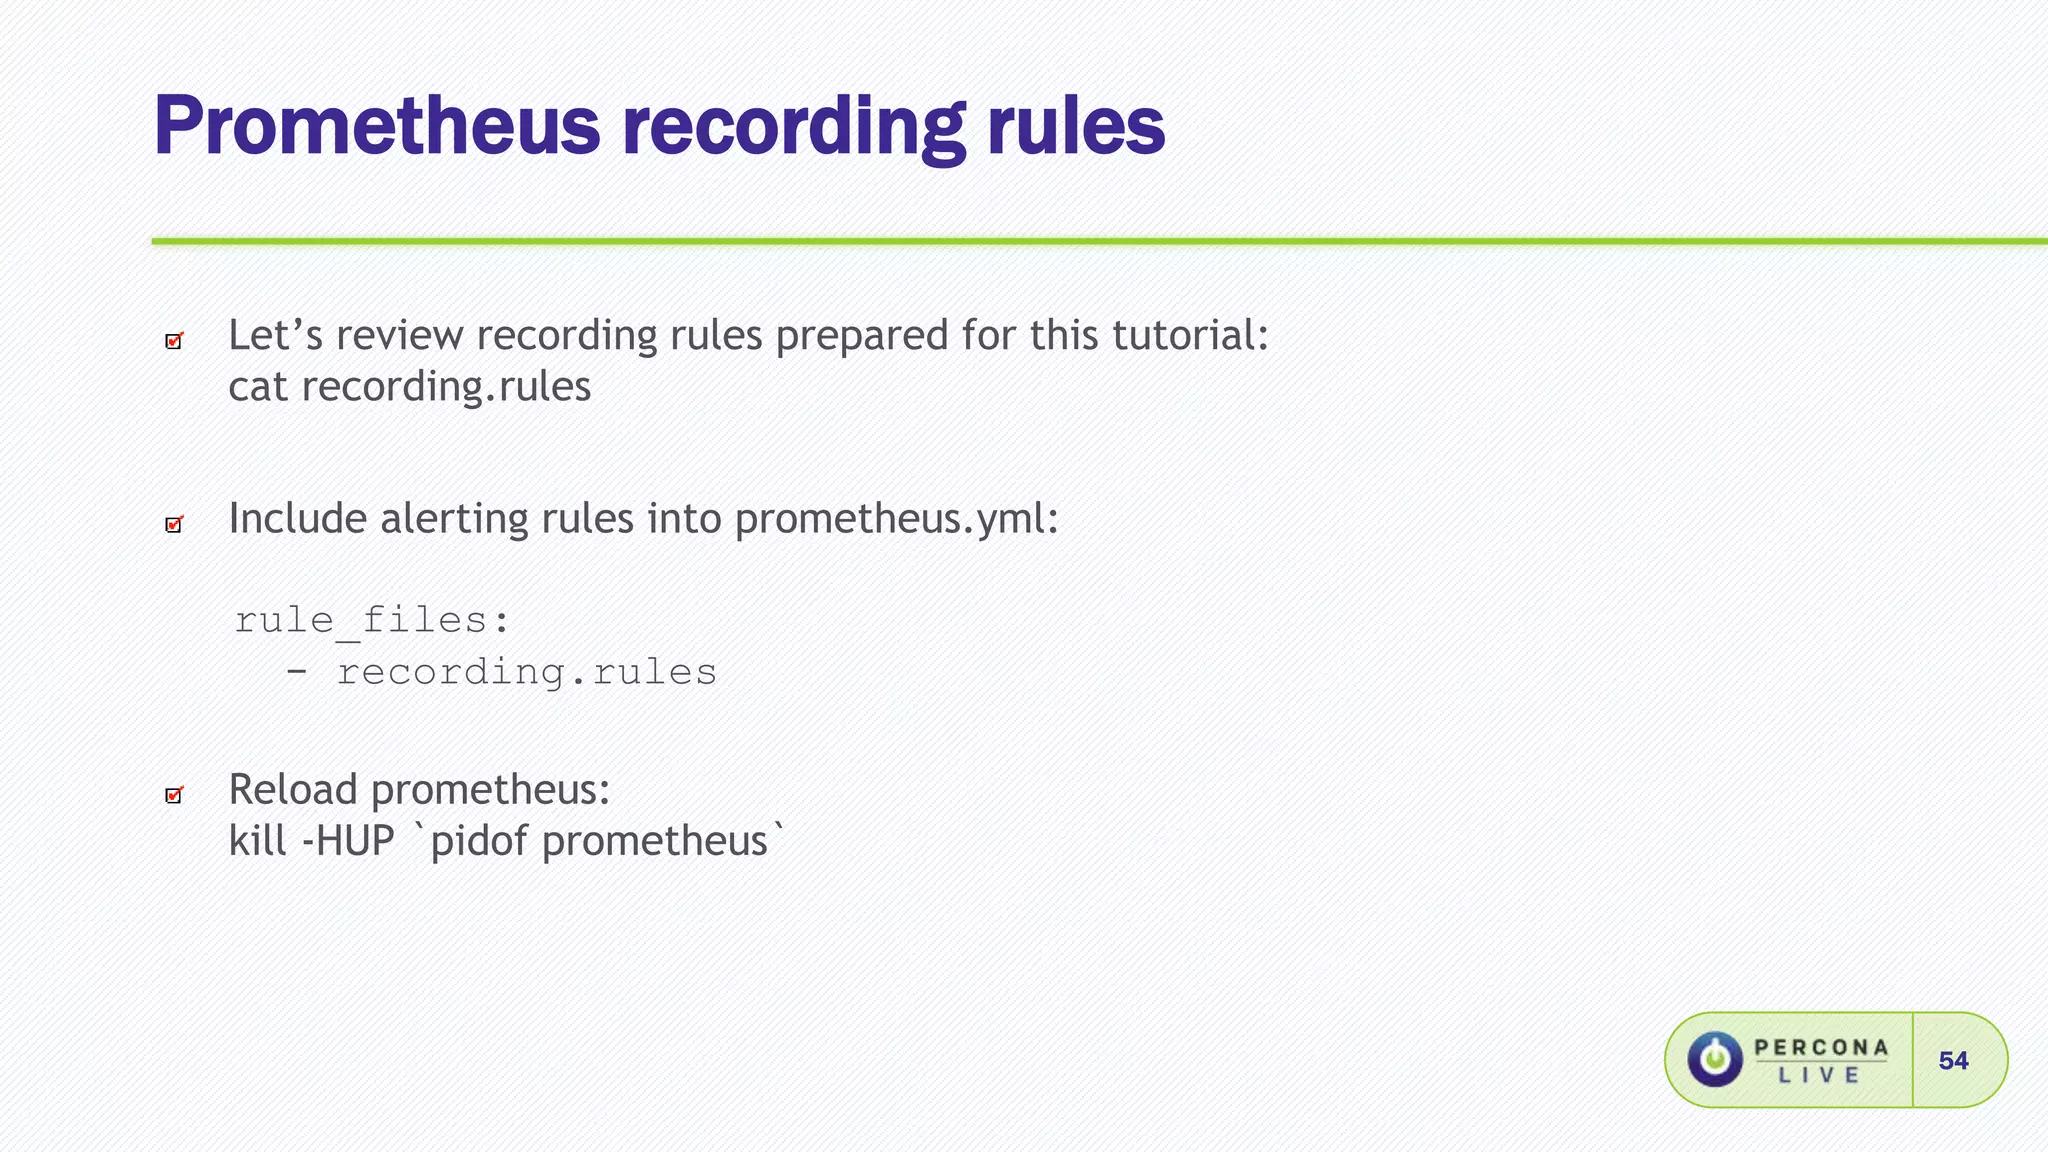
Let’s review alert definitions prepared for this tutorial:
cat alerting.rules
Include alerting rules into prometheus.yml:
rule_files:
- alerting.rules
Reload prometheus:
kill -HUP `pidof prometheus`
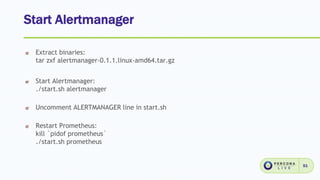
Using Alertmanager
50
Let’s reviewAlertmanager config prepared for this tutorial:
cat alertmanager.yml
Edit it with the appropriate email addresses for testing.
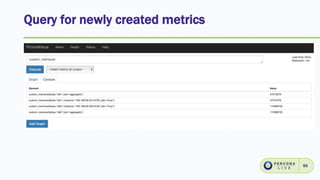
Working with PrometheusHTTP API
56
Instant and range queries, at a single point in time or range:
curl -sg 'http://localhost:9090/api/v1/query?query=up{job="mysql"}' | python -m json.tool
curl -sg 'http://localhost:9090/api/v1/query?query=ALERTS{alertstate="firing"}' | python -m
json.tool
curl -sg "http://localhost:9090/api/v1/query_range?query=node_load1&start=`expr $(date +%s) -
3600`&end=`date +%s`&step=5m" | python -m json.tool
Label values across the whole DB:
curl http://localhost:9090/api/v1/label/alias/values
List of series matching the expression:
curl -sg
'http://localhost:9090/api/v1/series?match[]=node_filesystem_size{fstype!~"rootfs|selinuxfs|autofs
|rpc_pipefs|tmpfs"}'| python -m json.tool
Delete series:
curl -g -X DELETE 'http://localhost:9090/api/v1/series?match[]={alias="db2"}'
57.
InfluxDB overview
57
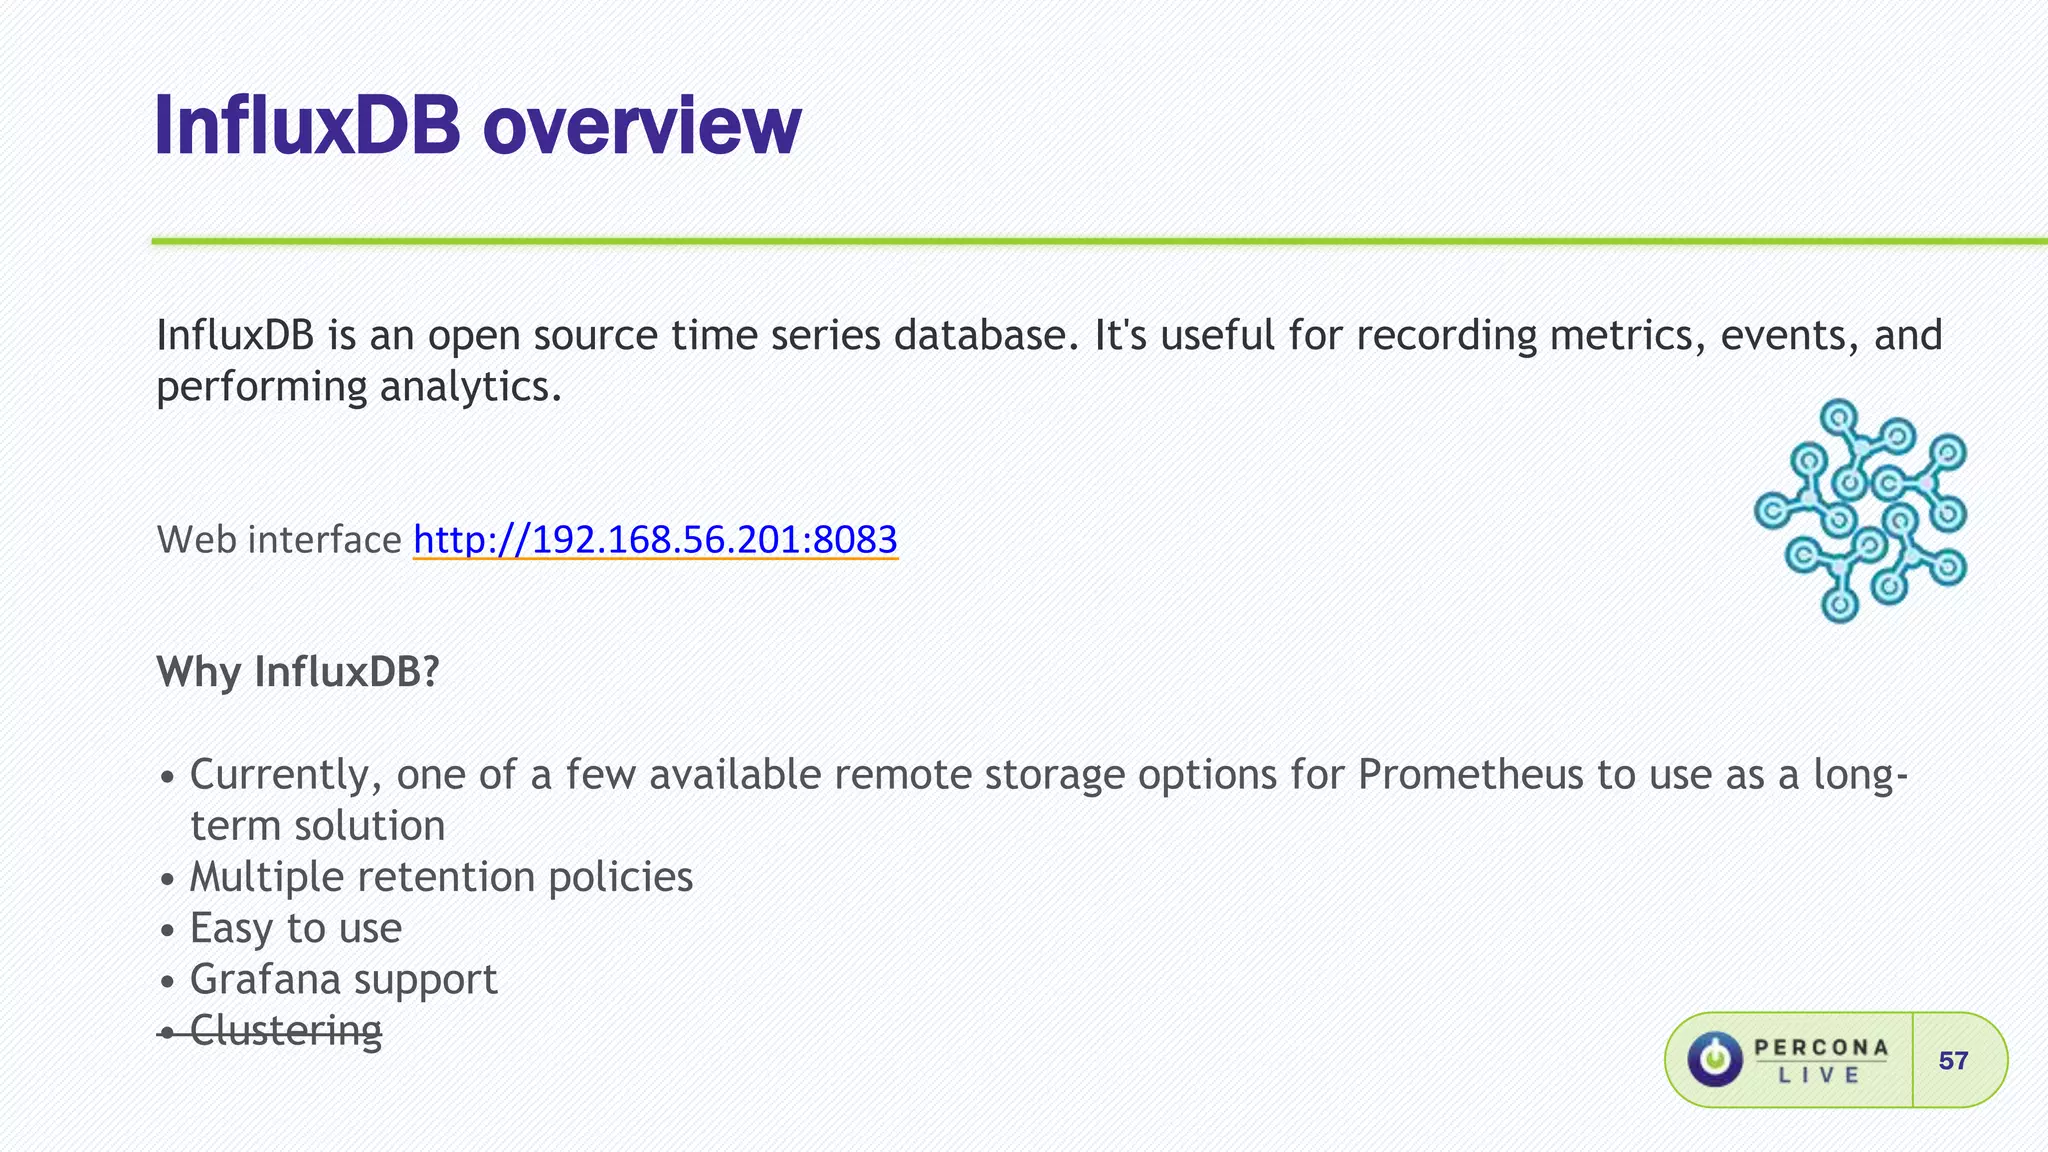
InfluxDB isan open source time series database. It's useful for recording metrics, events, and
performing analytics.
Web interface http://192.168.56.201:8083
Why InfluxDB?
• Currently, one of a few available remote storage options for Prometheus to use as a long-
term solution
• Multiple retention policies
• Easy to use
• Grafana support
• Clustering
58.
Configure Prometheus withInfluxDB
58
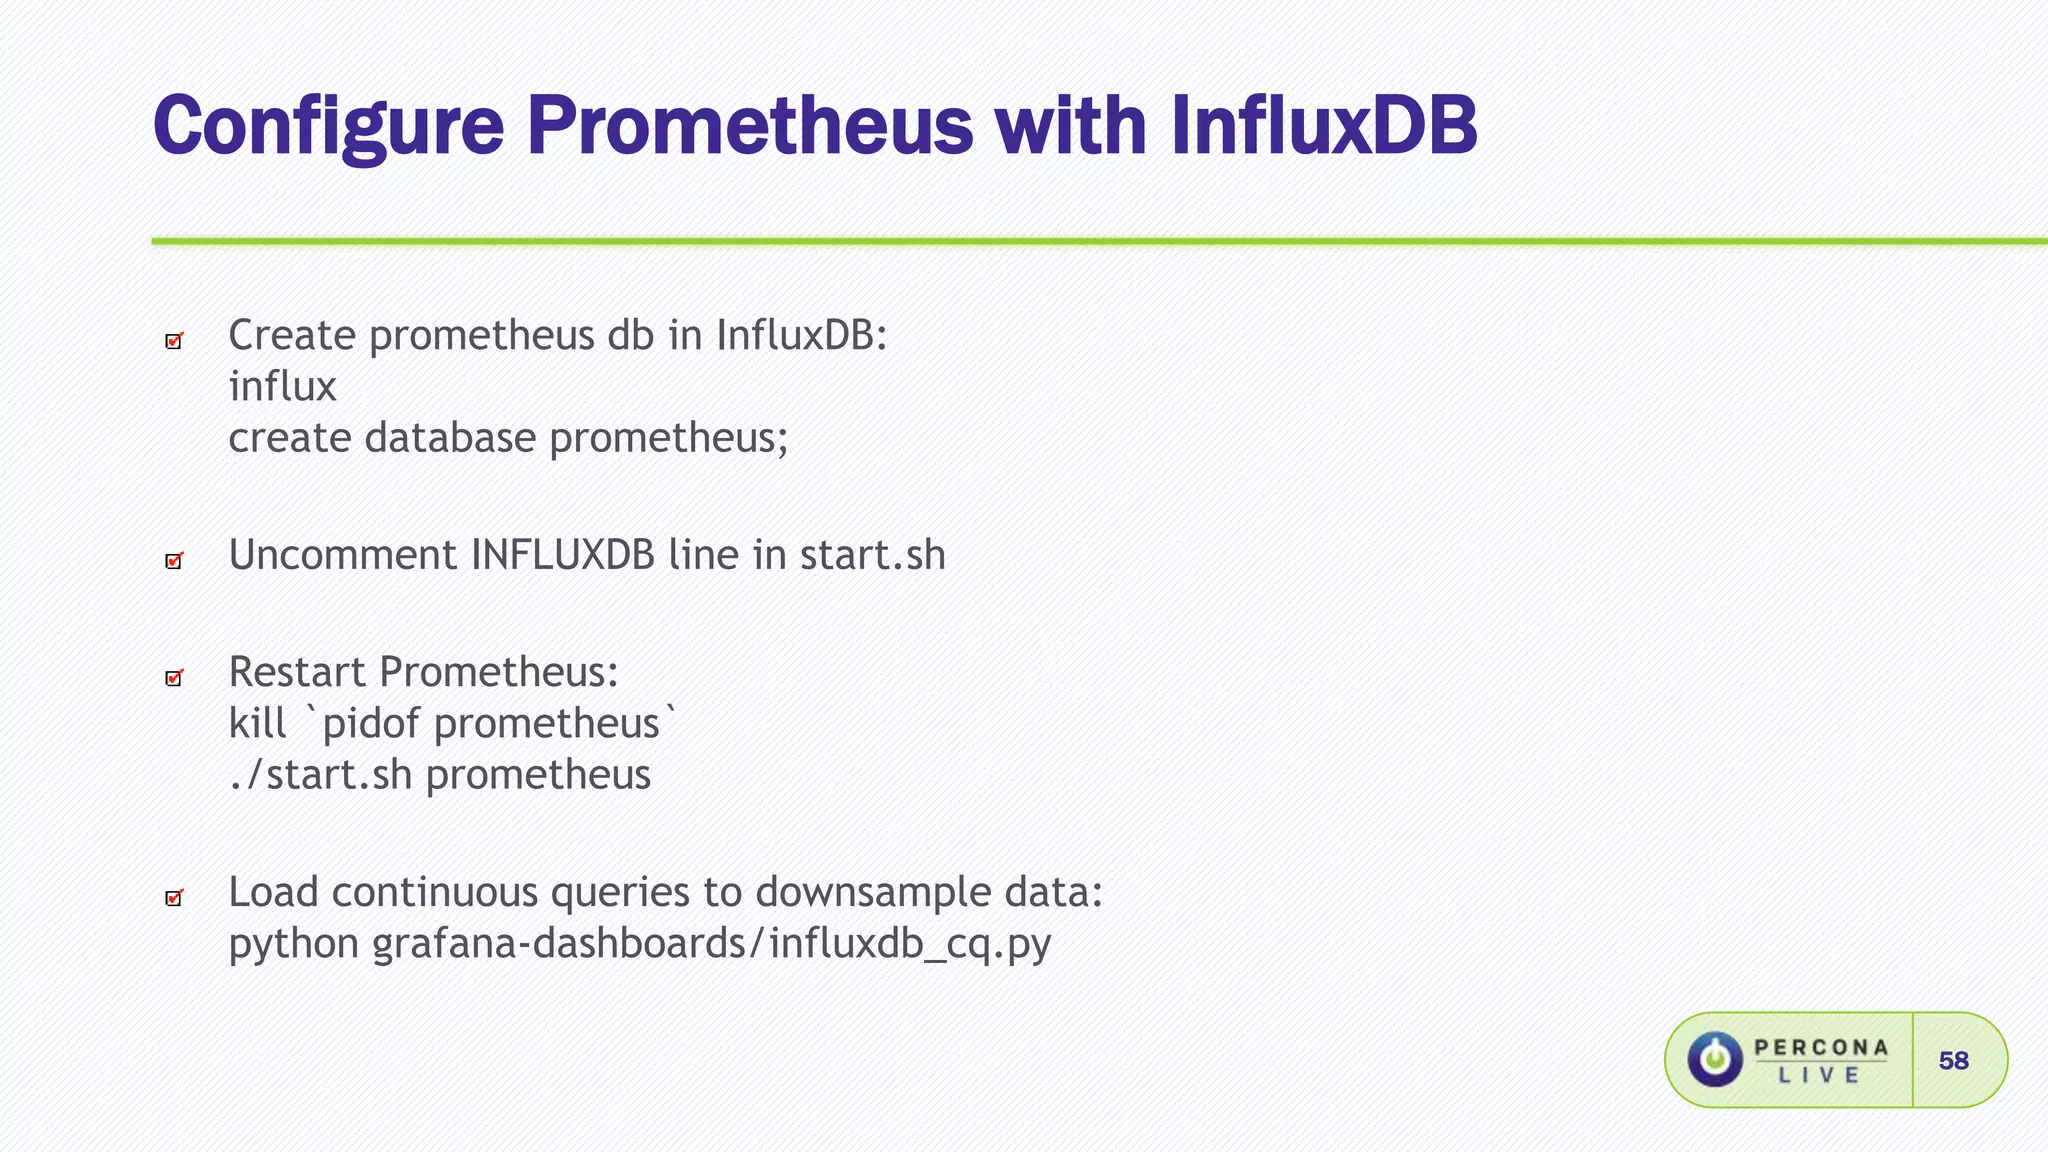
Create prometheus db in InfluxDB:
influx
create database prometheus;
Uncomment INFLUXDB line in start.sh
Restart Prometheus:
kill `pidof prometheus`
./start.sh prometheus
Load continuous queries to downsample data:
python grafana-dashboards/influxdb_cq.py
59.
Using InfluxDB
59
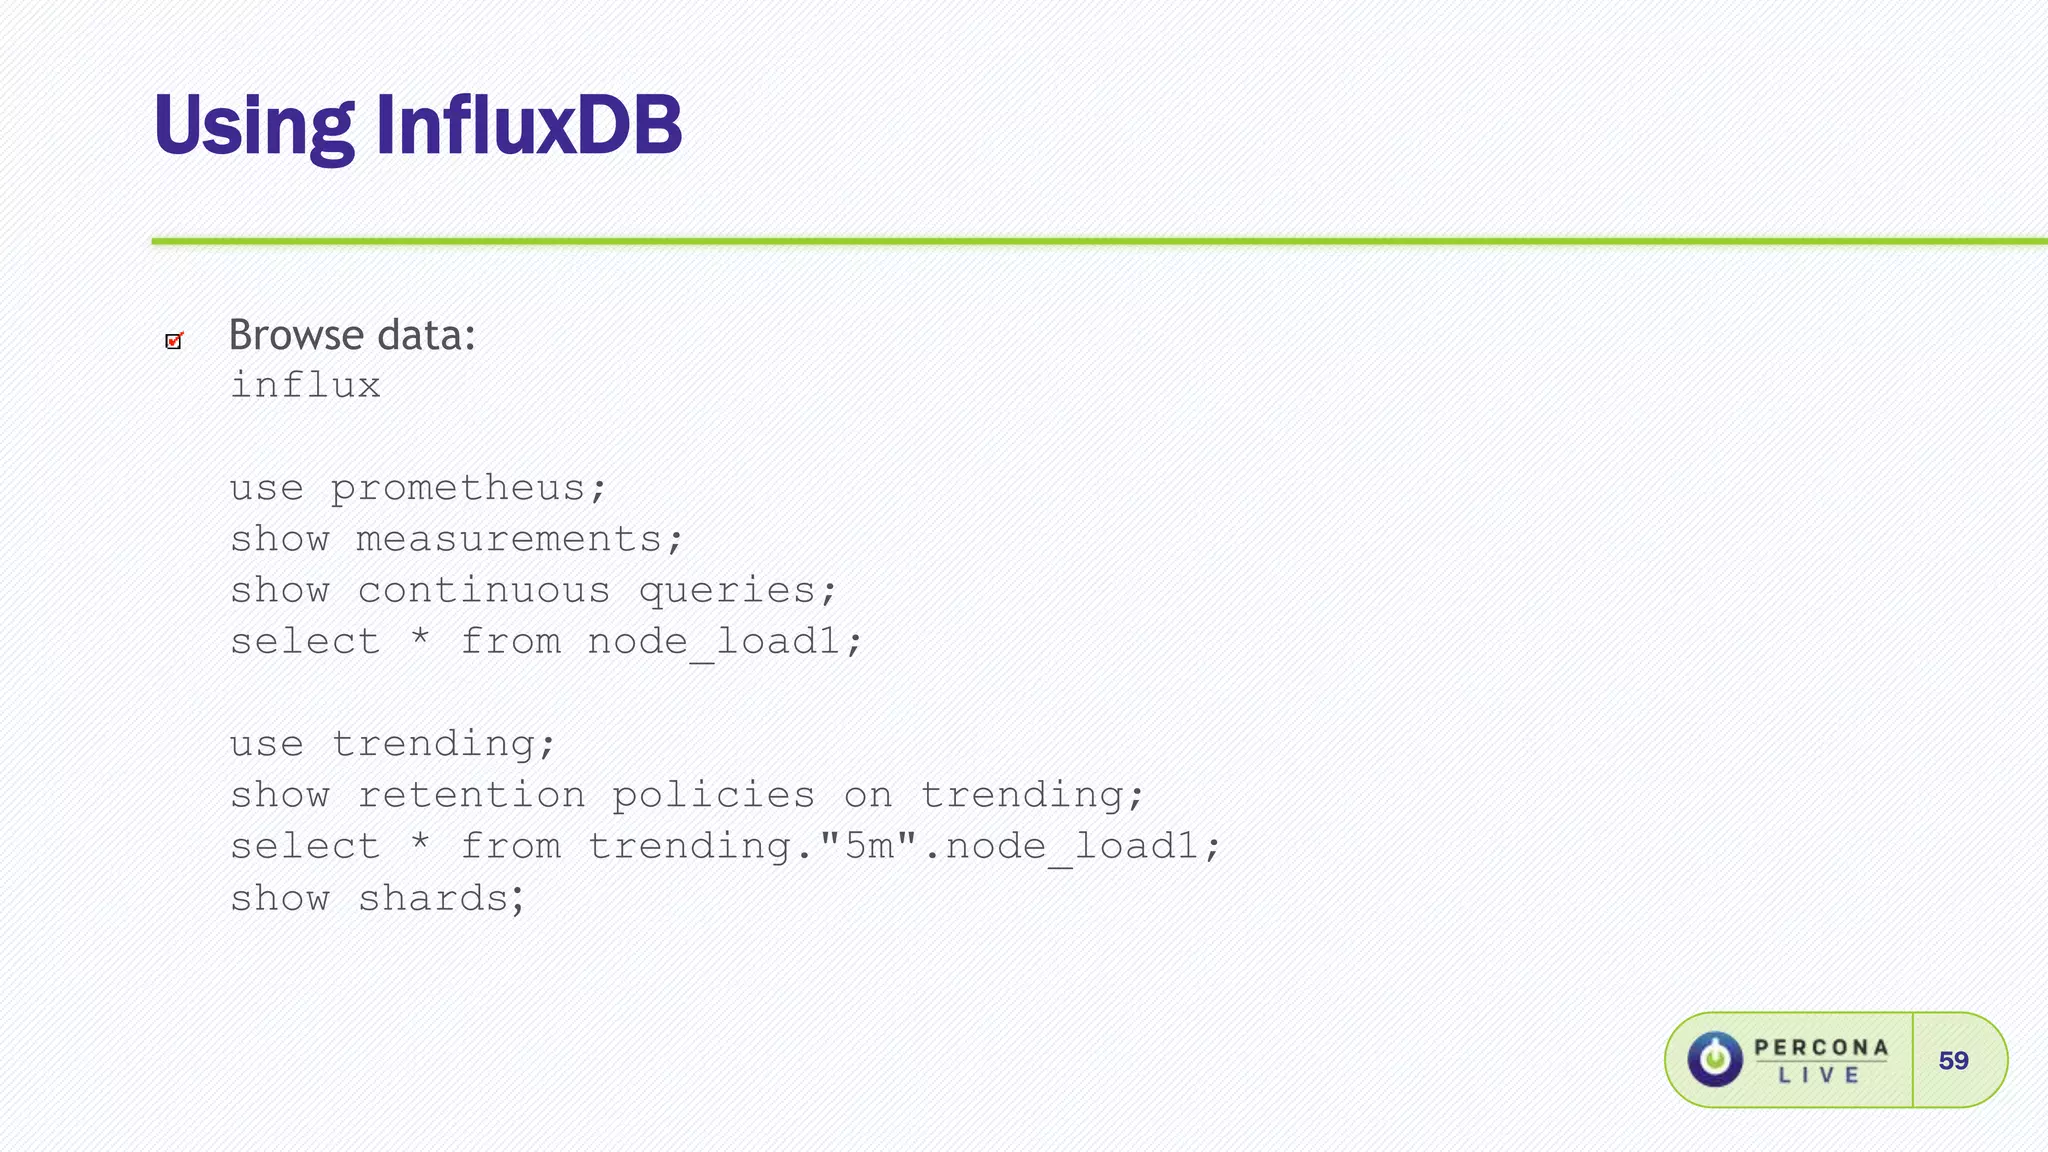
Browse data:
influx
useprometheus;
show measurements;
show continuous queries;
select * from node_load1;
use trending;
show retention policies on trending;
select * from trending."5m".node_load1;
show shards;
What’s next?
61
• Grafana3.0 release: pie charts, more functionality, improved Prometheus datasource?
• More long-term storage options for Prometheus
• Alertmanager production-ready status?
• InfluxDB or not InfluxDB?


![Percona Grafana dashboards
19
Open-source and available @ https://github.com/percona/grafana-dashboards
This is a set of Grafana dashboards to be used with Prometheus and InfluxDB datasources for
MySQL and system monitoring. MongoDB dashboard to be shared separately.
MySQL:
• MySQL InnoDB Metrics
• MySQL MyISAM Metrics
• MySQL Overview
• MySQL Performance Schema
• MySQL Query Response Time
• MySQL Replication
• MySQL Table Statistics
• MySQL User Statistics
• Galera Graphs
• TokuDB Graphs
System:
• System Overview
• Disk Space
• Disk Performance
Mixed:
• Cross Server Graphs
• Summary Dashboard
• Trends Dashboard
• Prometheus
• [InfluxDB] 5m downsample
• [InfluxDB] 1h downsample](https://image.slidesharecdn.com/eb7ede0c-dfc4-46ce-848e-7fb7ff8c4652-160420235653/85/Monitoring_with_Prometheus_Grafana_Tutorial-19-320.jpg)
![Install dashboards
20
Copy dashboard files:
cp -r grafana-dashboards/dashboards/ /var/lib/grafana/
Enable JSON dashboards by adding those lines to /etc/grafana/grafana.ini:
[dashboards.json]
enabled = true
path = /var/lib/grafana/dashboards
Restart Grafana:
systemctl restart grafana-server.service](https://image.slidesharecdn.com/eb7ede0c-dfc4-46ce-848e-7fb7ff8c4652-160420235653/85/Monitoring_with_Prometheus_Grafana_Tutorial-20-320.jpg)


![Working with Prometheus HTTP API
56
Instant and range queries, at a single point in time or range:
curl -sg 'http://localhost:9090/api/v1/query?query=up{job="mysql"}' | python -m json.tool
curl -sg 'http://localhost:9090/api/v1/query?query=ALERTS{alertstate="firing"}' | python -m
json.tool
curl -sg "http://localhost:9090/api/v1/query_range?query=node_load1&start=`expr $(date +%s) -
3600`&end=`date +%s`&step=5m" | python -m json.tool
Label values across the whole DB:
curl http://localhost:9090/api/v1/label/alias/values
List of series matching the expression:
curl -sg
'http://localhost:9090/api/v1/series?match[]=node_filesystem_size{fstype!~"rootfs|selinuxfs|autofs
|rpc_pipefs|tmpfs"}'| python -m json.tool
Delete series:
curl -g -X DELETE 'http://localhost:9090/api/v1/series?match[]={alias="db2"}'](https://image.slidesharecdn.com/eb7ede0c-dfc4-46ce-848e-7fb7ff8c4652-160420235653/85/Monitoring_with_Prometheus_Grafana_Tutorial-56-320.jpg)


![Percona Grafana dashboards
19
Open-source and available @ https://github.com/percona/grafana-dashboards
This is a set of Grafana dashboards to be used with Prometheus and InfluxDB datasources for
MySQL and system monitoring. MongoDB dashboard to be shared separately.
MySQL:
• MySQL InnoDB Metrics
• MySQL MyISAM Metrics
• MySQL Overview
• MySQL Performance Schema
• MySQL Query Response Time
• MySQL Replication
• MySQL Table Statistics
• MySQL User Statistics
• Galera Graphs
• TokuDB Graphs
System:
• System Overview
• Disk Space
• Disk Performance
Mixed:
• Cross Server Graphs
• Summary Dashboard
• Trends Dashboard
• Prometheus
• [InfluxDB] 5m downsample
• [InfluxDB] 1h downsample](https://image.slidesharecdn.com/eb7ede0c-dfc4-46ce-848e-7fb7ff8c4652-160420235653/75/Monitoring_with_Prometheus_Grafana_Tutorial-19-2048.jpg)
![Install dashboards
20
Copy dashboard files:
cp -r grafana-dashboards/dashboards/ /var/lib/grafana/
Enable JSON dashboards by adding those lines to /etc/grafana/grafana.ini:
[dashboards.json]
enabled = true
path = /var/lib/grafana/dashboards
Restart Grafana:
systemctl restart grafana-server.service](https://image.slidesharecdn.com/eb7ede0c-dfc4-46ce-848e-7fb7ff8c4652-160420235653/75/Monitoring_with_Prometheus_Grafana_Tutorial-20-2048.jpg)
![Working with Prometheus HTTP API
56
Instant and range queries, at a single point in time or range:
curl -sg 'http://localhost:9090/api/v1/query?query=up{job="mysql"}' | python -m json.tool
curl -sg 'http://localhost:9090/api/v1/query?query=ALERTS{alertstate="firing"}' | python -m
json.tool
curl -sg "http://localhost:9090/api/v1/query_range?query=node_load1&start=`expr $(date +%s) -
3600`&end=`date +%s`&step=5m" | python -m json.tool
Label values across the whole DB:
curl http://localhost:9090/api/v1/label/alias/values
List of series matching the expression:
curl -sg
'http://localhost:9090/api/v1/series?match[]=node_filesystem_size{fstype!~"rootfs|selinuxfs|autofs
|rpc_pipefs|tmpfs"}'| python -m json.tool
Delete series:
curl -g -X DELETE 'http://localhost:9090/api/v1/series?match[]={alias="db2"}'](https://image.slidesharecdn.com/eb7ede0c-dfc4-46ce-848e-7fb7ff8c4652-160420235653/75/Monitoring_with_Prometheus_Grafana_Tutorial-56-2048.jpg)