Download as PDF, PPTX


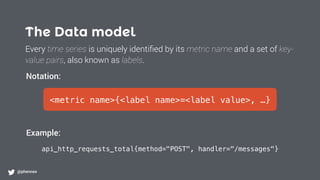


![PromQL - Examples
@phennex
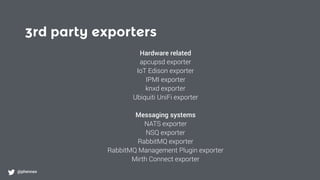
rate(api_http_requests_total[5m])
errors{job=“foo”} / total{job=“foo”}
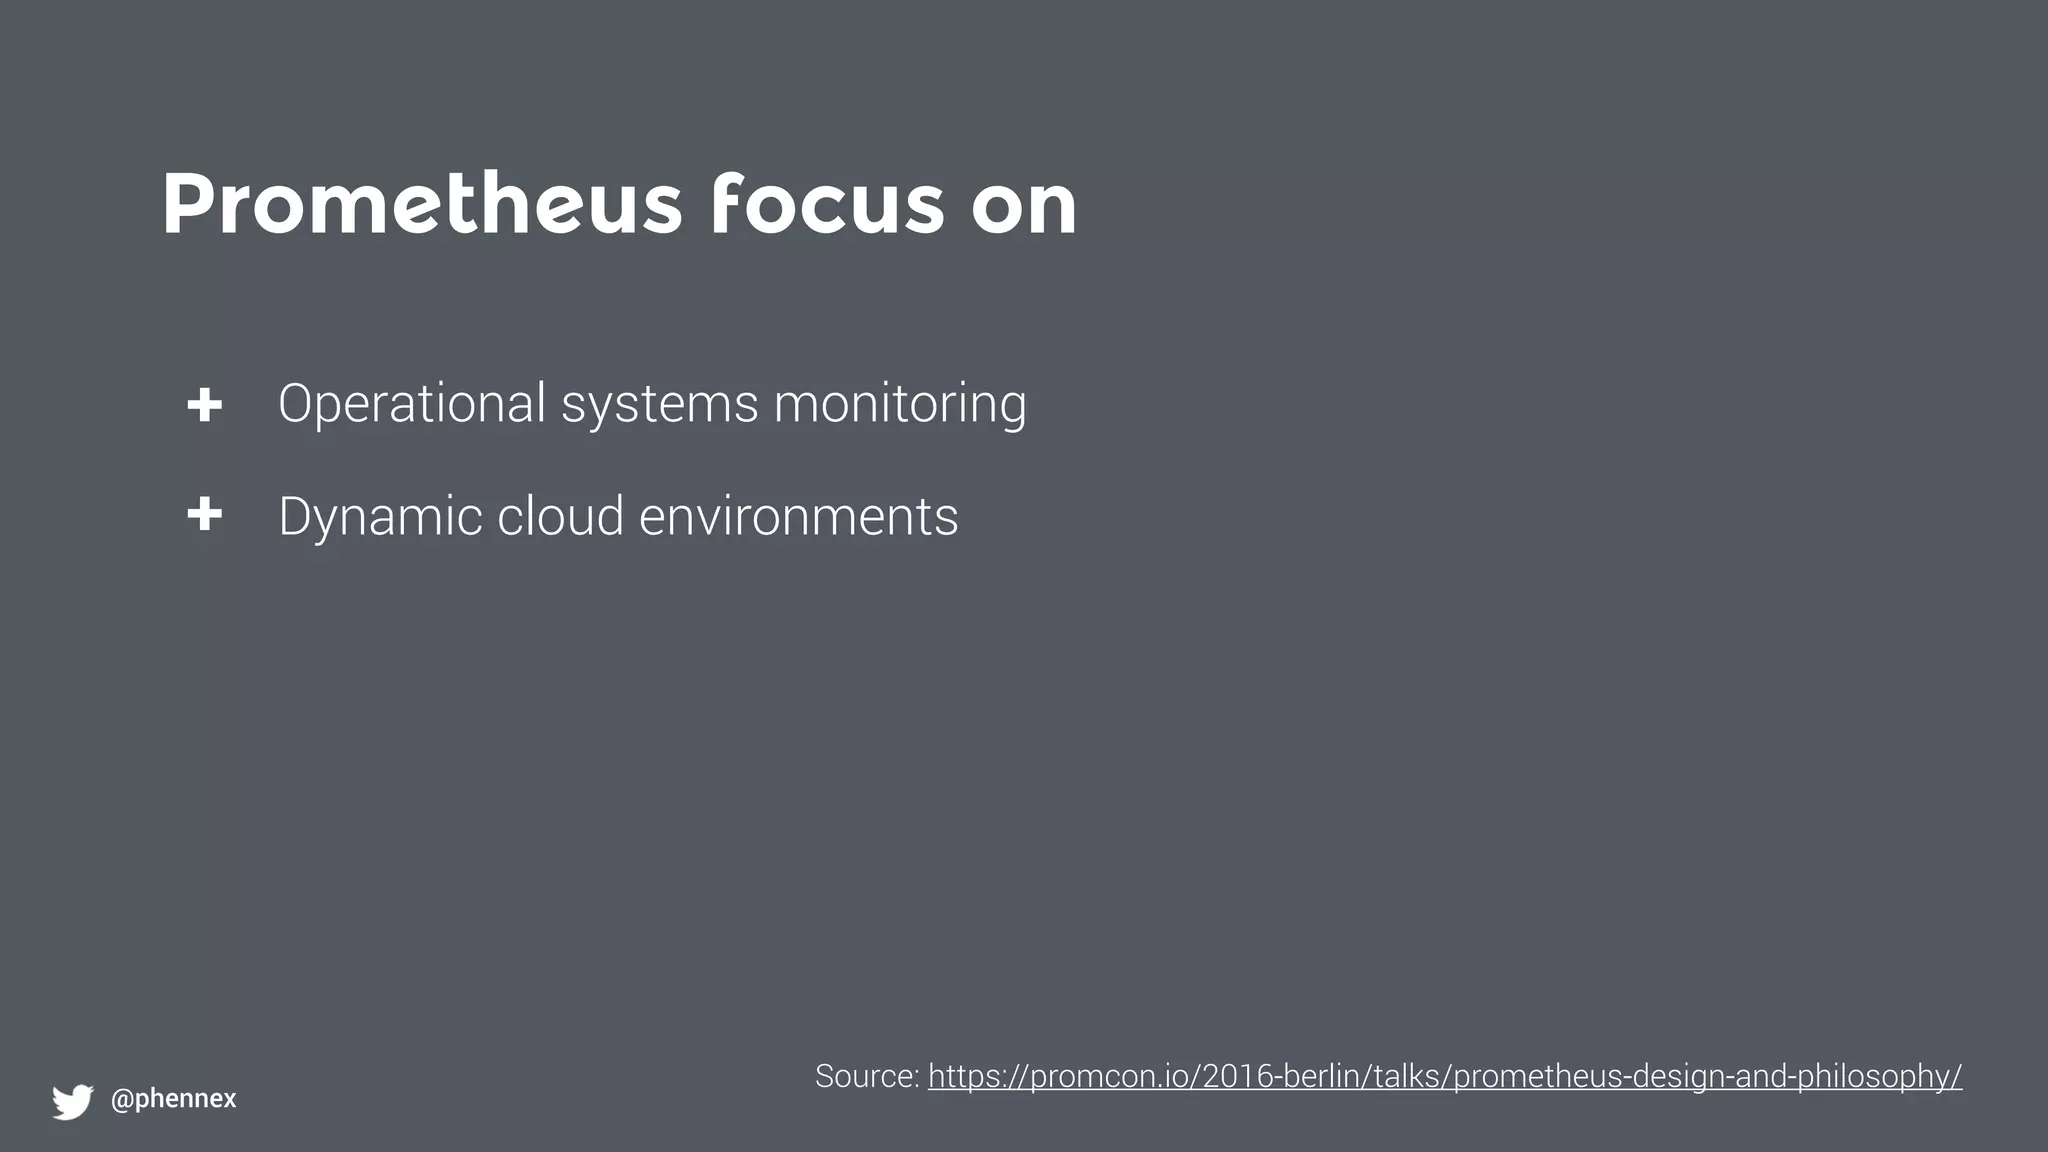
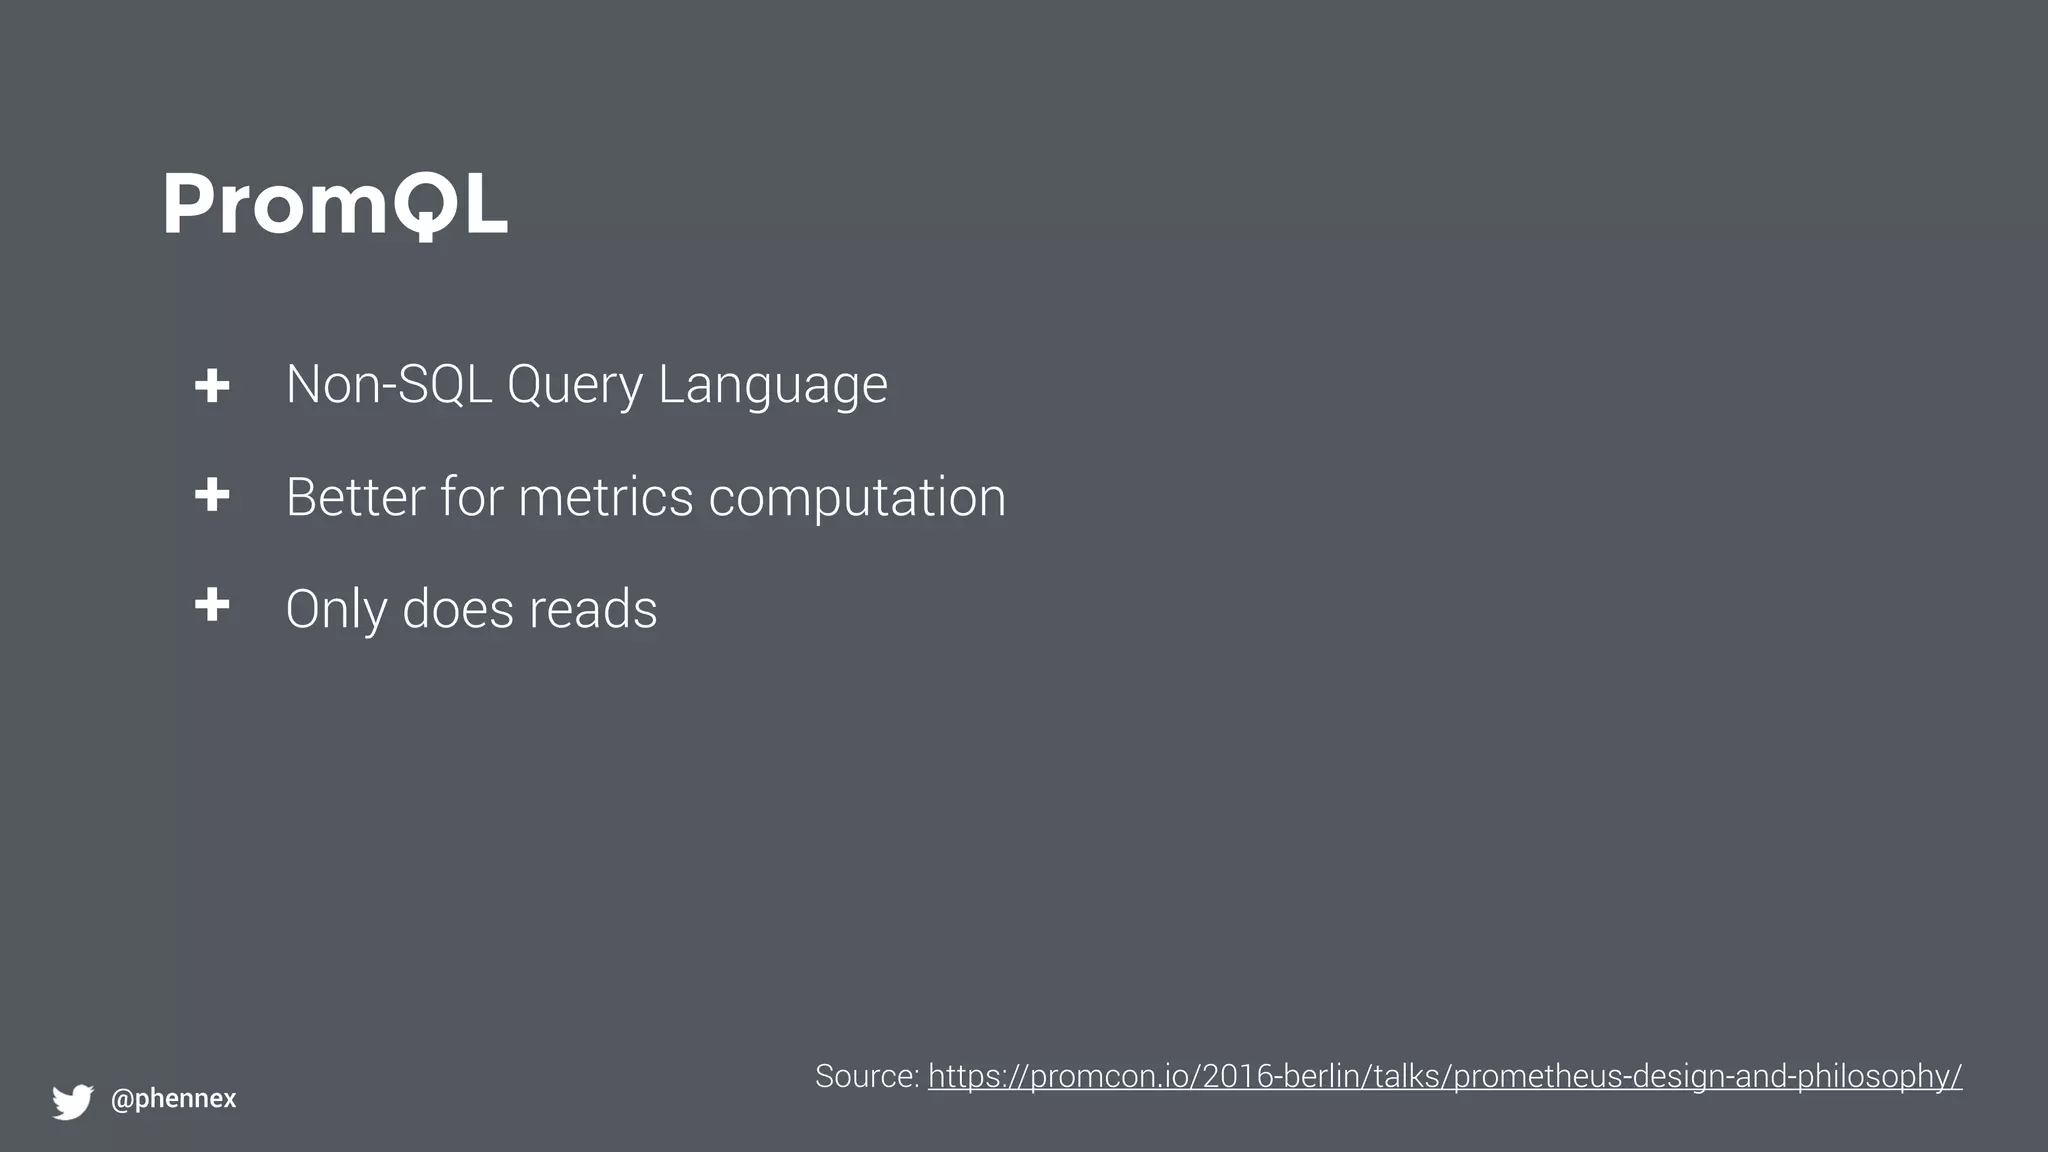
Source: https://promcon.io/2016-berlin/talks/prometheus-design-and-philosophy/](https://image.slidesharecdn.com/monitoringwithprometheus-161102054822/85/Monitoring-with-prometheus-40-320.jpg)


![PromQL - Examples
@phennex
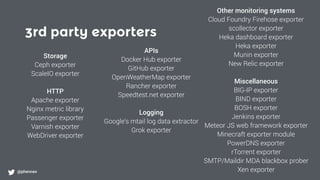
rate(api_http_requests_total[5m])
errors{job=“foo”} / total{job=“foo”}
Source: https://promcon.io/2016-berlin/talks/prometheus-design-and-philosophy/](https://image.slidesharecdn.com/monitoringwithprometheus-161102054822/75/Monitoring-with-prometheus-40-2048.jpg)


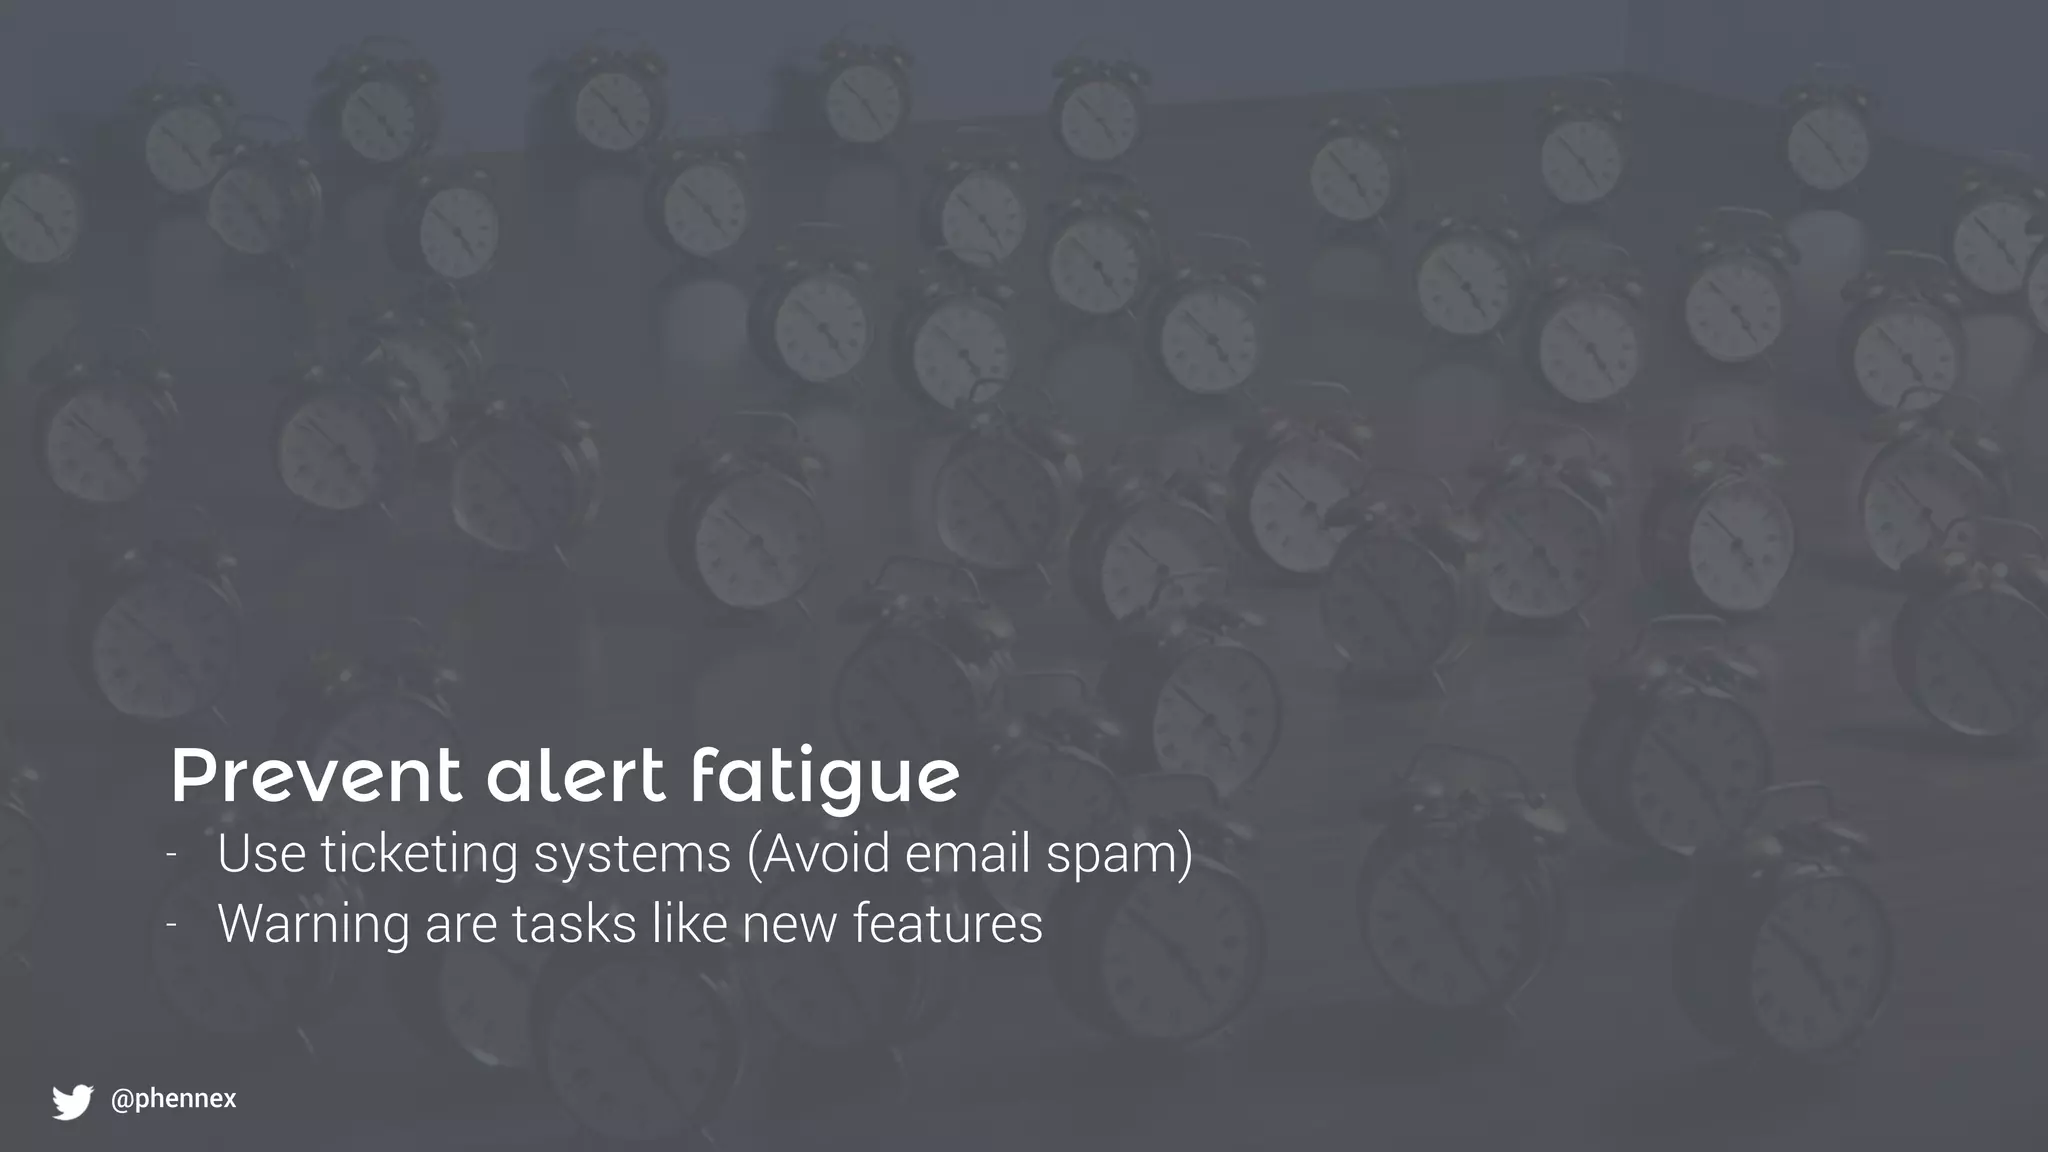
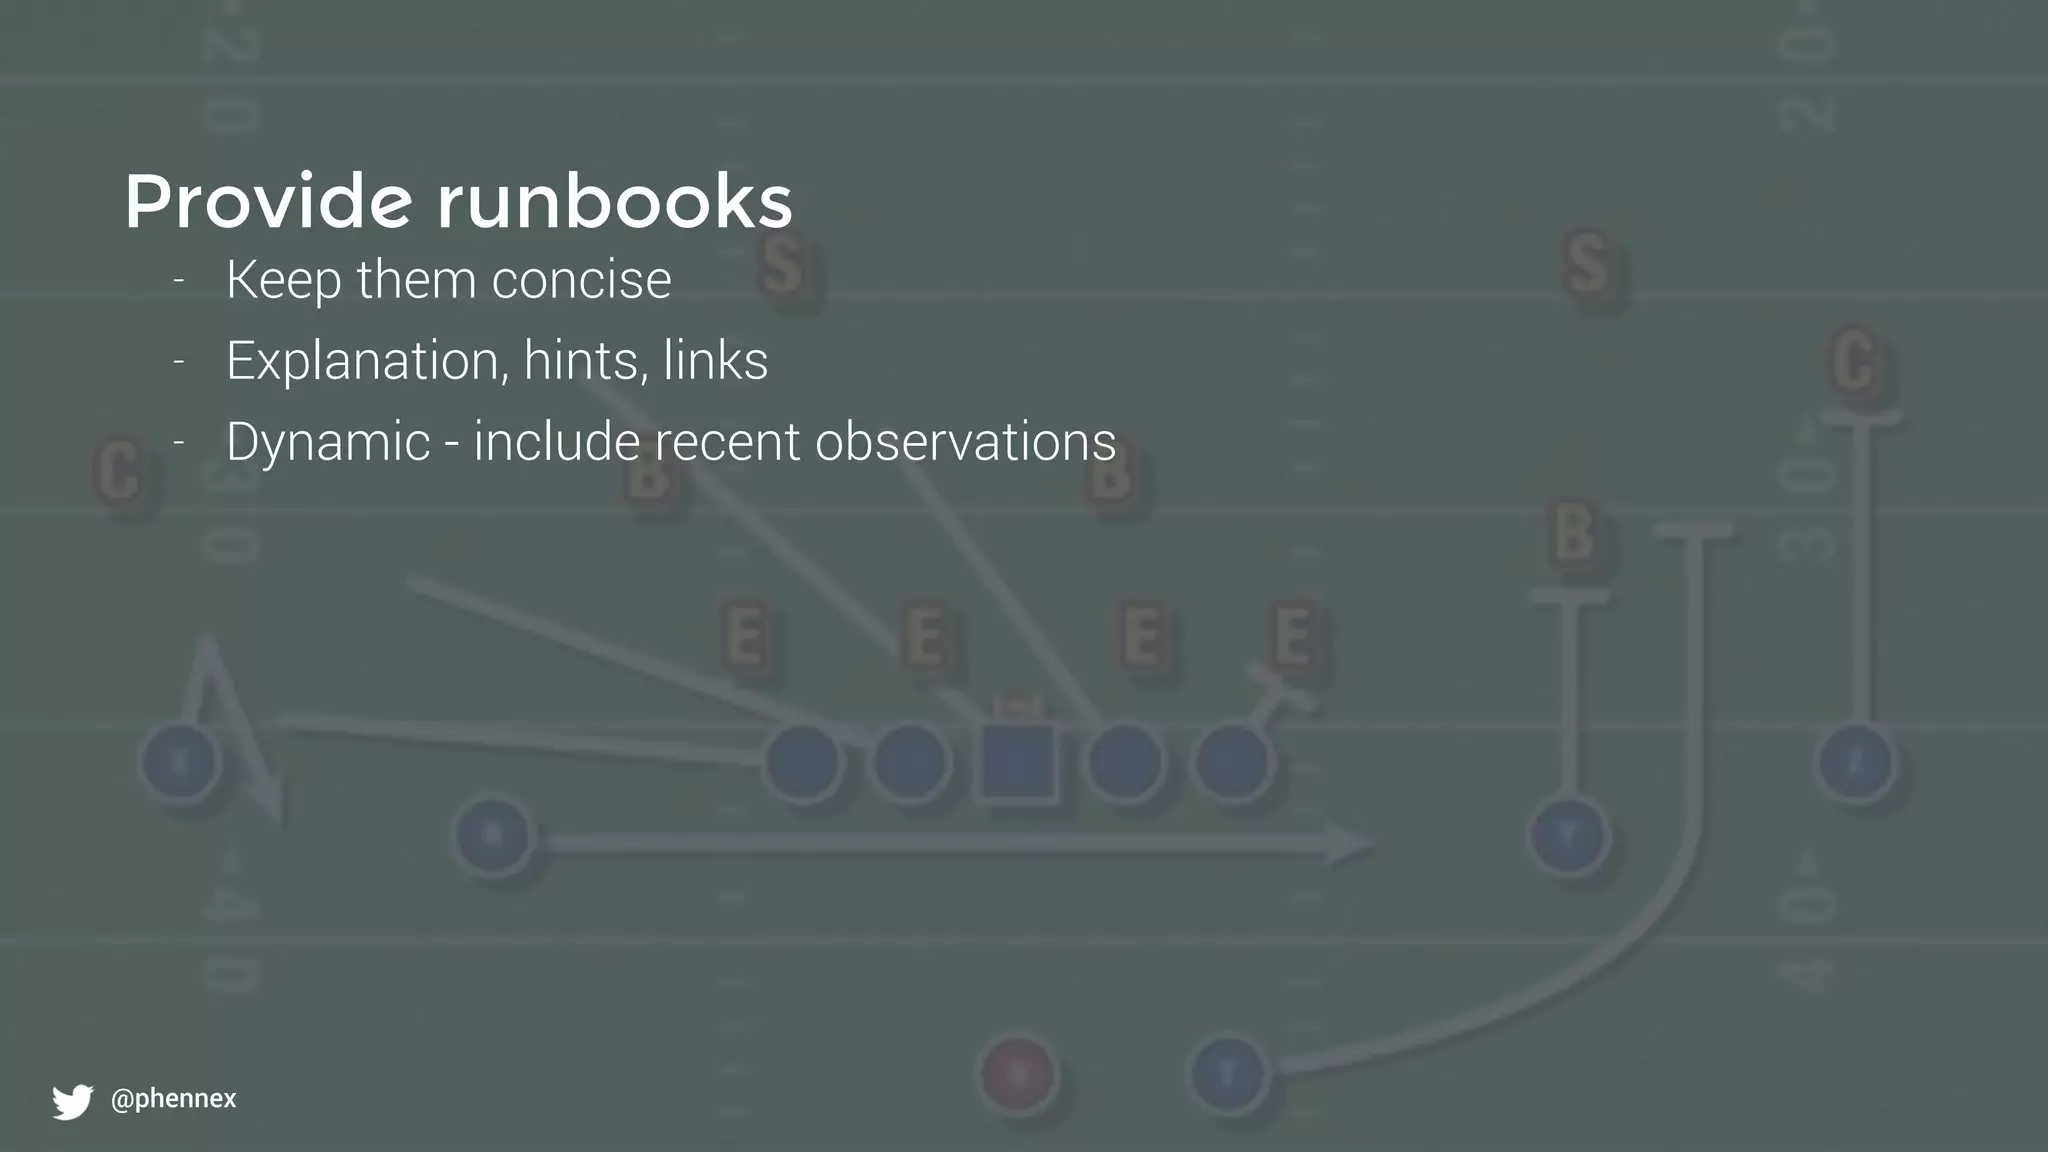
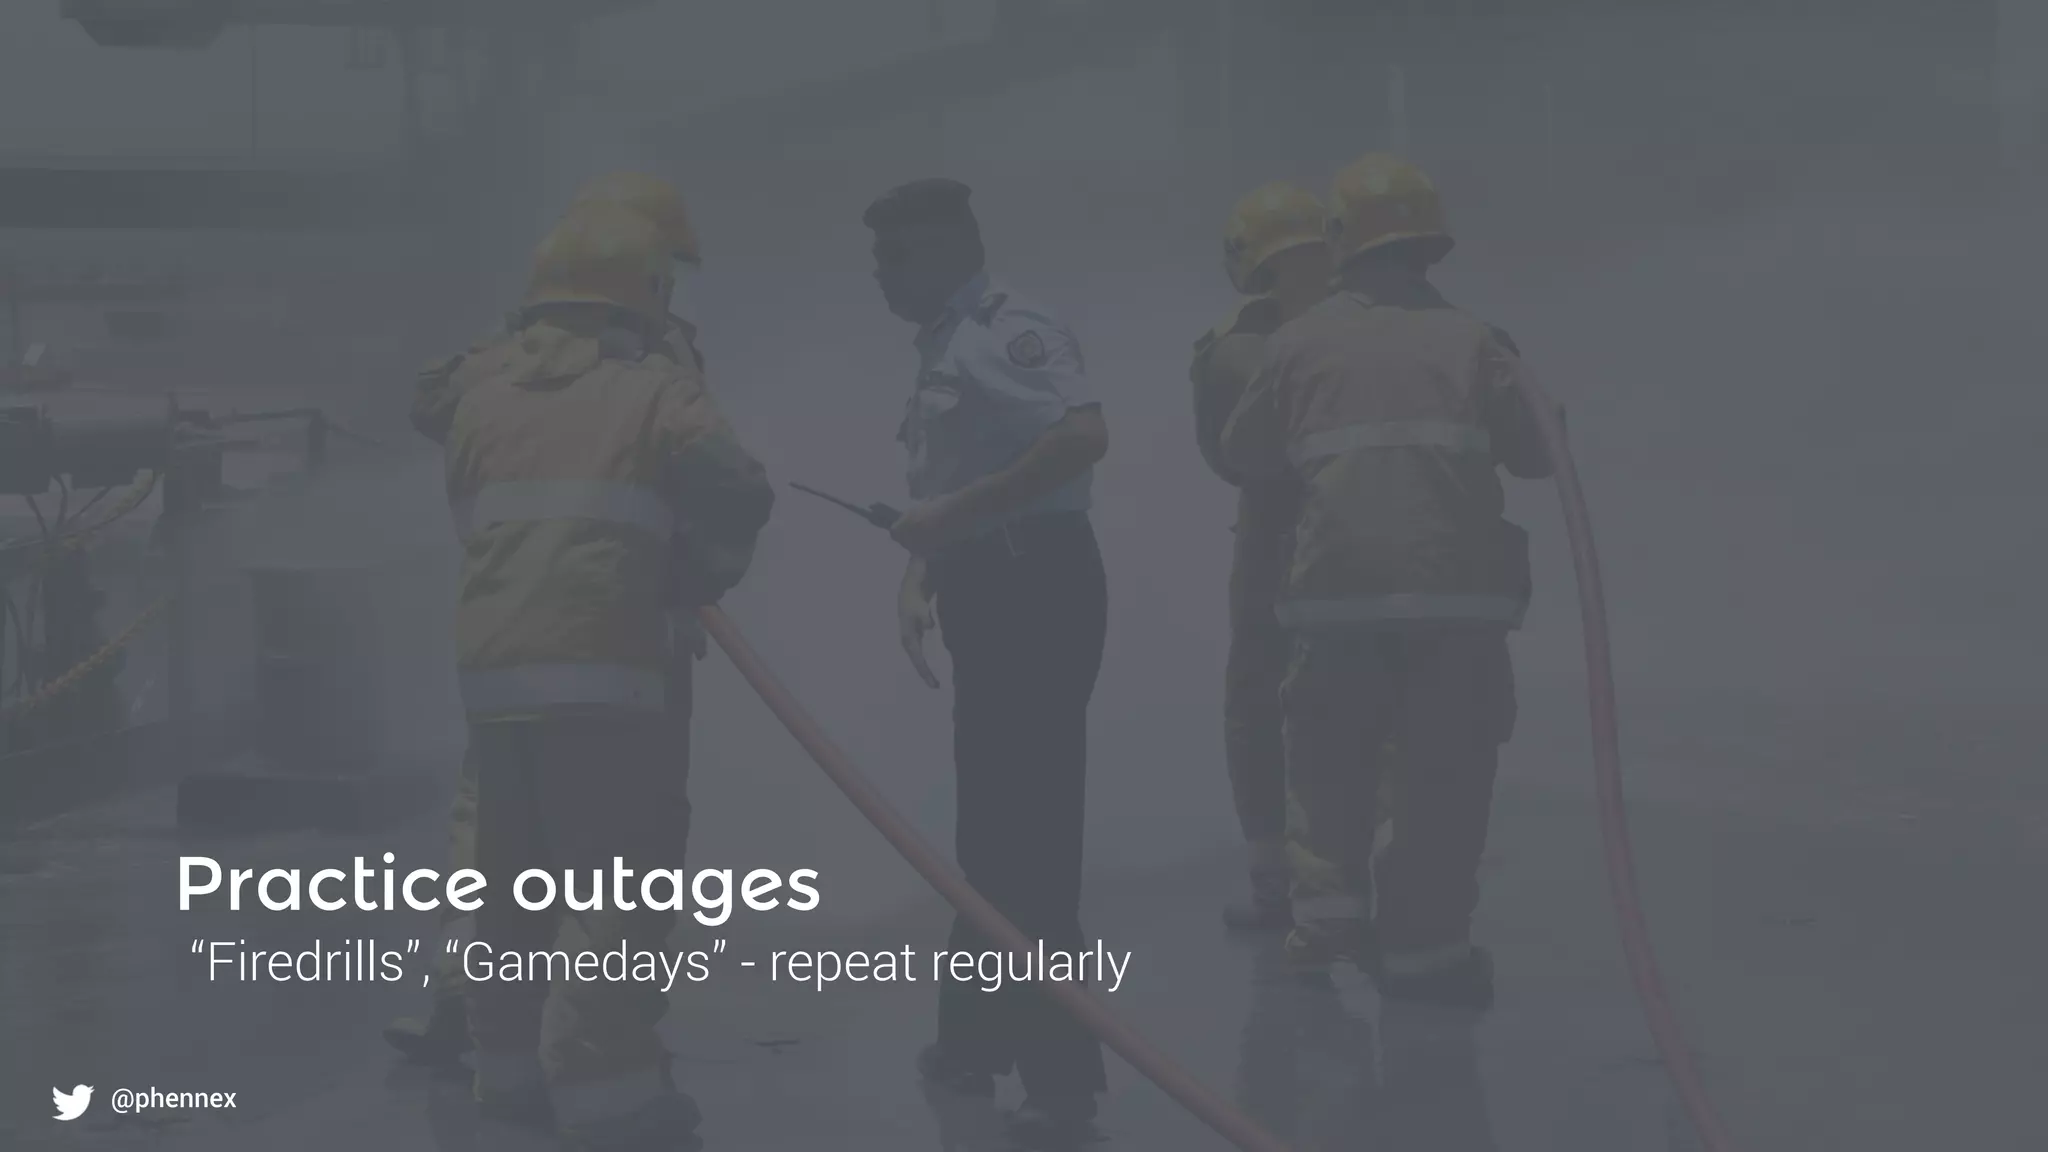


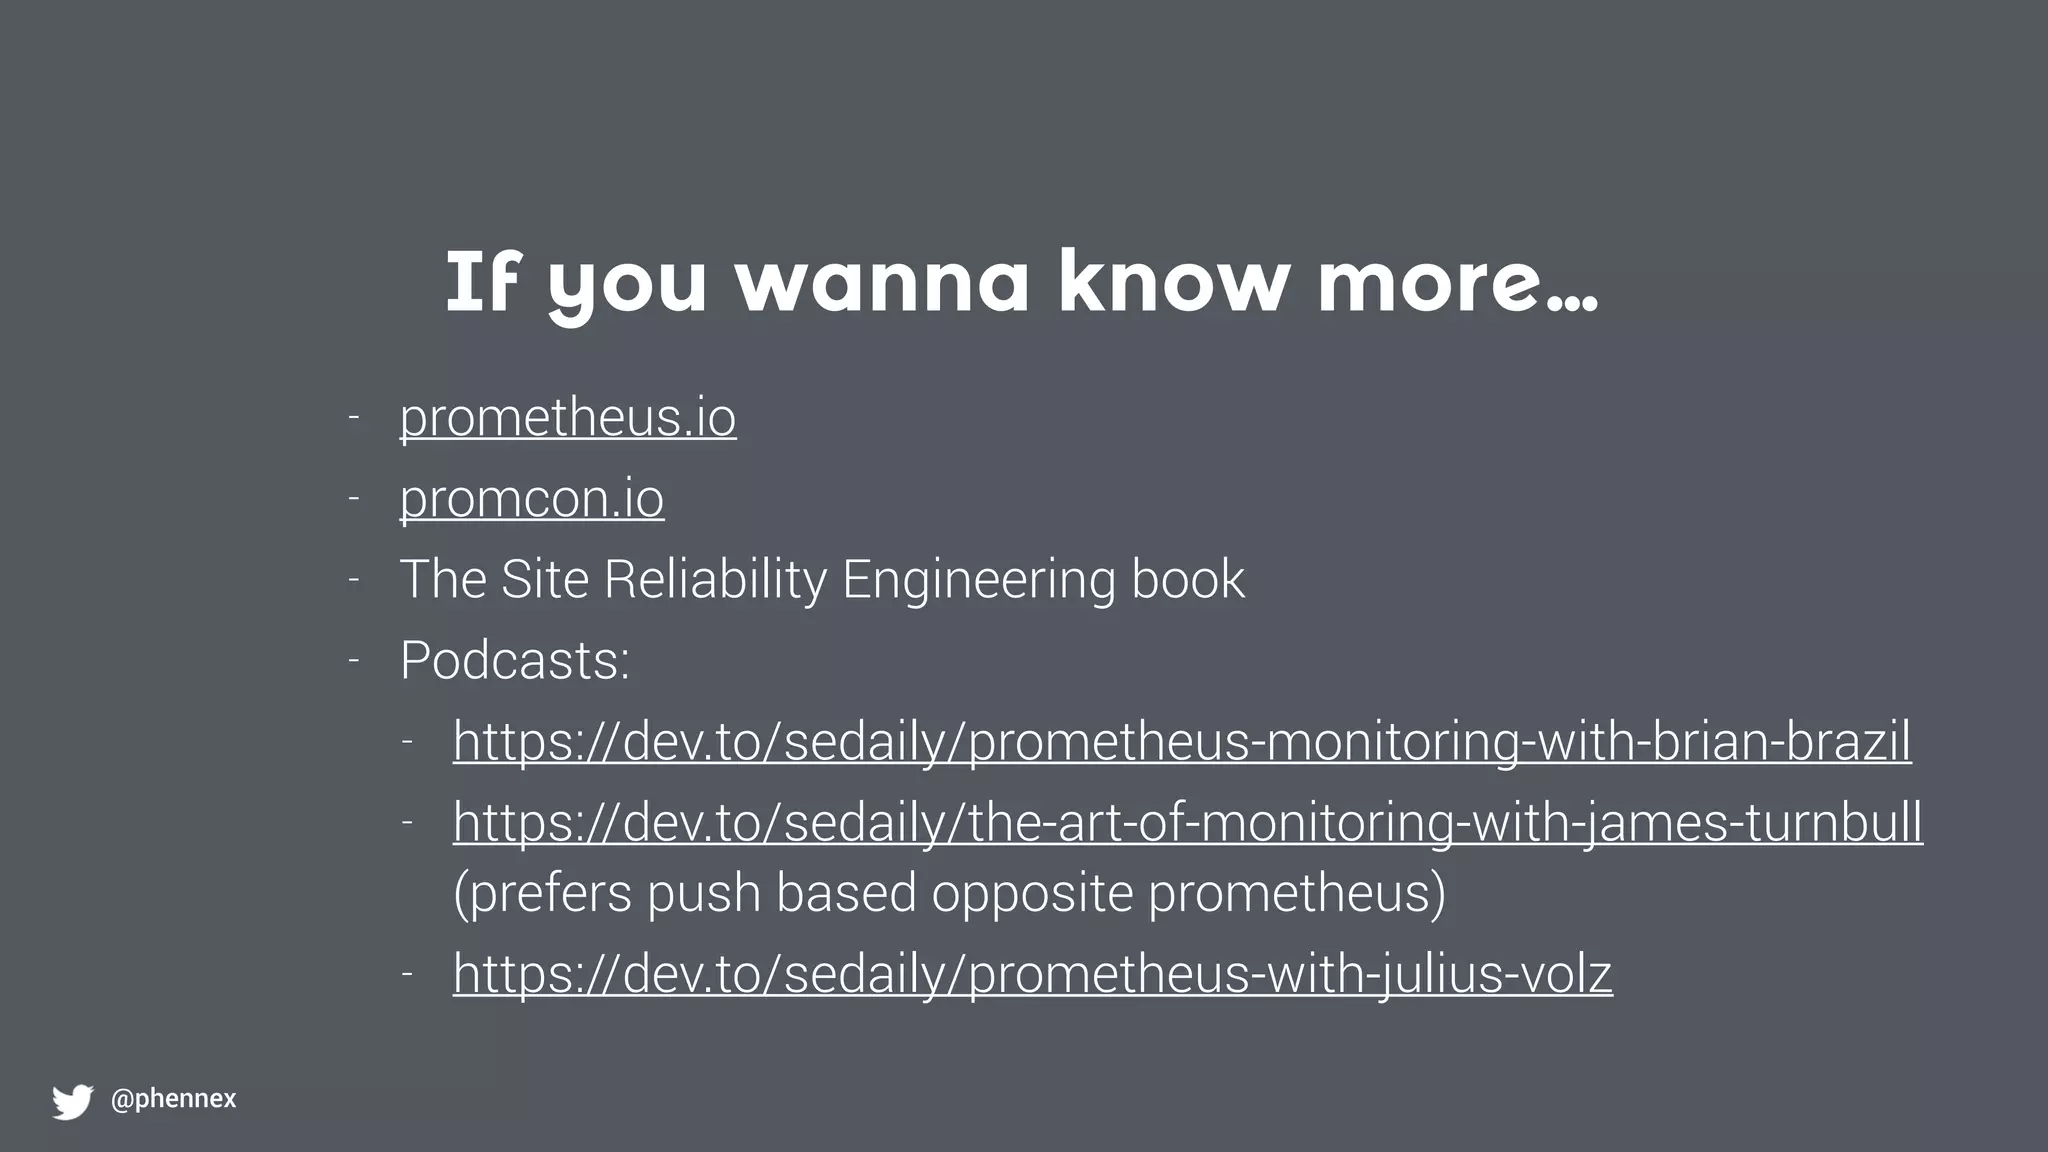


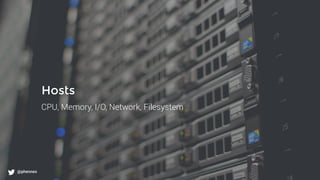
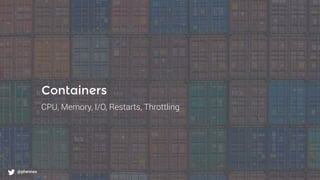
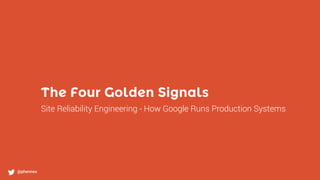
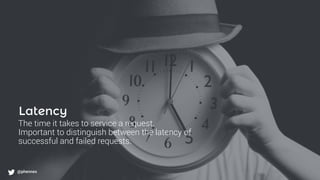
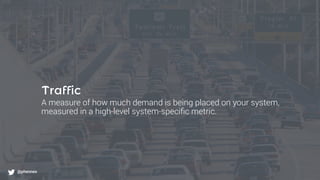
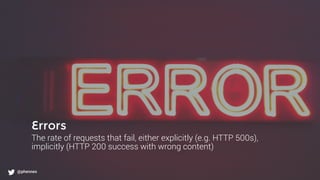
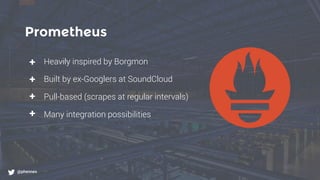
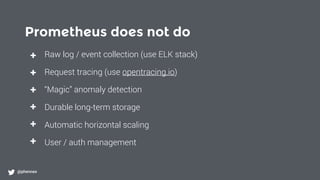
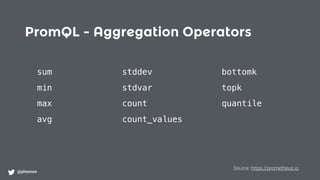
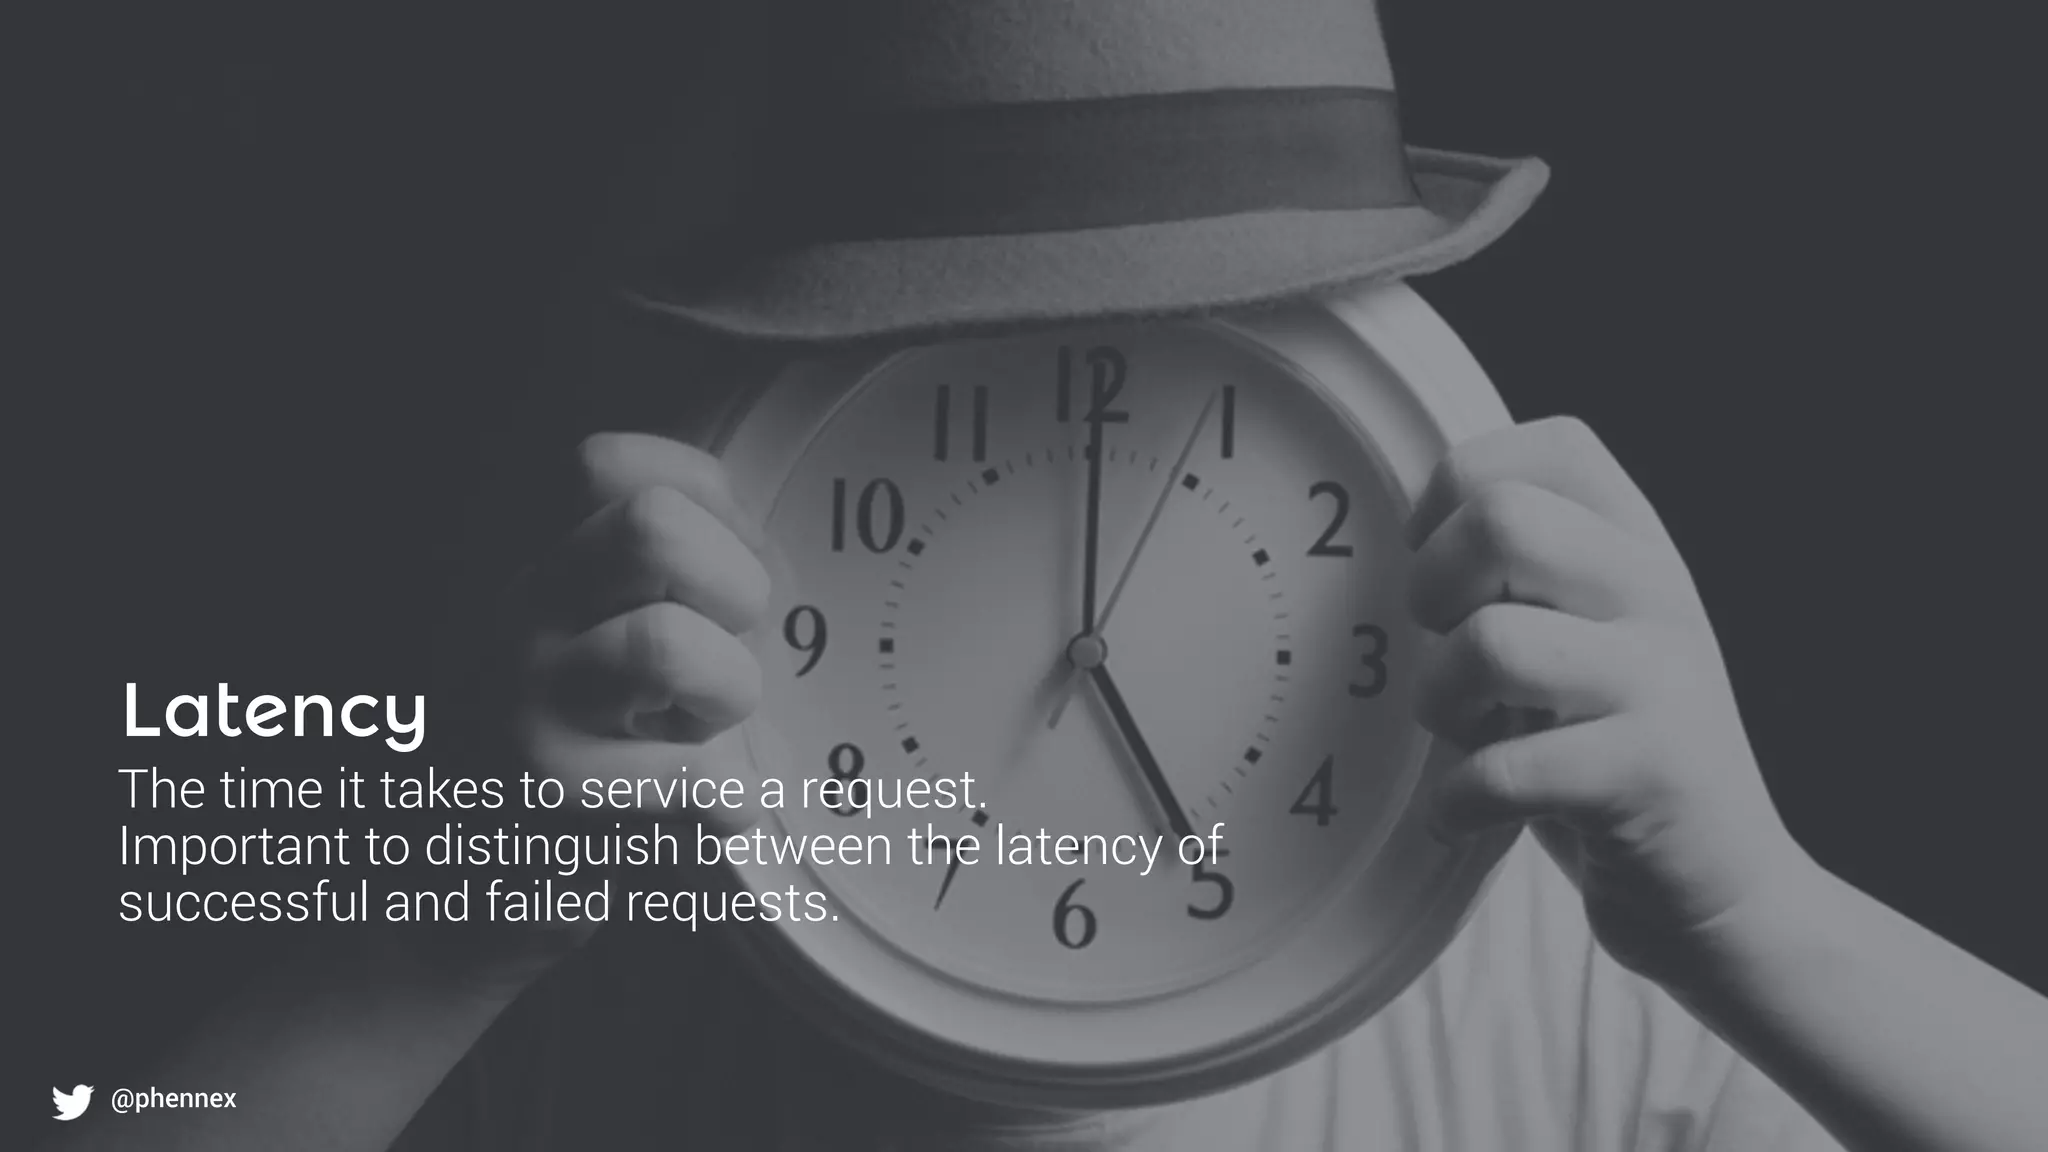
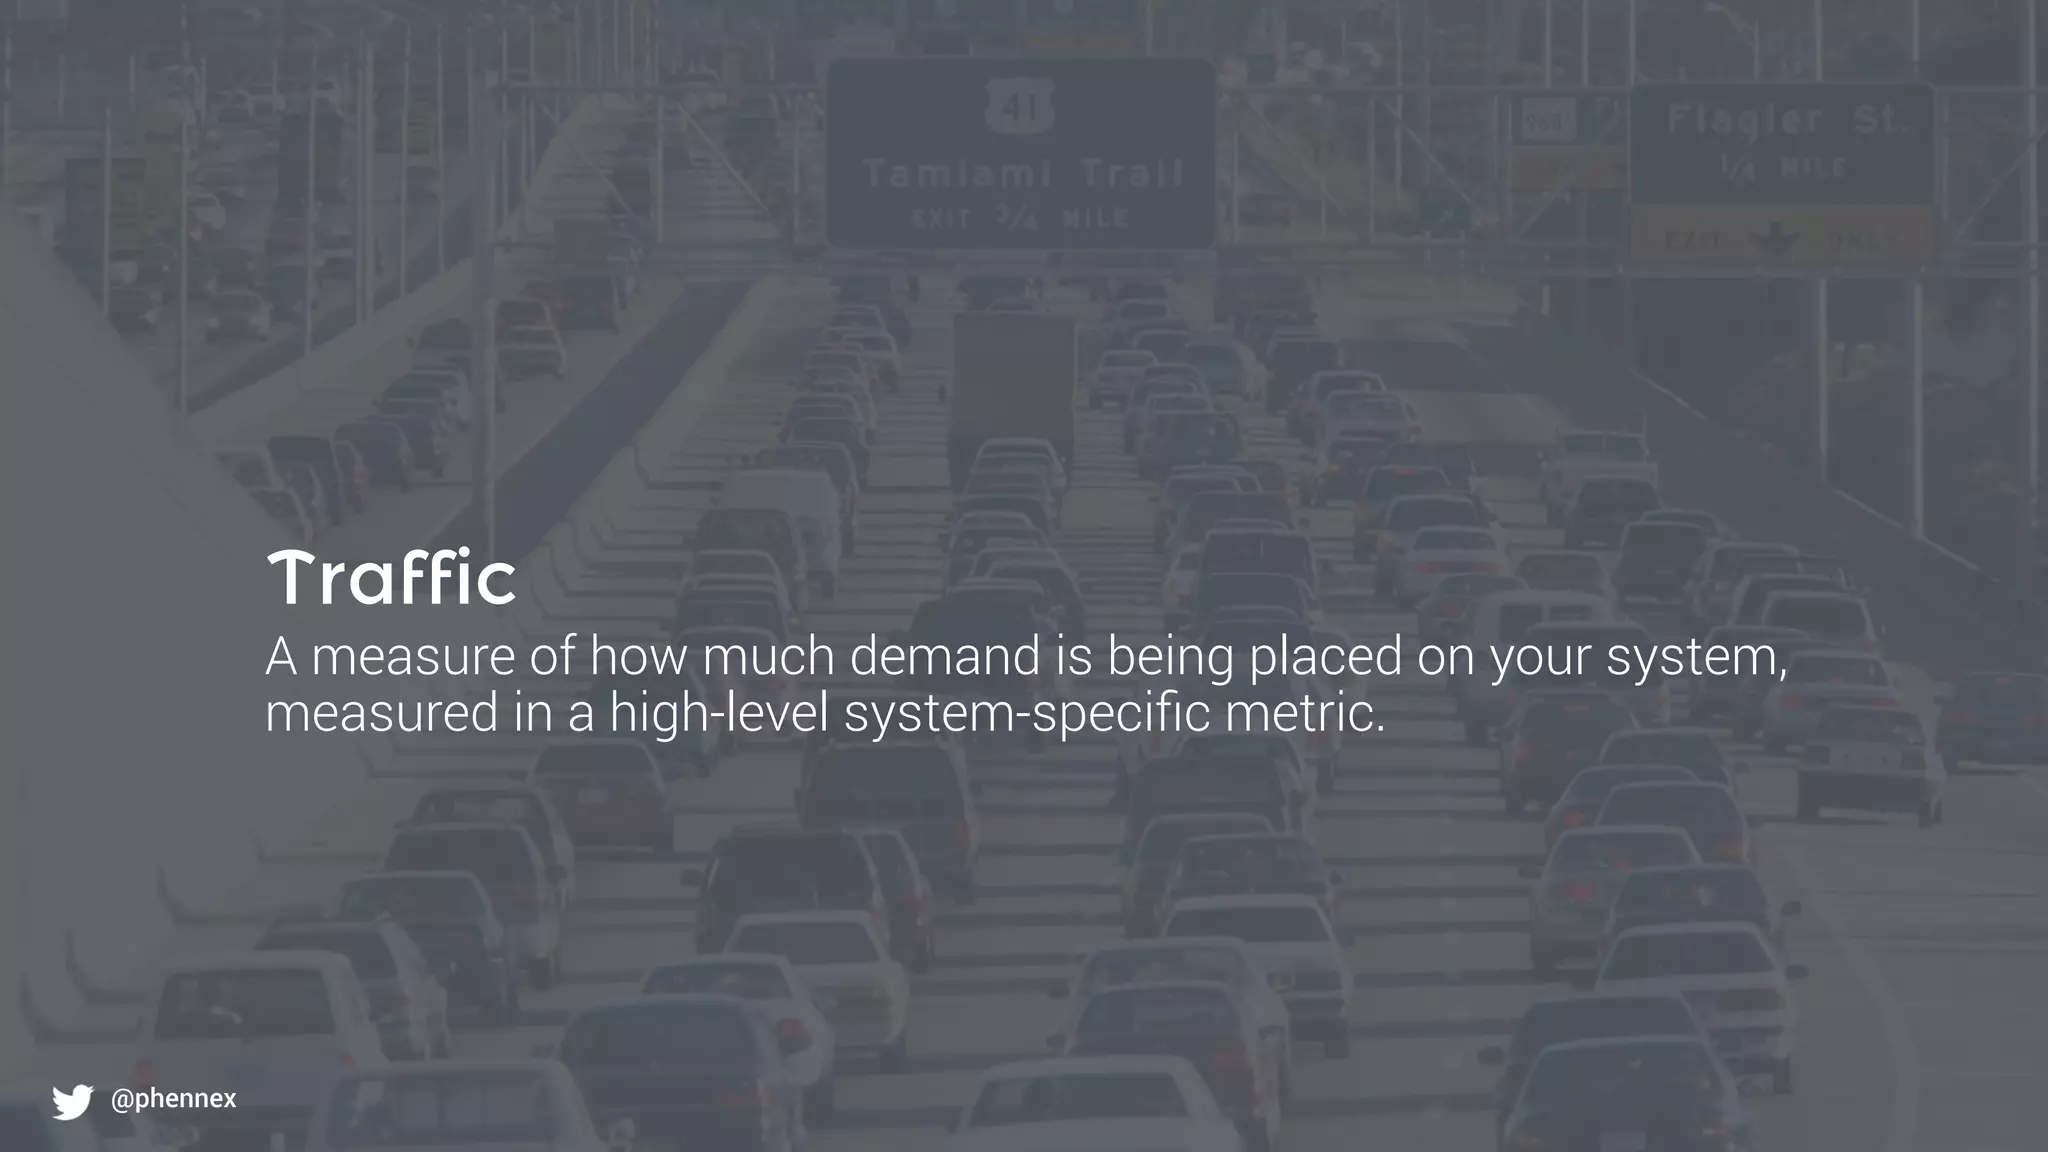
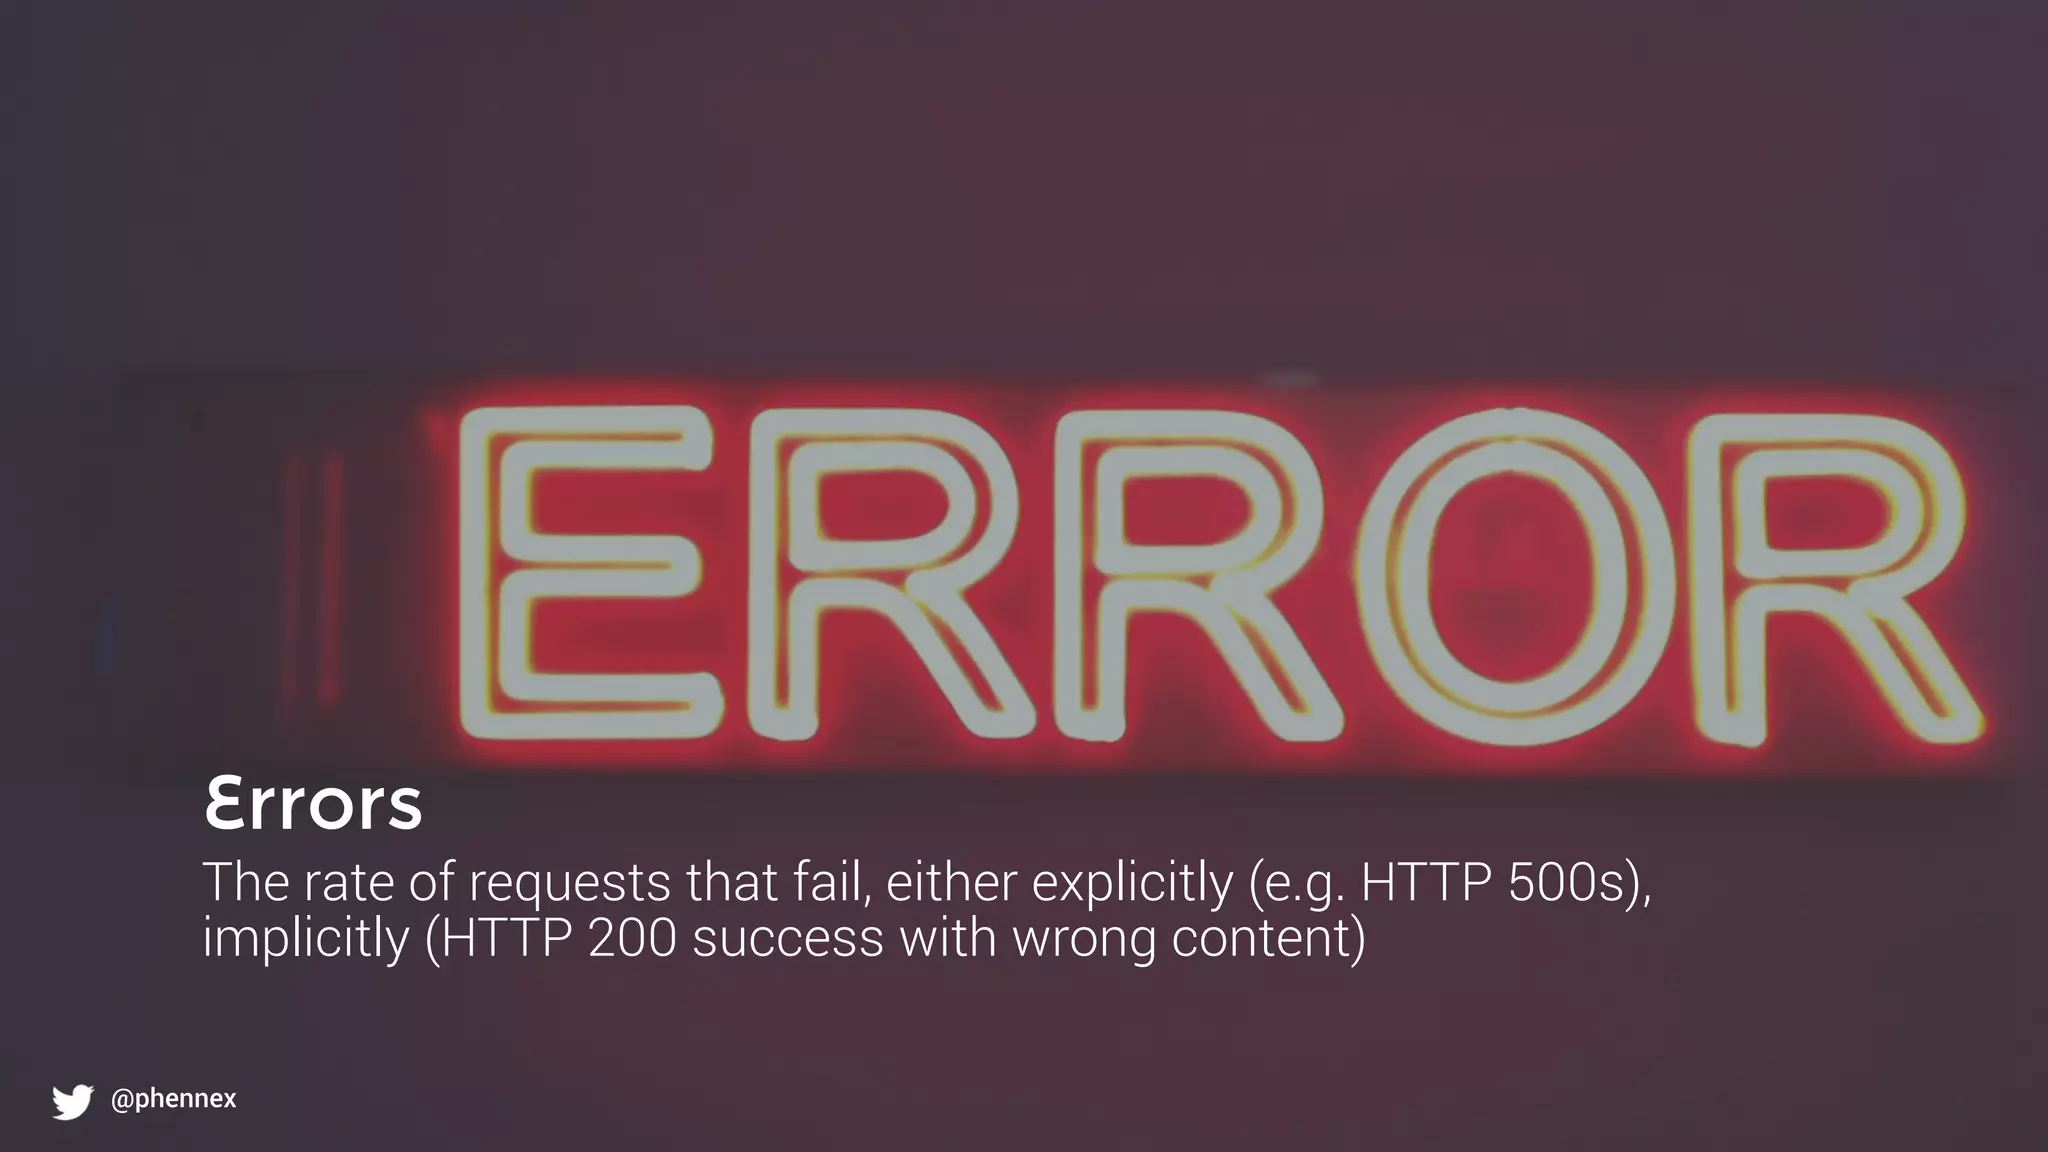
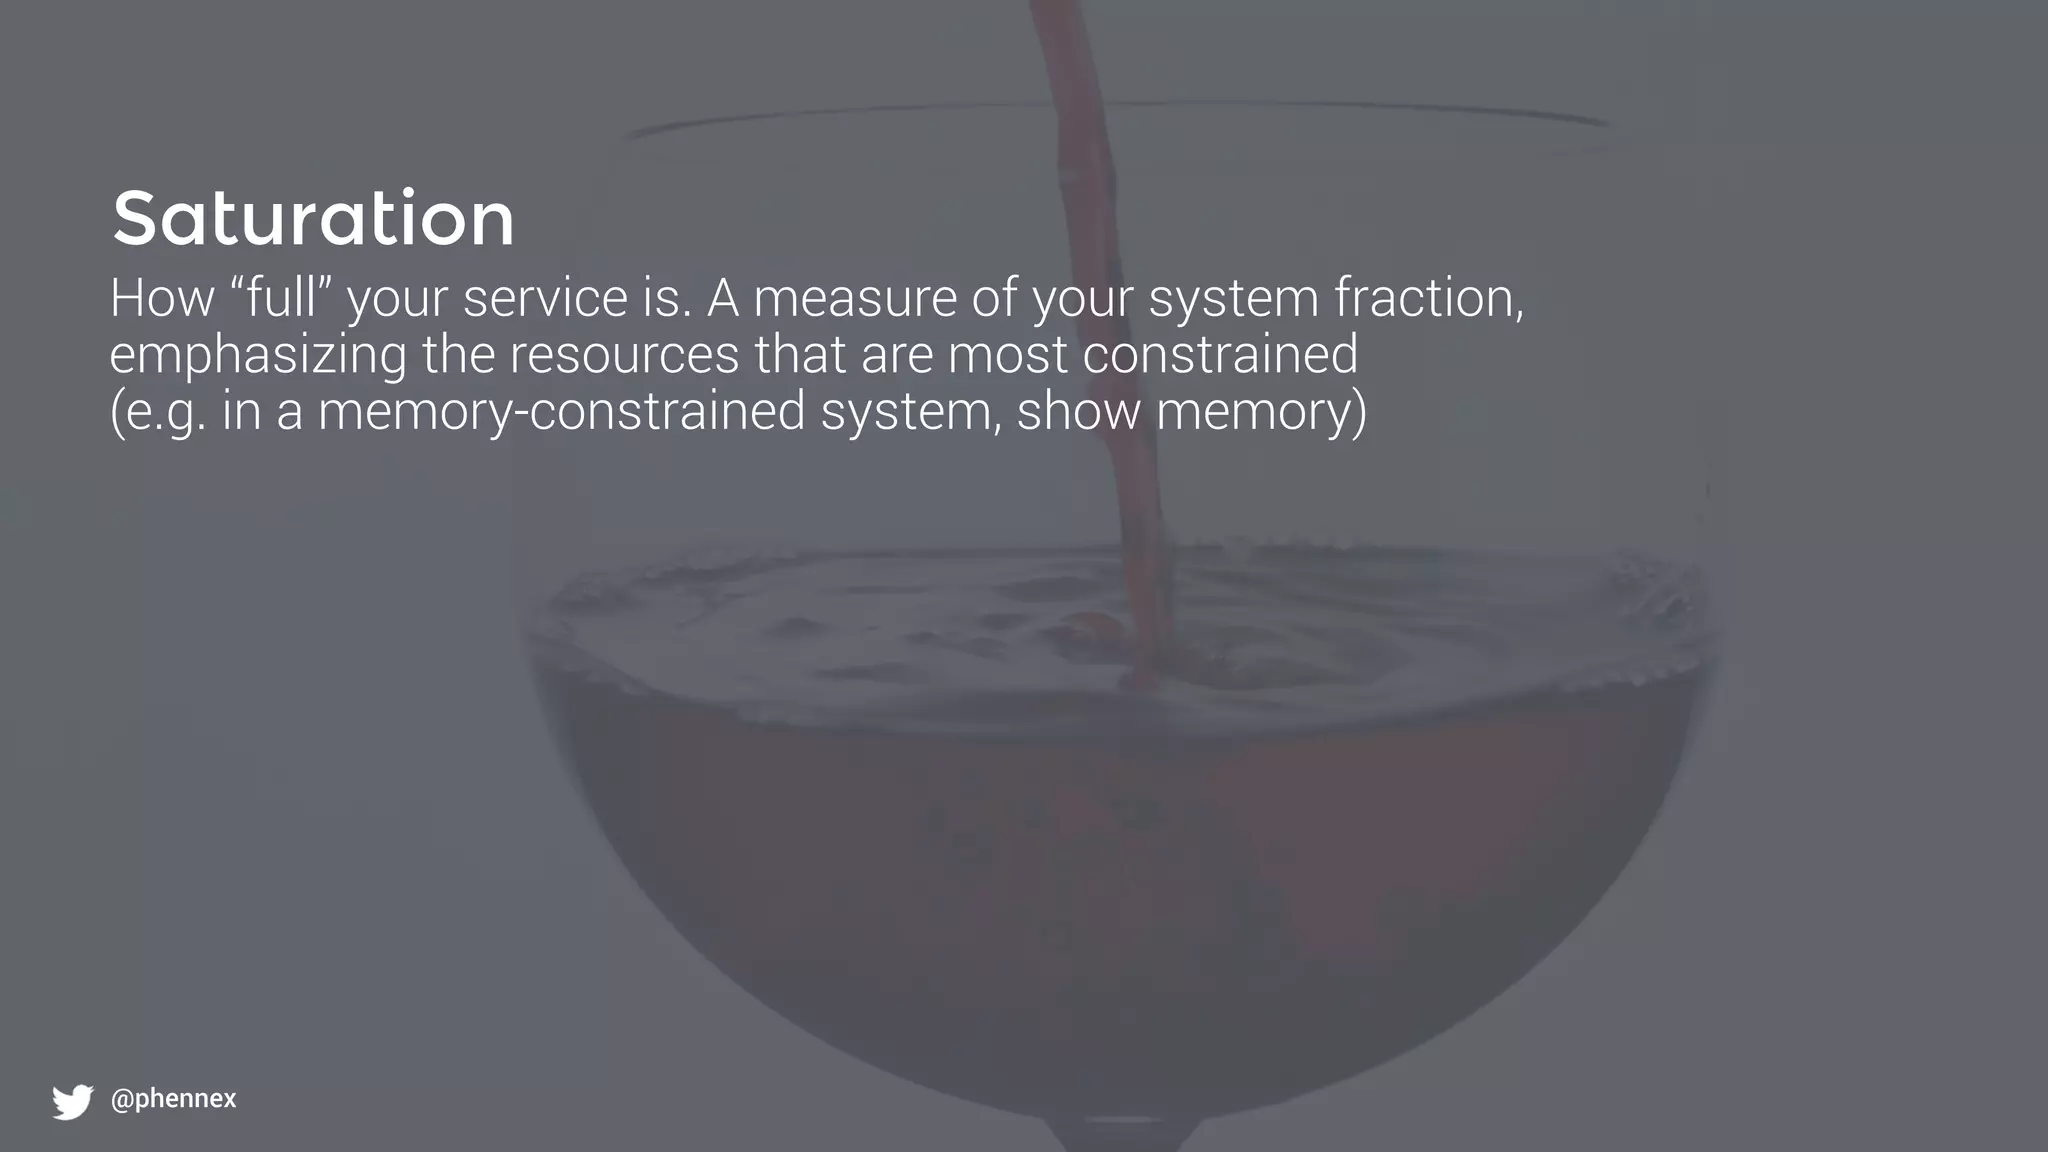
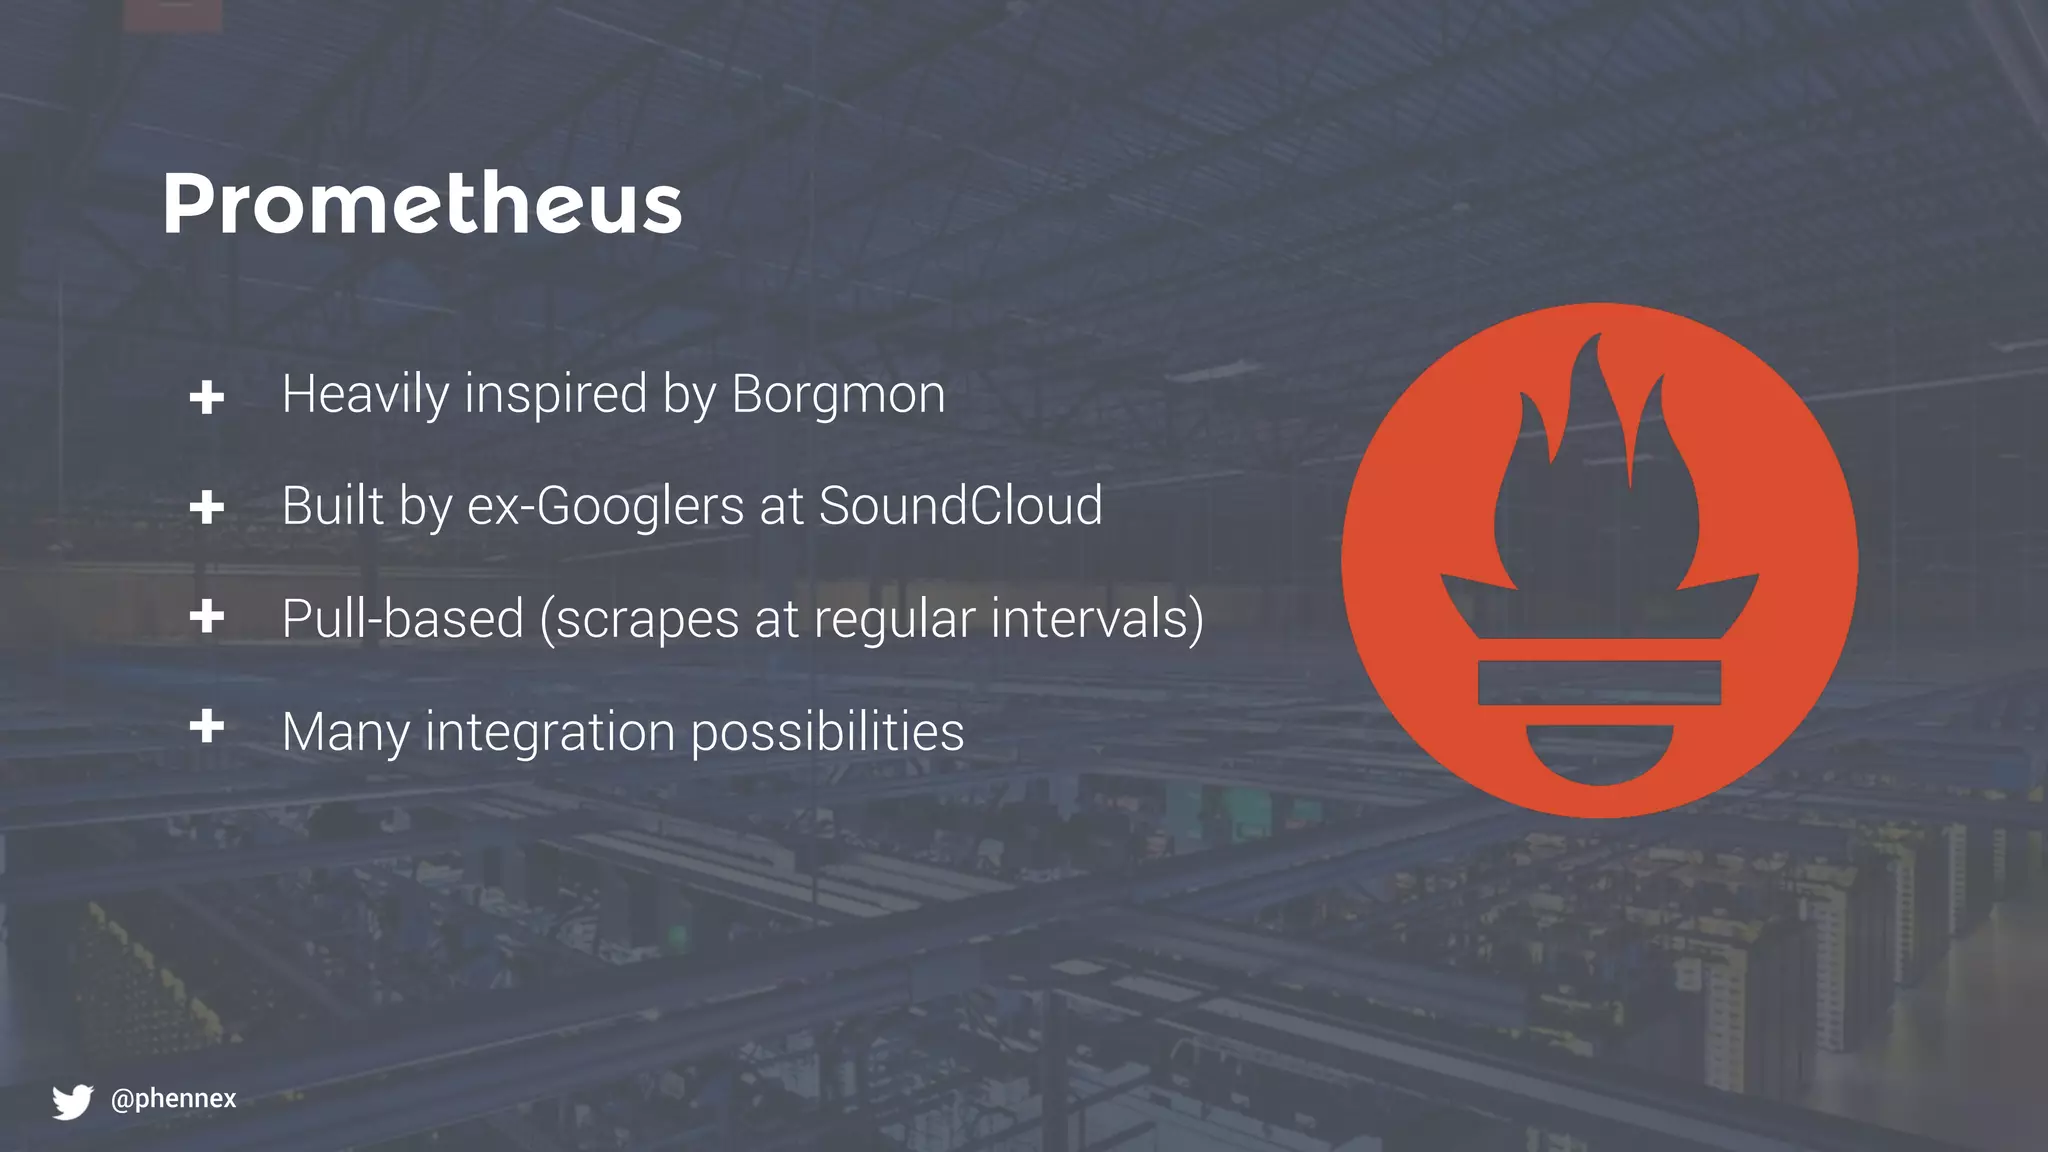
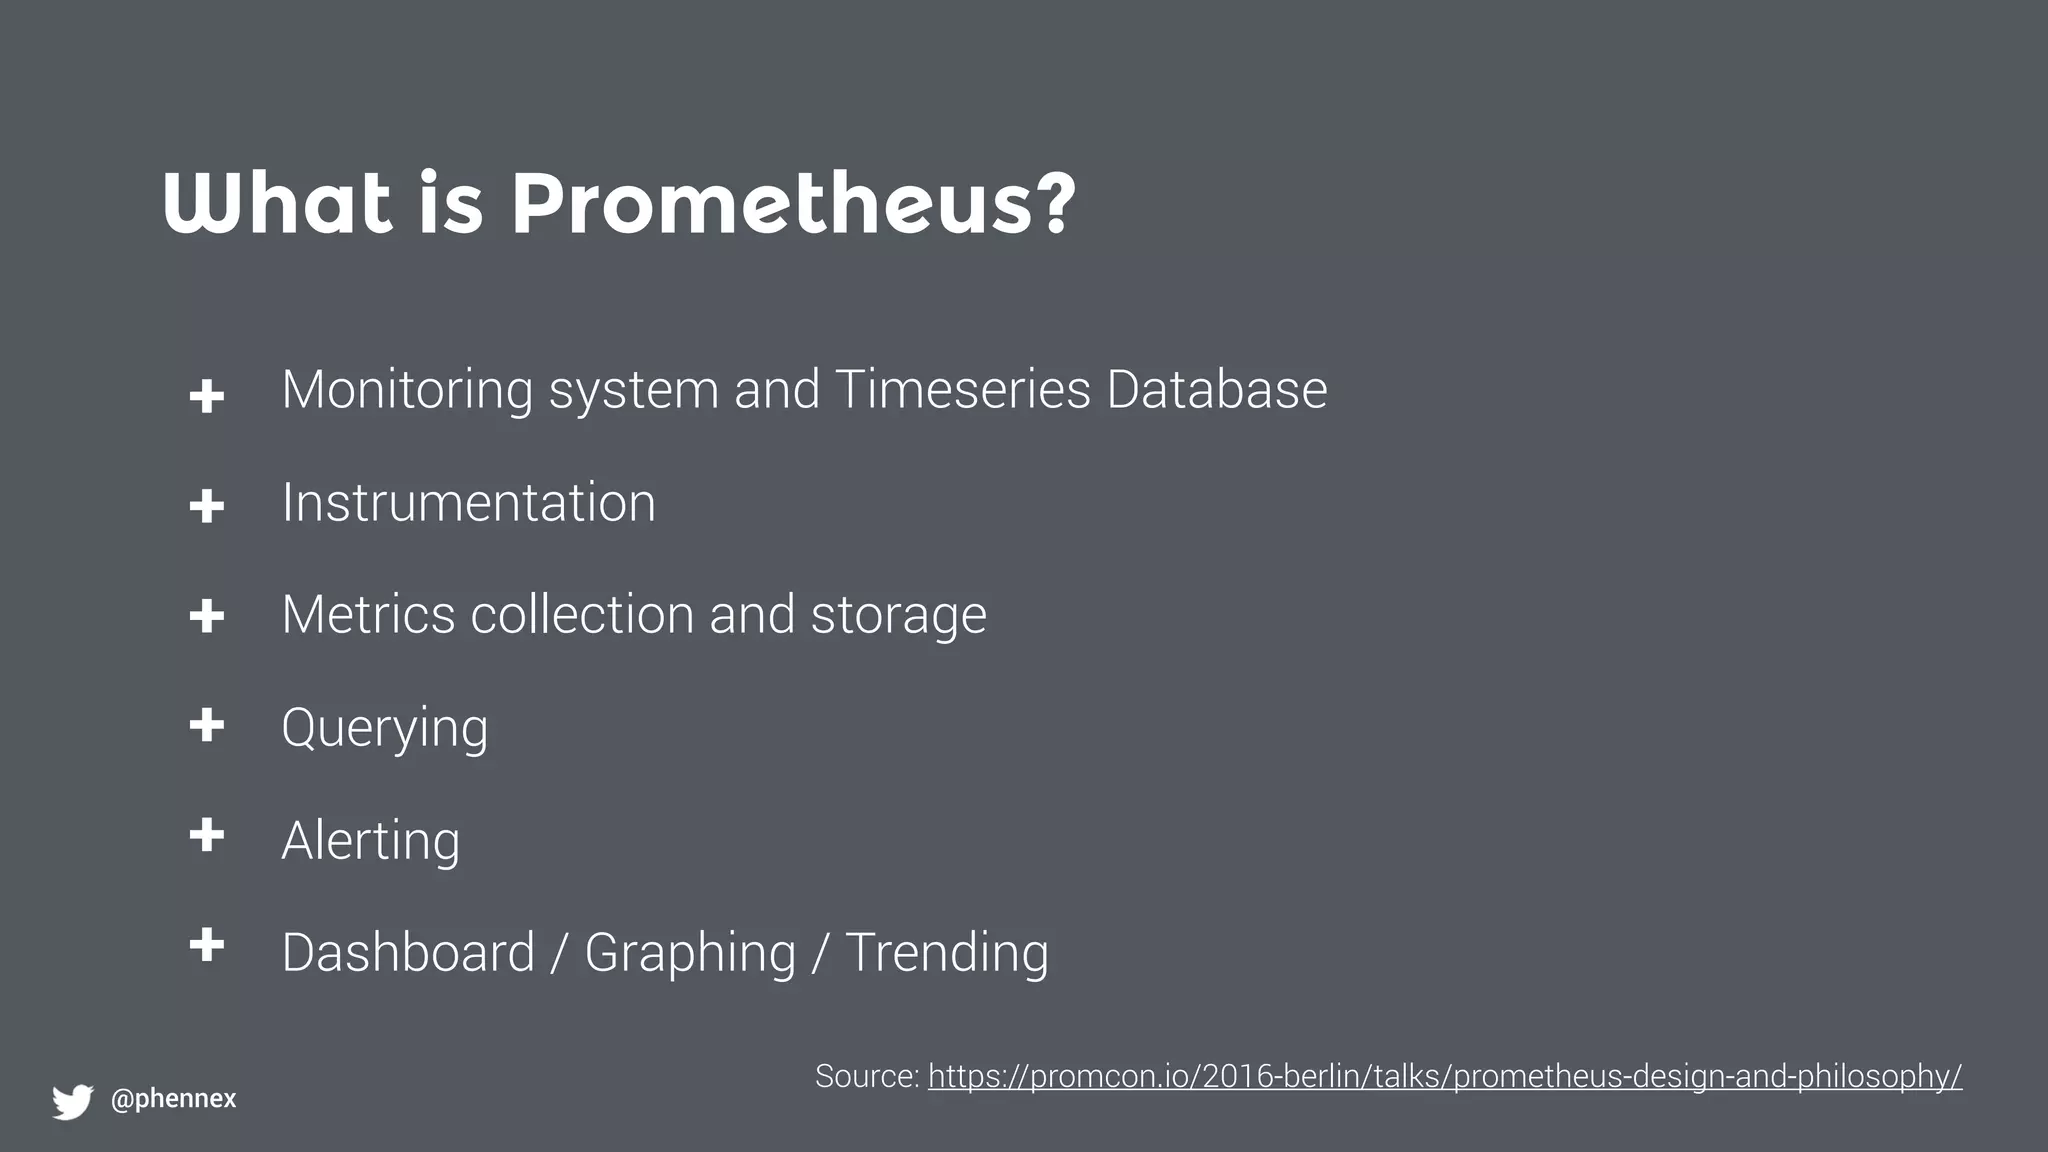
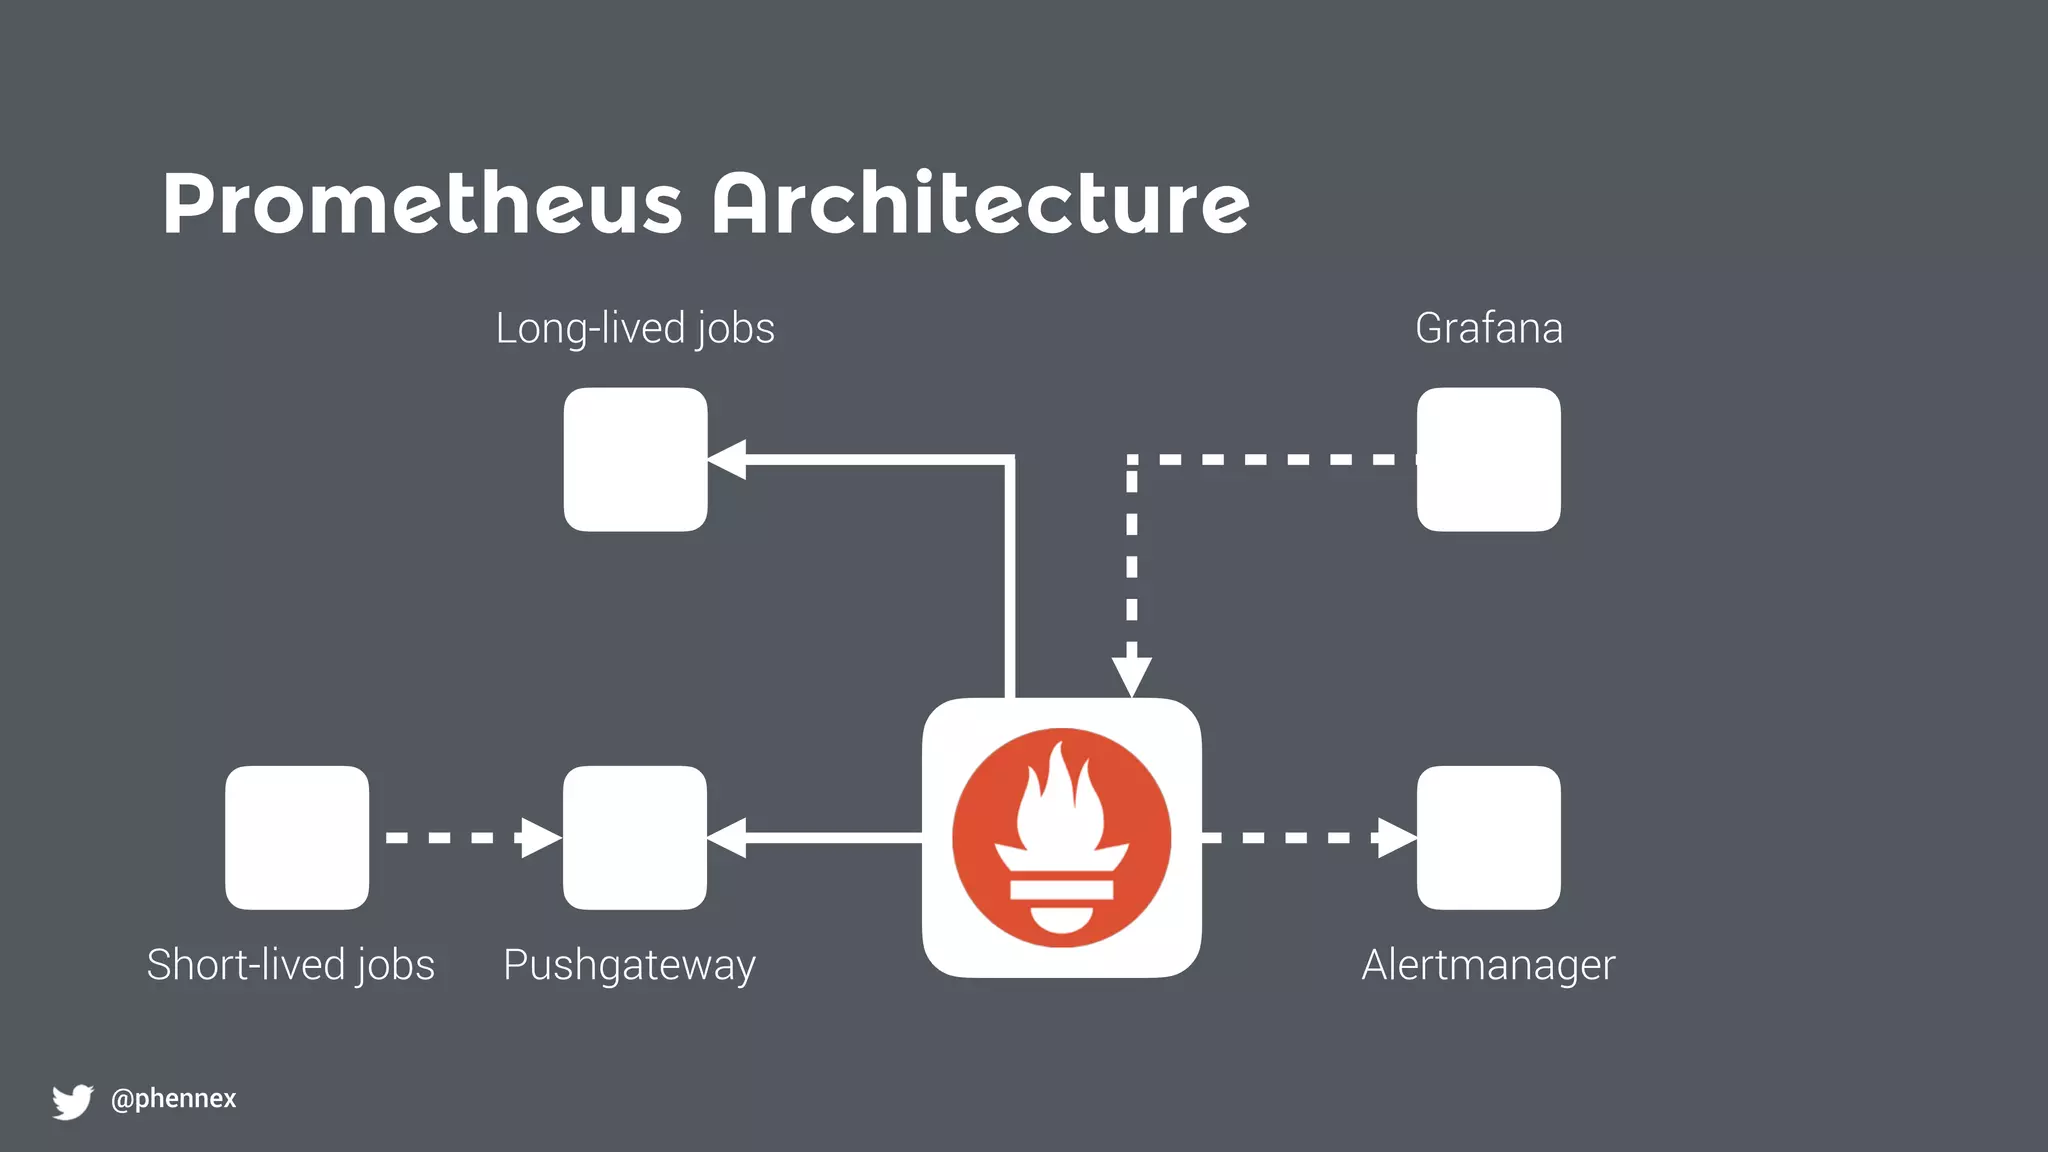
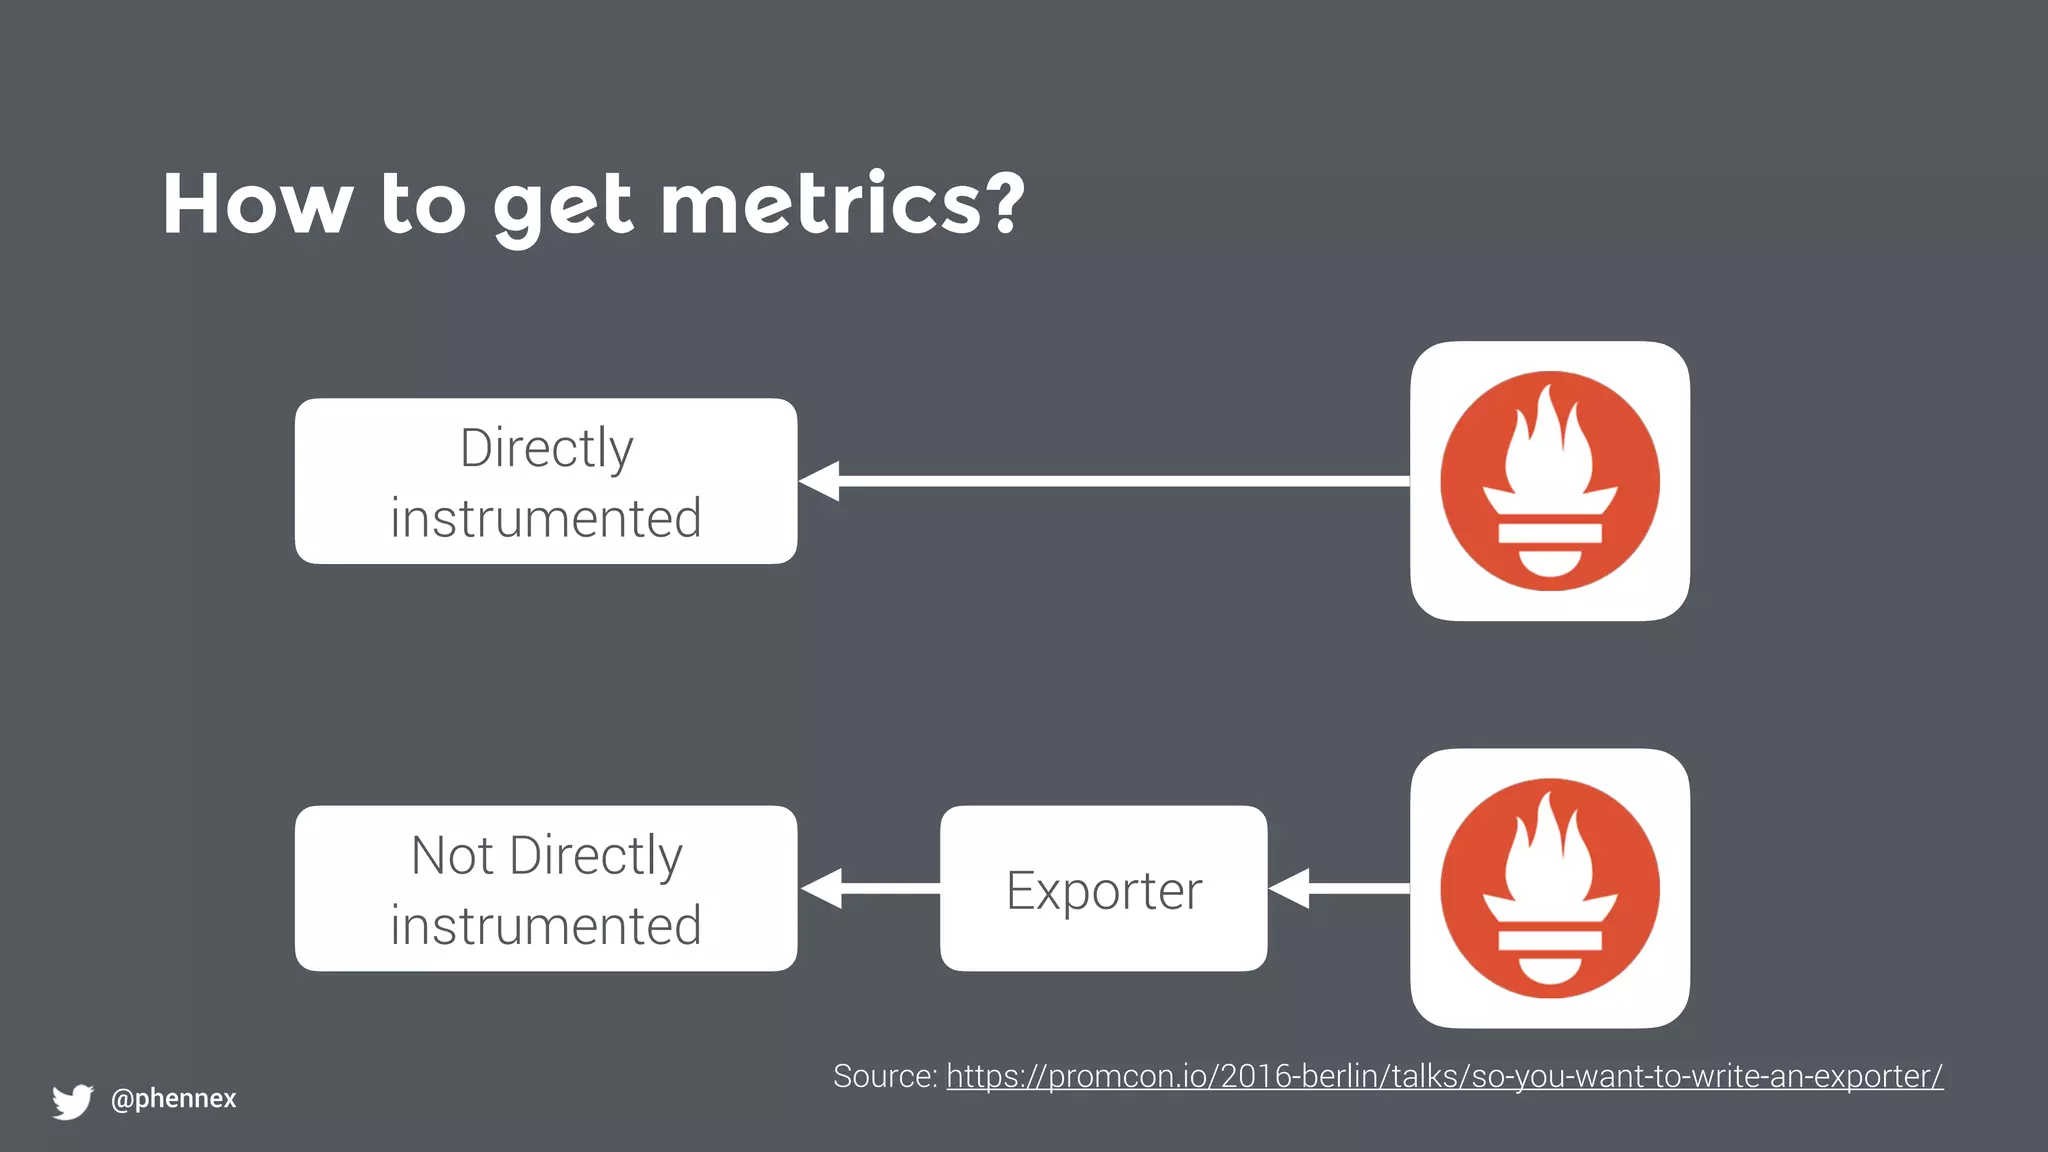
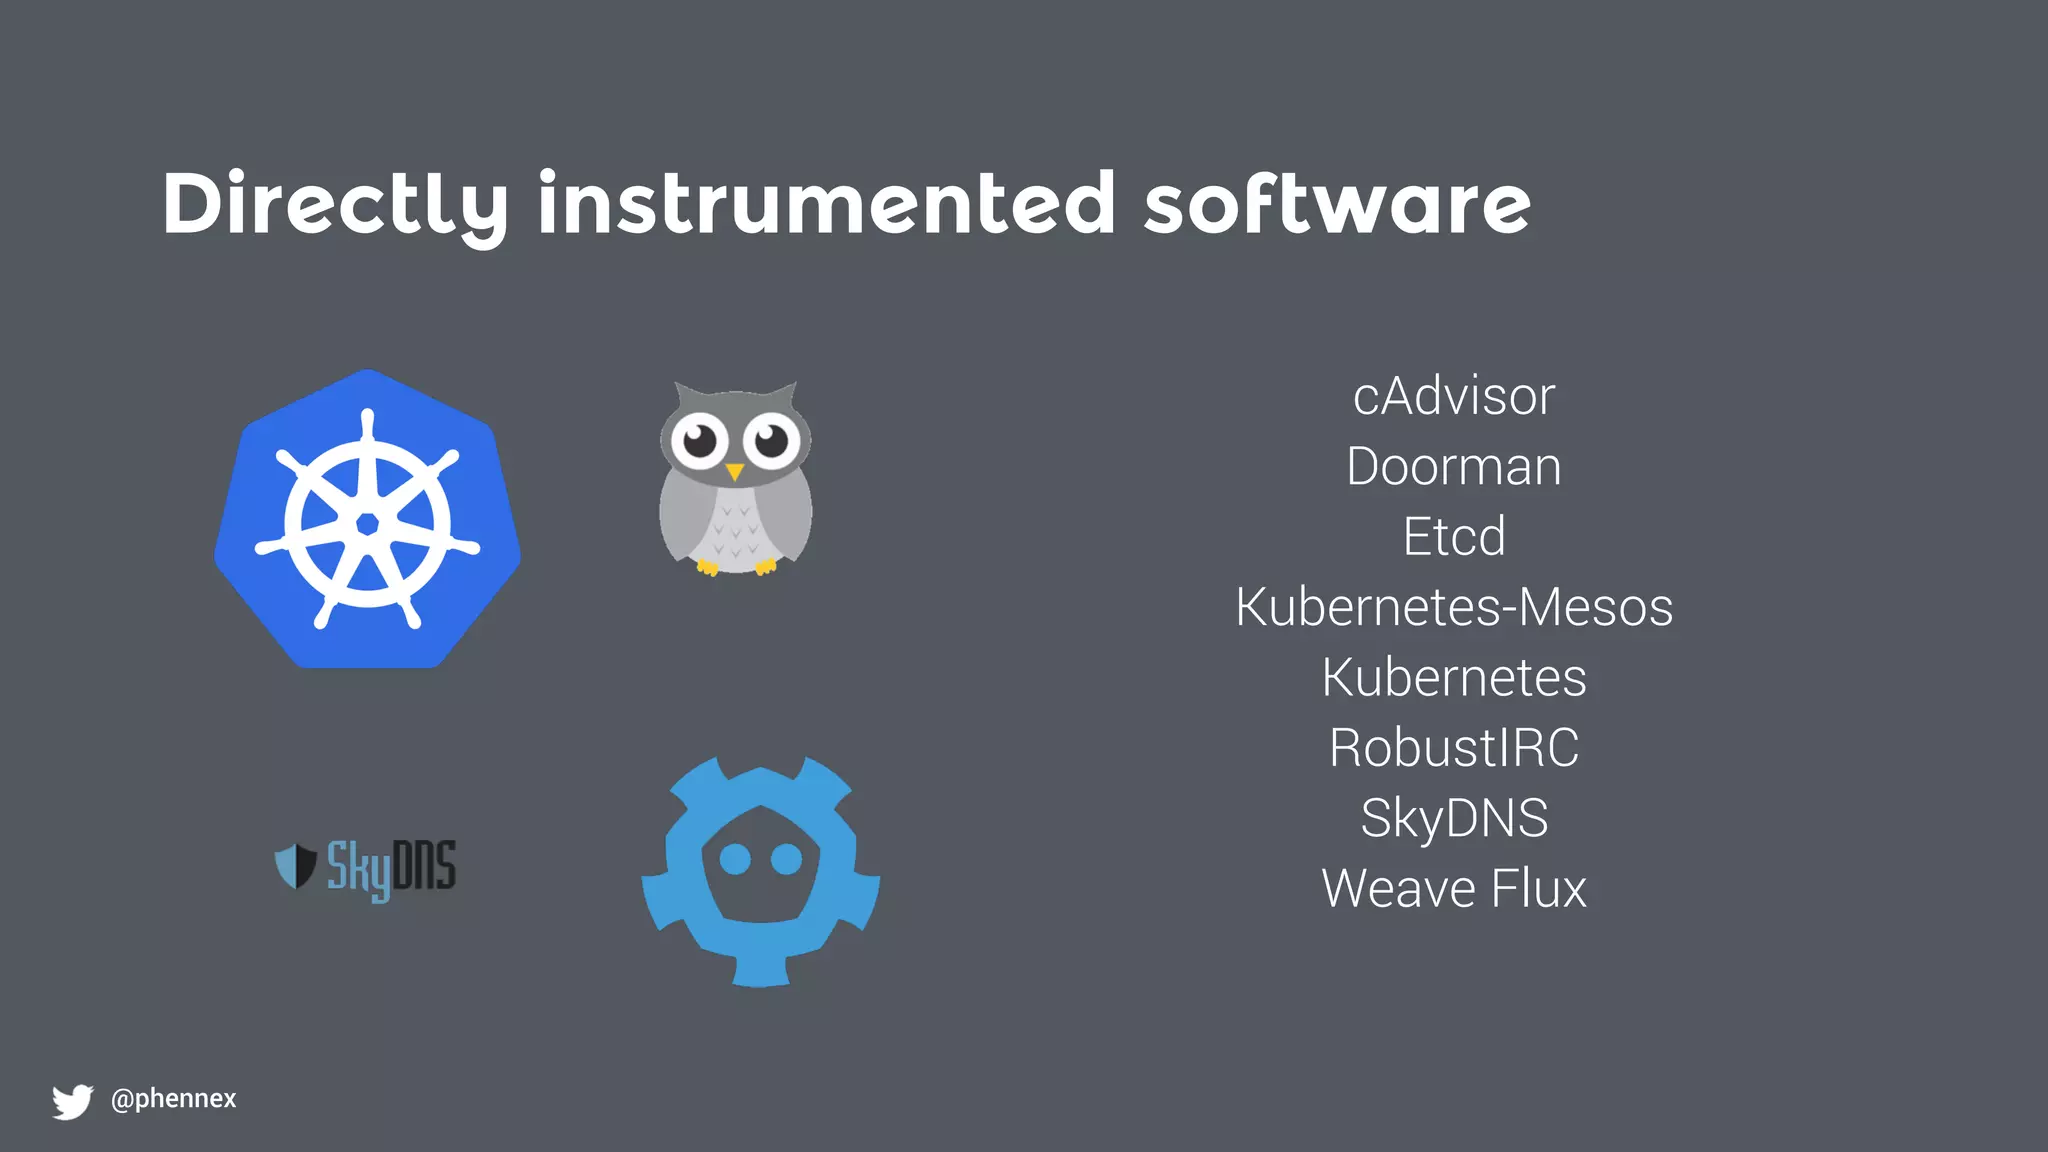
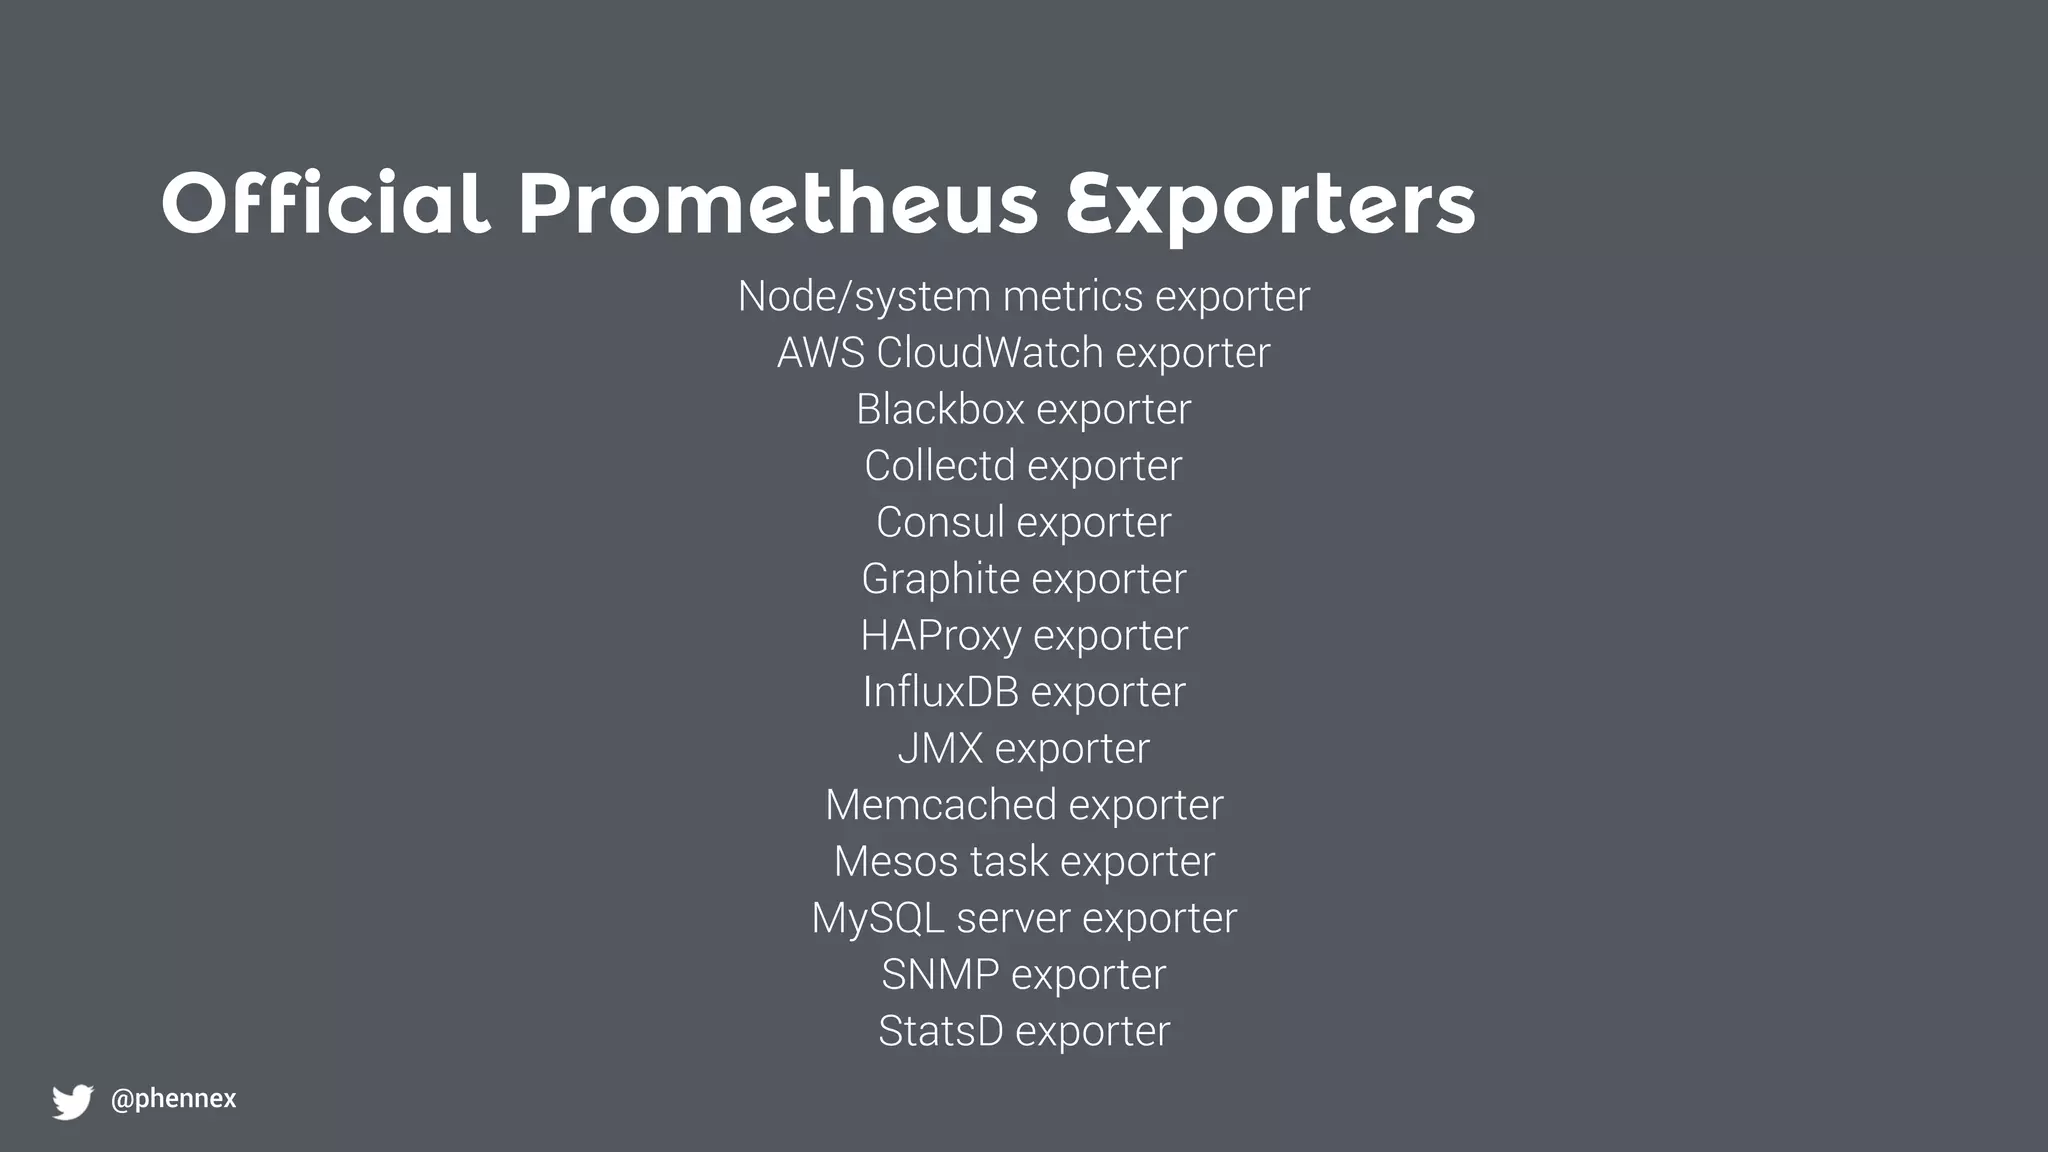
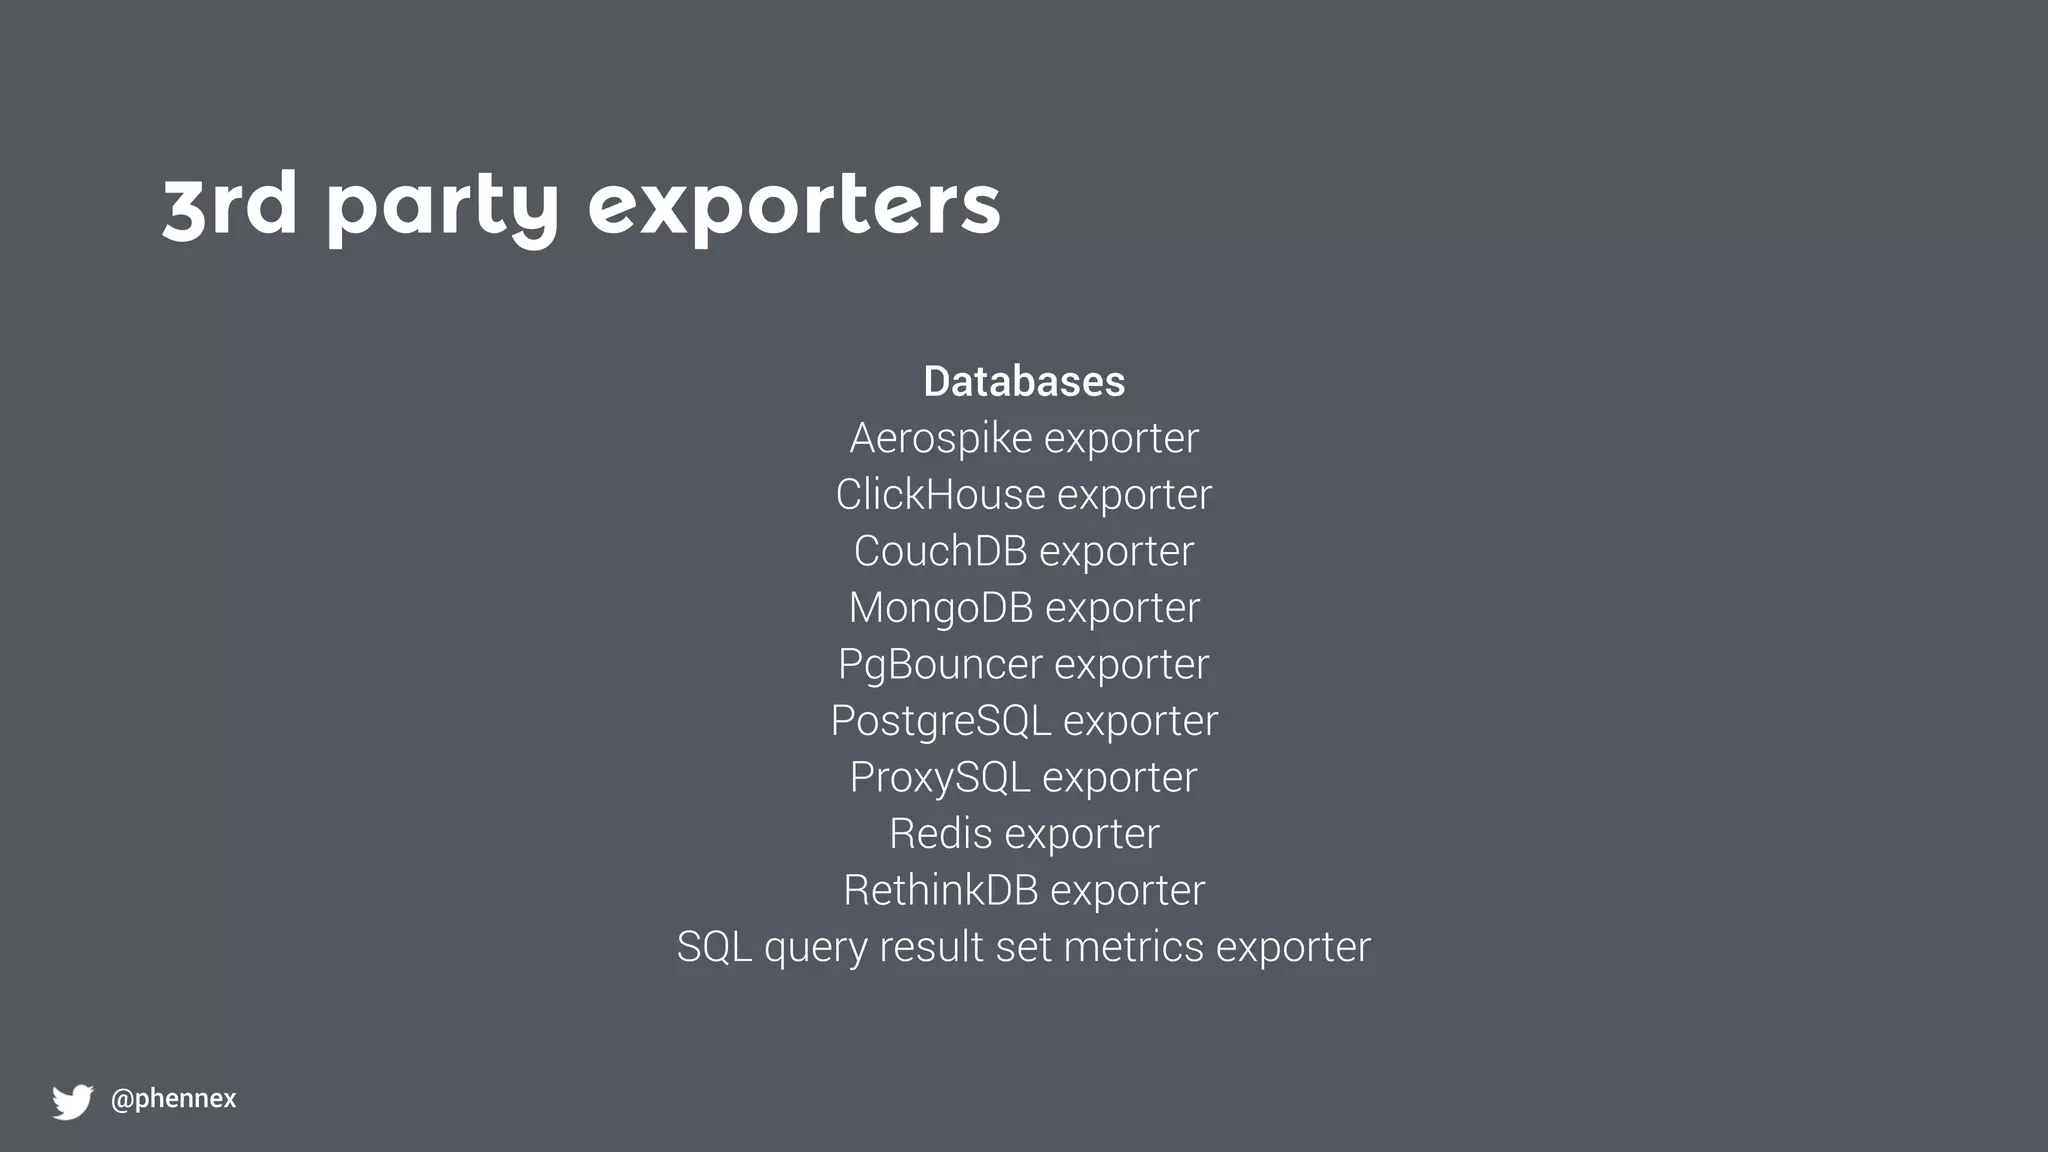
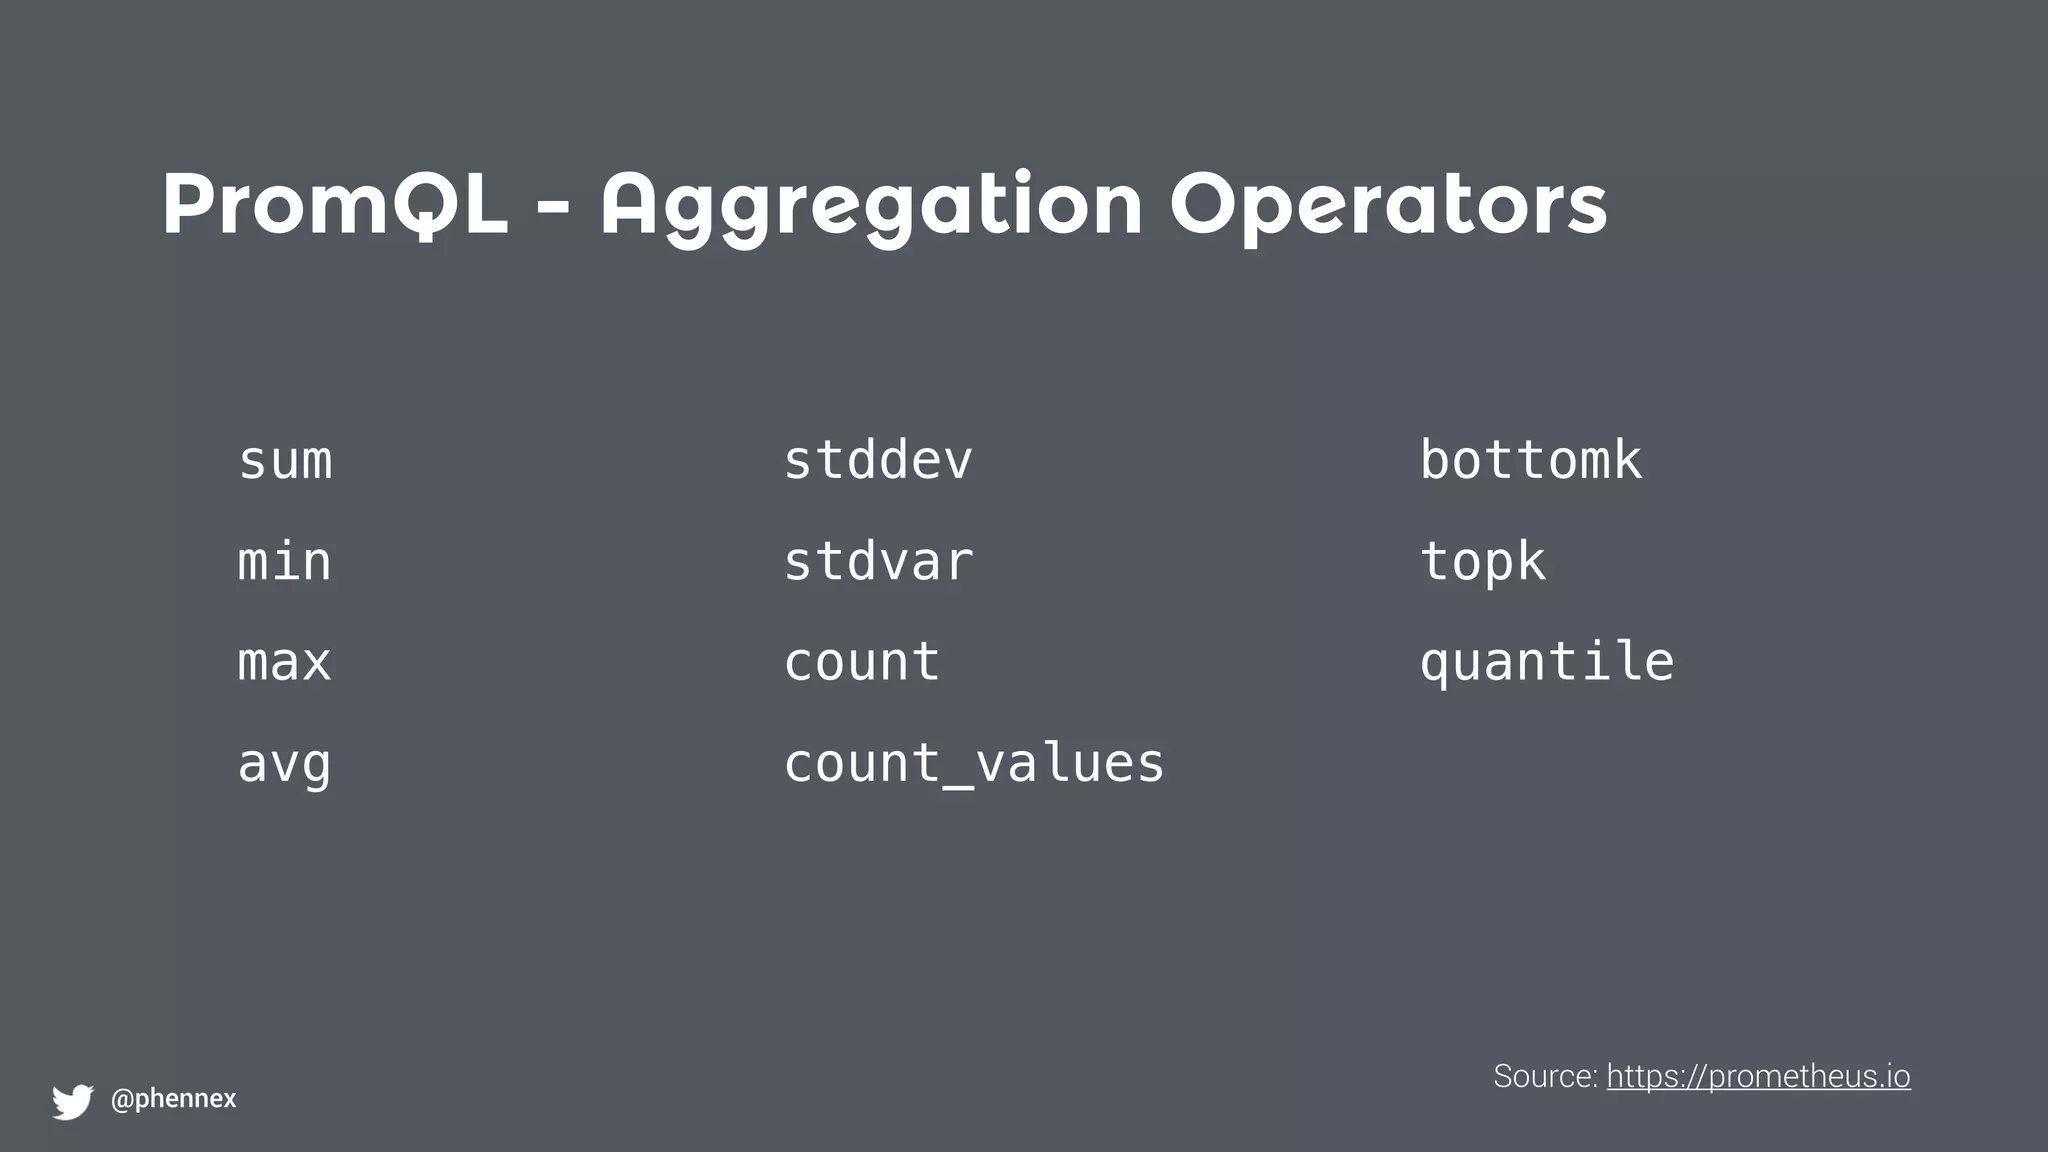
The document provides an overview of monitoring with Prometheus, covering its purpose, architecture, metrics collection, and alerting strategies. It emphasizes the importance of monitoring various system aspects including latency, traffic, errors, and saturation, while also introducing Prometheus as a pull-based monitoring system created by ex-Google engineers. Additionally, it includes practical suggestions for improving alerting processes and references for further information on the topic.


![UiPath Automation Suite Installation (Hands-On) [2/3]](https://cdn.slidesharecdn.com/ss_thumbnails/automationsuitecommunitysession2-251015095633-a6d862f1-thumbnail.jpg?width=600ounds&width=560&fit=bounds)


