Download as PDF, PPTX


The document outlines a presentation by Sebastian Poxhofer on the state of observability in DevOps and security, focusing on OpenTelemetry as a solution for monitoring complex microservices architectures. It discusses key concepts such as instrumentation, data querying, and the significance of metadata standards to avoid vendor lock-in. The presentation also covers the components of OpenTelemetry, its support across multiple programming languages, and the current status of its implementation.
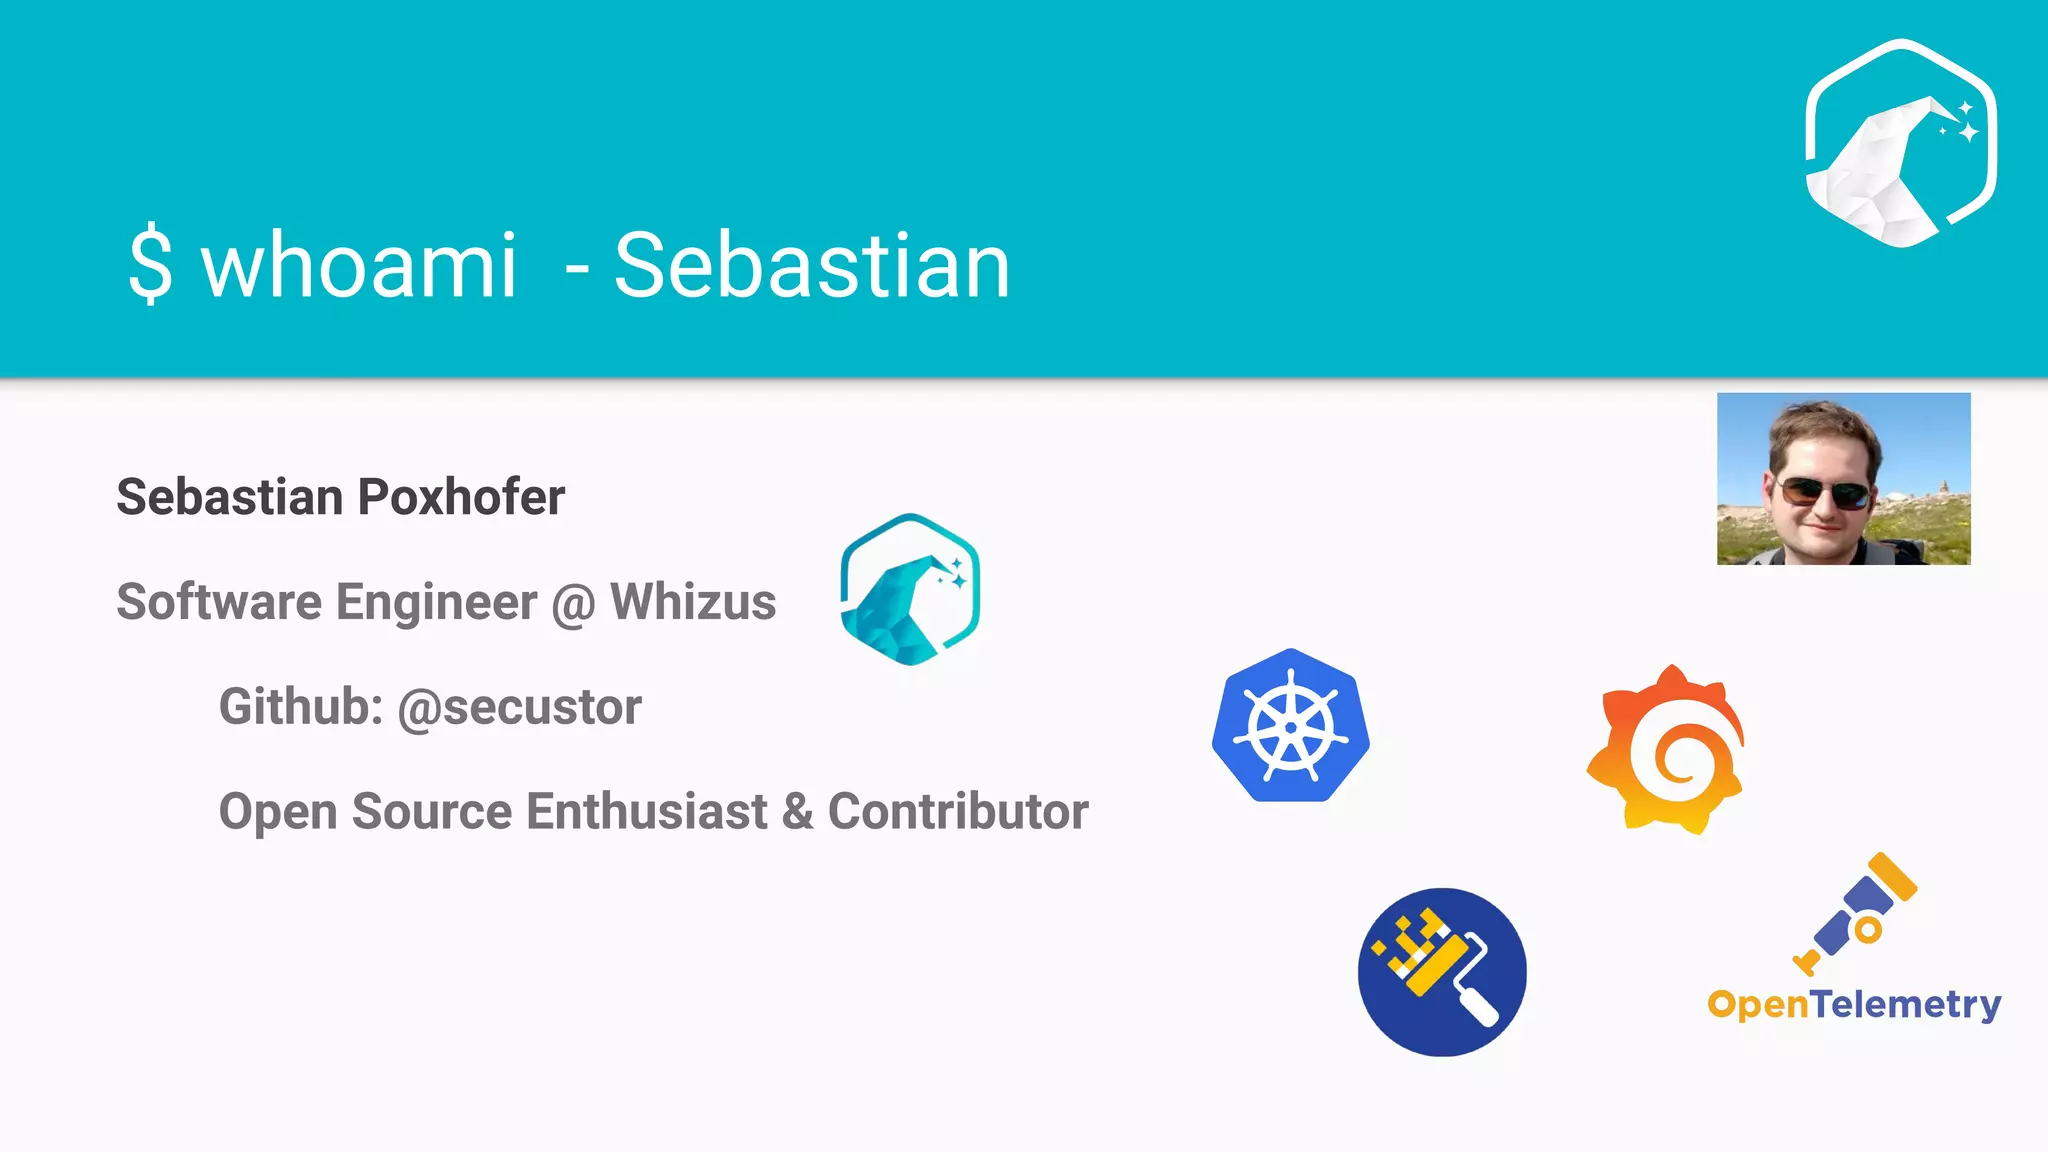
The presentation introduces the Vienna DevOps & Security Meetup, presenting the speaker, Sebastian Poxhofer, and outlining the agenda.
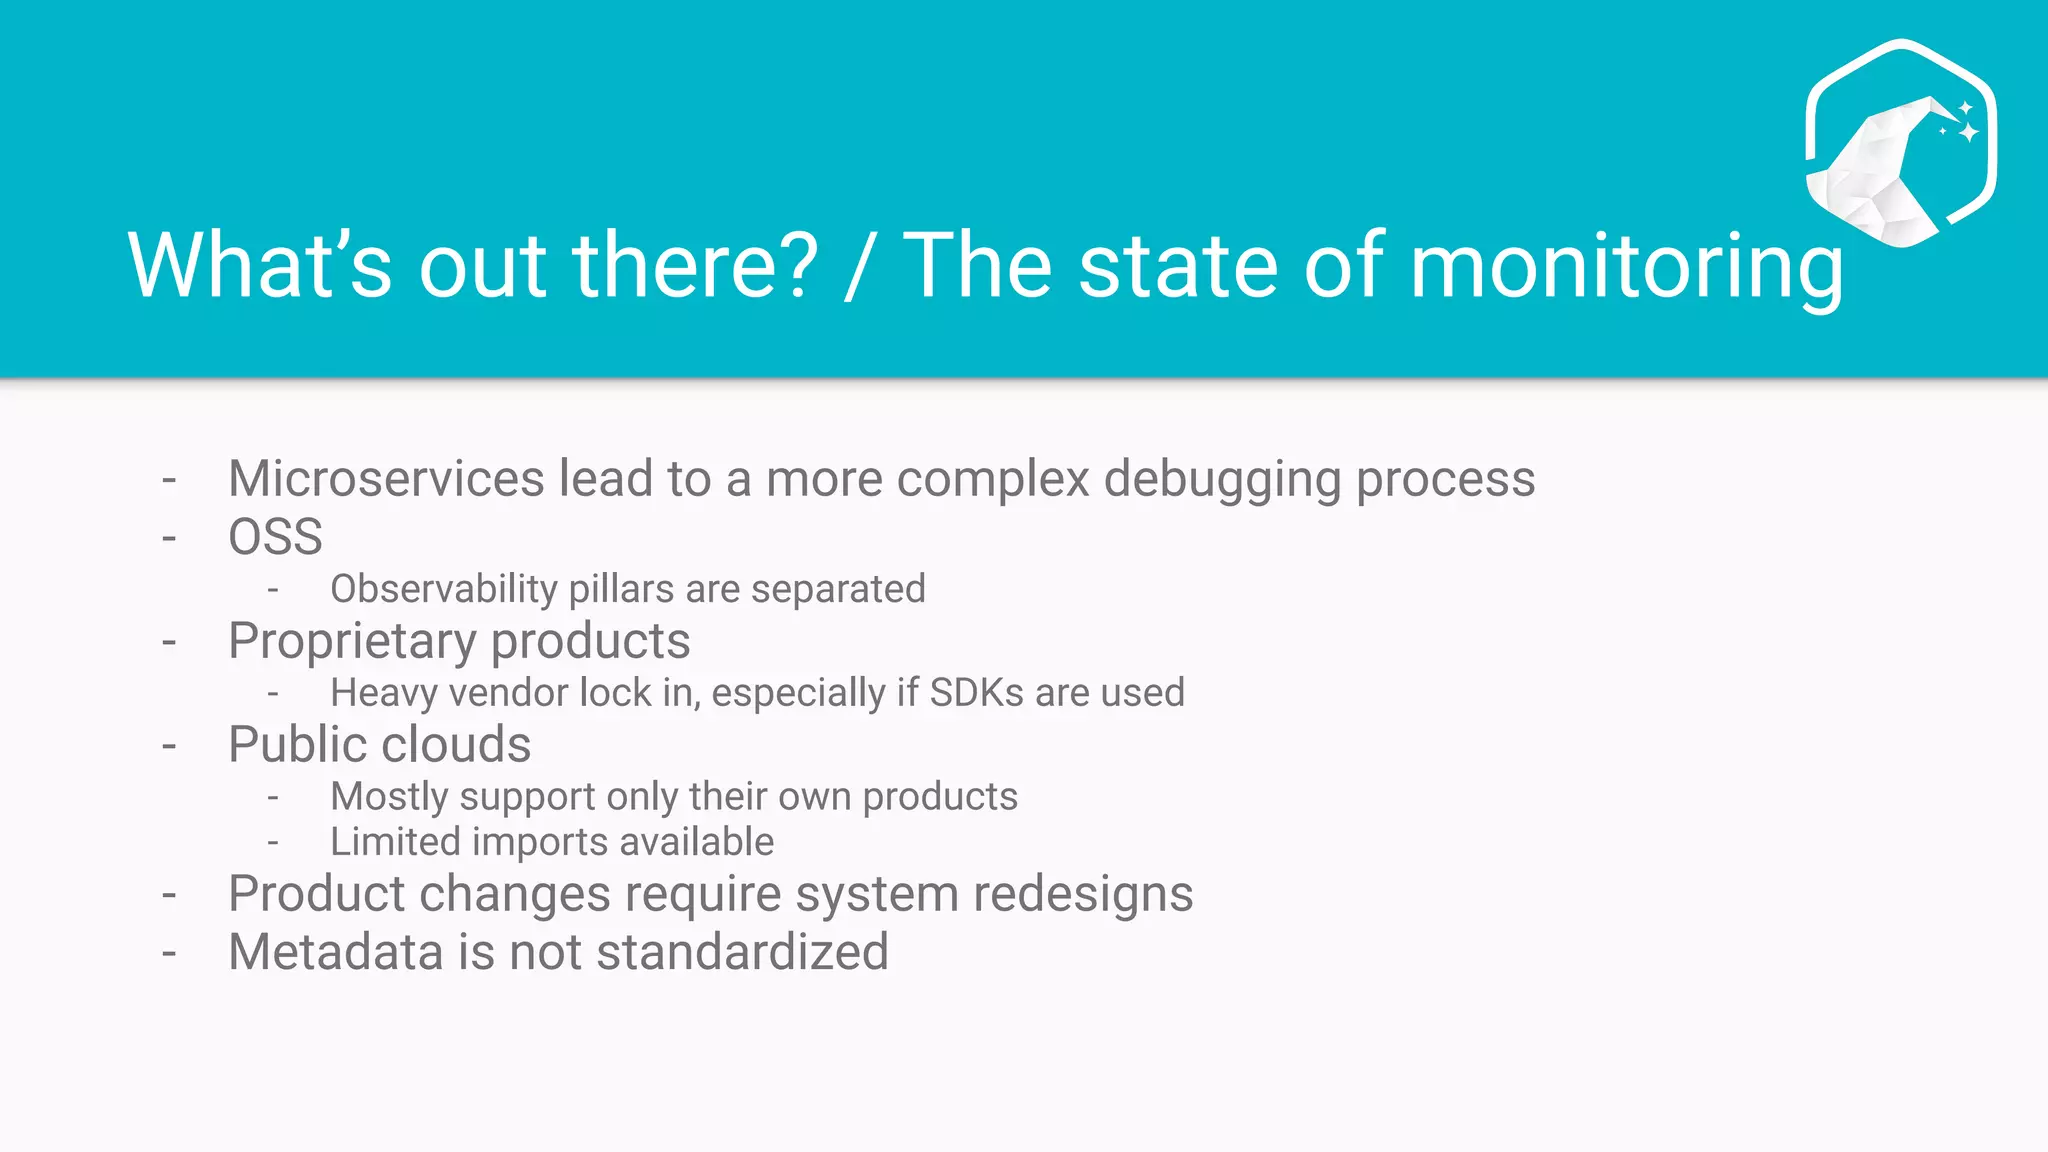
Illustrates the complexities in monitoring due to microservices, OSS, and proprietary products leading to vendor lock-in.
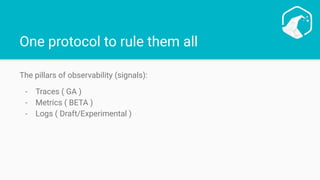
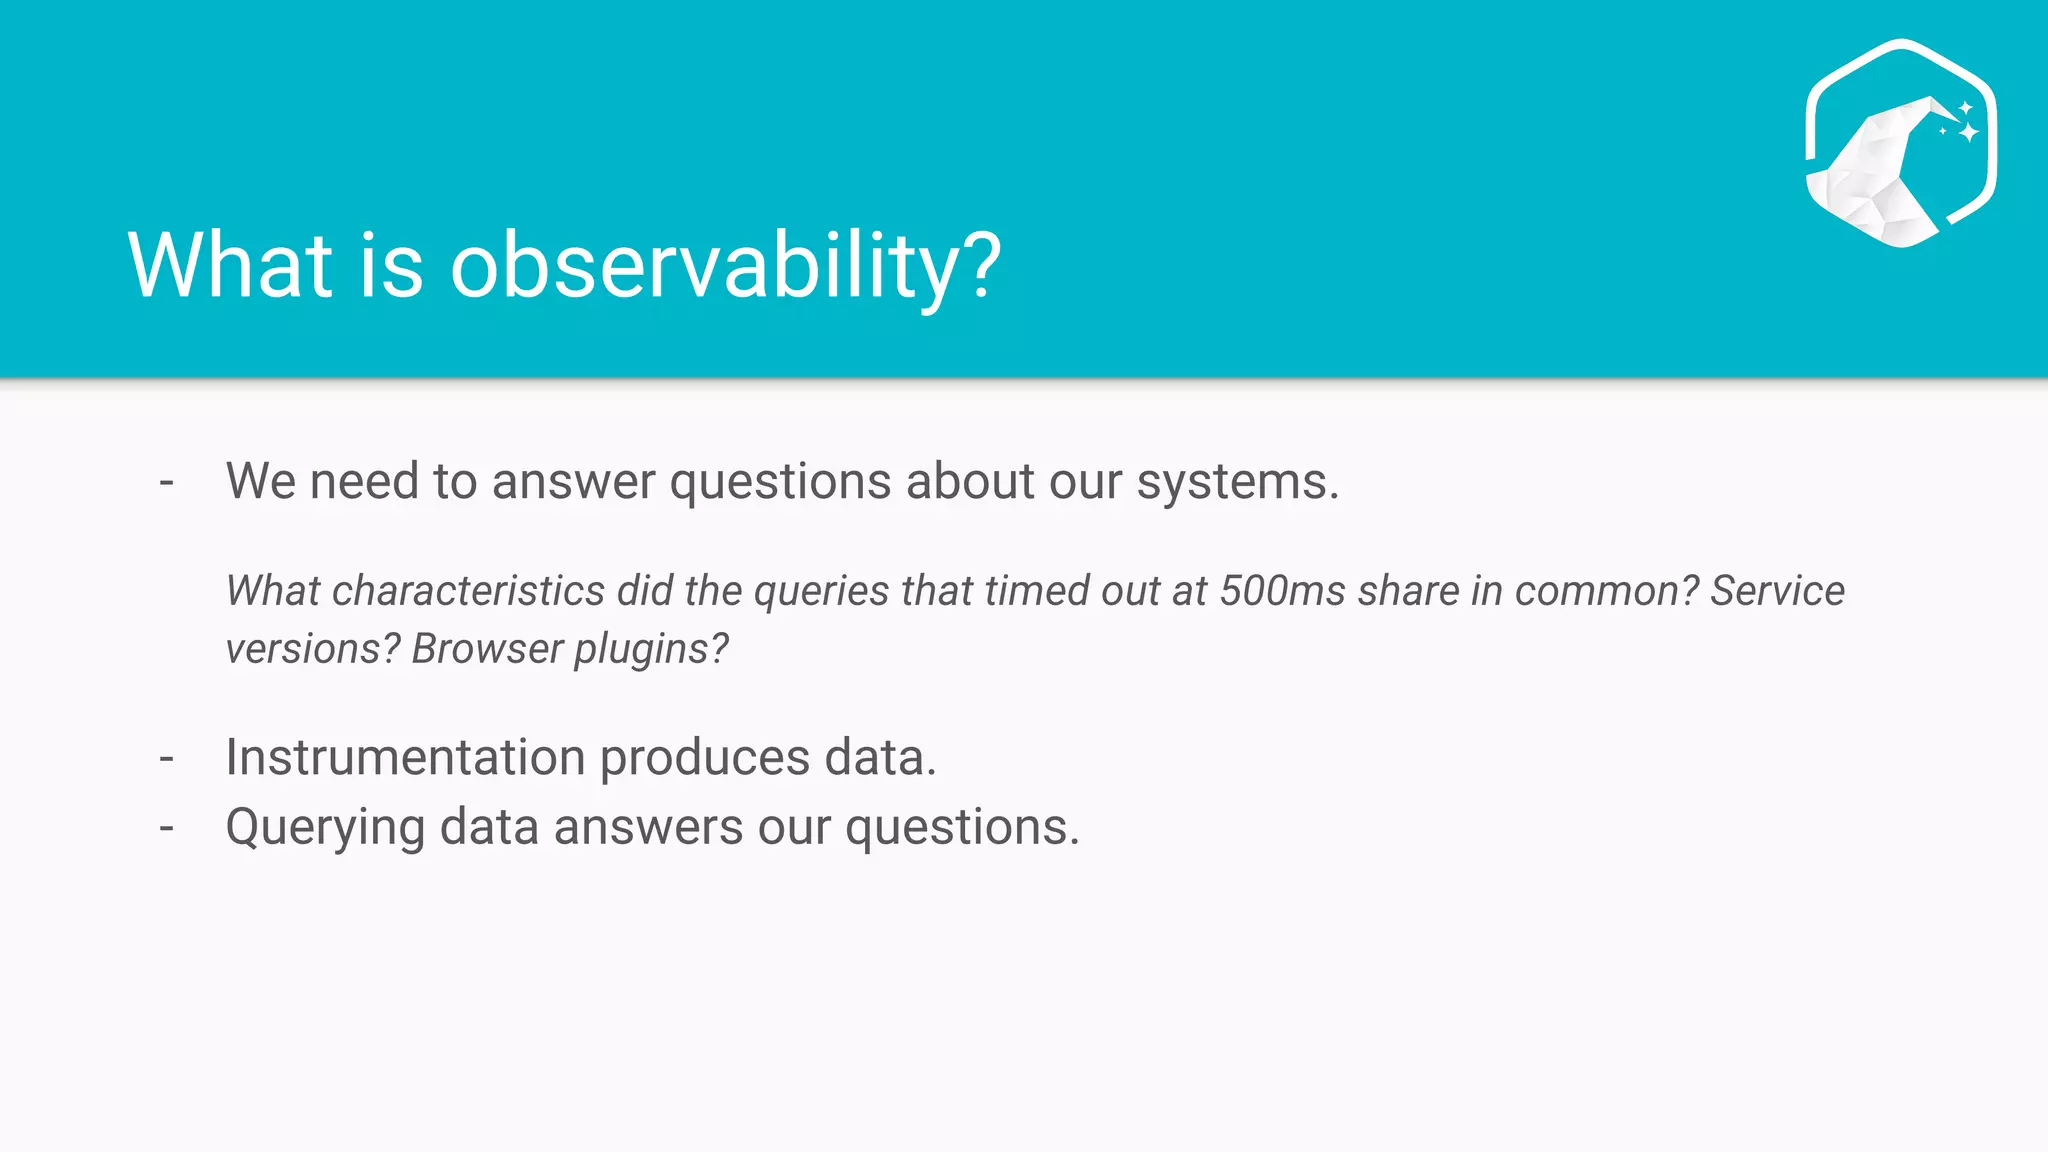
Discusses the necessity of observability, outlining its pillars: traces, metrics, and logs, pivotal for answering system queries.
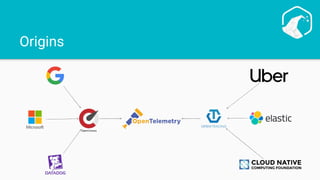
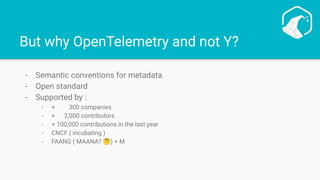
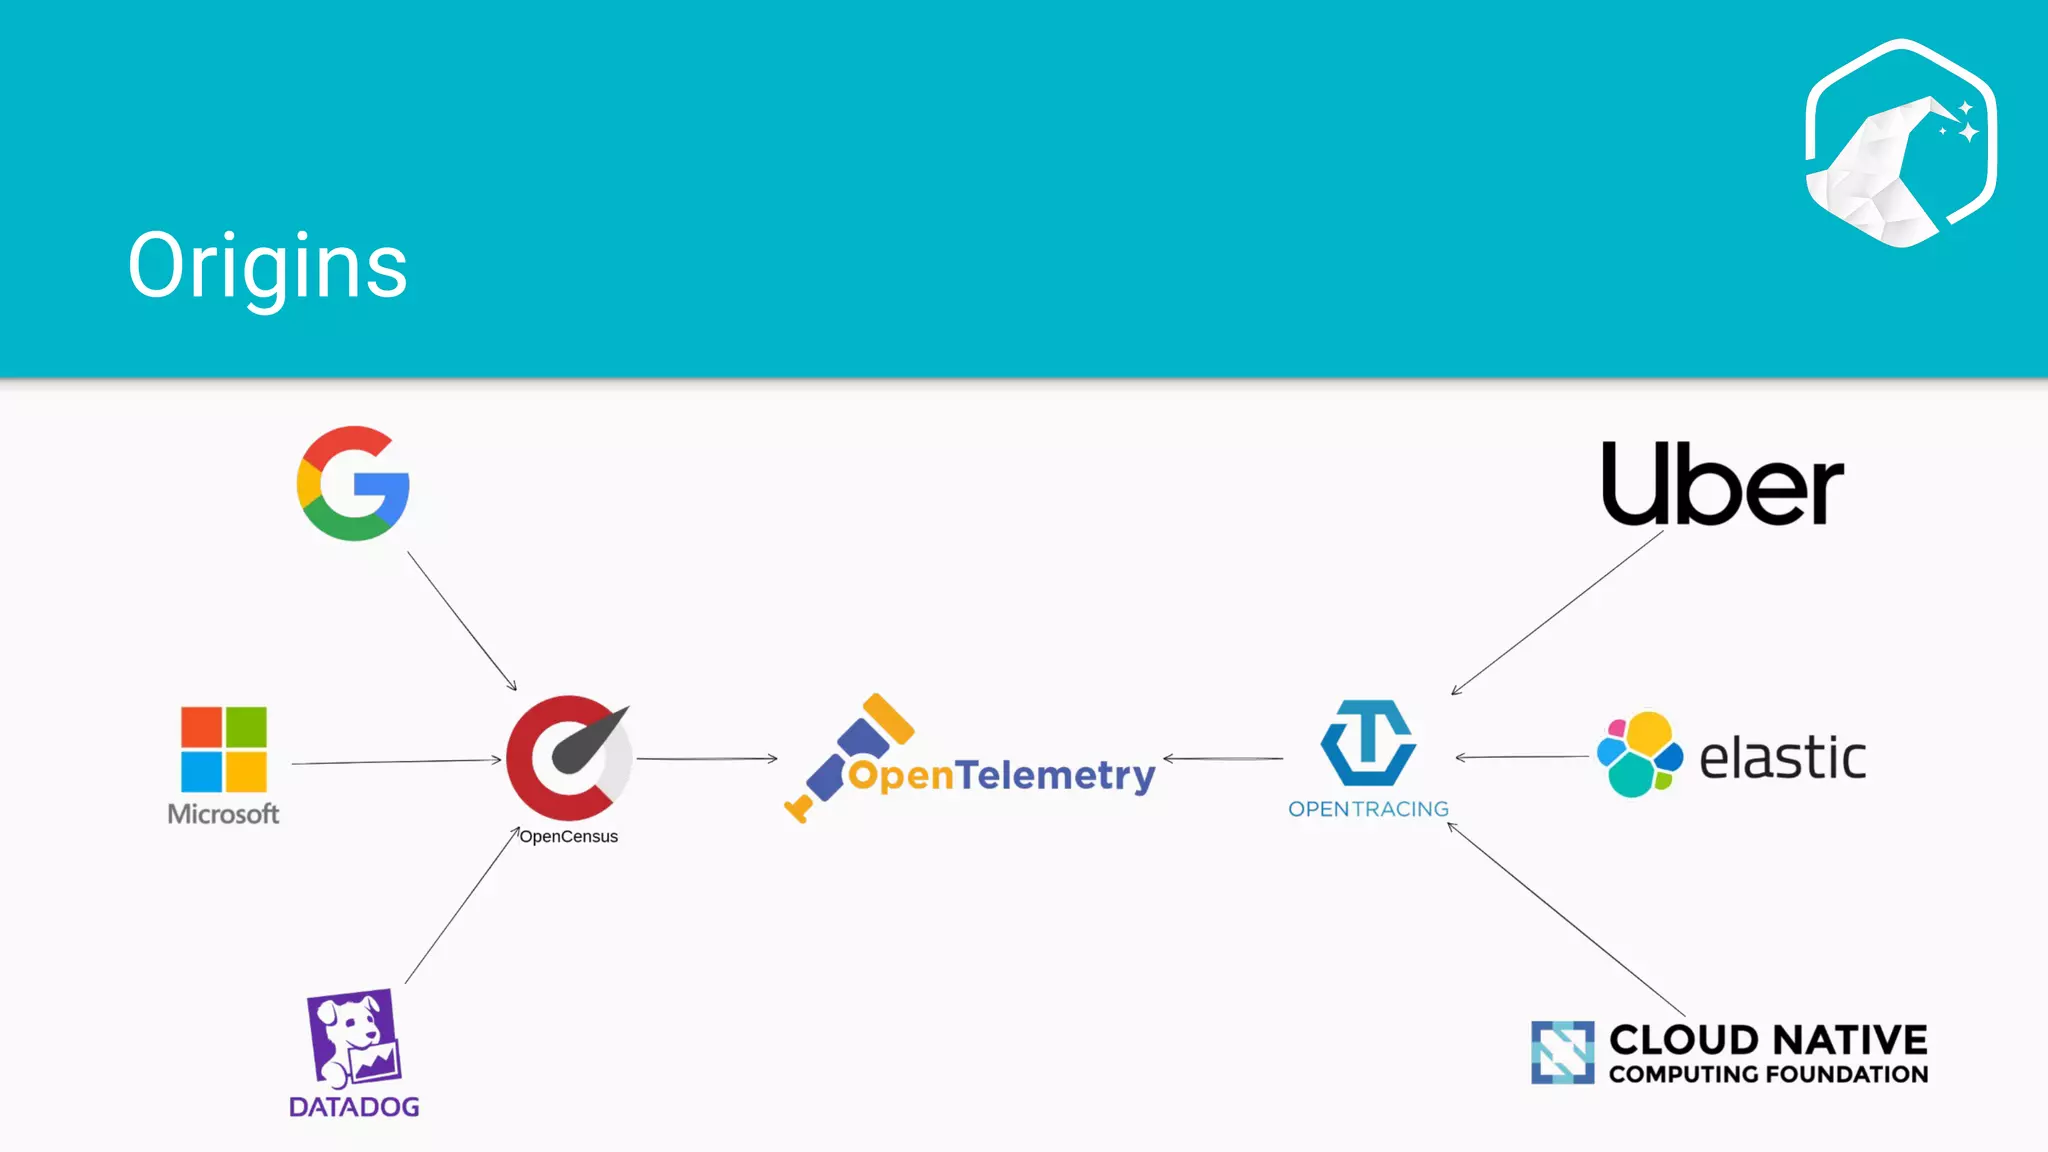
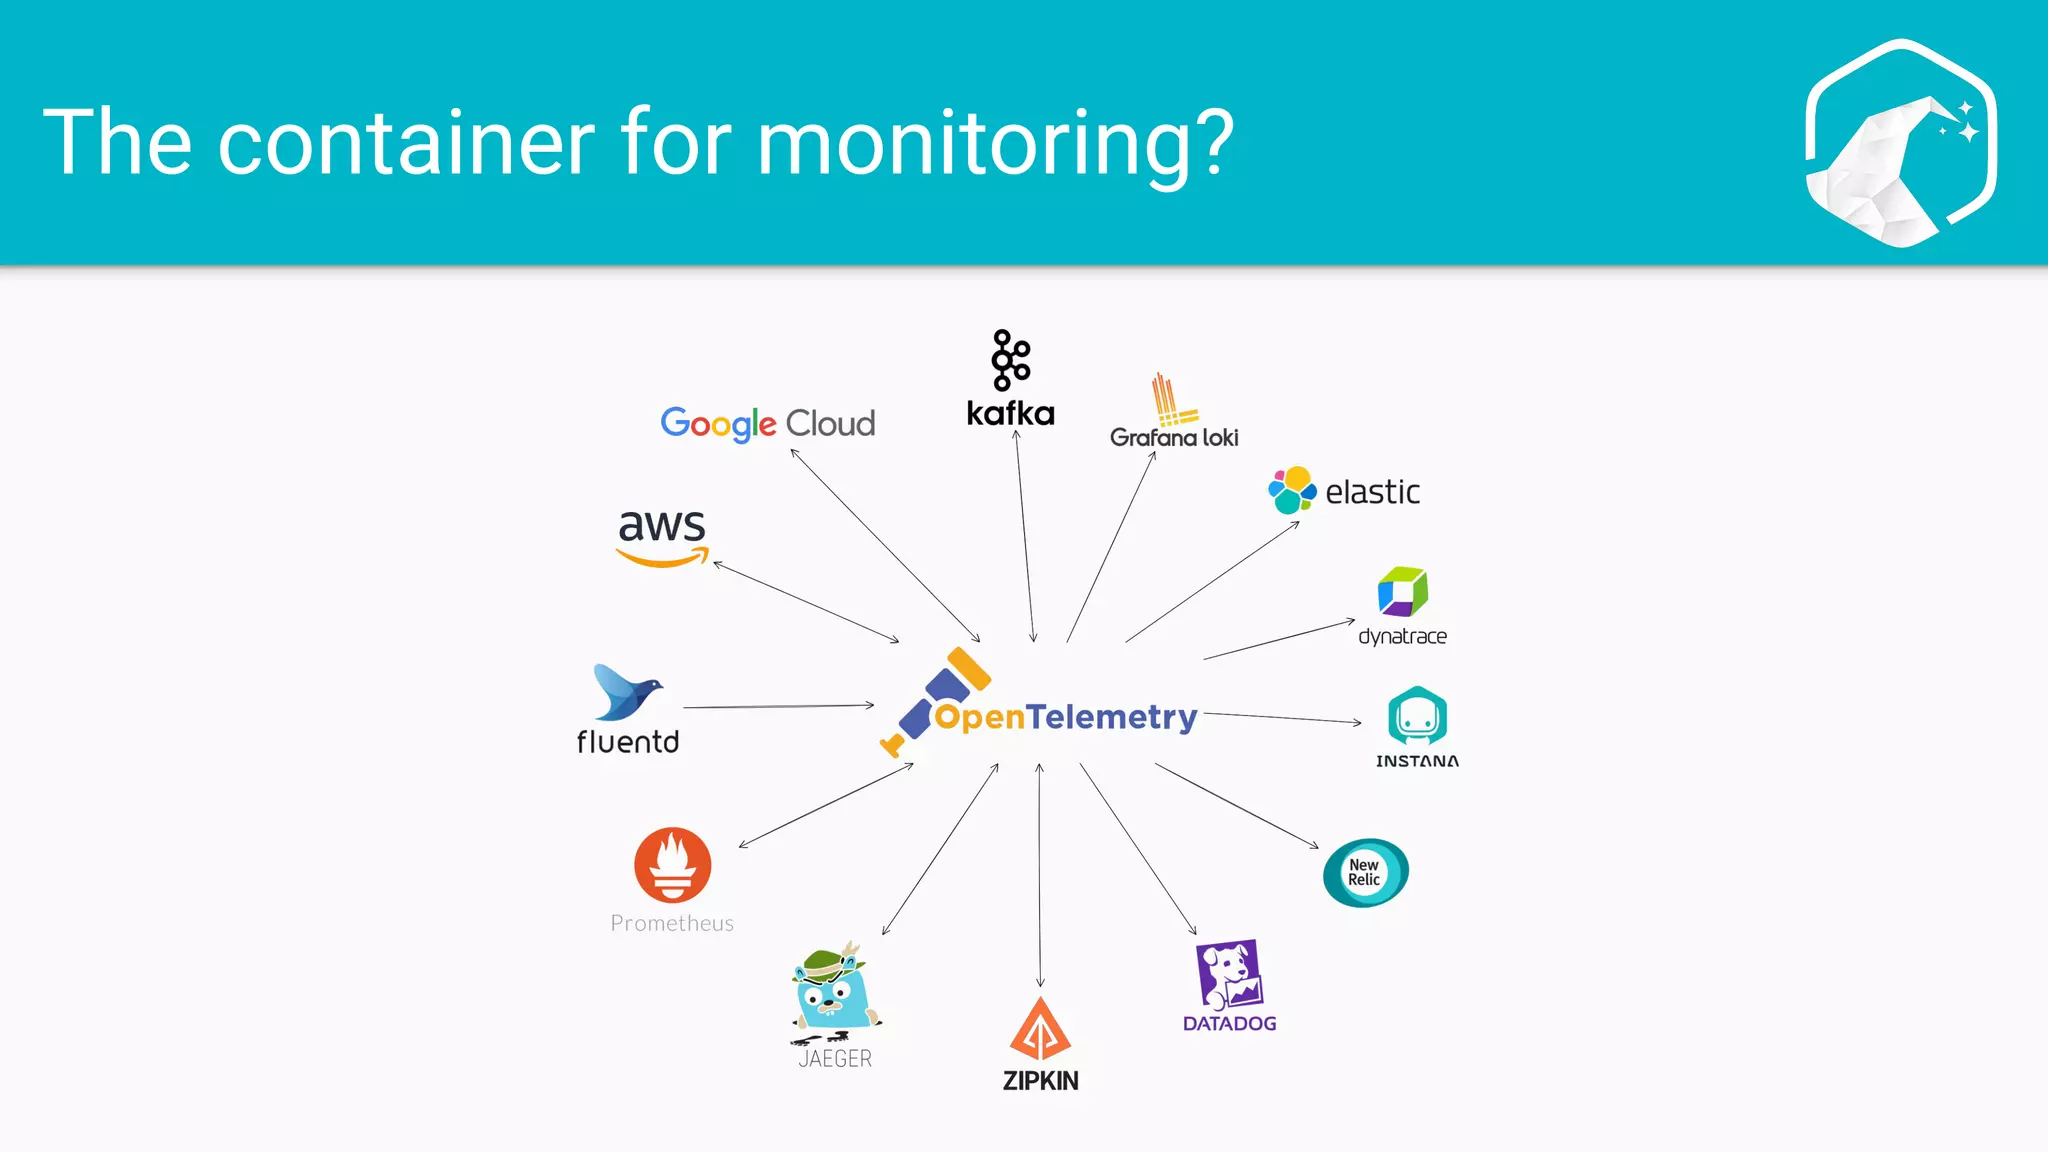
Highlights OpenTelemetry's advantages such as semantic conventions, open standards, and extensive support from major companies.
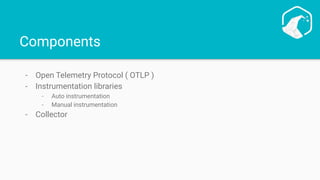
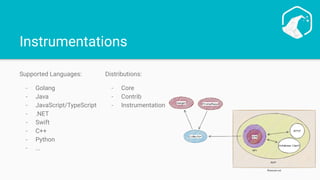
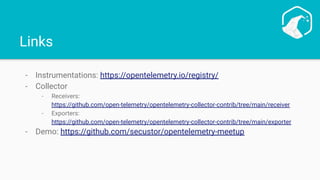
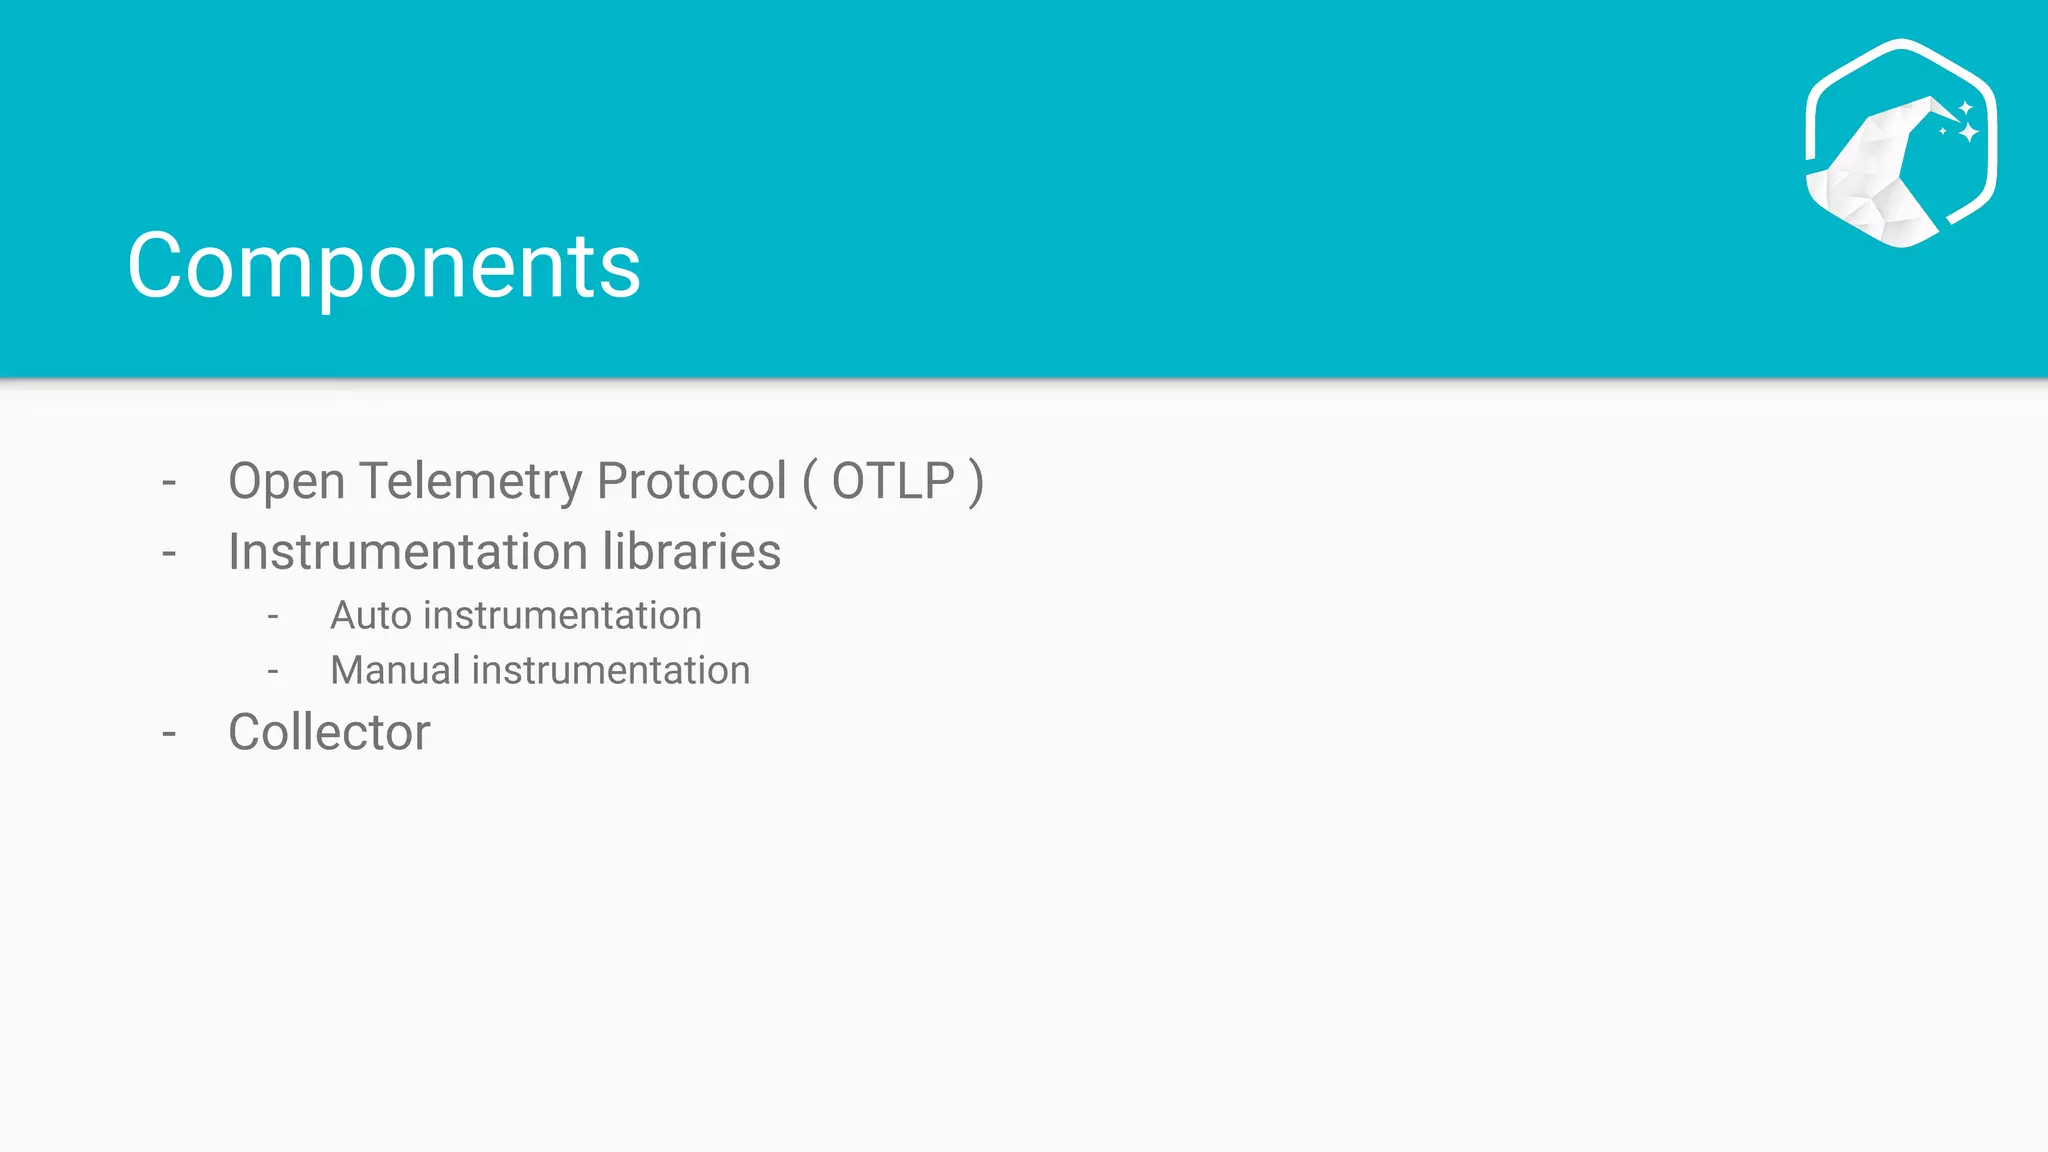
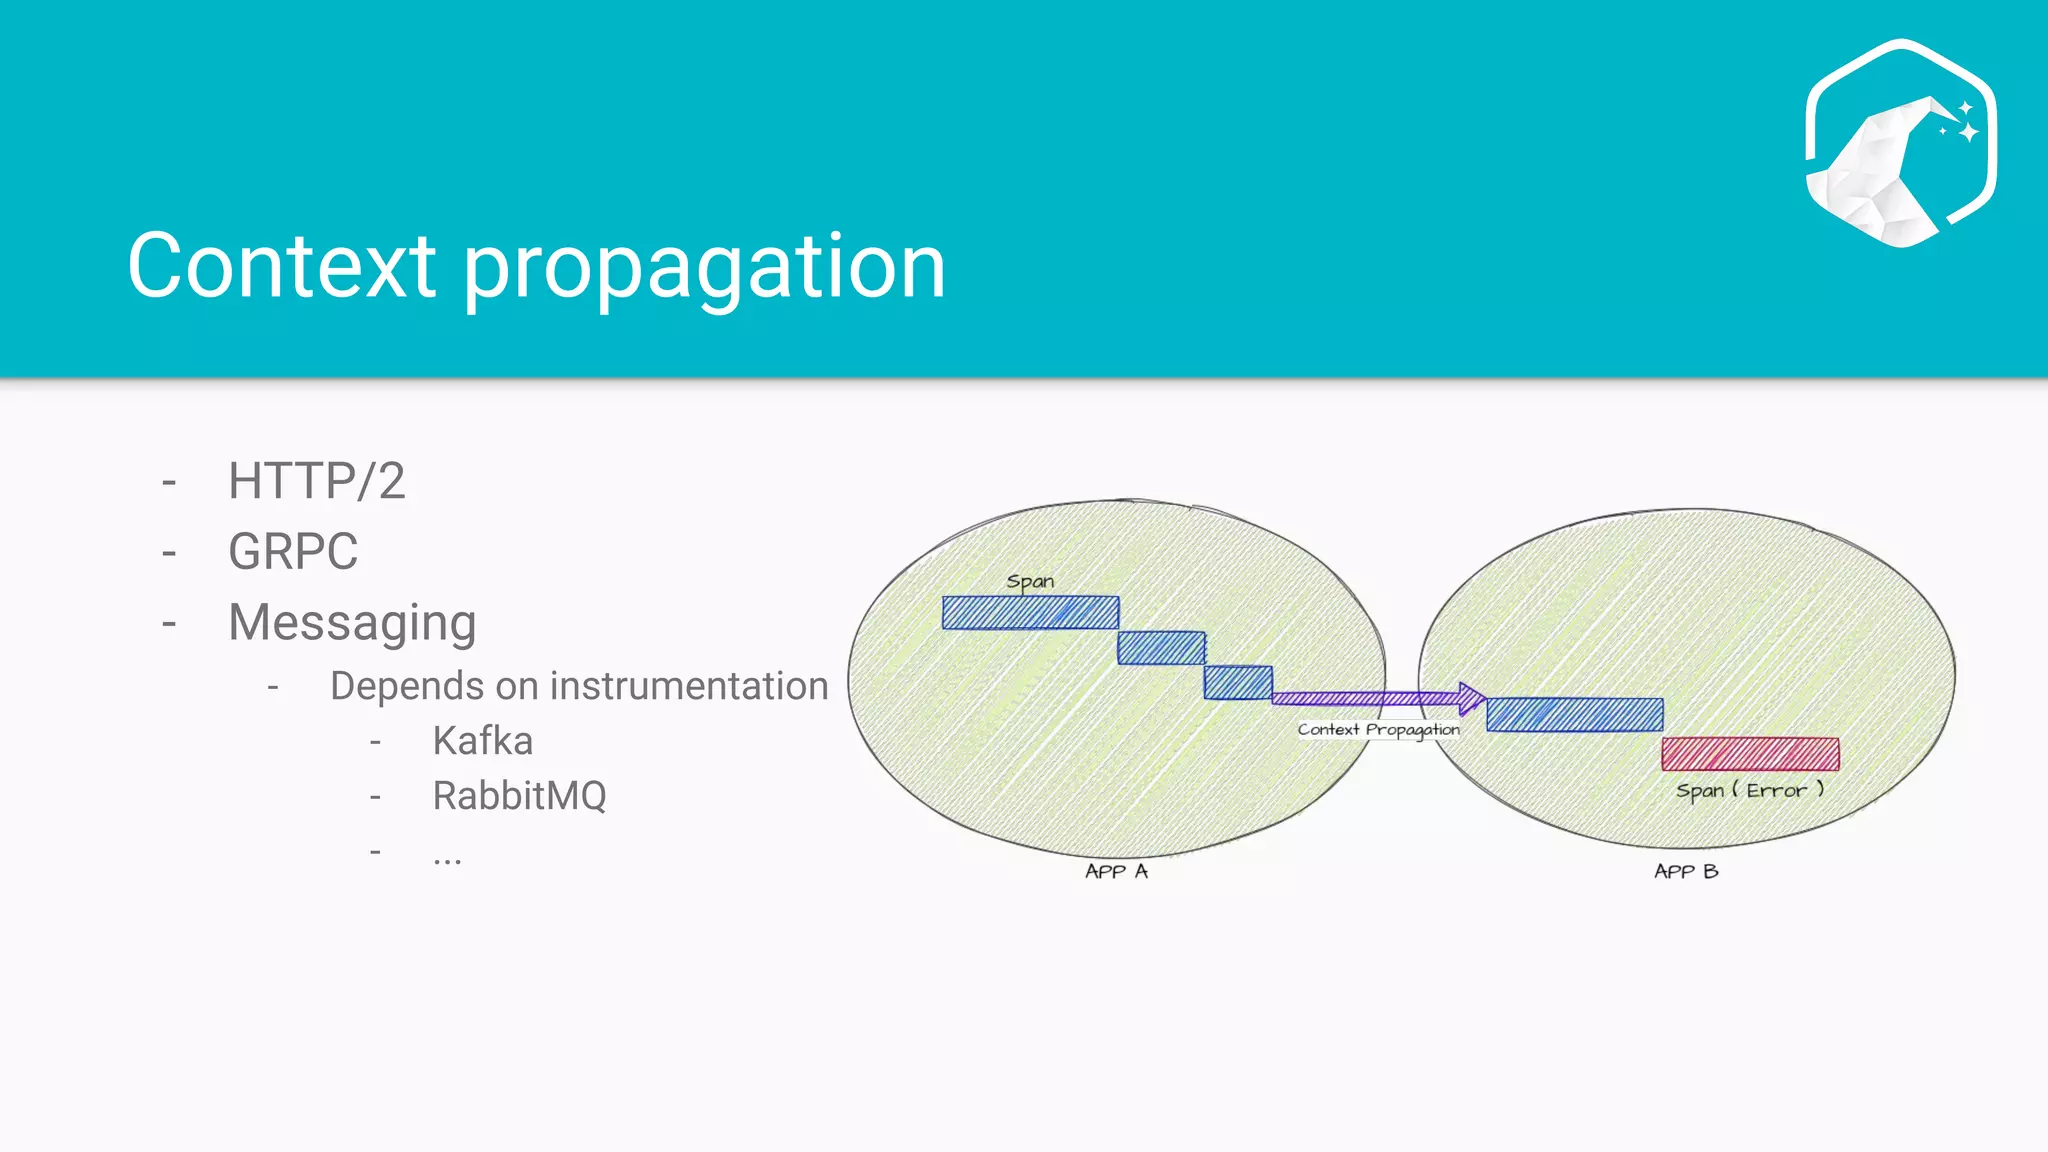
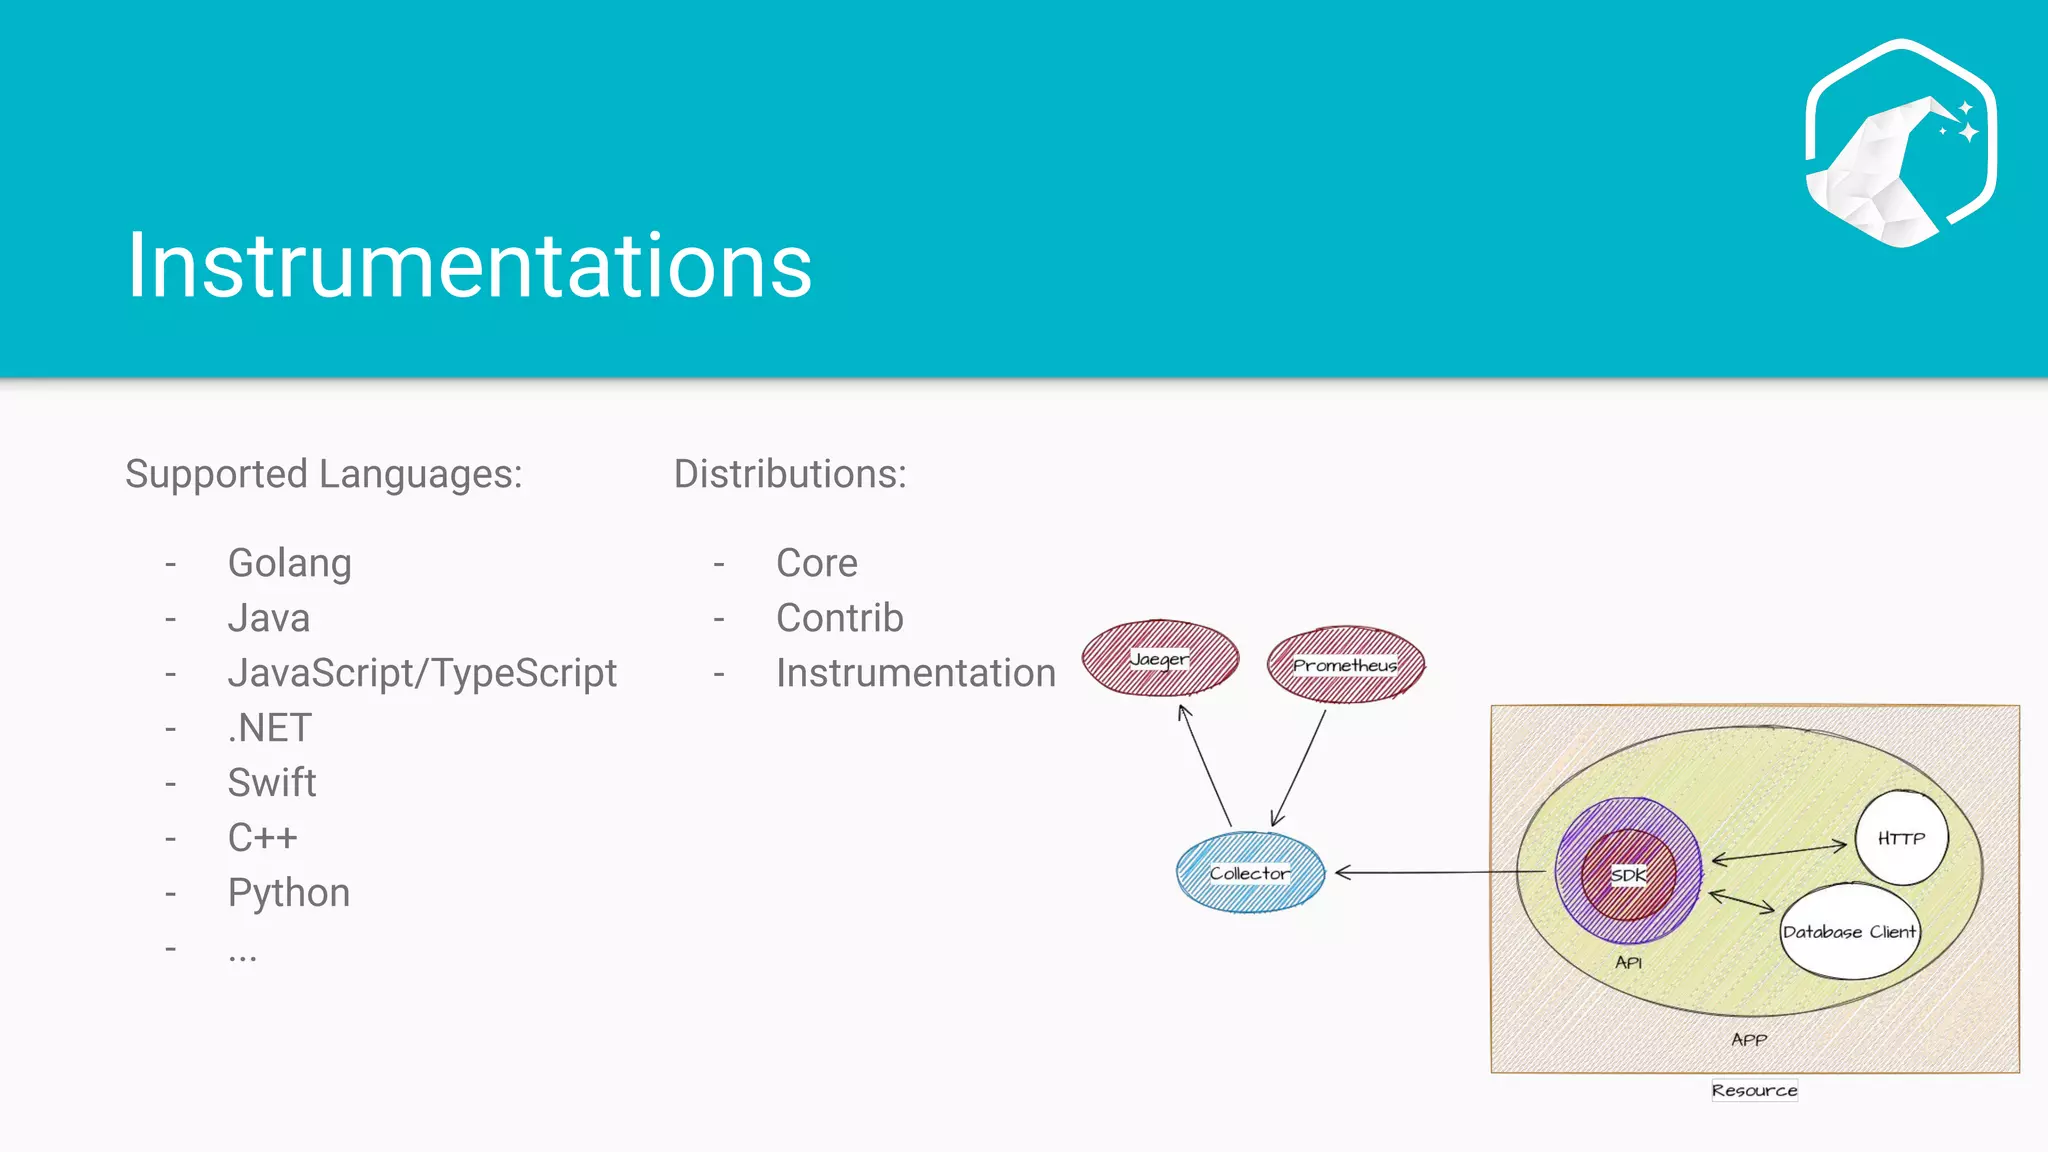
Explains key components of OpenTelemetry, including protocols, instrumentation libraries, and supported languages.
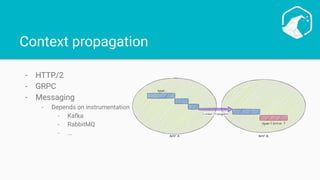
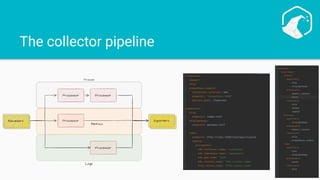
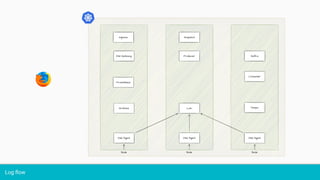
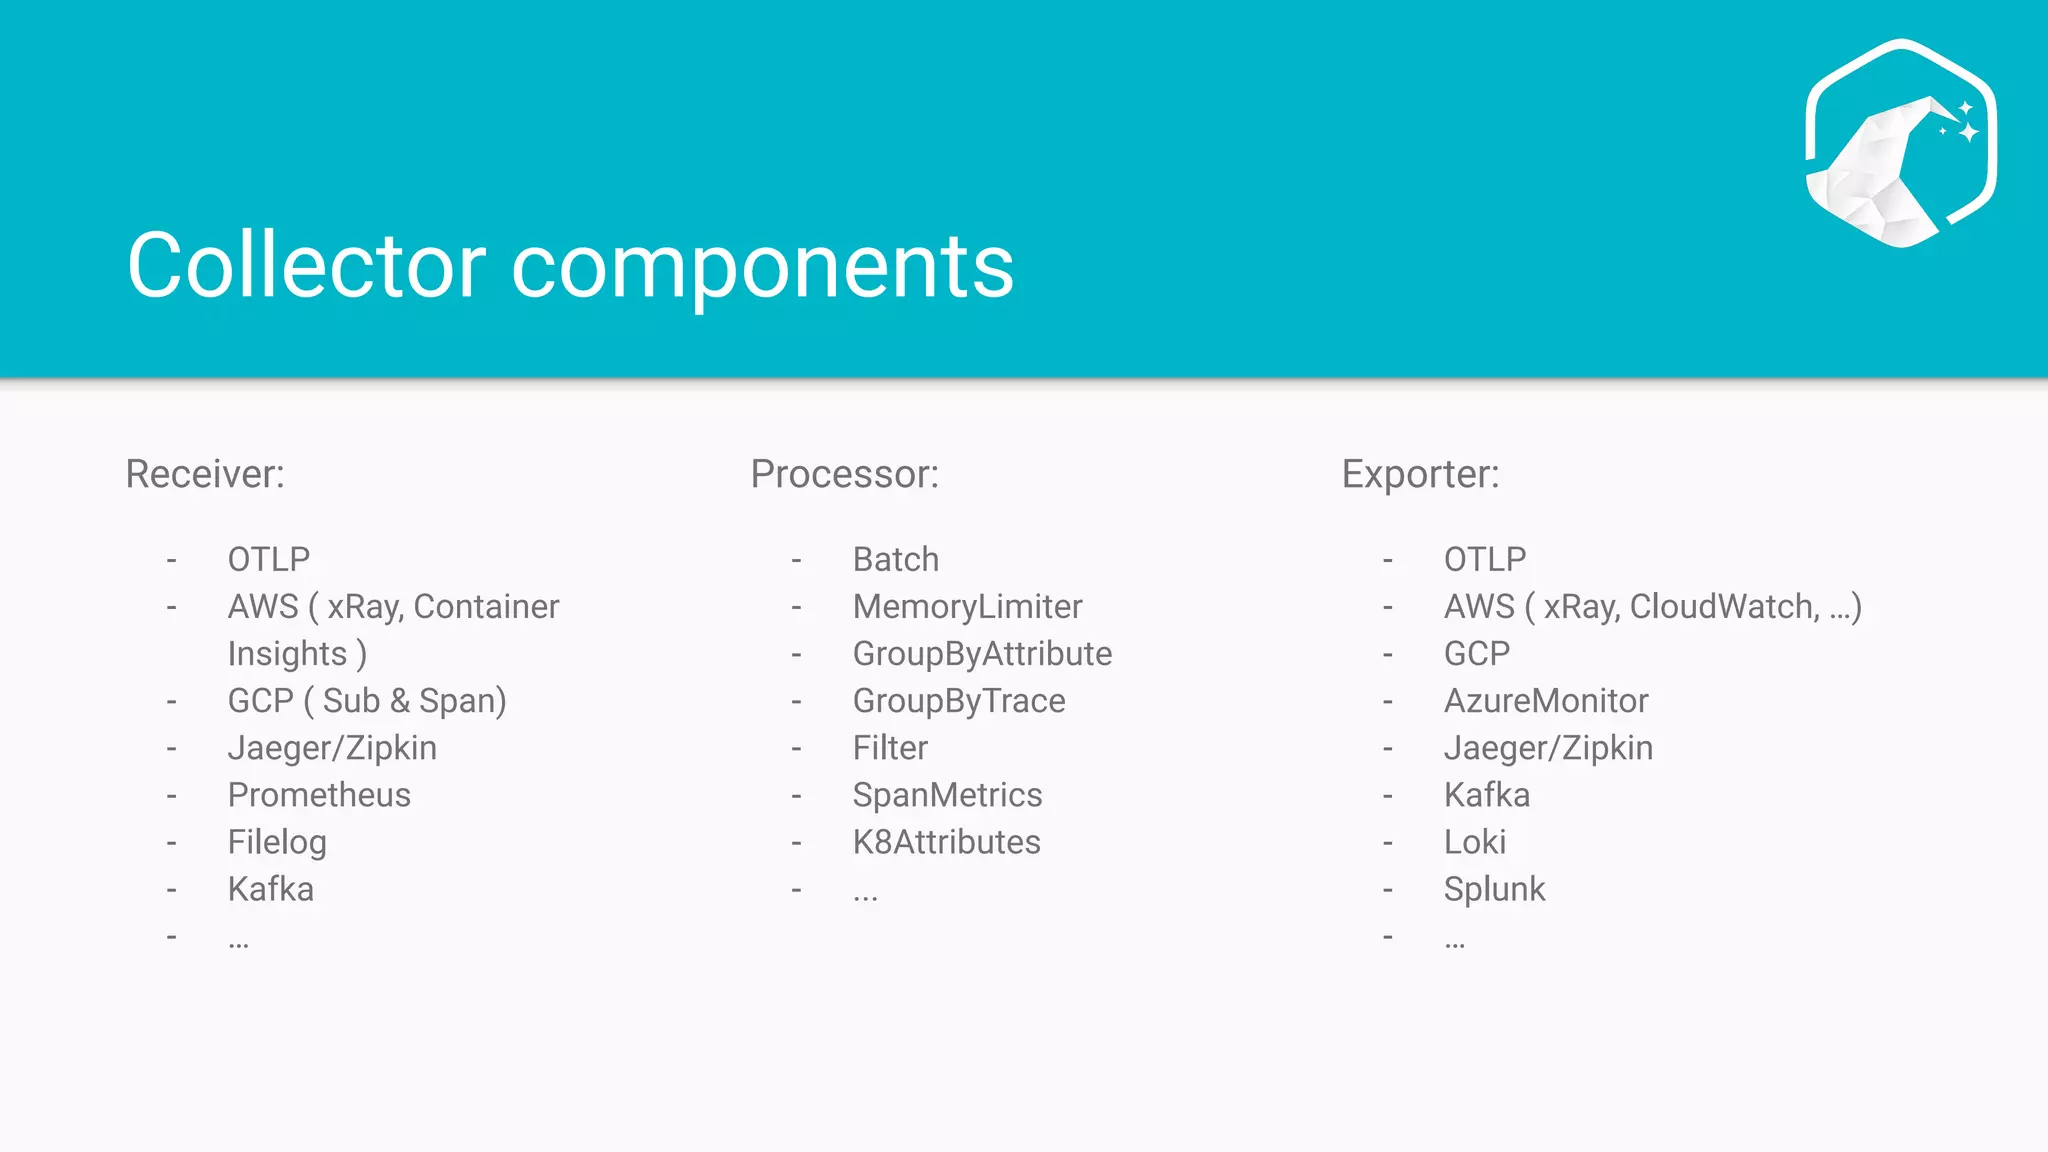
Describes the architecture of the collector pipeline, detailing its components like receiver, processor, and exporter.
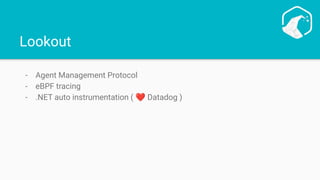
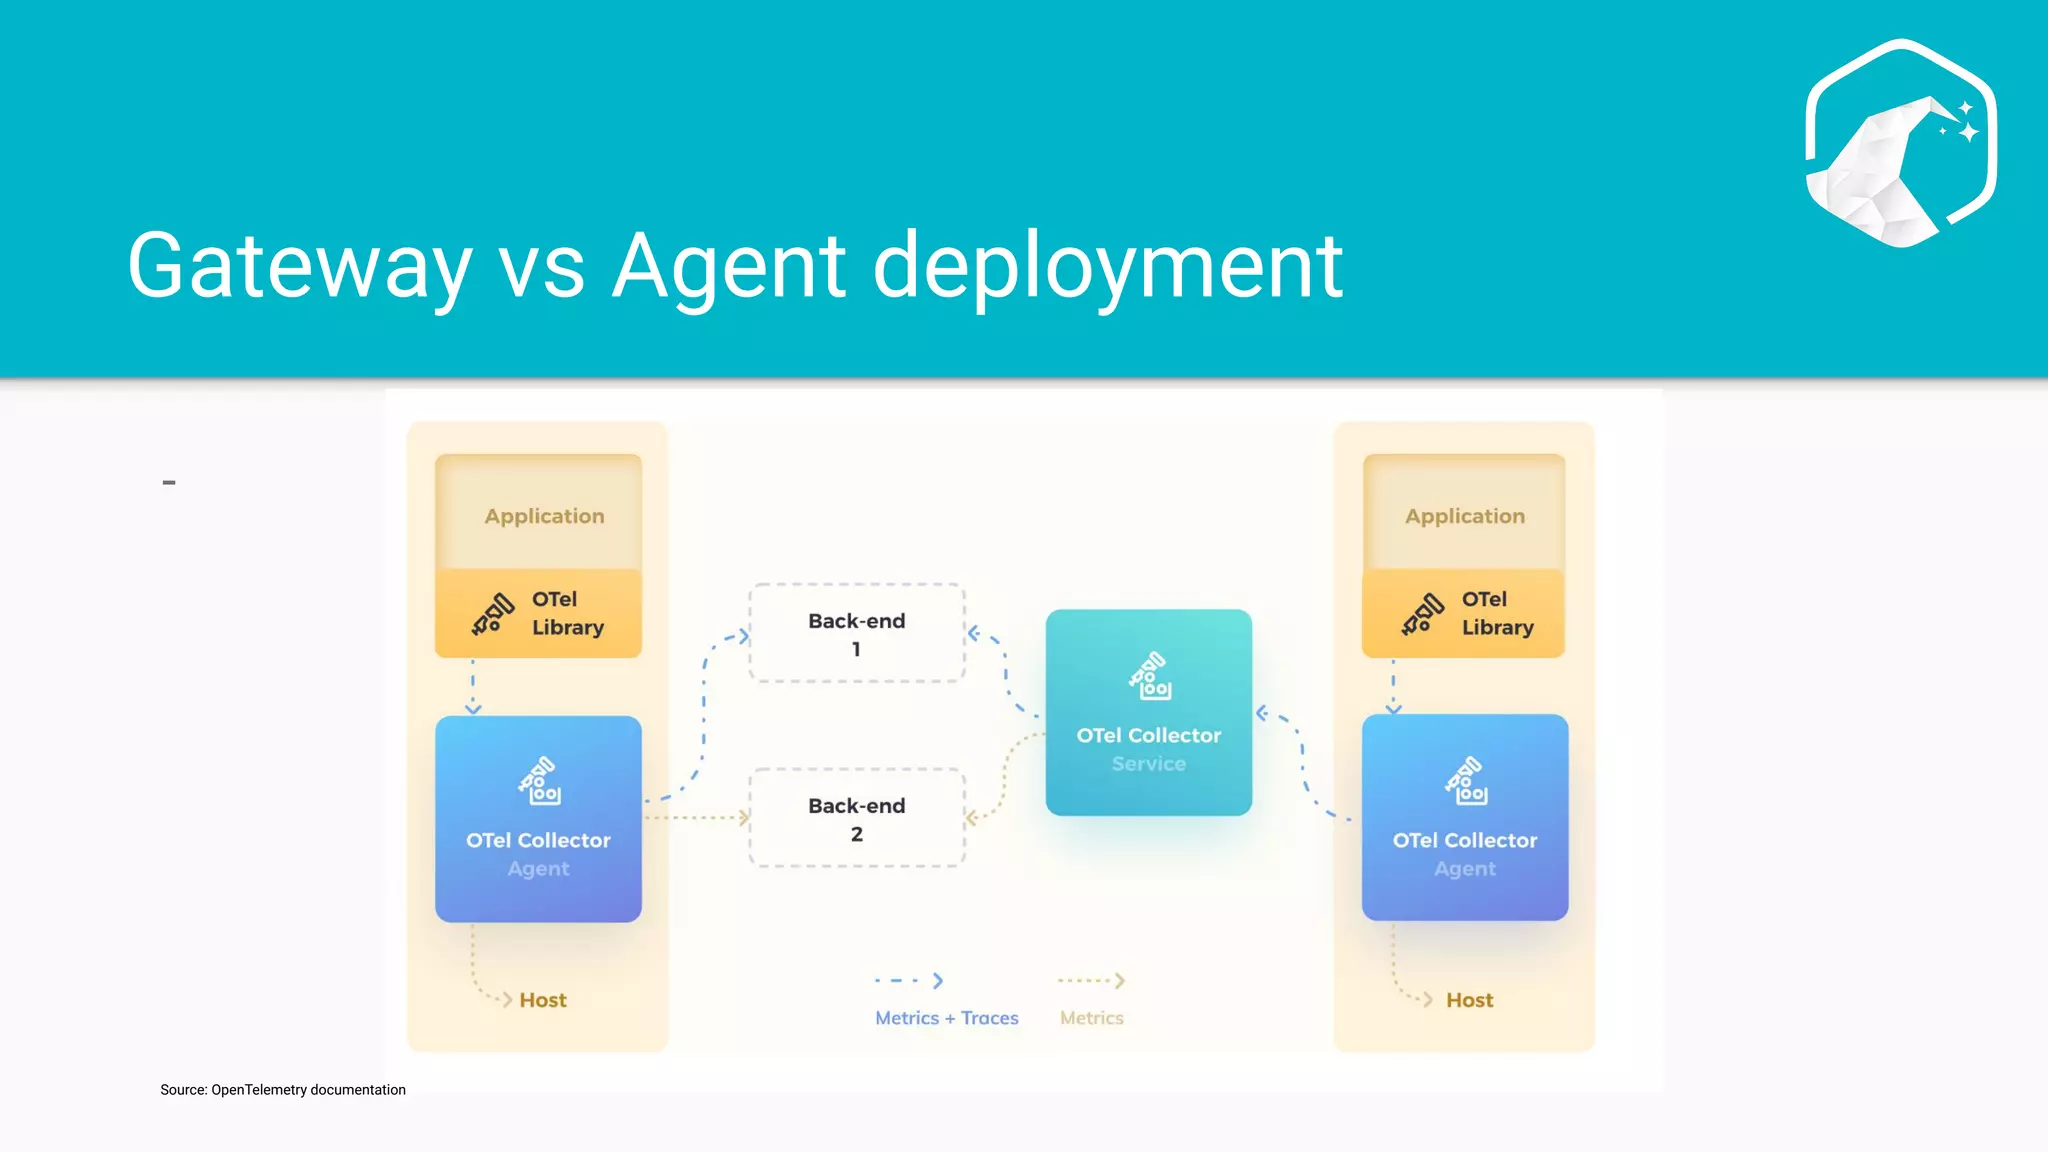
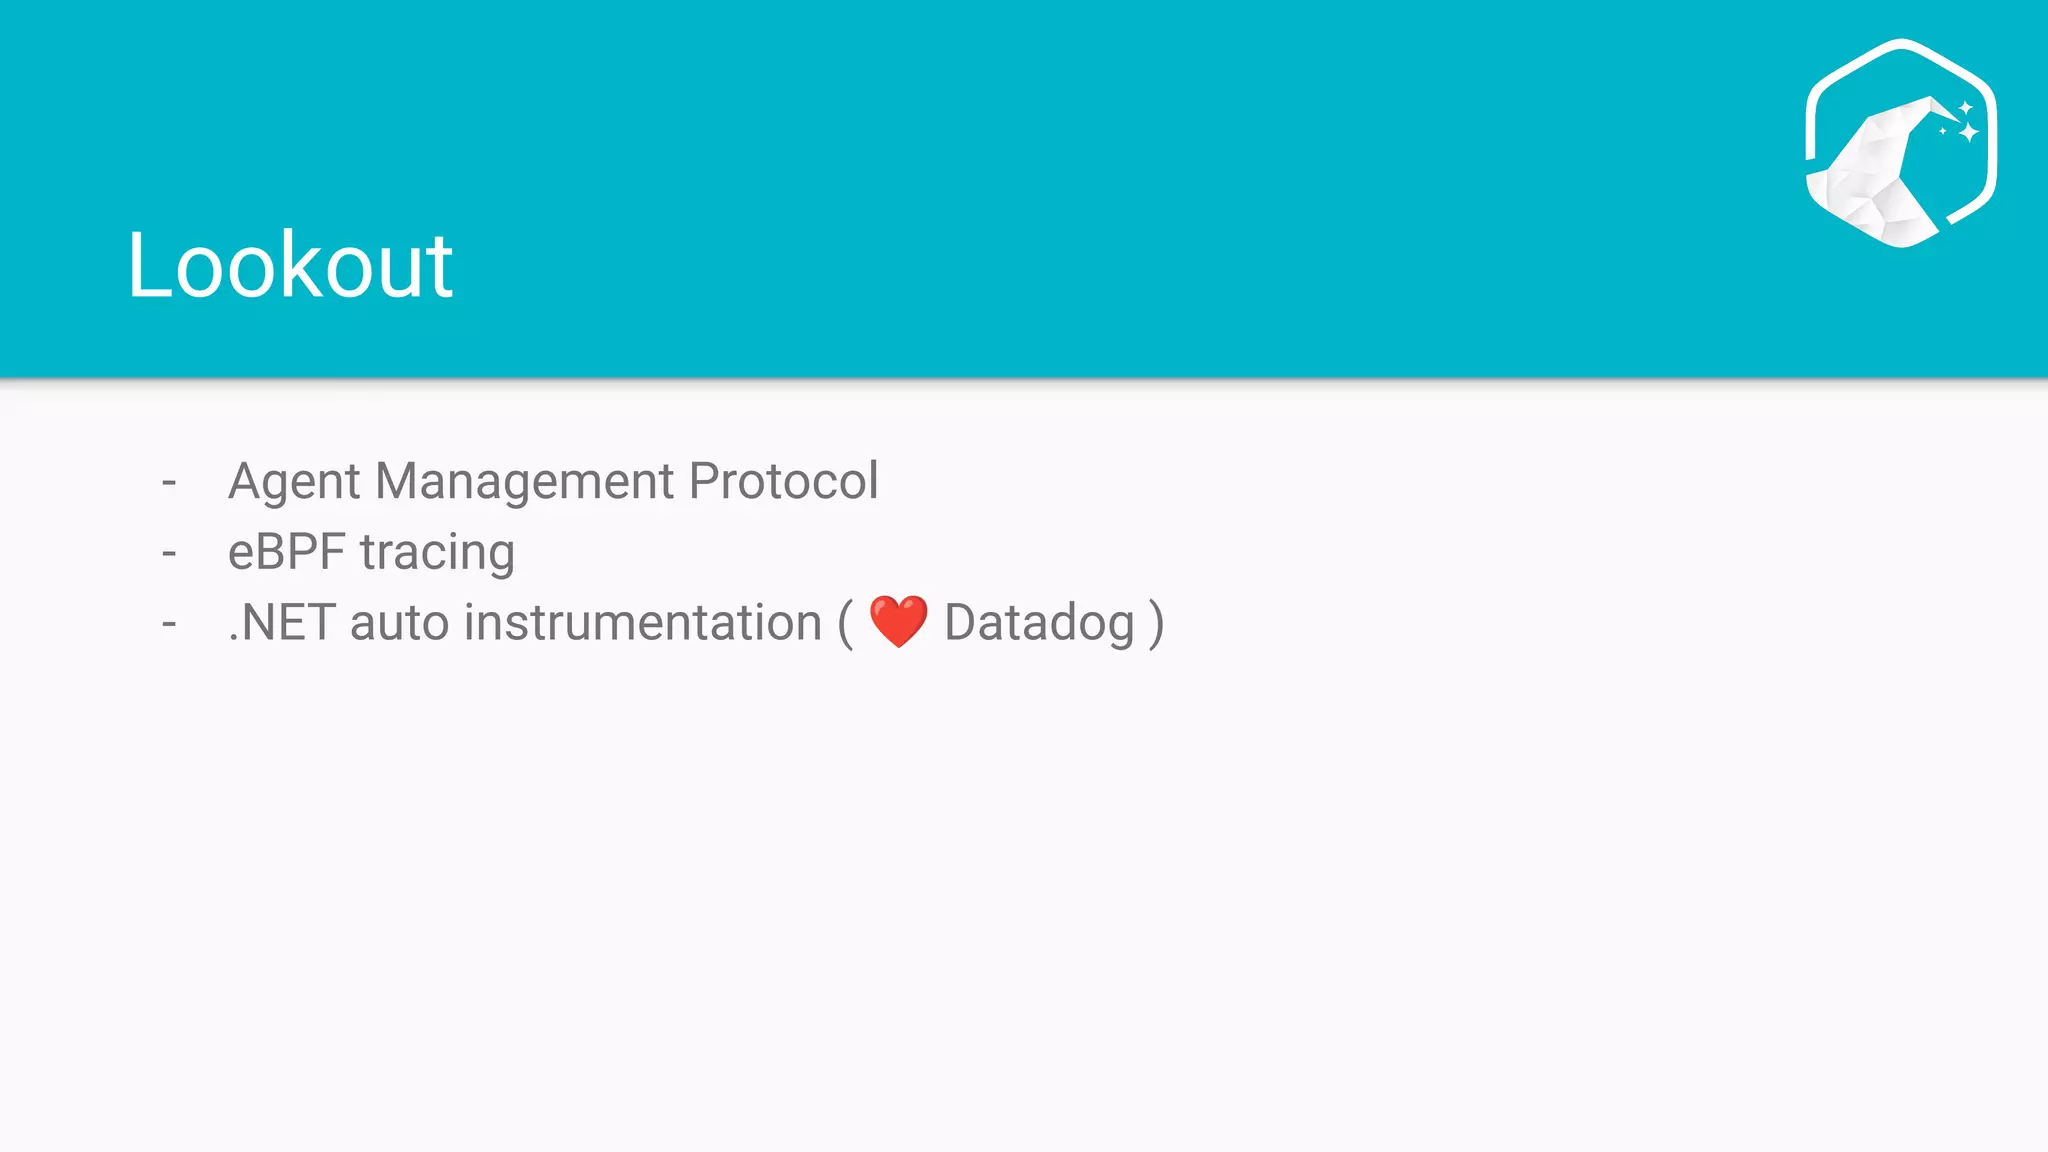
Compares Gateway vs Agent deployment methods and outlines future developments in OpenTelemetry.
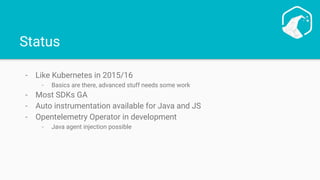
Reflects on OpenTelemetry's status, likening it to Kubernetes' early days, and mentions auto instrumentation advancements.
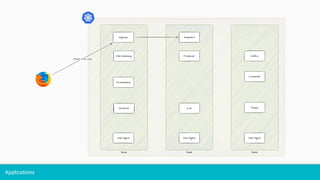
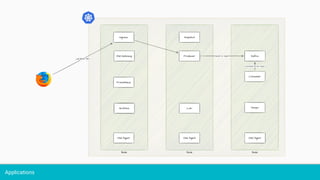
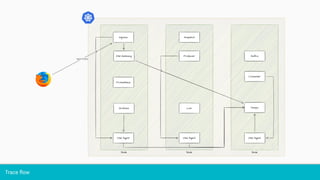
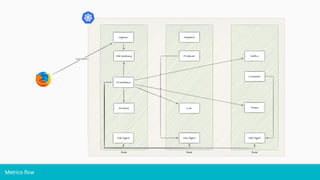
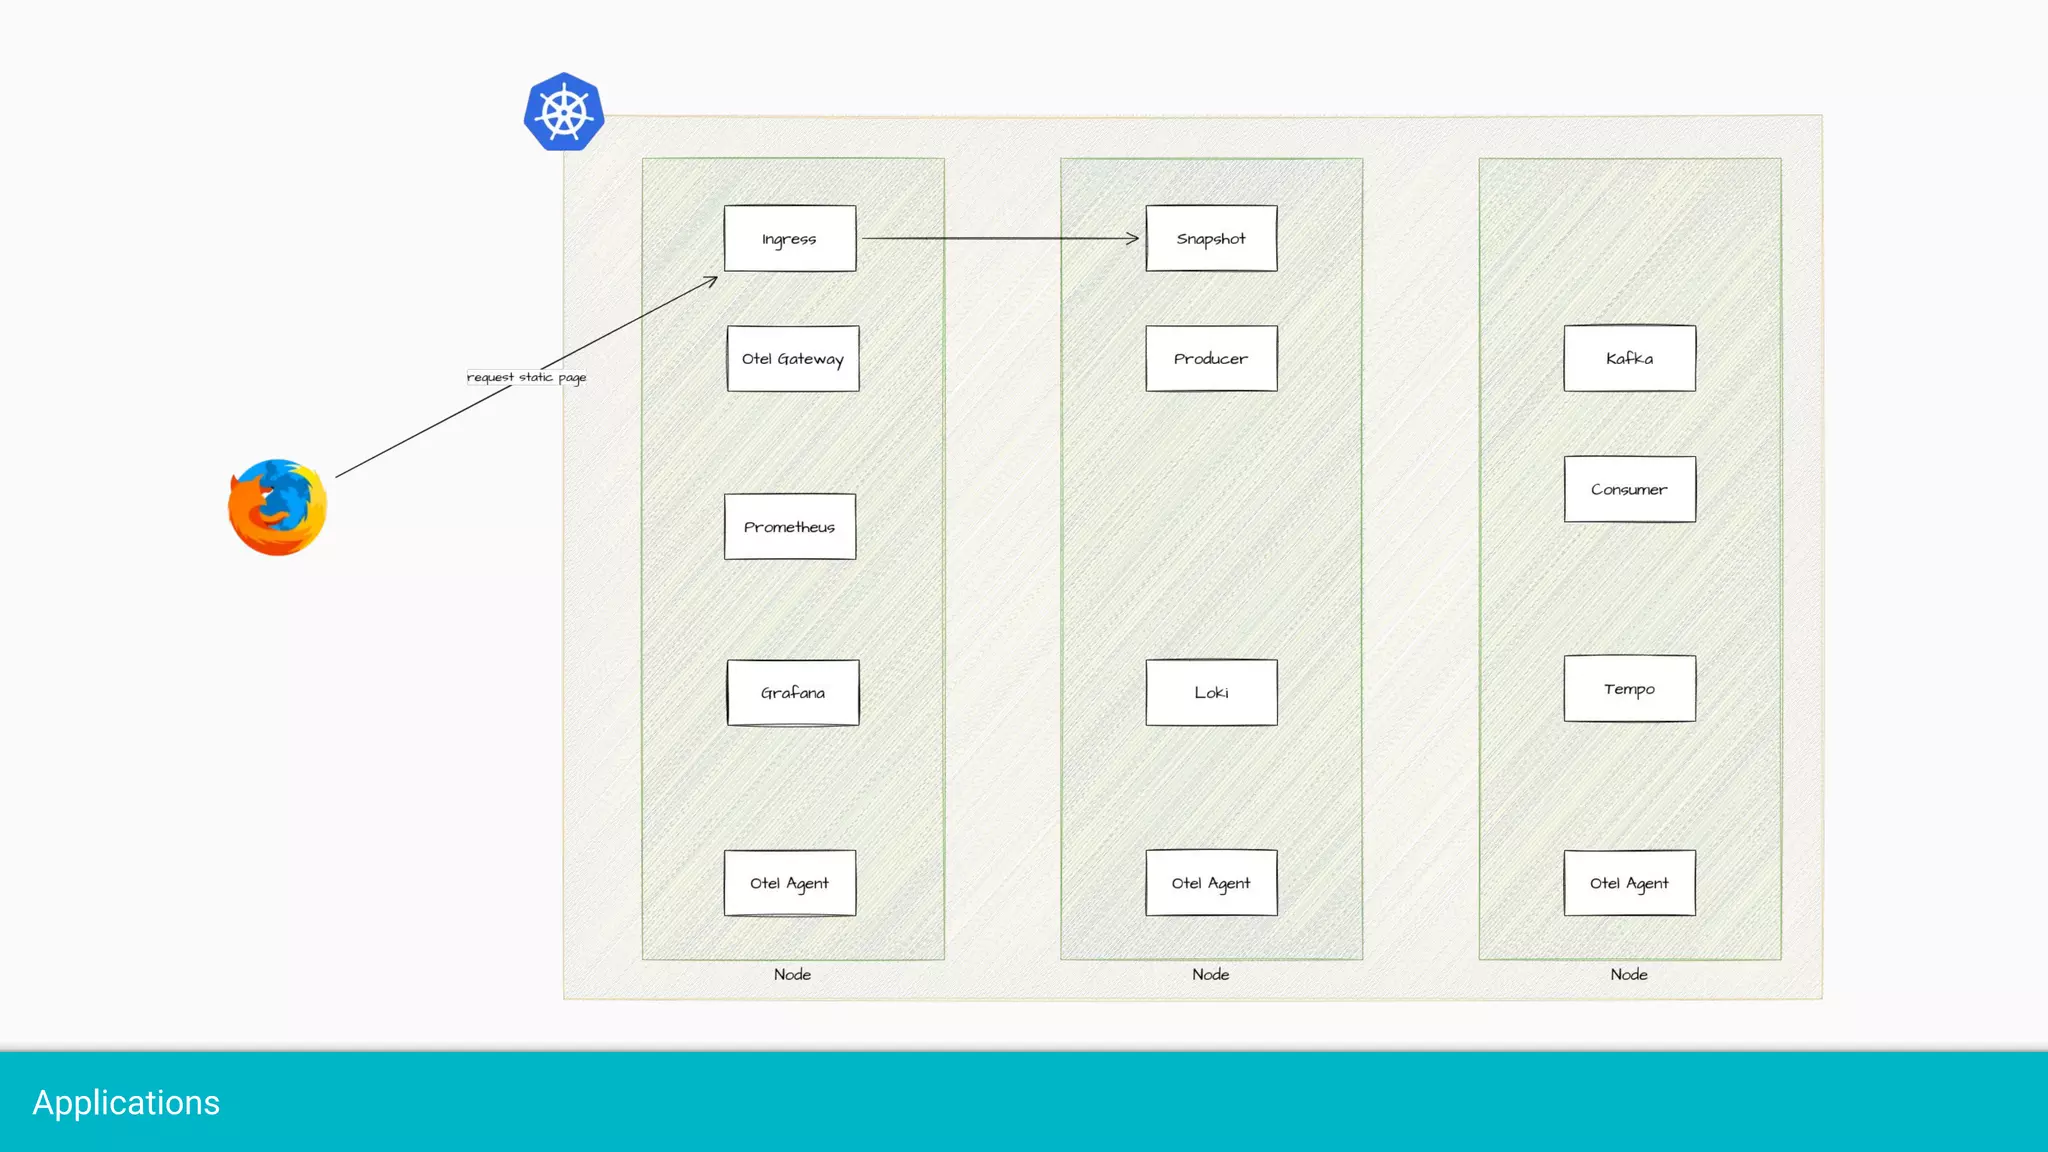
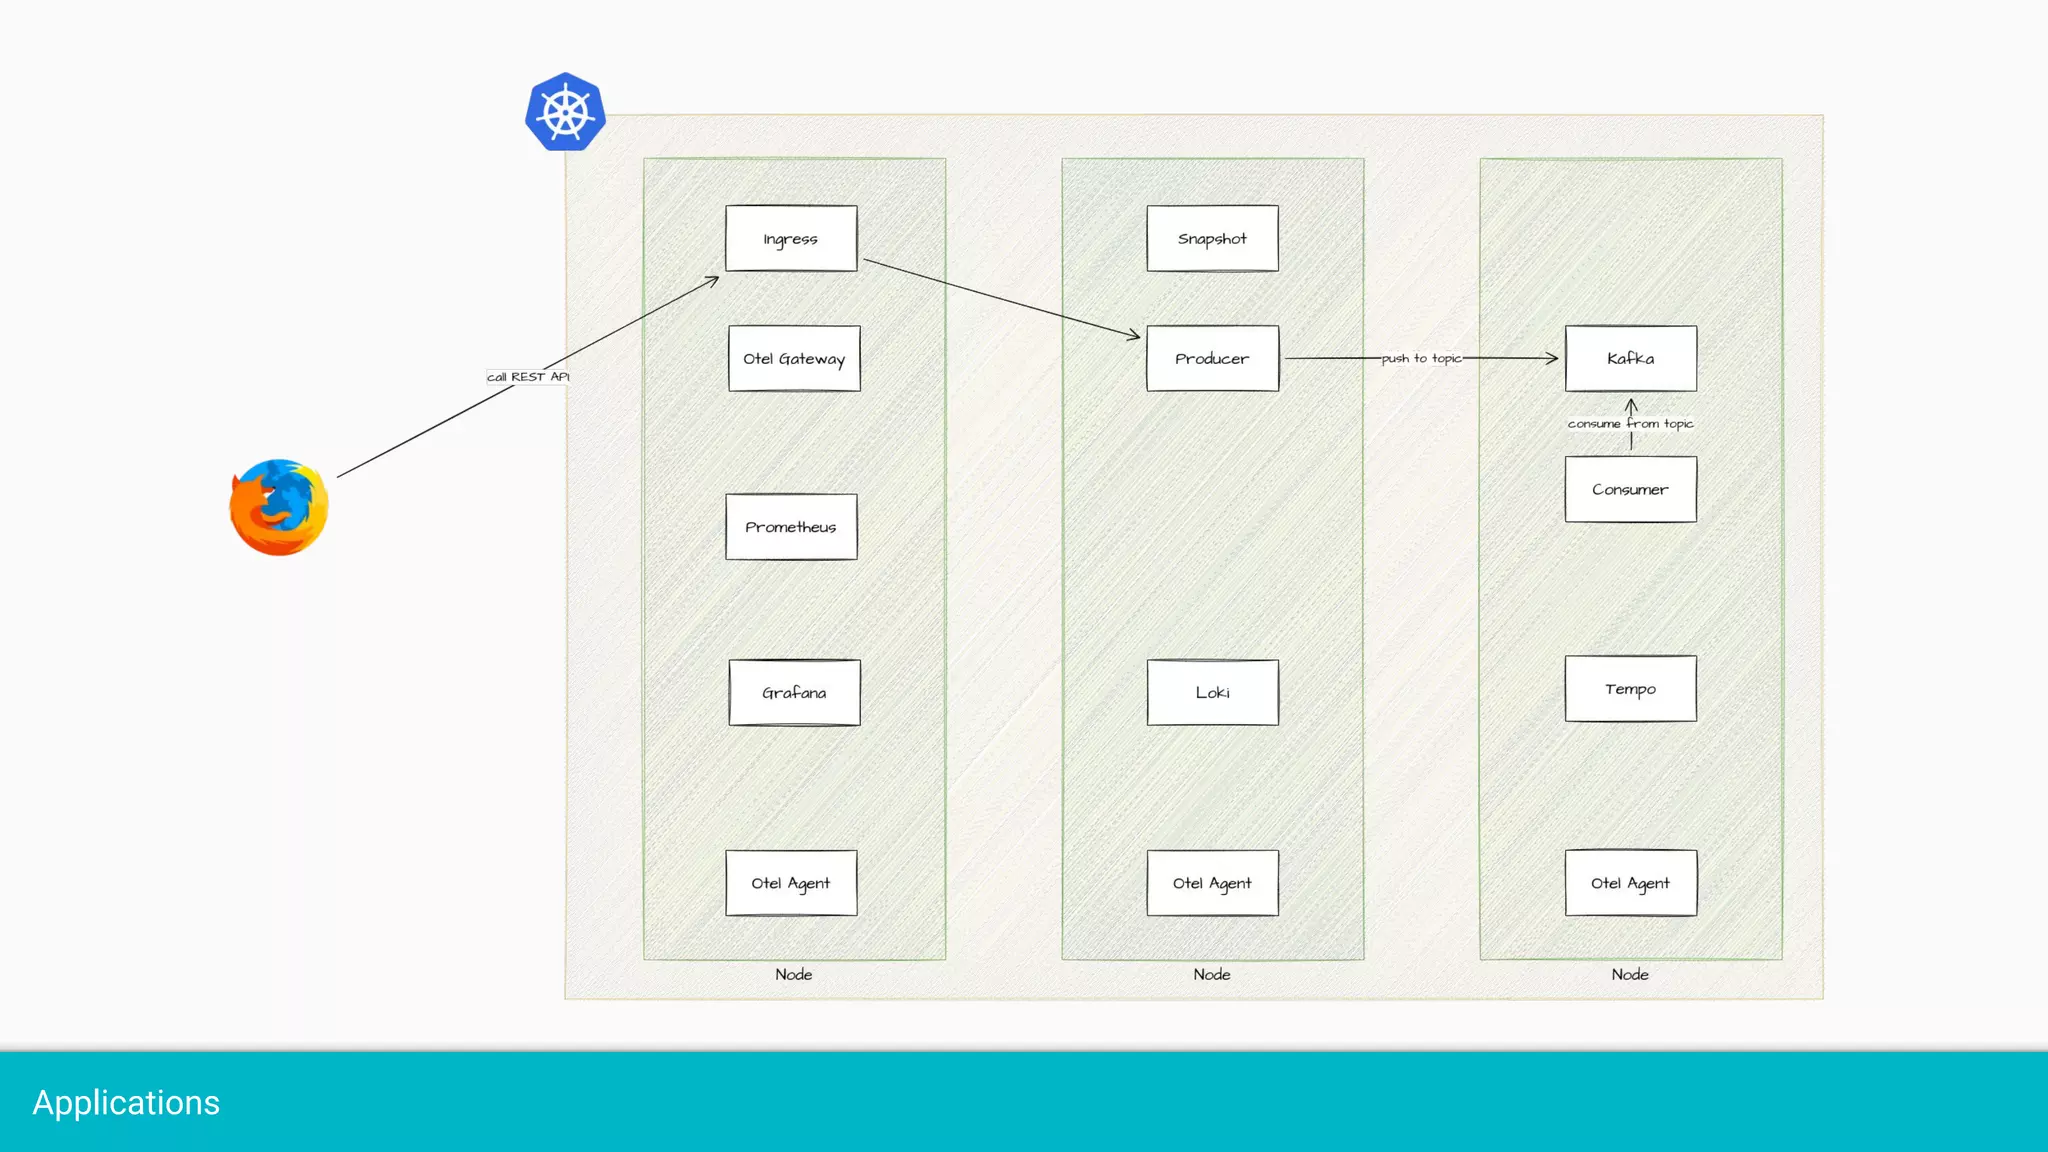
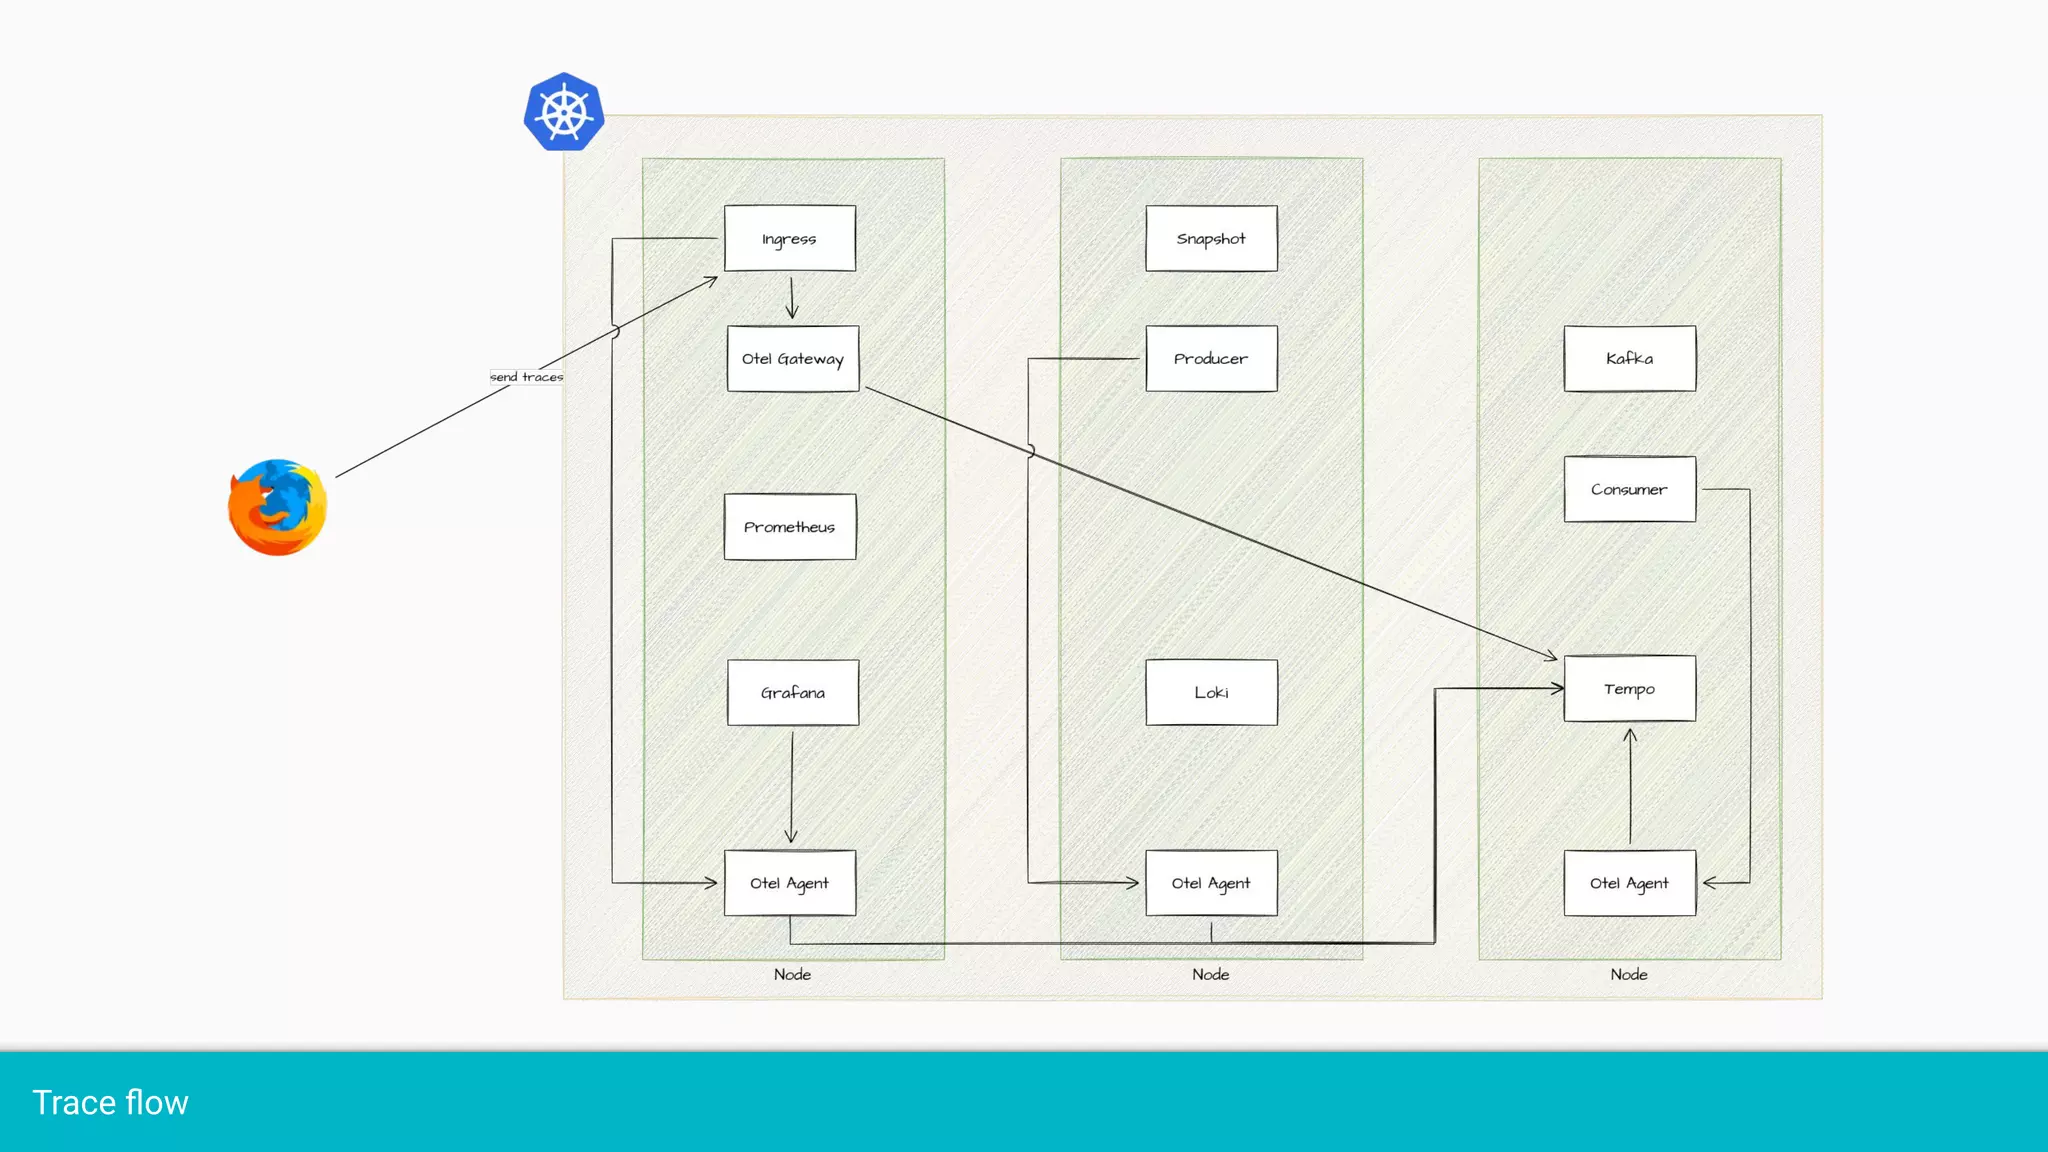
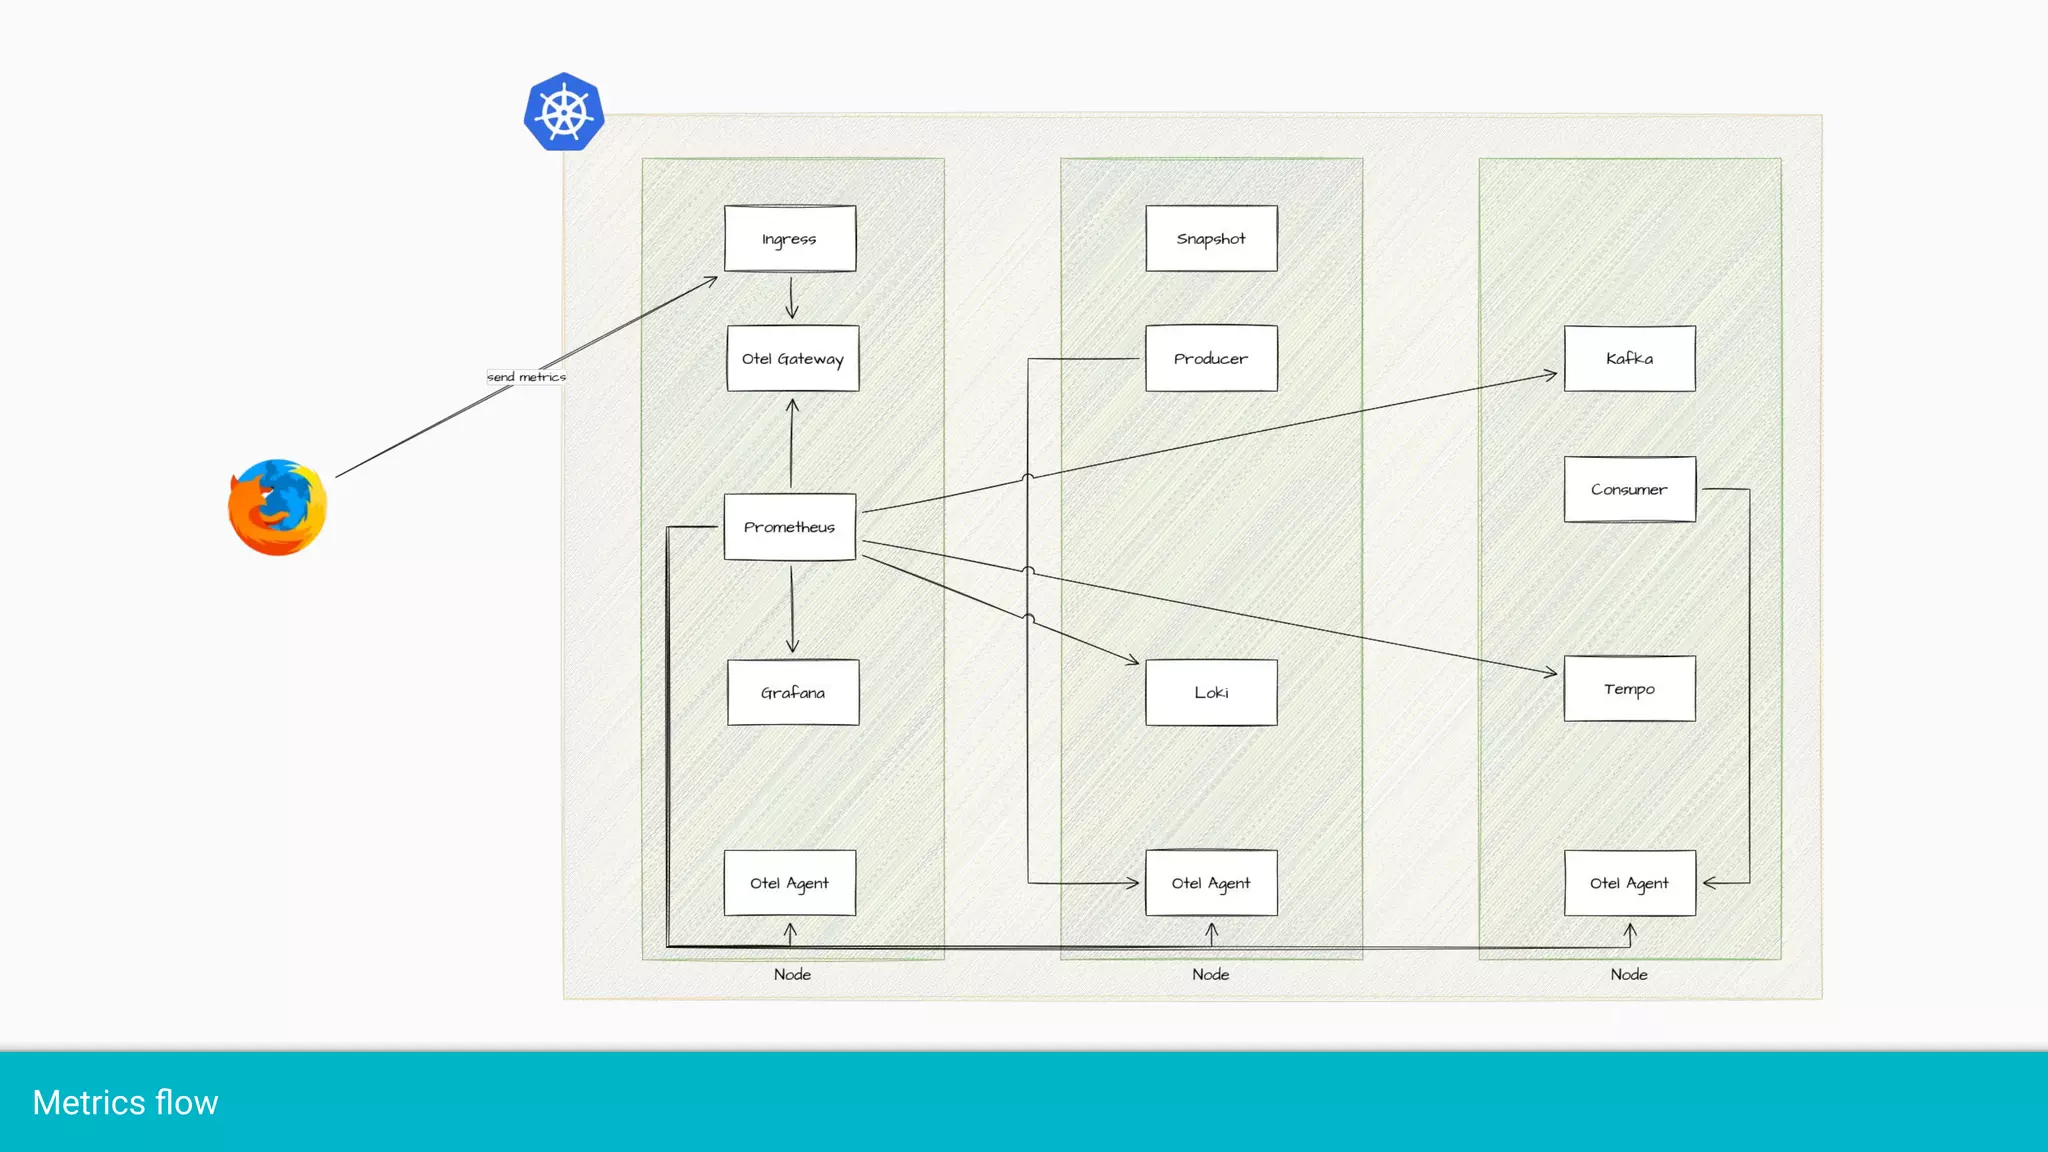
Showcases a demo with applications illustrating trace, metrics, and log flows in the OpenTelemetry context.
Promotes job openings at Whizus, encouraging interested candidates to apply.
Opens the floor to questions from participants, allowing for audience interaction.


