Downloaded 104 times


![28
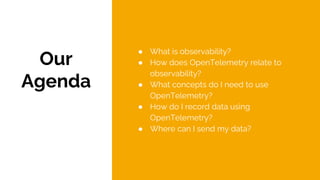
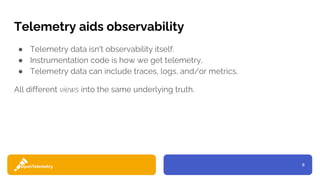
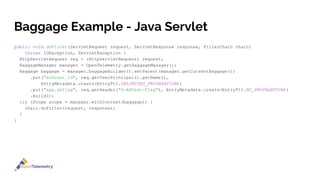
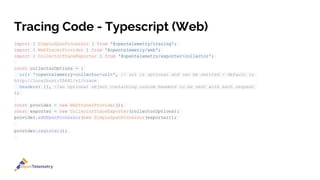
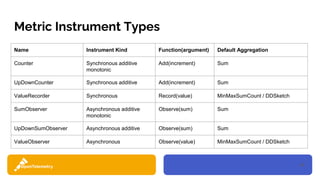
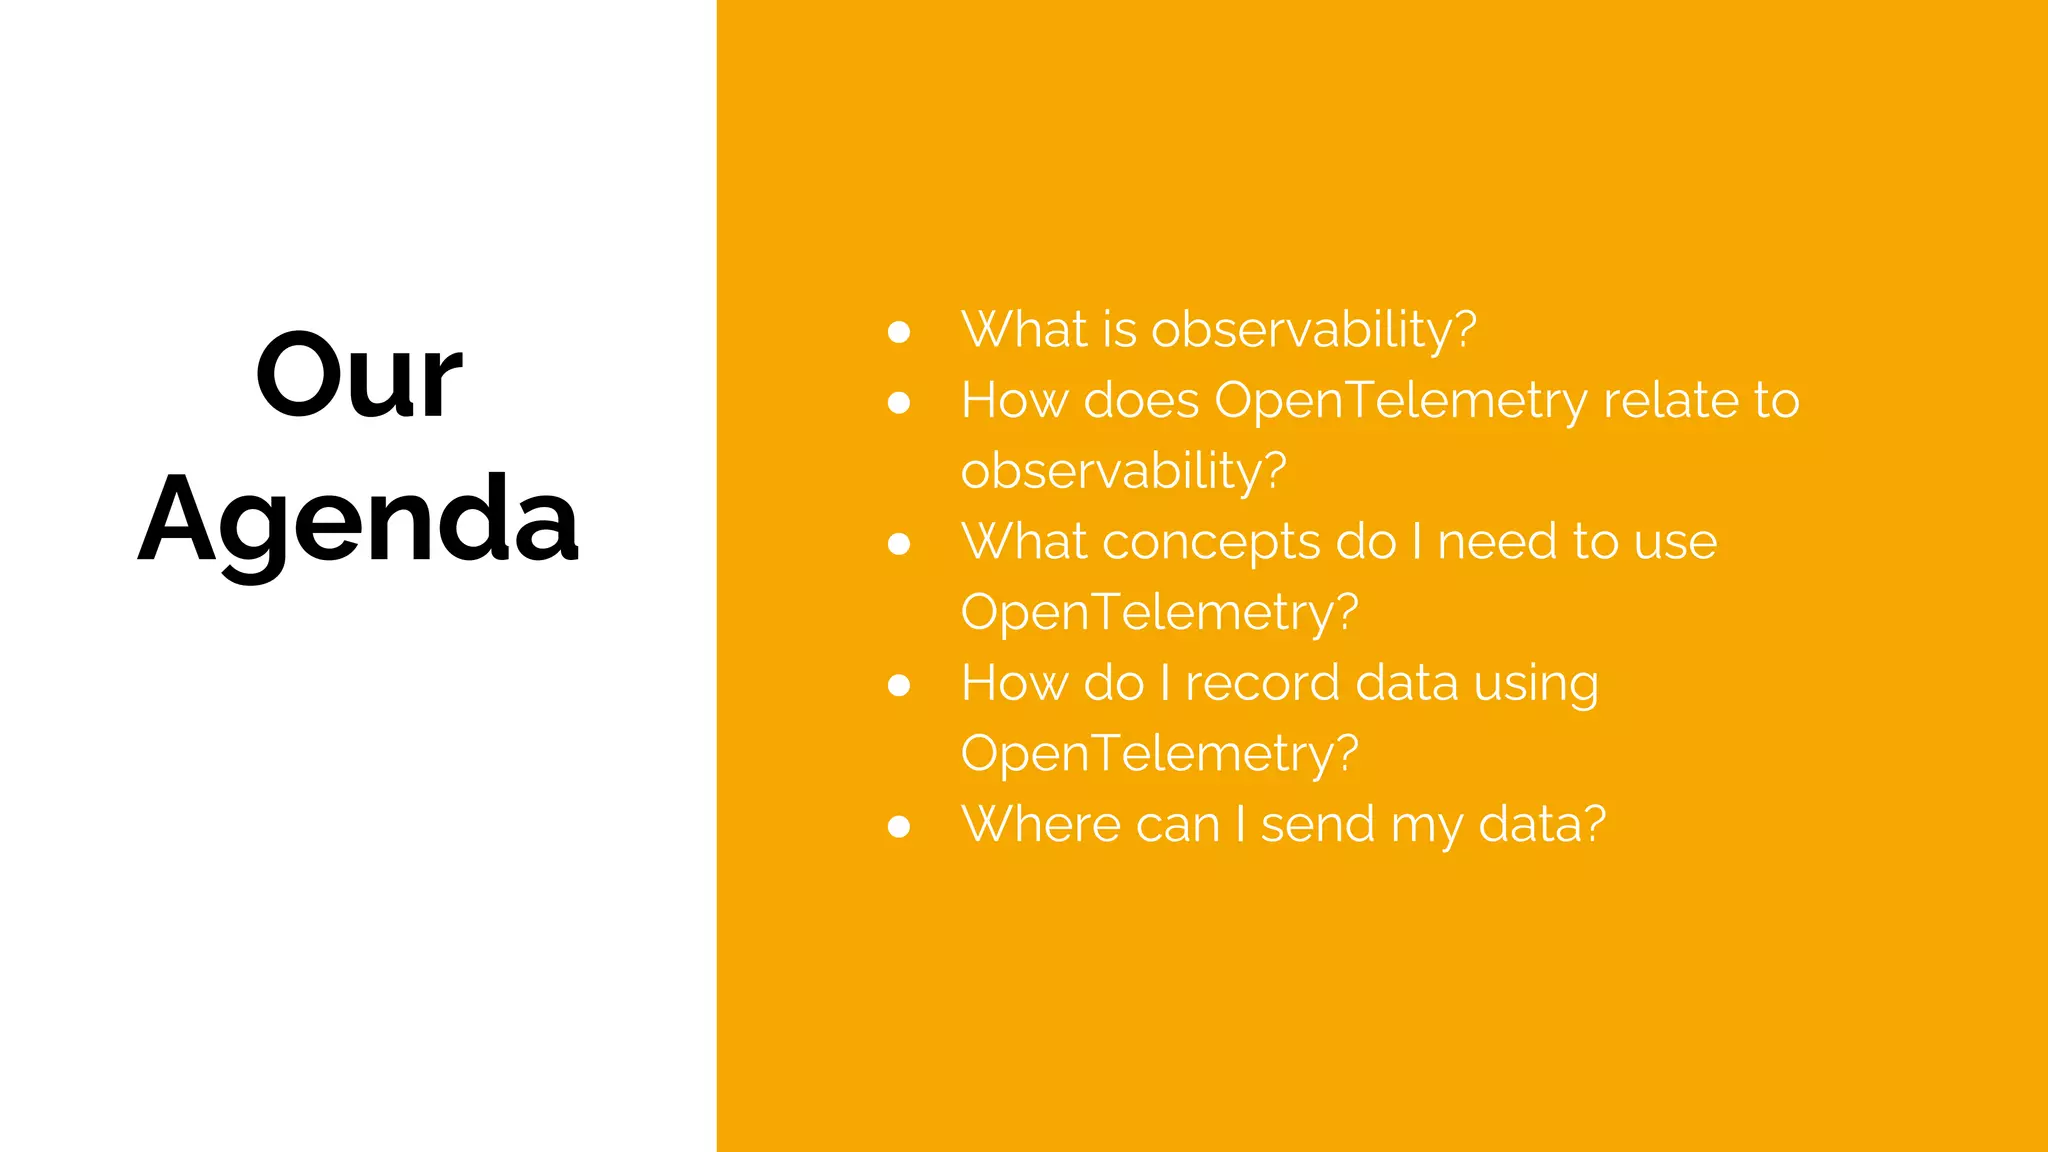
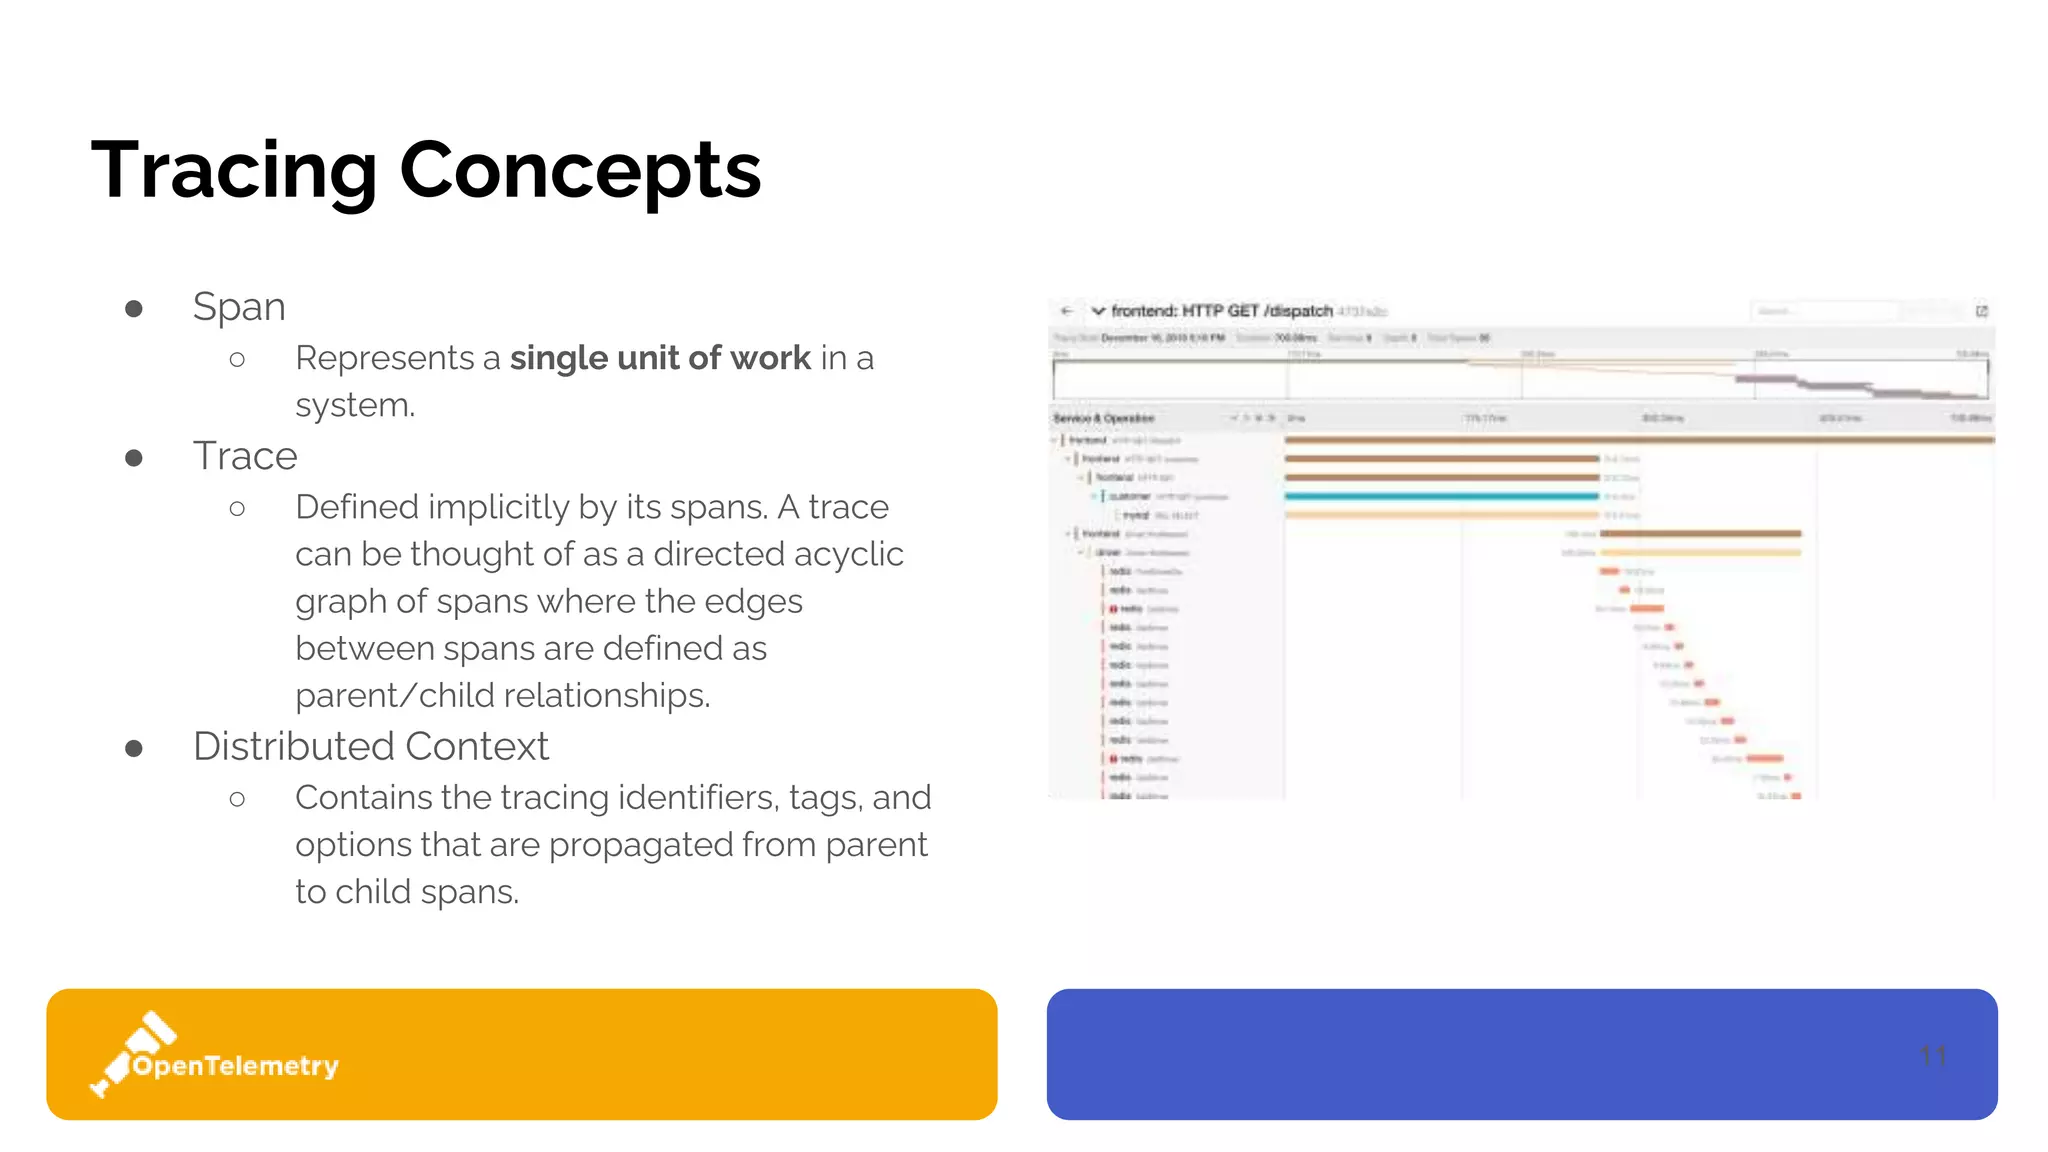
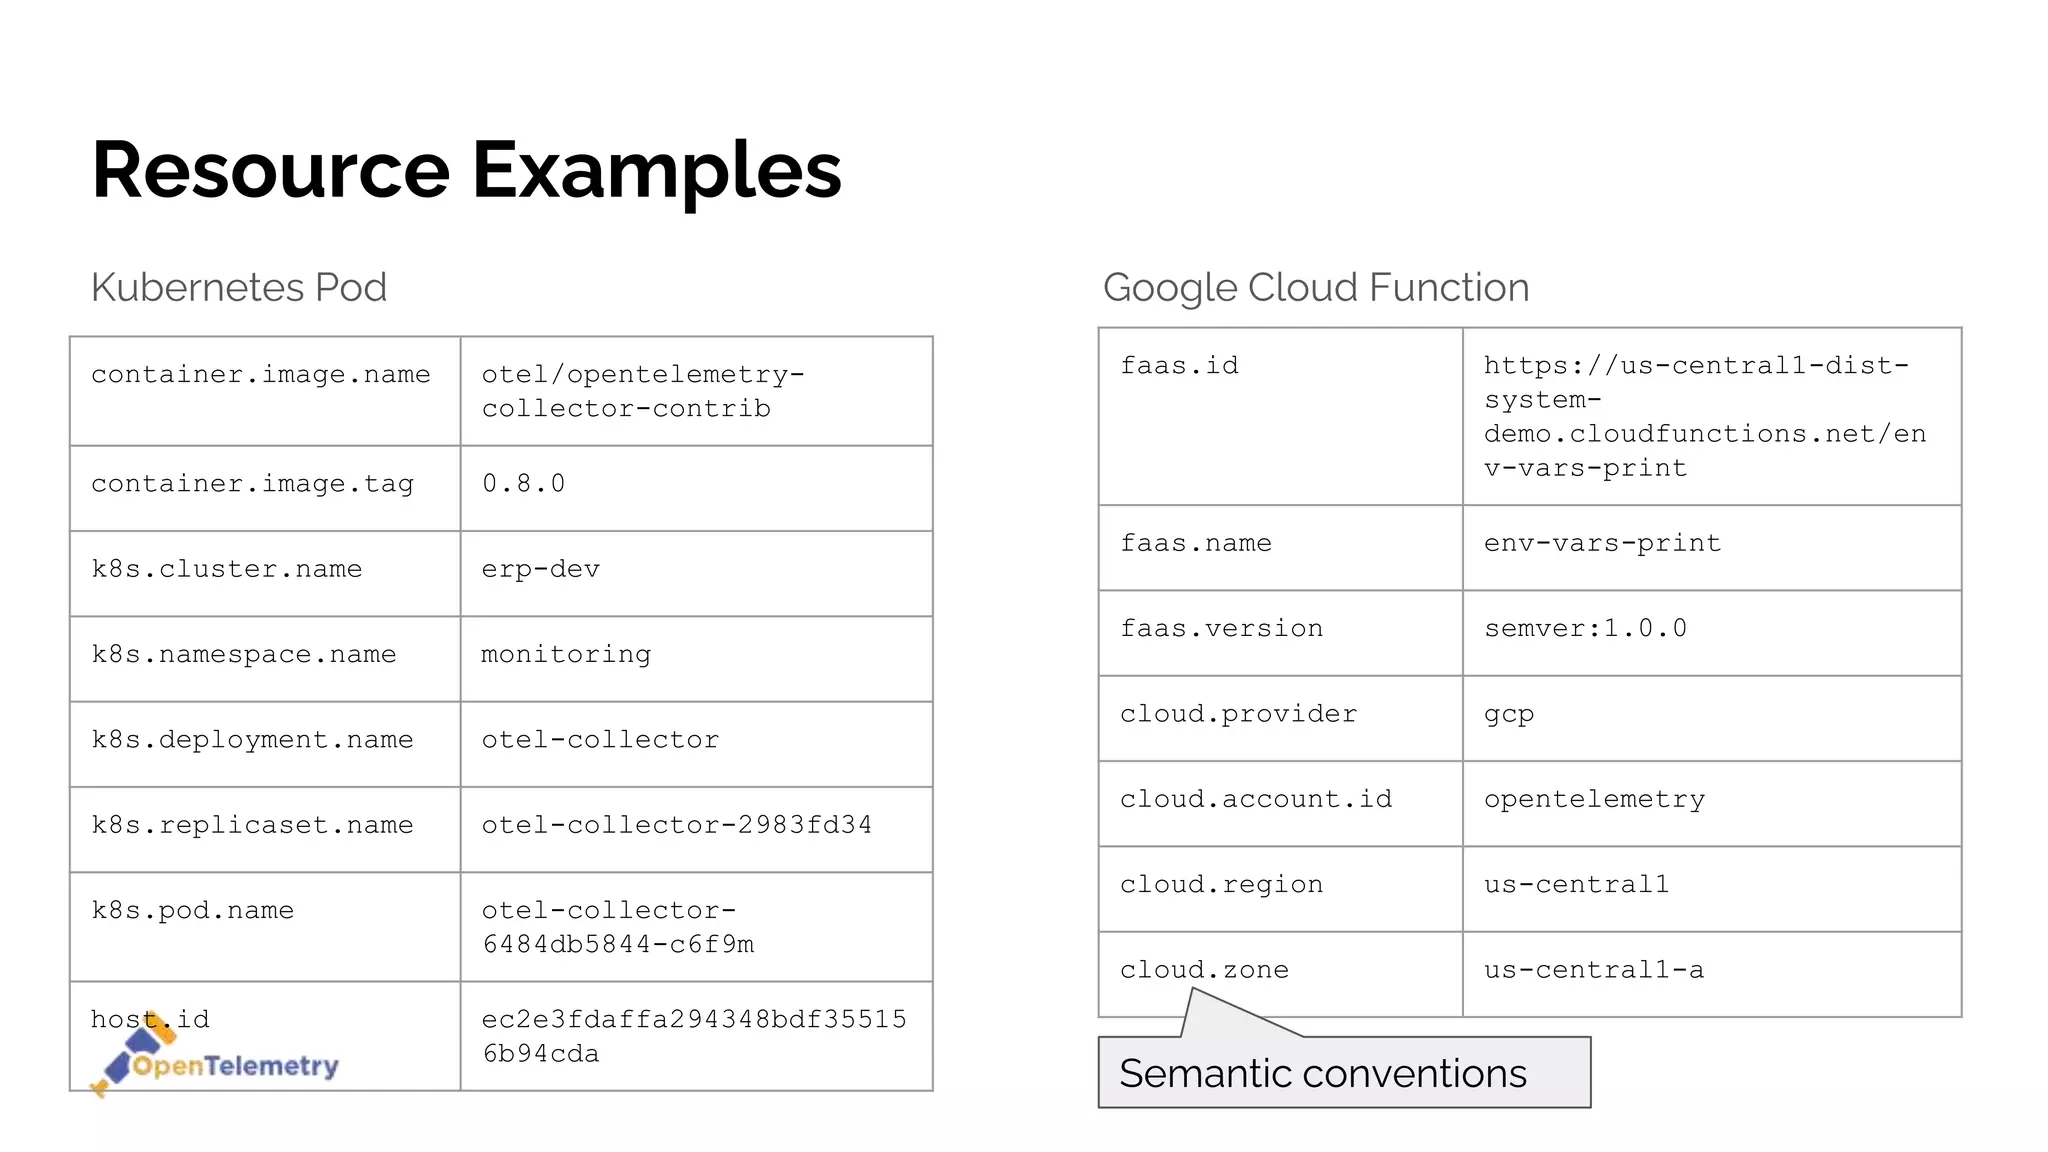
Span Fields
● Name - Concisely identifies the work
● SpanContext - Immutable unique id
○ TraceId (16-bytes) globally-unique
○ SpanId (8-bytes) unique-within-trace
○ TraceFlags - Currently only sampled
○ TraceState - Vendor-specific info
● ParentSpan - Span which spawned this
span
● SpanKind - Relationship to other spans
○ [ CLIENT | SERVER | PRODUCER |
CONSUMER | INTERNAL ]
● StartTimestamp - Unix nanos
● EndTimestamp - Unix nanos
● Attributes collection
○ Key-value pairs describing the
operational context
○ OTel semantic conventions define
common keys
● Links collection
○ Associated non-parent spans
● Events collection
○ Significant data points during span
● Status - Success or failure details](https://image.slidesharecdn.com/otelfordevelopers-1-201109165601/85/OpenTelemetry-For-Developers-28-320.jpg)

![31
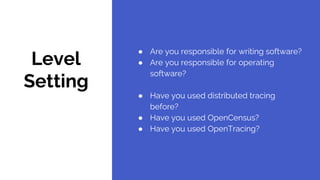
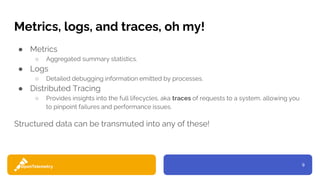
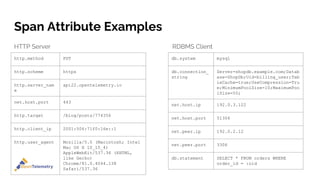
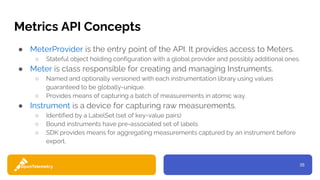
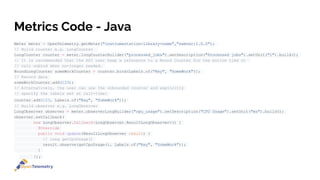
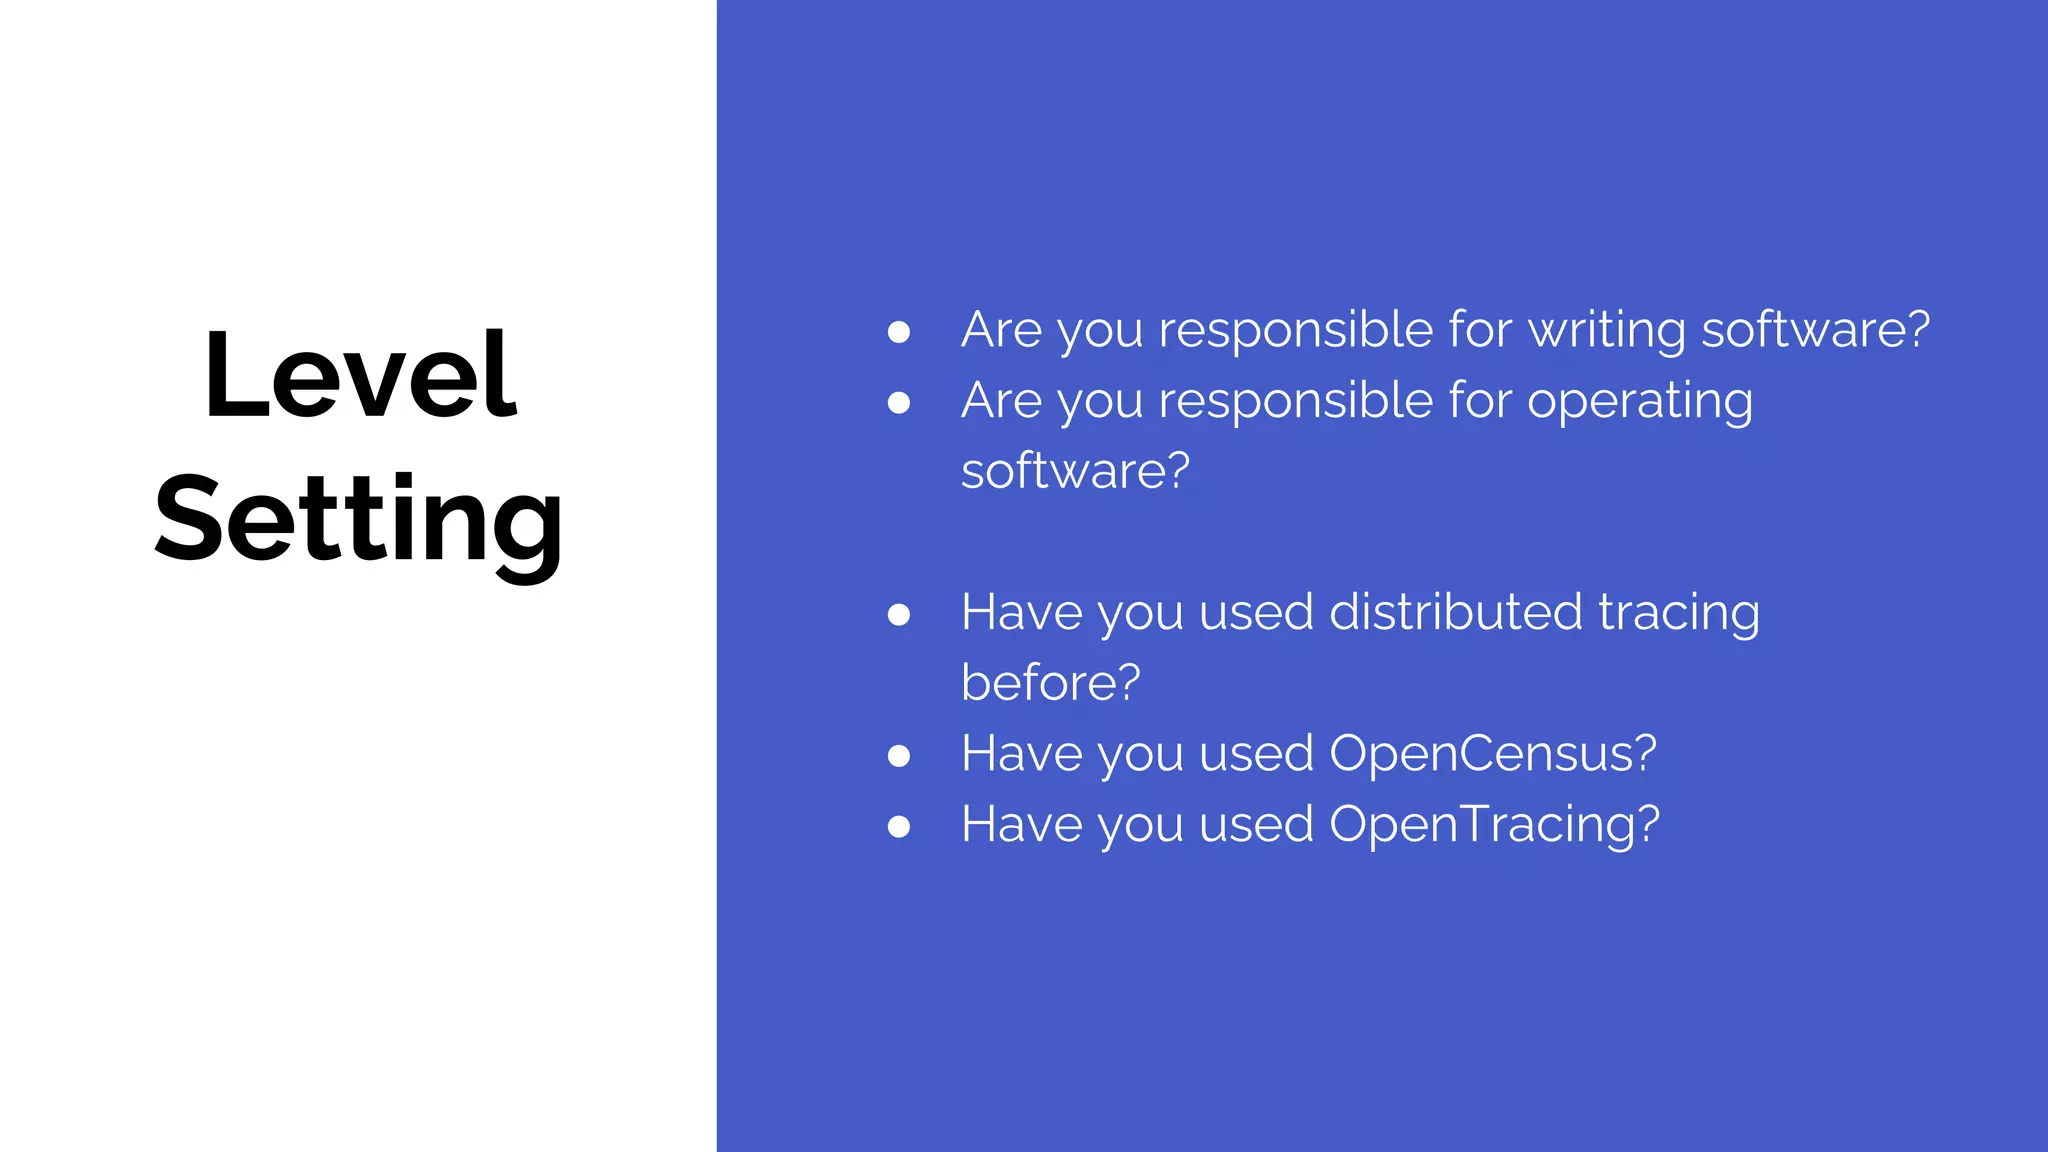
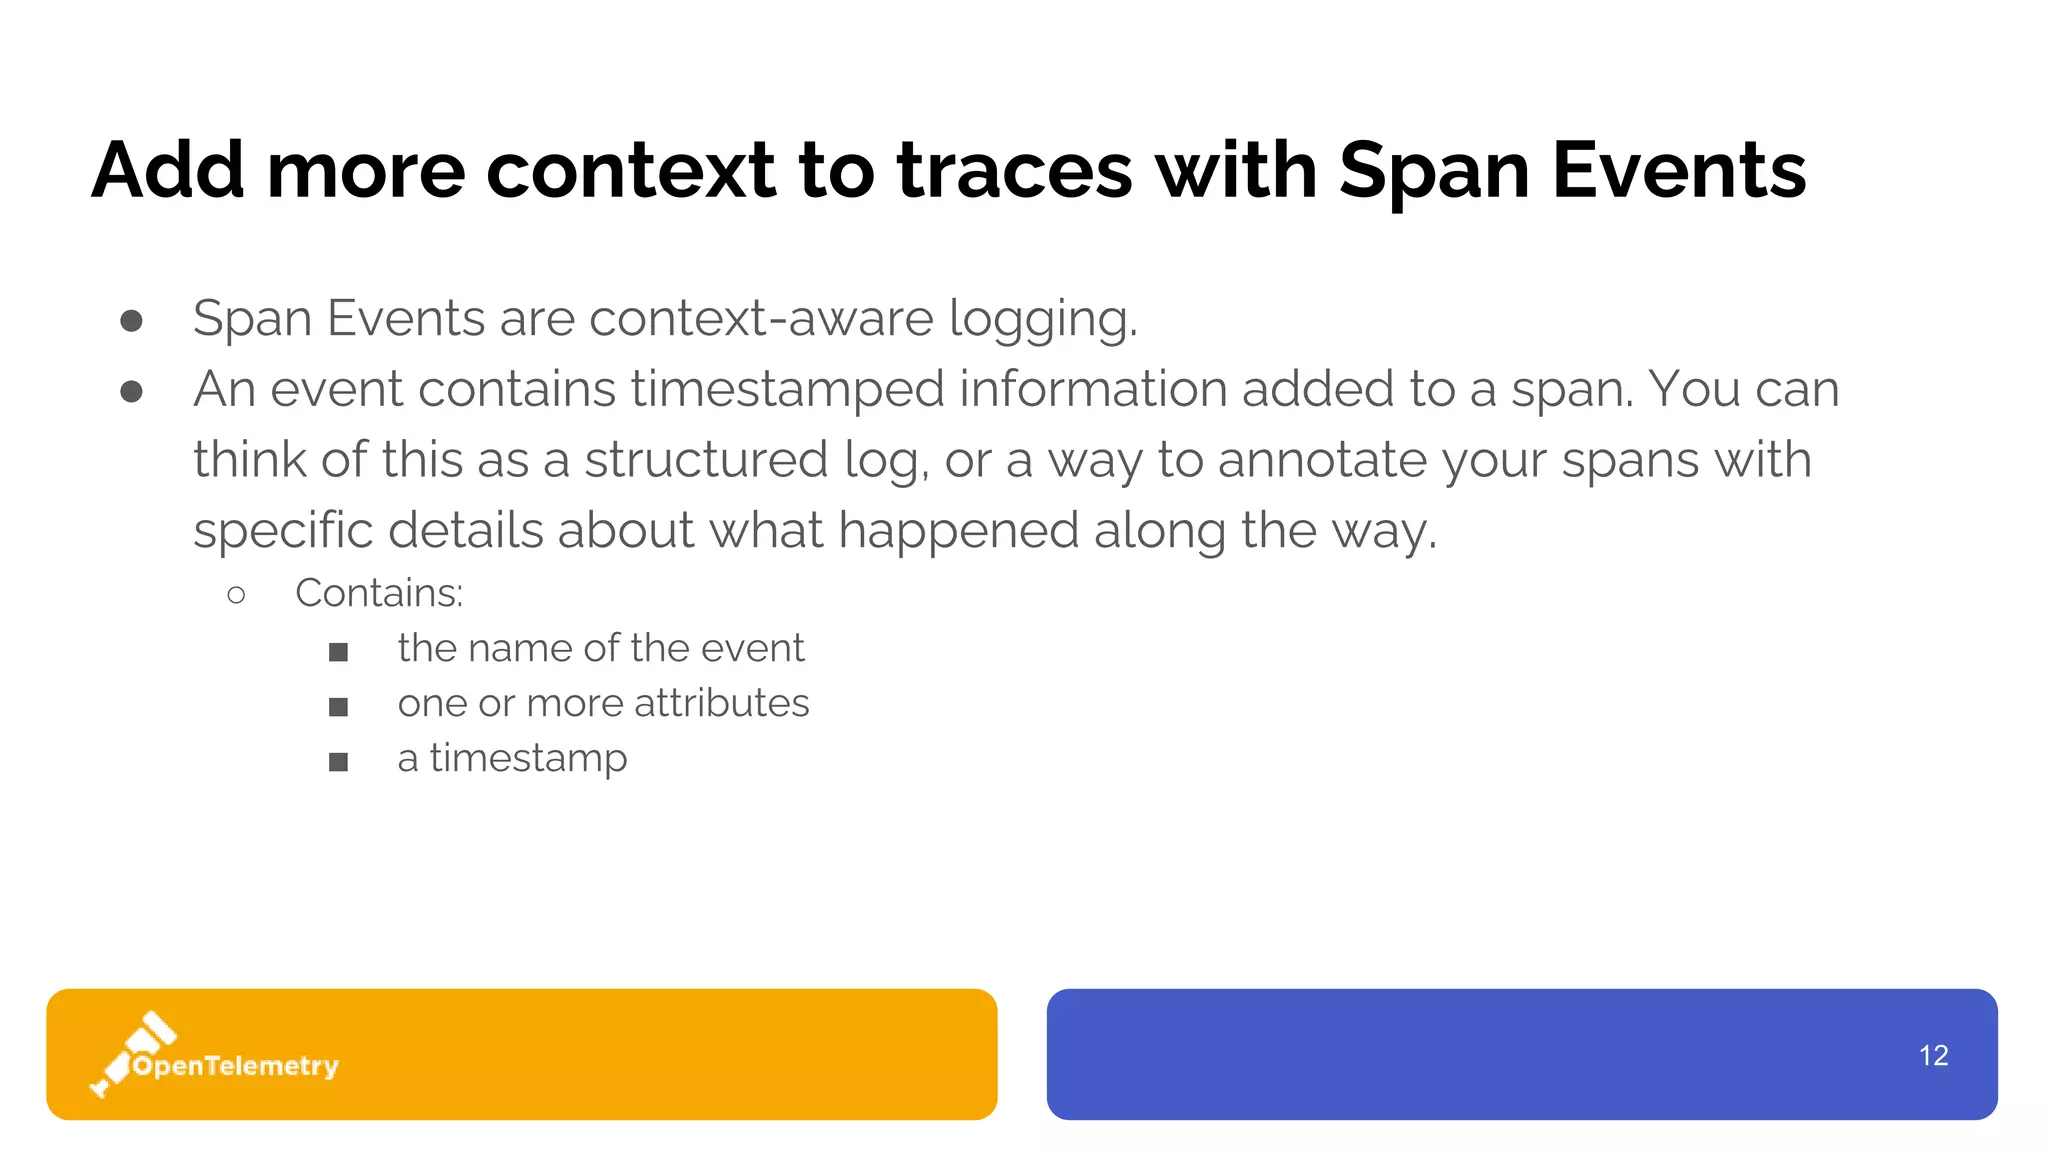
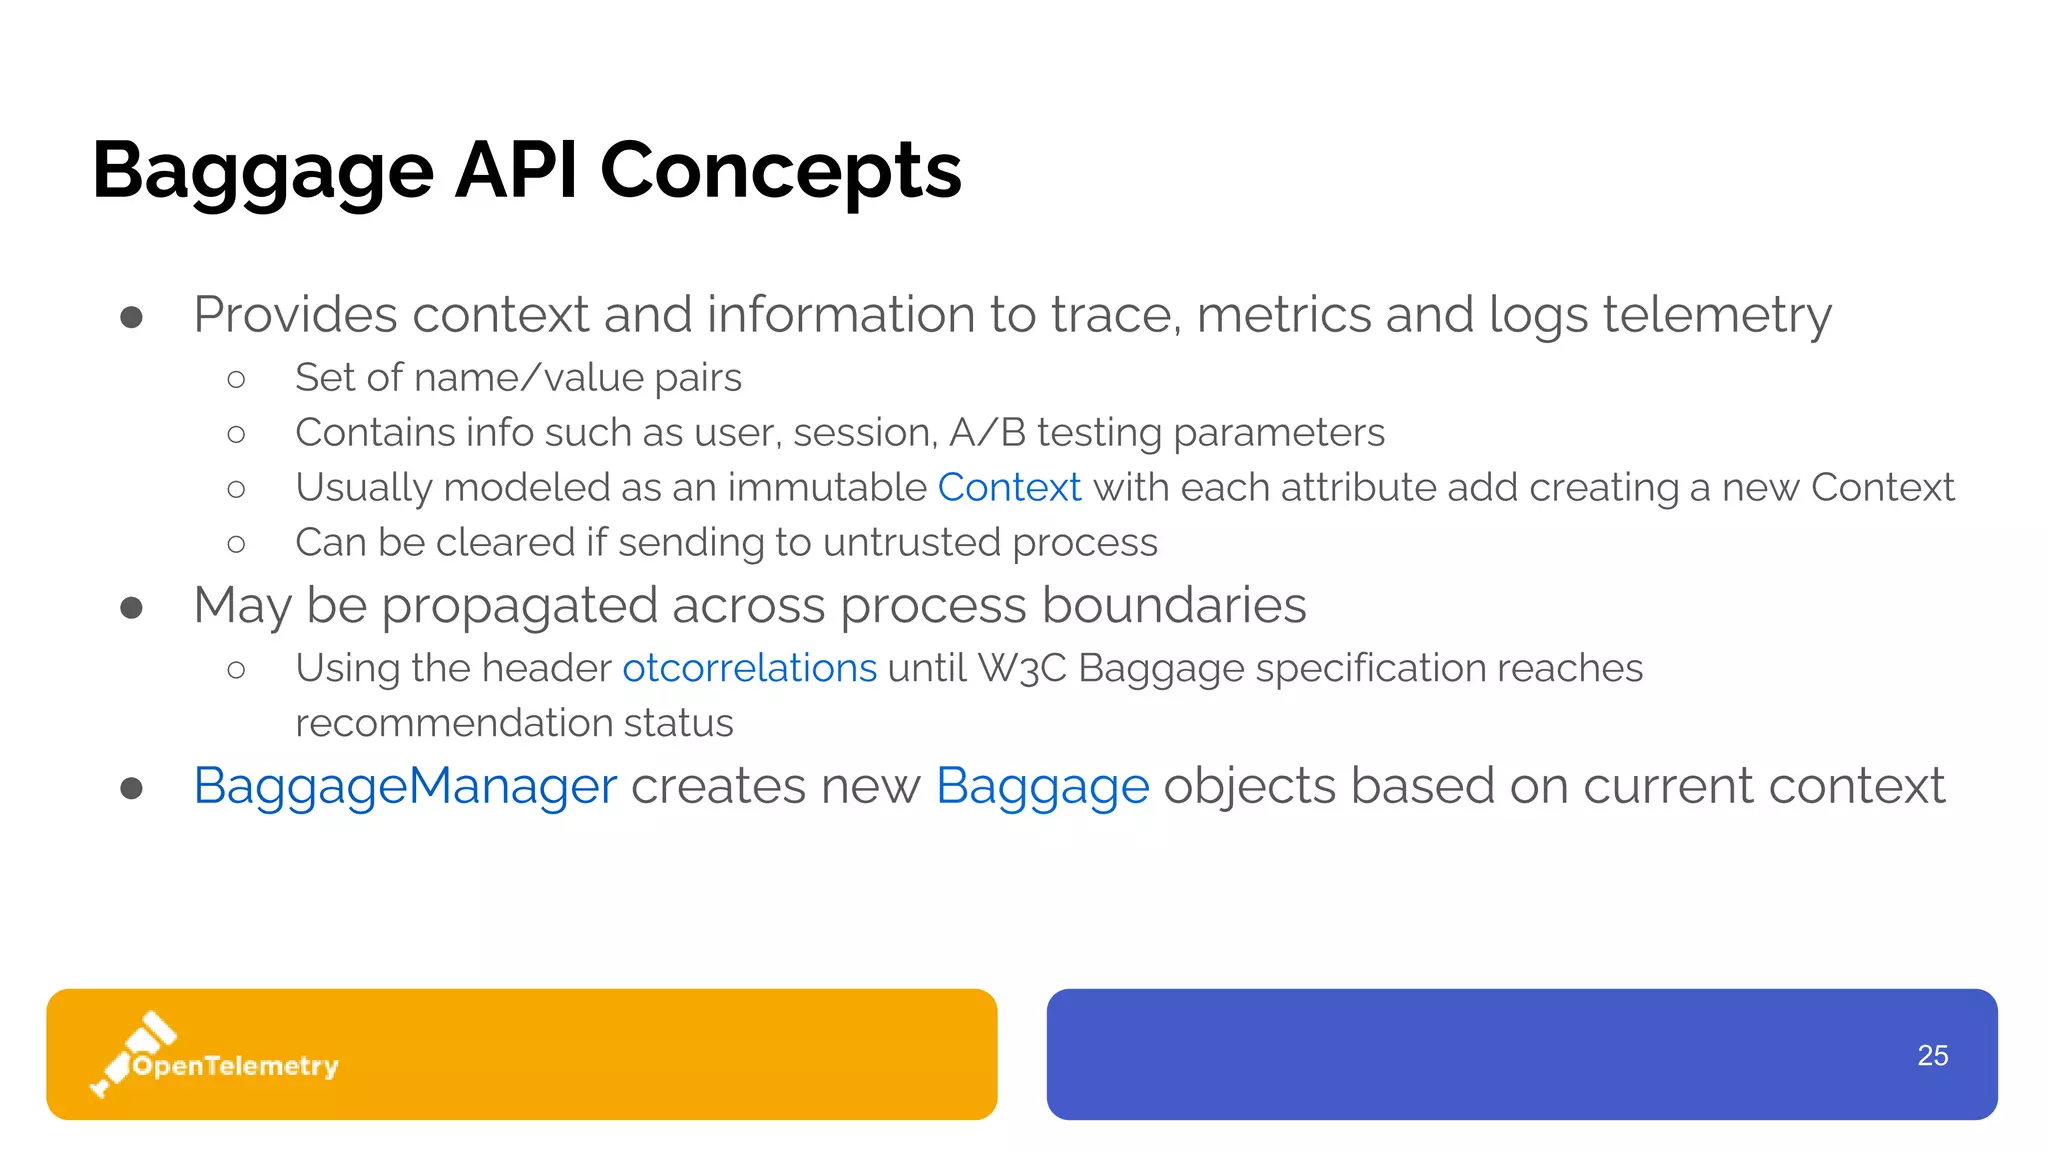
Tracing SDK Concepts
● Sampler controls the number of traces collected and sent to the backend.
○ Sampling decision values [ DROP | RECORD_ONLY | RECORD_AND_SAMPLE ]
○ SDK built-in samplers [ AlwaysOn | AlwaysOff | TraceIdRatioBased ]
○ Use AlwaysOn if doing tail-based sampling
● SpanProcessor enables hooks for span start and end method invocations.
○ SDK built-in processors [ ExportFormatConverter | Batching ]
○ Only invoked when IsRecording is true
● SpanExporter defines interface for protocol-specific exporters](https://image.slidesharecdn.com/otelfordevelopers-1-201109165601/85/OpenTelemetry-For-Developers-31-320.jpg)


![28
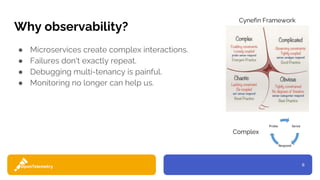
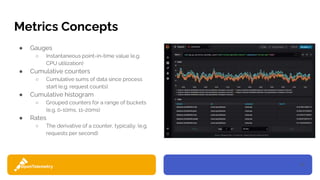
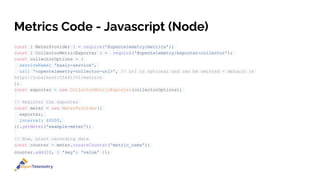
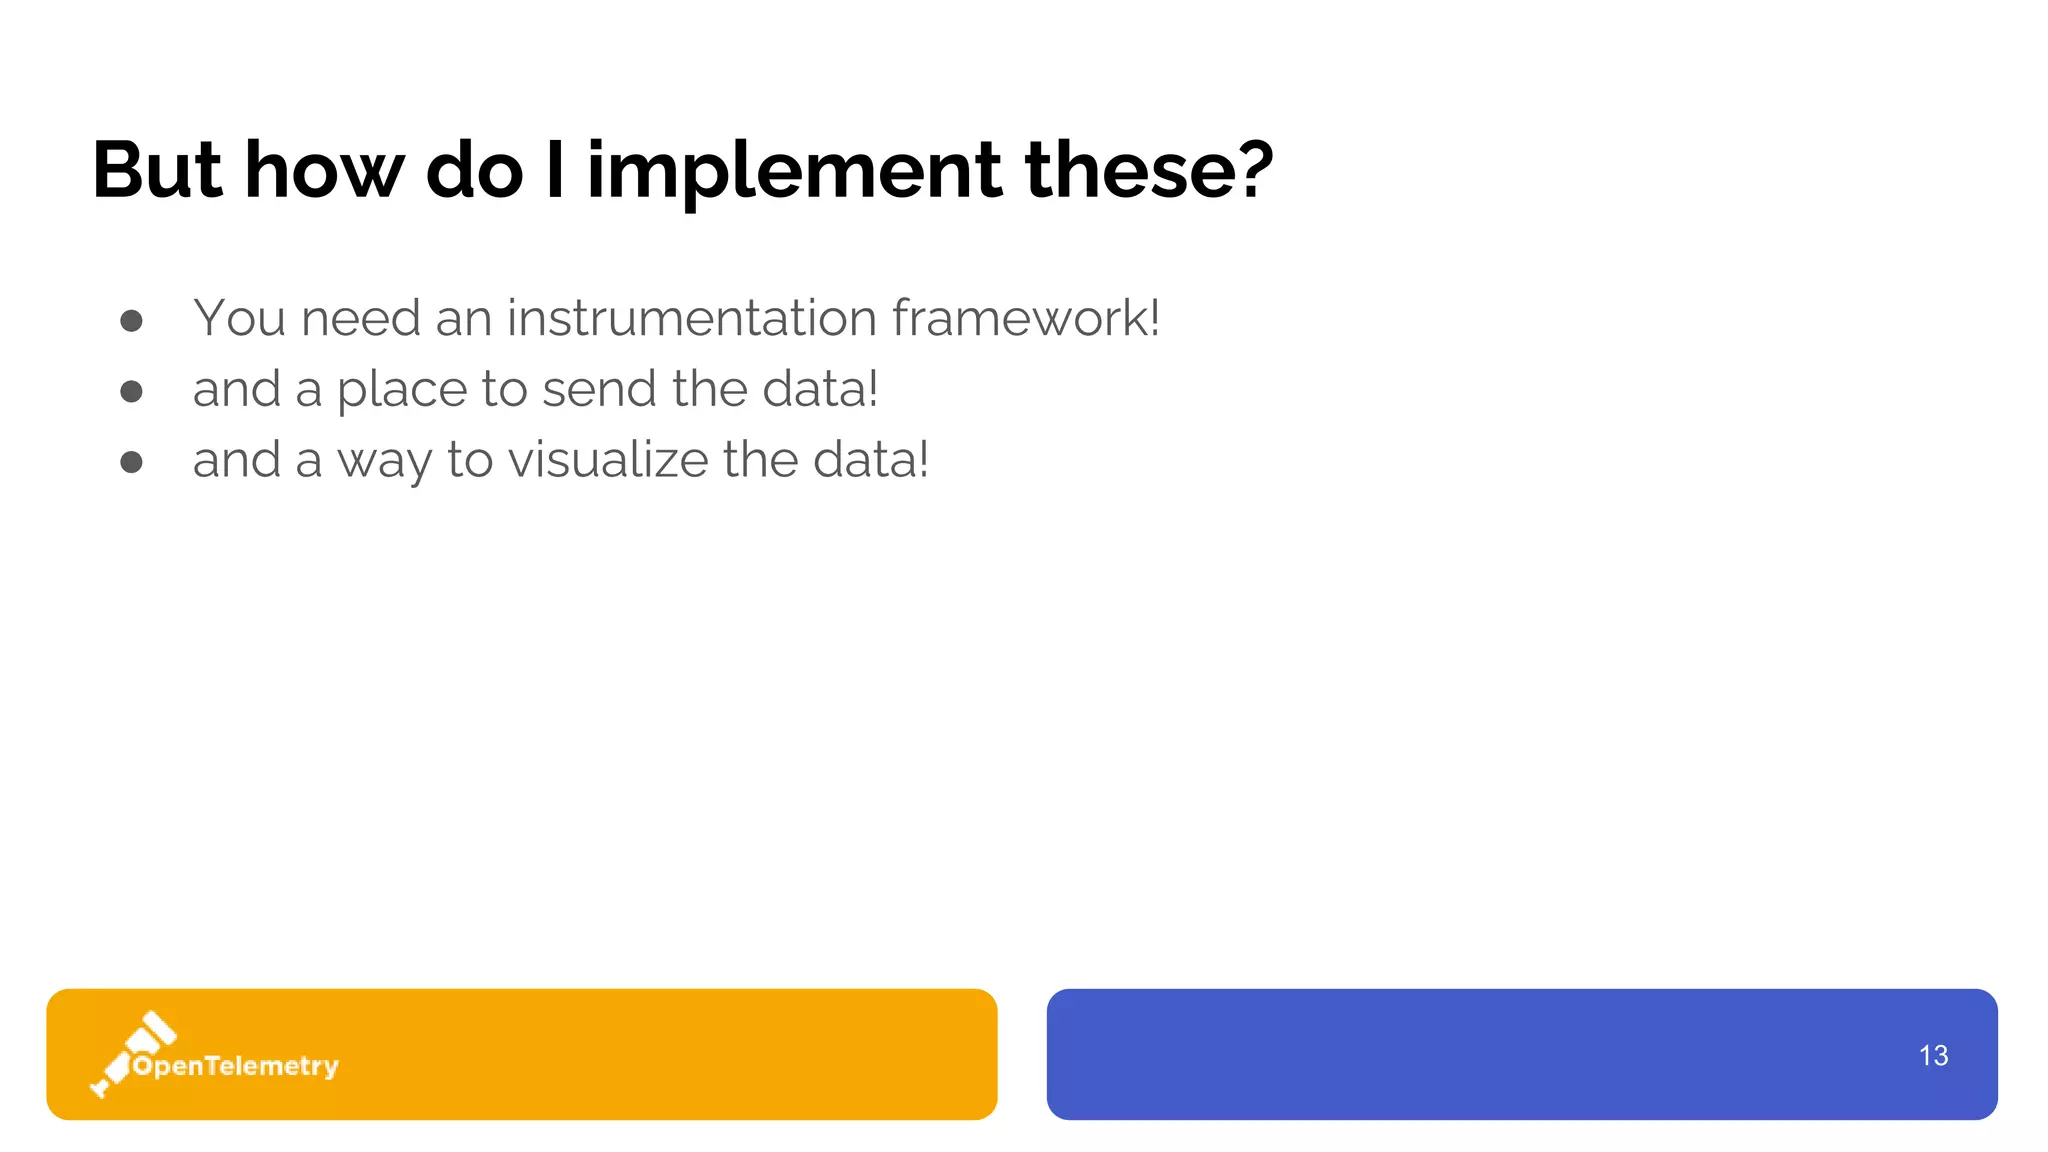
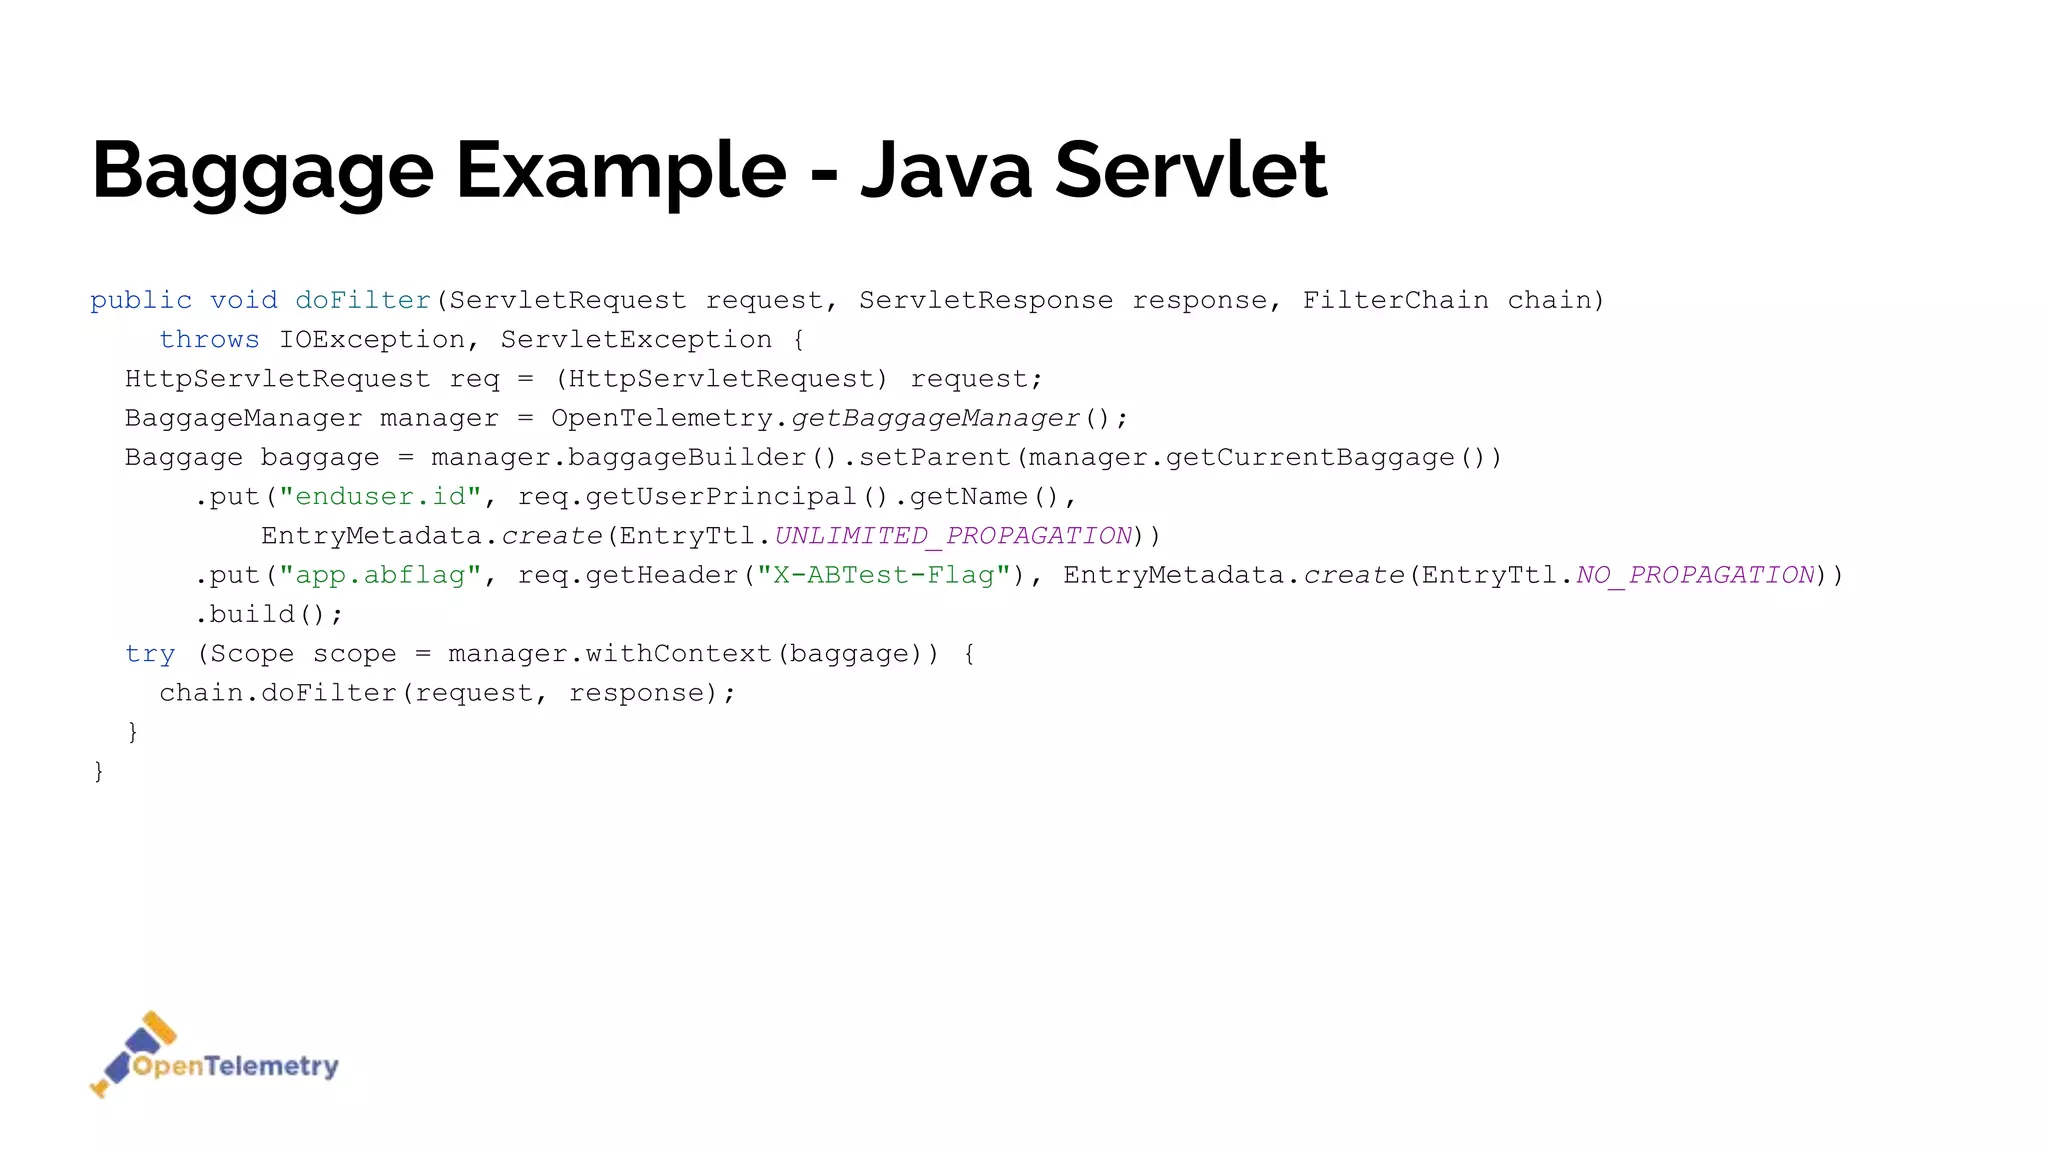
Span Fields
● Name - Concisely identifies the work
● SpanContext - Immutable unique id
○ TraceId (16-bytes) globally-unique
○ SpanId (8-bytes) unique-within-trace
○ TraceFlags - Currently only sampled
○ TraceState - Vendor-specific info
● ParentSpan - Span which spawned this
span
● SpanKind - Relationship to other spans
○ [ CLIENT | SERVER | PRODUCER |
CONSUMER | INTERNAL ]
● StartTimestamp - Unix nanos
● EndTimestamp - Unix nanos
● Attributes collection
○ Key-value pairs describing the
operational context
○ OTel semantic conventions define
common keys
● Links collection
○ Associated non-parent spans
● Events collection
○ Significant data points during span
● Status - Success or failure details](https://image.slidesharecdn.com/otelfordevelopers-1-201109165601/75/OpenTelemetry-For-Developers-28-2048.jpg)

![31
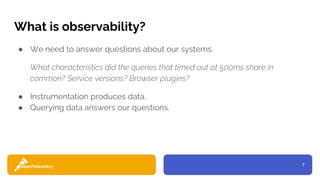
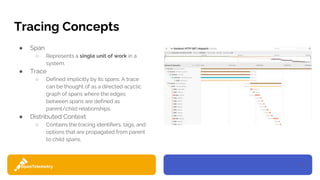
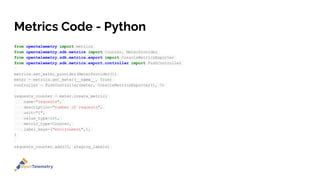
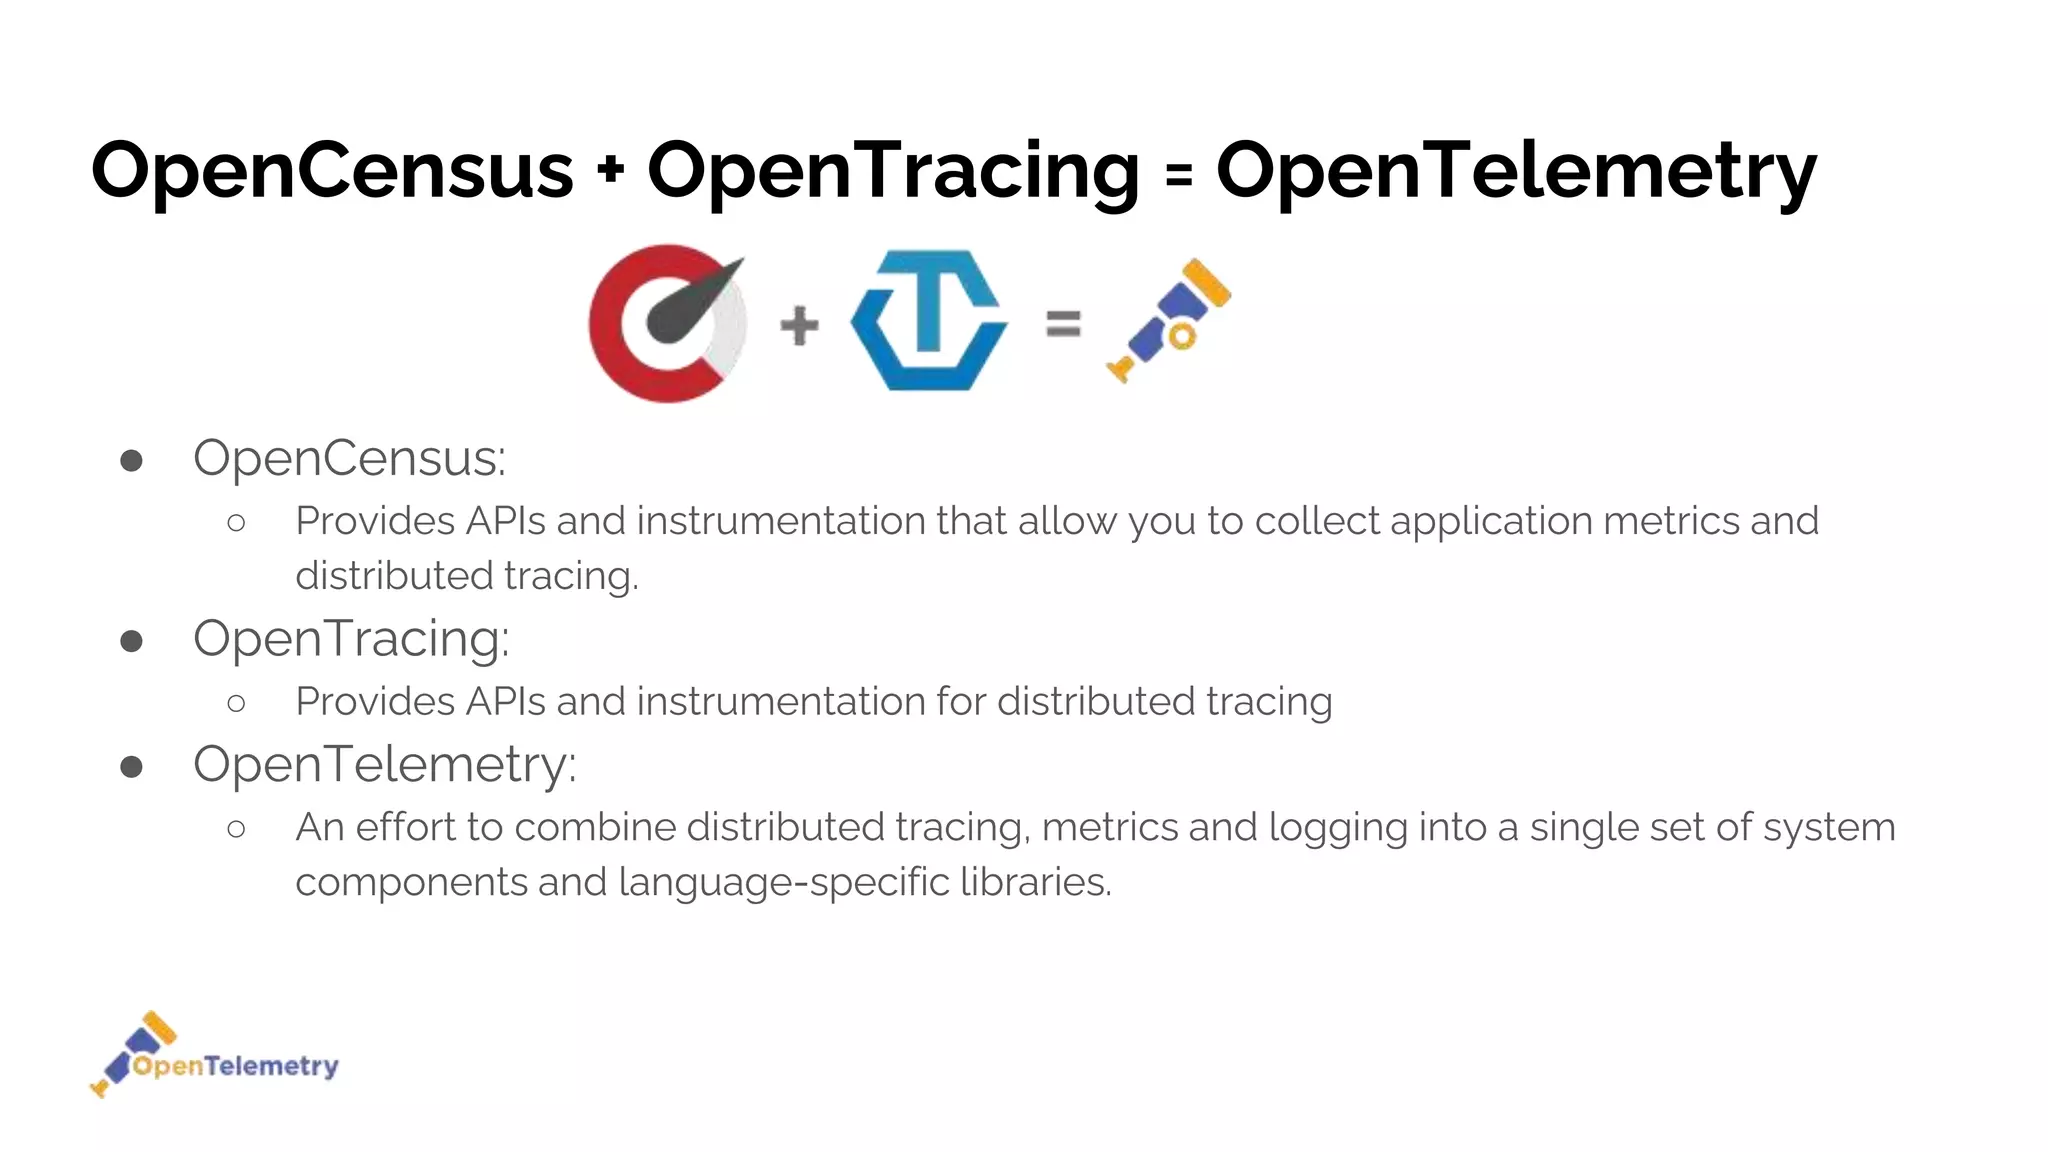
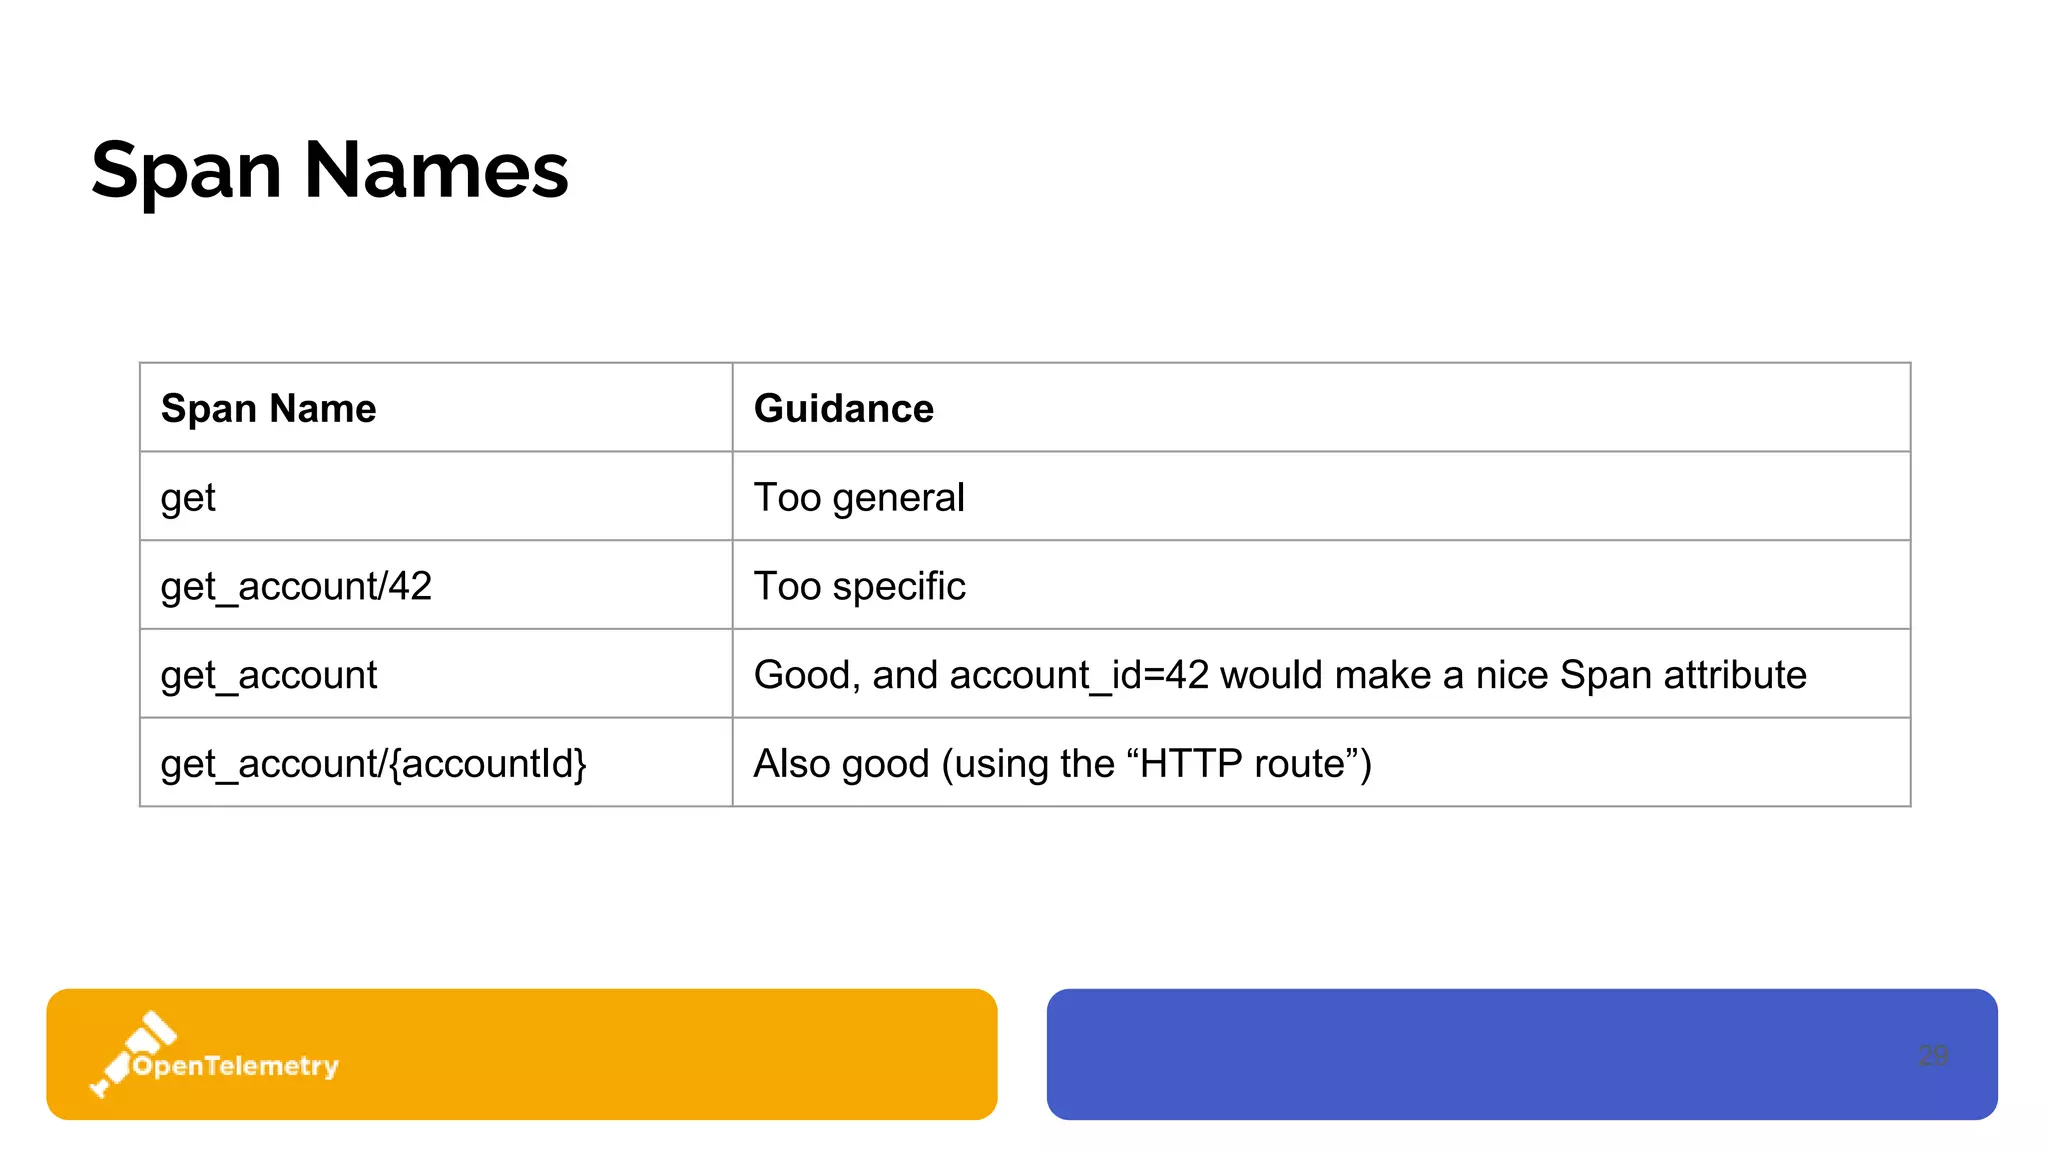
Tracing SDK Concepts
● Sampler controls the number of traces collected and sent to the backend.
○ Sampling decision values [ DROP | RECORD_ONLY | RECORD_AND_SAMPLE ]
○ SDK built-in samplers [ AlwaysOn | AlwaysOff | TraceIdRatioBased ]
○ Use AlwaysOn if doing tail-based sampling
● SpanProcessor enables hooks for span start and end method invocations.
○ SDK built-in processors [ ExportFormatConverter | Batching ]
○ Only invoked when IsRecording is true
● SpanExporter defines interface for protocol-specific exporters](https://image.slidesharecdn.com/otelfordevelopers-1-201109165601/75/OpenTelemetry-For-Developers-31-2048.jpg)


The document presents a comprehensive overview of OpenTelemetry, focusing on its role in enhancing observability for software systems. Key topics include the definitions and functions of telemetry, instrumentation libraries, and various programming languages' integration approaches. It emphasizes the importance of concepts such as metrics, logs, and tracing in monitoring complex microservices architectures.


