Download to read offline


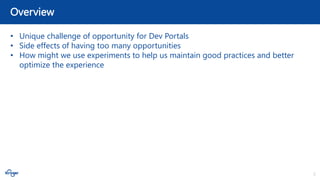
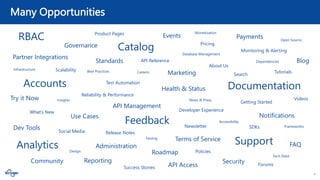
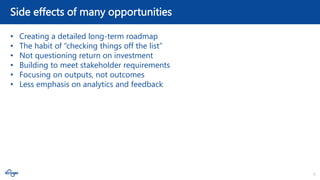
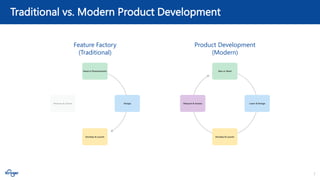

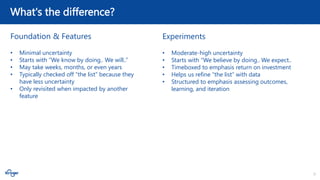
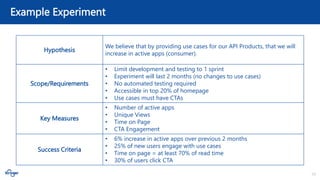
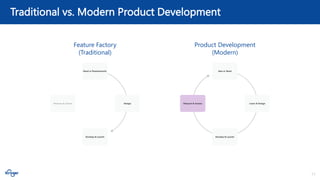
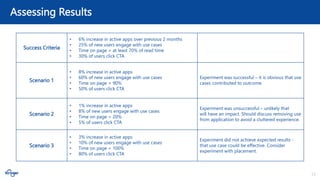


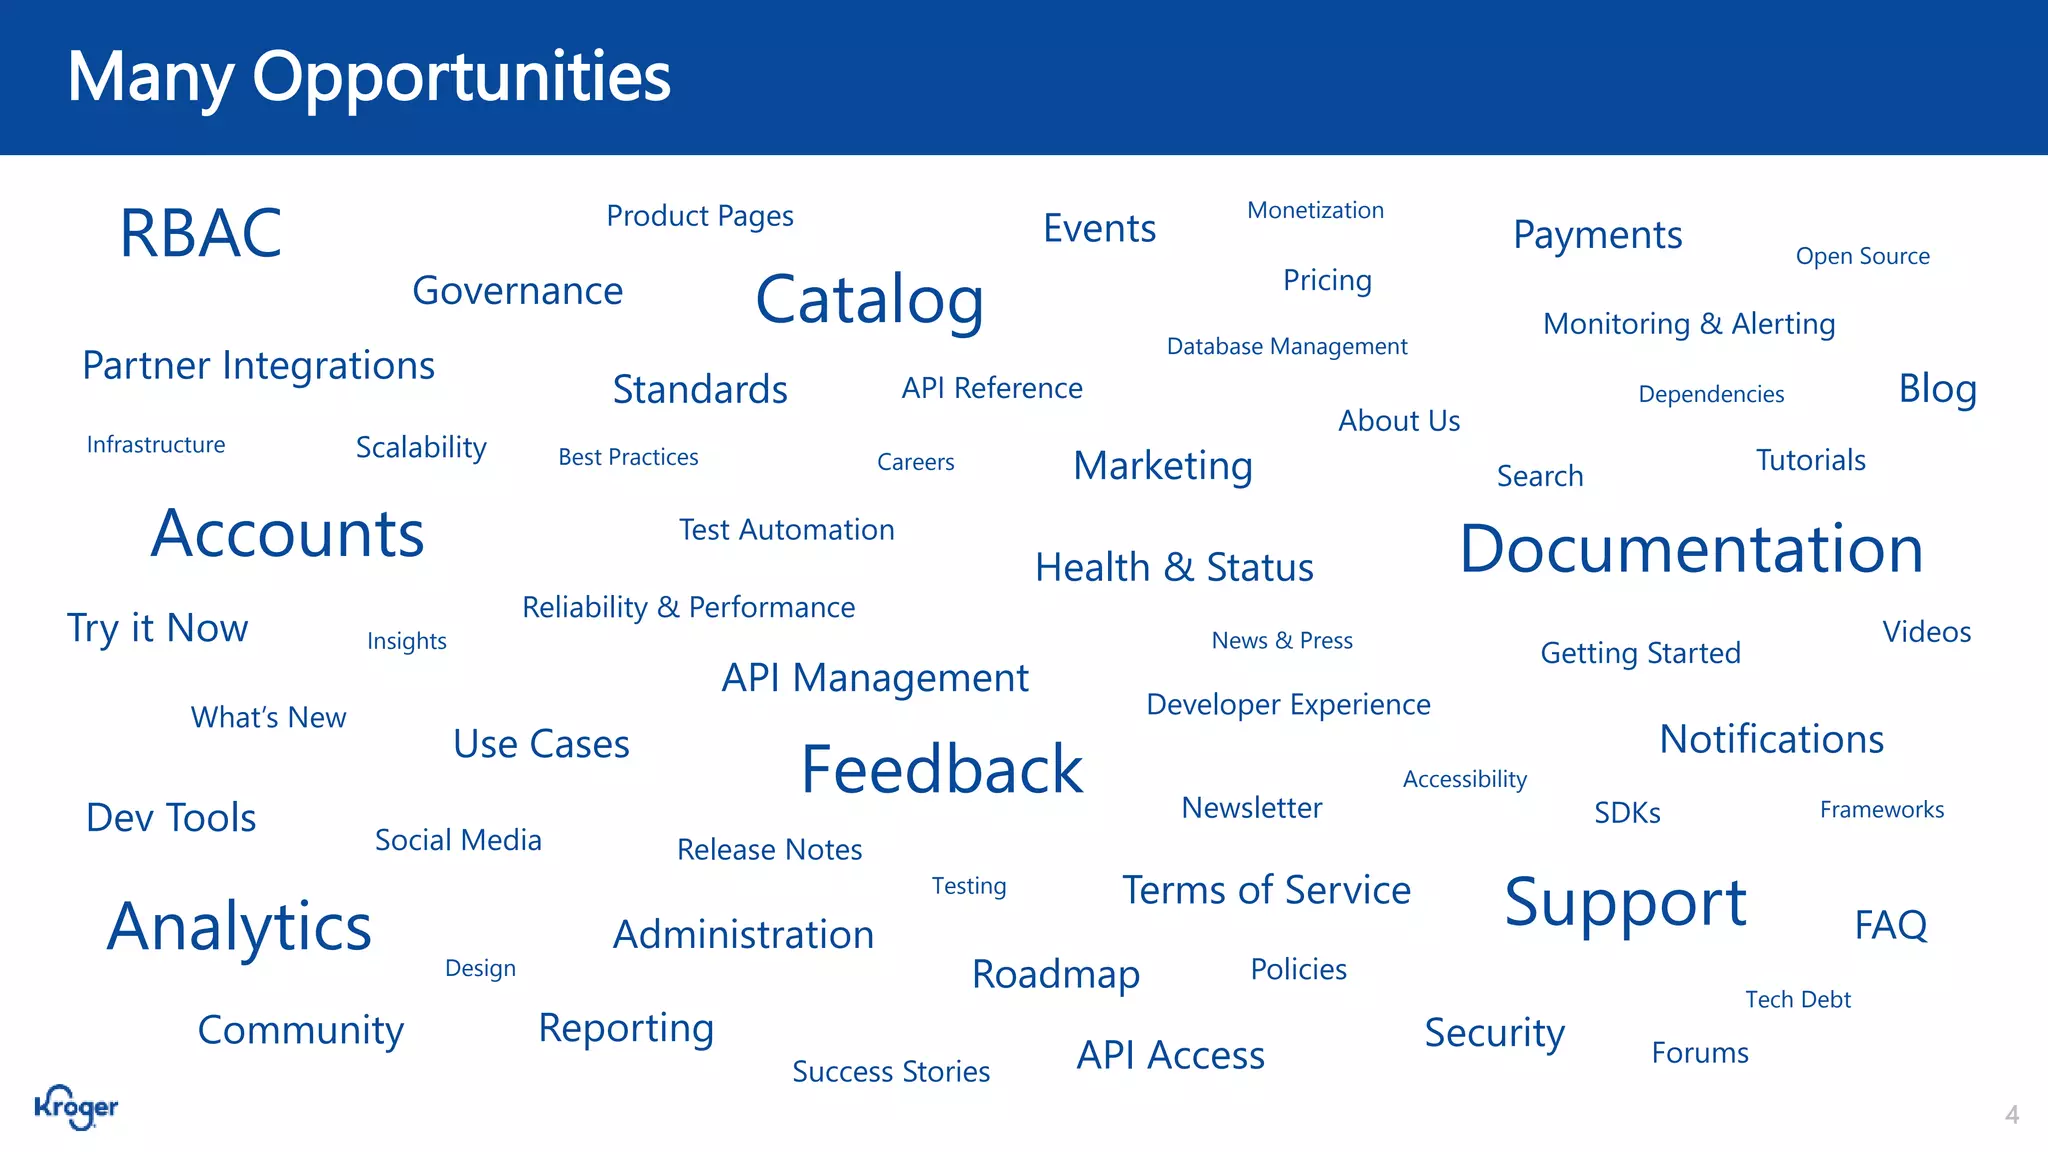
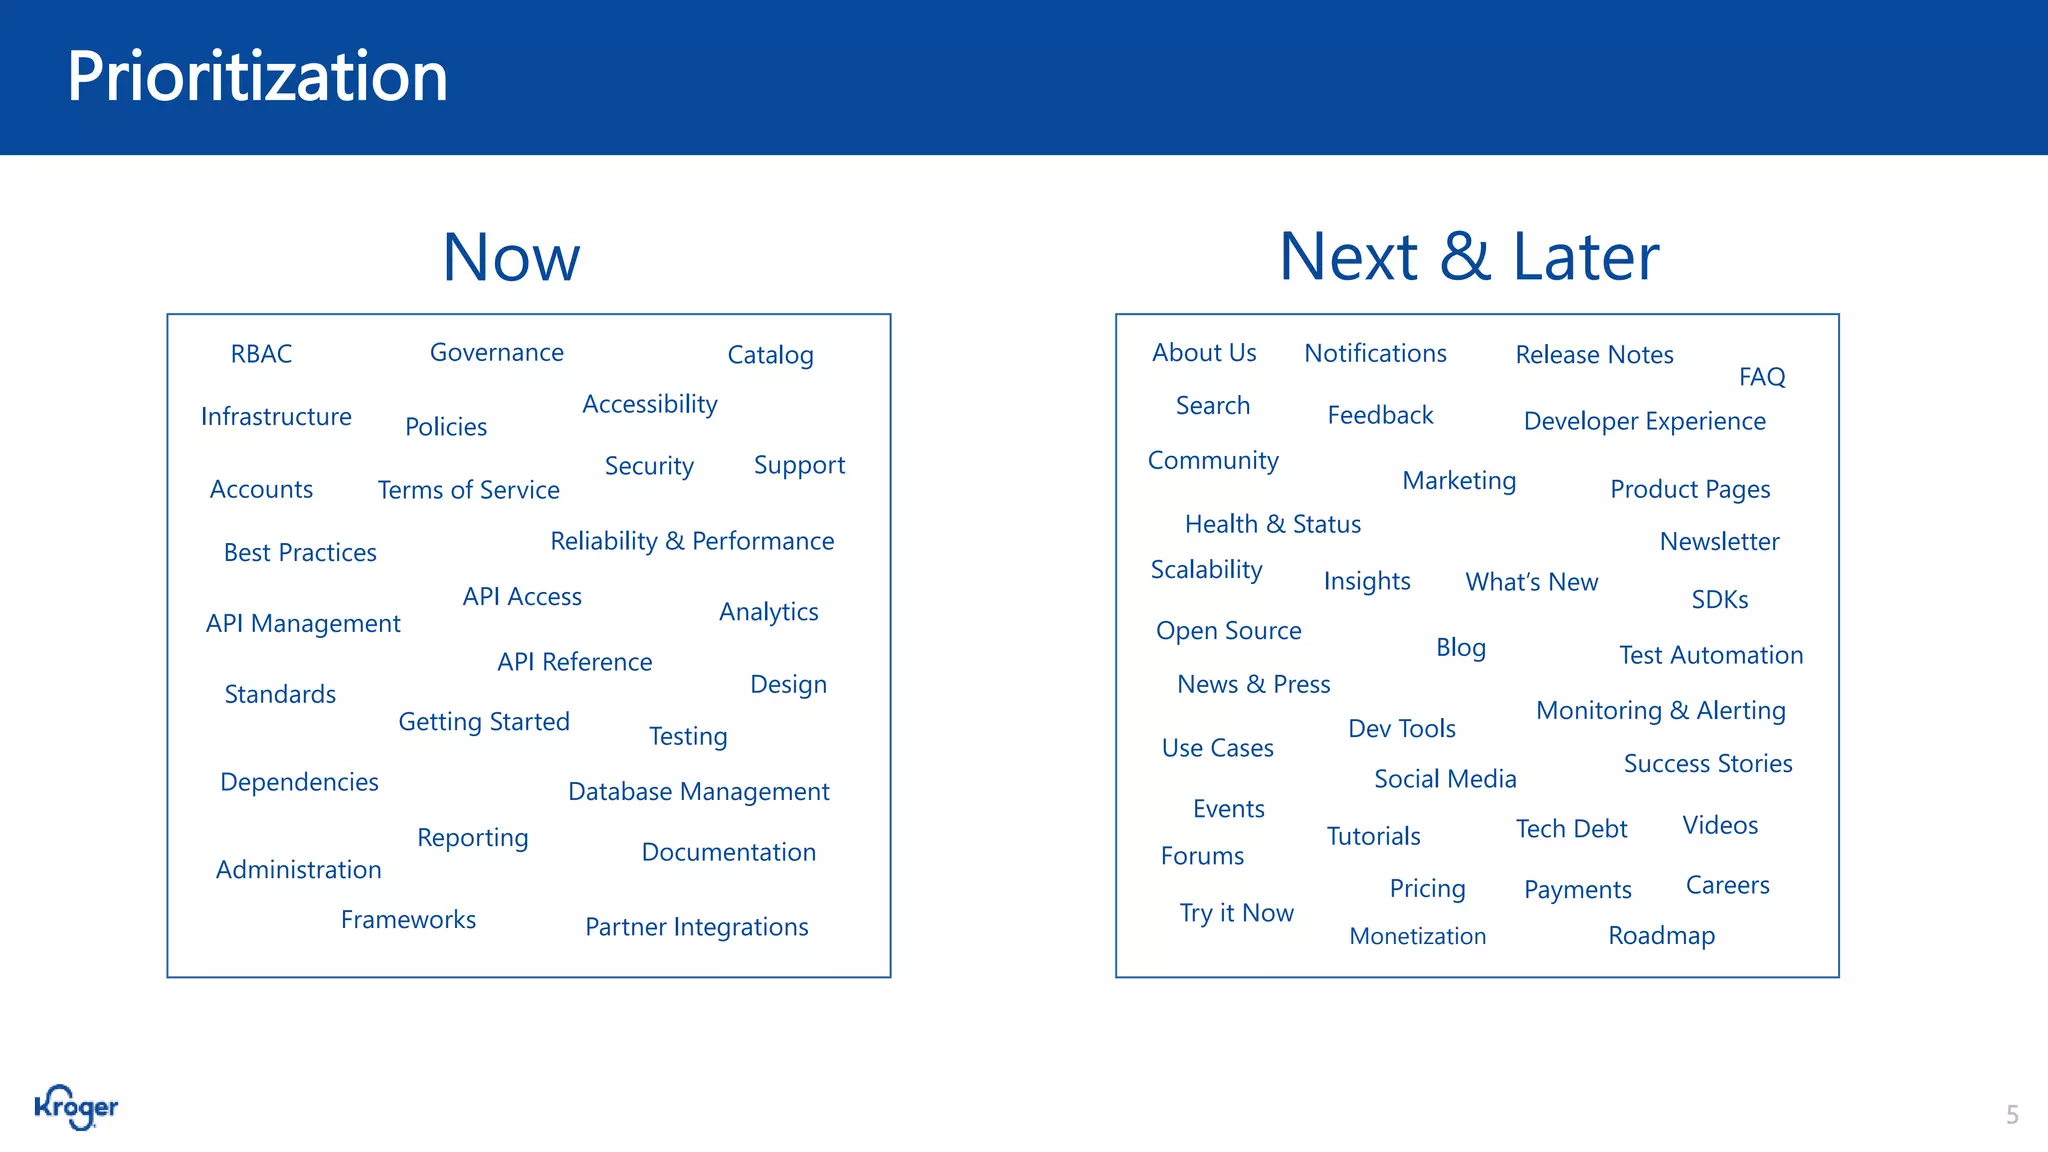
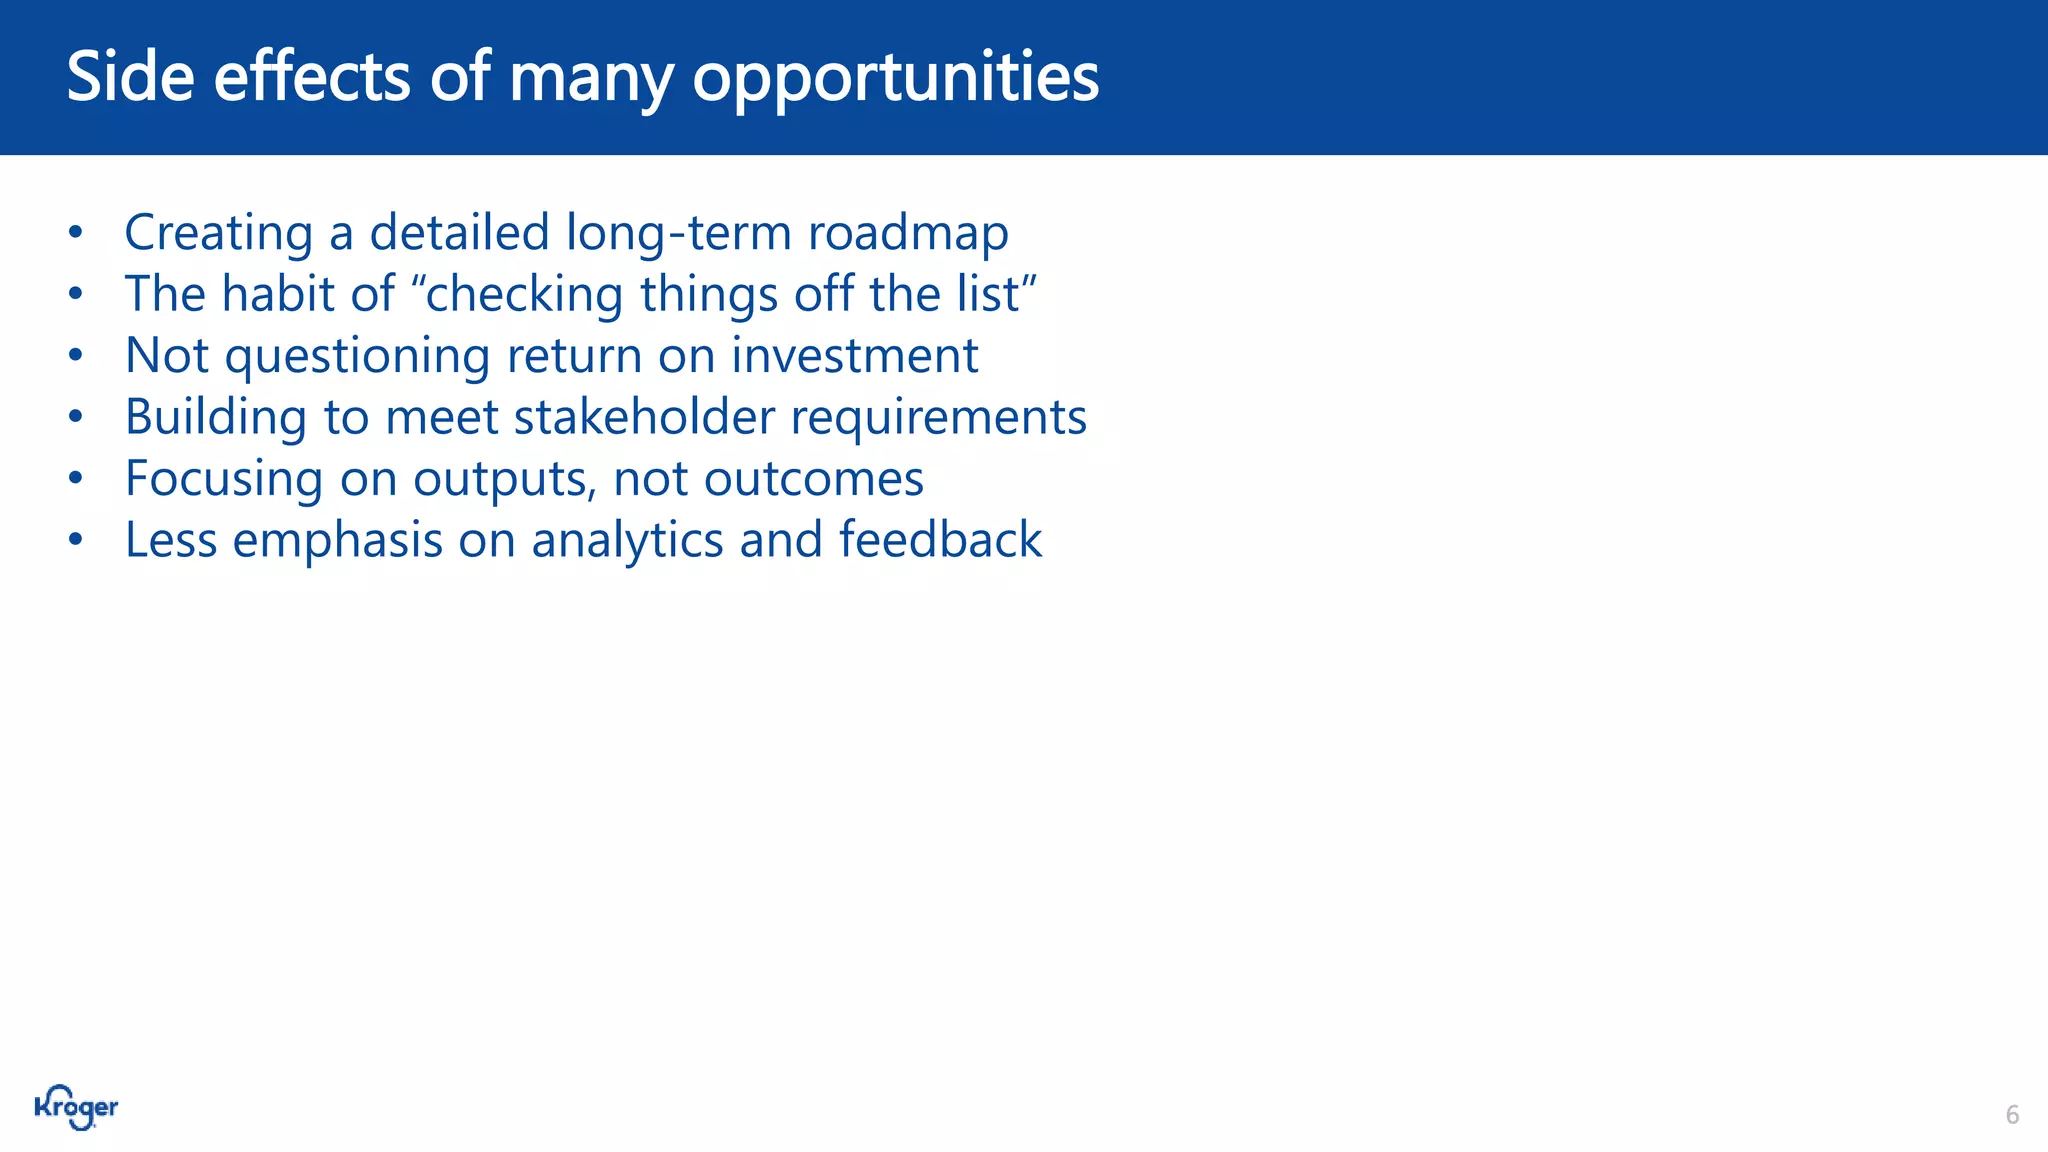

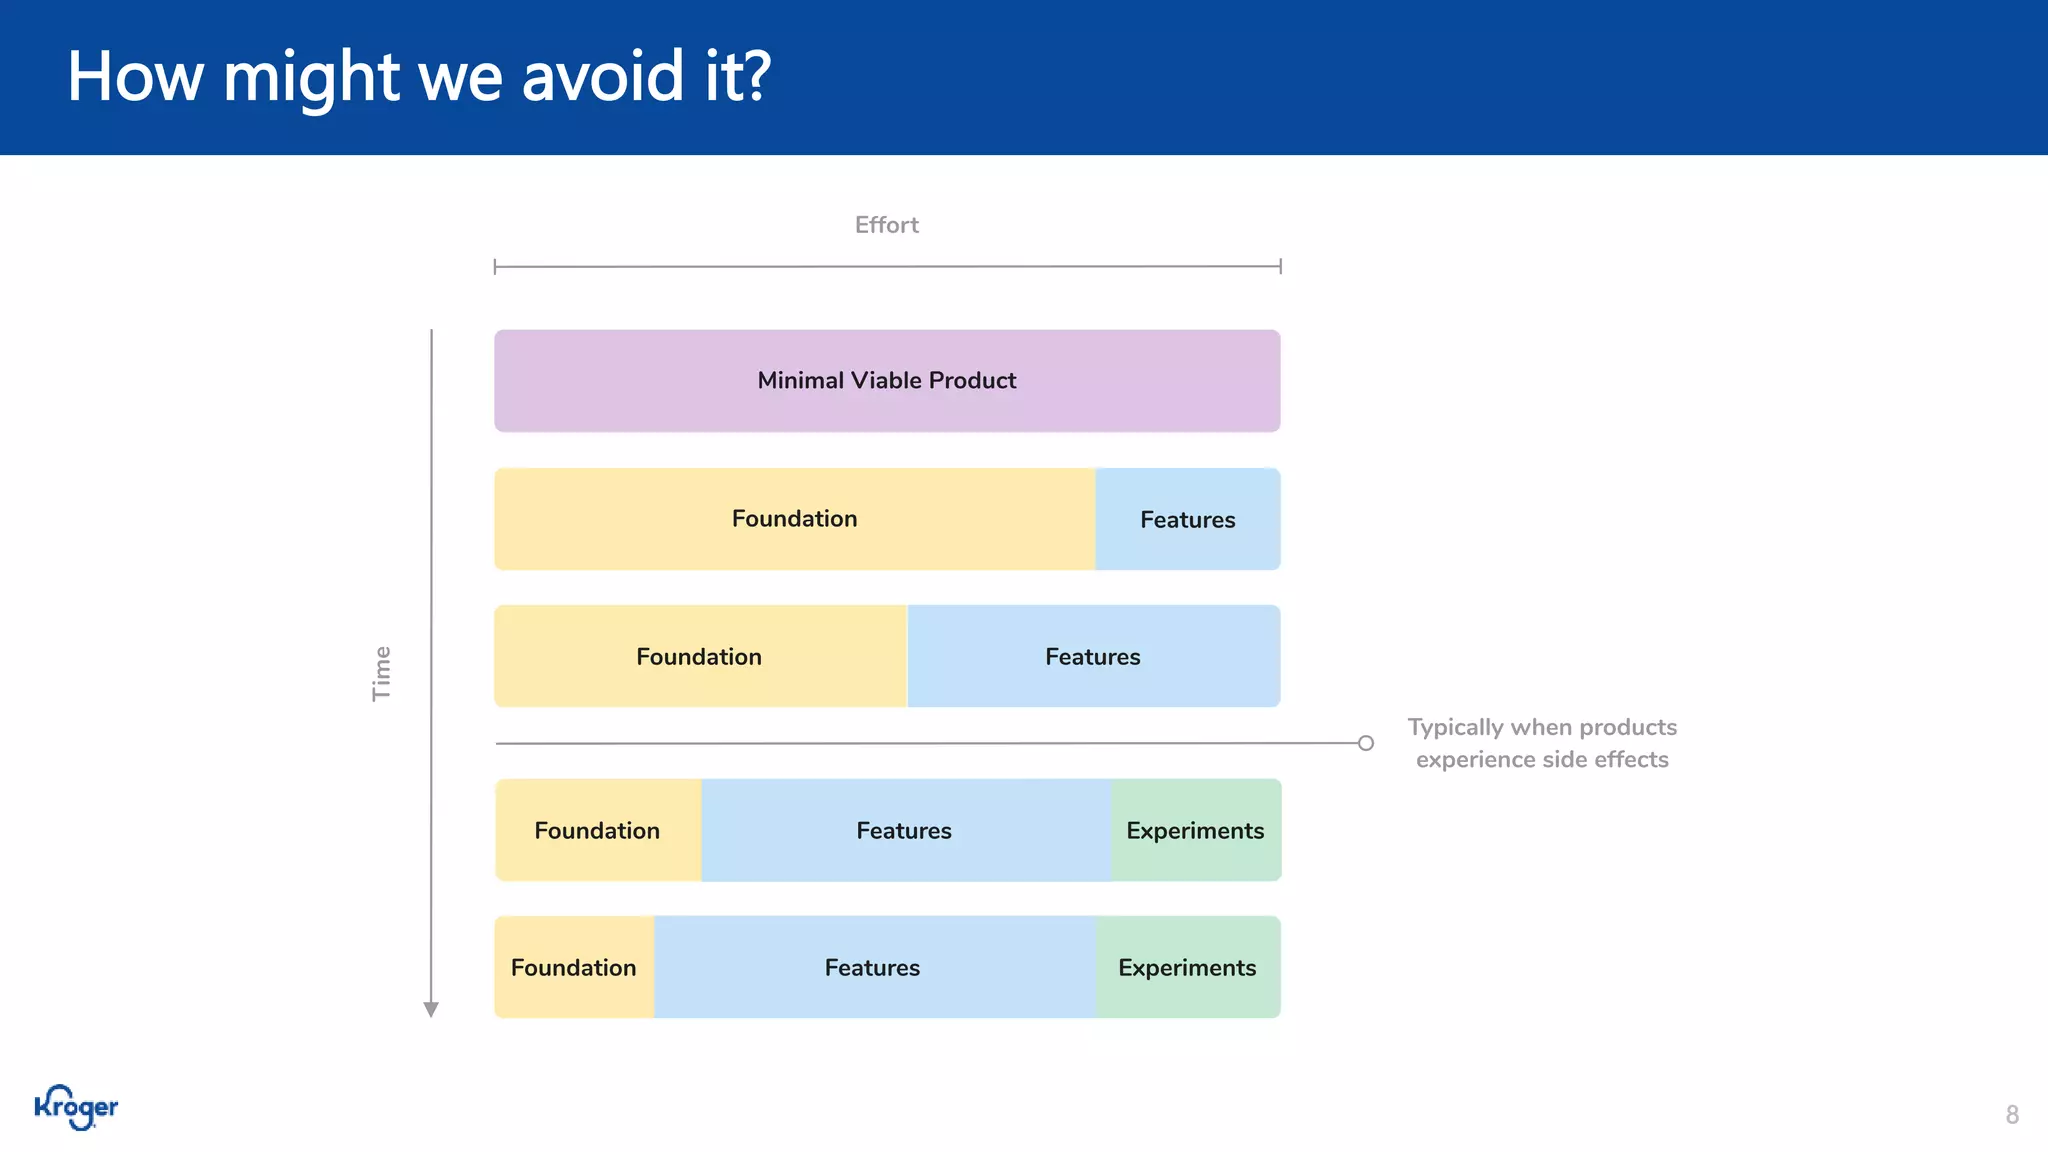
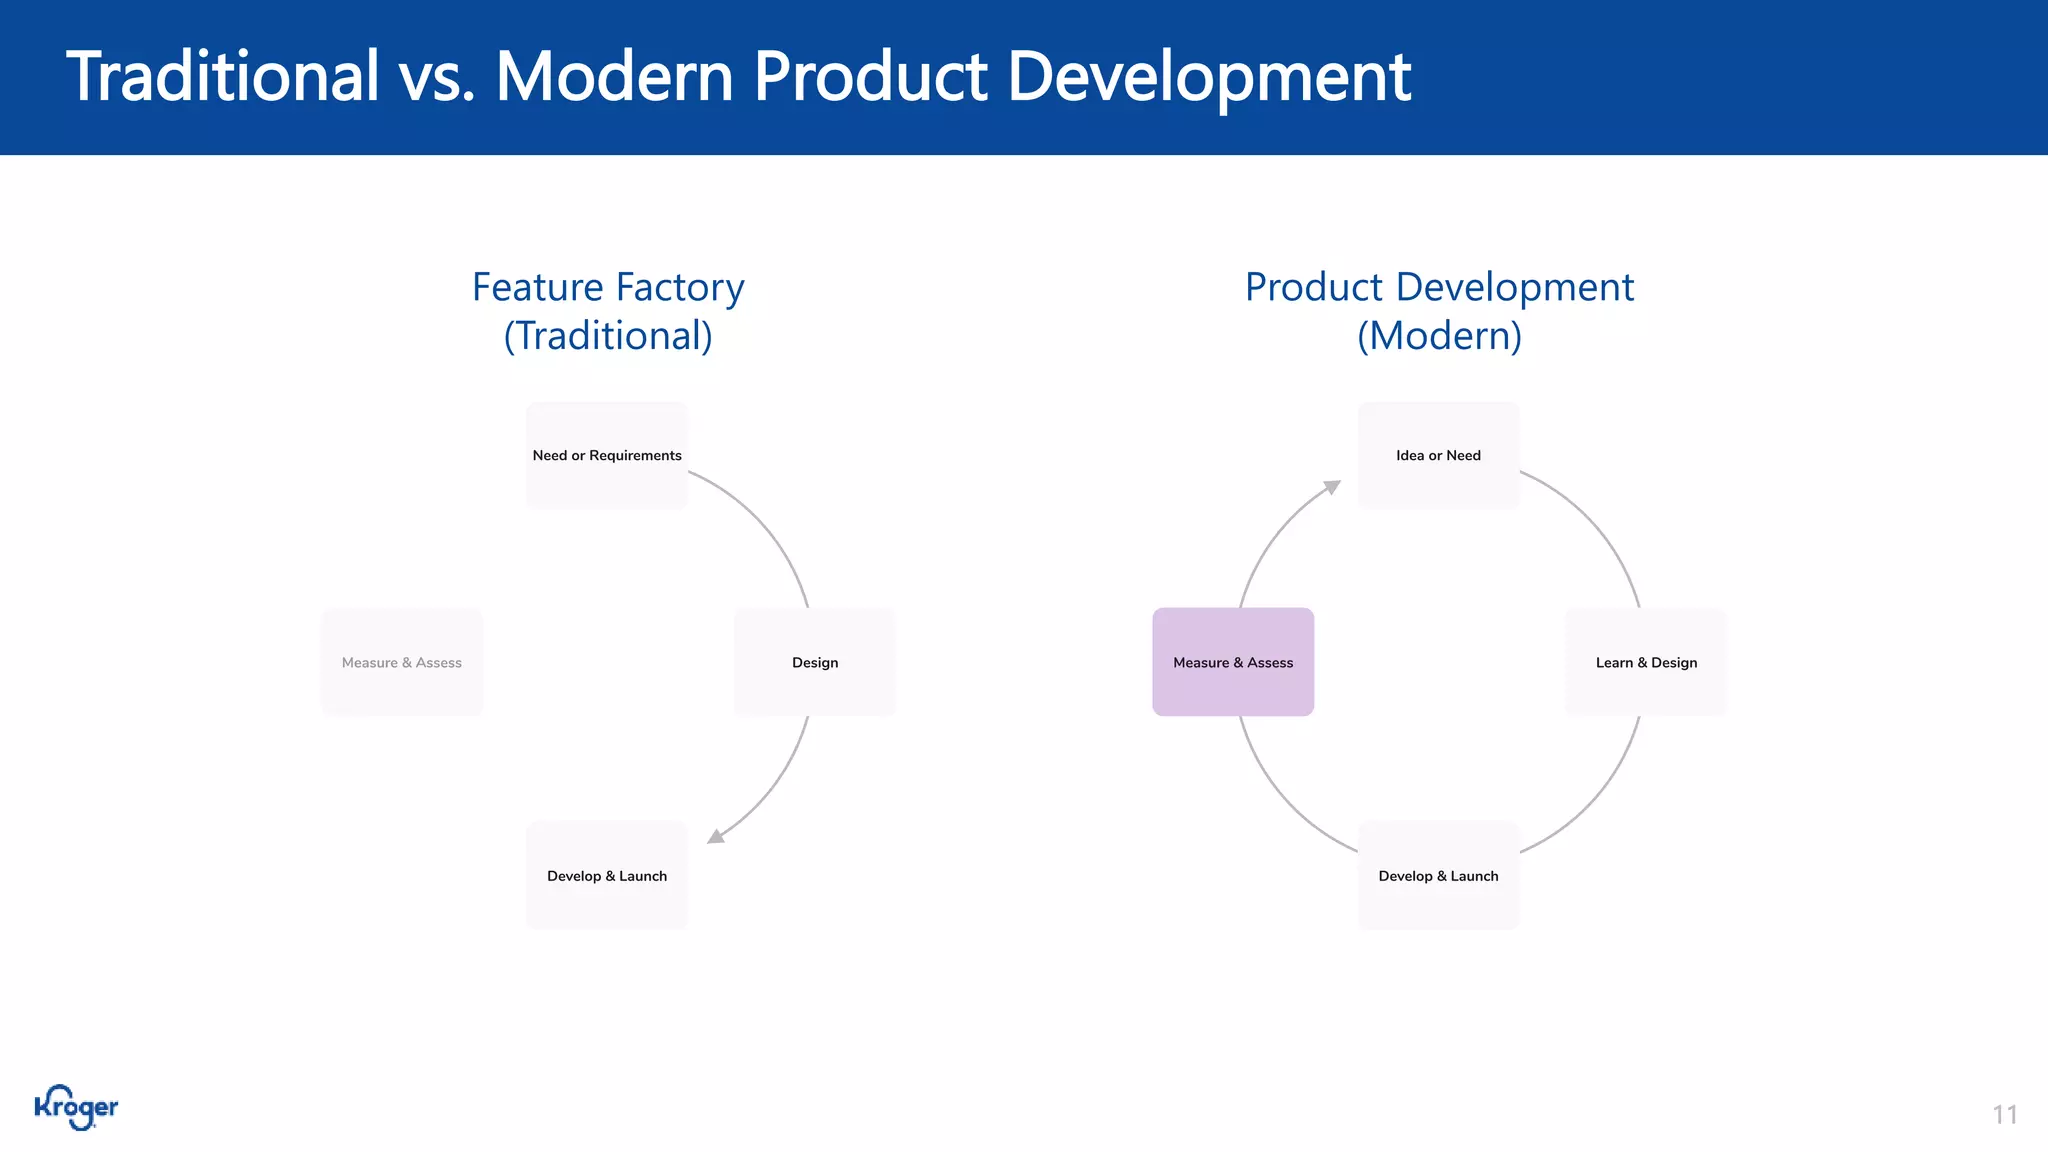
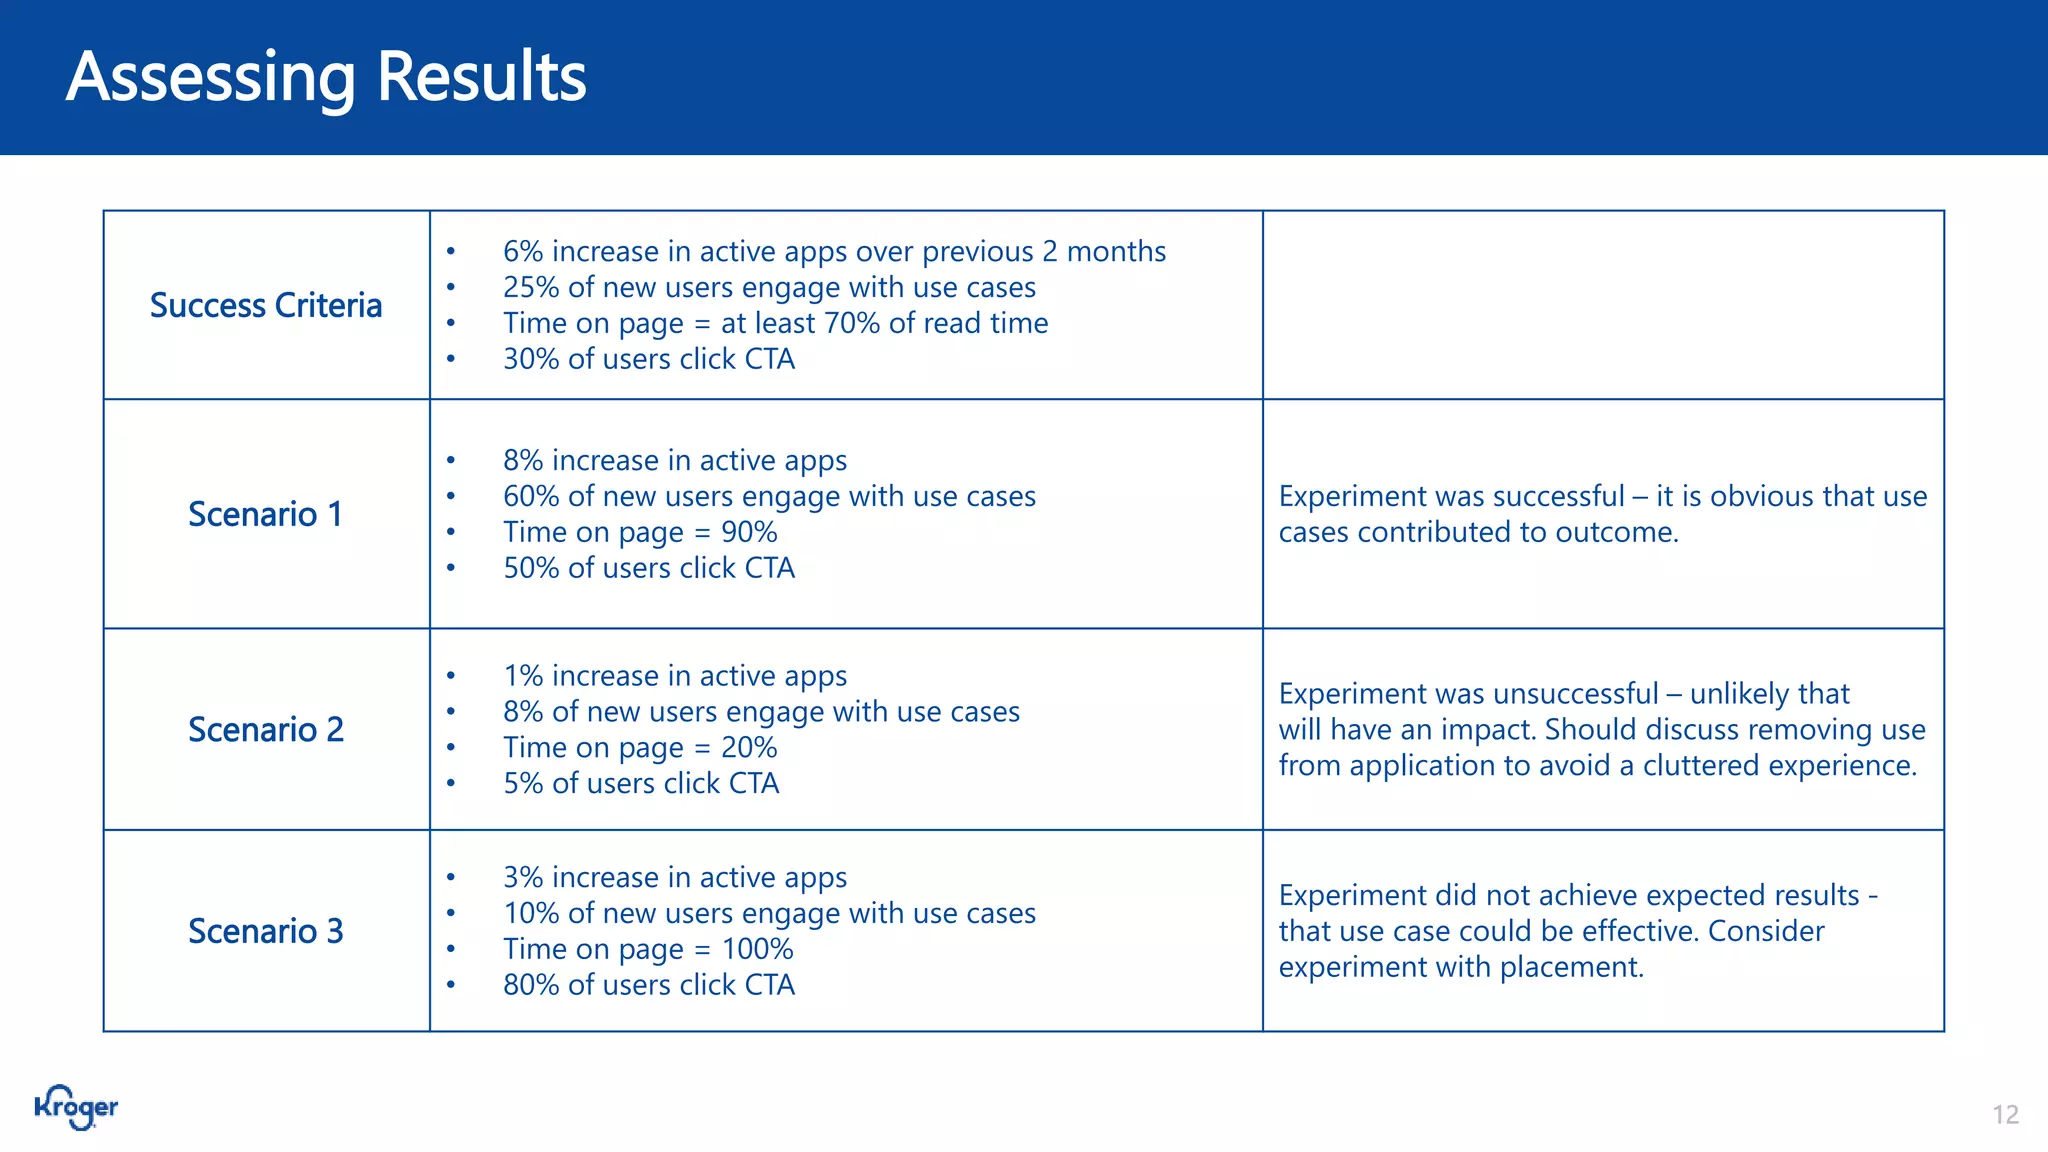


The document discusses optimizing developer portals through analytics and feedback, highlighting the unique challenges and opportunities involved. It emphasizes the importance of modern product development approaches, such as experimentation, to prioritize outcomes over outputs, reduce uncertainty, and improve user engagement. Recommendations include maintaining an experimental mindset, focusing on learning from experiments, and using multiple key measures for success.


![[Webinar] Visa's Journey to a Culture of Experimentation](https://cdn.slidesharecdn.com/ss_thumbnails/optimizelywebinar-visasjourneytoacultureofexperimentation-180227210737-thumbnail.jpg?width=600ounds&width=560&fit=bounds)


![UiPath Automation Suite Installation (Hands-On) [2/3]](https://cdn.slidesharecdn.com/ss_thumbnails/automationsuitecommunitysession2-251015095633-a6d862f1-thumbnail.jpg?width=600ounds&width=560&fit=bounds)


