#2 Year by year, the cost of computer systems continues to drop dramatically, while the
performance and capacity of those systems continue to rise equally dramatically.
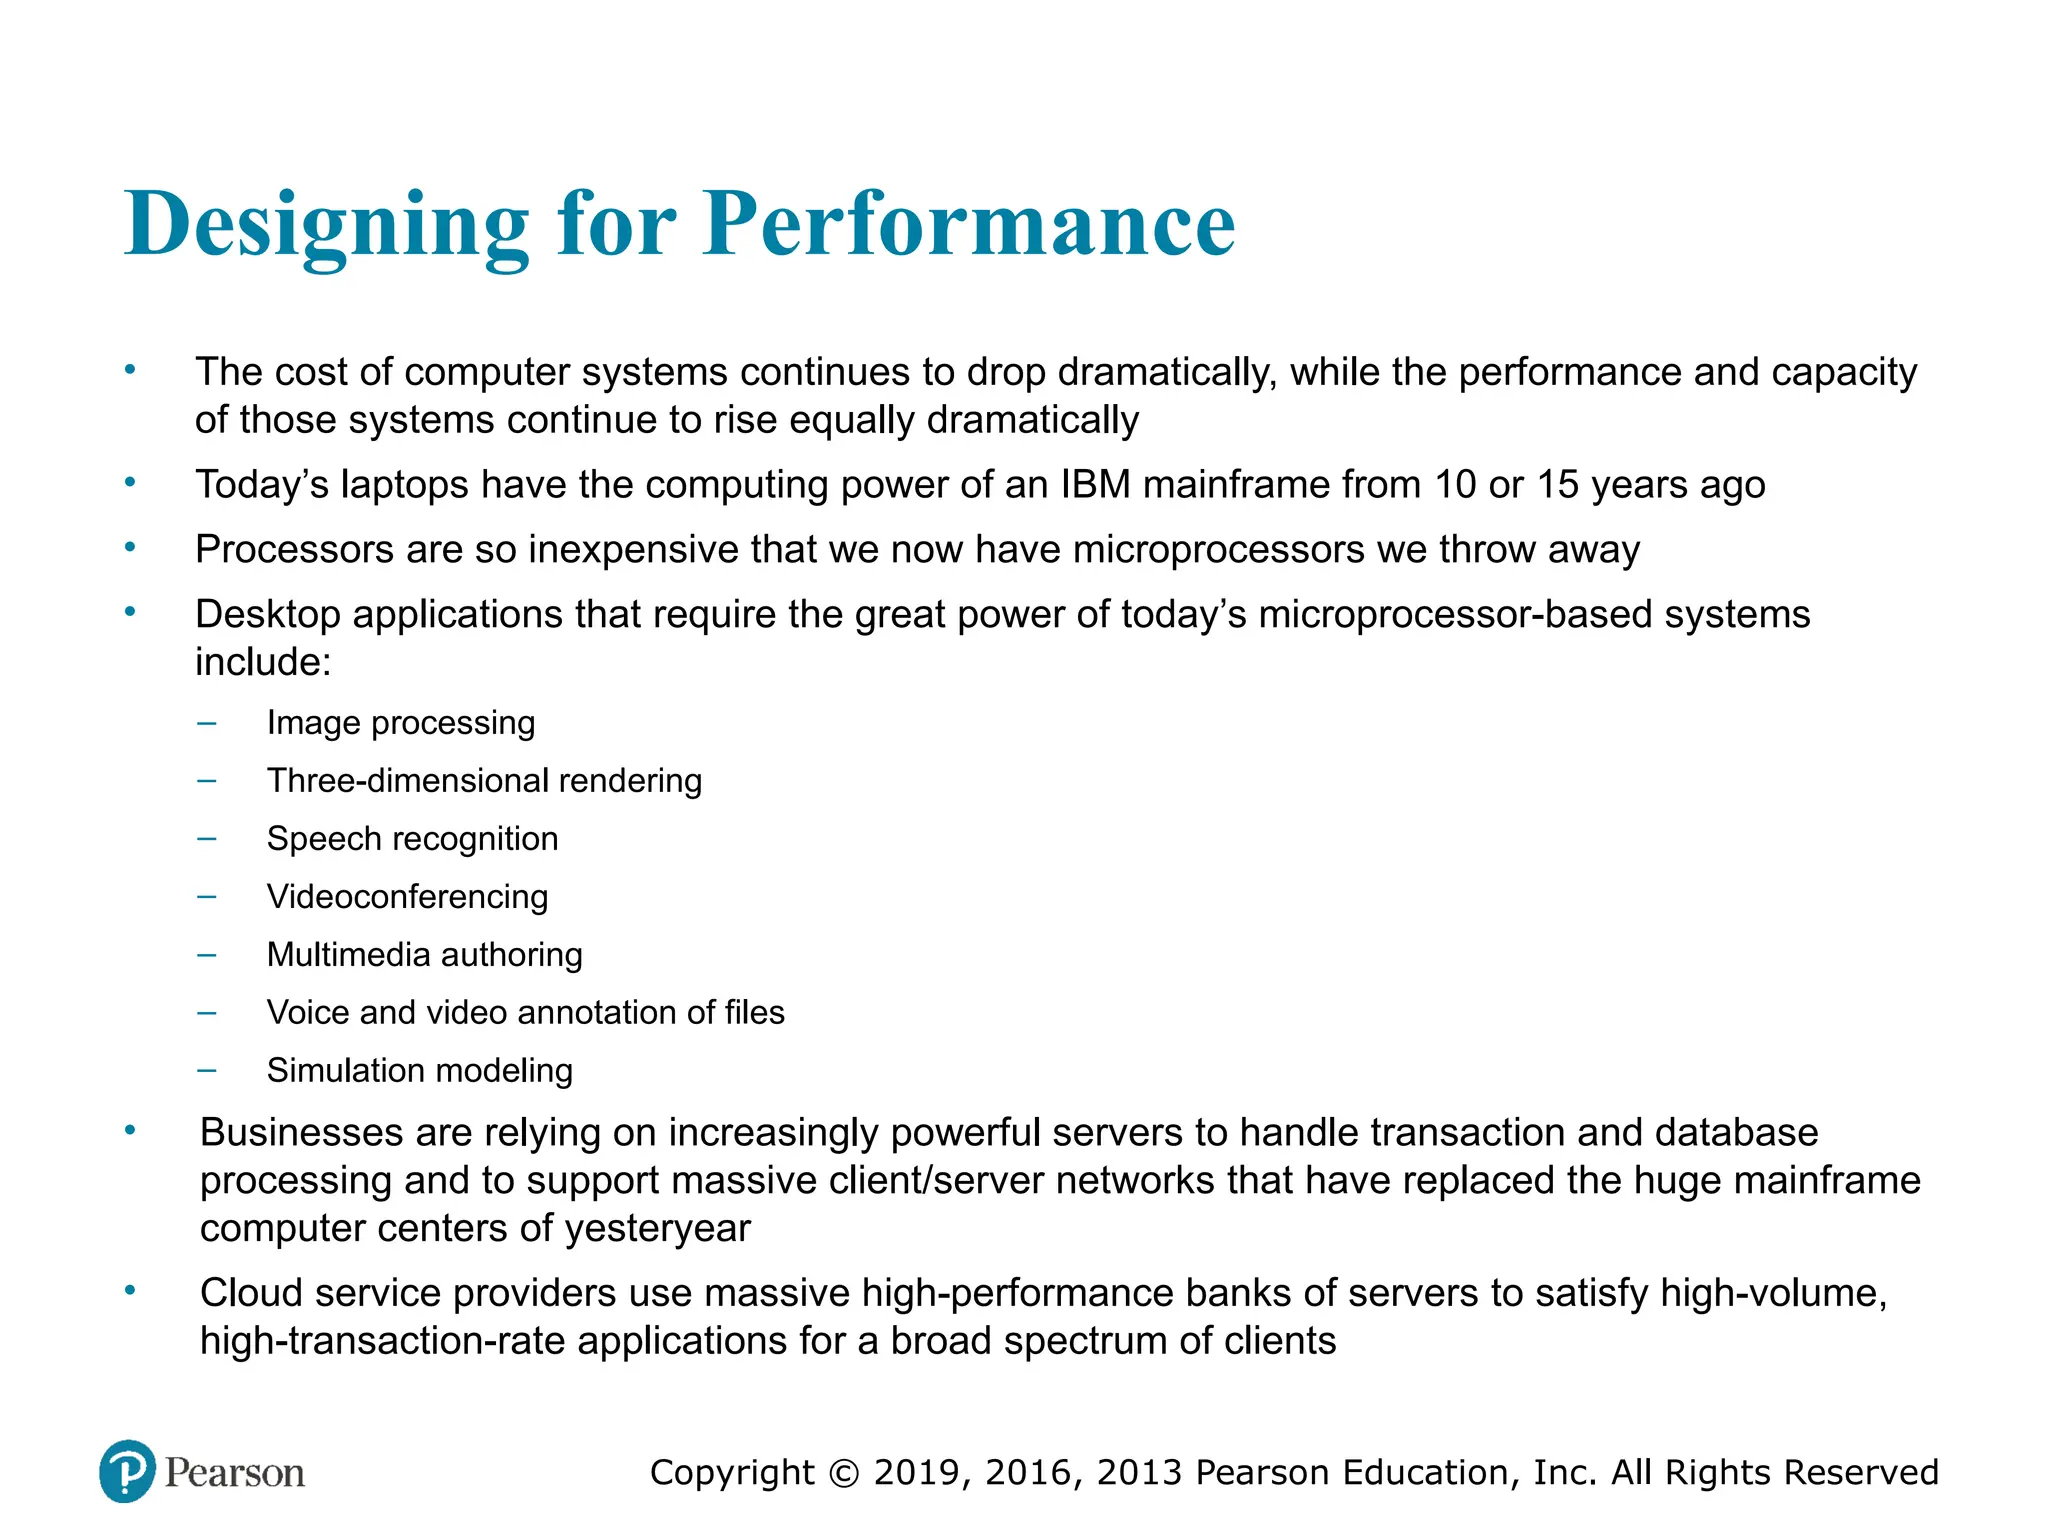
Today’s laptops have the computing power of an IBM mainframe from 10 or 15
years ago. Thus, we have virtually “free” computer power. Processors are so inexpensive
that we now have microprocessors we throw away. The digital pregnancy test is
an example (used once and then thrown away). And this continuing technological
revolution has enabled the development of applications of astounding complexity
and power. For example, desktop applications that require the great power of
today’s microprocessor-based systems include
■ Image processing
■ Three-dimensional rendering
■ Speech recognition
■ Videoconferencing
■ Multimedia authoring
■ Voice and video annotation of files
■ Simulation modeling
Workstation systems now support highly sophisticated engineering and scientific
applications and have the capacity to support image and video applications. In addition,
businesses are relying on increasingly powerful servers to handle transaction
and database processing and to support massive client/server networks that have
replaced the huge mainframe computer centers of yesteryear. As well, cloud service
providers use massive high-performance banks of servers to satisfy high-volume,
high-transaction-rate applications for a broad spectrum of clients.
What is fascinating about all this from the perspective of computer organization
and architecture is that, on the one hand, the basic building blocks for today’s
computer miracles are virtually the same as those of the IAS computer from over
50 years ago, while on the other hand, the techniques for squeezing the maximum
performance out of the materials at hand have become increasingly sophisticated.
This observation serves as a guiding principle for the presentation in this
book. As we progress through the various elements and components of a computer,
two objectives are pursued. First, the book explains the fundamental functionality
in each area under consideration, and second, the book explores those techniques
required to achieve maximum performance. In the remainder of this section, we
highlight some of the driving factors behind the need to design for performance.
#3 What gives Intel x86 processors or IBM mainframe computers such mind-boggling
power is the relentless pursuit of speed by processor chip manufacturers. The evolution
of these machines continues to bear out Moore’s law, described in Chapter 1. So
long as this law holds, chipmakers can unleash a new generation of chips every three
years—with four times as many transistors. In memory chips, this has quadrupled
the capacity of dynamic random-access memory (DRAM), still the basic technology
for computer main memory, every three years. In microprocessors, the addition of
new circuits, and the speed boost that comes from reducing the distances between
them, has improved performance four- or fivefold every three years or so since Intel
launched its x86 family in 1978.
But the raw speed of the microprocessor will not achieve its potential unless
it is fed a constant stream of work to do in the form of computer instructions.
Anything that gets in the way of that smooth flow undermines the power of the
processor. Accordingly, while the chipmakers have been busy learning how to fabricate
chips of greater and greater density, the processor designers must come up with
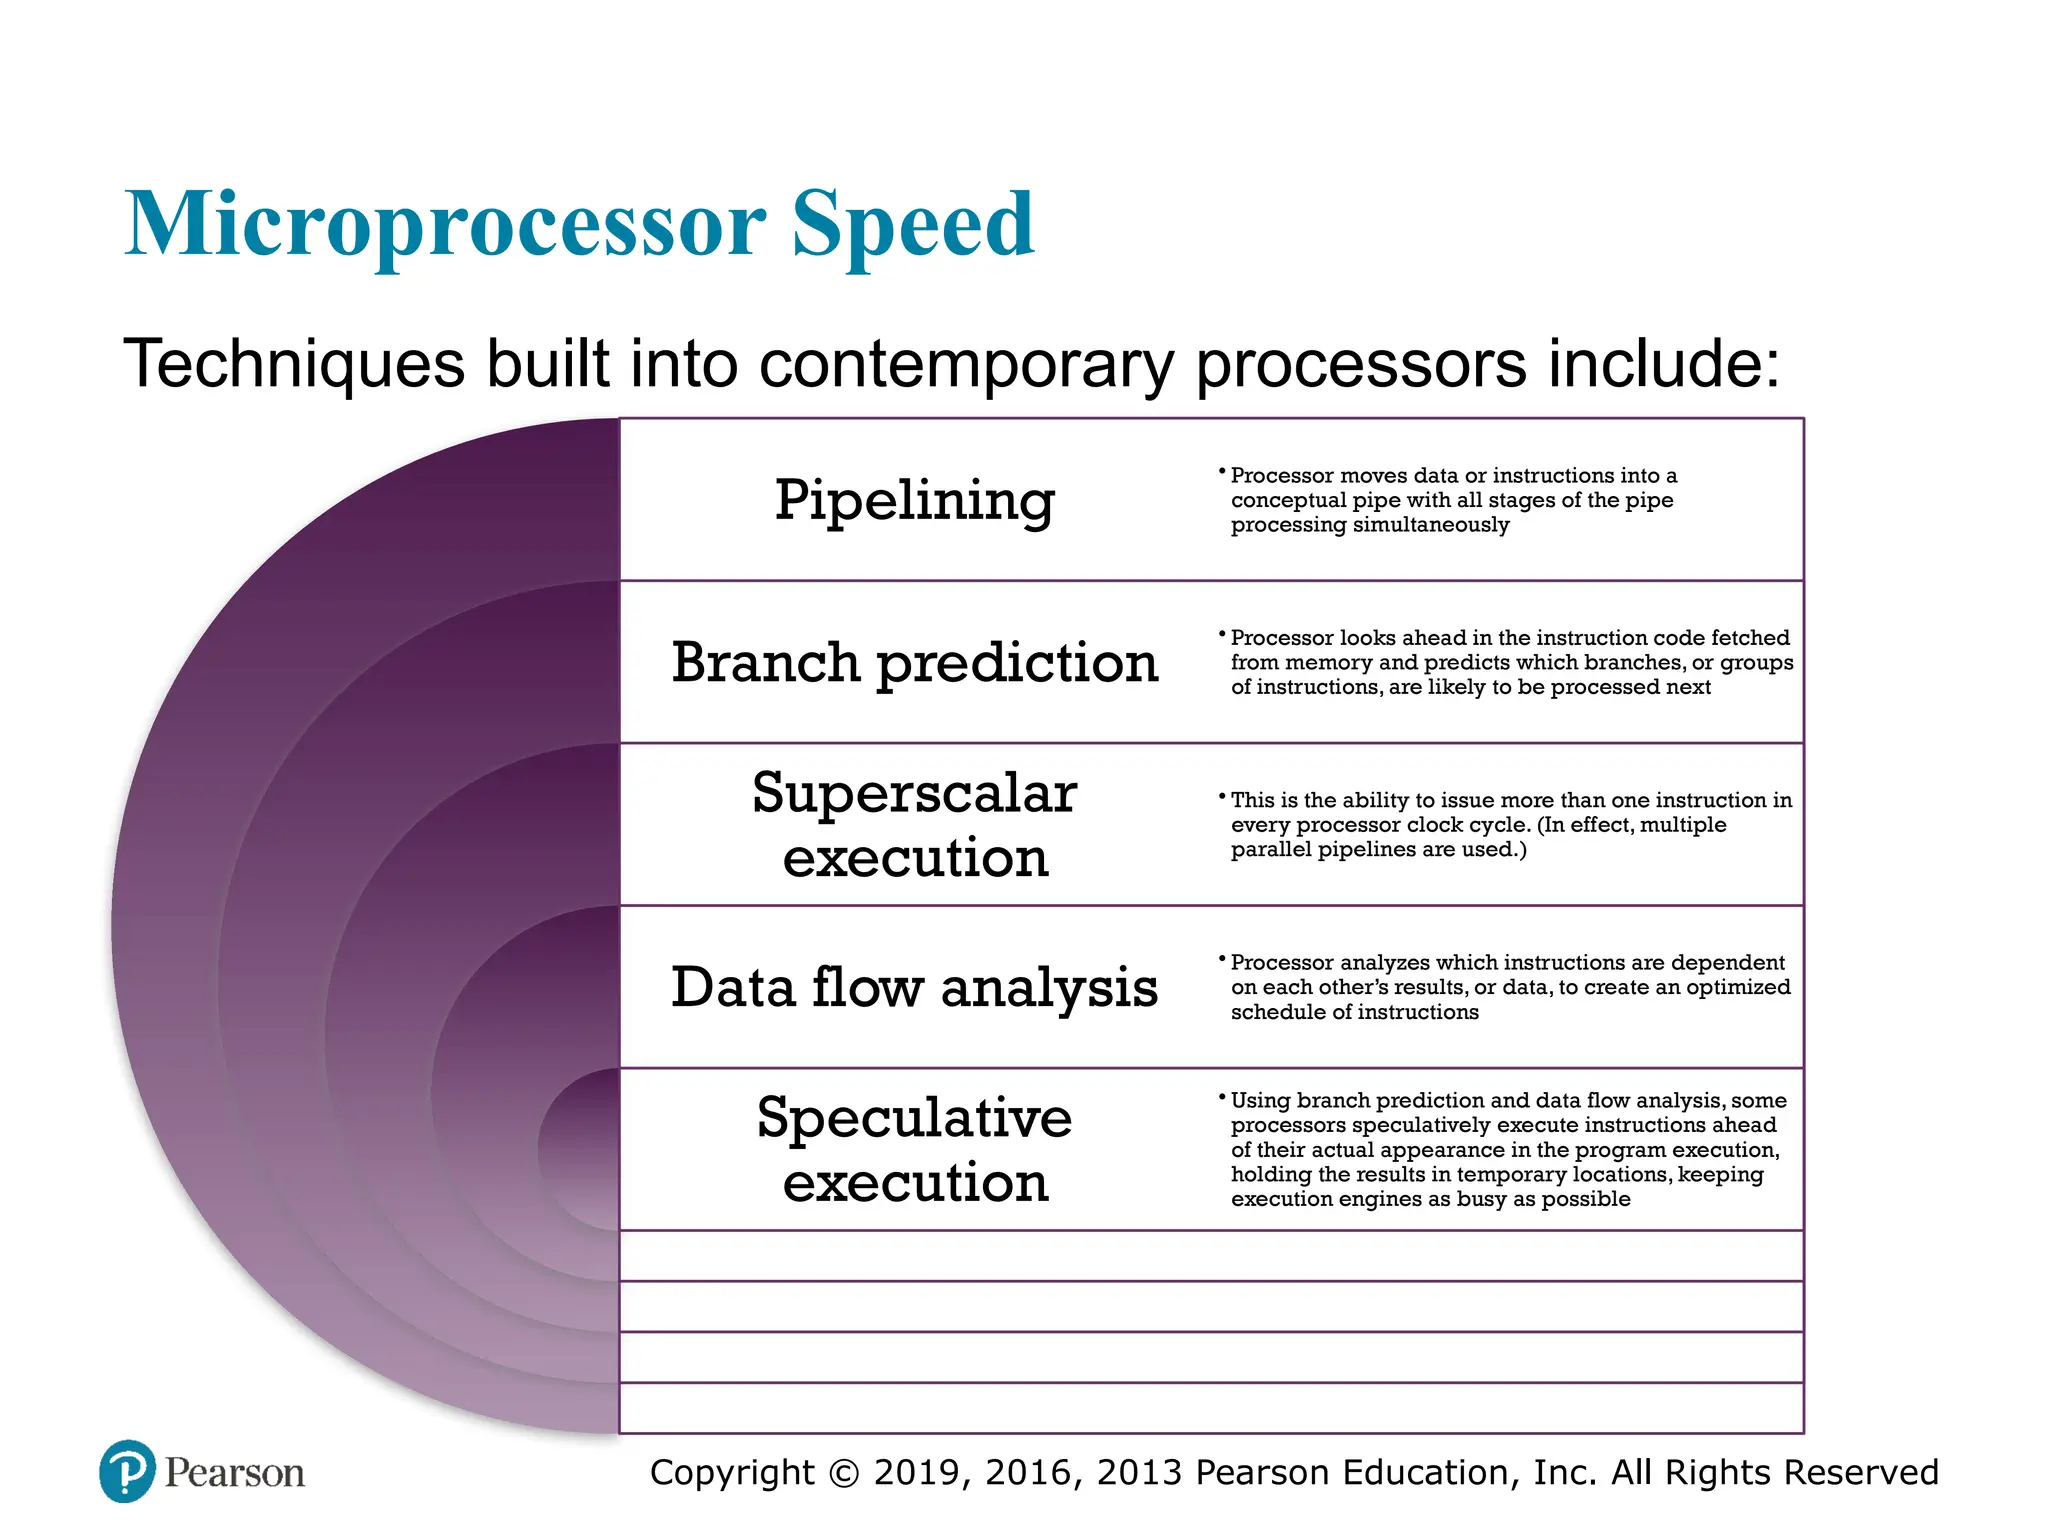
ever more elaborate techniques for feeding the monster. Among the techniques
built into contemporary processors are the following:
Pipelining:
The execution of an instruction involves multiple stages of operation,
including fetching the instruction, decoding the opcode, fetching operands,
performing a calculation, and so on. Pipelining enables a processor to
work simultaneously on multiple instructions by performing a different phase
for each of the multiple instructions at the same time. The processor overlaps
operations by moving data or instructions into a conceptual pipe with all
stages of the pipe processing simultaneously. For example, while one instruction
is being executed, the computer is decoding the next instruction. This is
the same principle as seen in an assembly line.
• Branch prediction:
The processor looks ahead in the instruction code fetched
from memory and predicts which branches, or groups of instructions, are likely
to be processed next. If the processor guesses right most of the time, it can
prefetch the correct instructions and buffer them so that the processor is kept
busy. The more sophisticated examples of this strategy predict not just the
next branch but multiple branches ahead. Thus, branch prediction increases
the amount of work available for the processor to execute.
• Superscalar execution:
This is the ability to issue more than one instruction
in every processor clock cycle. In effect, multiple parallel pipelines are used.
• Data flow analysis:
The processor analyzes which instructions are dependent
on each other’s results, or data, to create an optimized schedule of instructions.
In fact, instructions are scheduled to be executed when ready, independent of
the original program order. This prevents unnecessary delay.
• Speculative execution:
Using branch prediction and data flow analysis, some
processors speculatively execute instructions ahead of their actual appearance
in the program execution, holding the results in temporary locations.
This enables the processor to keep its execution engines as busy as possible by
executing instructions that are likely to be needed.
These and other sophisticated techniques are made necessary by the sheer
power of the processor. Collectively they make it possible to execute many instructions
per processor cycle, rather than to take many cycles per instruction.
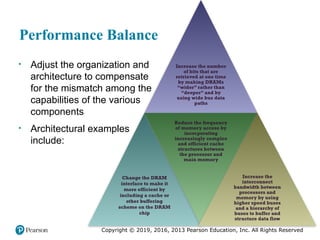
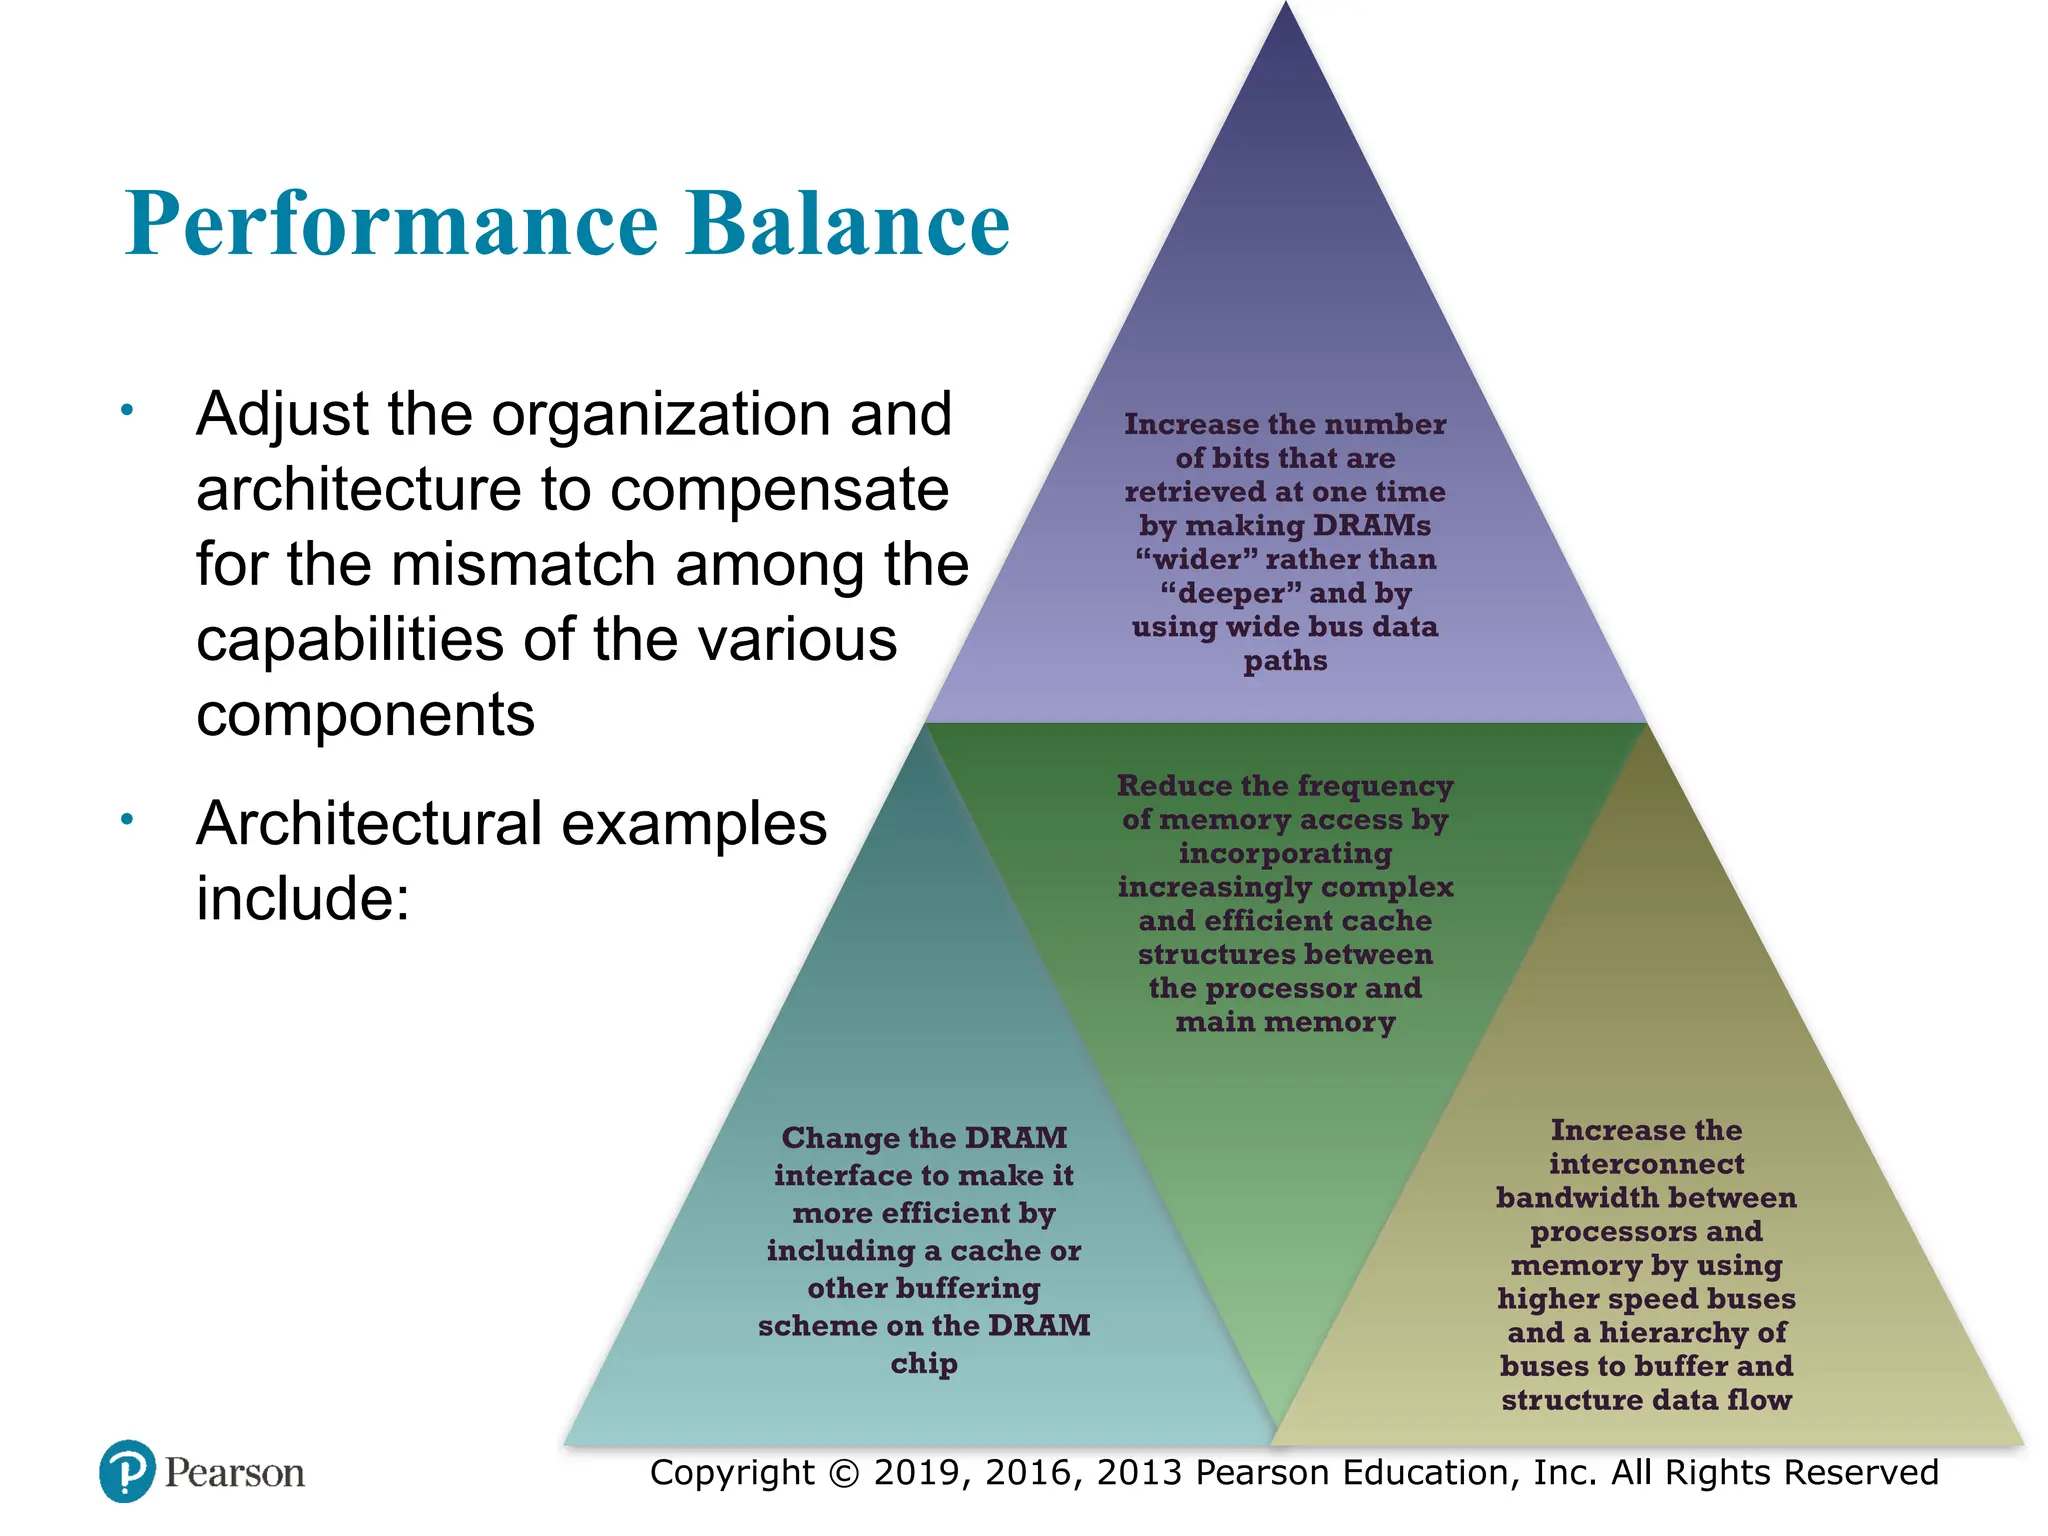
#4 While processor power has raced ahead at breakneck speed, other critical components
of the computer have not kept up. The result is a need to look for performance
balance: an adjusting of the organization and architecture to compensate for the
mismatch among the capabilities of the various components.
The problem created by such mismatches is particularly critical at the
interface between processor and main memory. While processor speed has grown
rapidly, the speed with which data can be transferred between main memory and the
processor has lagged badly. The interface between processor and main memory is
the most crucial pathway in the entire computer because it is responsible for carrying
a constant flow of program instructions and data between memory chips and the
processor. If memory or the pathway fails to keep pace with the processor’s insistent
demands, the processor stalls in a wait state, and valuable processing time is lost.
A system architect can attack this problem in a number of ways, all of which
are reflected in contemporary computer designs. Consider the following examples:
• Increase the number of bits that are retrieved at one time by making DRAMs
“wider” rather than “deeper” and by using wide bus data paths.
• Change the DRAM interface to make it more efficient by including a cache
or other buffering scheme on the DRAM chip.
• Reduce the frequency of memory access by incorporating increasingly complex
and efficient cache structures between the processor and main memory. This
includes the incorporation of one or more caches on the processor chip as well
as on an off-chip cache close to the processor chip.
• Increase the interconnect bandwidth between processors and memory by using
higher-speed buses and a hierarchy of buses to buffer and structure data
flow.
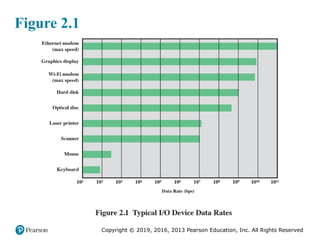
#5 Another area of design focus is the handling of I/O devices. As computers
become faster and more capable, more sophisticated applications are developed
that support the use of peripherals with intensive I/O demands. Figure 2.1 gives
some examples of typical peripheral devices in use on personal computers and
workstations. These devices create tremendous data throughput demands. While
the current generation of processors can handle the data pumped out by these
devices, there remains the problem of getting that data moved between processor
and peripheral. Strategies here include caching and buffering schemes plus the
use of higher-speed interconnection buses and more elaborate structures of buses.
In addition, the use of multiple-processor configurations can aid in satisfying I/O
demands.
The key in all this is balance. Designers constantly strive to balance the
throughput and processing demands of the processor components, main memory,
I/O devices, and the interconnection structures. This design must constantly be
rethought to cope with two constantly evolving factors:
• The rate at which performance is changing in the various technology areas
(processor, buses, memory, peripherals) differs greatly from one type of
element to another.
• New applications and new peripheral devices constantly change the nature of
the demand on the system in terms of typical instruction profile and the data
access patterns.
Thus, computer design is a constantly evolving art form. This book attempts to
present the fundamentals on which this art form is based and to present a survey of
the current state of that art.
#6 As designers wrestle with the challenge of balancing processor performance with that
of main memory and other computer components, the need to increase processor
speed remains. There are three approaches to achieving increased processor speed:
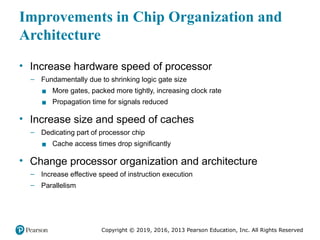
• Increase the hardware speed of the processor. This increase is fundamentally
due to shrinking the size of the logic gates on the processor chip, so that more
gates can be packed together more tightly and to increasing the clock rate.
With gates closer together, the propagation time for signals is significantly
reduced, enabling a speeding up of the processor. An increase in clock rate
means that individual operations are executed more rapidly.
• Increase the size and speed of caches that are interposed between the processor
and main memory. In particular, by dedicating a portion of the processor
chip itself to the cache, cache access times drop significantly.
• Make changes to the processor organization and architecture that increase the
effective speed of instruction execution. Typically, this involves using parallelism
in one form or another.
#7 Traditionally, the dominant factor in performance gains has been in increases
in clock speed due and logic density. However, as clock speed and logic density
increase, a number of obstacles become more significant [INTE04b]:
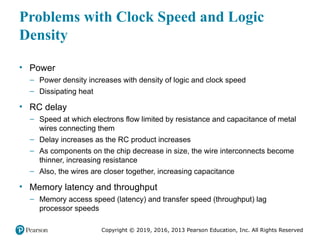
• Power: As the density of logic and the clock speed on a chip increase, so does
the power density (Watts/cm2). The difficulty of dissipating the heat generated
on high-density, high-speed chips is becoming a serious design issue [GIBB04,
BORK03].
• RC delay: The speed at which electrons can flow on a chip between transistors
is limited by the resistance and capacitance of the metal wires connecting
them; specifically, delay increases as the RC product increases. As components
on the chip decrease in size, the wire interconnects become thinner, increasing
resistance. Also, the wires are closer together, increasing capacitance.
• Memory latency and throughput: Memory access speed(latency) and transfer speed (throughput)
lag processor speeds, as previously discussed.
Thus, there will be more emphasis on organization and architectural approaches
to improving performance. These techniques are discussed in later chapters of the book.
#8 Beginning in the late 1980s, and continuing for about 15 years, two main
strategies have been used to increase performance beyond what can be achieved
simply by increasing clock speed. First, there has been an increase in cache capacity.
There are now typically two or three levels of cache between the processor and
main memory. As chip density has increased, more of the cache memory has been
incorporated on the chip, enabling faster cache access. For example, the original
Pentium chip devoted about 10% of on-chip area to caches. Contemporary chips
devote over half of the chip area to caches. And, typically, about three-quarters of the
other half is for pipeline-related control and buffering.
Second, the instruction execution logic within a processor has become increasingly
complex to enable parallel execution of instructions within the processor. Two
noteworthy design approaches have been pipelining and superscalar. A pipeline
works much as an assembly line in a manufacturing plant enabling different stages
of execution of different instructions to occur at the same time along the pipeline. A
superscalar approach in essence allows multiple pipelines within a single processor
so that instructions that do not depend on one another can be executed in parallel.
By the mid to late 90s, both of these approaches were reaching a point of
diminishing returns. The internal organization of contemporary processors is
exceedingly complex and is able to squeeze a great deal of parallelism out of the
instruction stream. It seems likely that further significant increases in this direction
will be relatively modest [GIBB04]. With three levels of cache on the processor
chip, each level providing substantial capacity, it also seems that the benefits from
the cache are reaching a limit.
However, simply relying on increasing clock rate for increased performance
runs into the power dissipation problem already referred to. The faster the clock
rate, the greater the amount of power to be dissipated, and some fundamental physical
limits are being reached.
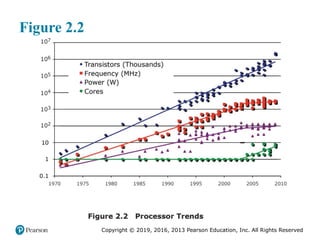
Figure 2.2 illustrates the concepts we have been discussing. The top line
shows that, as per Moore’s Law, the number of transistors on a single chip continues
to grow exponentially. Meanwhile, the clock speed has leveled off, in order
to prevent a further rise in power. To continue to increase performance, designers
have had to find ways of exploiting the growing number of transistors other than
simply building a more complex processor. The response in recent years has been
the development of the multicore computer chip.
#9 With all of the difficulties cited in the preceding section in mind, designers
have turned to a fundamentally new approach to improving performance: placing
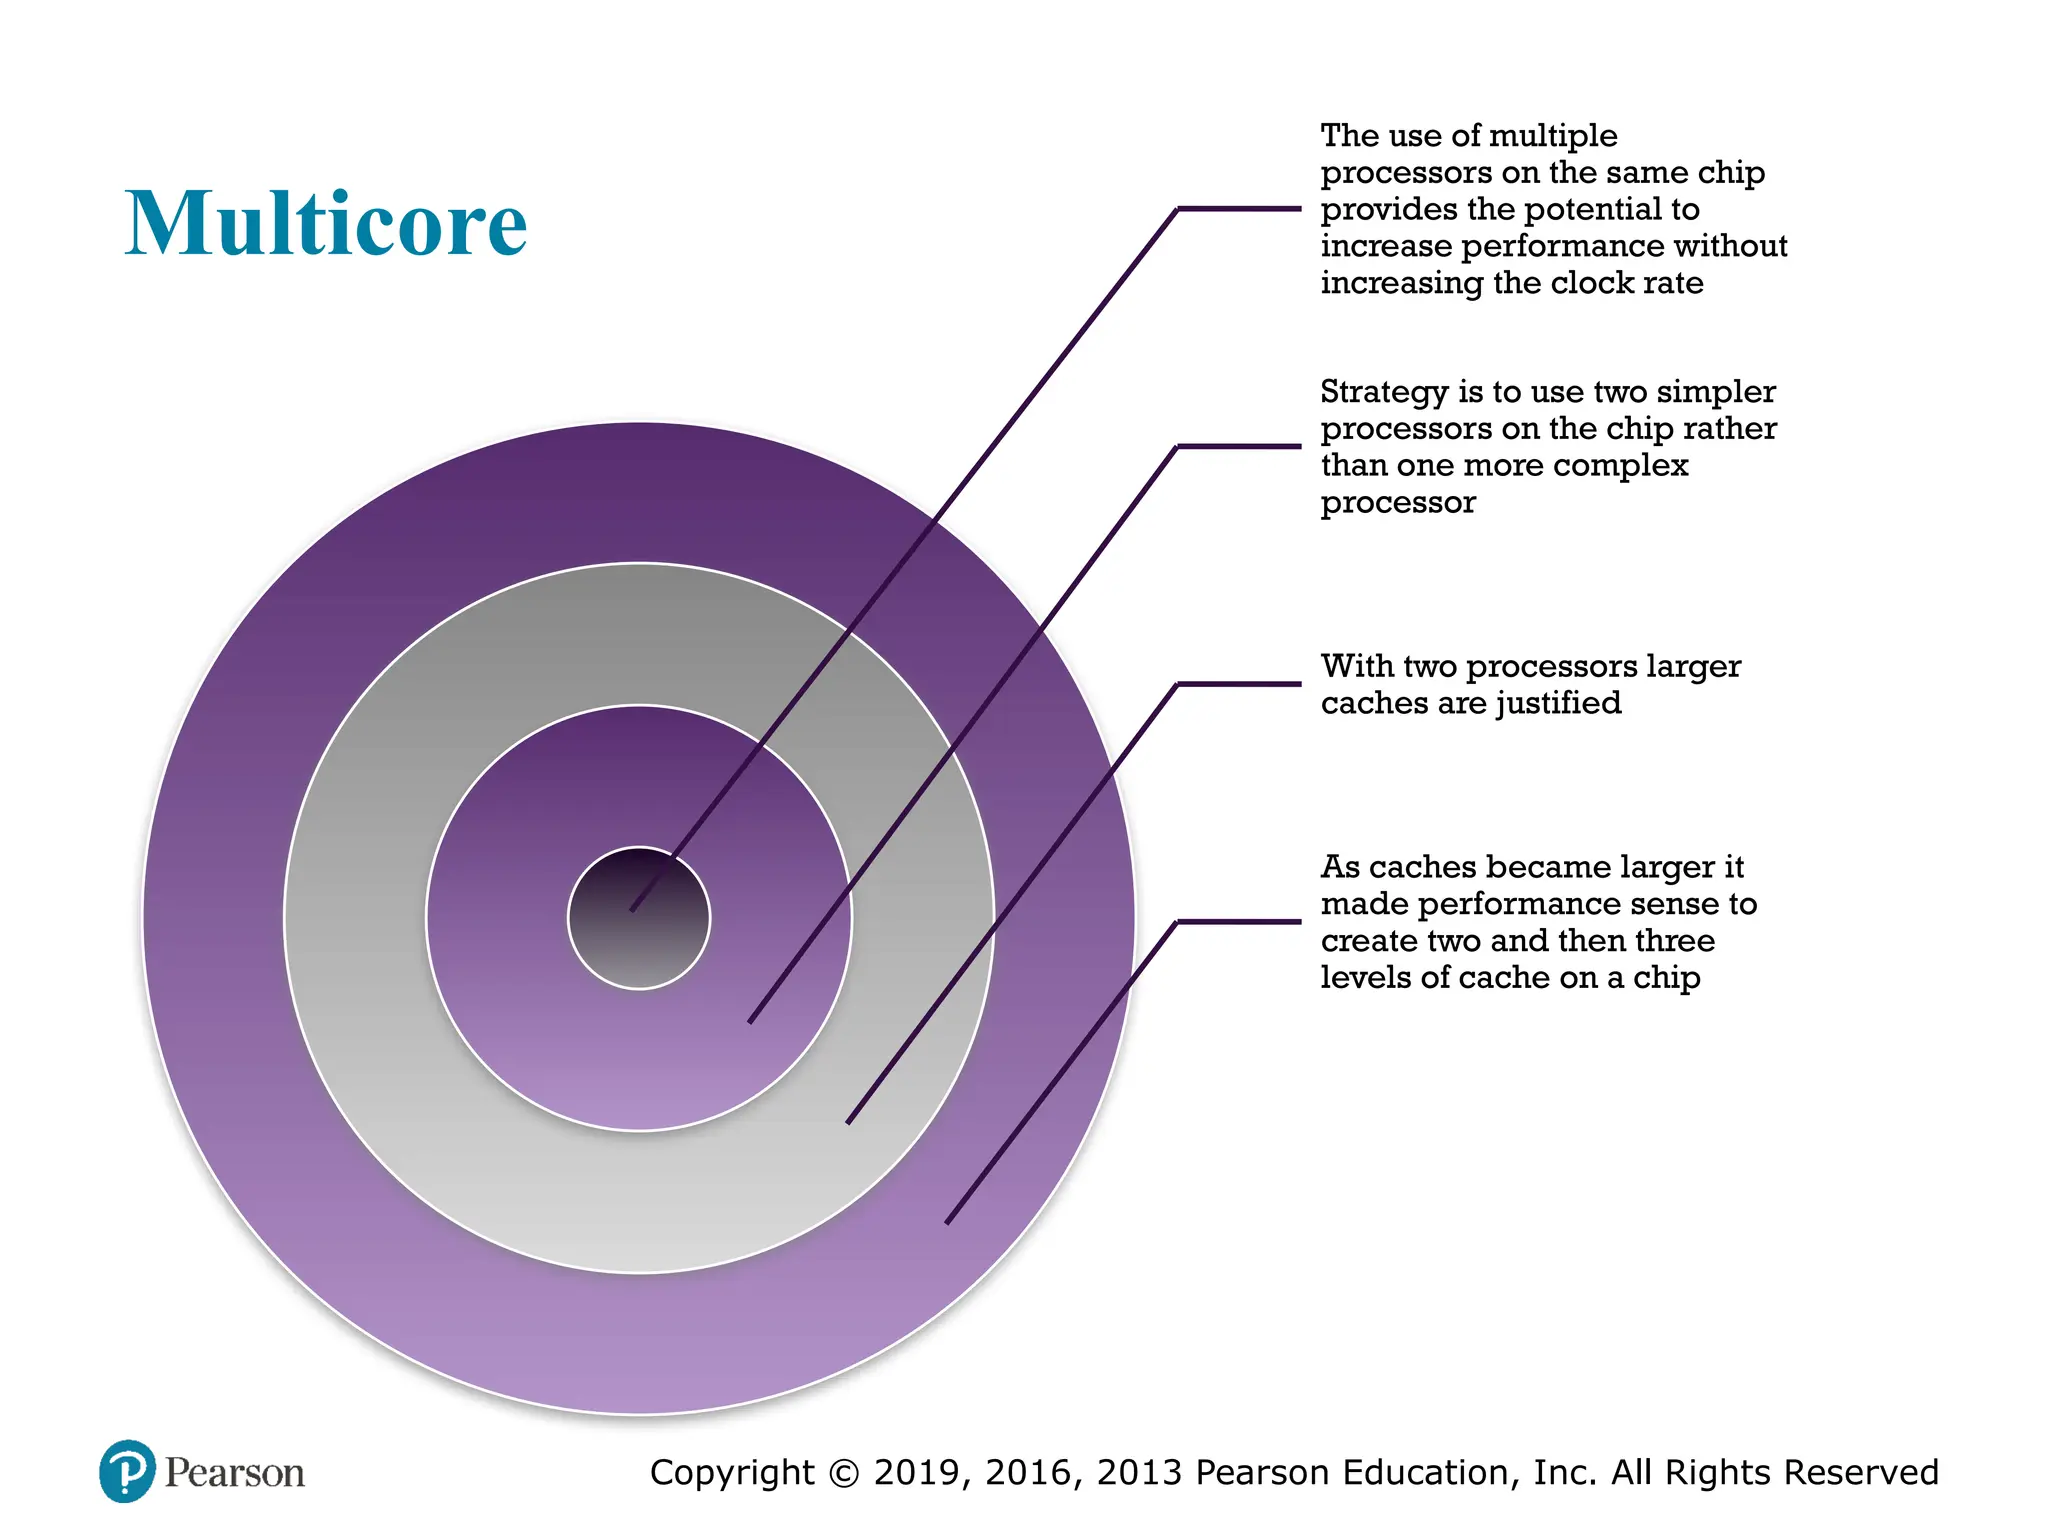
multiple processors on the same chip, with a large shared cache. The use of multiple
processors on the same chip, also referred to as multiple cores, or multicore,
provides the potential to increase performance without increasing the clock rate.
Studies indicate that, within a processor, the increase in performance is roughly
proportional to the square root of the increase in complexity [BORK03]. But if the
software can support the effective use of multiple processors, then doubling the
number of processors almost doubles performance. Thus, the strategy is to use two
simpler processors on the chip rather than one more complex processor.
In addition, with two processors, larger caches are justified. This is important
because the power consumption of memory logic on a chip is much less than that of
processing logic.
As the logic density on chips continues to rise, the trend to both more cores
and more cache on a single chip continues. Two-core chips were quickly followed
by four-core chips, then 8, then 16, and so on. As the caches became larger, it made
performance sense to create two and then three levels of cache on a chip, with the
first-level cache dedicated to an individual processor and levels two and three being
shared by all the processors. It is now common for the second-level
cache to also be private to each core.
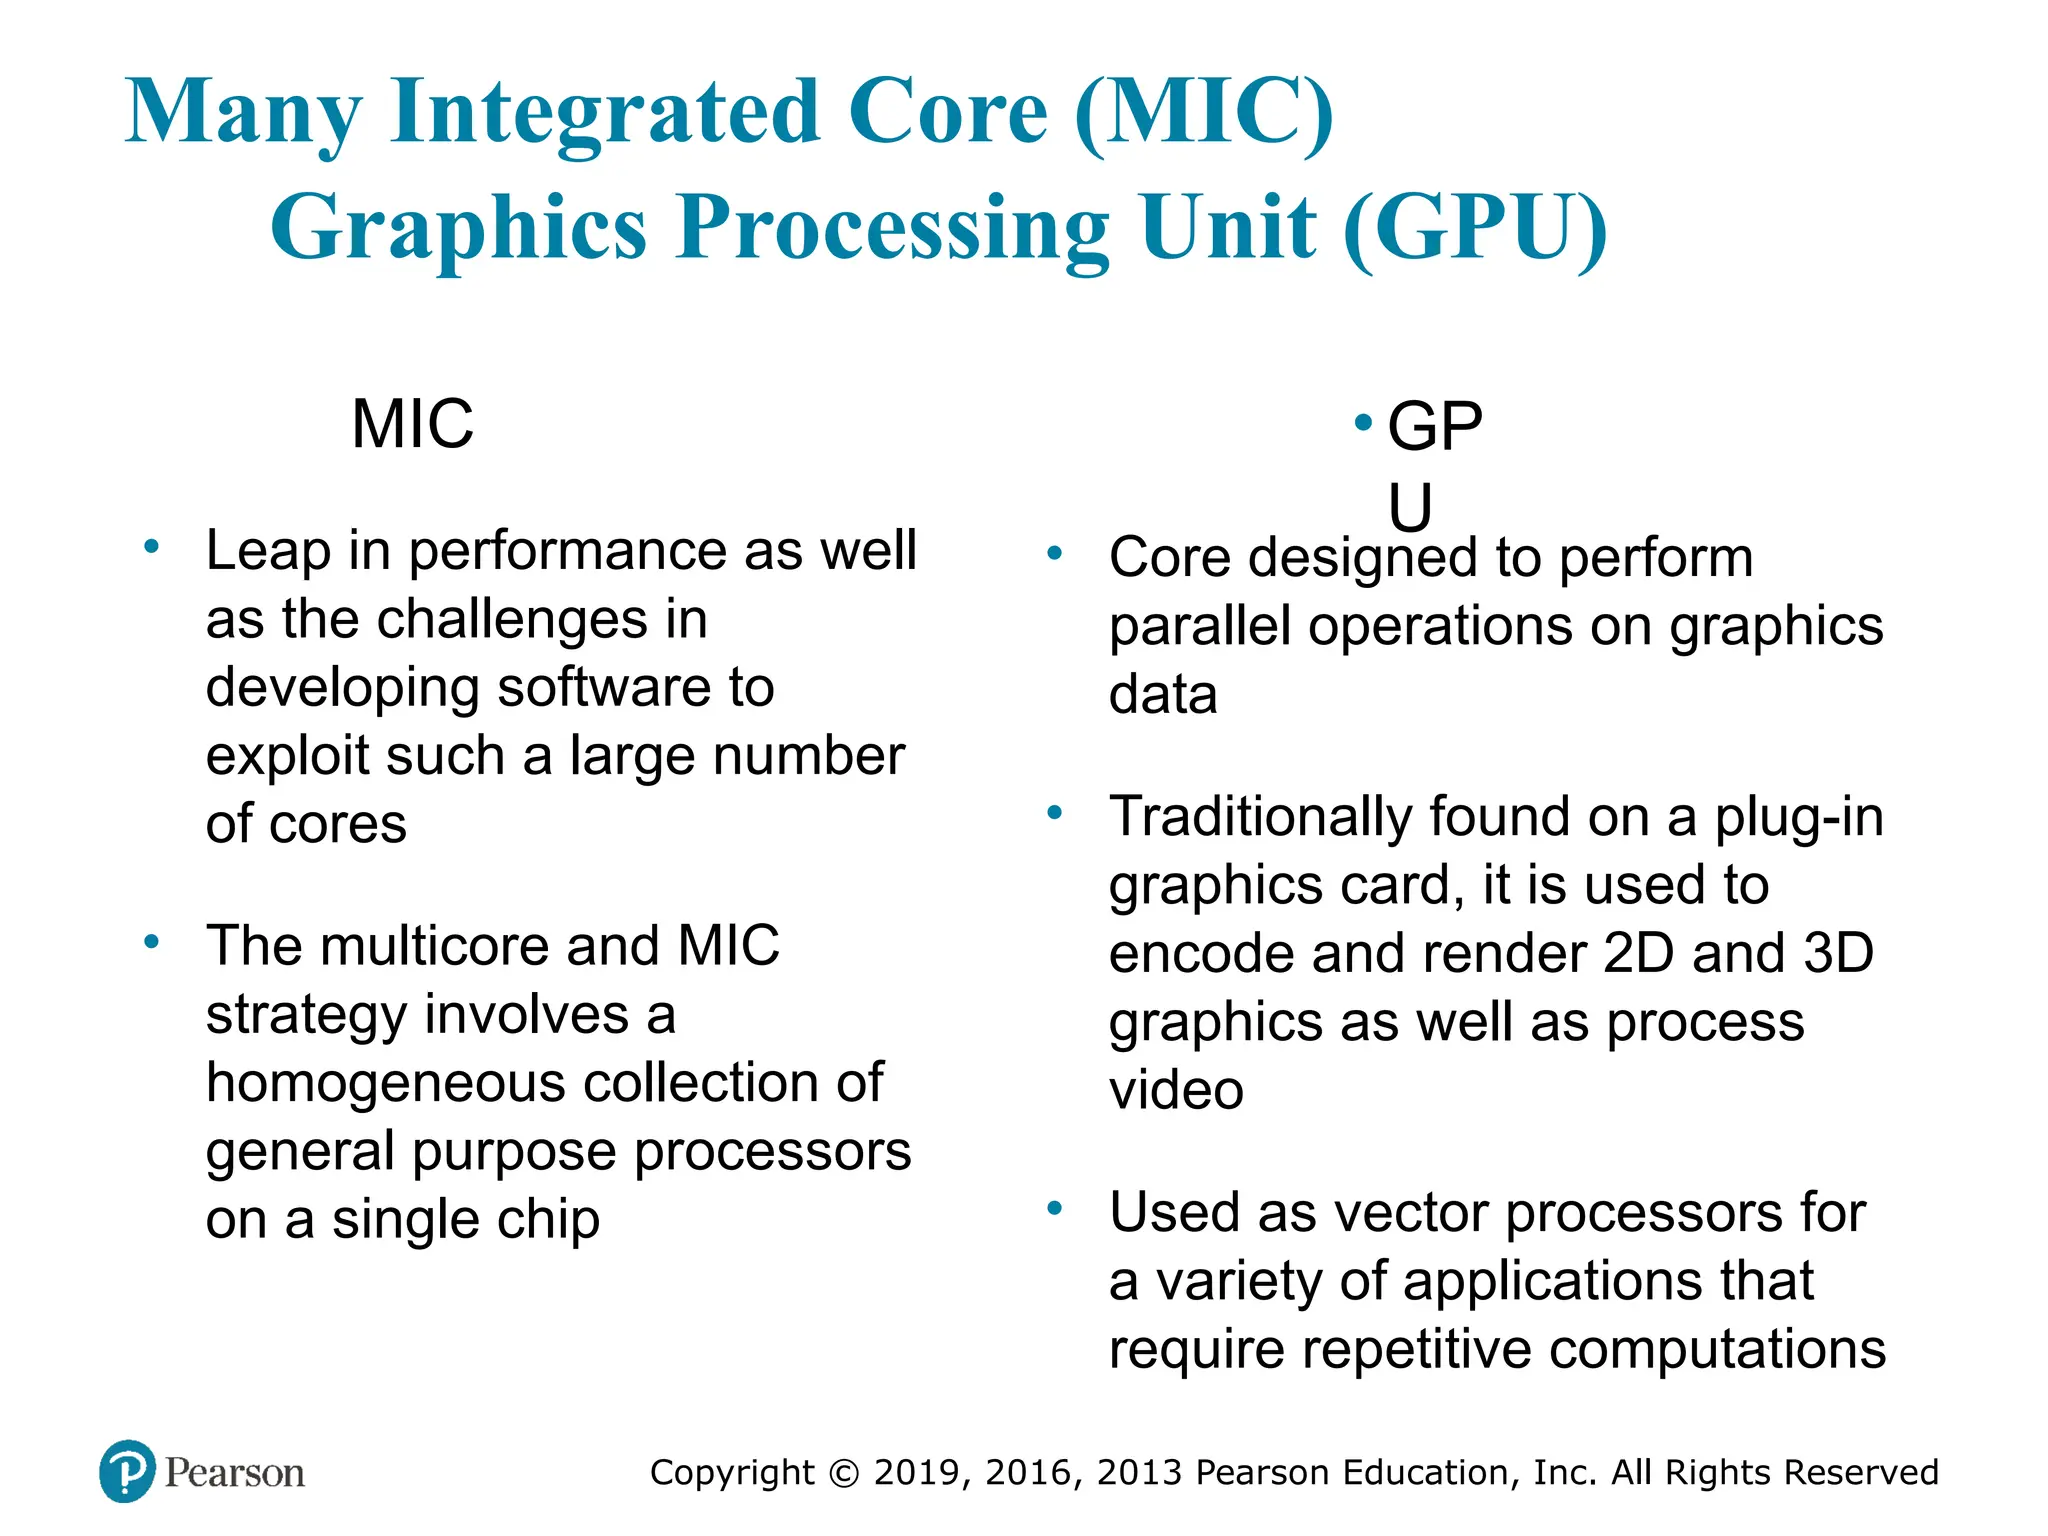
#10 Chip manufacturers are now in the process of making a huge leap forward
in the number of cores per chip, with more than 50 cores per chip. The leap in
performance as well as the challenges in developing software to exploit such a large
number of cores have led to the introduction of a new term: many integrated core
(MIC).
The multicore and MIC strategy involves a homogeneous collection of
general-purpose processors on a single chip. At the same time, chip manufacturers
are pursuing another design option: a chip with multiple general-purpose processors
plus graphics processing units (GPUs) and specialized cores for video processing
and other tasks. In broad terms, a GPU is a core designed to perform parallel
operations on graphics data. Traditionally found on a plug-in graphics card (display
adapter), it is used to encode and render 2D and 3D graphics as well as process
video.
Since GPUs perform parallel operations on multiple sets of data, they are
increasingly being used as vector processors for a variety of applications that
require repetitive computations. This blurs the line between the GPU and the
CPU [AROR12, FATA08, PROP11]. When a broad range of applications are supported
by such a processor, the term general-purpose computing on GPUs (GPGPU)
is used.
We explore design characteristics of multicore computers in Chapter 18 and
GPGPUs in Chapter 19.
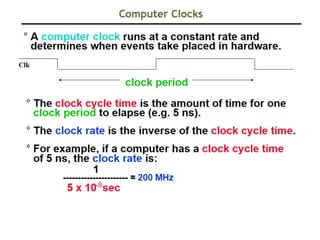
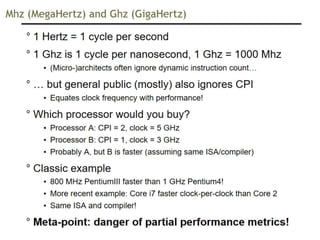
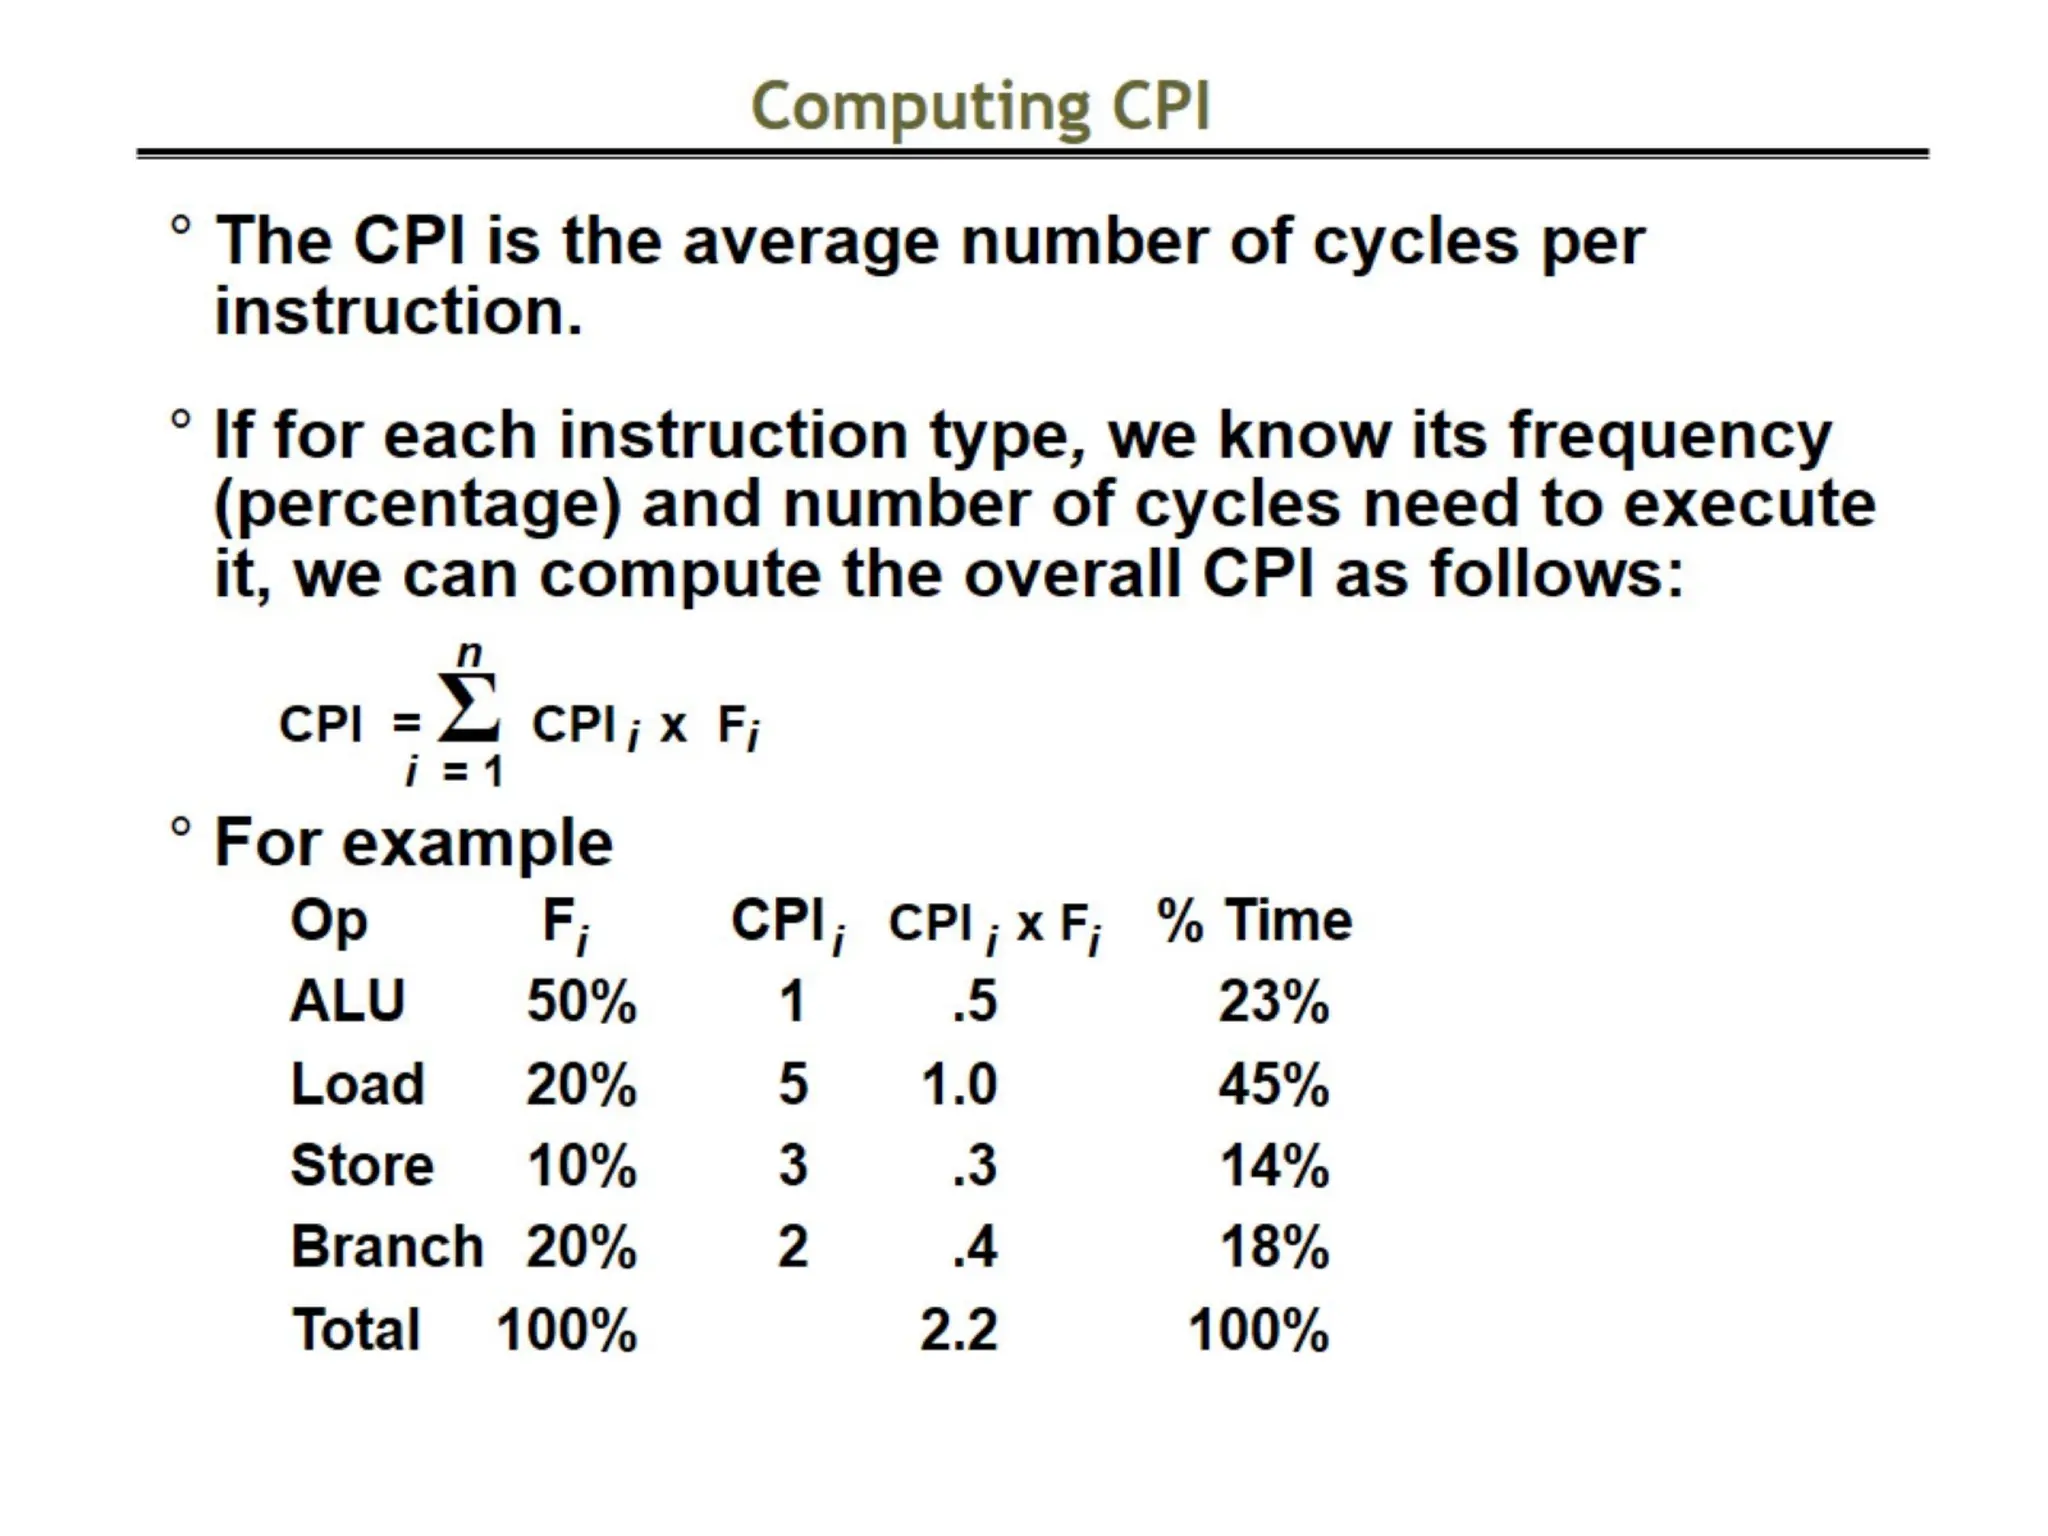
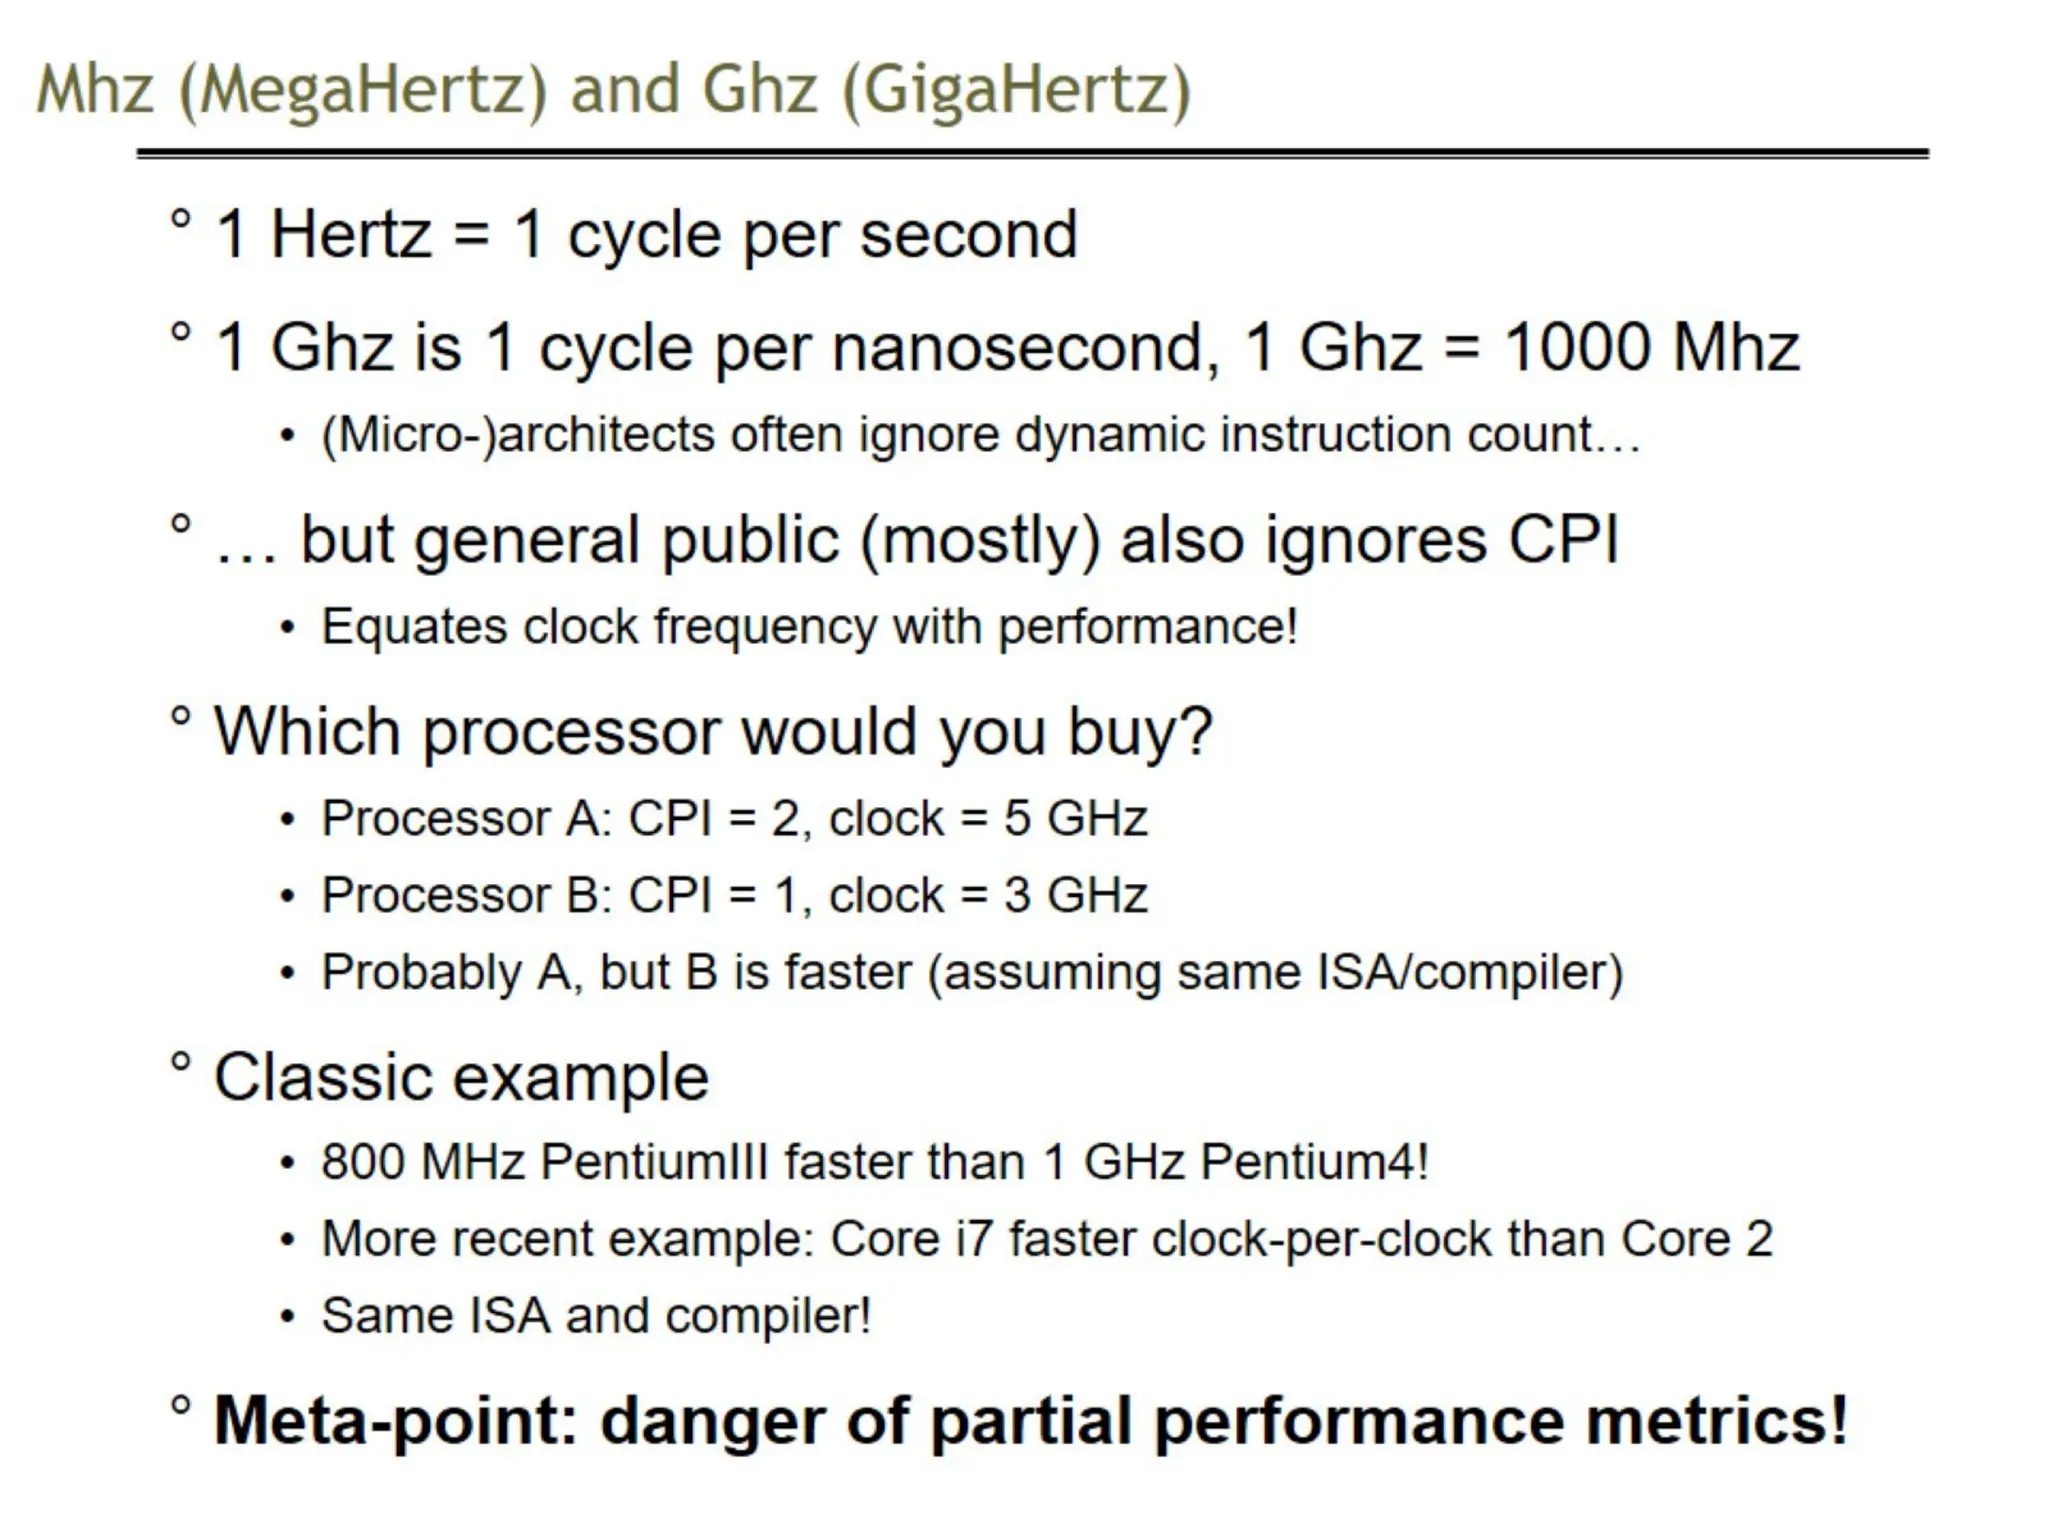
#11 Operations performed by a processor, such as fetching an
instruction, decoding the instruction, performing an arithmetic operation, and so
on, are governed by a system clock. Typically, all operations begin with the pulse of
the clock. Thus, at the most fundamental level, the speed of a processor is dictated
by the pulse frequency produced by the clock, measured in cycles per second, or
Hertz (Hz).
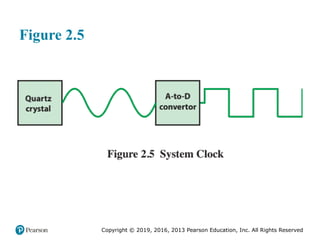
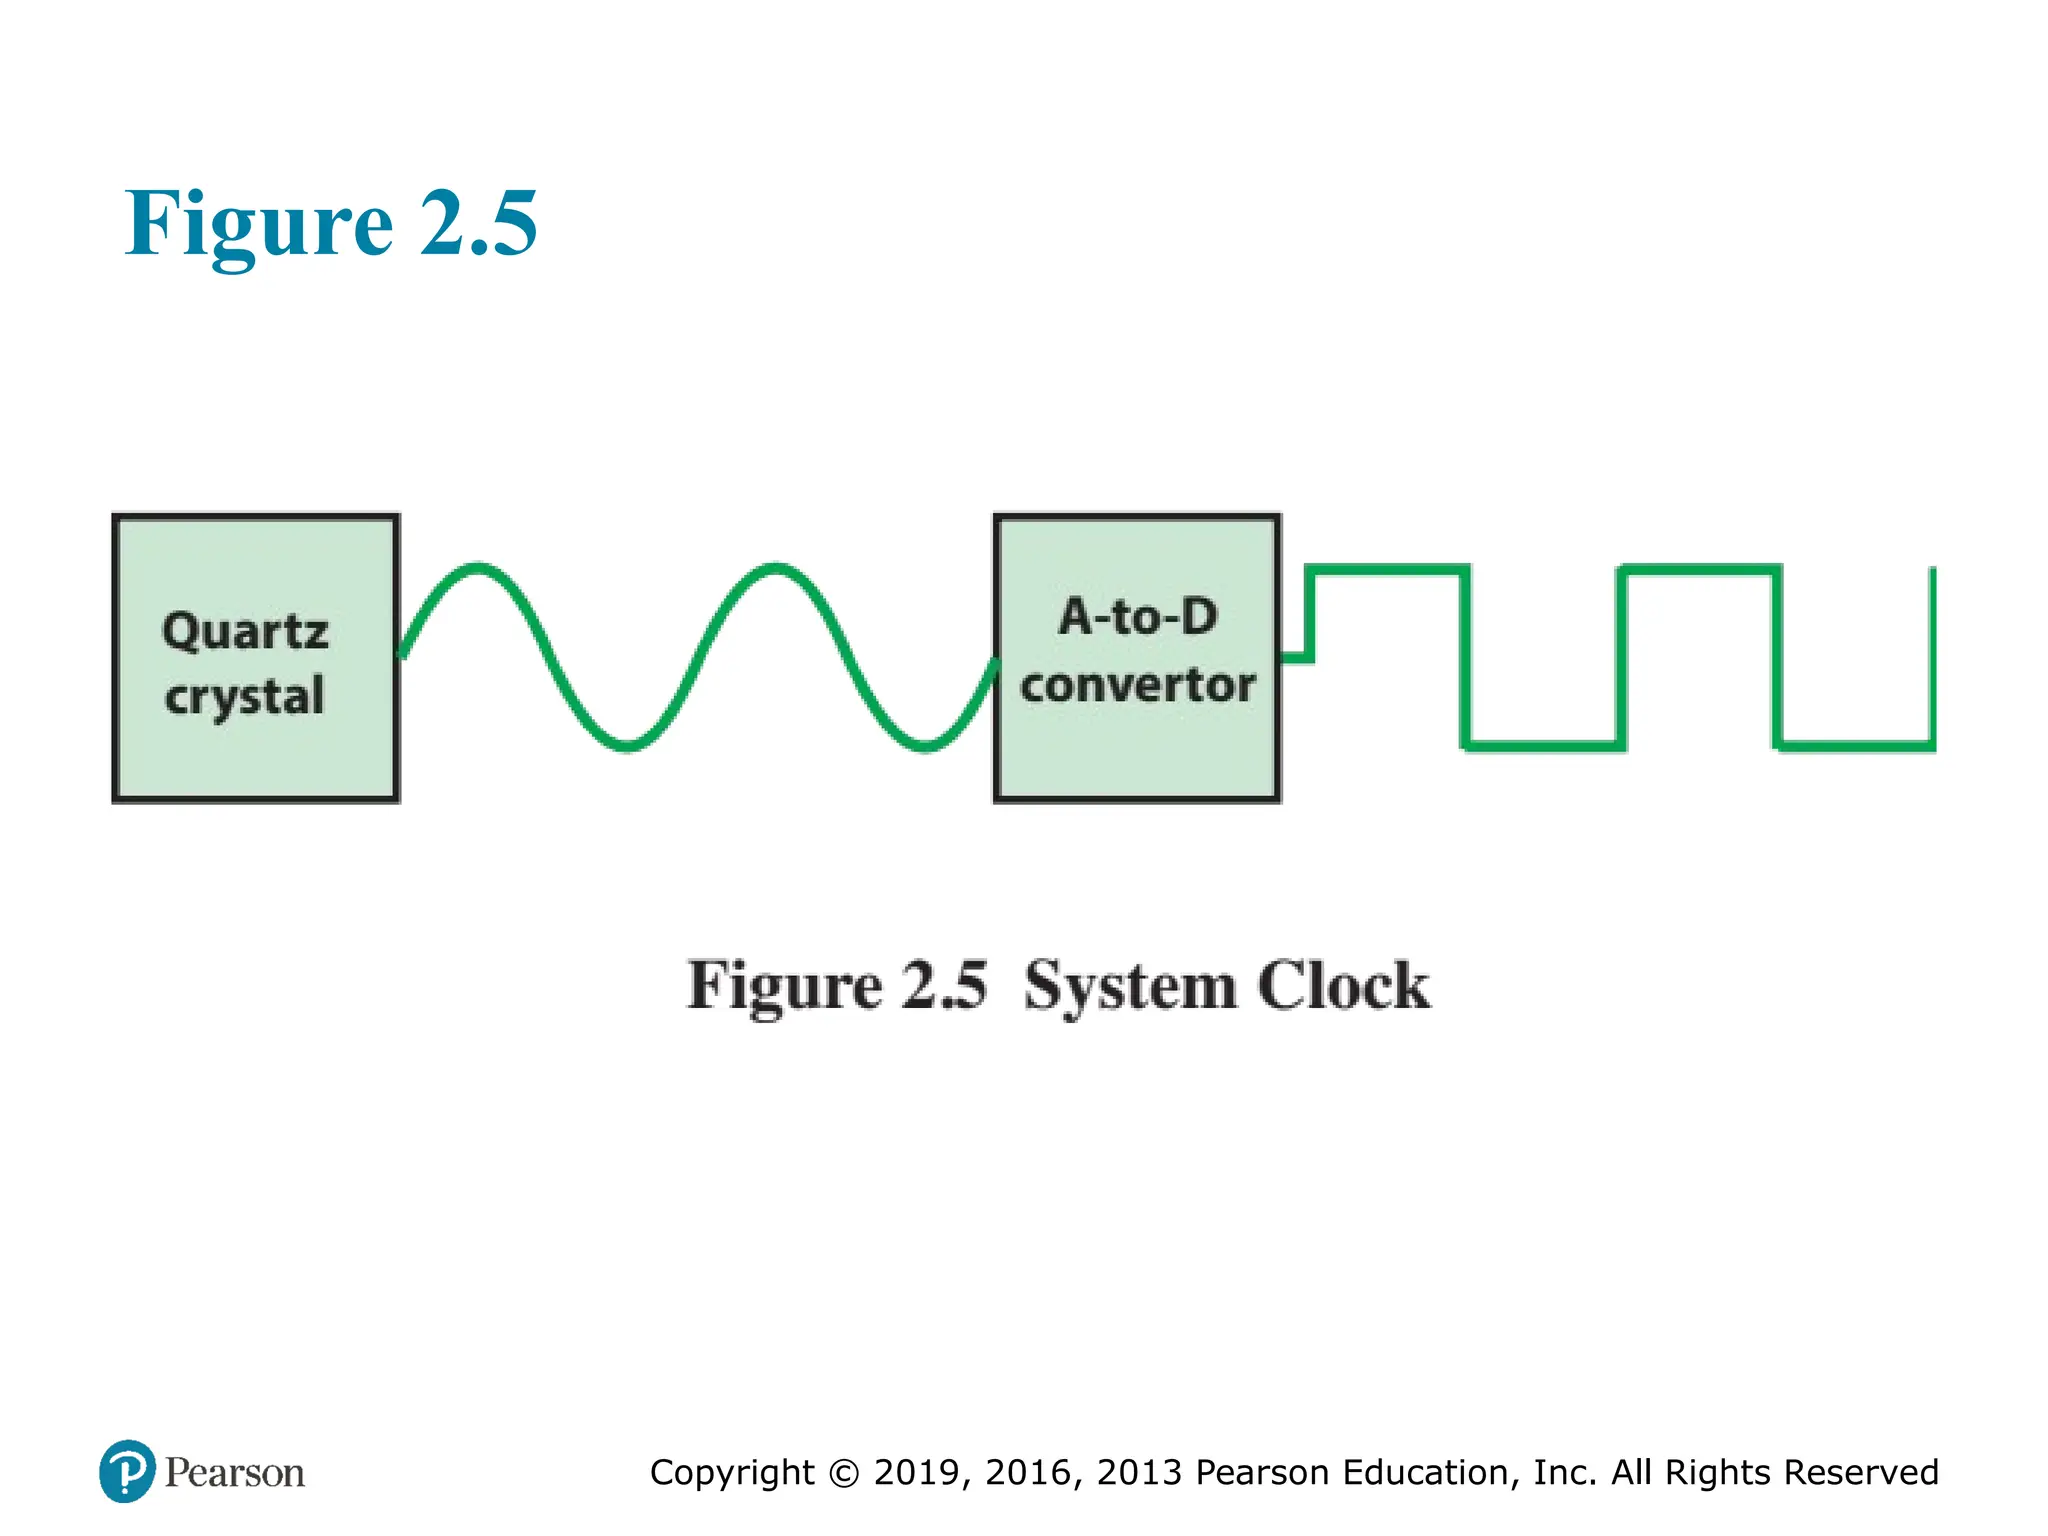
Typically, clock signals are generated by a quartz crystal, which generates a
constant sine wave while power is applied. This wave is converted into a digital
voltage pulse stream that is provided in a constant flow to the processor circuitry
(Figure 2.5). For example, a 1-GHz processor receives 1 billion pulses per second.
The rate of pulses is known as the clock rate, or clock speed. One increment, or
pulse, of the clock is referred to as a clock cycle, or a clock tick. The time between
pulses is the cycle time.
The clock rate is not arbitrary, but must be appropriate for the physical layout
of the processor. Actions in the processor require signals to be sent from one processor
element to another. When a signal is placed on a line inside the processor, it
takes some finite amount of time for the voltage levels to settle down so that an
accurate value (1 or 0) is available. Furthermore, depending on the physical layout
of the processor circuits, some signals may change more rapidly than others. Thus,
operations must be synchronized and paced so that the proper electrical signal
(voltage) values are available for each operation.
The execution of an instruction involves a number of discrete steps, such
as fetching the instruction from memory, decoding the various portions of the
instruction, loading and storing data, and performing arithmetic and logical operations.
Thus, most instructions on most processors require multiple clock cycles to
complete. Some instructions may take only a few cycles, while others require dozens.
In addition, when pipelining is used, multiple instructions are being executed simultaneously.
Thus, a straight comparison of clock speeds on different processors does
not tell the whole story about performance.
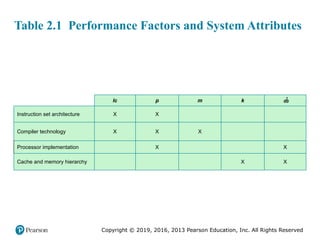
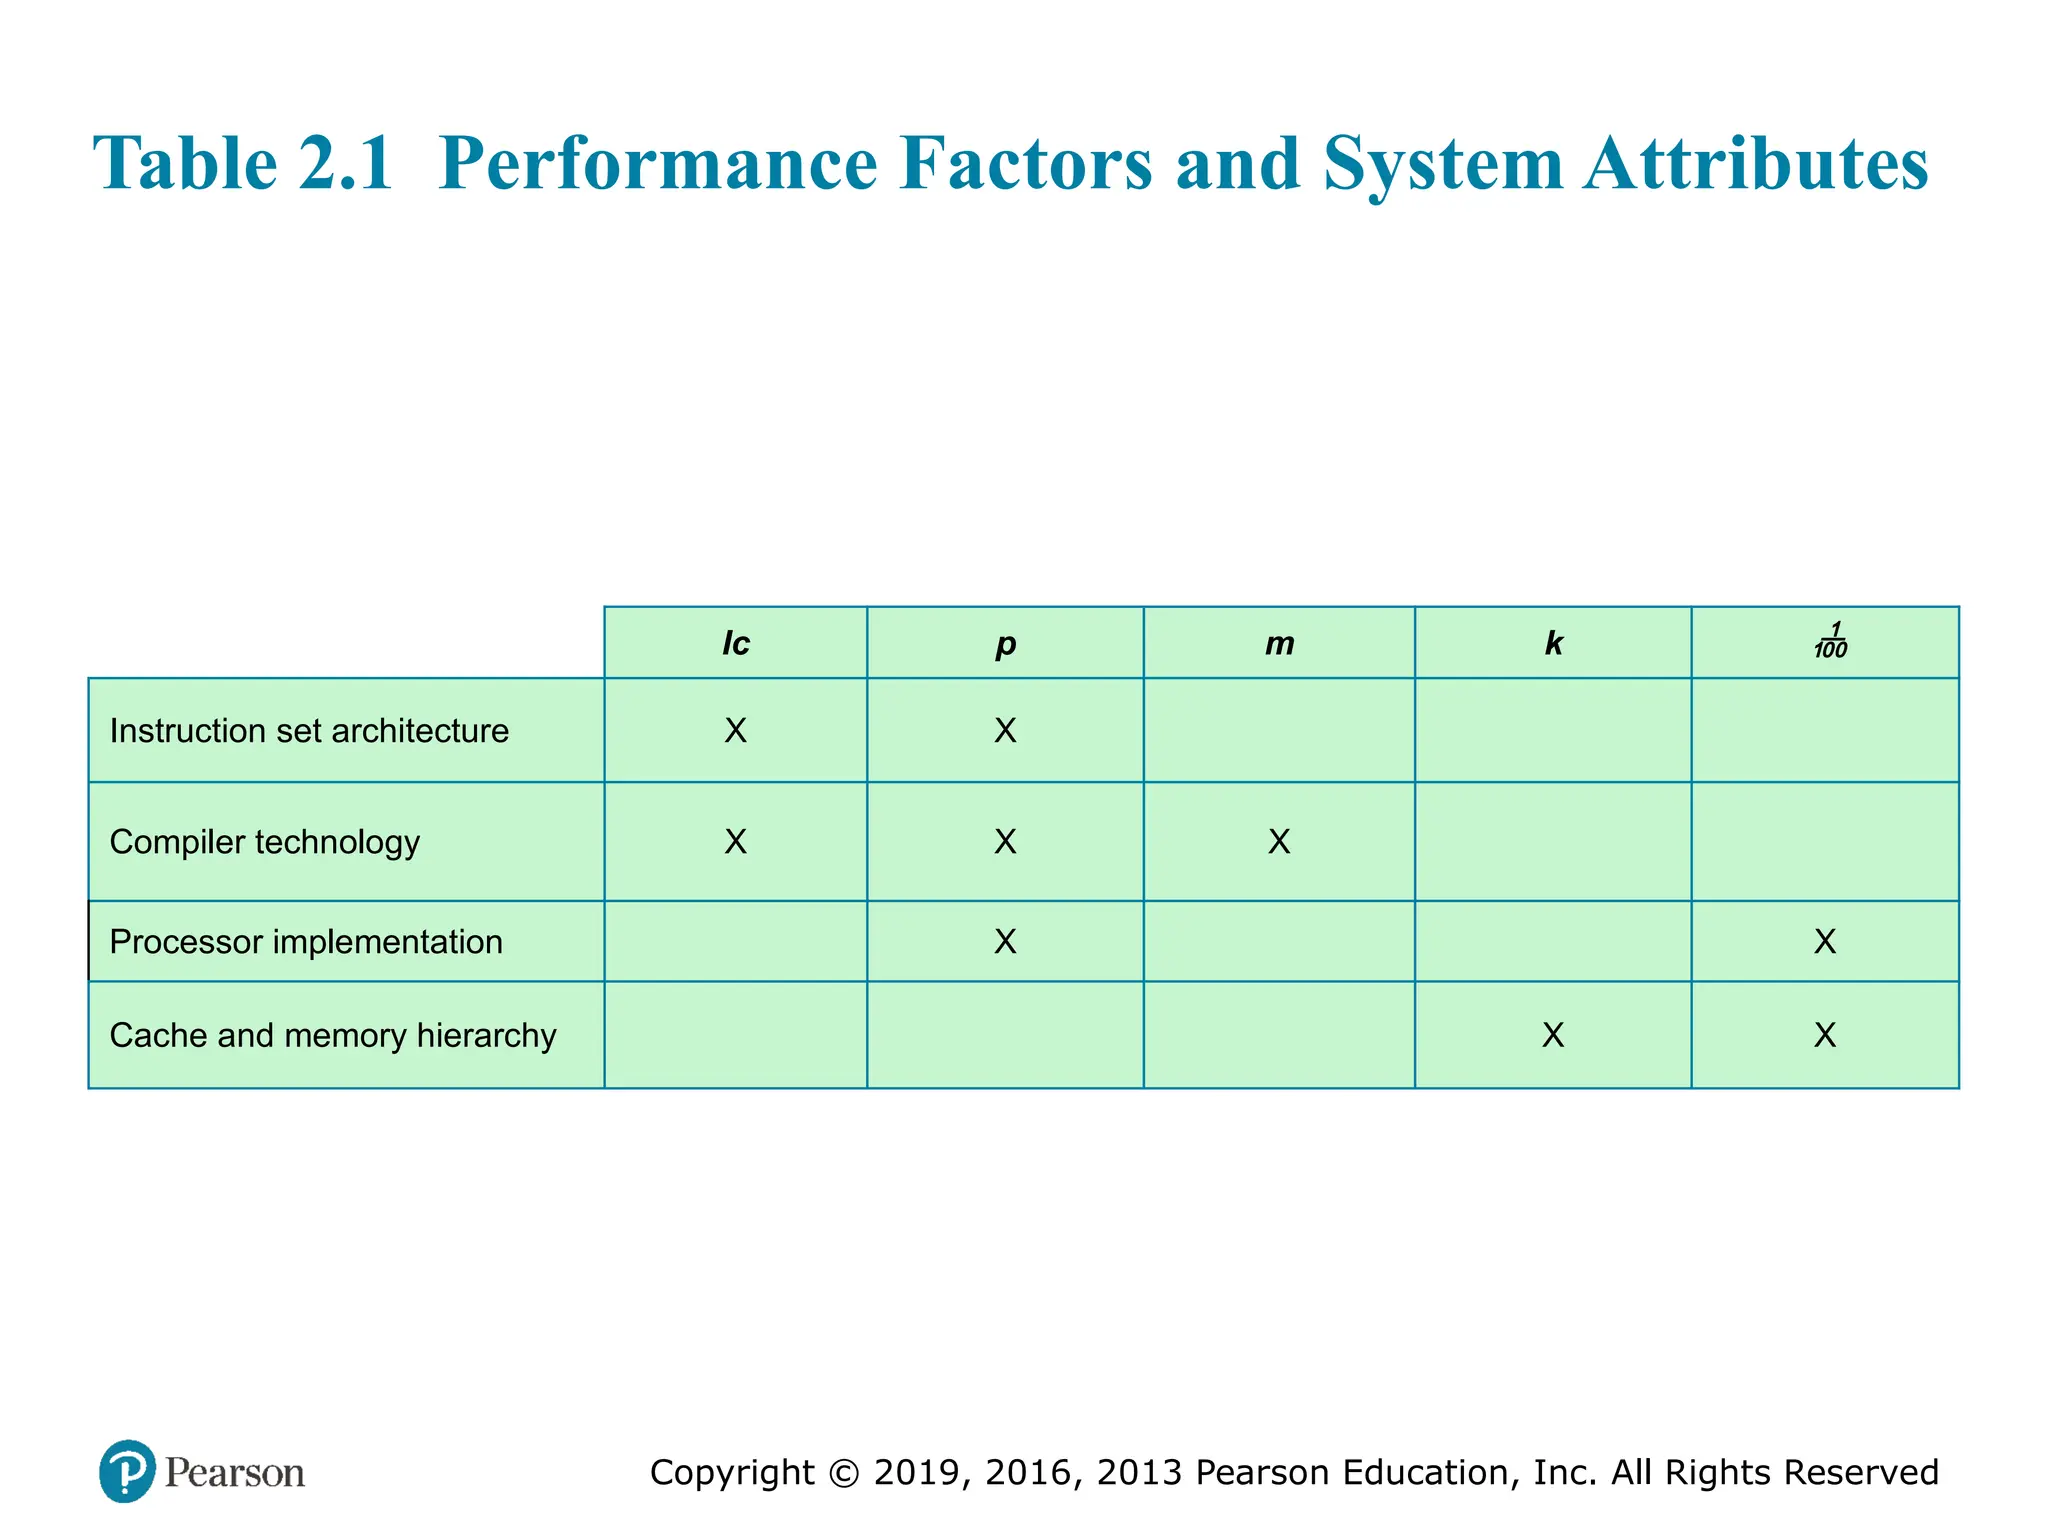
#13 Table 2.1 is a matrix in which one dimension shows the five
performance factors and the other dimension shows the four system attributes. An
X in a cell indicates a system attribute that affects a performance factor.
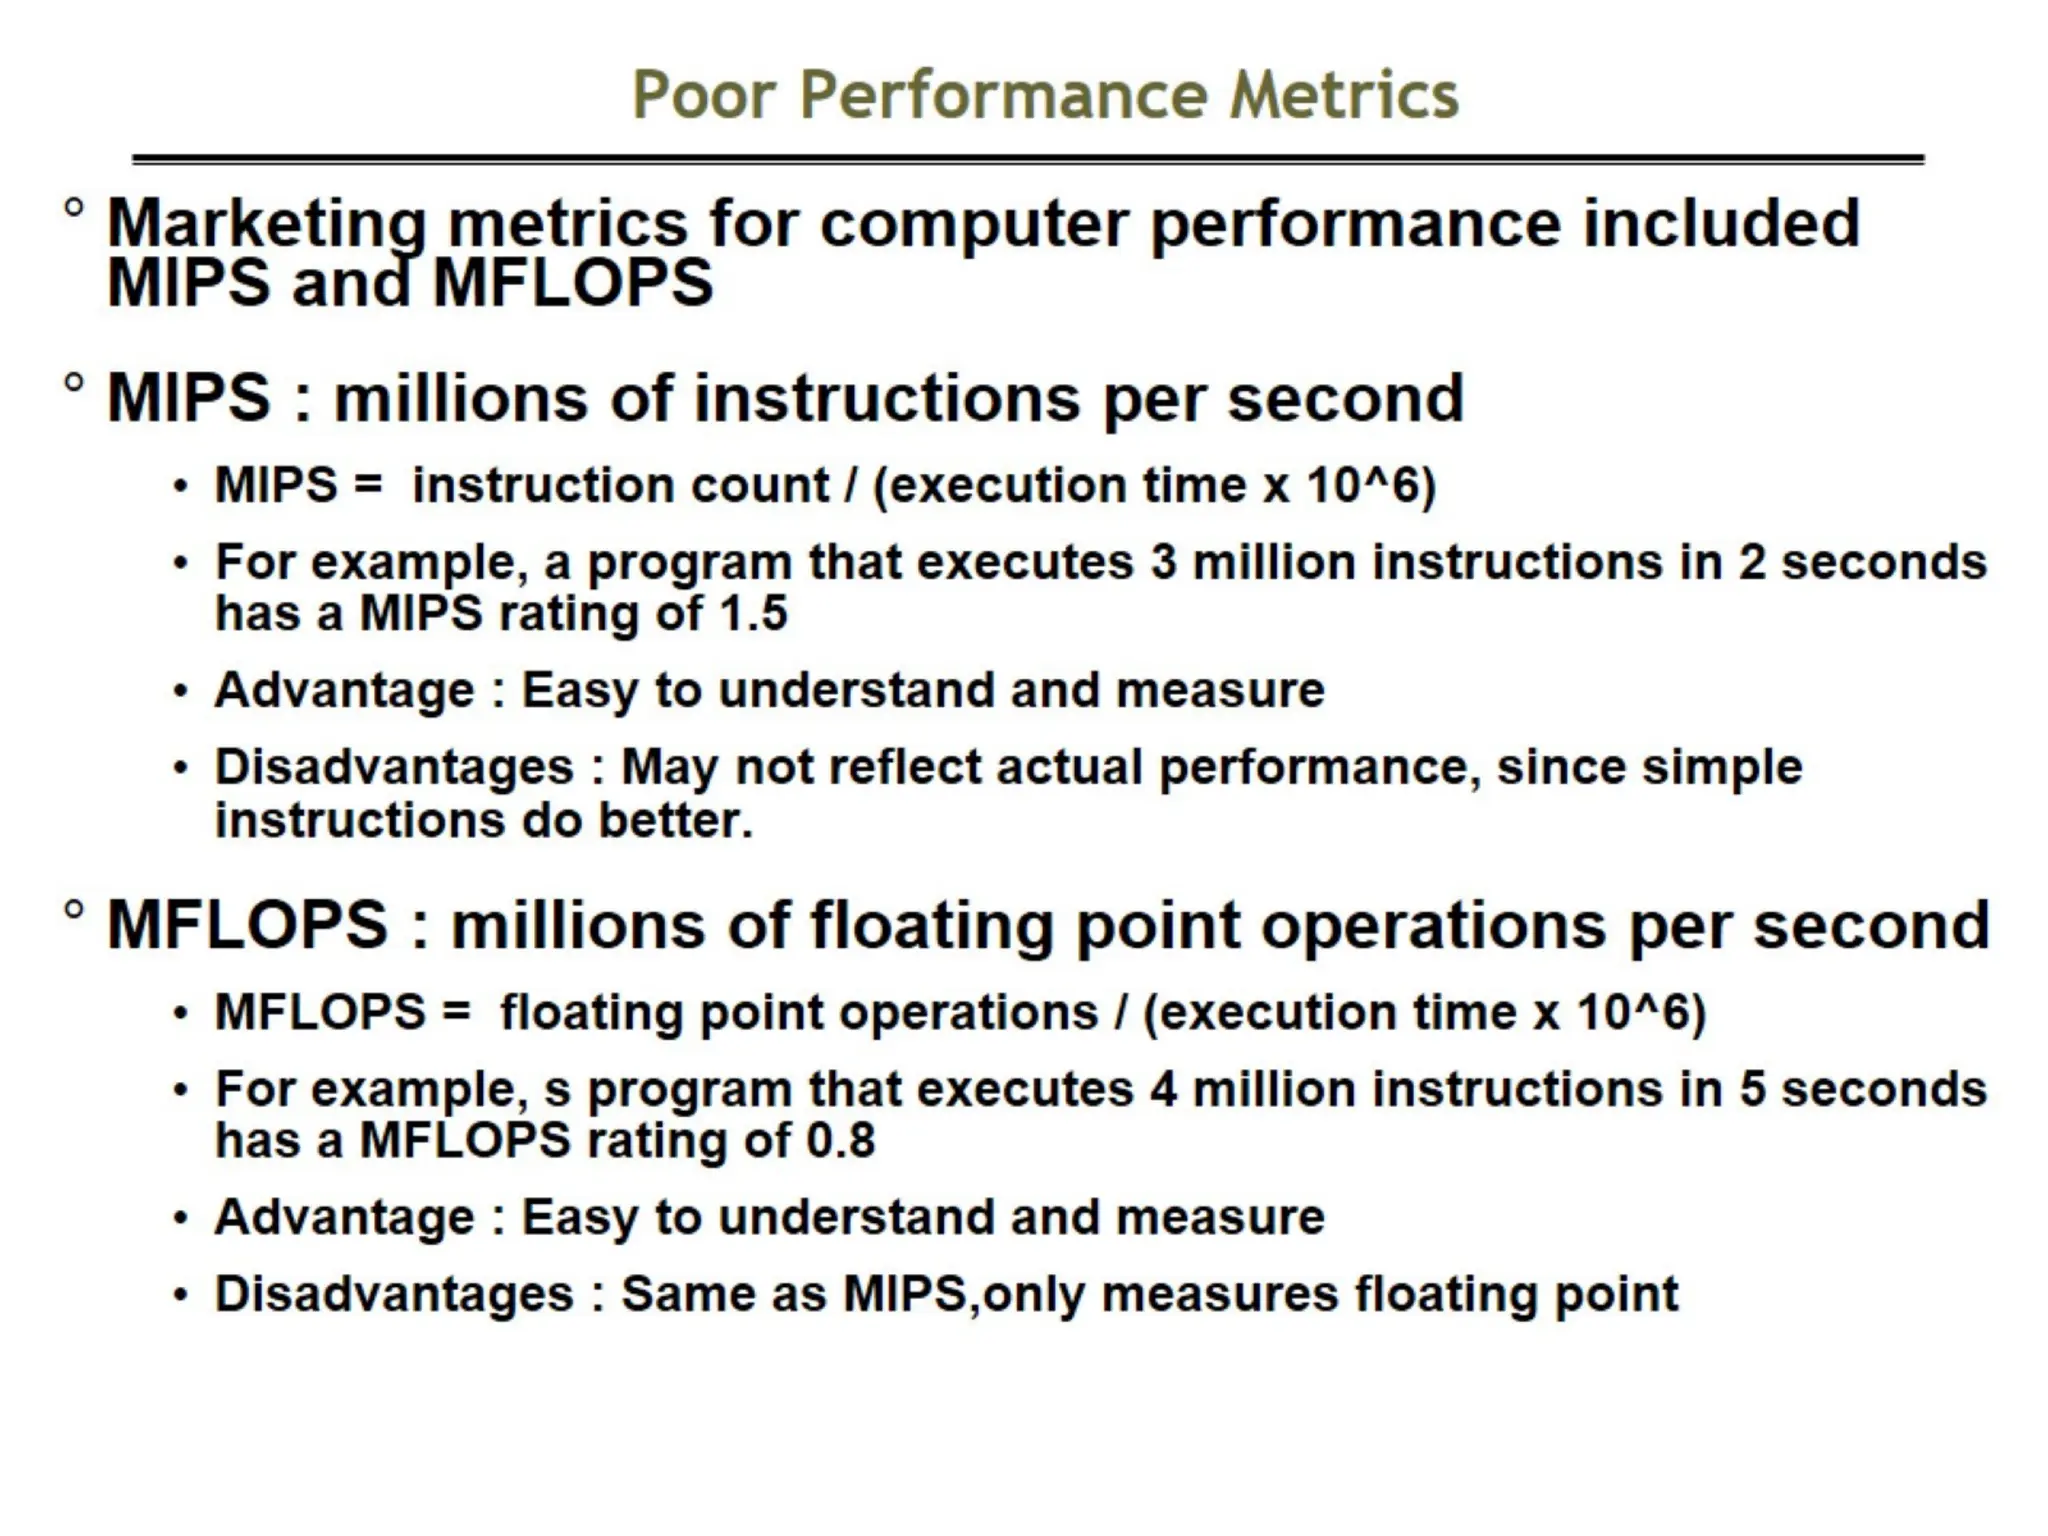
A common measure of performance for a processor is the rate at which
instructions are executed, expressed as millions of instructions per second (MIPS),
referred to as the MIPS rate.
Another common performance measure deals only with floating-point instructions.
These are common in many scientific and game applications. Floating-point
performance is expressed as millions of floating-point operations per second
(MFLOPS).
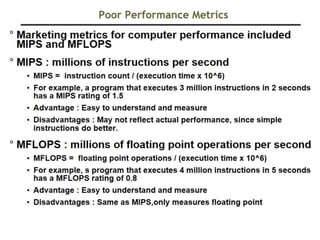
#19 Measures such as MIPS and MFLOPS have proven inadequate to evaluating the performance
of processors. Because of differences in instruction sets, the instruction execution
rate is not a valid means of comparing the performance of different architectures.
Another consideration is that the performance of a given processor on a given
program may not be useful in determining how that processor will perform on a
very different type of application. Accordingly, beginning in the late 1980s and
early 1990s, industry and academic interest shifted to measuring the performance of
systems using a set of benchmark programs. The same set of programs can be run on
different machines and the execution times compared. Benchmarks provide guidance
to customers trying to decide which system to buy and can be useful to vendors
and designers in determining how to design systems to meet benchmark goals.
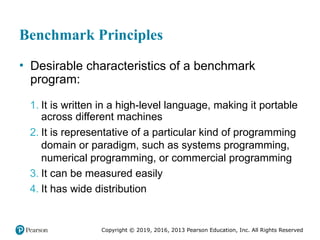
[WEIC90] lists the following as desirable characteristics of a benchmark program:
1. It is written in a high-level language, making it portable across different machines.
2. It is representative of a particular kind of programming domain or paradigm, such
as systems programming, numerical programming, or commercial programming.
3. It can be measured easily.
4. It has wide distribution.
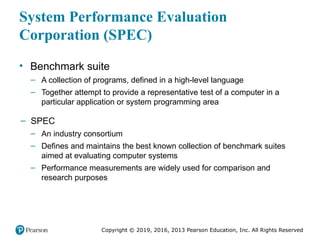
#20 The common need in industry and academic and research
communities for generally accepted computer performance measurements has
led to the development of standardized benchmark suites. A benchmark suite is a
collection of programs, defined in a high-level language, that together attempt to
provide a representative test of a computer in a particular application or system
programming area. The best known such collection of benchmark suites is defined
and maintained by the System Performance Evaluation Corporation (SPEC),
an industry consortium. SPEC performance measurements are widely used for
comparison and research purposes.
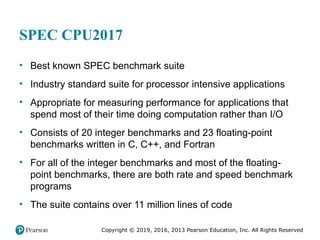
#21 The best known of the SPEC benchmark suites is SPEC CPU2017. This is the
industry standard suite for processor-intensive applications. That is, SPEC CPU2017 is
appropriate for measuring performance for applications that spend most of their time
doing computation rather than I/O.
Other SPEC suites include the following:
■ SPEC Cloud_IaaS: Benchmark addresses the performance of infrastructure-
as-a-service (IaaS) public or private cloud platforms.
■ SPECviewperf: Standard for measuring 3D graphics performance based on
professional applications.
■ SPECwpc: benchmark to measure all key aspects of workstation performance
based on diverse professional applications, including media and entertainment,
product development, life sciences, financial services, and energy.
■ SPECjvm2008: Intended to evaluate performance of the combined hardware
and software aspects of the Java Virtual Machine (JVM) client platform.
■ SPECjbb2015 (Java Business Benchmark): A benchmark for evaluating server-
side Java-based electronic commerce applications.
■ SPECsfs2014: Designed to evaluate the speed and request-handling capabilities
of file servers.
■ SPECvirt_sc2013: Performance evaluation of datacenter servers used in virtualized
server consolidation. Measures the end-to-end performance of all
system components including the hardware, virtualization platform, and the
virtualized guest operating system and application software. The benchmark
supports hardware virtualization, operating system virtualization, and hardware
partitioning schemes.
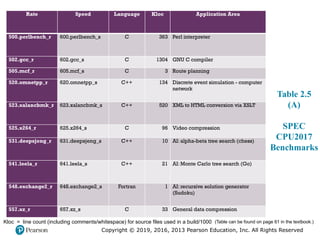
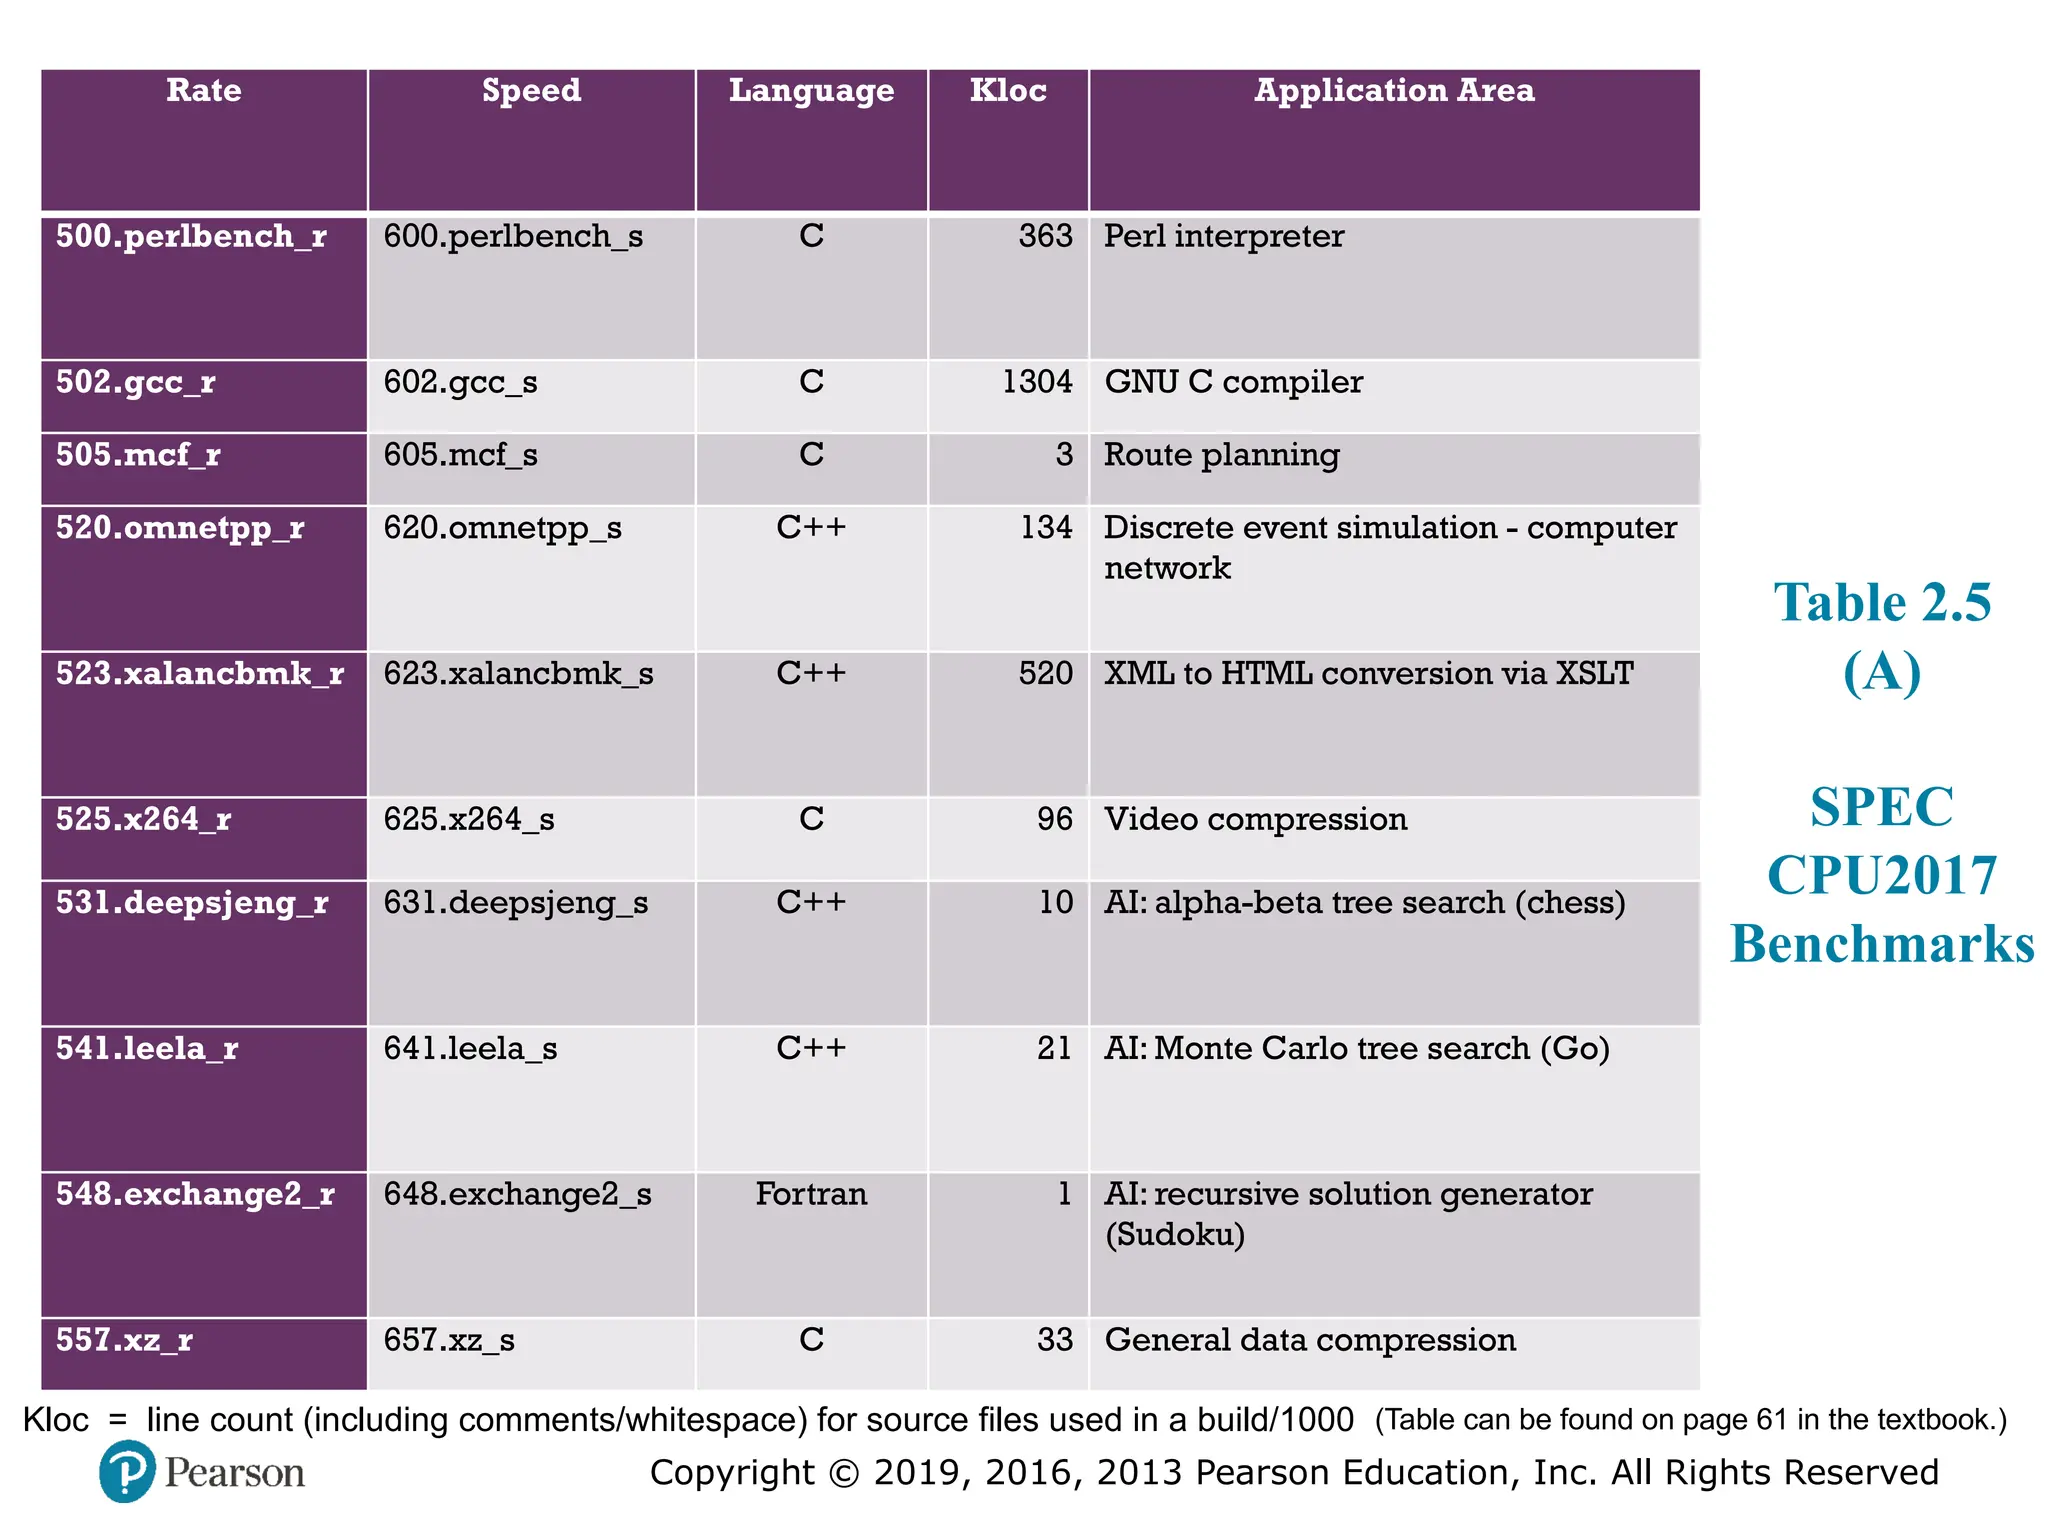
#22 Table 2.5
SPEC CPU2017 Integer Benchmarks
The CPU2017 suite is based on existing applications that have already been
ported to a wide variety of platforms by SPEC industry members. In order to make
the benchmark results reliable and realistic, the CPU2017 benchmarks are drawn
from real-life applications, rather than using artificial loop programs or synthetic
benchmarks. The suite consists of 20 integer benchmarks and 23 floating-point benchmarks
written in C, C++, and Fortran (Table 2.5). For all of the integer benchmarks
and most of the floating-point benchmarks, there are both rate and speed benchmark
programs. The differences between corresponding rate and speed benchmarks
include workload sizes, compile flags, and run rules. The suite contains over 11 million
lines of code. This is the sixth generation of processor-intensive suites from SPEC; the
fifth generation was CPU2006. CPU2017 is designed to provide a contemporary set of
benchmarks that reflect the dramatic changes in workload and performance requirements
in the 11 years since CPU2006 [MOOR17].
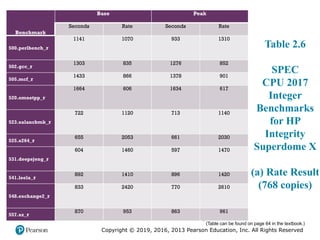
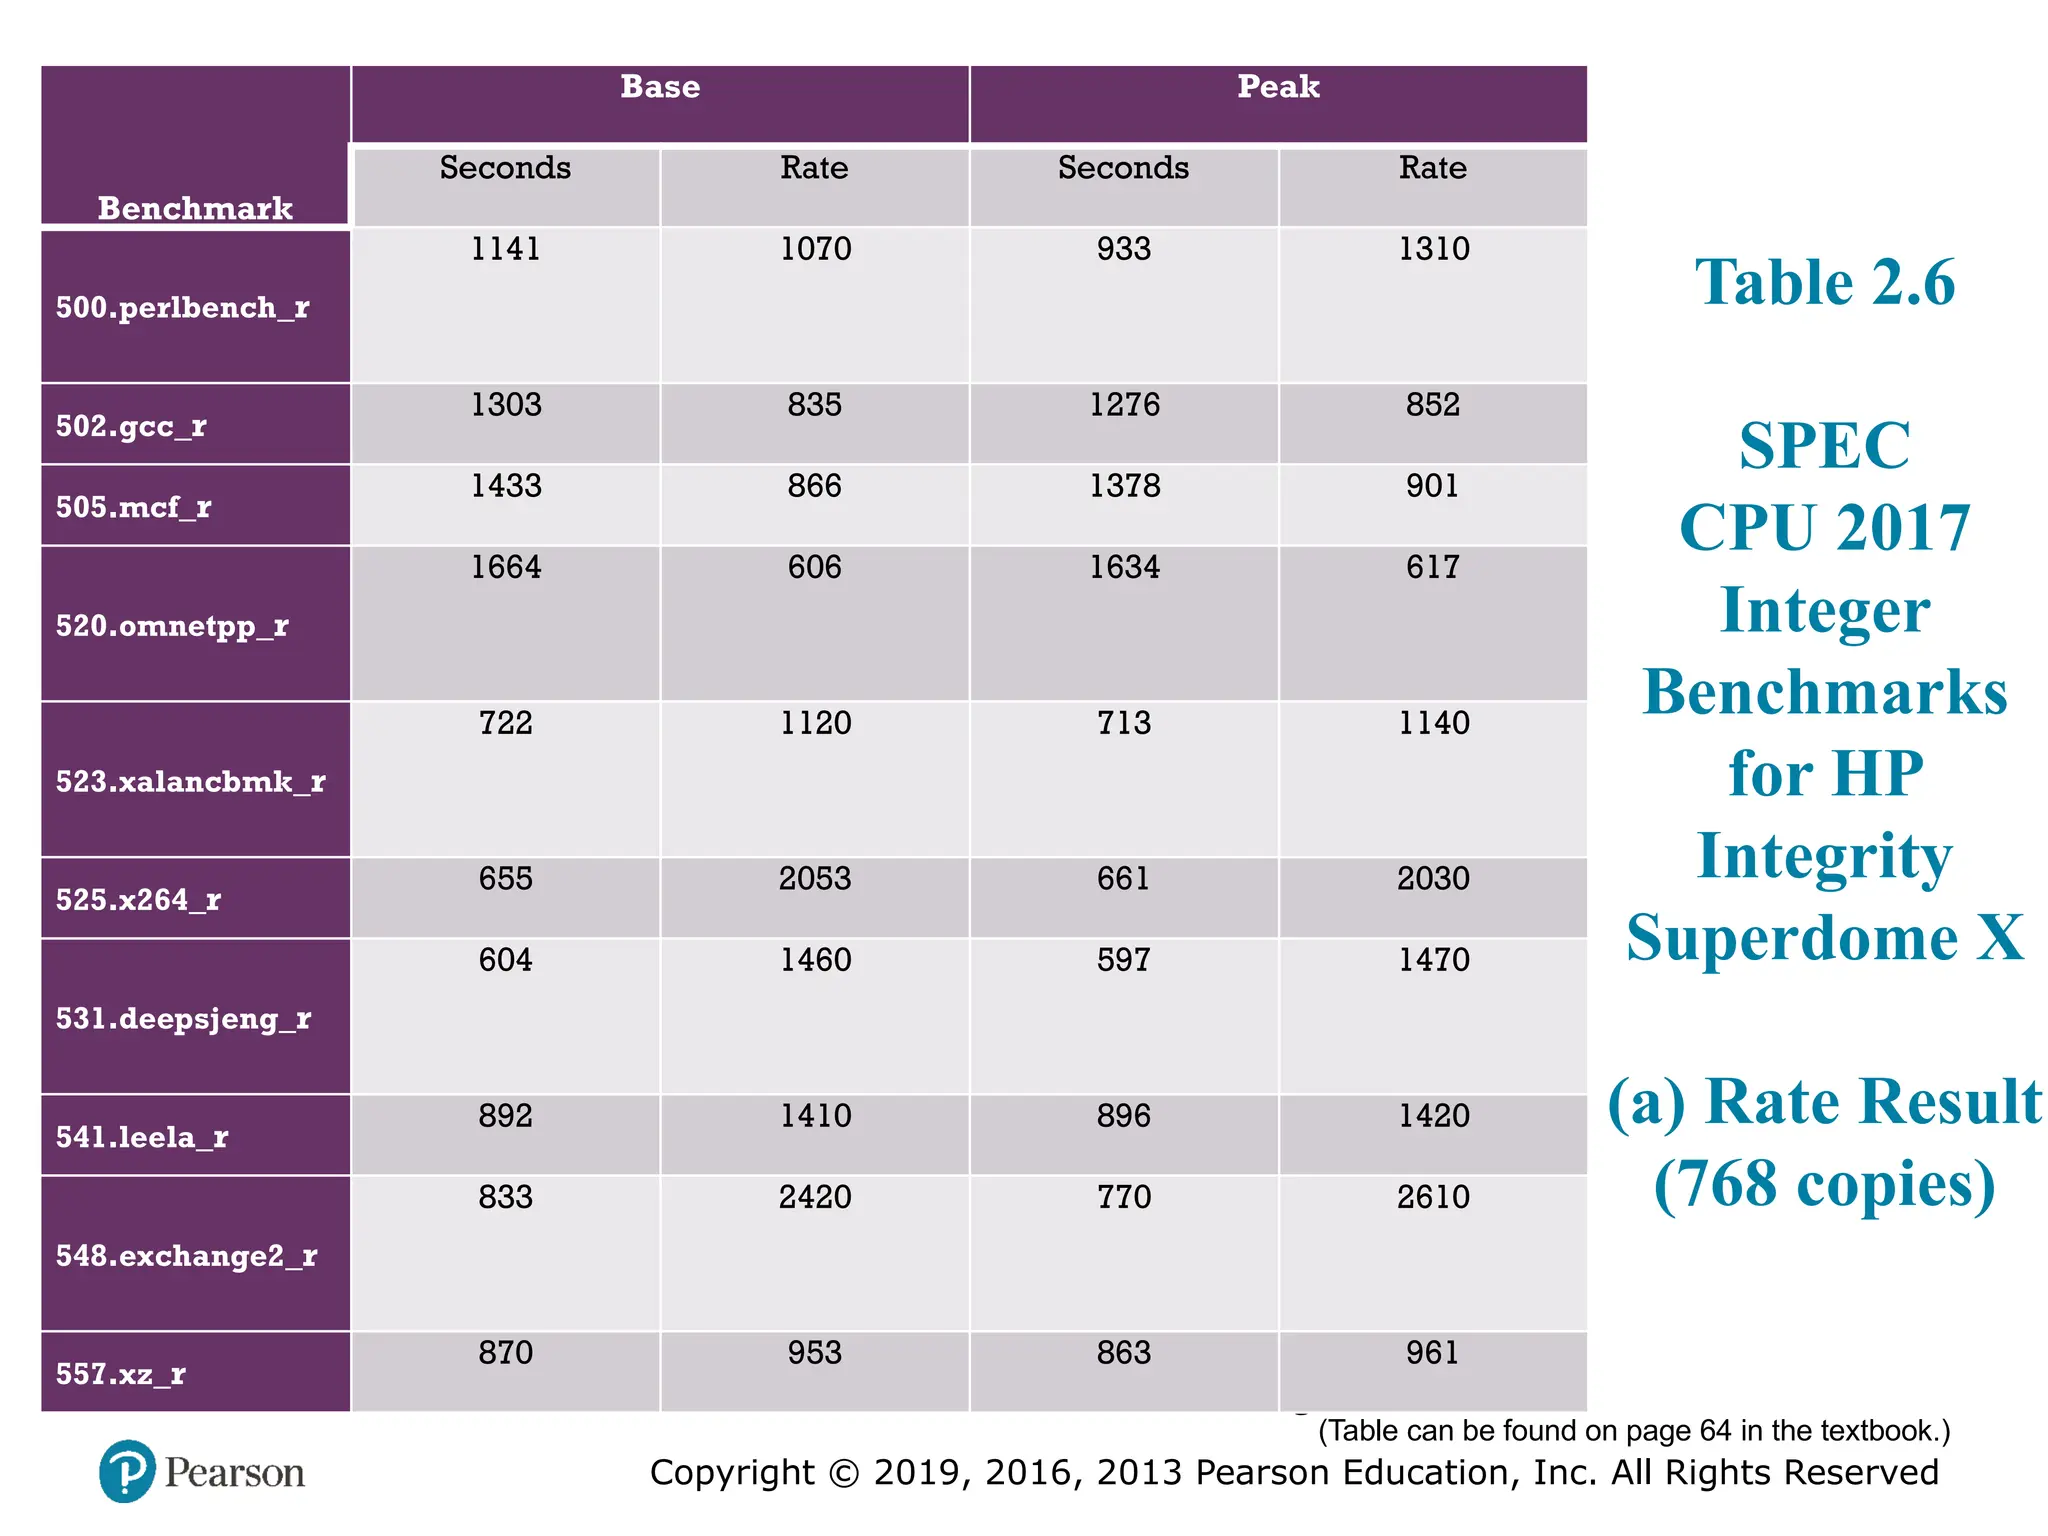
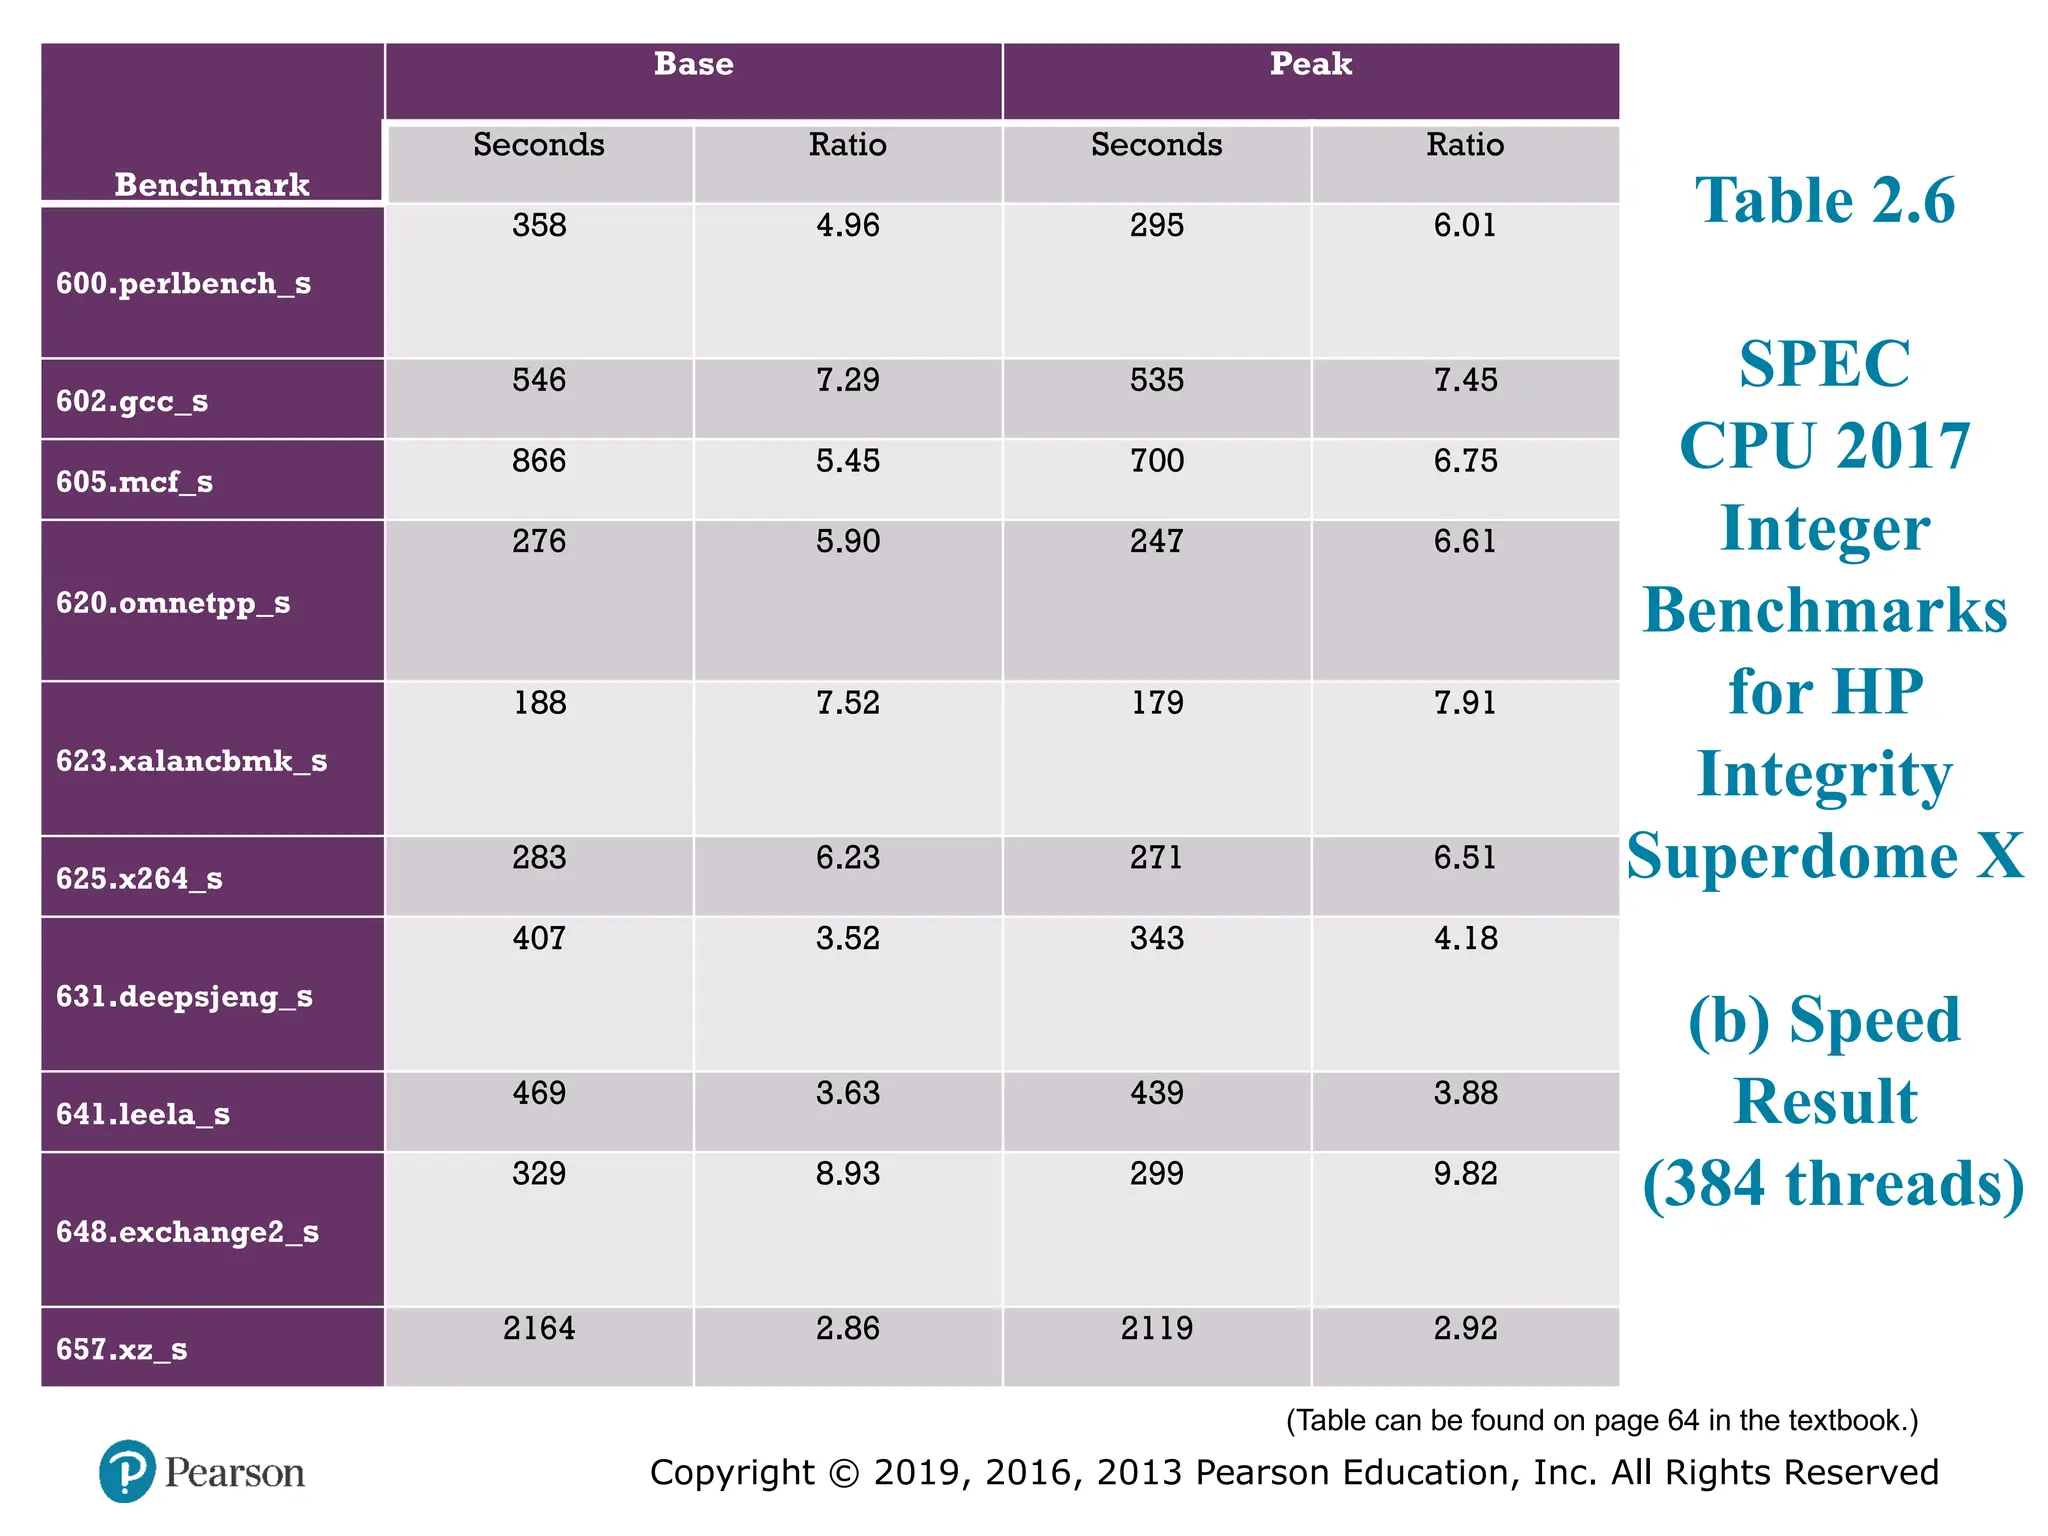
#24 Table 2.6 SPEC CPU2017 Integer Benchmarks for HP Integrity Superdome X
SPEC uses a historical Sun system, the “Ultra Enterprise 2,” which was introduced
in 1997, as the reference machine. The reference machine uses a 296-MHz
UltraSPARC II processor. It takes about 12 days to do a rule-conforming run of
the base metrics for CINT2017 and CFP2017 on the CPU2017 reference machine.
Tables 2.5 and 2.6 show the amount of time to run each benchmark using the reference
machine. The tables also show the dynamic instruction counts on the reference
machine, as reported in [PHAN07]. These value are the actual number of instructions
executed during the run of each program.
#25 Table 2.6 SPEC CPU2017 Integer Benchmarks for HP Integrity Superdome X
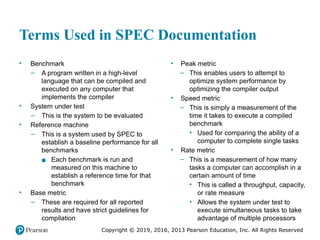
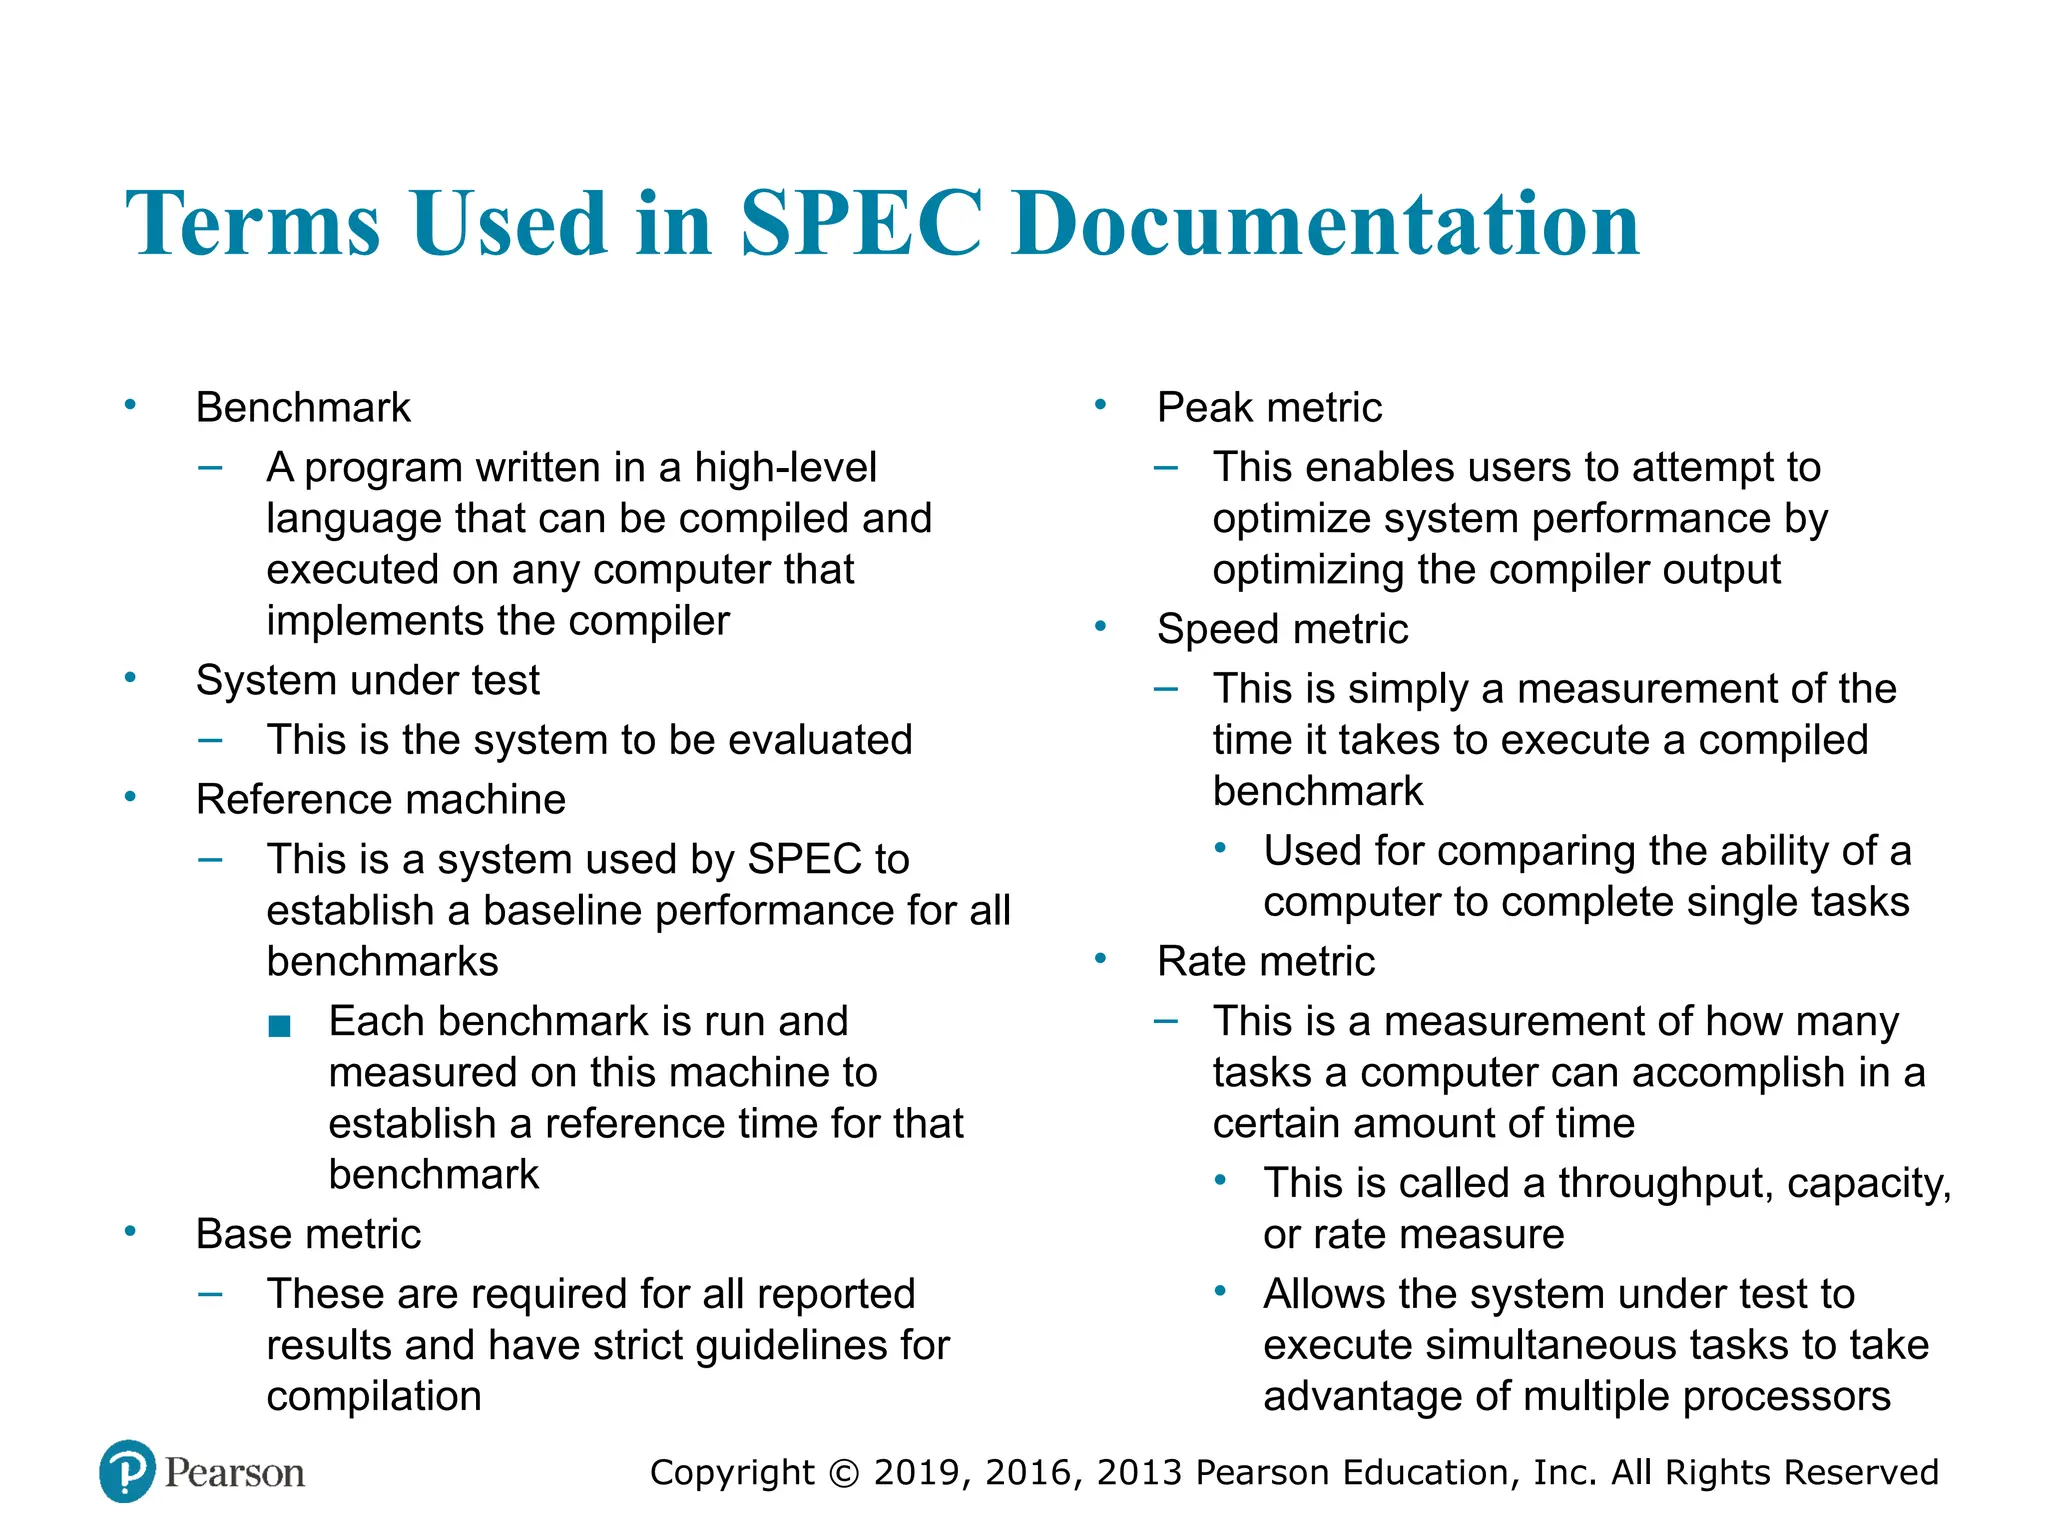
#26 To better understand results published of a system using CPU2017, we define
the following terms used in the SPEC documentation:
■ Benchmark: A program written in a high-level language that can be compiled
and executed on any computer that implements the compiler.
■ System under test: This is the system to be evaluated.
■ Reference machine: This is a system used by SPEC to establish a baseline performance
for all benchmarks. Each benchmark is run and measured on this
machine to establish a reference time for that benchmark. A system under test
is evaluated by running the CPU2017 benchmarks and comparing the results
for running the same programs on the reference machine.
■ Base metric: These are required for all reported results and have strict guidelines
for compilation. In essence, the standard compiler with more or less
default settings should be used on each system under test to achieve comparable
results.
■ Peak metric: This enables users to attempt to optimize system performance by
optimizing the compiler output. For example, different compiler options may
be used on each benchmark, and feedback-directed optimization is allowed.
■ Speed metric: This is simply a measurement of the time it takes to execute a
compiled benchmark. The speed metric is used for comparing the ability of a
computer to complete single tasks.
■ Rate metric: This is a measurement of how many tasks a computer can accomplish
in a certain amount of time; this is called a throughput , capacity, or rate
measure. The rate metric allows the system under test to execute simultaneous
tasks to take advantage of multiple processors.
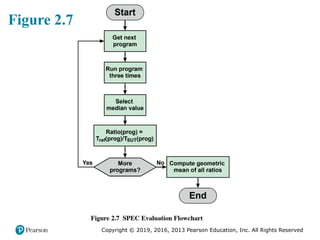
#27 We now consider the specific calculations that are done to assess a system. We
consider the integer benchmarks; the same procedures are used to create a floating-point
benchmark value. For the integer benchmarks, there are 12 programs in the
test suite. Calculation is a three-step process (Figure 2.7):
For the integer benchmarks, four separate metrics can be calculated:
■ SPECspeed2017_int_base: The geometric mean of 12 normalized ratios when
the benchmarks are compiled with base tuning.
■ SPECspeed2017_int_peak: The geometric mean of 12 normalized ratios when
the benchmarks are compiled with peak tuning.
■ SPECrate2017_int_base: The geometric mean of 12 normalized throughput
ratios when the benchmarks are compiled with base tuning.
■ SPECrate2017_int_peak: The geometric mean of 12 normalized throughput
ratios when the benchmarks are compiled with peak tuning.