Downloaded 23 times


![Just use linux
$ docker run --rm rust:1.51
# apt-get install linux-perf
...
# cargo flamegraph
Finished dev [unoptimized + debuginfo] target(s) in 0.03s
/usr/bin/perf: line 13: exec: perf_5.10: not found
E: linux-perf-5.10 is not installed.
failed to sample program](https://image.slidesharecdn.com/rustperformanceanalysis-210609154346/85/Performance-Profiling-in-Rust-13-320.jpg)

![Match the kernel version
$ docker run --rm rust:1.51-bullseye
# apt-get install linux-perf
...
# cargo flamegraph --dev
Finished dev [unoptimized + debuginfo] target(s) in 0.03s
….](https://image.slidesharecdn.com/rustperformanceanalysis-210609154346/85/Performance-Profiling-in-Rust-15-320.jpg)
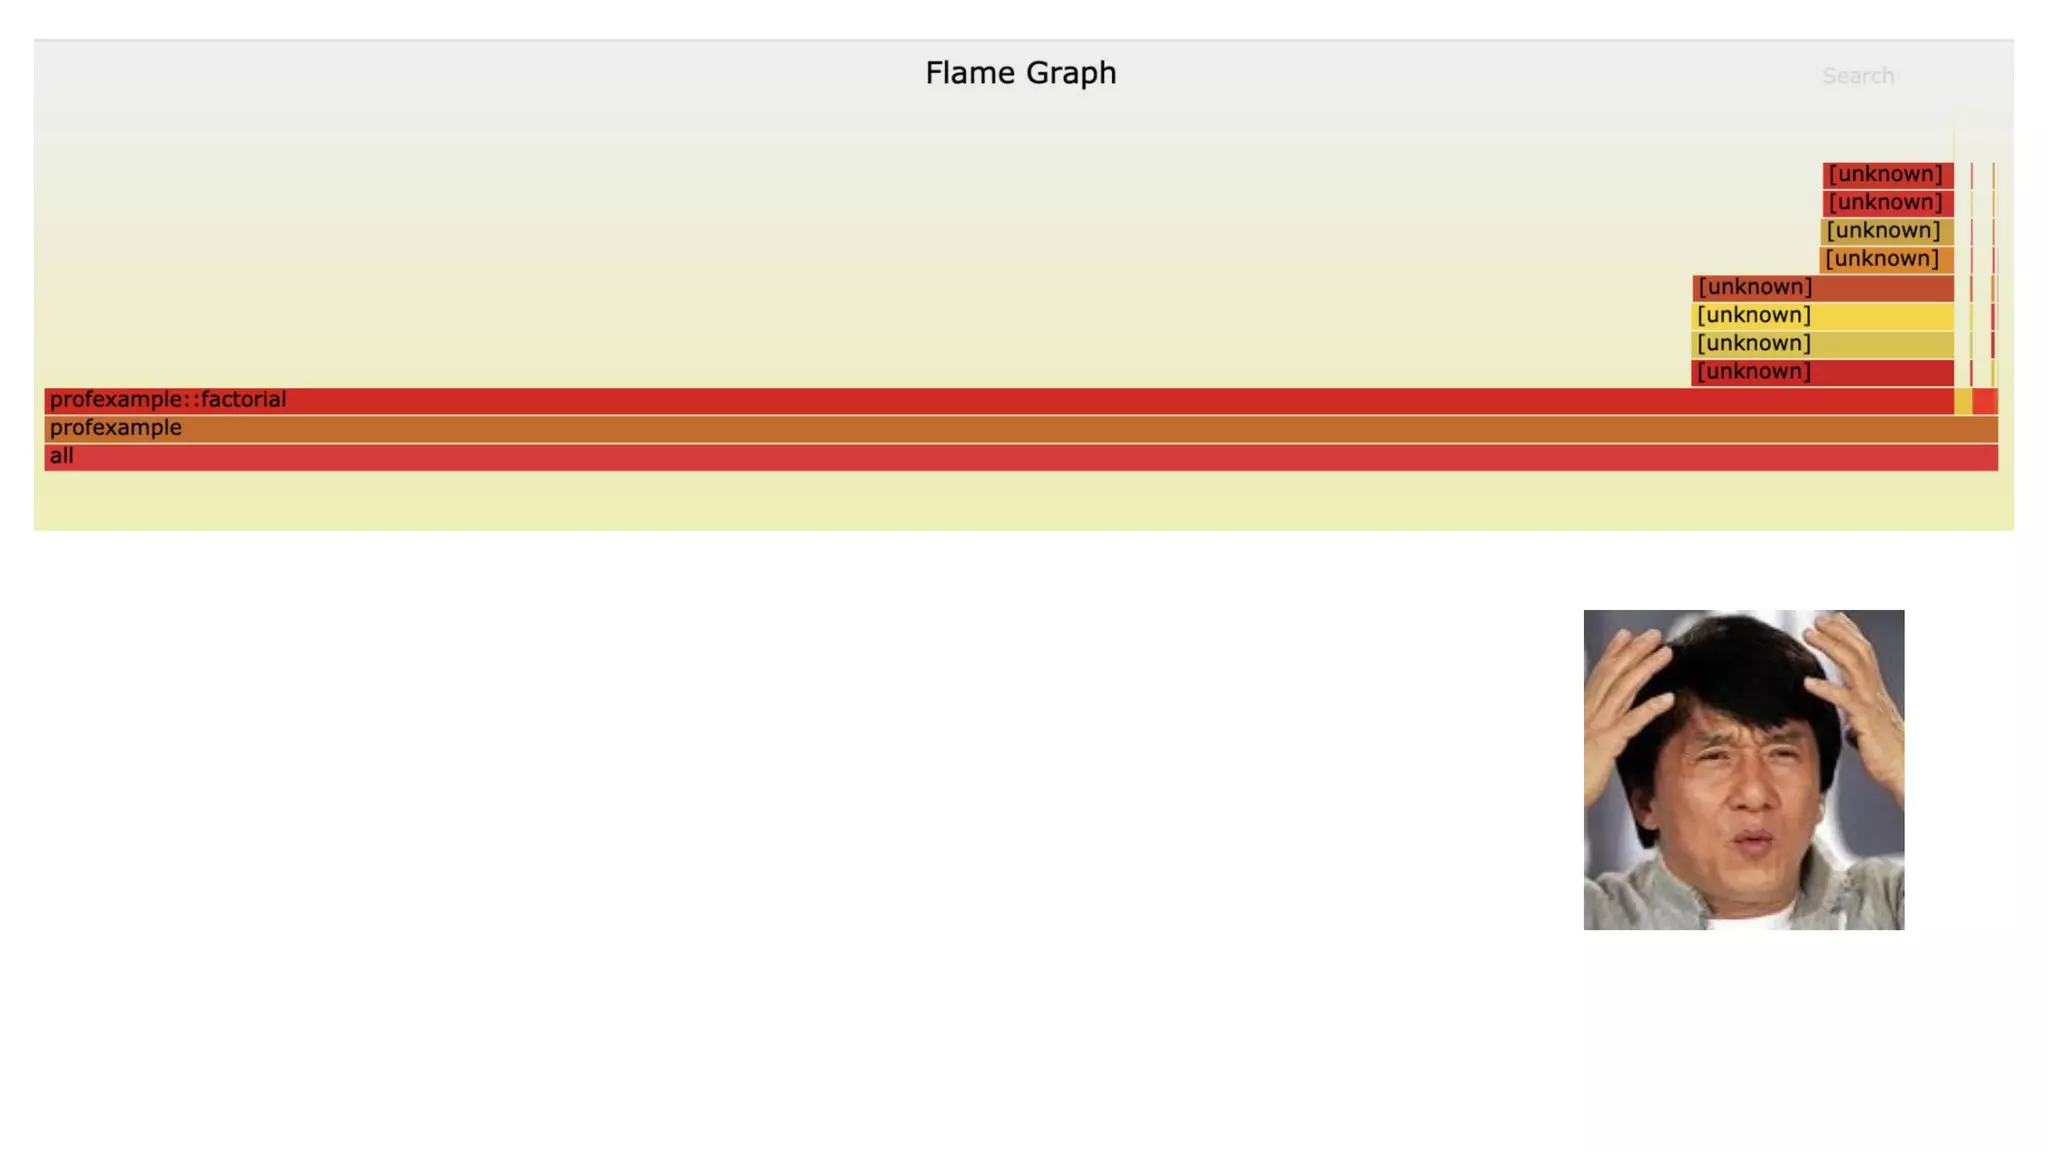
![Profiling a running program
$ cargo install inferno
$ perf record -p "$(pgrep profexample)" -F 997 -g
…^C
[ perf record: Captured and wrote 5.535 MB perf.data (81144 samples) ]
$ perf script | inferno-collapse-perf > stacks.folded
$ inferno-flamegraph < stacks.folded > flamegraph.svg
$ open flamegraph.svg
...](https://image.slidesharecdn.com/rustperformanceanalysis-210609154346/85/Performance-Profiling-in-Rust-17-320.jpg)

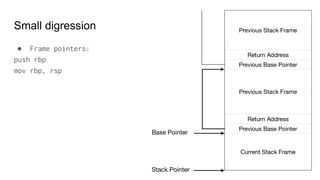
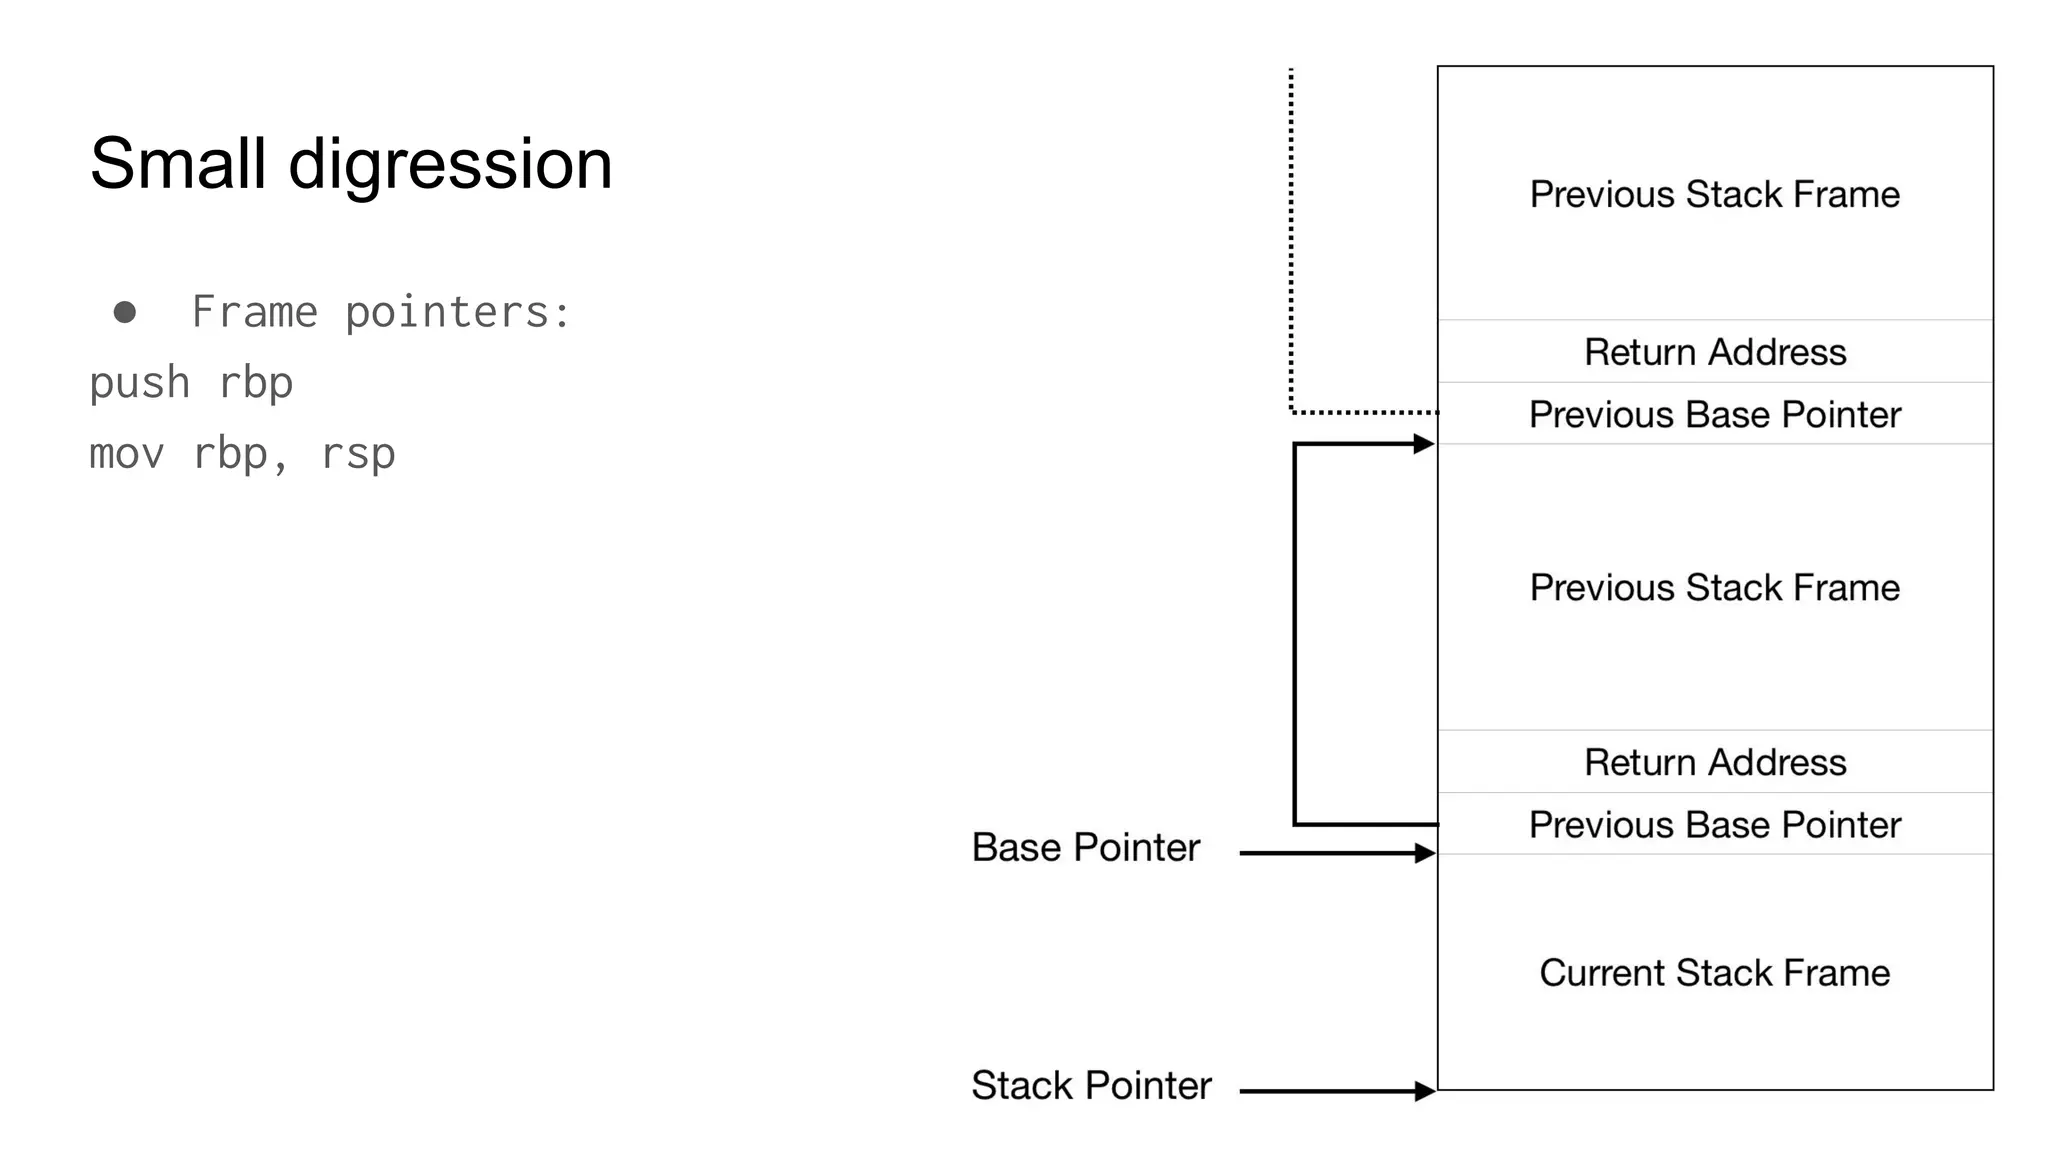
![Small digression (2)
● On x86-64 the default is to omit frame pointers
● X86-64 ABI says:
● The conventional use of %rbp as a frame pointer for the stack frame may be avoided by using %rsp (the stack
pointer) to index into the stack frame. This technique saves two instructions in the prologue and epilogue and
makes one additional general-purpose register (%rbp) available.
● Gcc since 4.6 omits frame pointers by default on x84-6
● Rust omits frame pointers also on dev builds
● DWARF info is used to figure out the layout of the stack frame for
each function. You don’t need full debug info for backtraces:
[profile.release]
debug = 1](https://image.slidesharecdn.com/rustperformanceanalysis-210609154346/85/Performance-Profiling-in-Rust-20-320.jpg)
![Profiling a running program
$ cargo install inferno
$ perf record -p "$(pgrep profexample)" -F 997 -g --call-graph dwarf
…^C
[ perf record: Captured and wrote 461.199 MB perf.data (57251 samples) ]
$ perf script | inferno-collapse-perf > stacks.folded
$ inferno-flamegraph < stacks.folded > flamegraph.svg
$ open flamegraph.svg
...](https://image.slidesharecdn.com/rustperformanceanalysis-210609154346/85/Performance-Profiling-in-Rust-21-320.jpg)


![Rust?
Enter: tikv/pprof-rs !!
[dependencies]
+pprof = { version = "0.4", features = ["flamegraph"] }](https://image.slidesharecdn.com/rustperformanceanalysis-210609154346/85/Performance-Profiling-in-Rust-33-320.jpg)

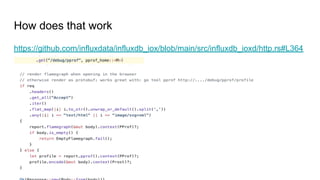
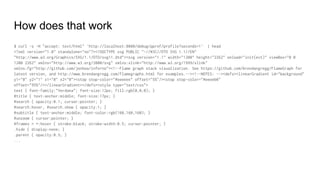
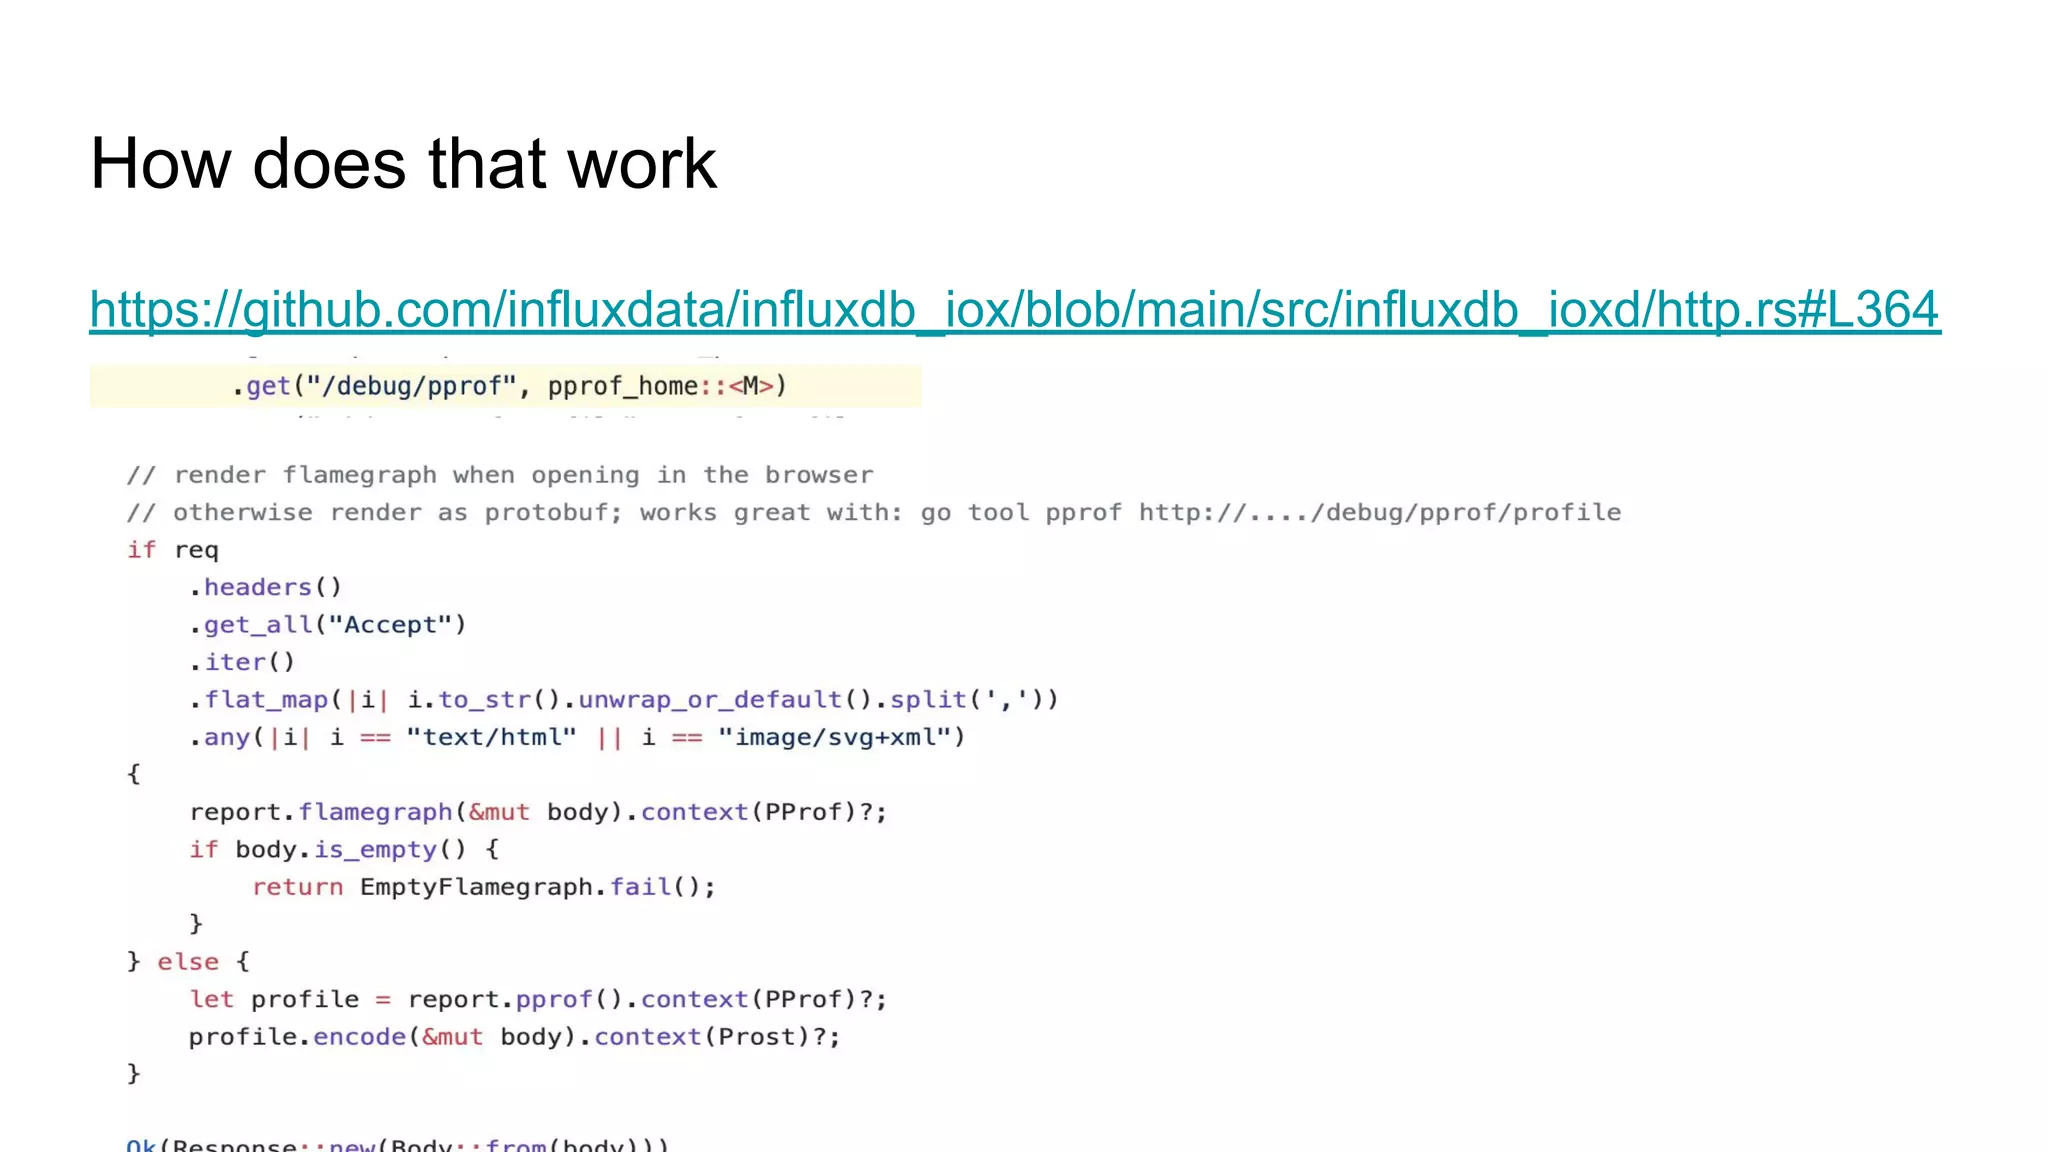
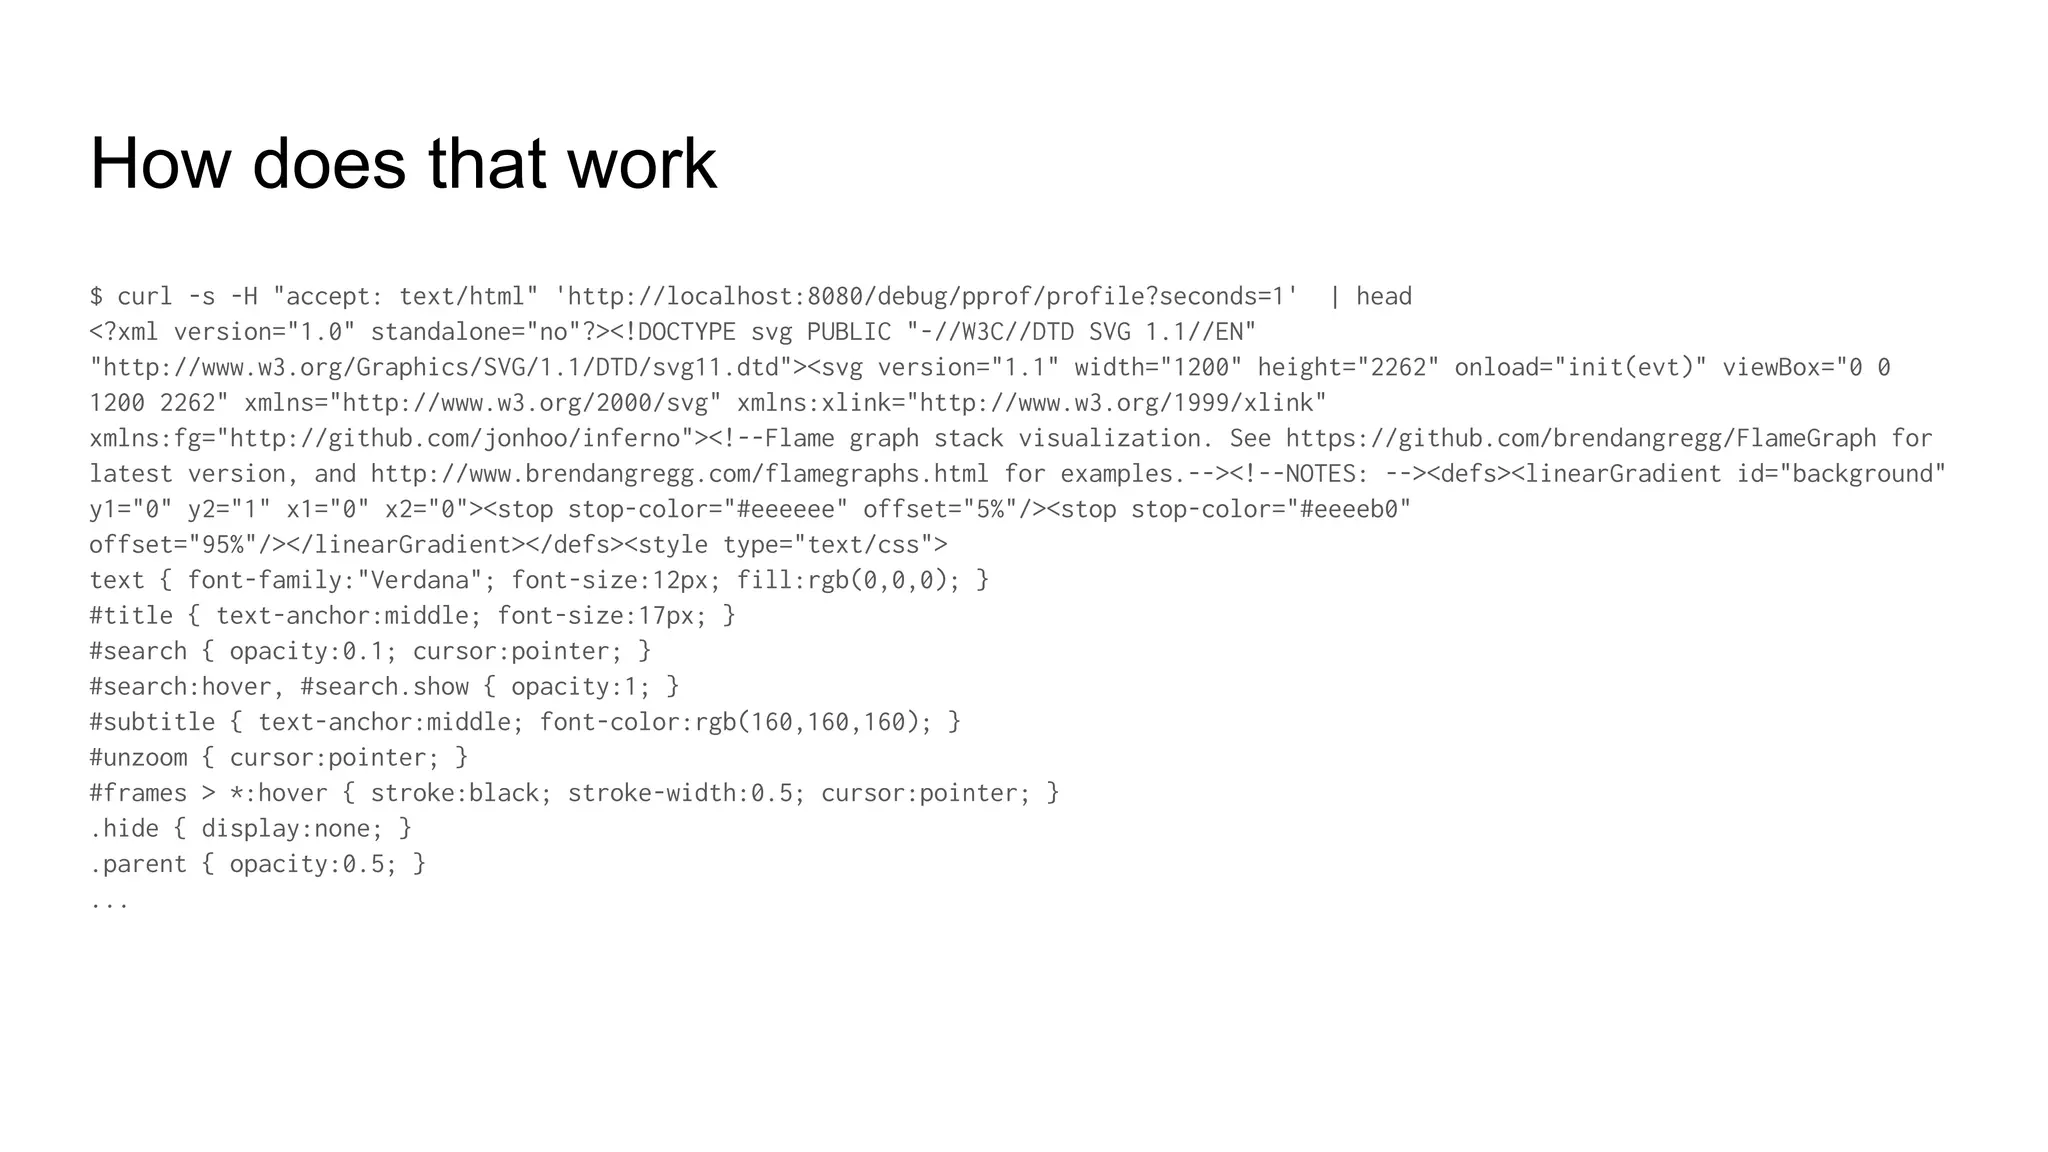
![How does that work
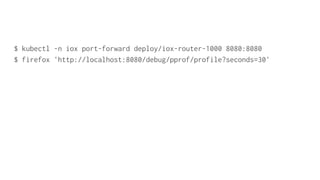
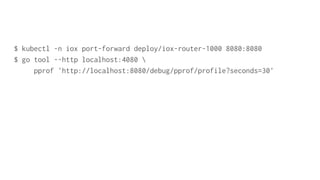
$ curl 'http://localhost:8080/debug/pprof/profile?seconds=1' | pq --msgtype perftools.profiles.Profile | jq
{
"sample_type": [
{
"type": 1164,
"unit": 1165
}
],
"sample": [
{
"location_id": [
1,
2,
...
"value": [
1
],
...
"string_table": [
"",
"flatbuffers::builder::FlatBufferBuilder::create_string",
"_ZN81_$LT$core..str..iter..Chars$u20$as$u20$core..iter..traits..iterator..Iterator$GT$4next17hfd848827f3ee829eE",
"_ZN4core3ptr19swap_nonoverlapping17h364e10b3426efe72E",
"_ZN6server15Server$LT$M$GT$19write_sharded_entry28_$u7b$$u7b$closure$u7d$$u7d$17h4746f0c3132c7a41E",
"_ZN5alloc4sync12Arc$LT$T$GT$9drop_slow17h20a22a0cdaab7f27E",
"_ZN22influxdb_line_protocol7tag_key17hf795357f1c28005dE",](https://image.slidesharecdn.com/rustperformanceanalysis-210609154346/85/Performance-Profiling-in-Rust-46-320.jpg)
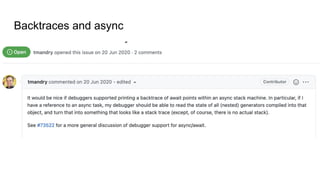

![Attempt 1
[dependencies]
tikv-jemallocator = {version = "0.4.0", features = ["profiling"] }
#[global_allocator]
static GLOBAL: Jemalloc = Jemalloc;
$ cargo build &&
_RJEM_MALLOC_CONF="prof:true,prof_final:true,prof_prefix:jeprof.out"
./target/debug/profexample](https://image.slidesharecdn.com/rustperformanceanalysis-210609154346/85/Performance-Profiling-in-Rust-50-320.jpg)
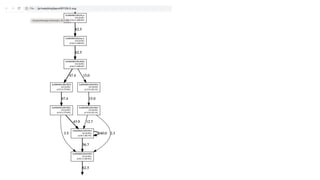
![Attempt 2: implement it like pprof-rs
use super::Profiler;
use libc::{c_int, c_void, size_t};
#[link(name = "jemalloc")]
extern "C" {
#[link_name = "_rjem_malloc"]
pub fn sys_malloc(size: size_t) -> *mut c_void;
#[link_name = "_rjem_free"]
pub fn sys_free(ptr: *mut c_void);
#[link_name = "_rjem_realloc"]
pub fn sys_realloc(ptr: *mut c_void, size: size_t) -> *mut c_void;
}
#[no_mangle]
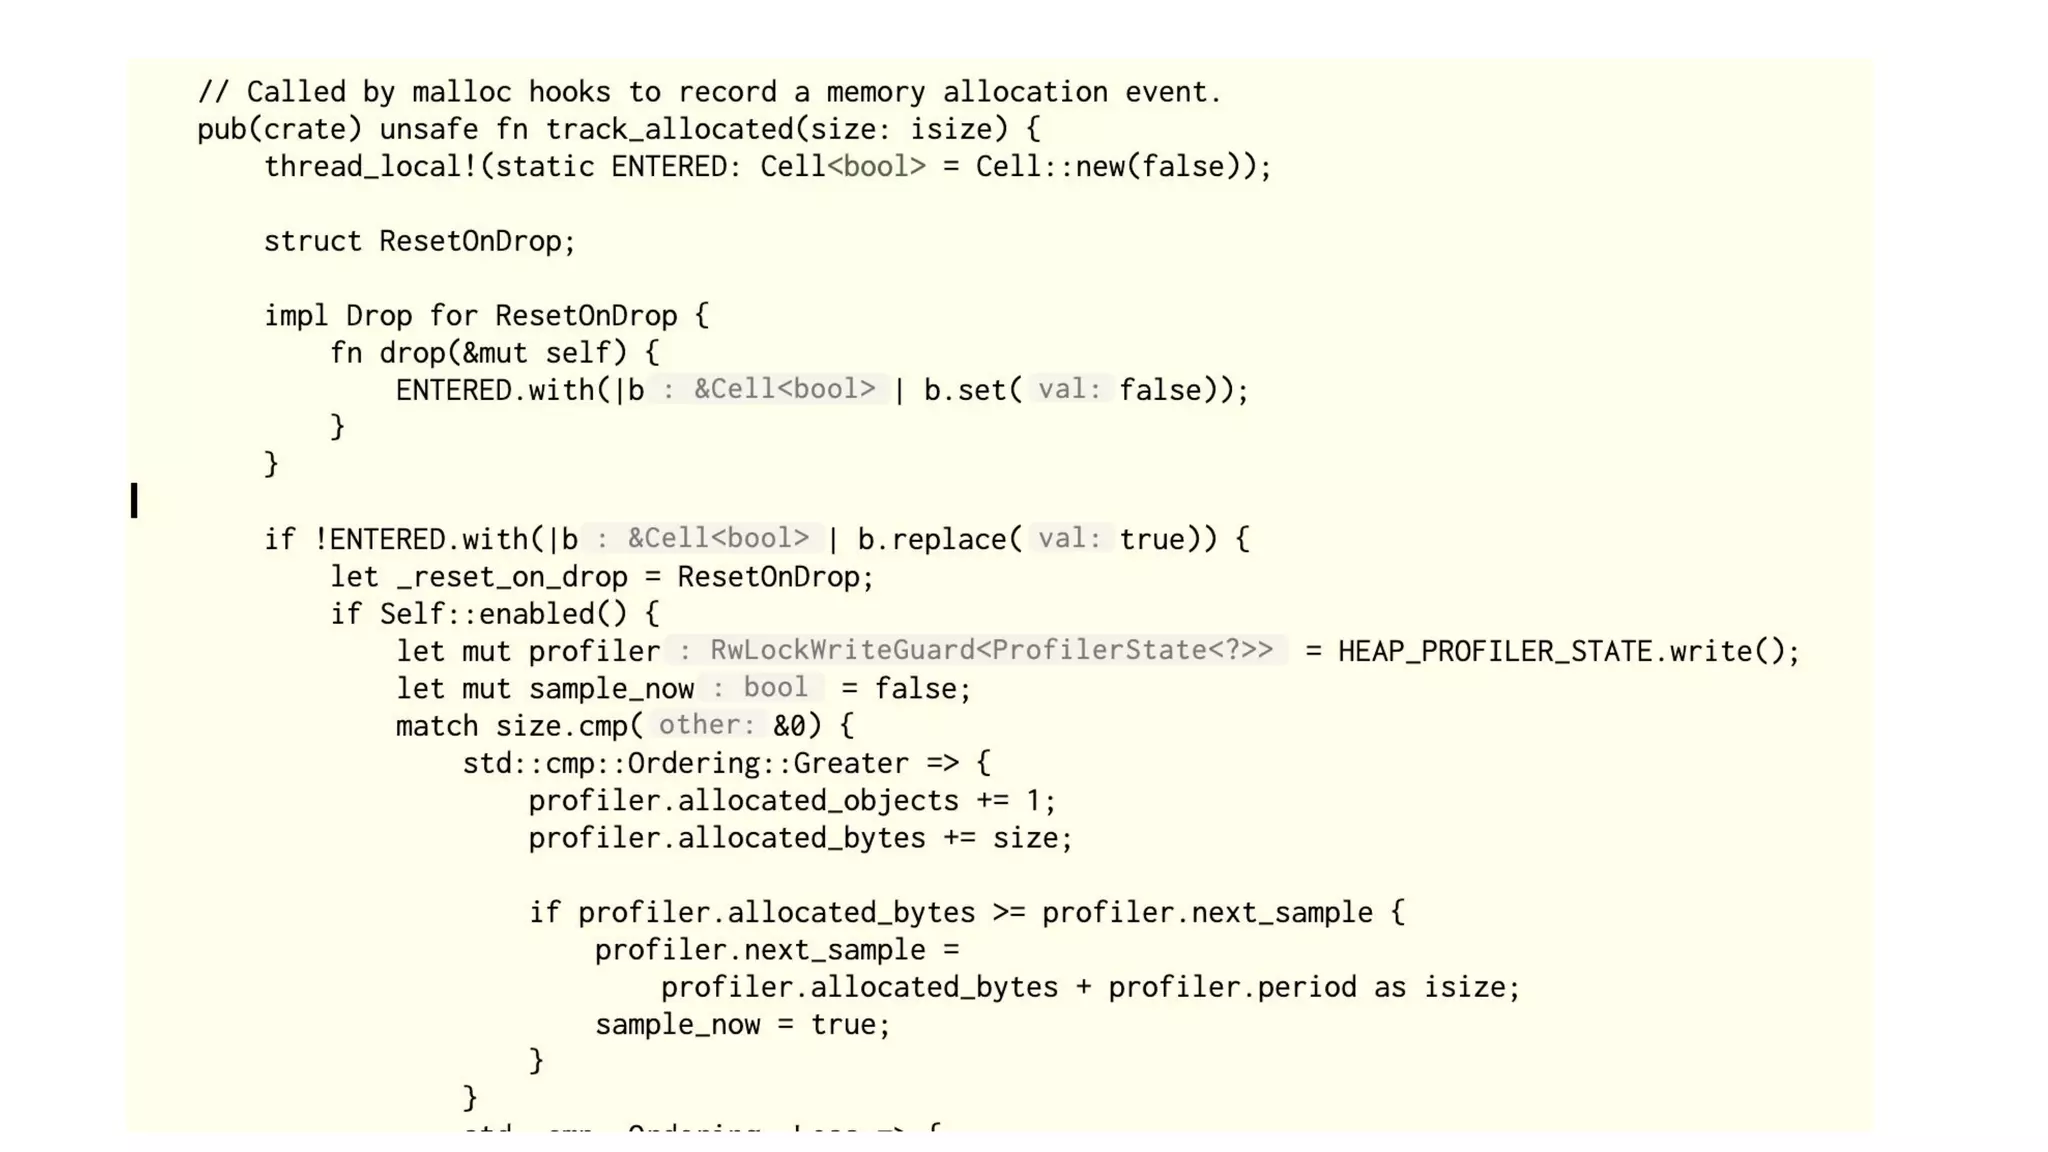
pub unsafe extern "C" fn malloc(size: size_t) -> *mut c_void {
Profiler::track_allocated(size as isize);
sys_malloc(size)
}](https://image.slidesharecdn.com/rustperformanceanalysis-210609154346/85/Performance-Profiling-in-Rust-52-320.jpg)
![//! The standard API includes: the [`malloc`], [`calloc`], [`realloc`], and
//! [`free`], which conform to to ISO/IEC 9899:1990 (“ISO C90”),
//! [`posix_memalign`] which conforms to conforms to POSIX.1-2016, and
//! [`aligned_alloc`].](https://image.slidesharecdn.com/rustperformanceanalysis-210609154346/85/Performance-Profiling-in-Rust-53-320.jpg)


![Just use linux
$ docker run --rm rust:1.51
# apt-get install linux-perf
...
# cargo flamegraph
Finished dev [unoptimized + debuginfo] target(s) in 0.03s
/usr/bin/perf: line 13: exec: perf_5.10: not found
E: linux-perf-5.10 is not installed.
failed to sample program](https://image.slidesharecdn.com/rustperformanceanalysis-210609154346/75/Performance-Profiling-in-Rust-13-2048.jpg)

![Match the kernel version
$ docker run --rm rust:1.51-bullseye
# apt-get install linux-perf
...
# cargo flamegraph --dev
Finished dev [unoptimized + debuginfo] target(s) in 0.03s
….](https://image.slidesharecdn.com/rustperformanceanalysis-210609154346/75/Performance-Profiling-in-Rust-15-2048.jpg)

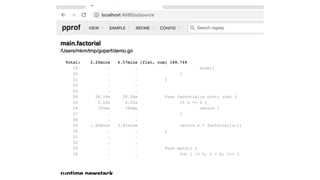
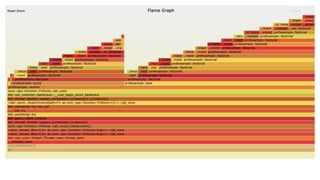
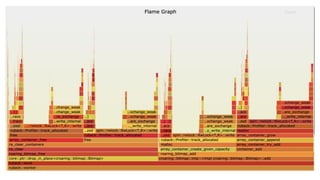
![Profiling a running program
$ cargo install inferno
$ perf record -p "$(pgrep profexample)" -F 997 -g
…^C
[ perf record: Captured and wrote 5.535 MB perf.data (81144 samples) ]
$ perf script | inferno-collapse-perf > stacks.folded
$ inferno-flamegraph < stacks.folded > flamegraph.svg
$ open flamegraph.svg
...](https://image.slidesharecdn.com/rustperformanceanalysis-210609154346/75/Performance-Profiling-in-Rust-17-2048.jpg)
![Small digression (2)
● On x86-64 the default is to omit frame pointers
● X86-64 ABI says:
● The conventional use of %rbp as a frame pointer for the stack frame may be avoided by using %rsp (the stack
pointer) to index into the stack frame. This technique saves two instructions in the prologue and epilogue and
makes one additional general-purpose register (%rbp) available.
● Gcc since 4.6 omits frame pointers by default on x84-6
● Rust omits frame pointers also on dev builds
● DWARF info is used to figure out the layout of the stack frame for
each function. You don’t need full debug info for backtraces:
[profile.release]
debug = 1](https://image.slidesharecdn.com/rustperformanceanalysis-210609154346/75/Performance-Profiling-in-Rust-20-2048.jpg)
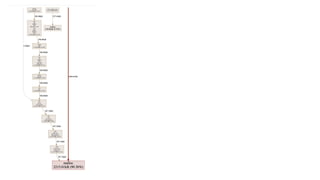
![Profiling a running program
$ cargo install inferno
$ perf record -p "$(pgrep profexample)" -F 997 -g --call-graph dwarf
…^C
[ perf record: Captured and wrote 461.199 MB perf.data (57251 samples) ]
$ perf script | inferno-collapse-perf > stacks.folded
$ inferno-flamegraph < stacks.folded > flamegraph.svg
$ open flamegraph.svg
...](https://image.slidesharecdn.com/rustperformanceanalysis-210609154346/75/Performance-Profiling-in-Rust-21-2048.jpg)


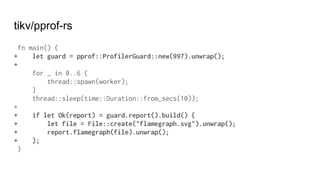
![Rust?
Enter: tikv/pprof-rs !!
[dependencies]
+pprof = { version = "0.4", features = ["flamegraph"] }](https://image.slidesharecdn.com/rustperformanceanalysis-210609154346/75/Performance-Profiling-in-Rust-33-2048.jpg)


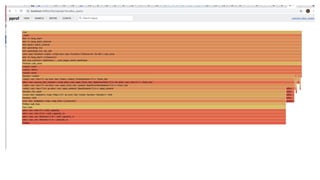
![How does that work
$ curl 'http://localhost:8080/debug/pprof/profile?seconds=1' | pq --msgtype perftools.profiles.Profile | jq
{
"sample_type": [
{
"type": 1164,
"unit": 1165
}
],
"sample": [
{
"location_id": [
1,
2,
...
"value": [
1
],
...
"string_table": [
"",
"flatbuffers::builder::FlatBufferBuilder::create_string",
"_ZN81_$LT$core..str..iter..Chars$u20$as$u20$core..iter..traits..iterator..Iterator$GT$4next17hfd848827f3ee829eE",
"_ZN4core3ptr19swap_nonoverlapping17h364e10b3426efe72E",
"_ZN6server15Server$LT$M$GT$19write_sharded_entry28_$u7b$$u7b$closure$u7d$$u7d$17h4746f0c3132c7a41E",
"_ZN5alloc4sync12Arc$LT$T$GT$9drop_slow17h20a22a0cdaab7f27E",
"_ZN22influxdb_line_protocol7tag_key17hf795357f1c28005dE",](https://image.slidesharecdn.com/rustperformanceanalysis-210609154346/75/Performance-Profiling-in-Rust-46-2048.jpg)

![Attempt 1
[dependencies]
tikv-jemallocator = {version = "0.4.0", features = ["profiling"] }
#[global_allocator]
static GLOBAL: Jemalloc = Jemalloc;
$ cargo build &&
_RJEM_MALLOC_CONF="prof:true,prof_final:true,prof_prefix:jeprof.out"
./target/debug/profexample](https://image.slidesharecdn.com/rustperformanceanalysis-210609154346/75/Performance-Profiling-in-Rust-50-2048.jpg)
![Attempt 2: implement it like pprof-rs
use super::Profiler;
use libc::{c_int, c_void, size_t};
#[link(name = "jemalloc")]
extern "C" {
#[link_name = "_rjem_malloc"]
pub fn sys_malloc(size: size_t) -> *mut c_void;
#[link_name = "_rjem_free"]
pub fn sys_free(ptr: *mut c_void);
#[link_name = "_rjem_realloc"]
pub fn sys_realloc(ptr: *mut c_void, size: size_t) -> *mut c_void;
}
#[no_mangle]
pub unsafe extern "C" fn malloc(size: size_t) -> *mut c_void {
Profiler::track_allocated(size as isize);
sys_malloc(size)
}](https://image.slidesharecdn.com/rustperformanceanalysis-210609154346/75/Performance-Profiling-in-Rust-52-2048.jpg)
![//! The standard API includes: the [`malloc`], [`calloc`], [`realloc`], and
//! [`free`], which conform to to ISO/IEC 9899:1990 (“ISO C90”),
//! [`posix_memalign`] which conforms to conforms to POSIX.1-2016, and
//! [`aligned_alloc`].](https://image.slidesharecdn.com/rustperformanceanalysis-210609154346/75/Performance-Profiling-in-Rust-53-2048.jpg)
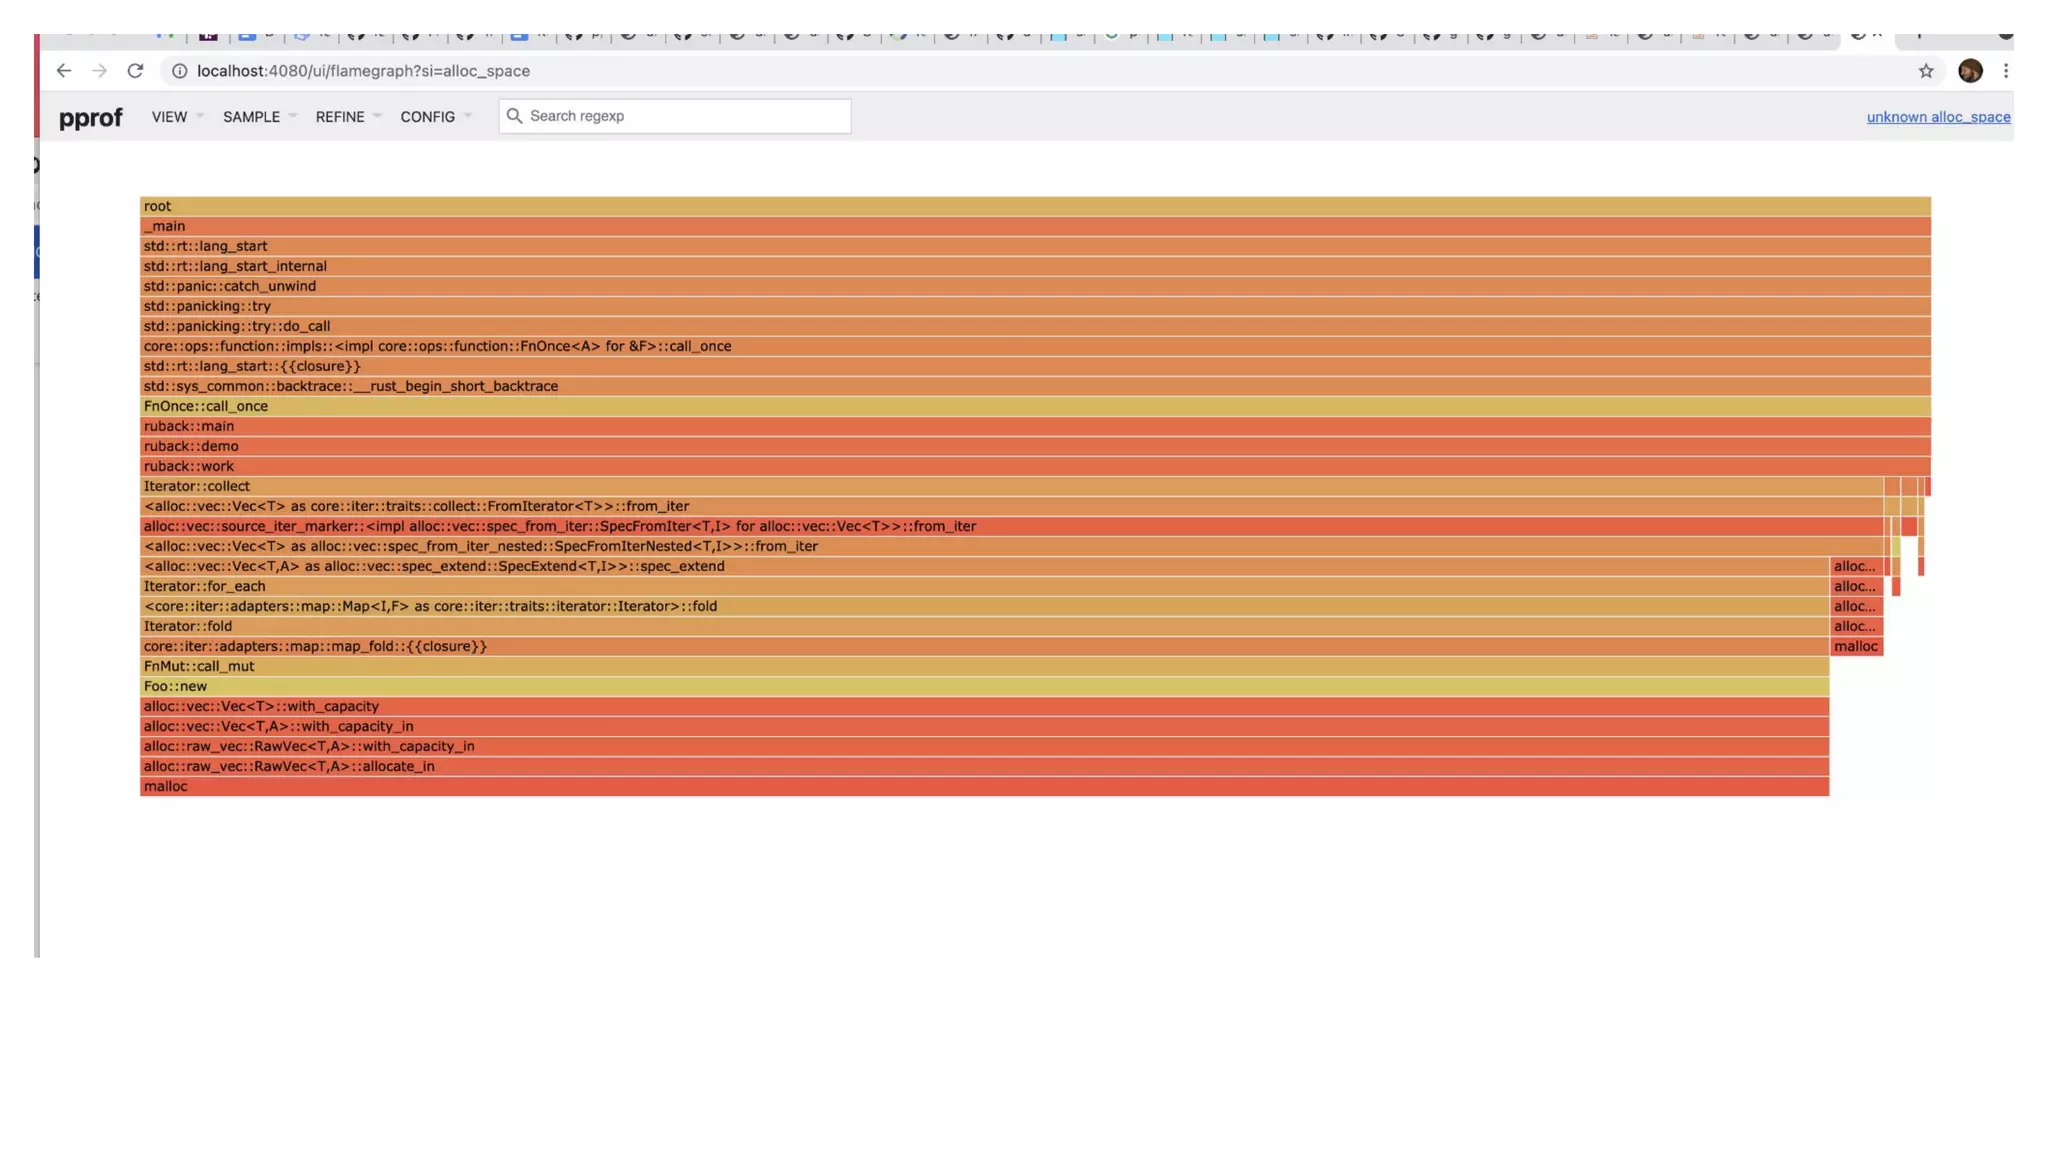
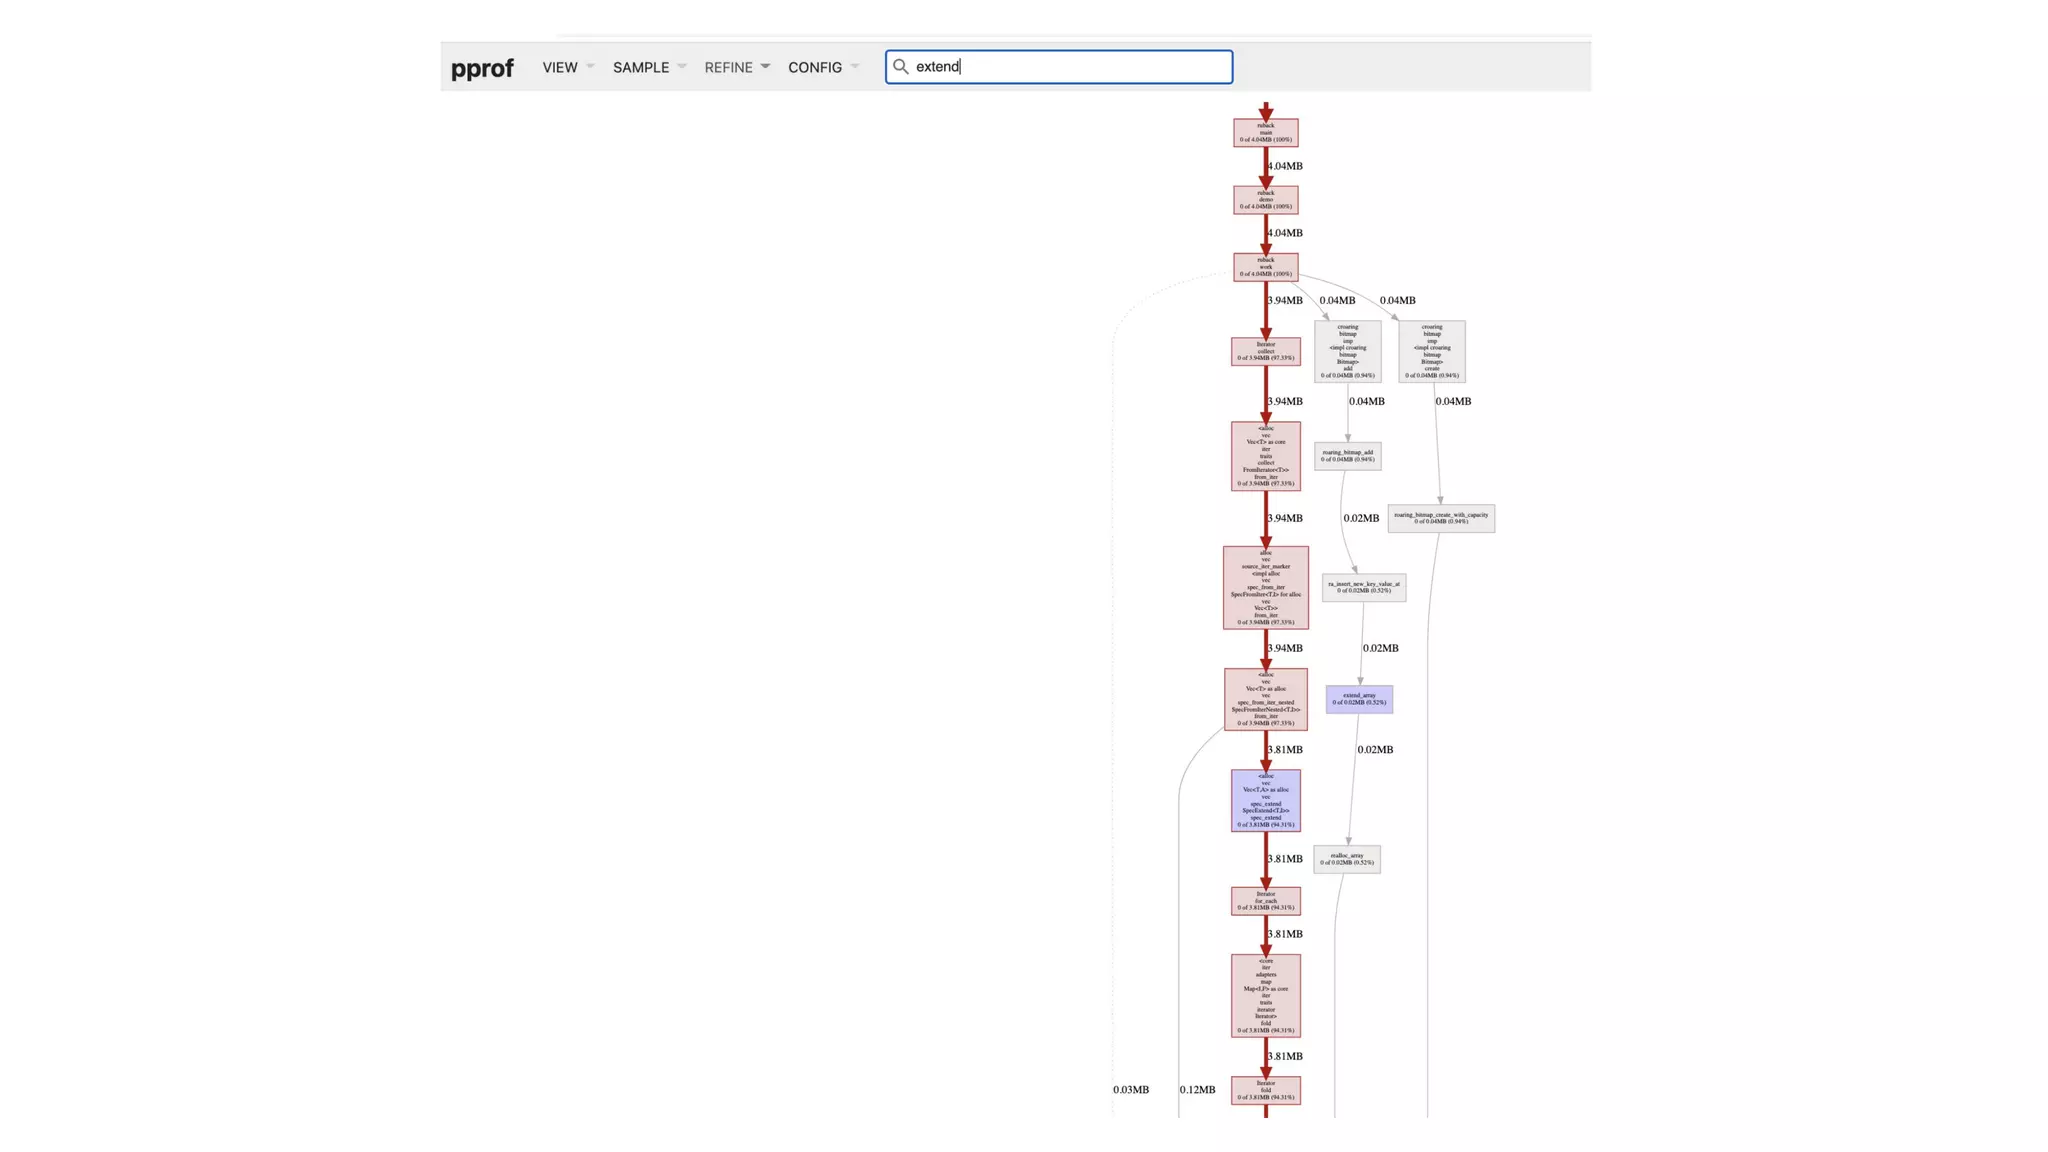

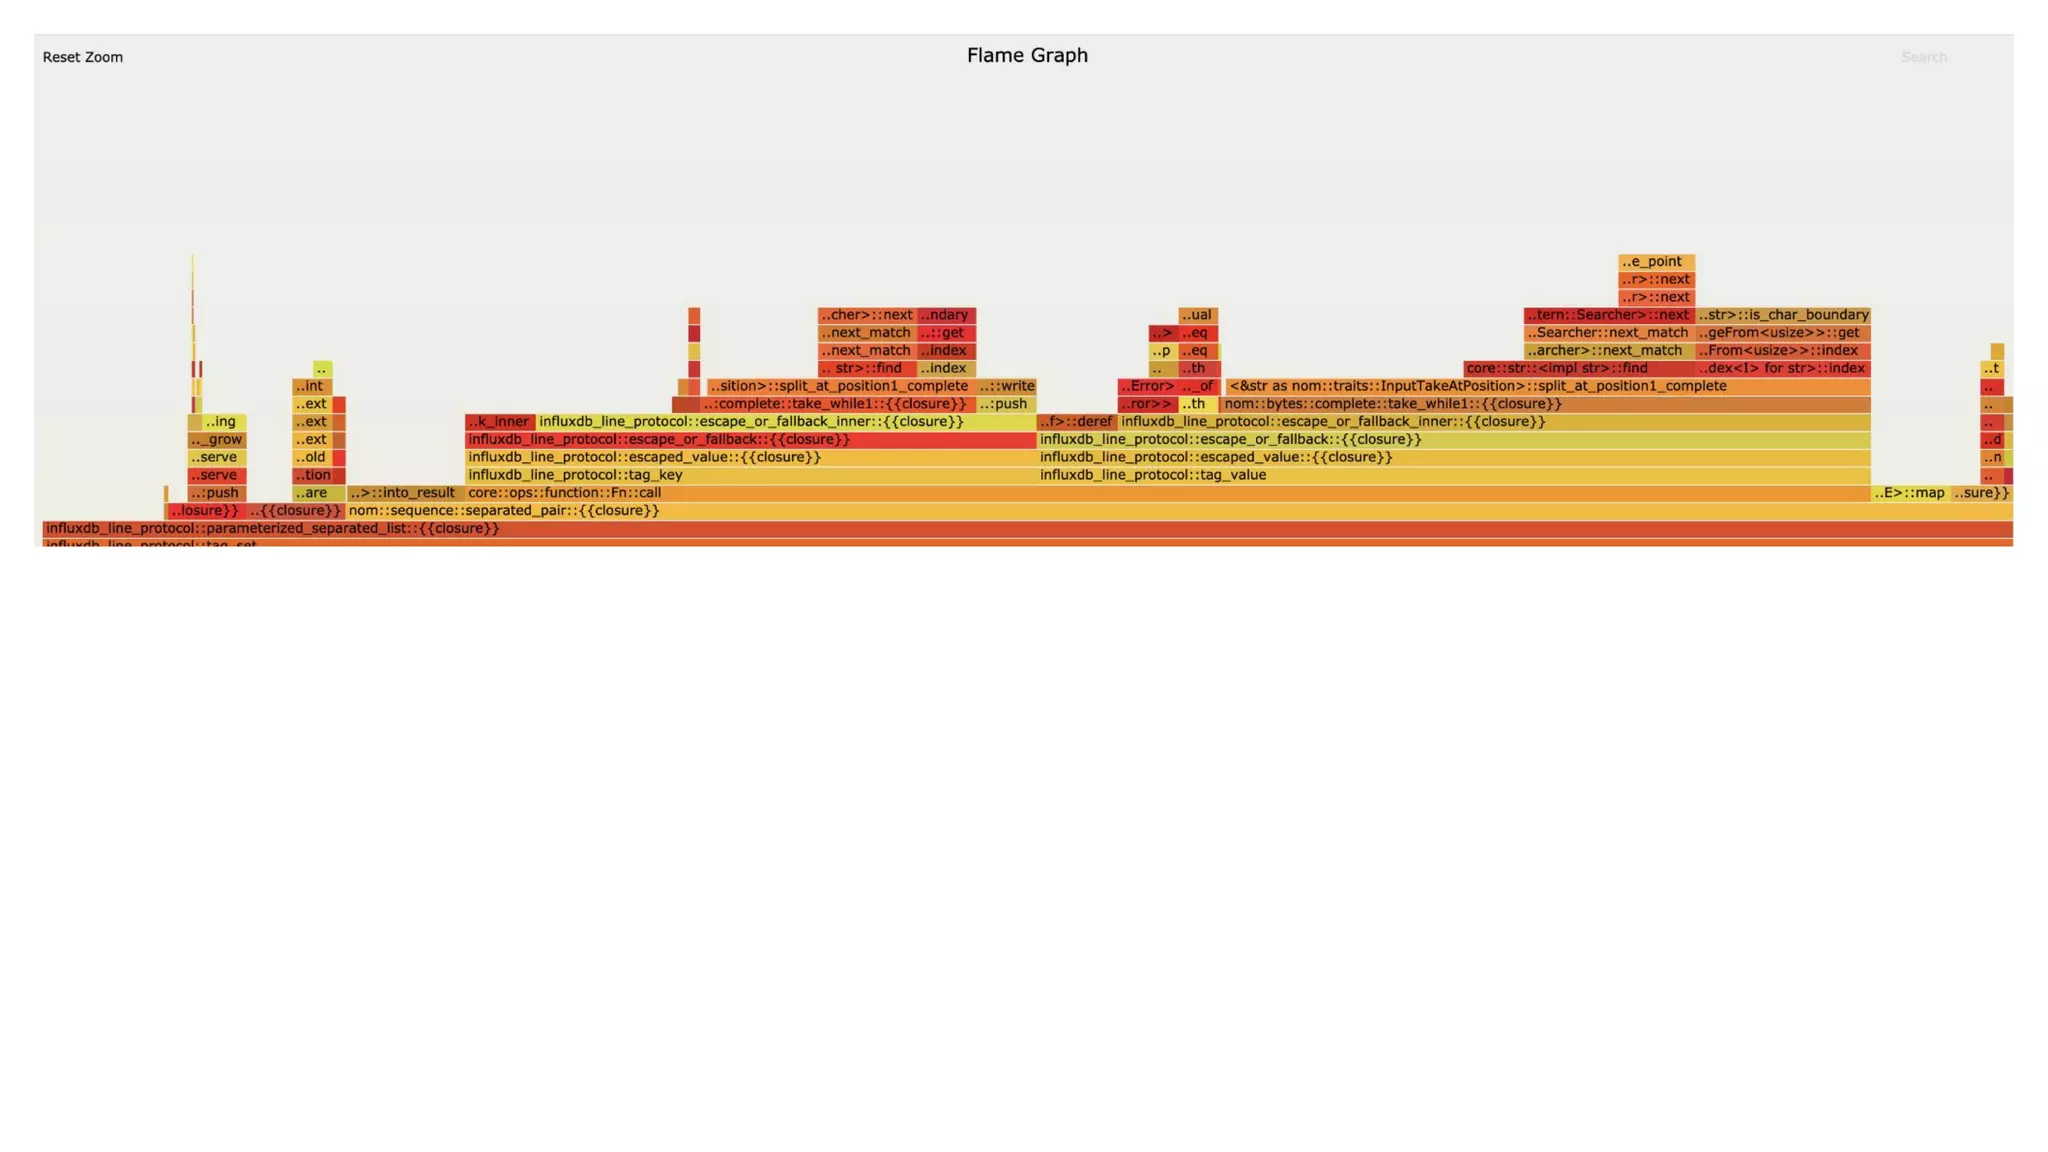


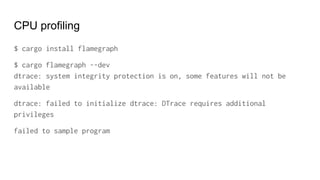
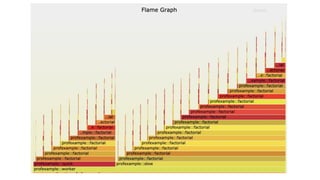
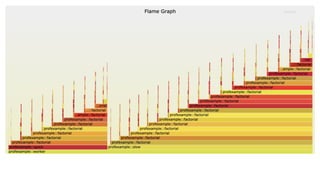
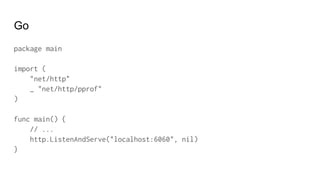
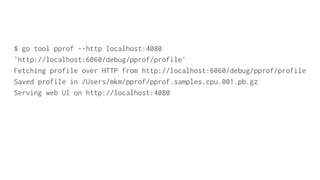
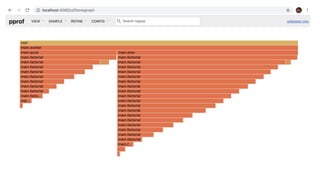
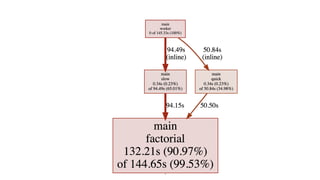
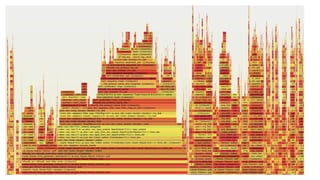
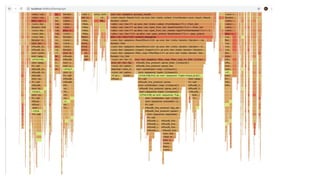
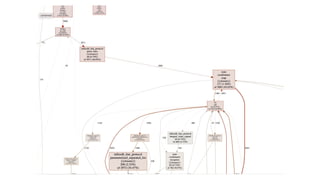
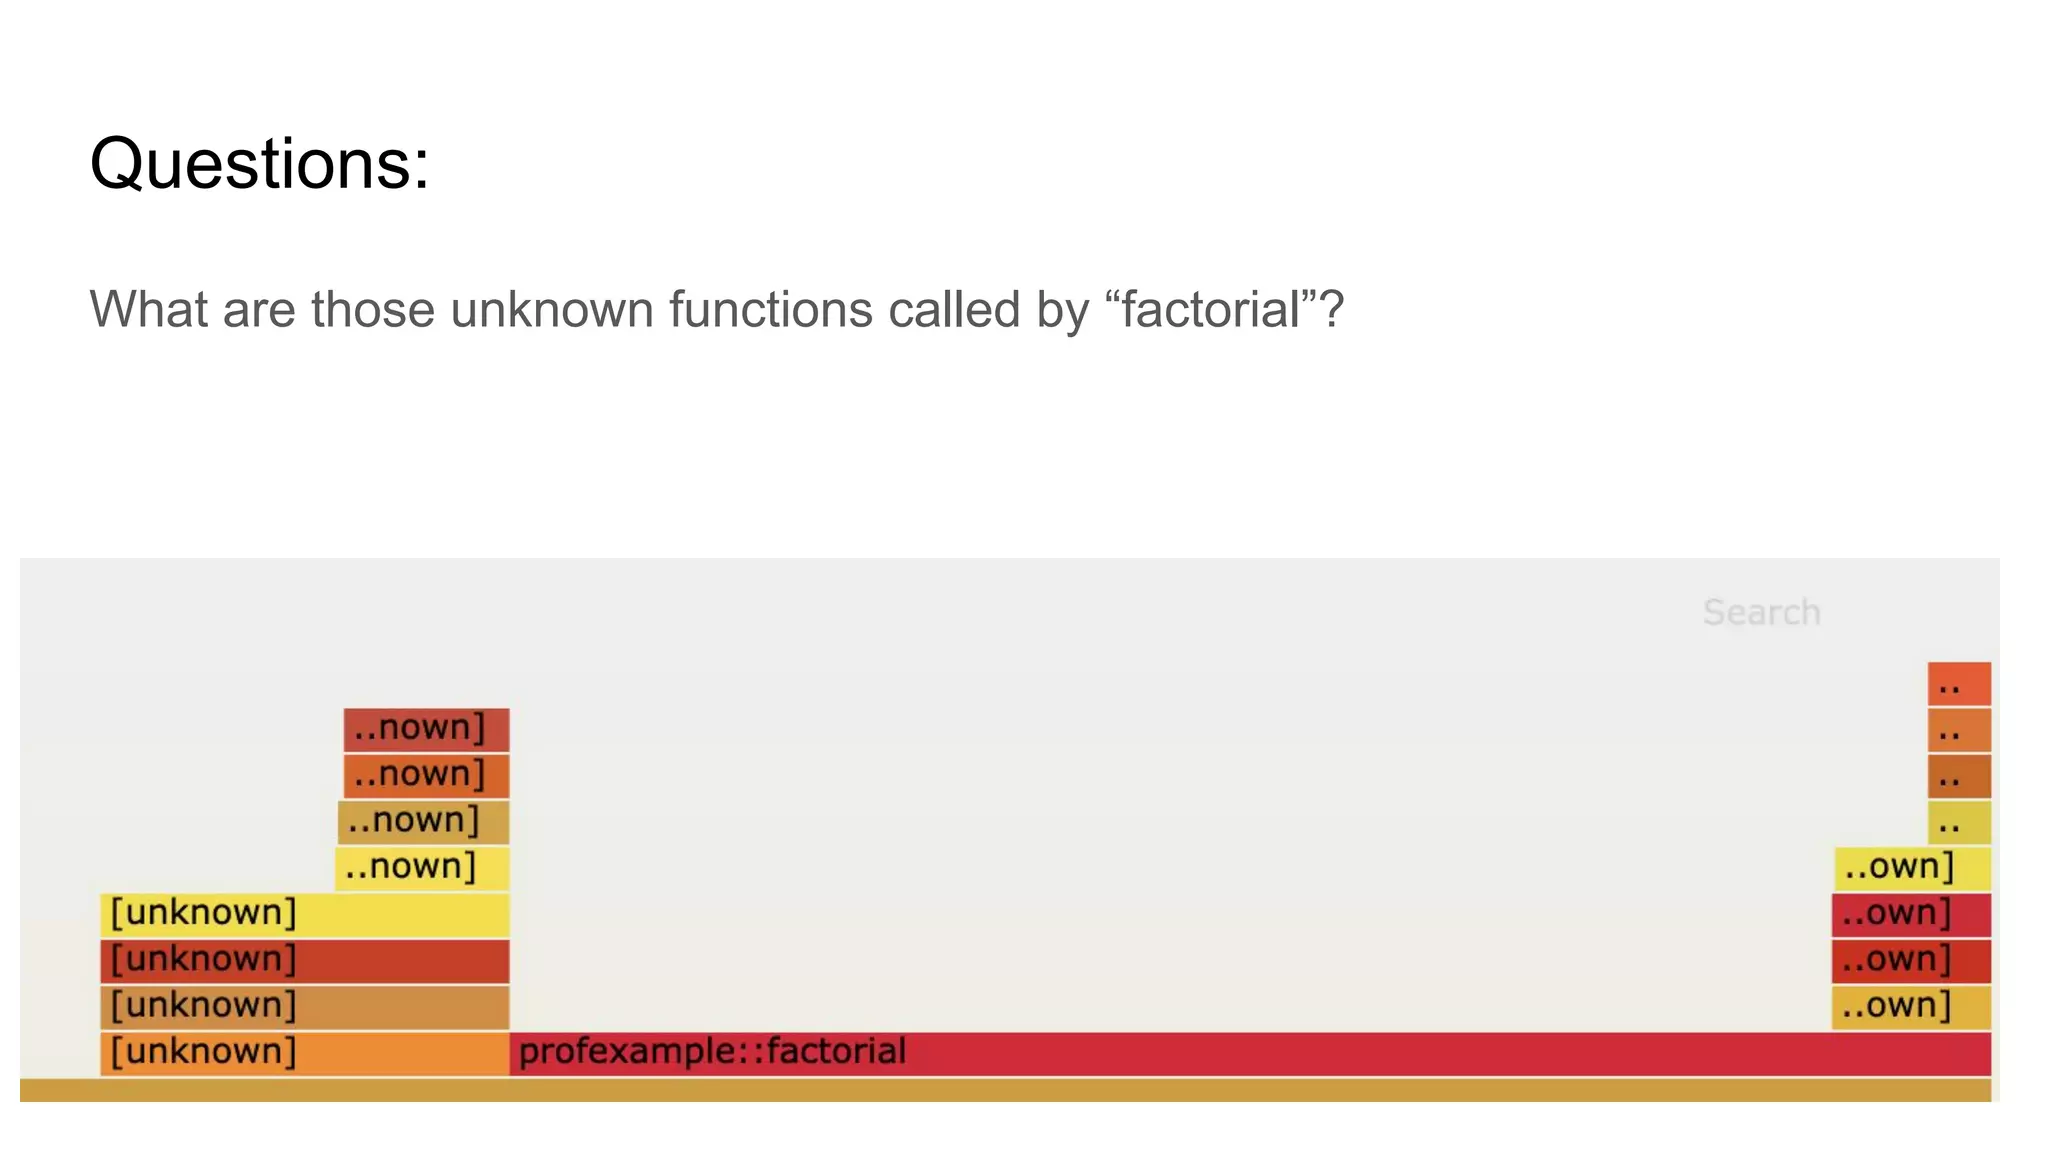
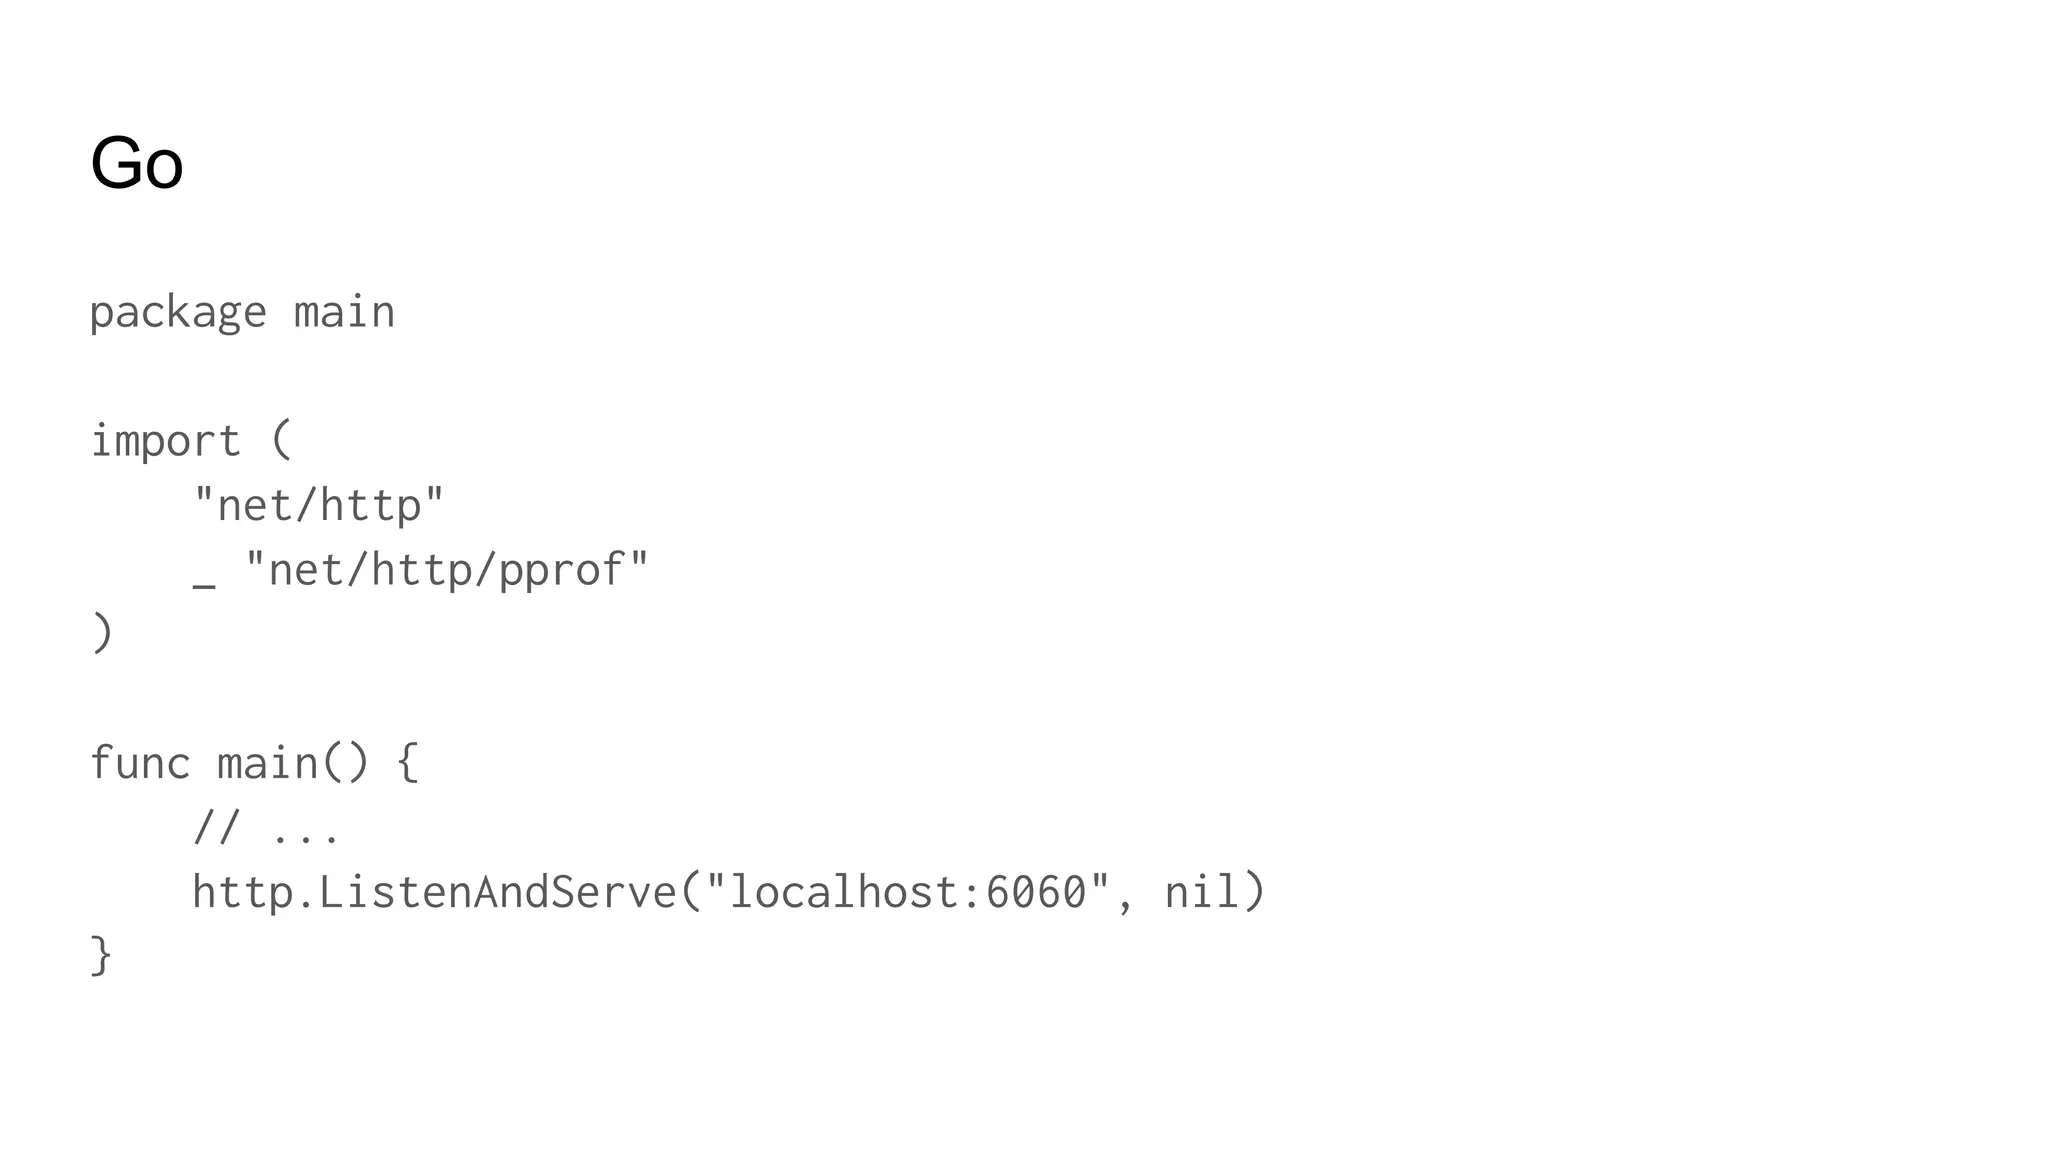
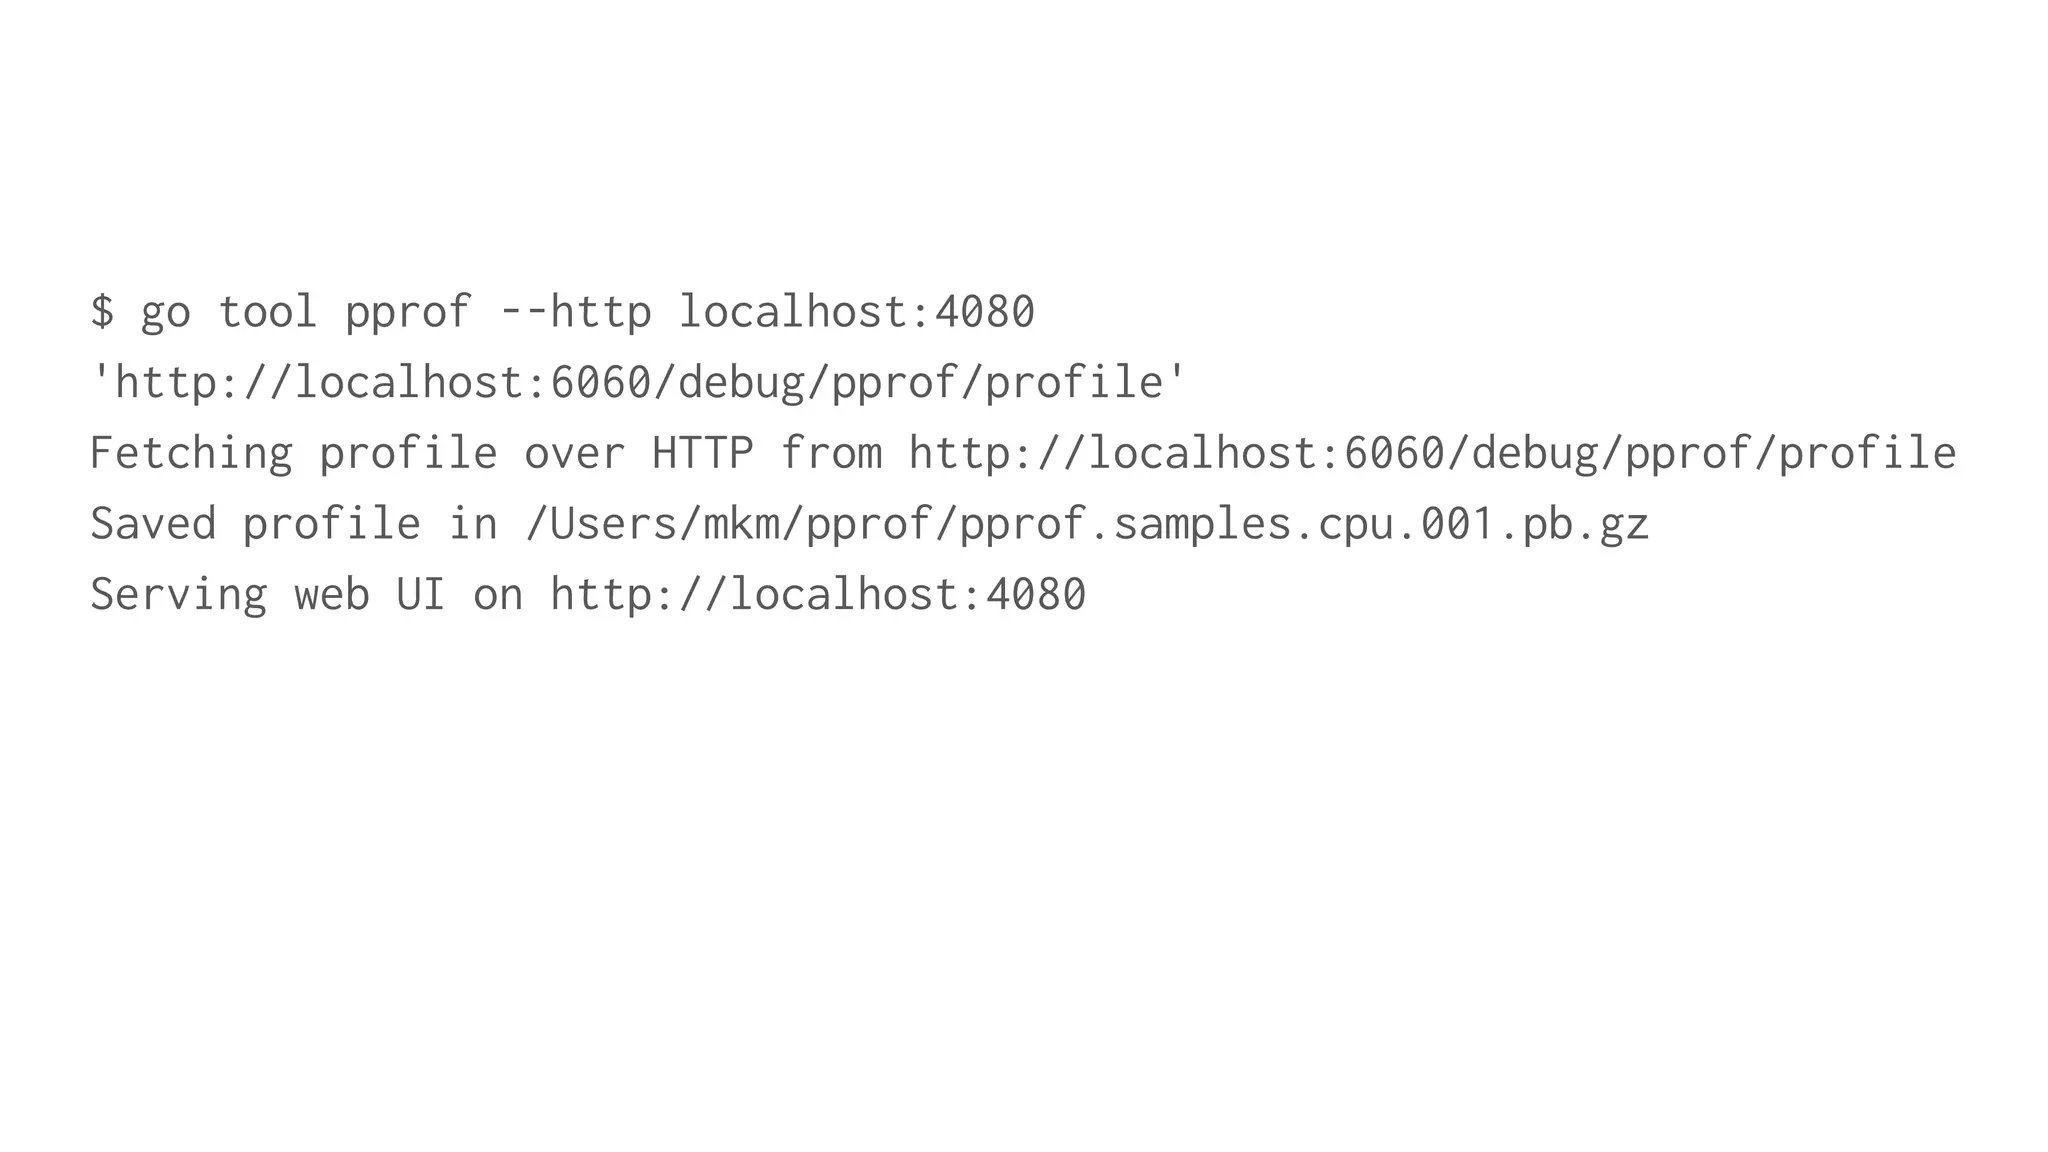
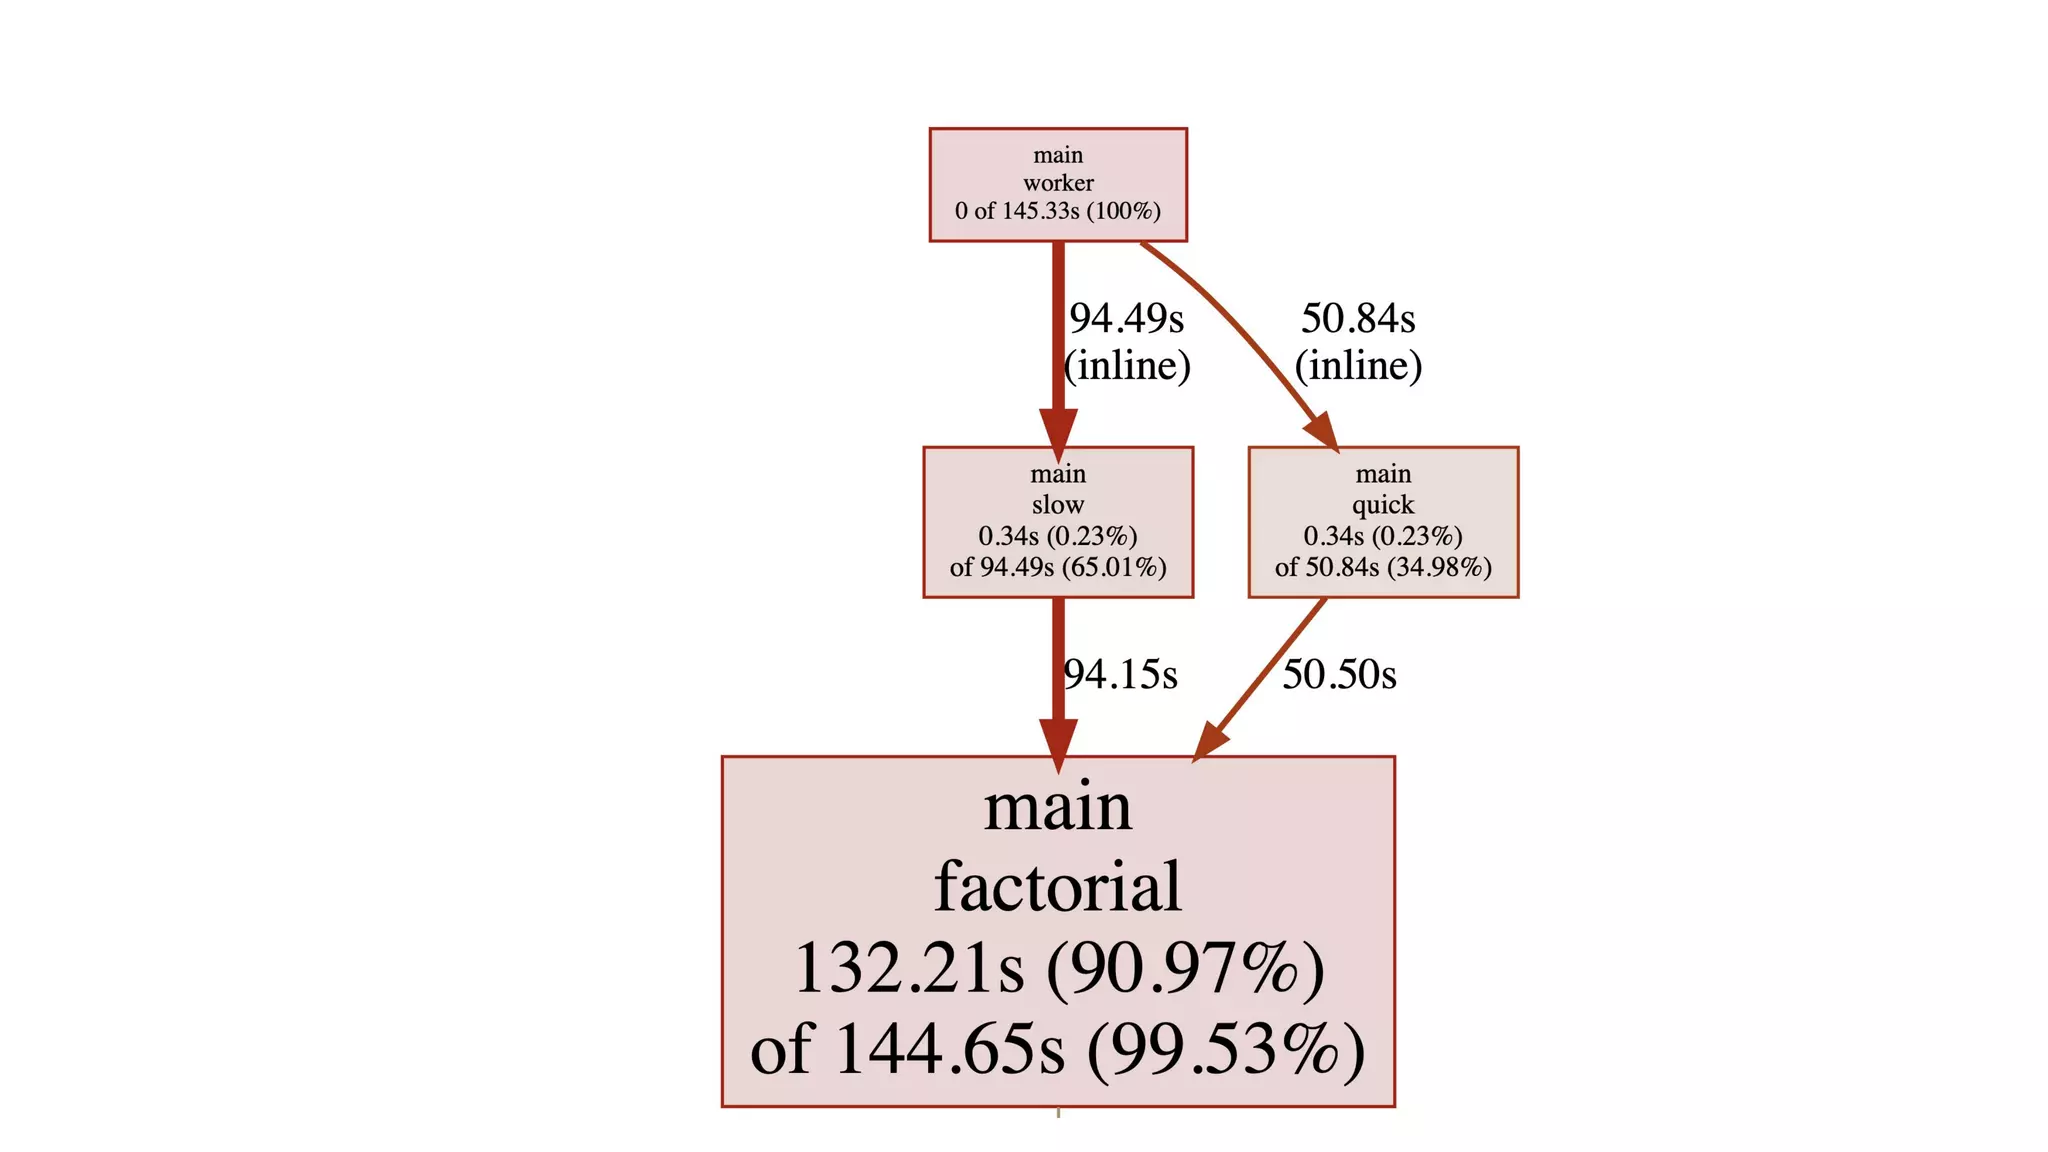
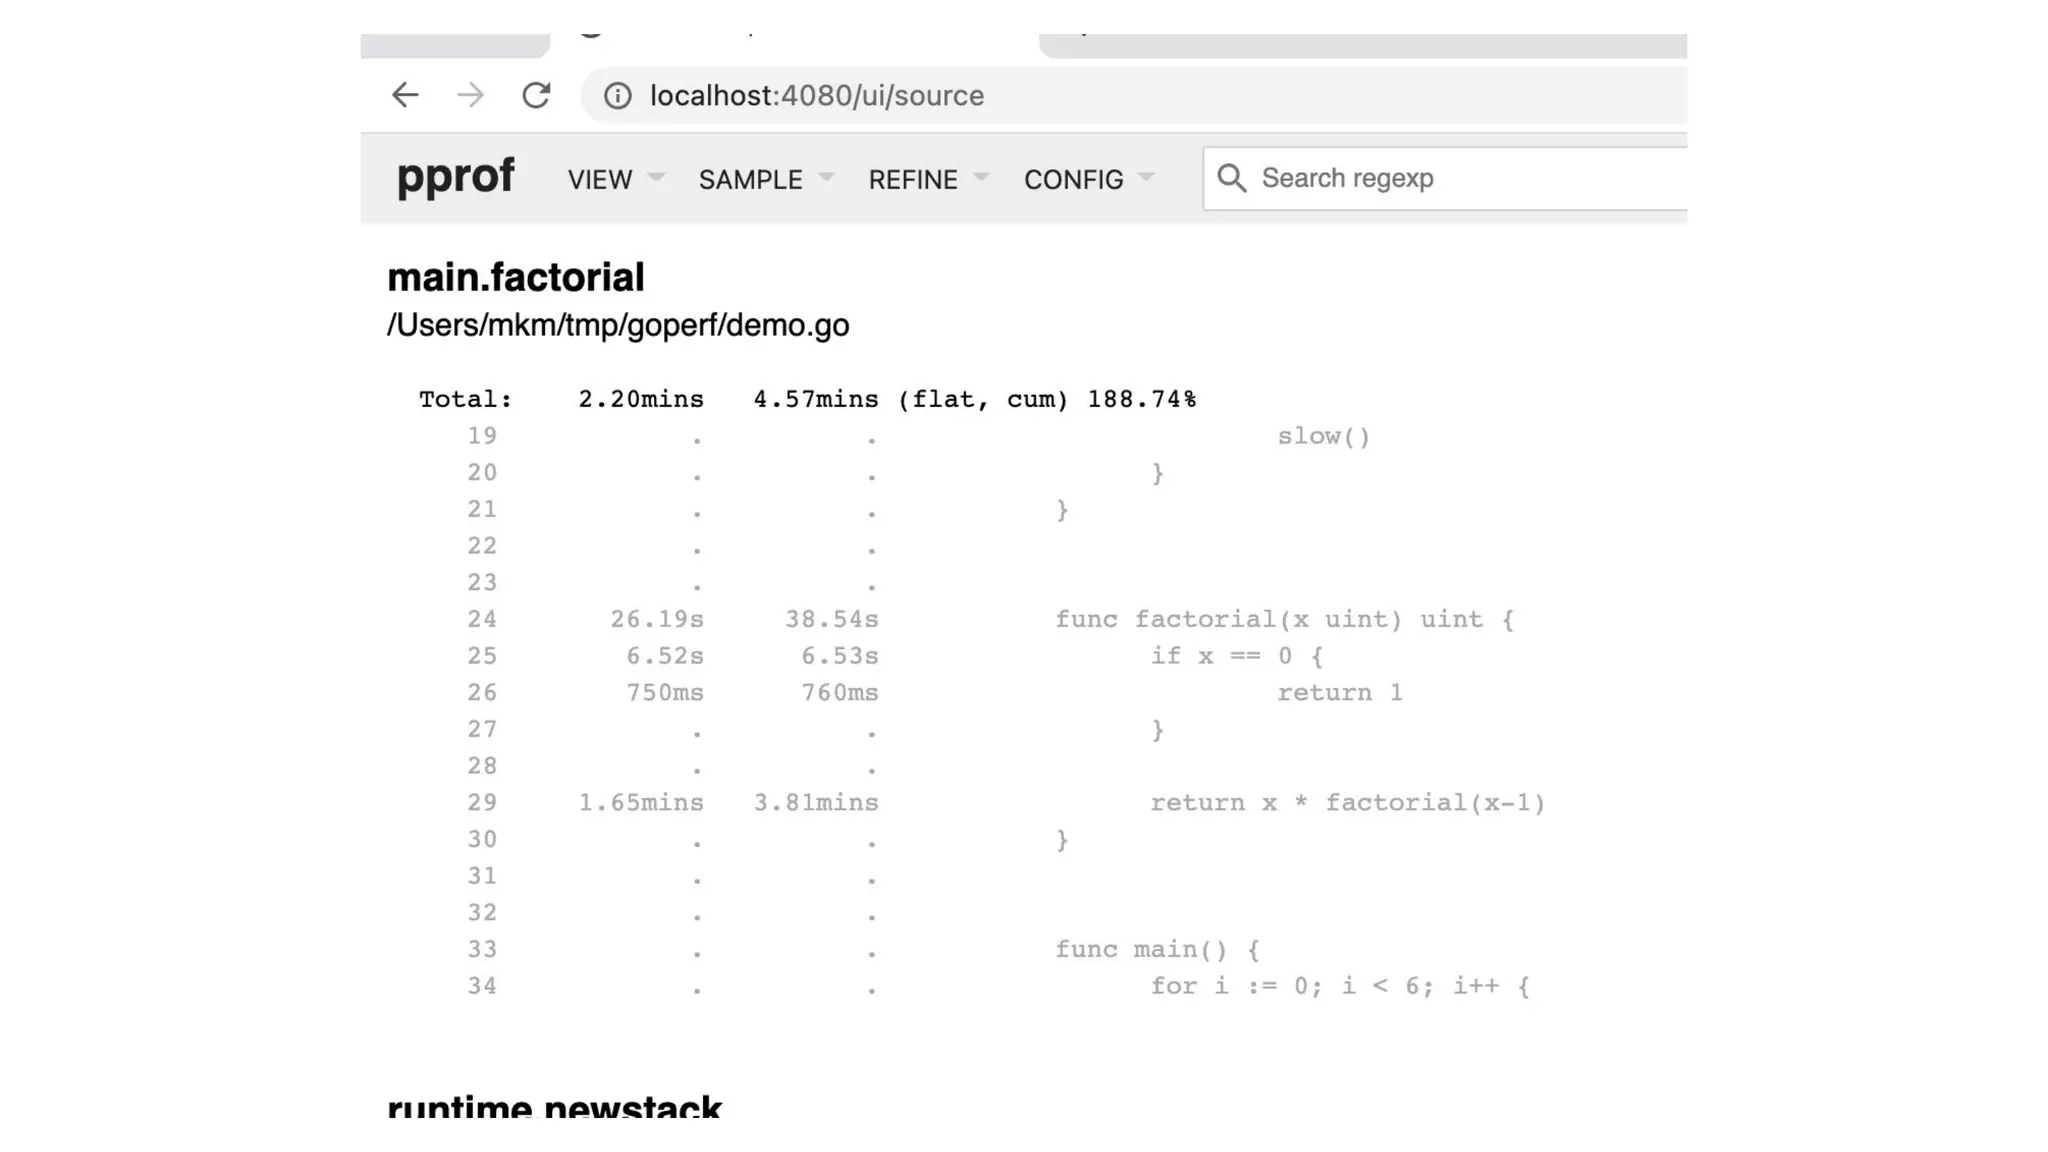
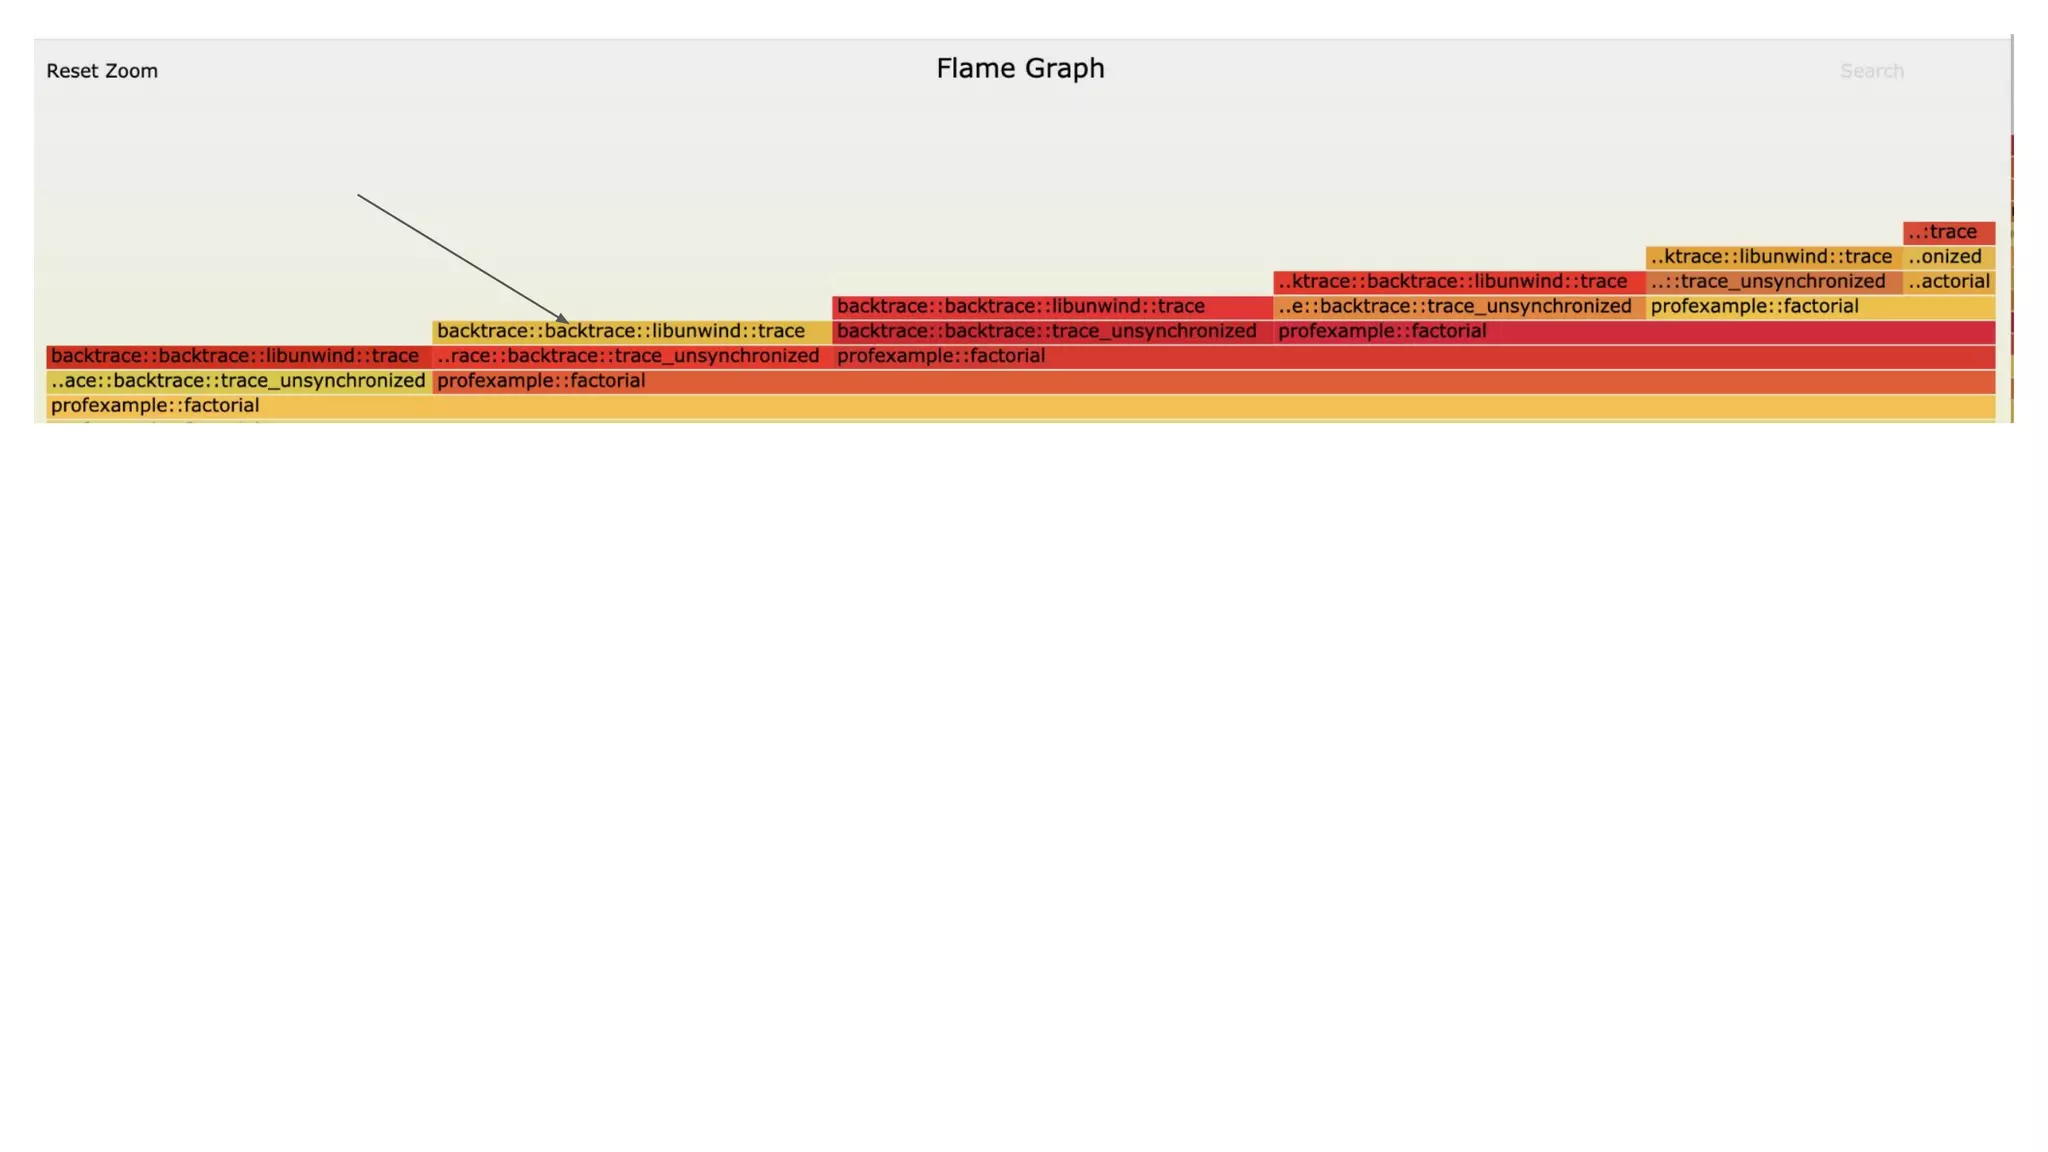
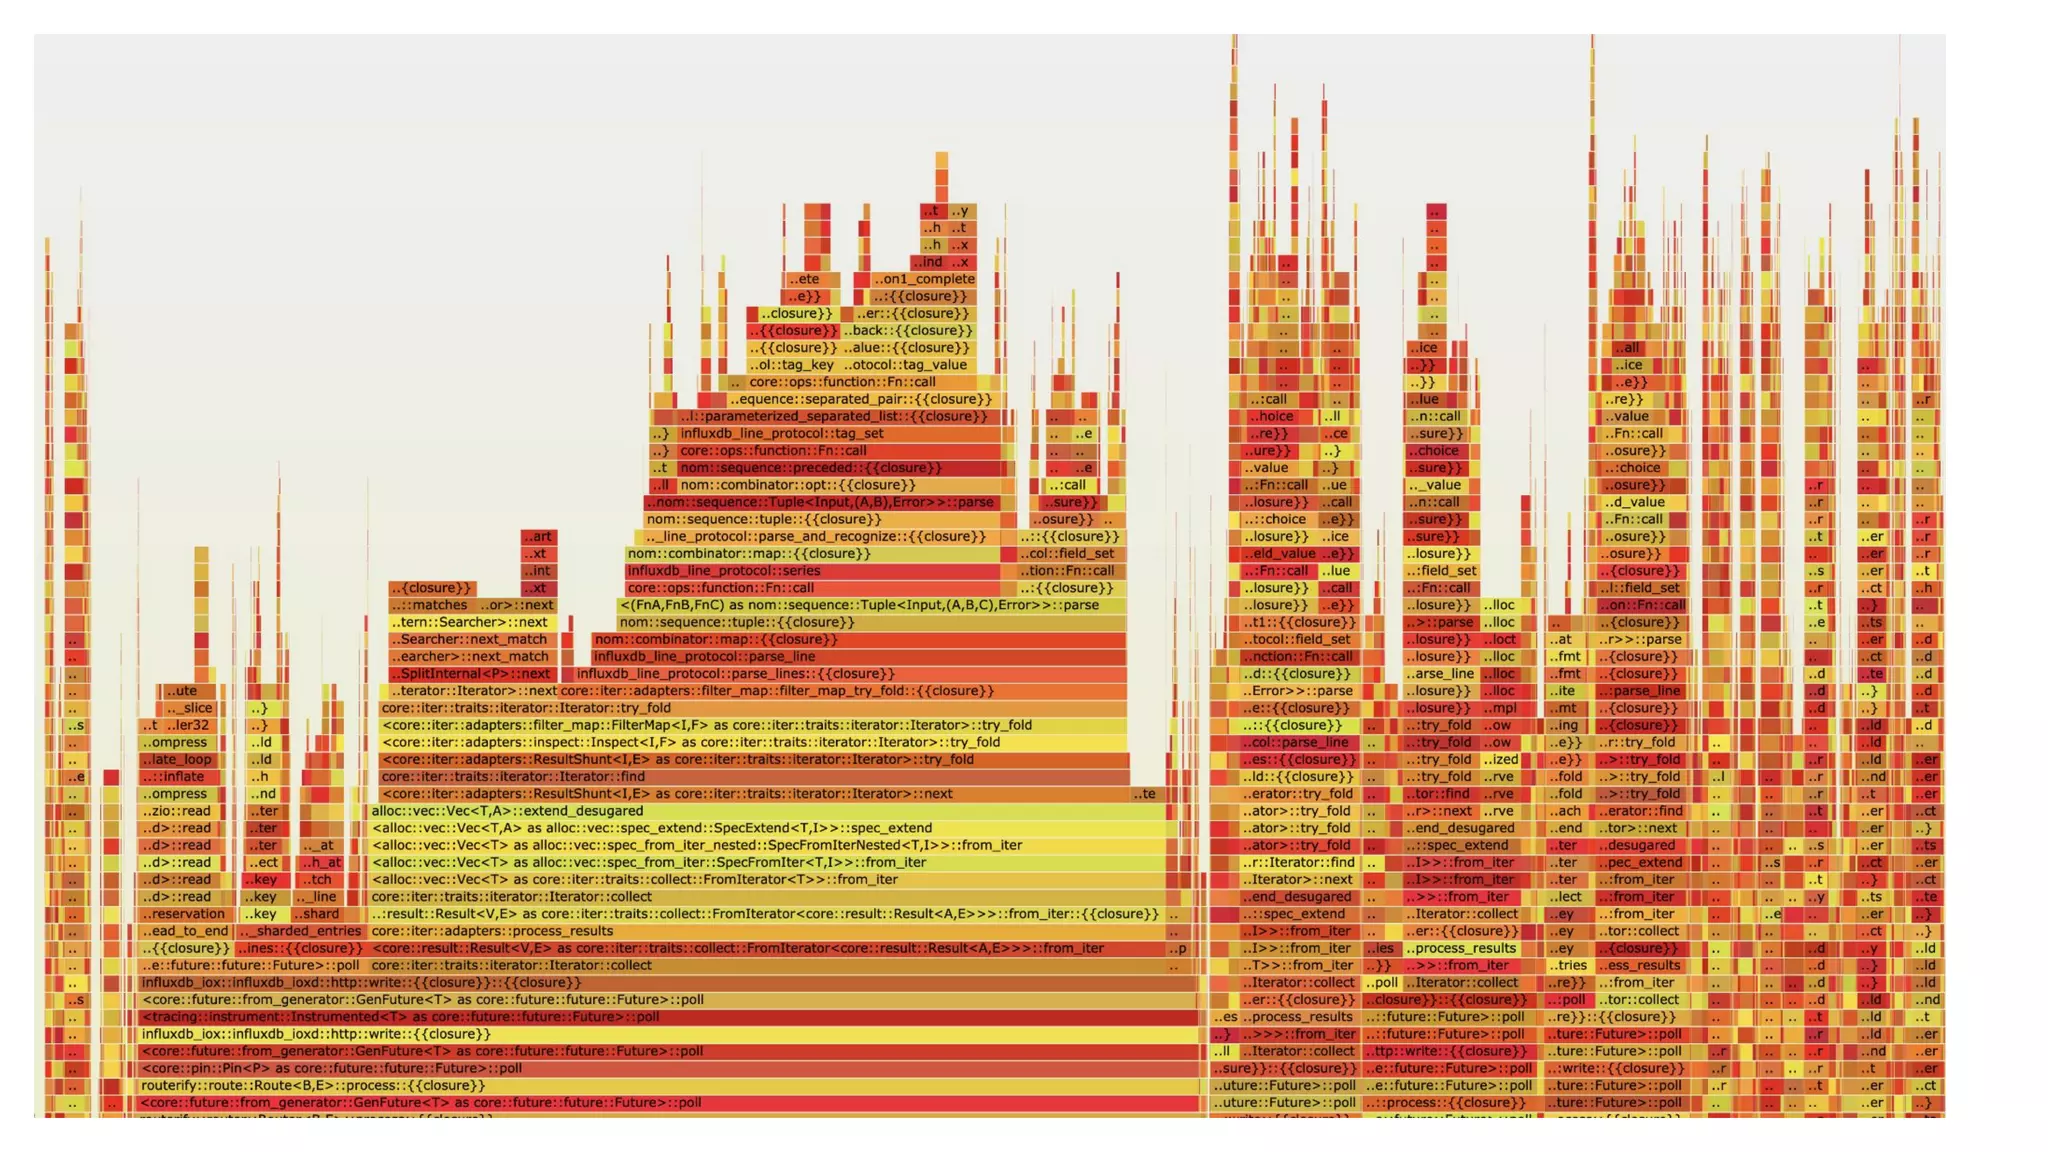
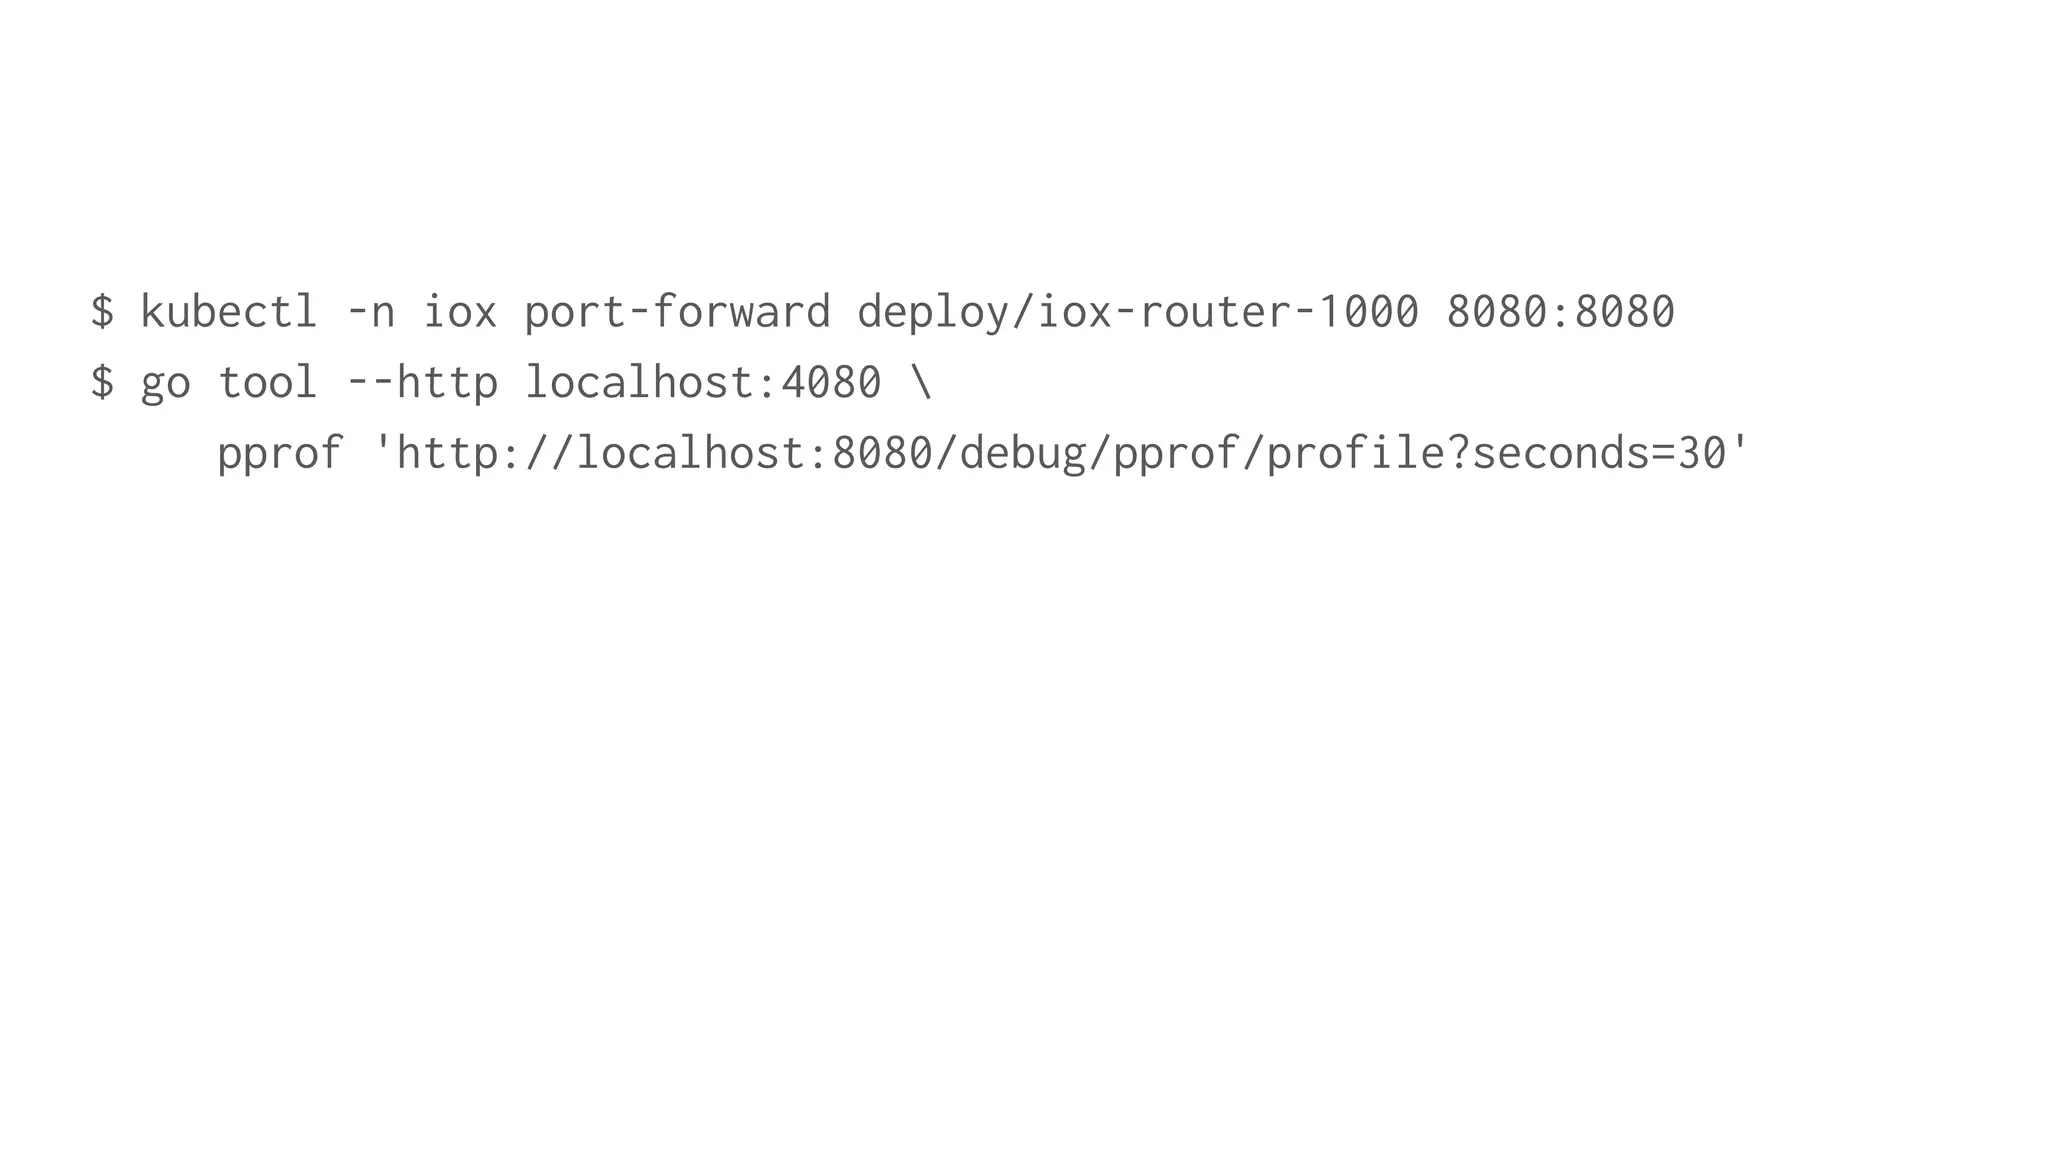
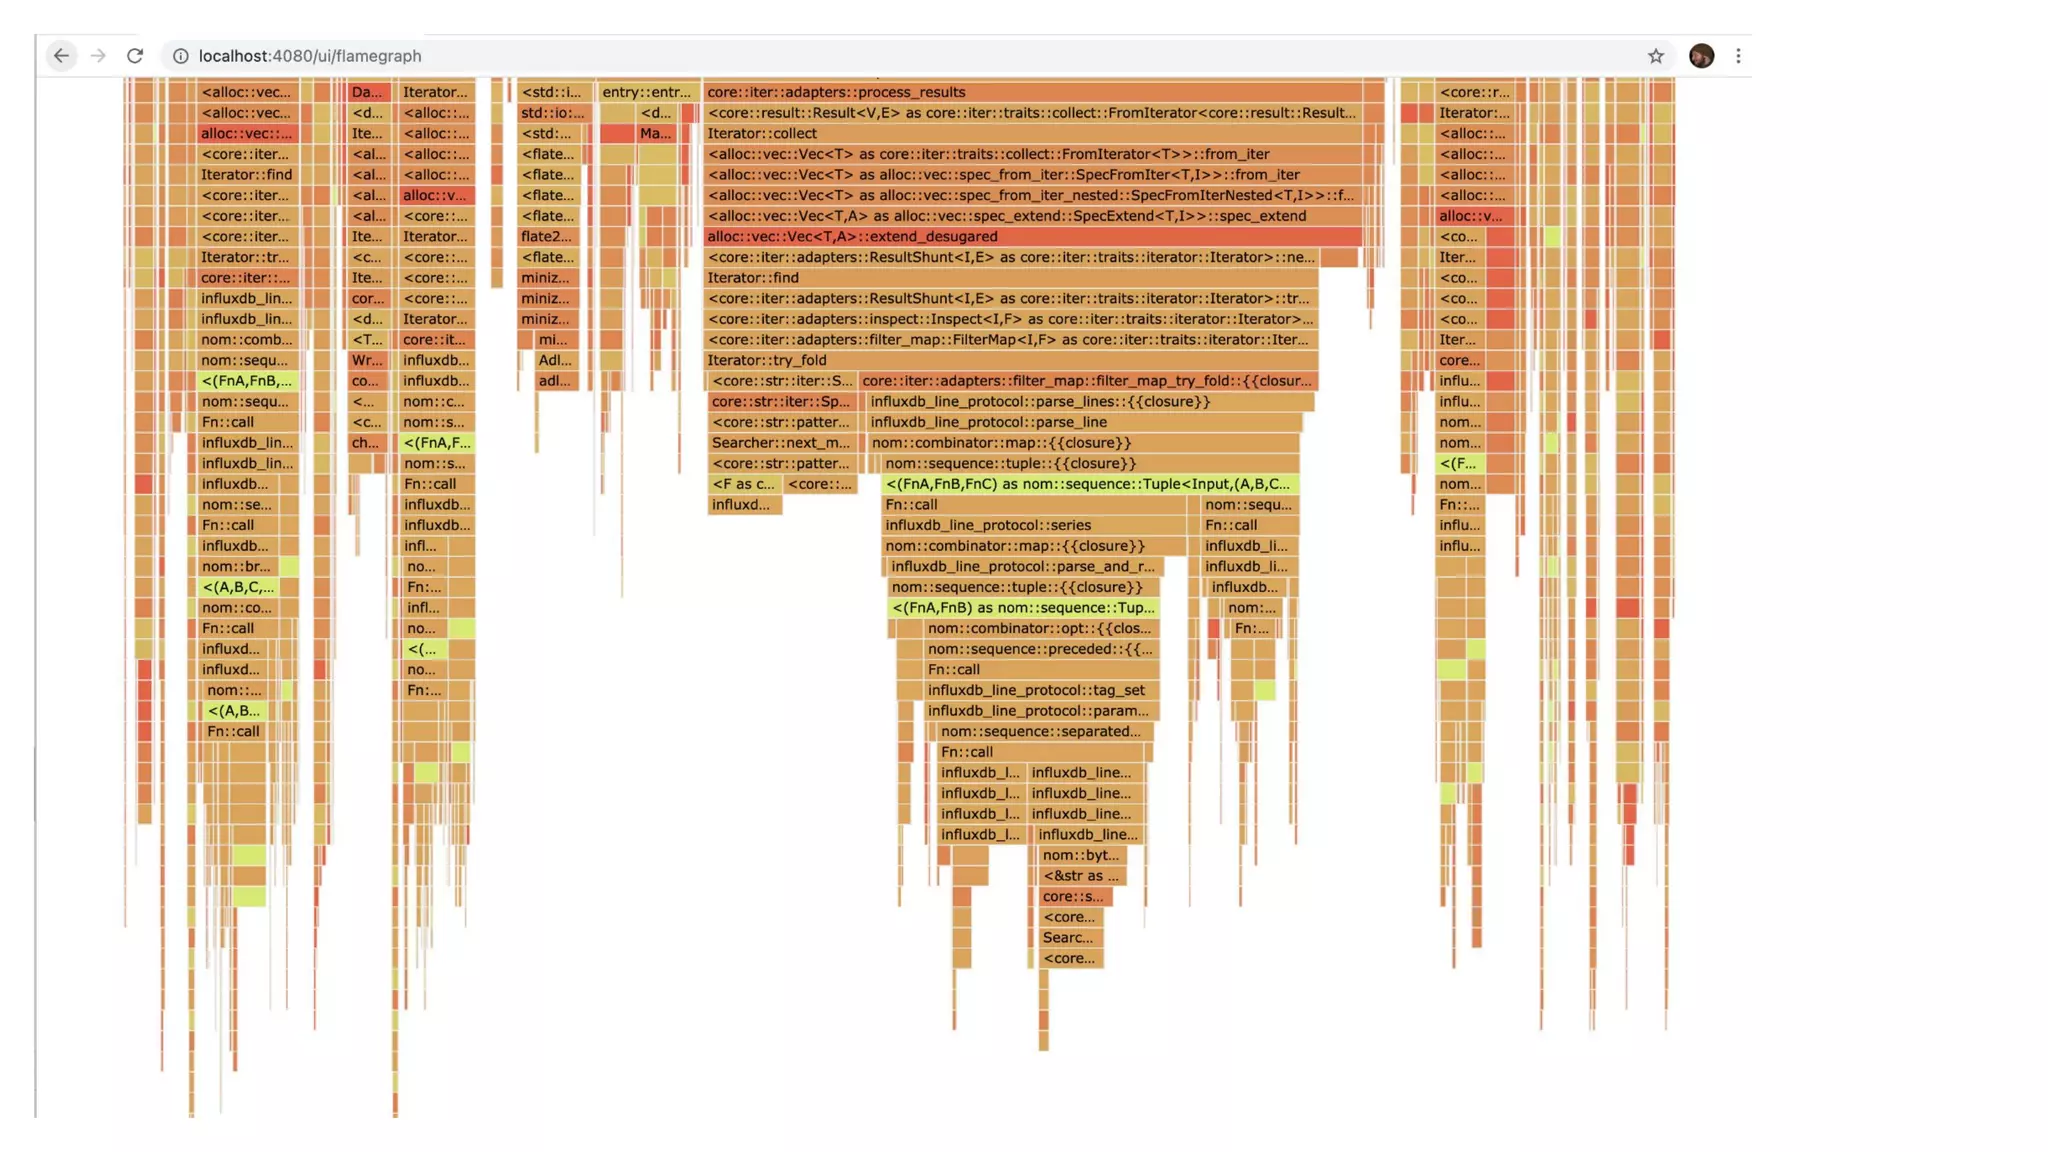
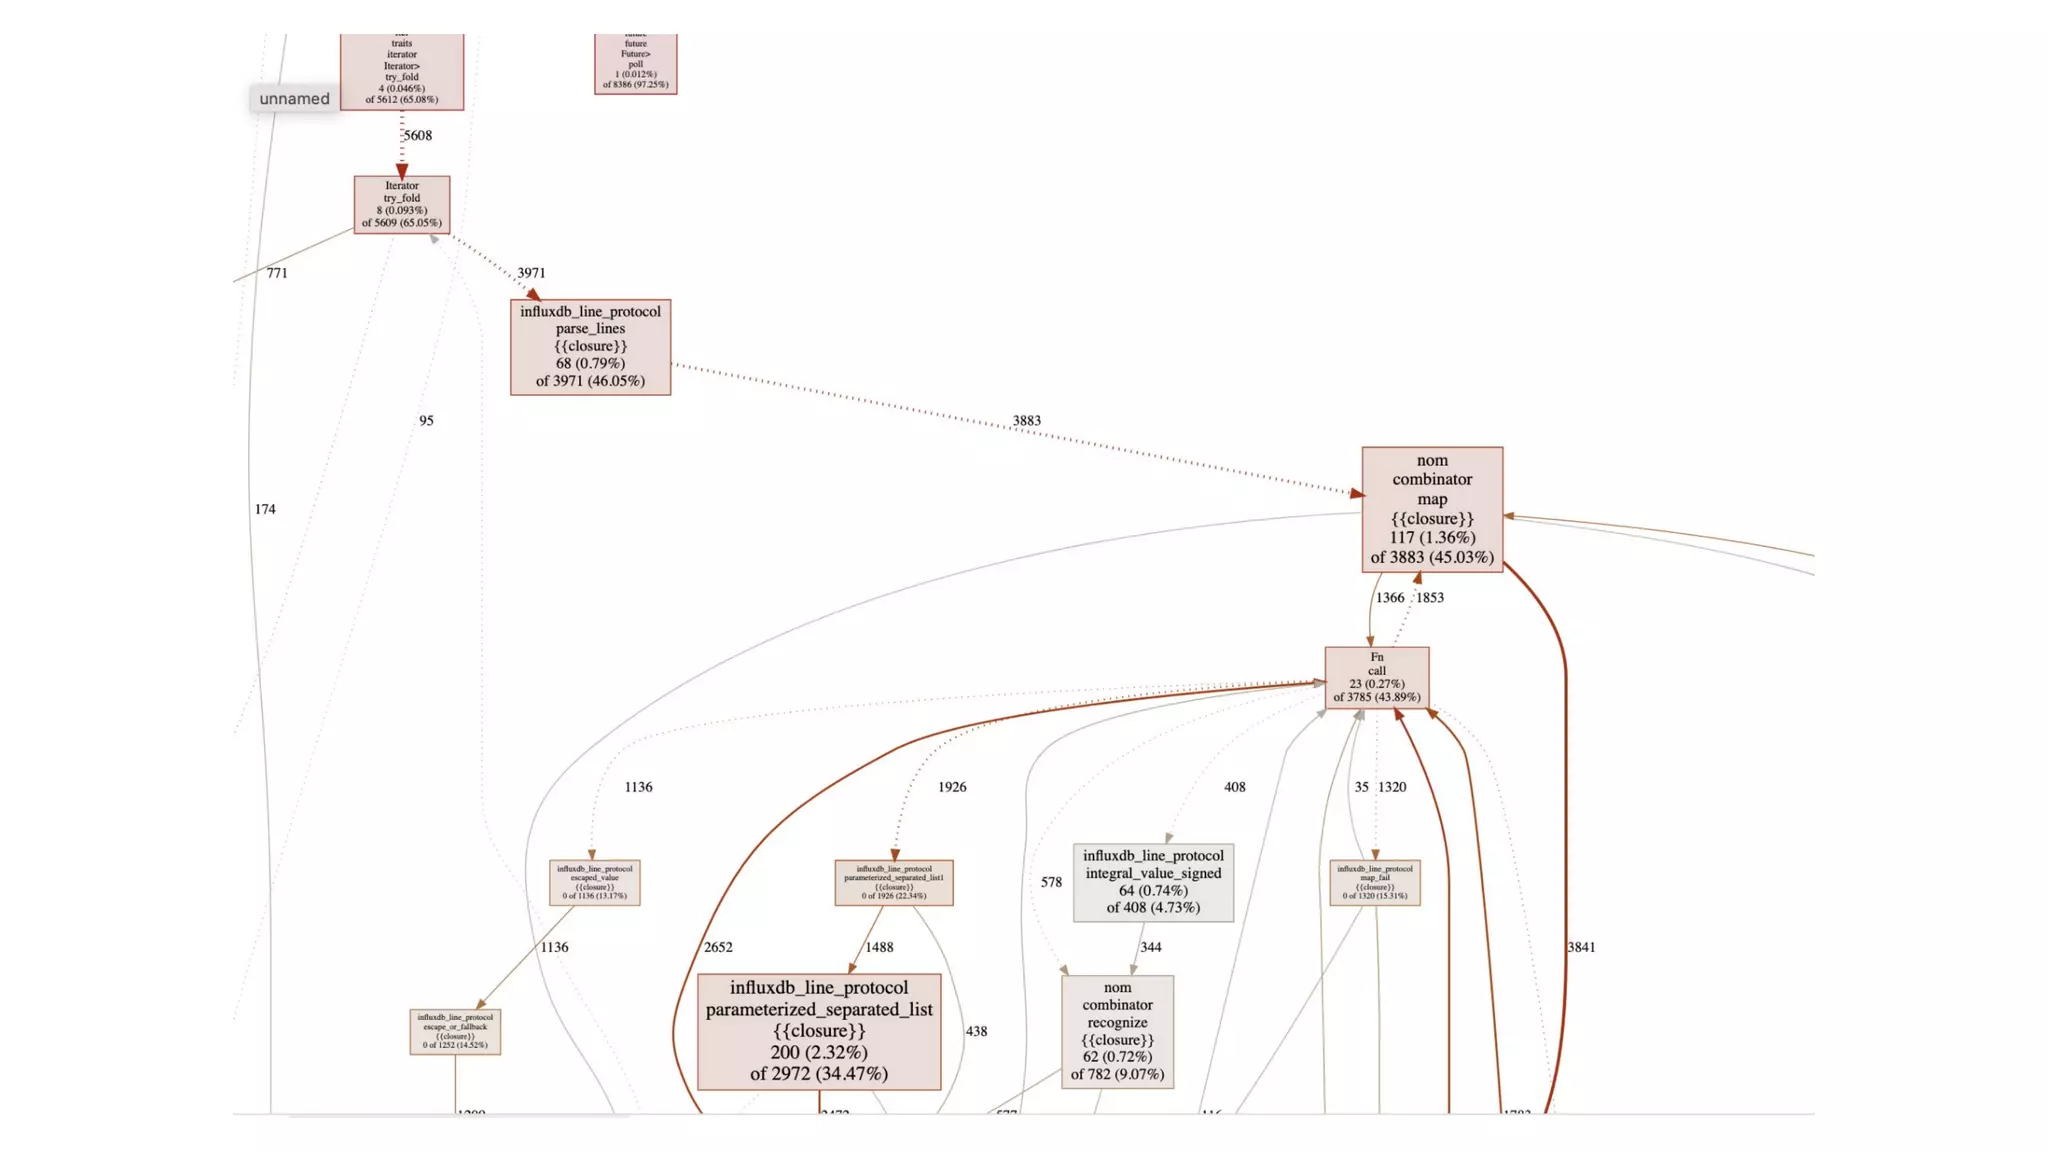
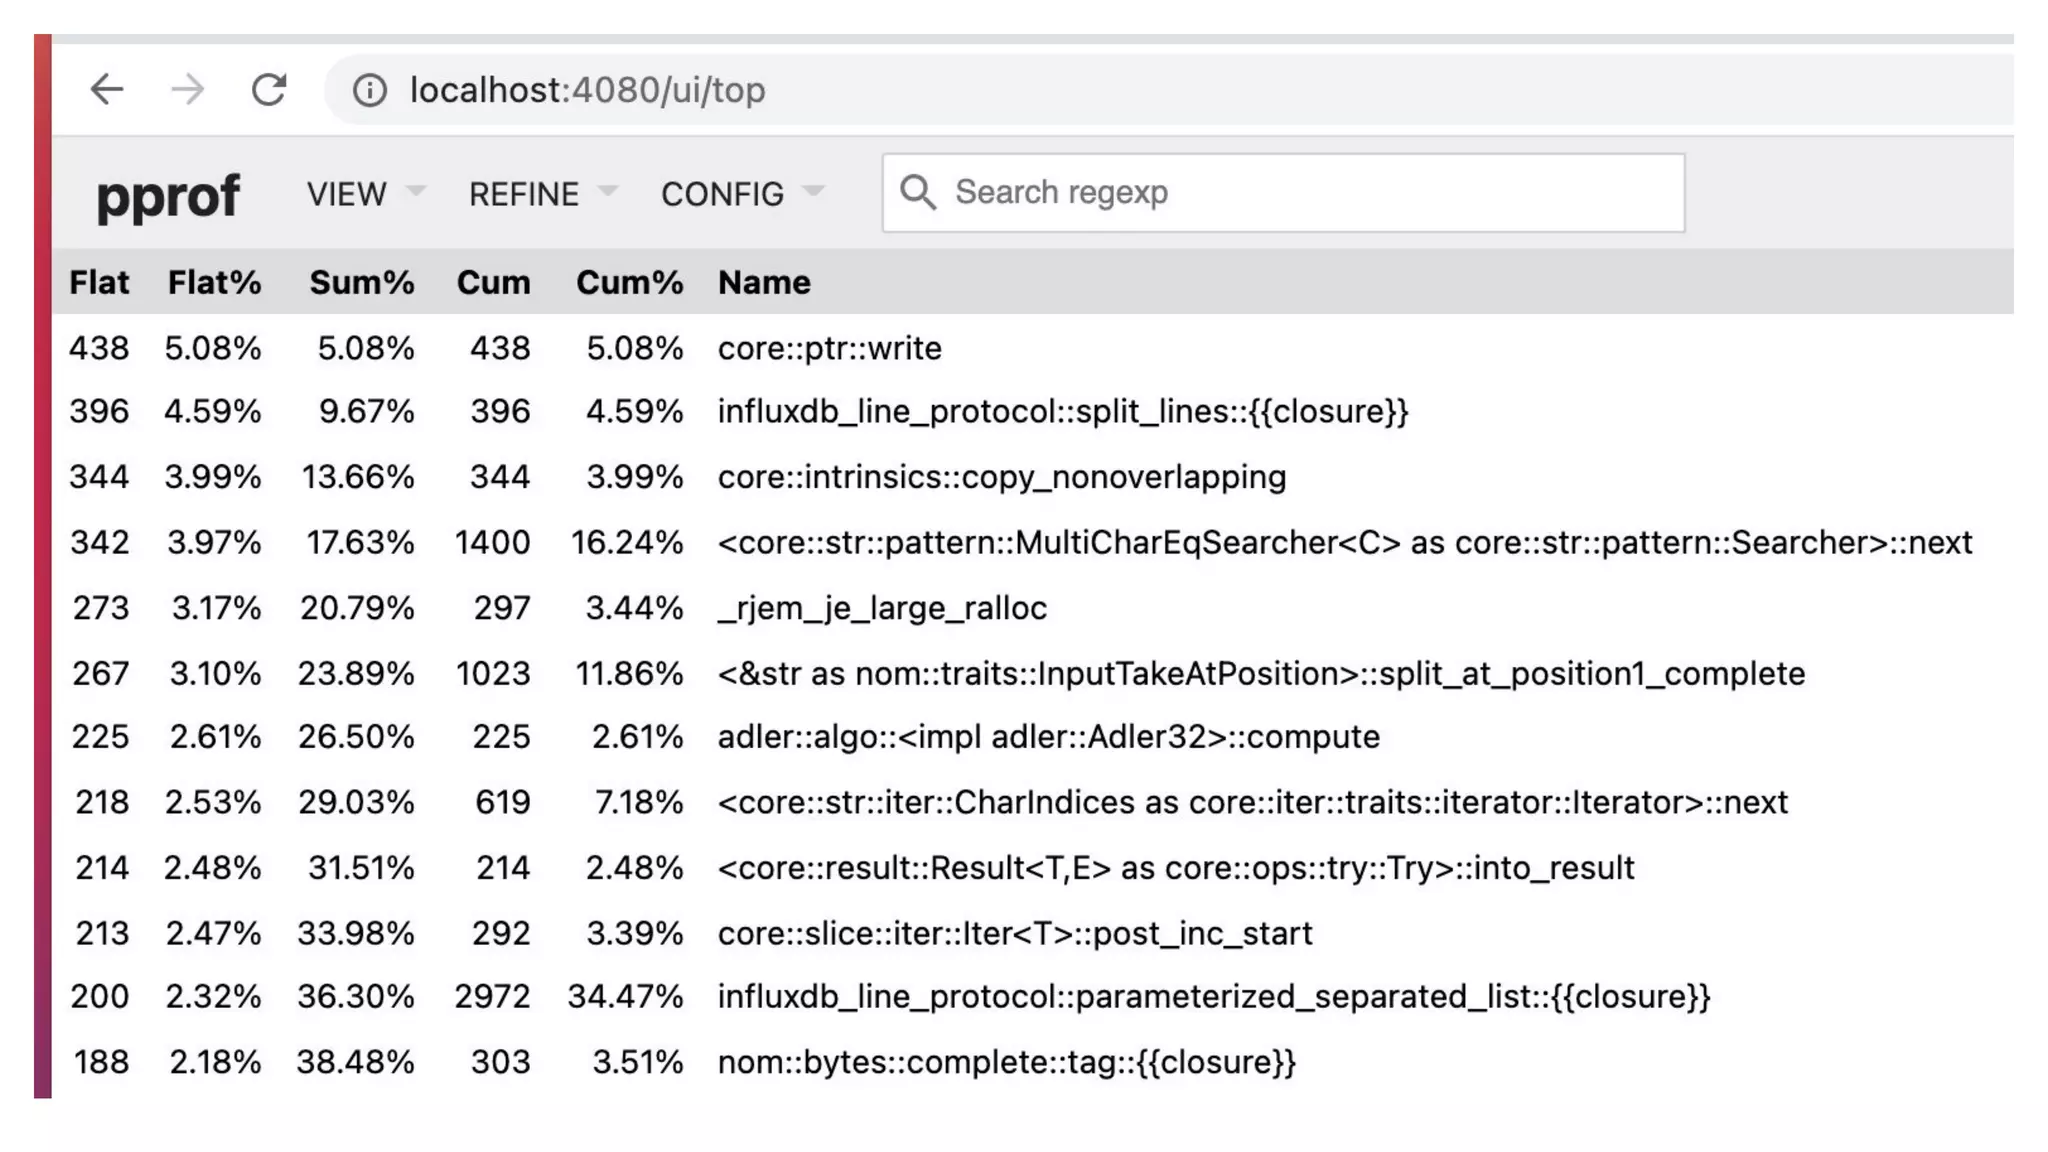
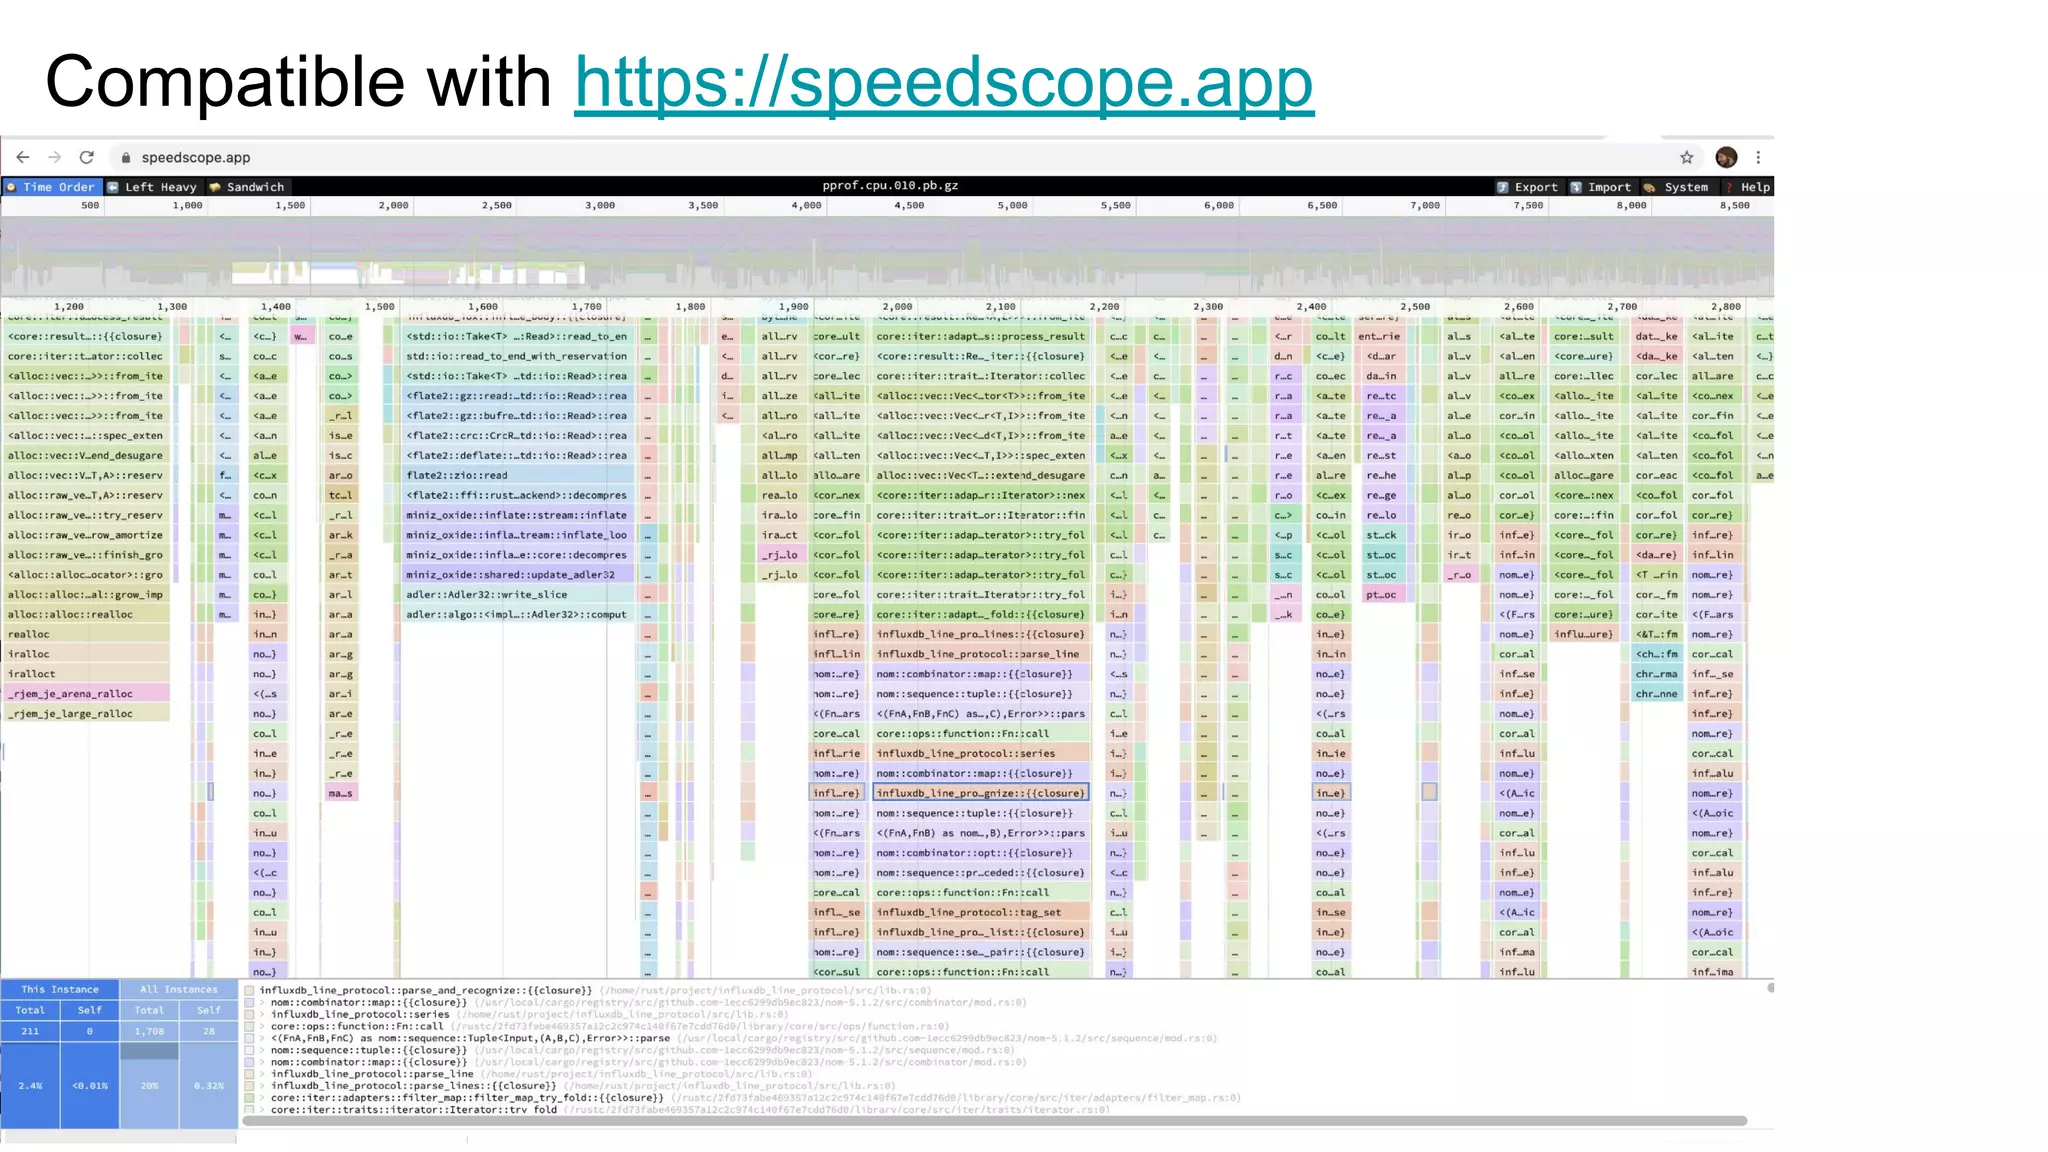
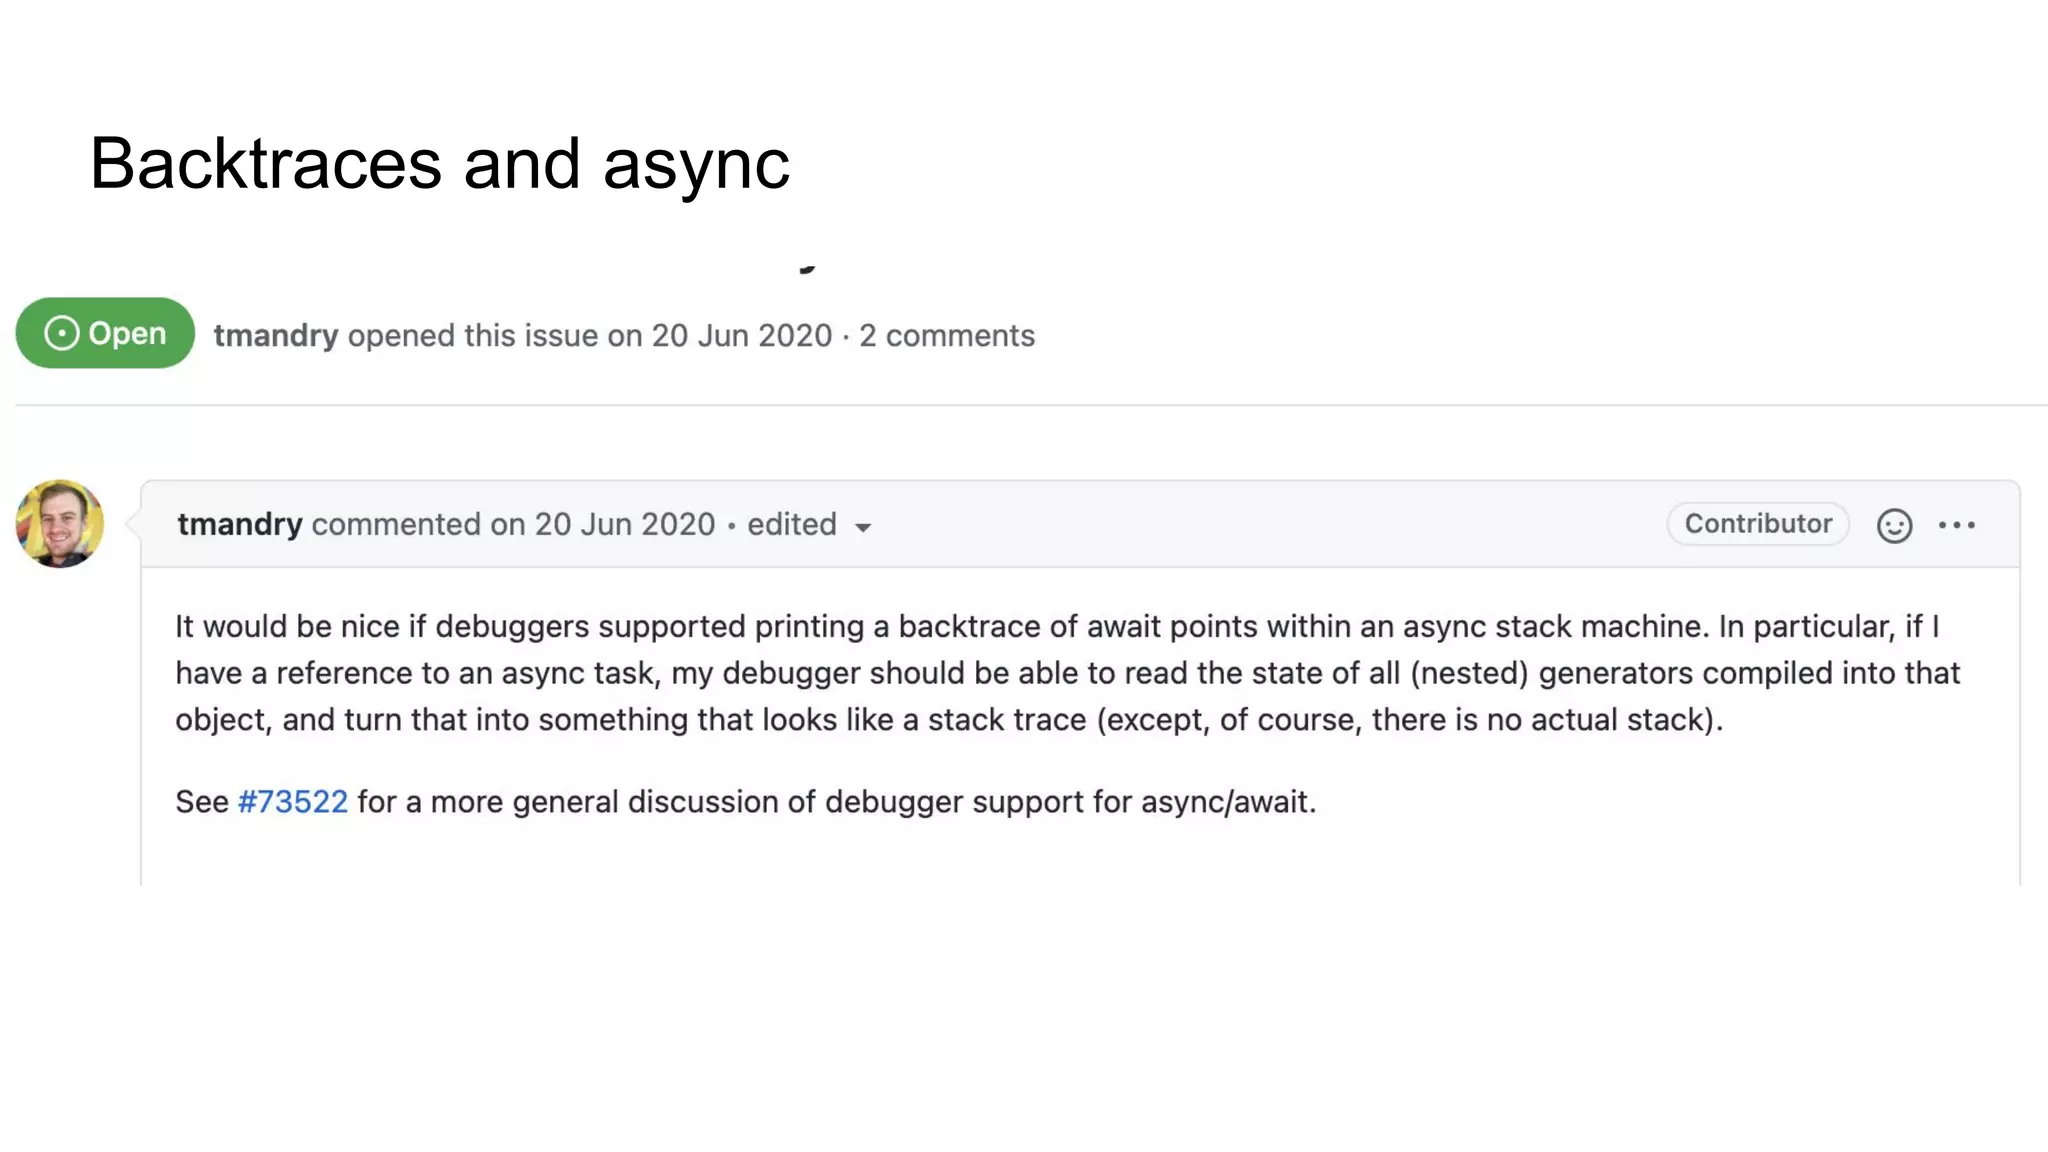
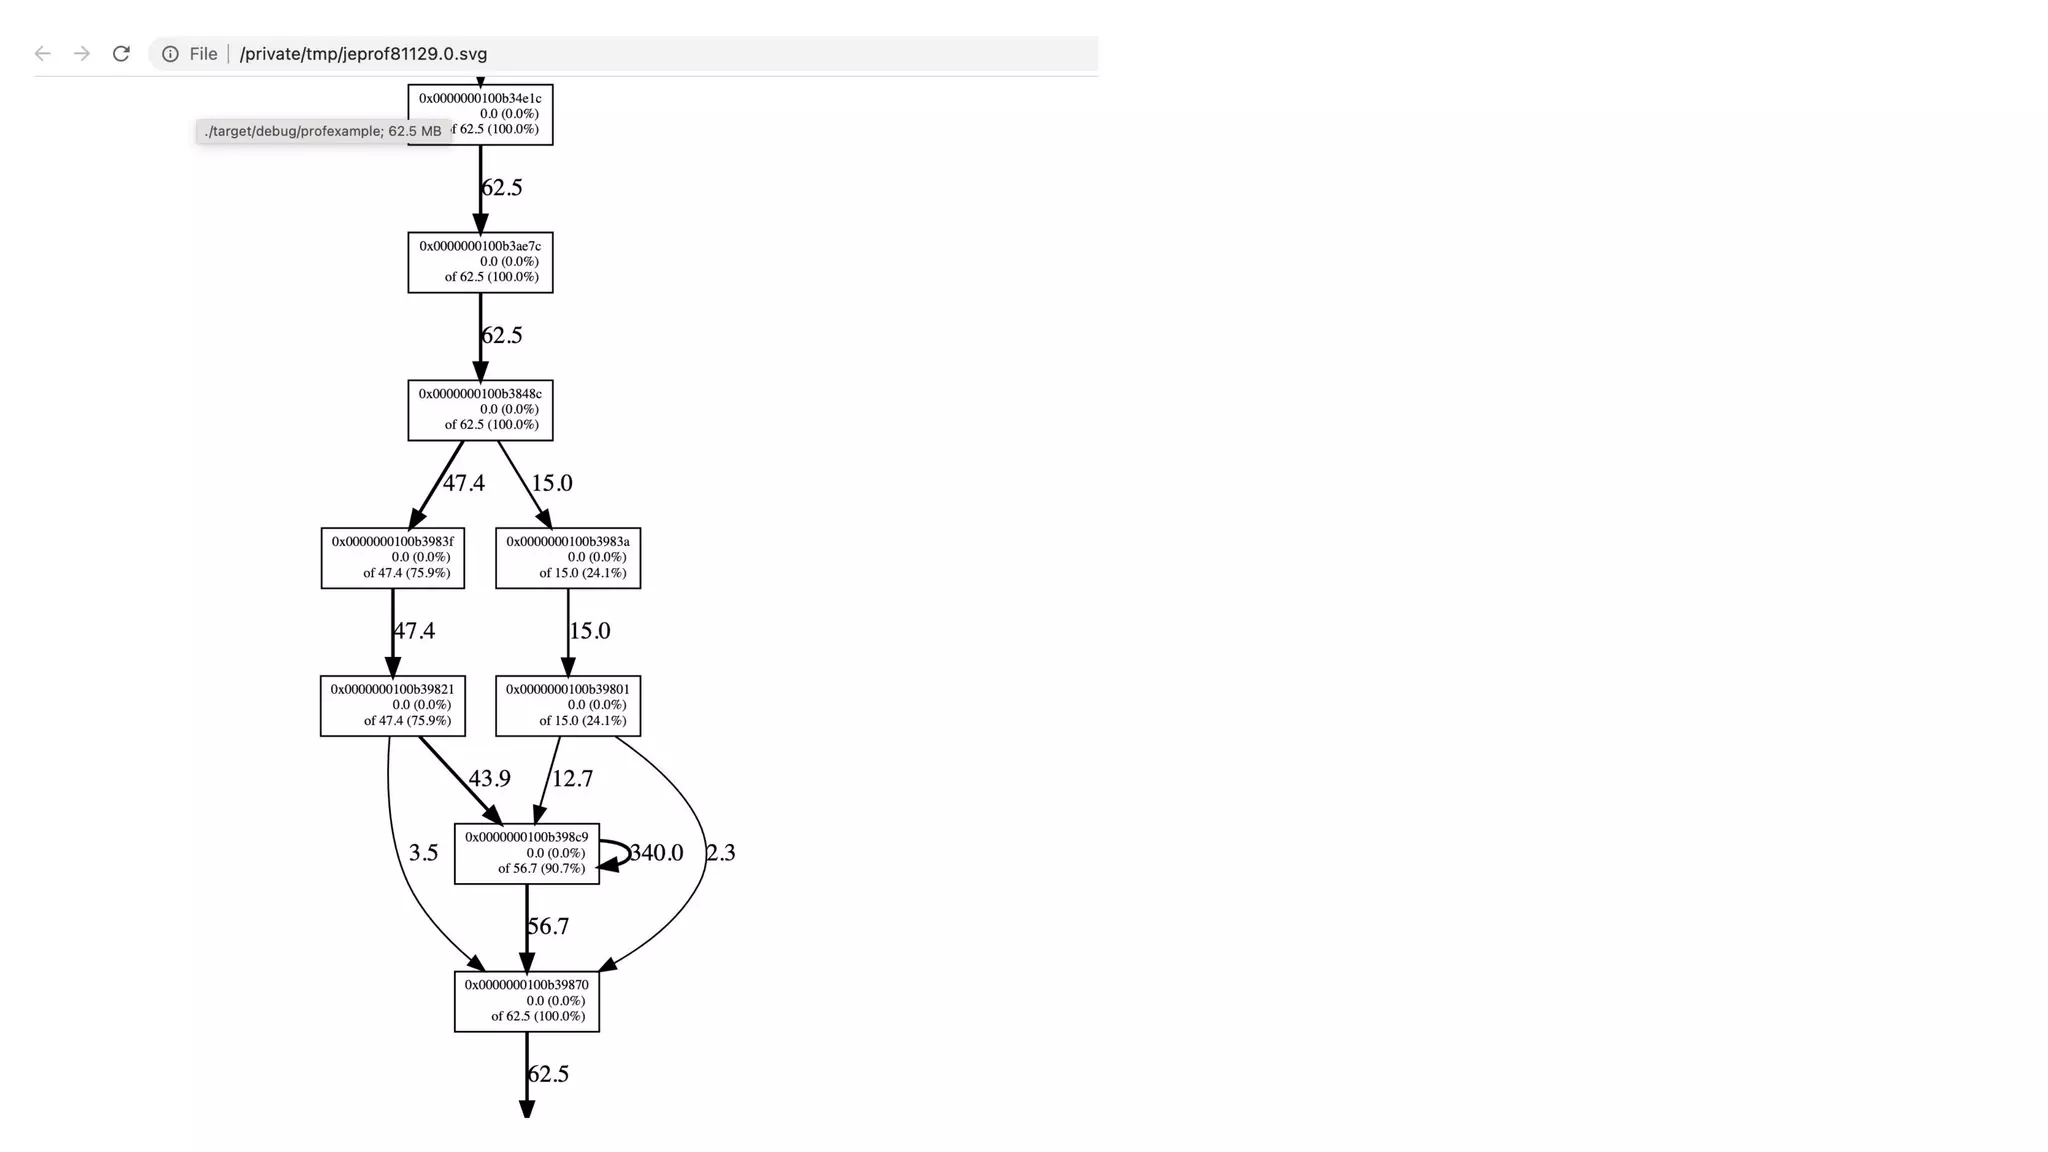
The document discusses various techniques for profiling CPU and memory performance in Rust programs, including: - Using the flamegraph tool to profile CPU usage by sampling a running process and generating flame graphs. - Integrating pprof profiling into Rust programs to expose profiles over HTTP similar to how it works in Go. - Profiling heap usage by integrating jemalloc profiling and generating heap profiles on program exit. - Some challenges with profiling asynchronous Rust programs due to the lack of backtraces. The key takeaways are that there are crates like pprof-rs and techniques like jemalloc integration that allow collecting CPU and memory profiles from Rust programs, but profiling asynchronous programs


![[ CNCF Q1 2024 ] Intro to Continuous Profiling and Grafana Pyroscope.pdf](https://cdn.slidesharecdn.com/ss_thumbnails/cncfq12024introtocontinuousprofilingandgrafanapyroscope-240407162420-9c15afb7-thumbnail.jpg?width=600ounds&width=560&fit=bounds)


![Ward Bowman [PTC] | ThingWorx Long-Term Data Storage with InfluxDB | InfluxDa...](https://cdn.slidesharecdn.com/ss_thumbnails/influxdays-221027185325-5d2f430b-thumbnail.jpg?width=600ounds&width=560&fit=bounds)
![Scott Anderson [InfluxData] | New & Upcoming Flux Features | InfluxDays 2022](https://cdn.slidesharecdn.com/ss_thumbnails/influxdays2022-fluxupdates-scott-221021210238-9d323cba-thumbnail.jpg?width=600ounds&width=560&fit=bounds)
![Steinkamp, Clifford [InfluxData] | Closing Thoughts | InfluxDays 2022](https://cdn.slidesharecdn.com/ss_thumbnails/influxdays2022closingthoughtsday2-221020220104-abde55ea-thumbnail.jpg?width=600ounds&width=560&fit=bounds)
![Steinkamp, Clifford [InfluxData] | Welcome to InfluxDays 2022 - Day 2 | Influ...](https://cdn.slidesharecdn.com/ss_thumbnails/influxdays2022welcometoday2-221020215815-c8463942-thumbnail.jpg?width=600ounds&width=560&fit=bounds)
![Steinkamp, Clifford [InfluxData] | Closing Thoughts Day 1 | InfluxDays 2022](https://cdn.slidesharecdn.com/ss_thumbnails/influxdays2022closingthoughtsday1-221020215301-f8040e1f-thumbnail.jpg?width=600ounds&width=560&fit=bounds)


