
![The Seven Habits of Highly Effective Presentations [ 1 ] Start with a structured story [ 2 ] Standardize your design language [ 3 ] Standardize your written language [ 4 ] Animate to narrate, not exaggerate [ 5 ] Show with images, tell with voiceover [ 6 ] Build slides around the transition [ 7 ] Learn to love the presentation remote](https://image.slidesharecdn.com/persuading3-1210034841268967-8/85/Persuading-with-Powerpoint-2-320.jpg)
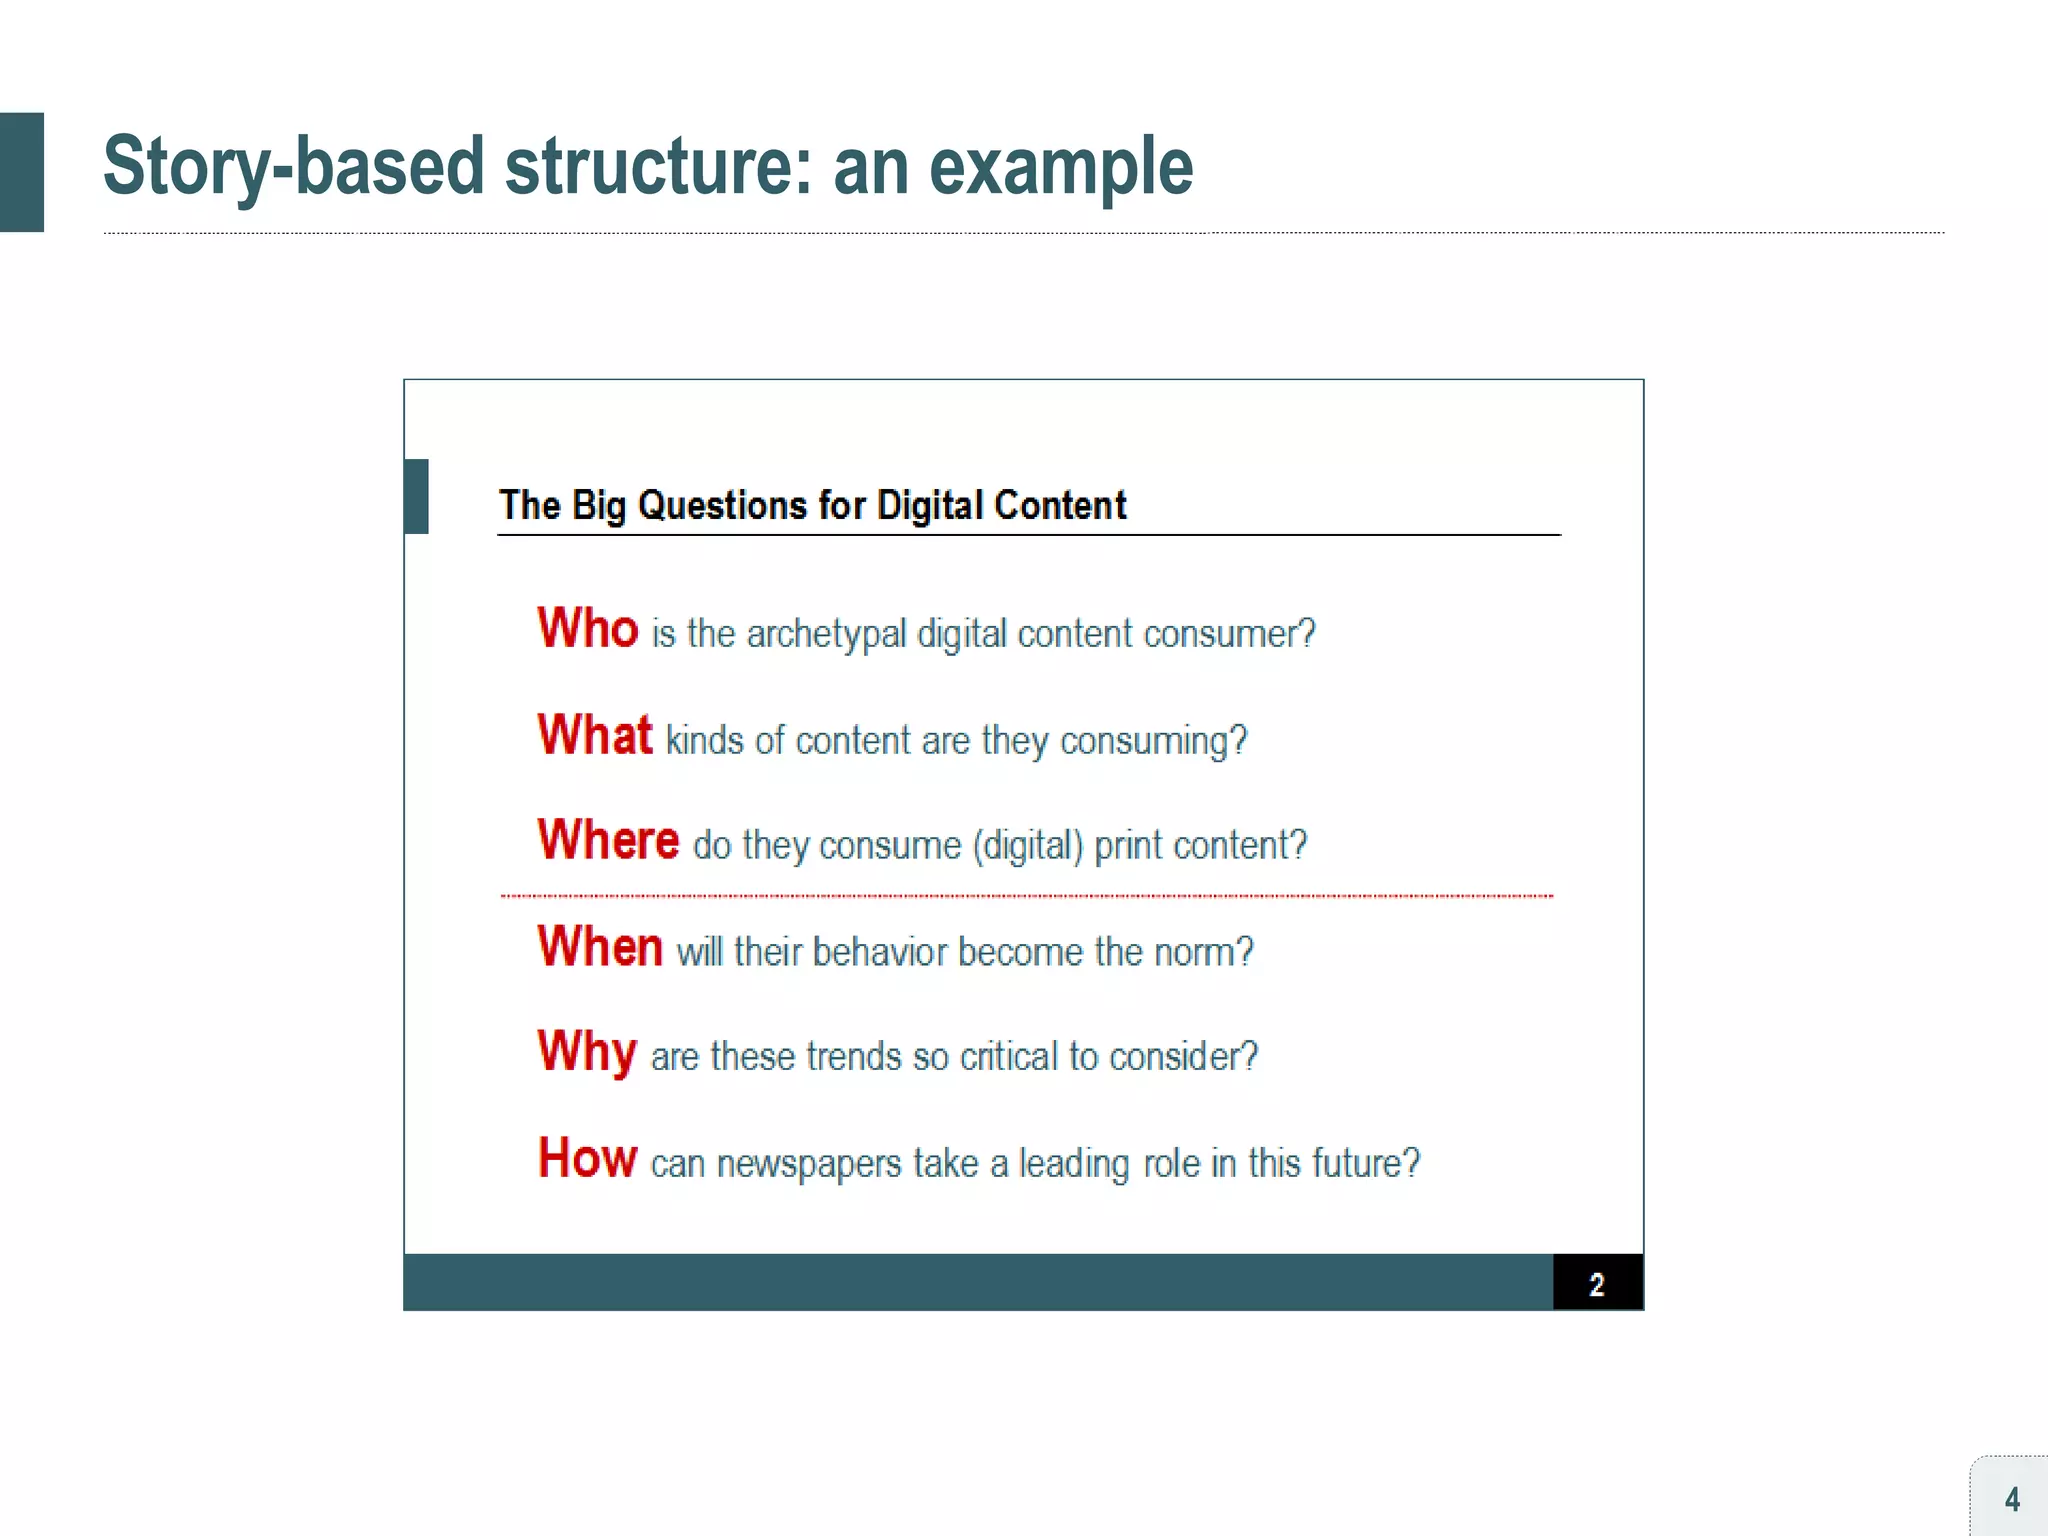
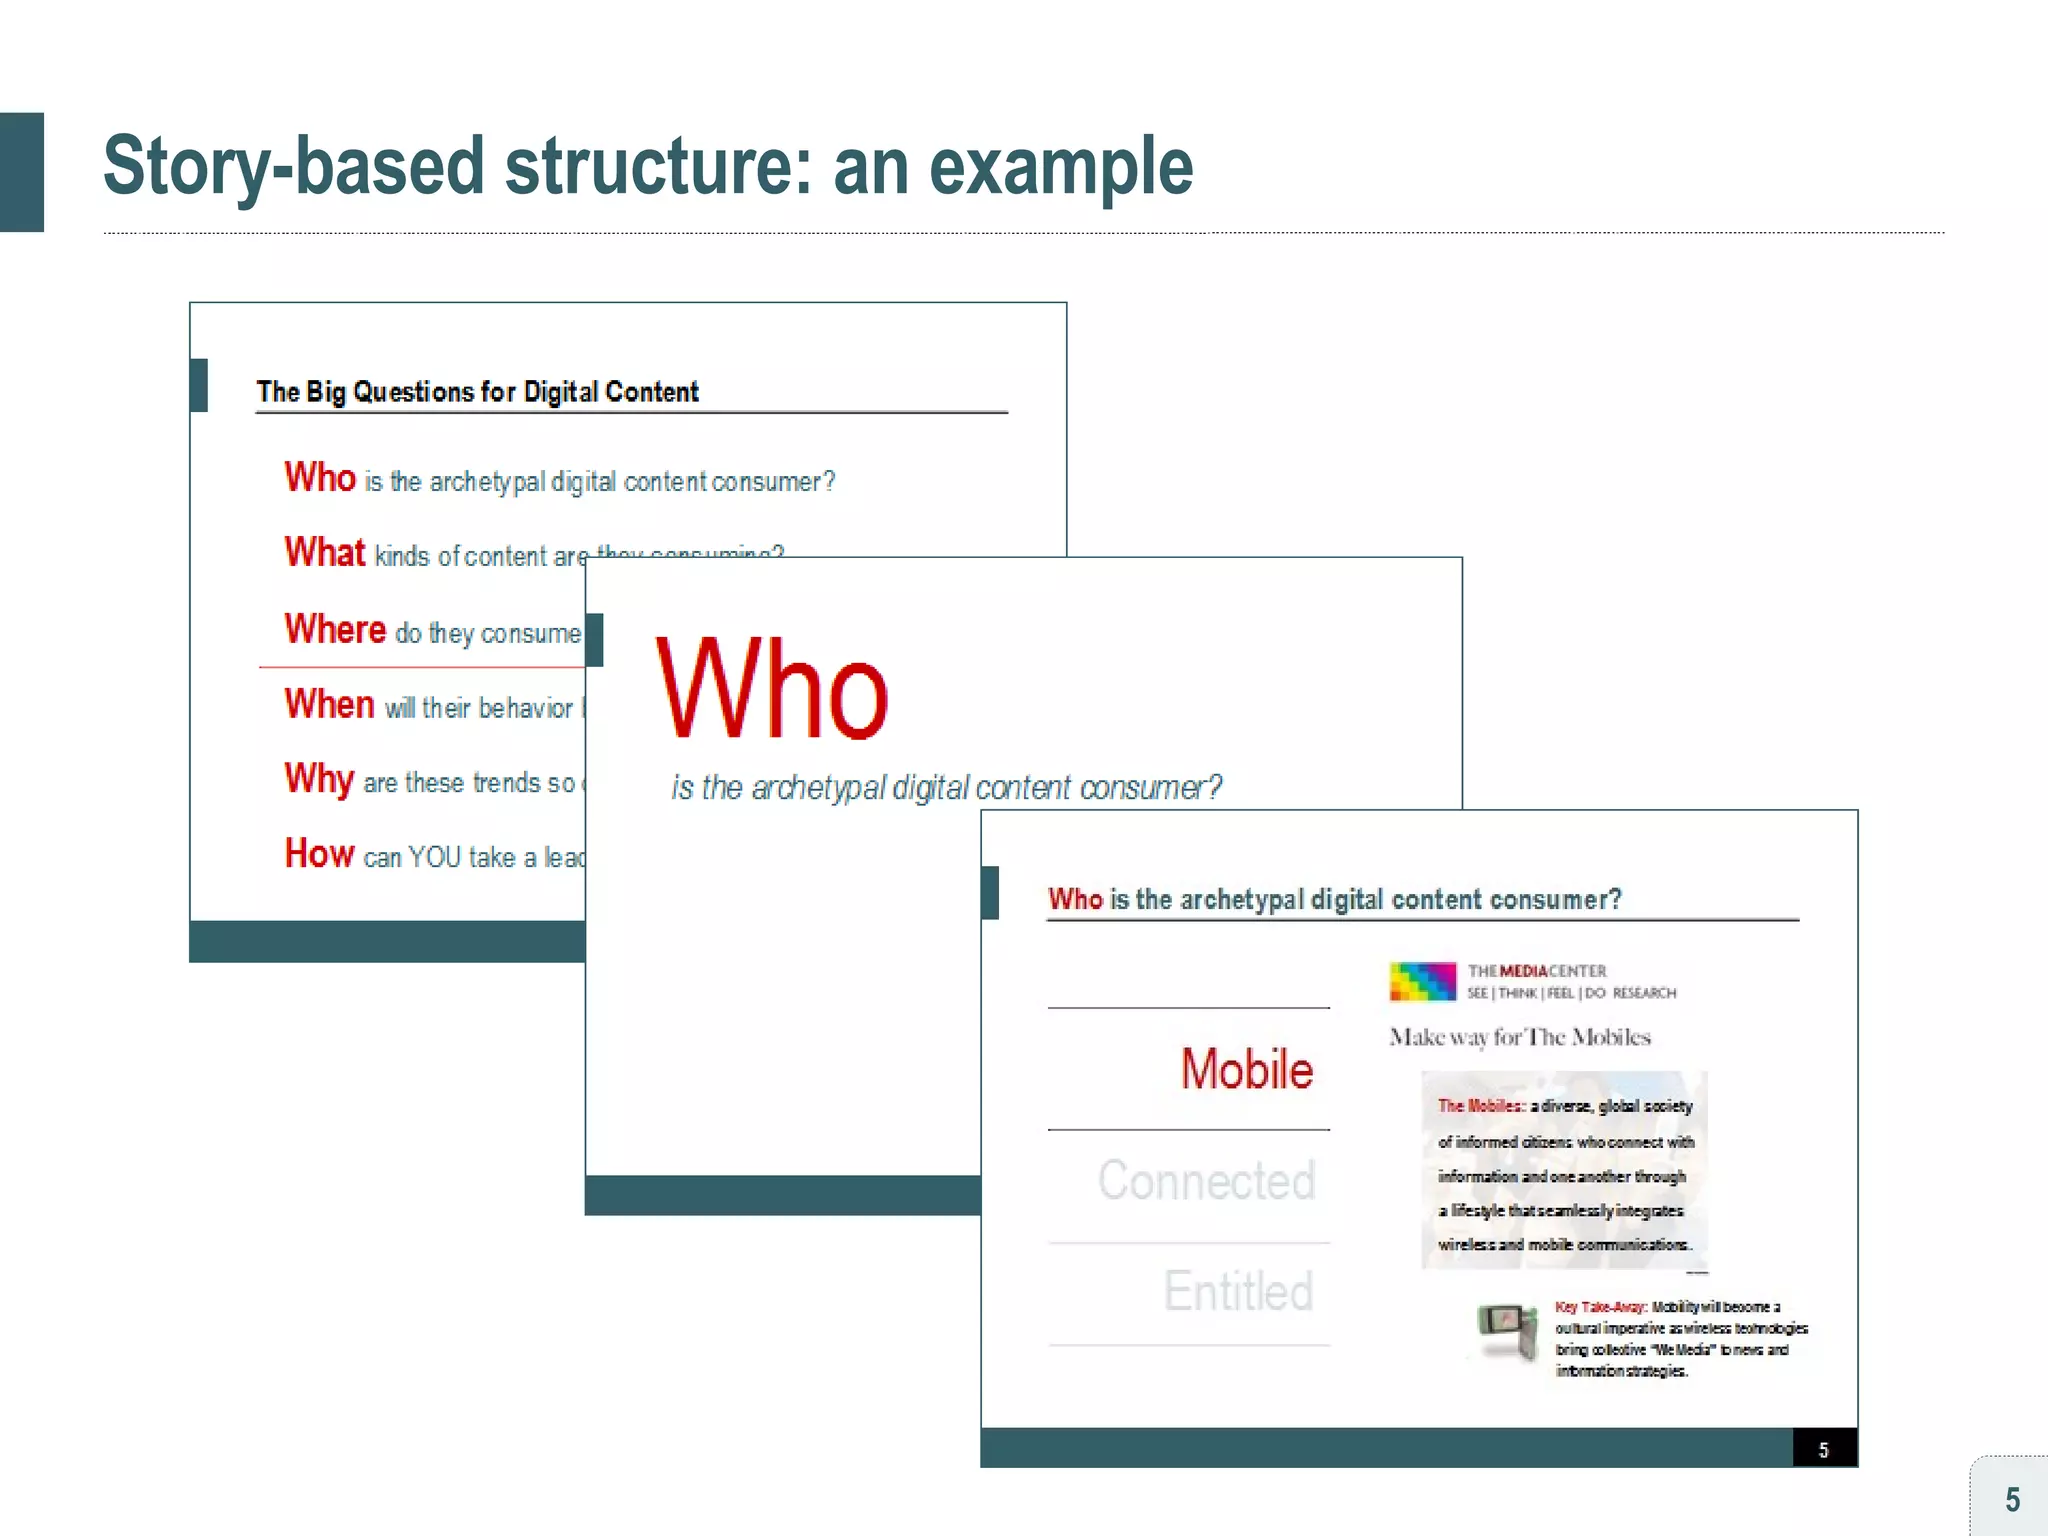
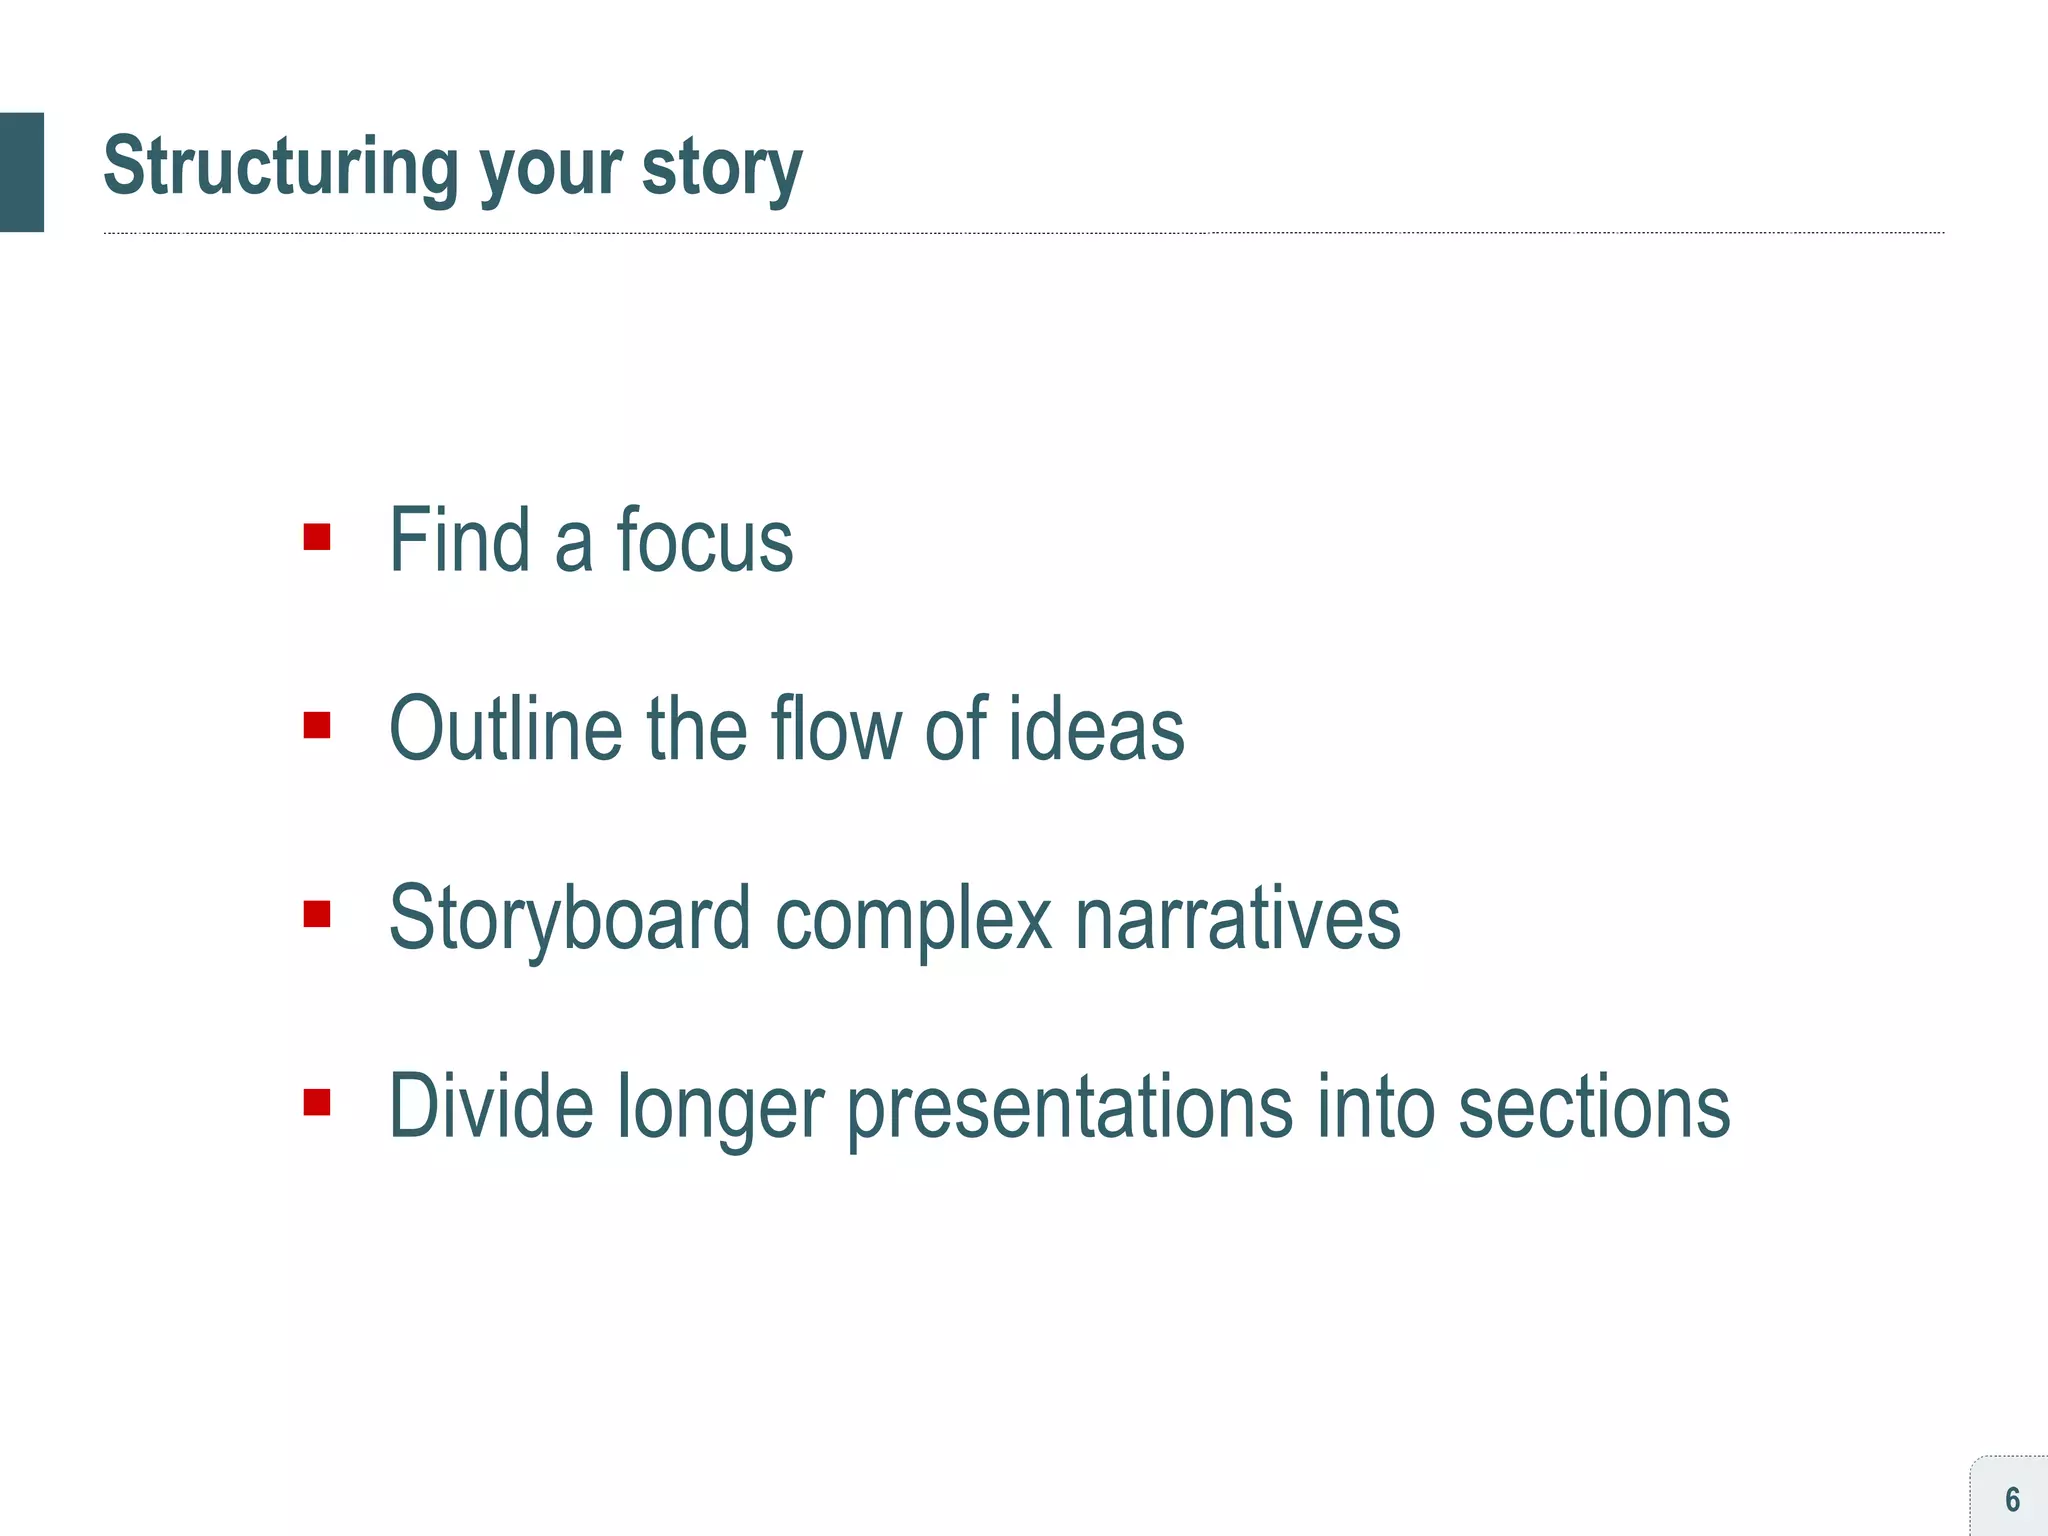
![[ habit #1 ] Start with a structured story](https://image.slidesharecdn.com/persuading3-1210034841268967-8/85/Persuading-with-Powerpoint-3-320.jpg)
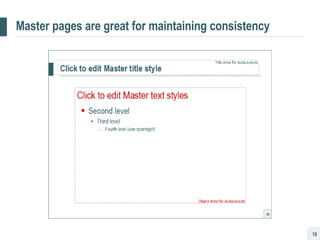
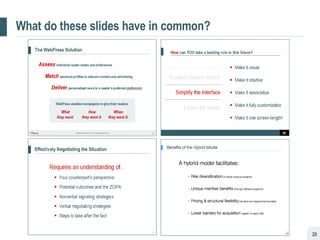
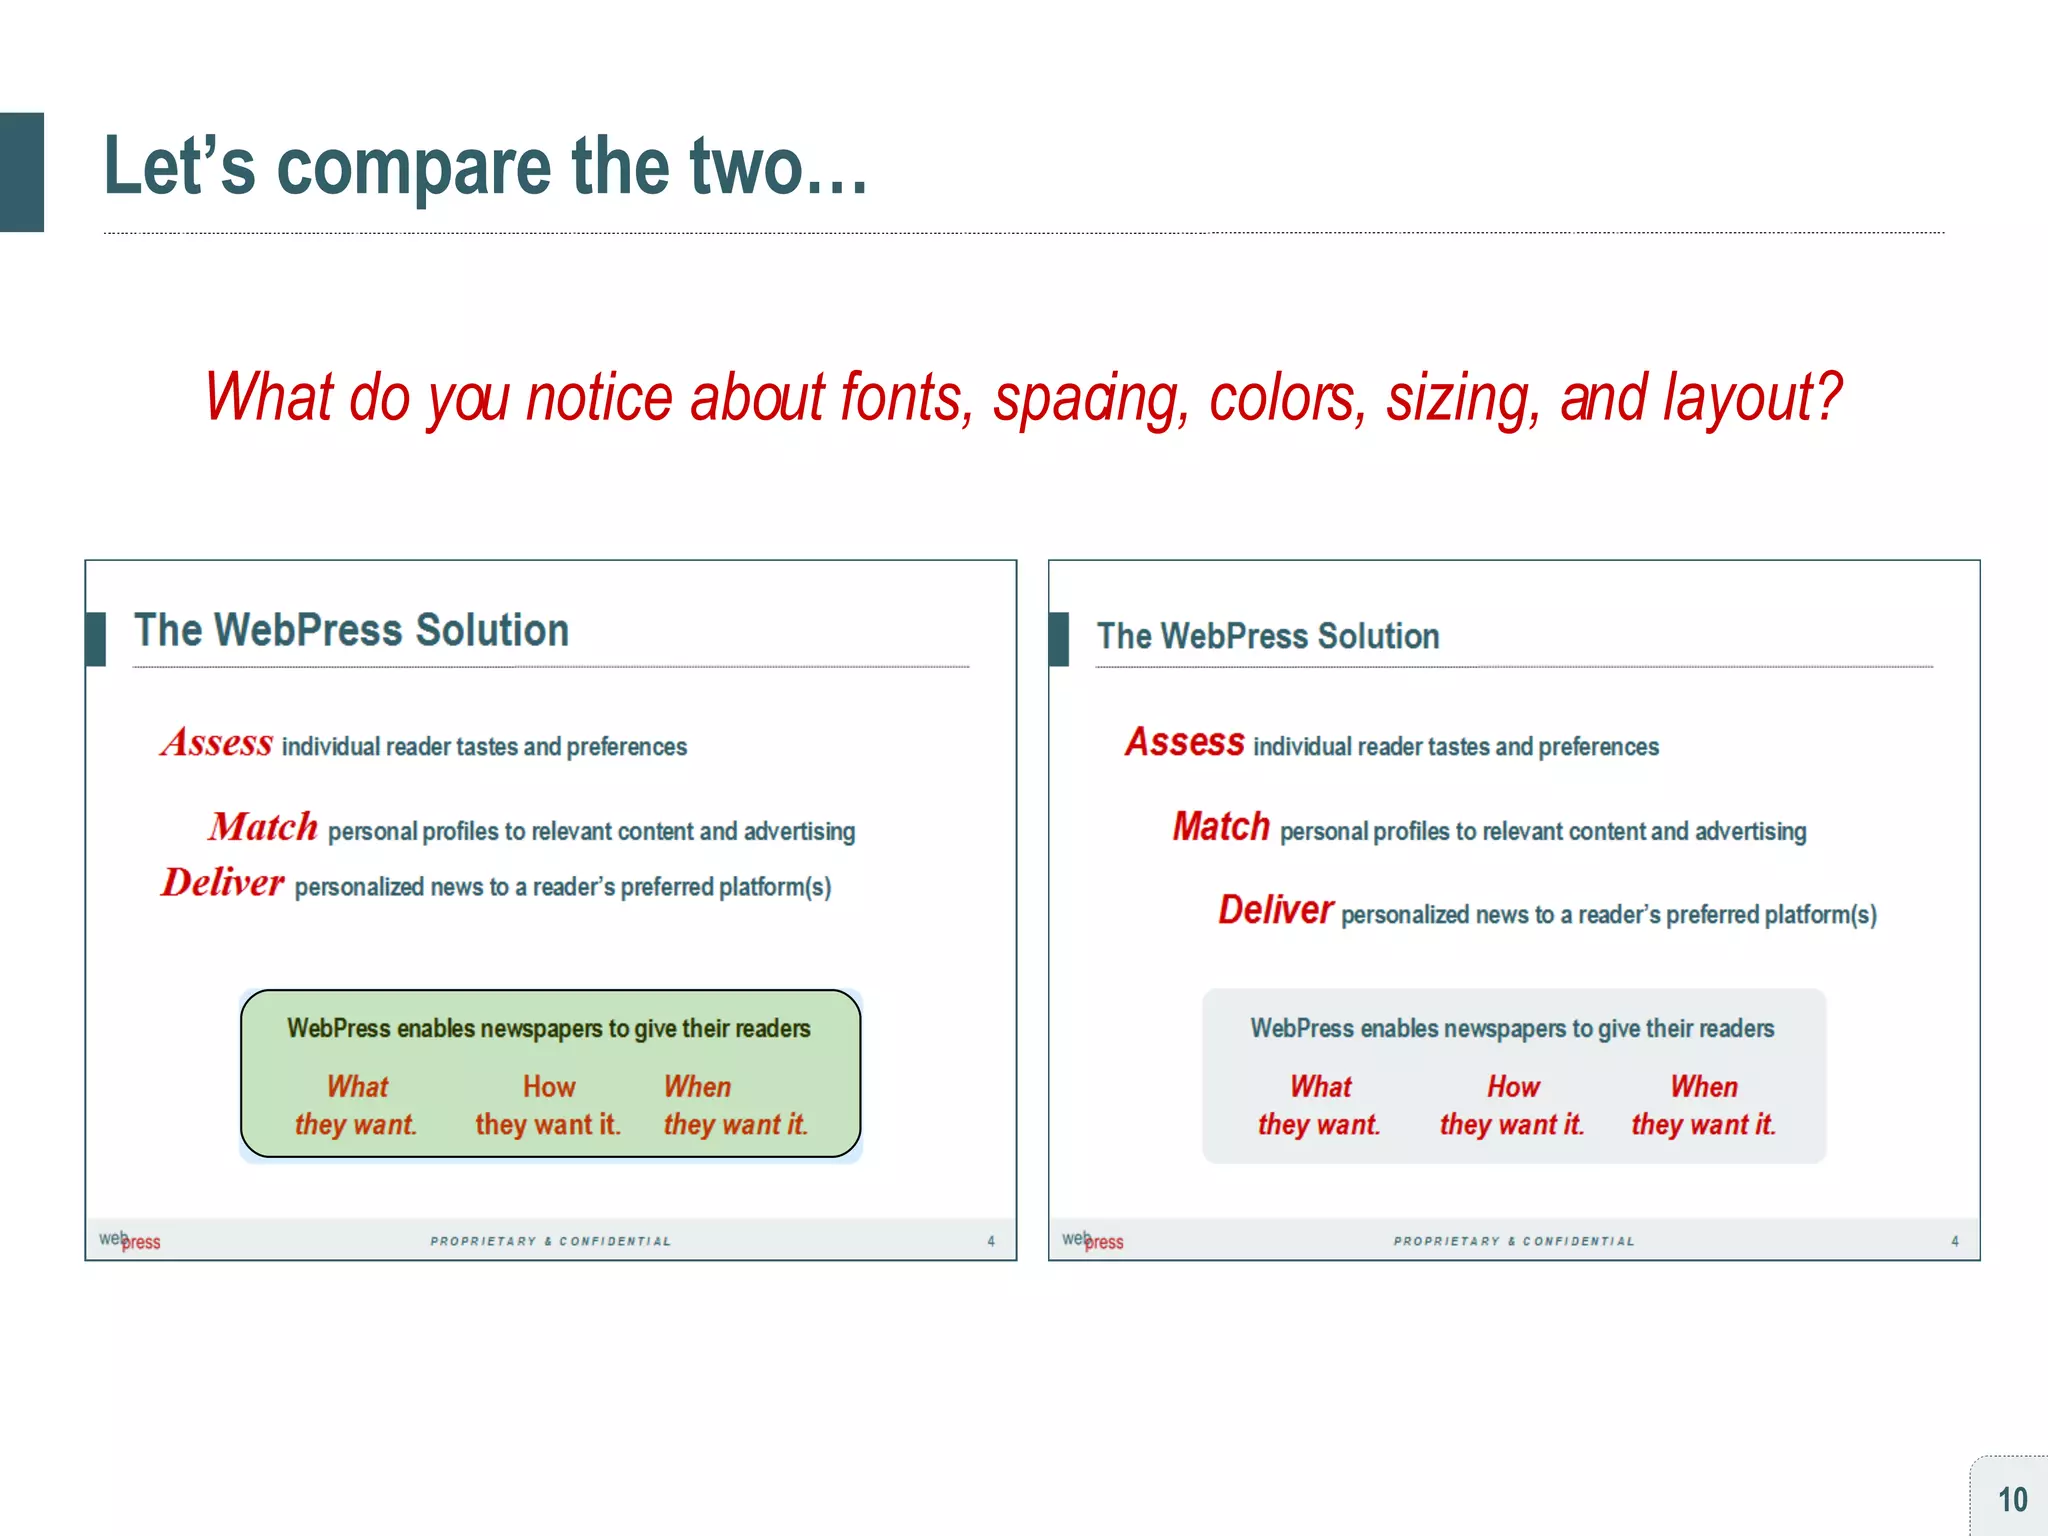
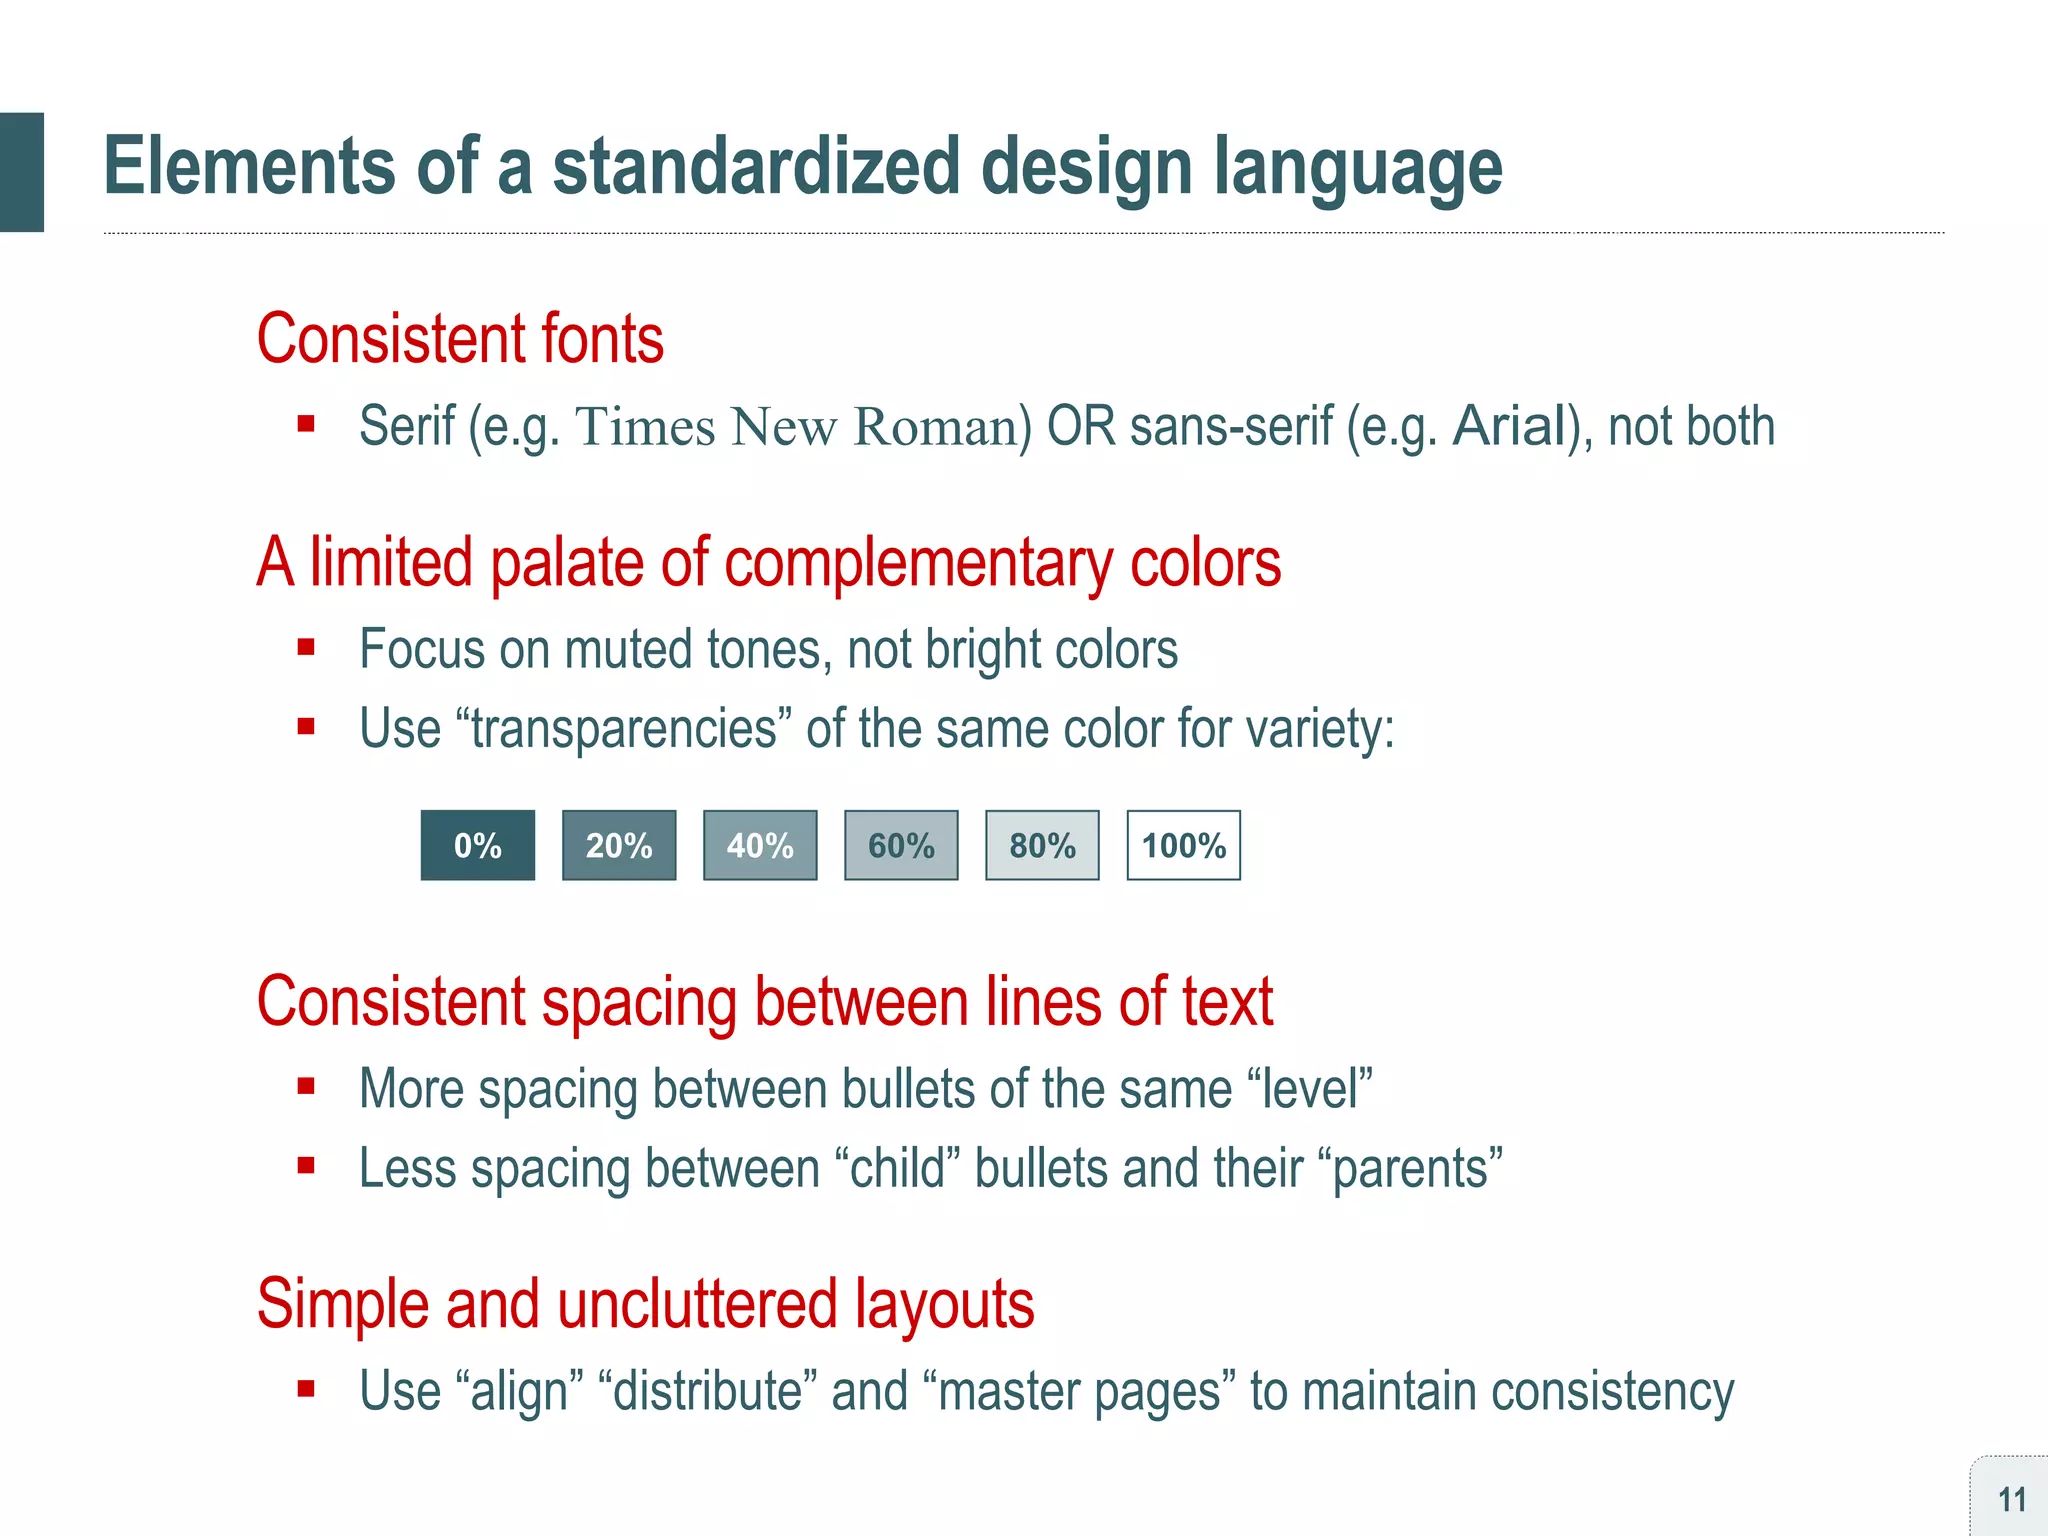
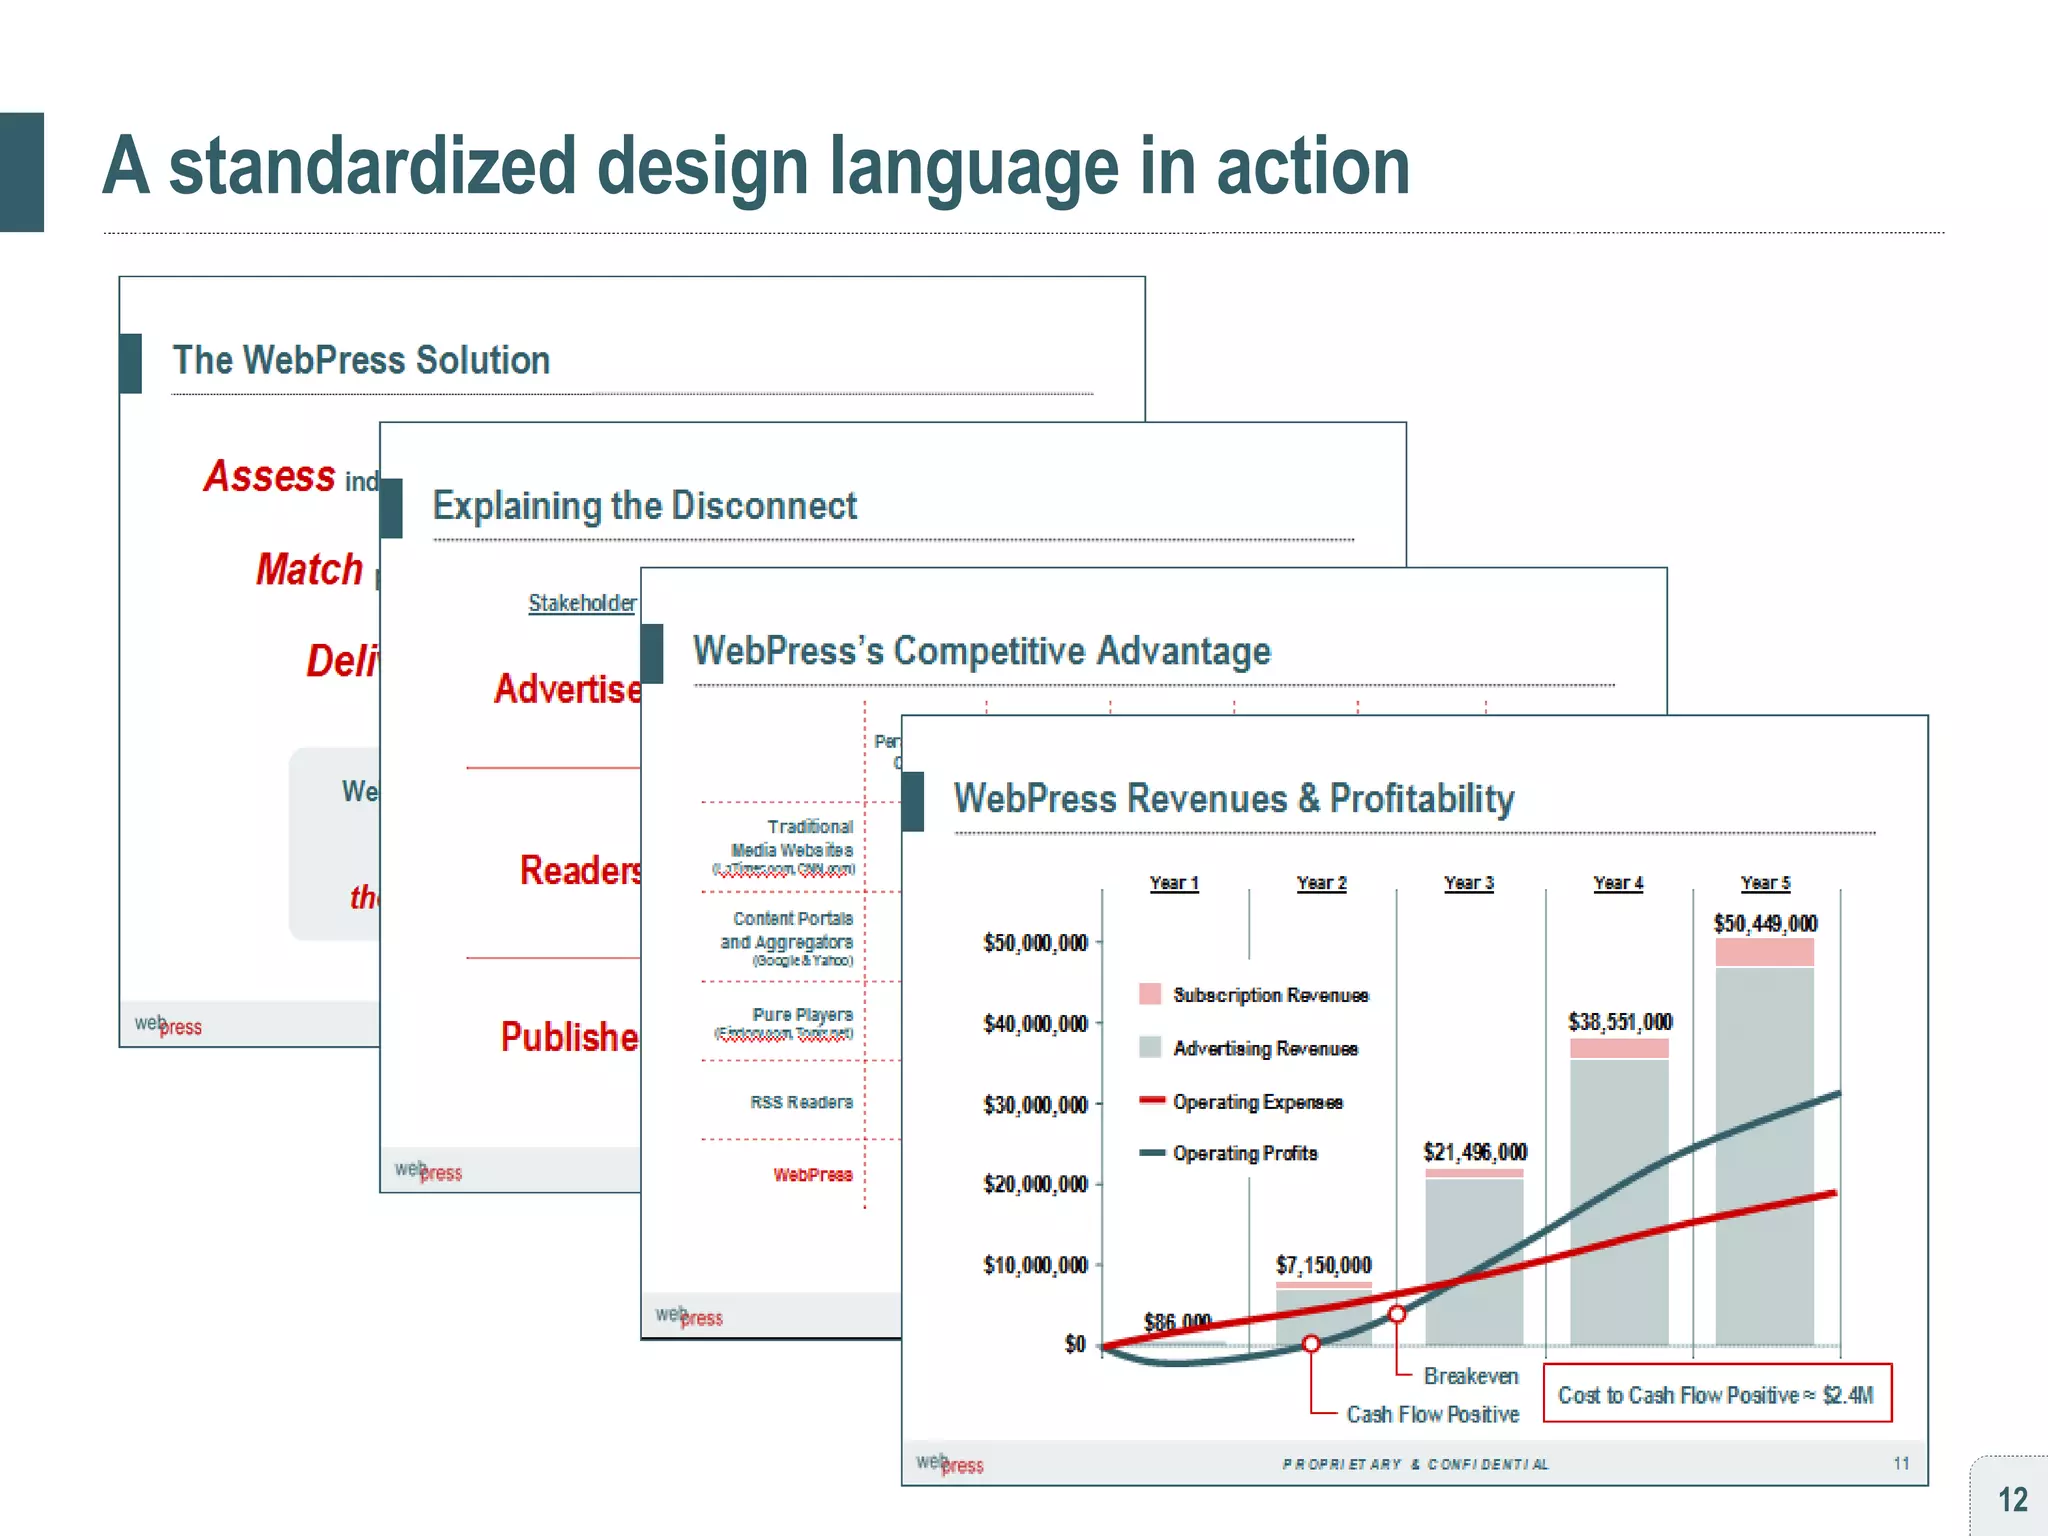
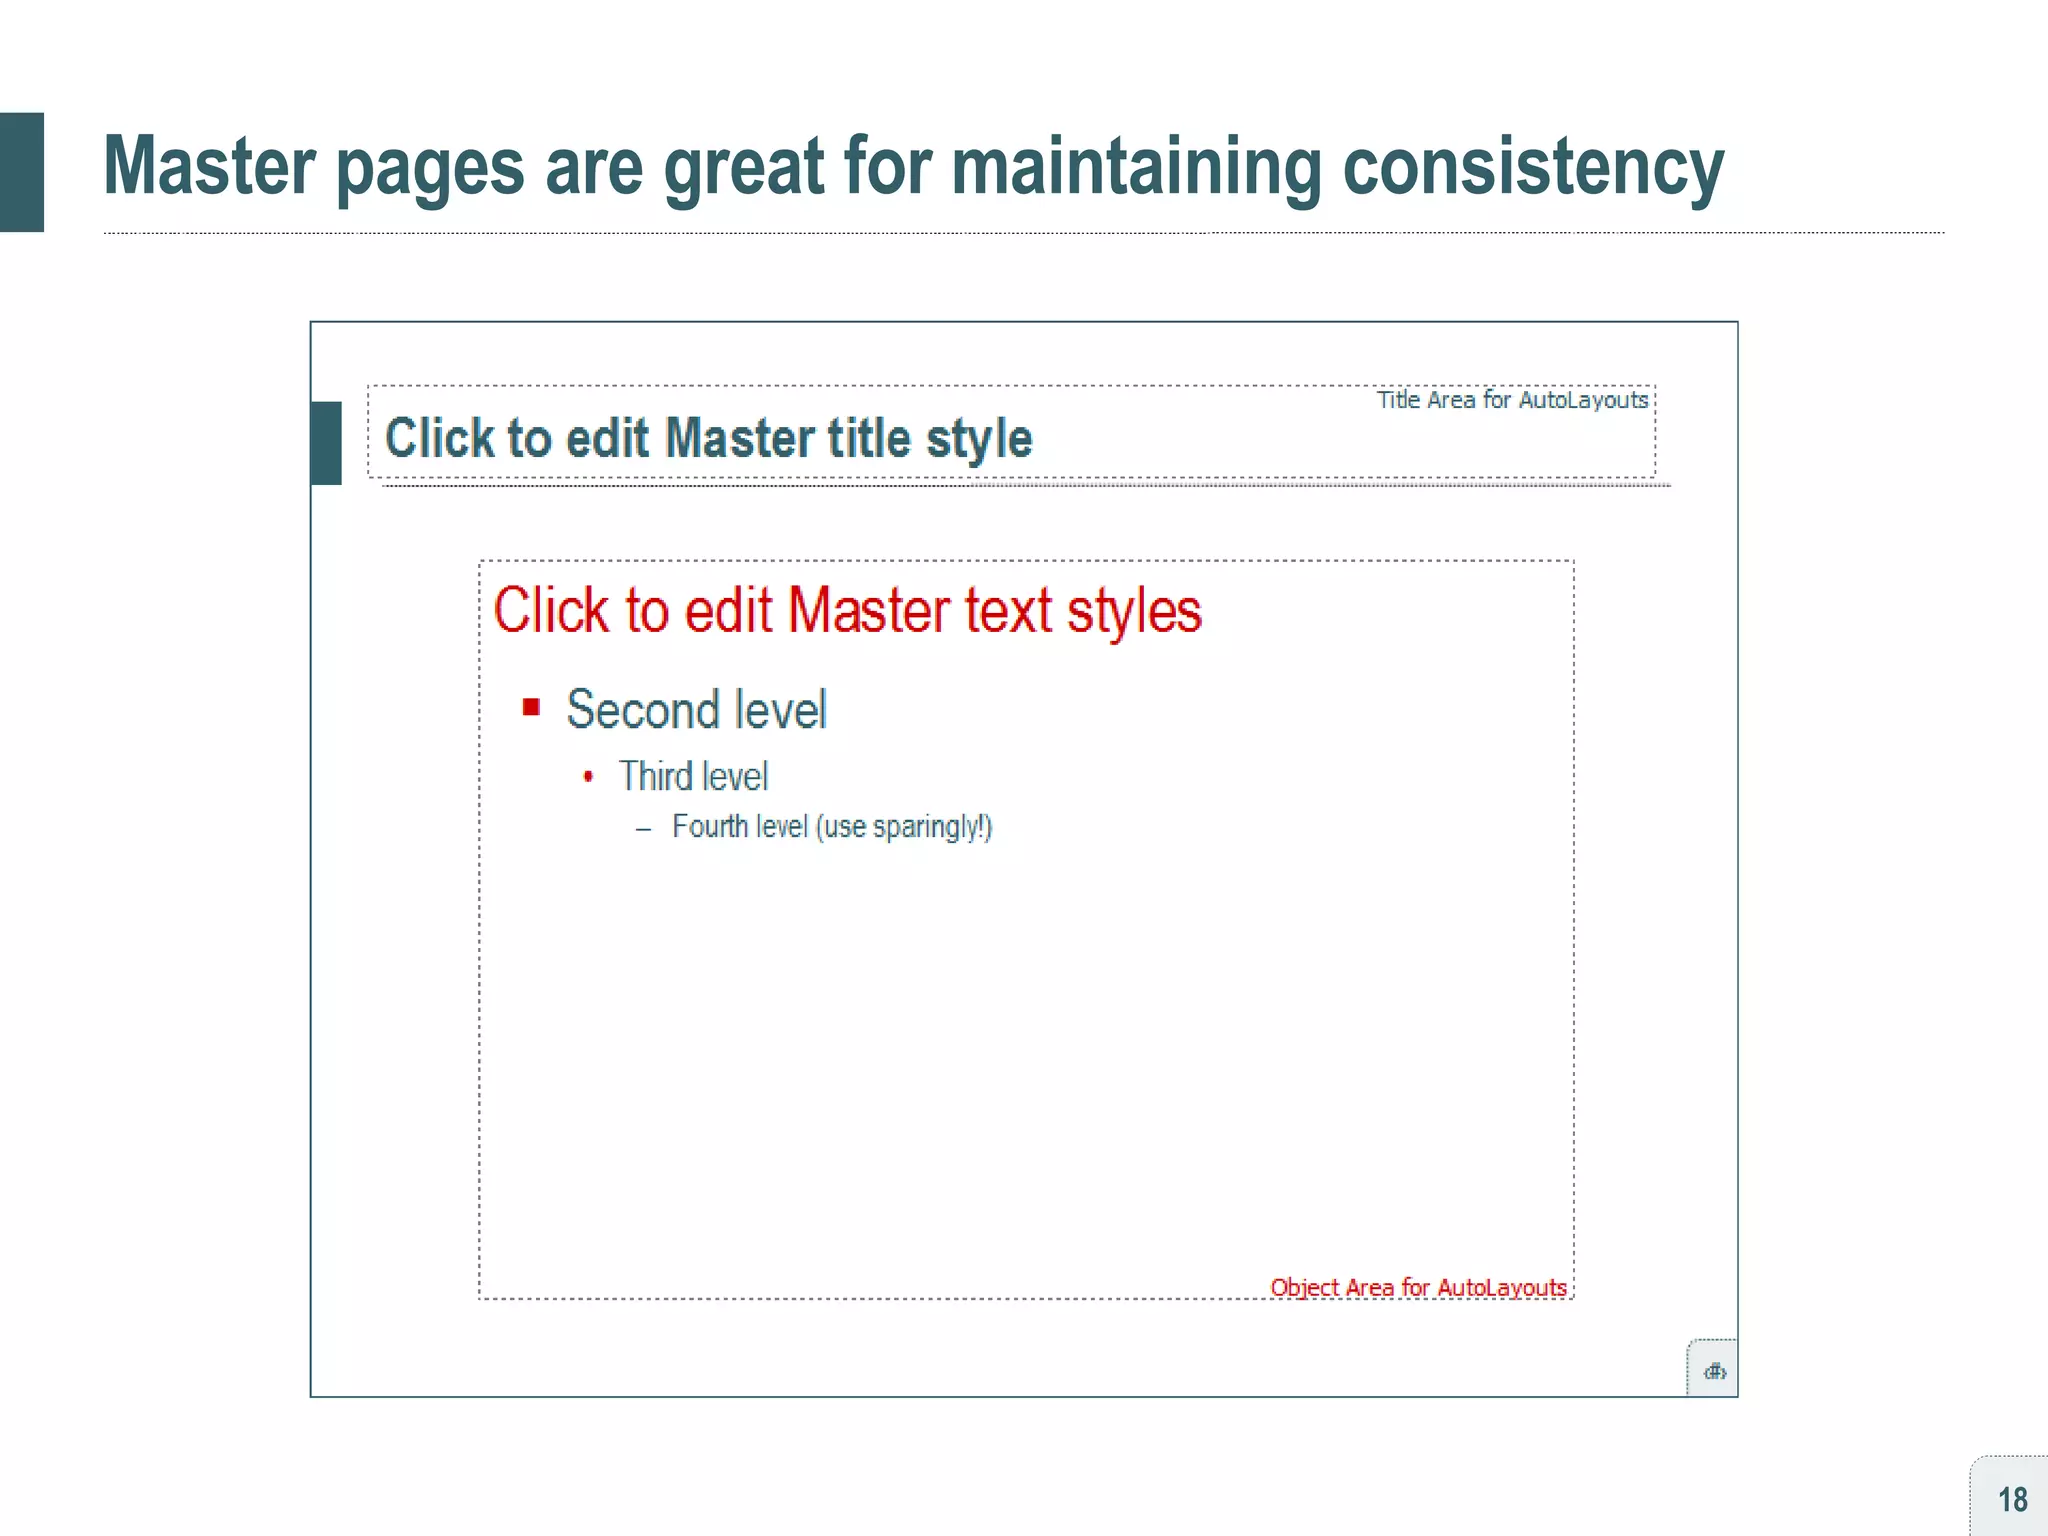
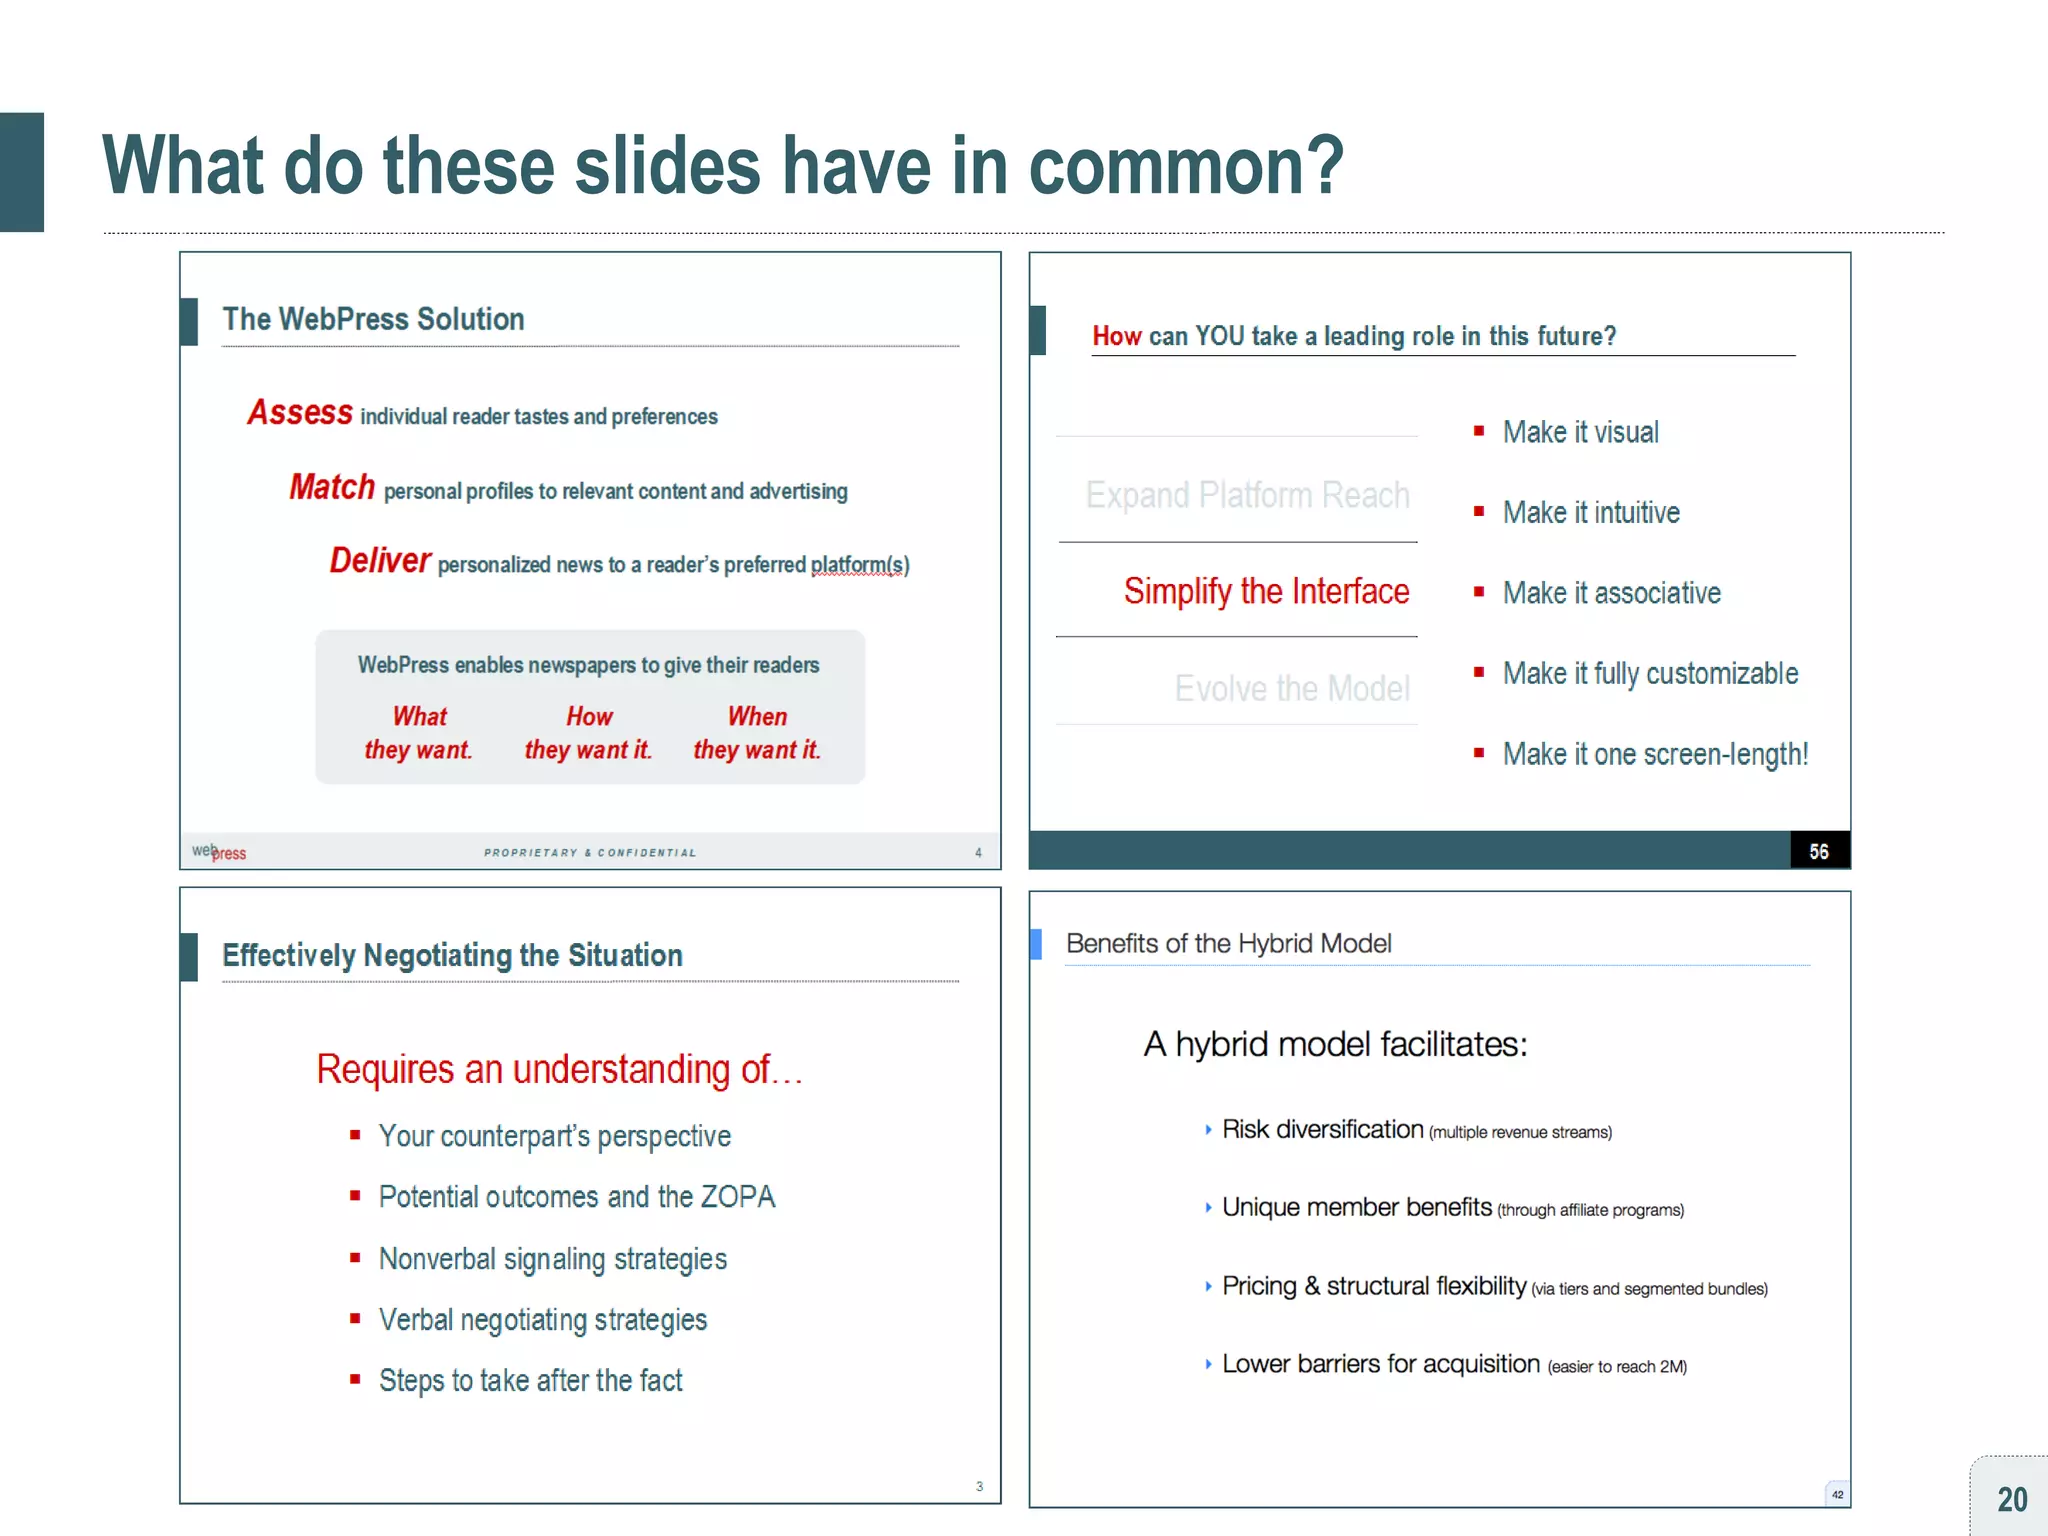
![[ habit #2 ] Standardize your design language](https://image.slidesharecdn.com/persuading3-1210034841268967-8/85/Persuading-with-Powerpoint-7-320.jpg)

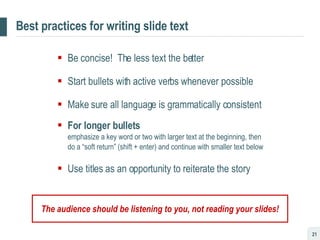
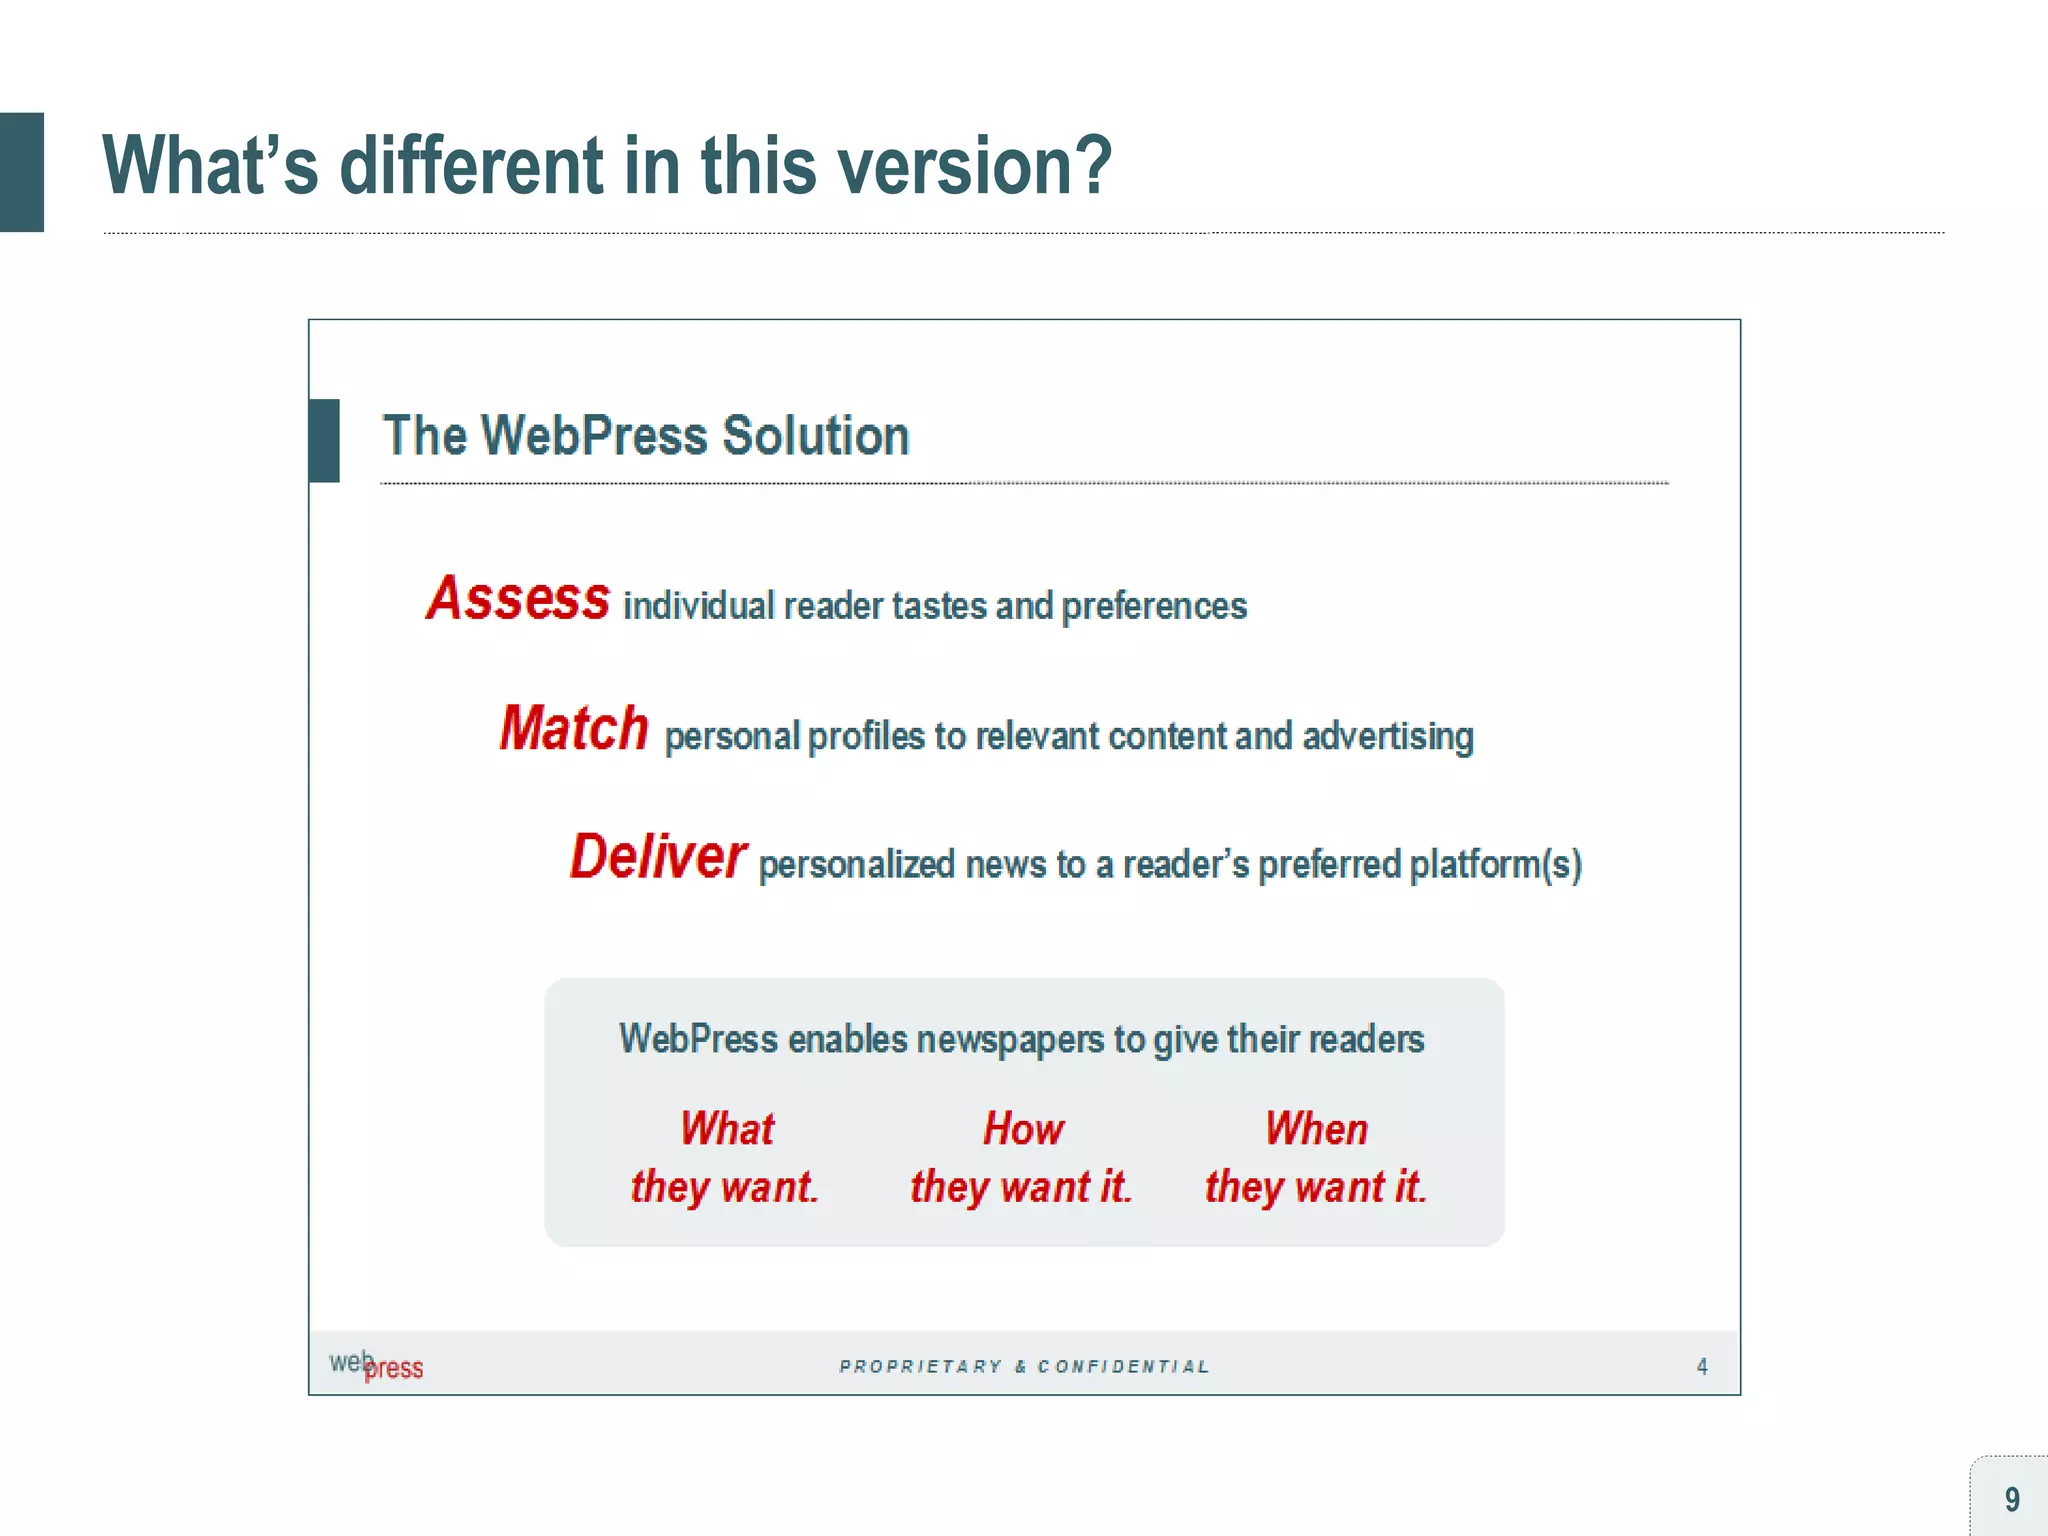
![[ habit #3 ] Standardize your written language](https://image.slidesharecdn.com/persuading3-1210034841268967-8/85/Persuading-with-Powerpoint-19-320.jpg)
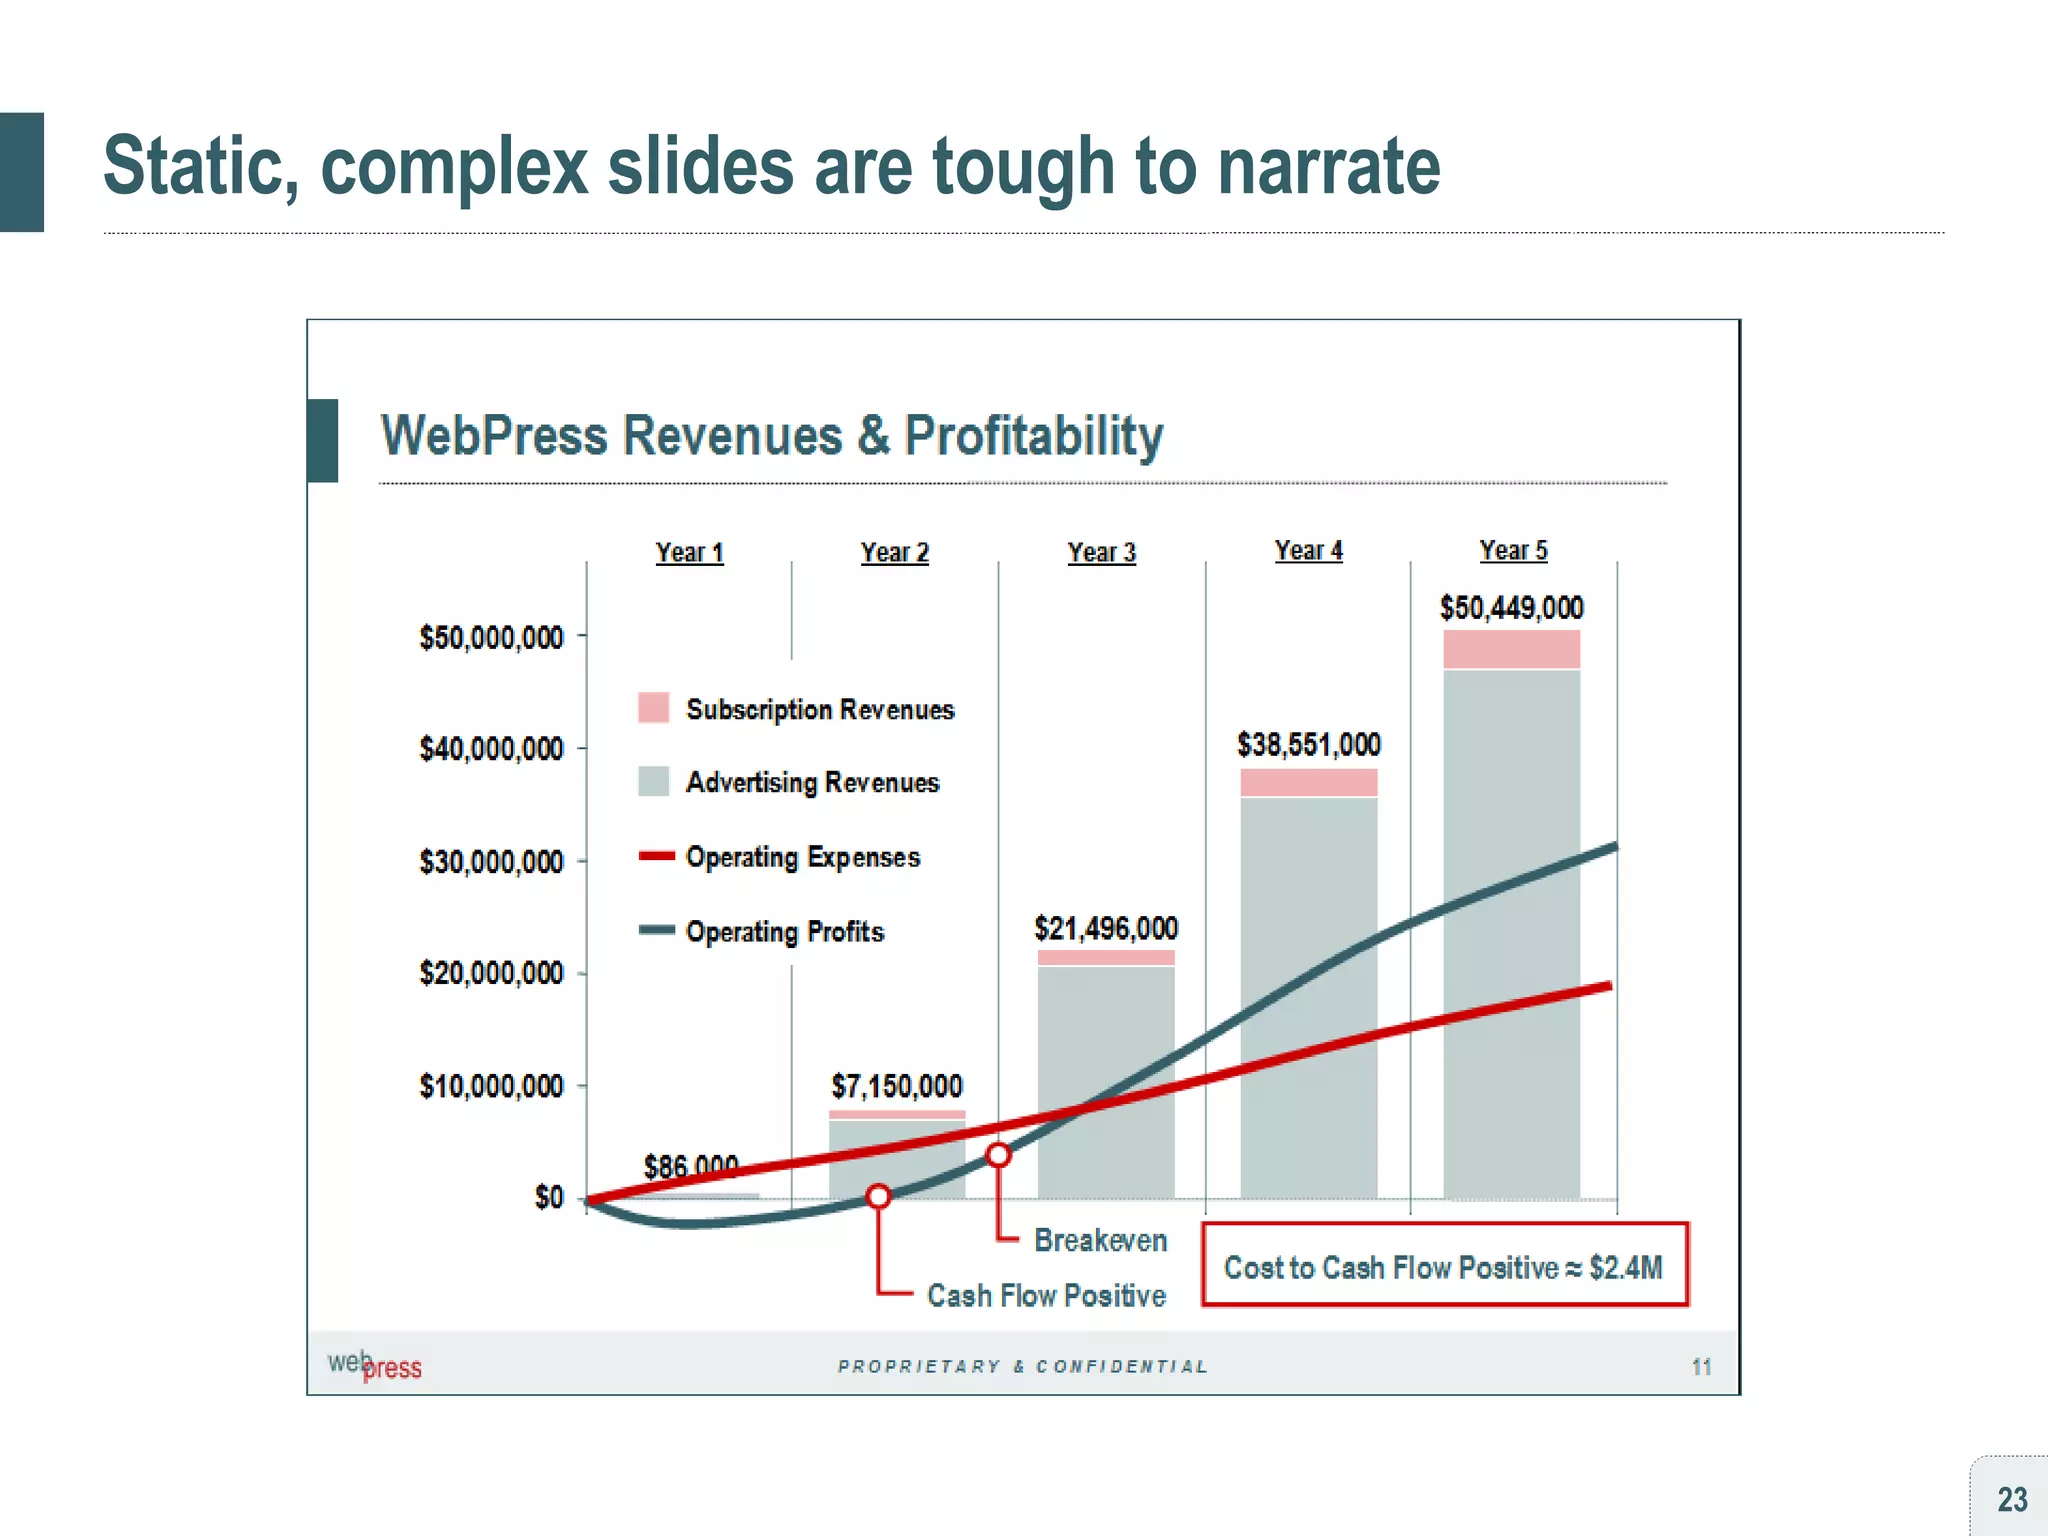
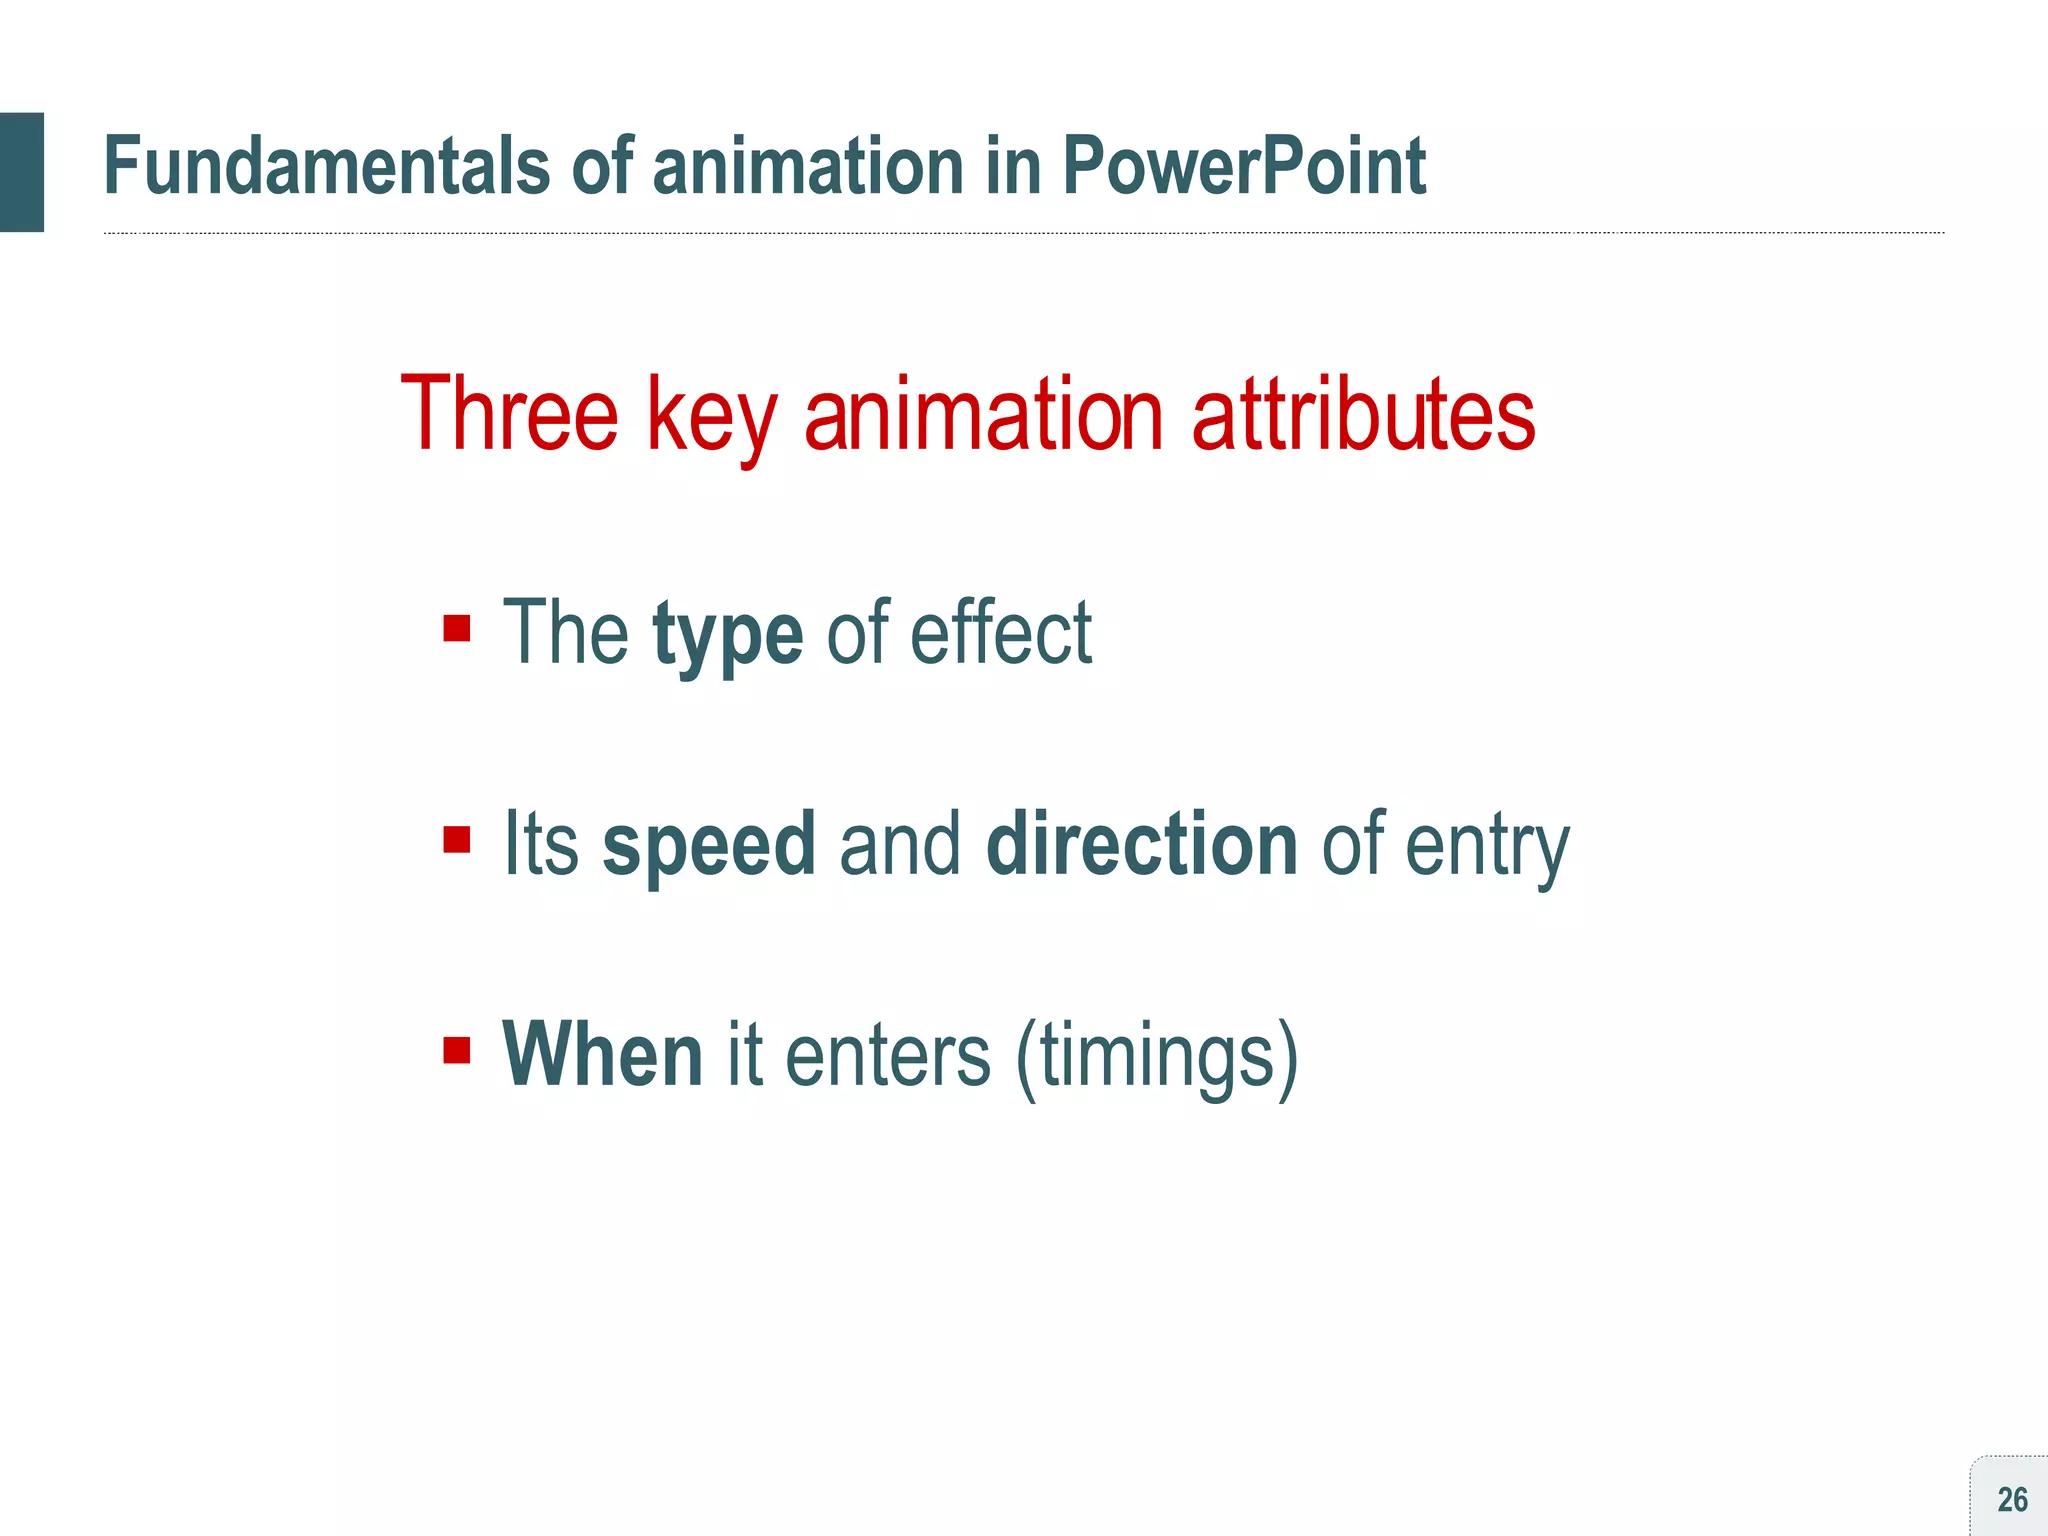
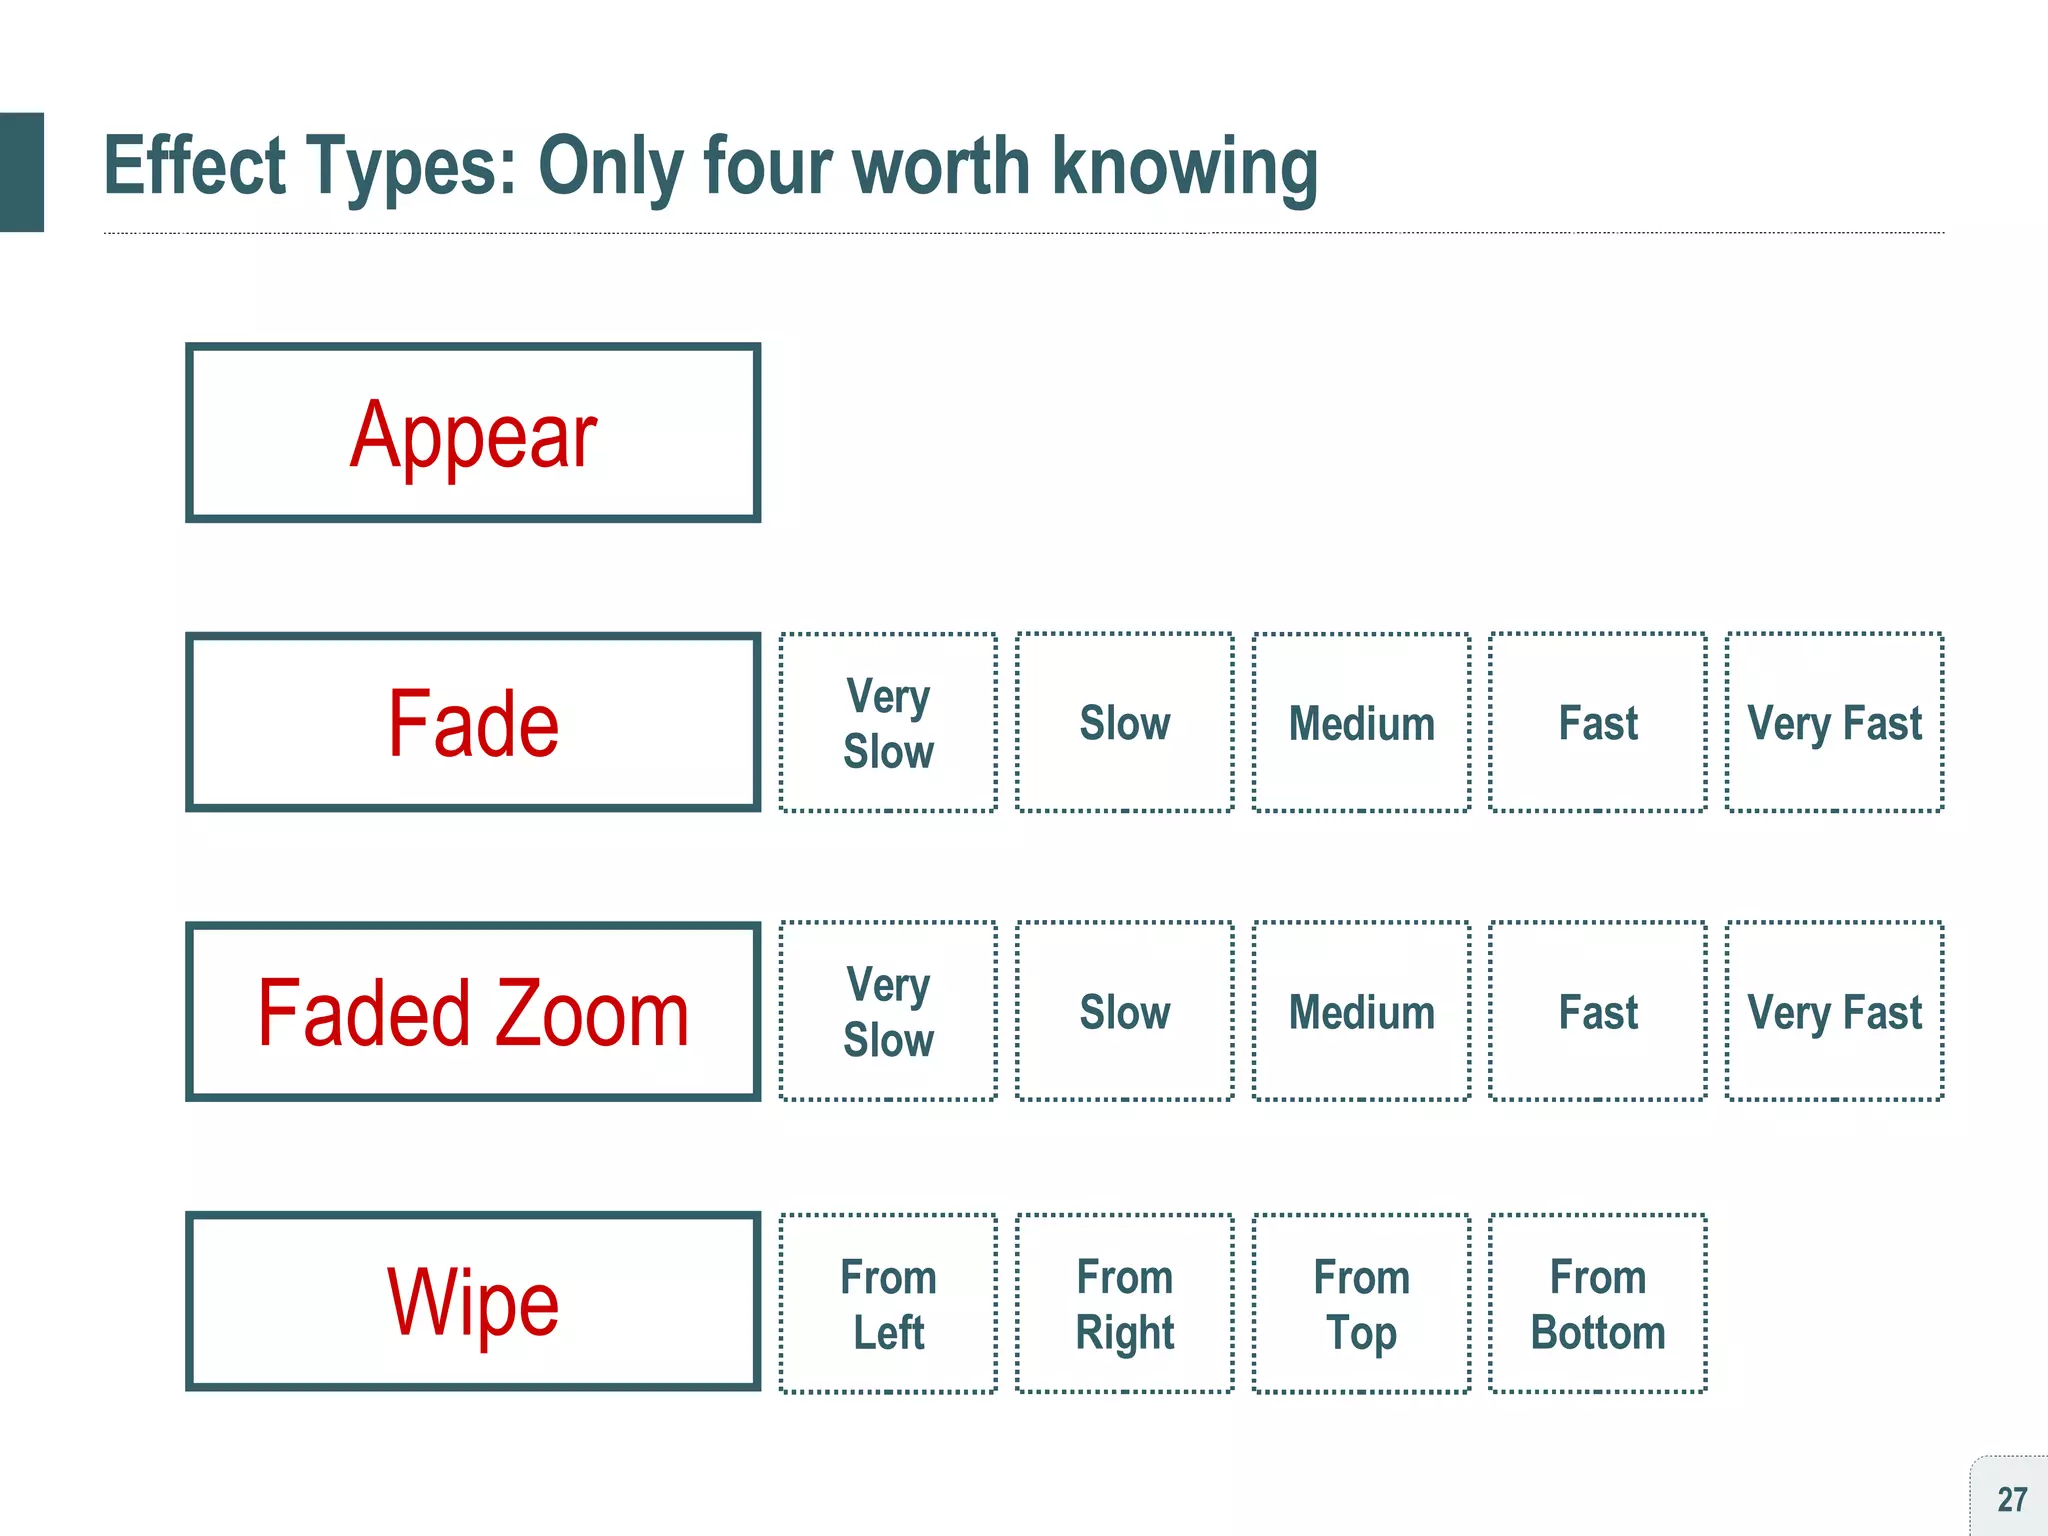
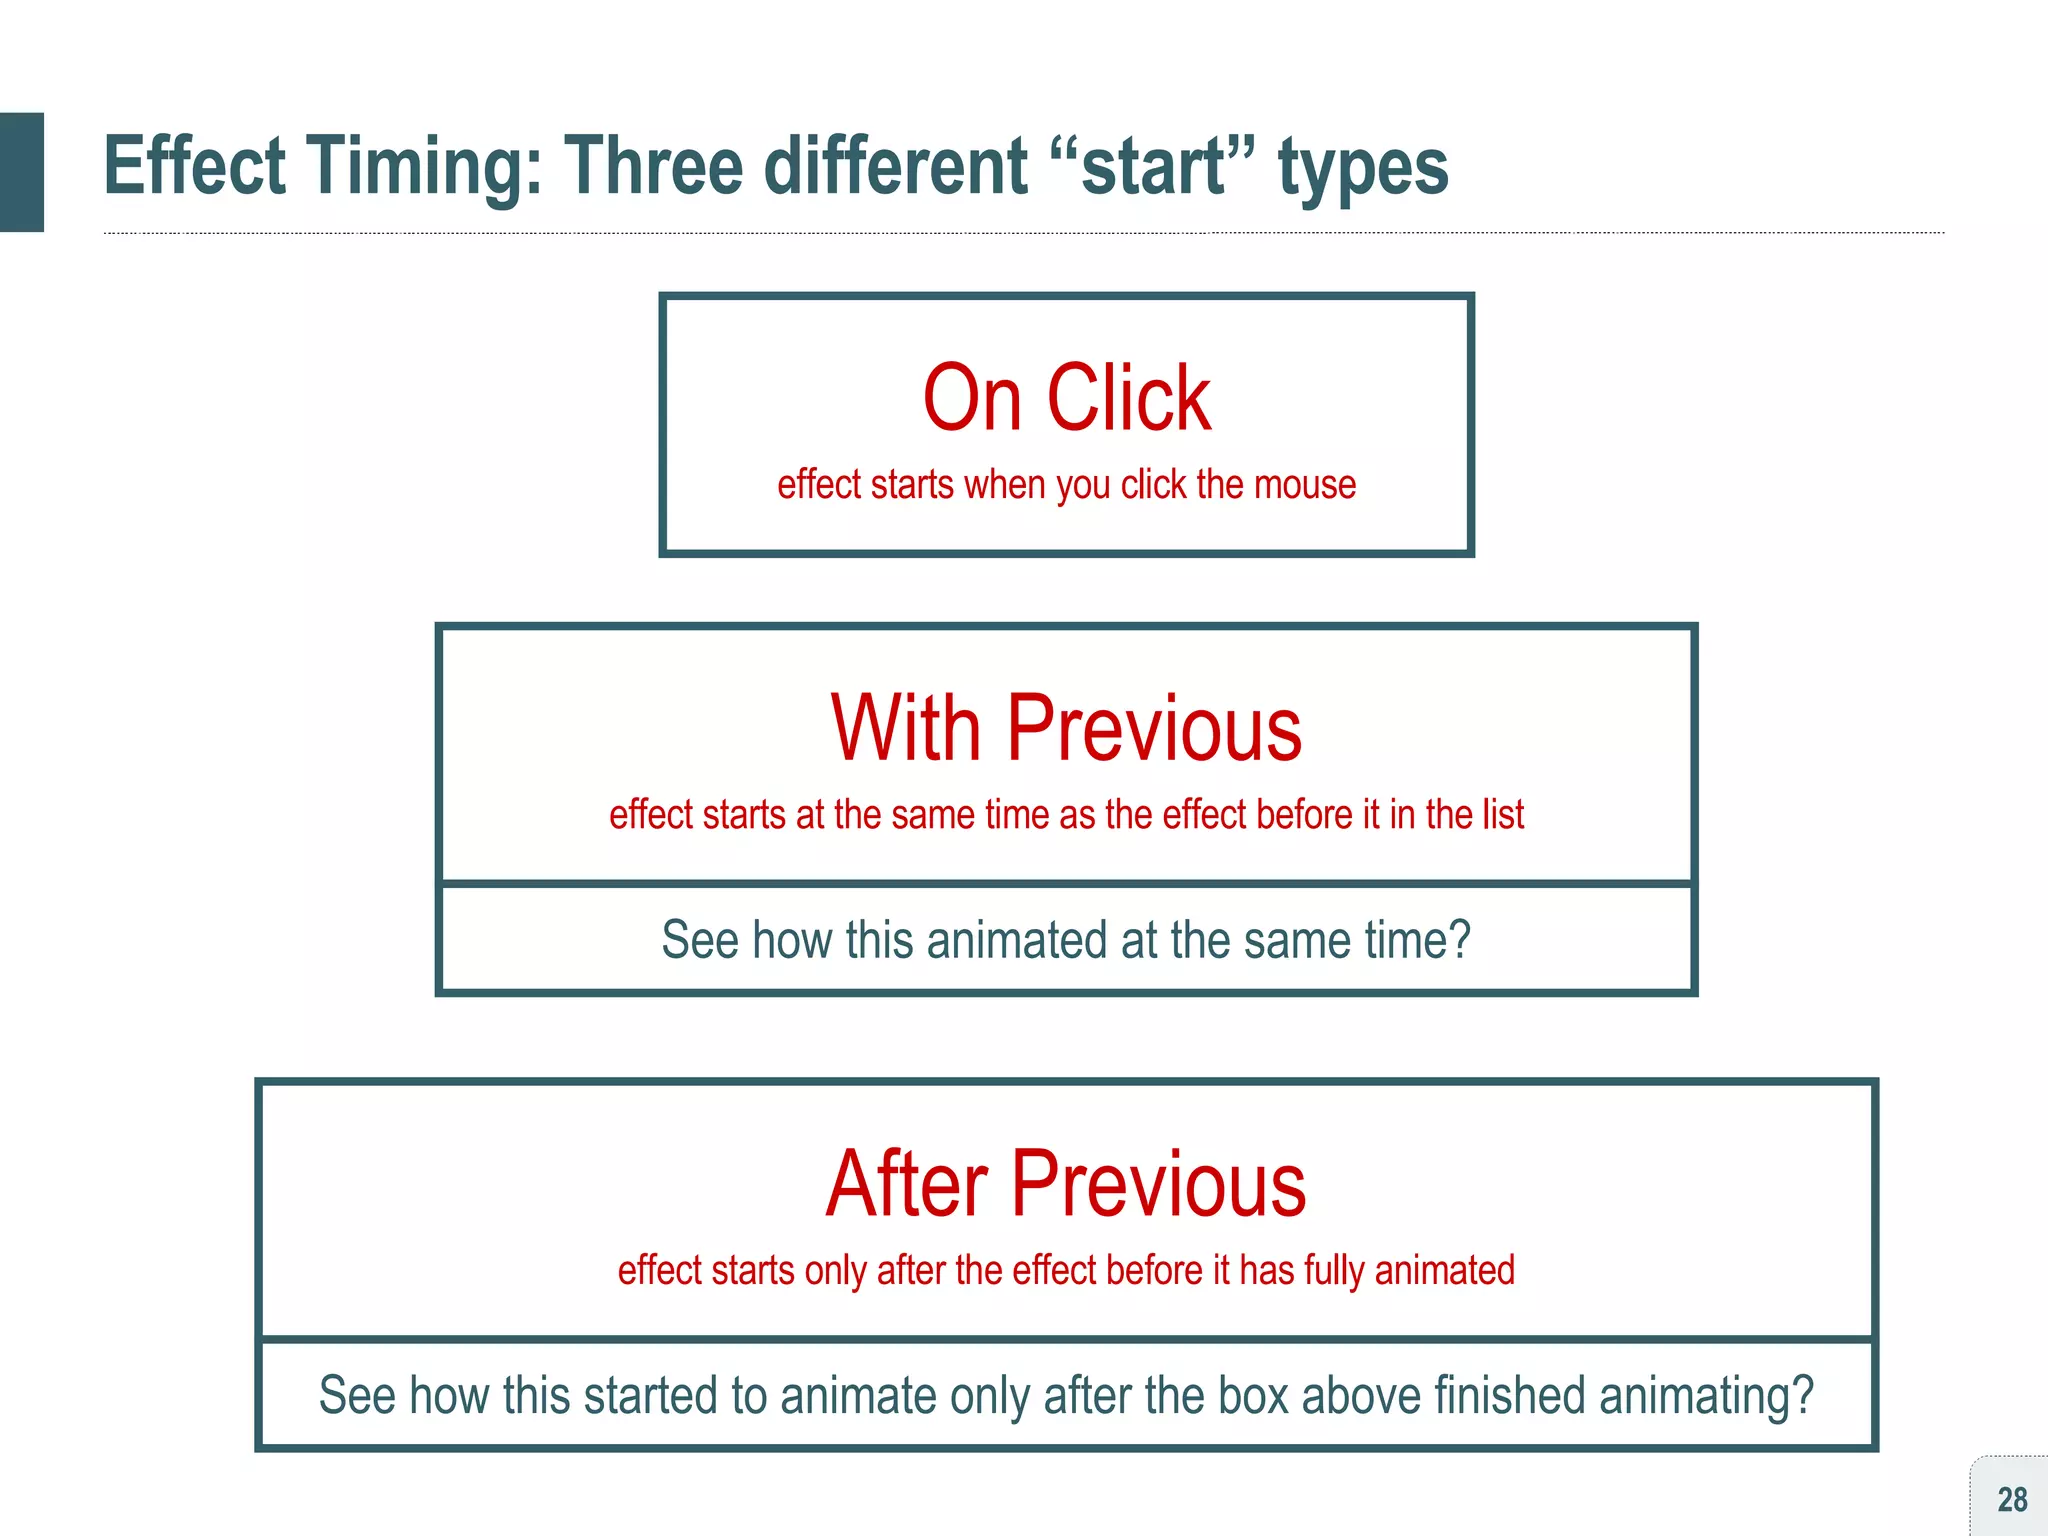
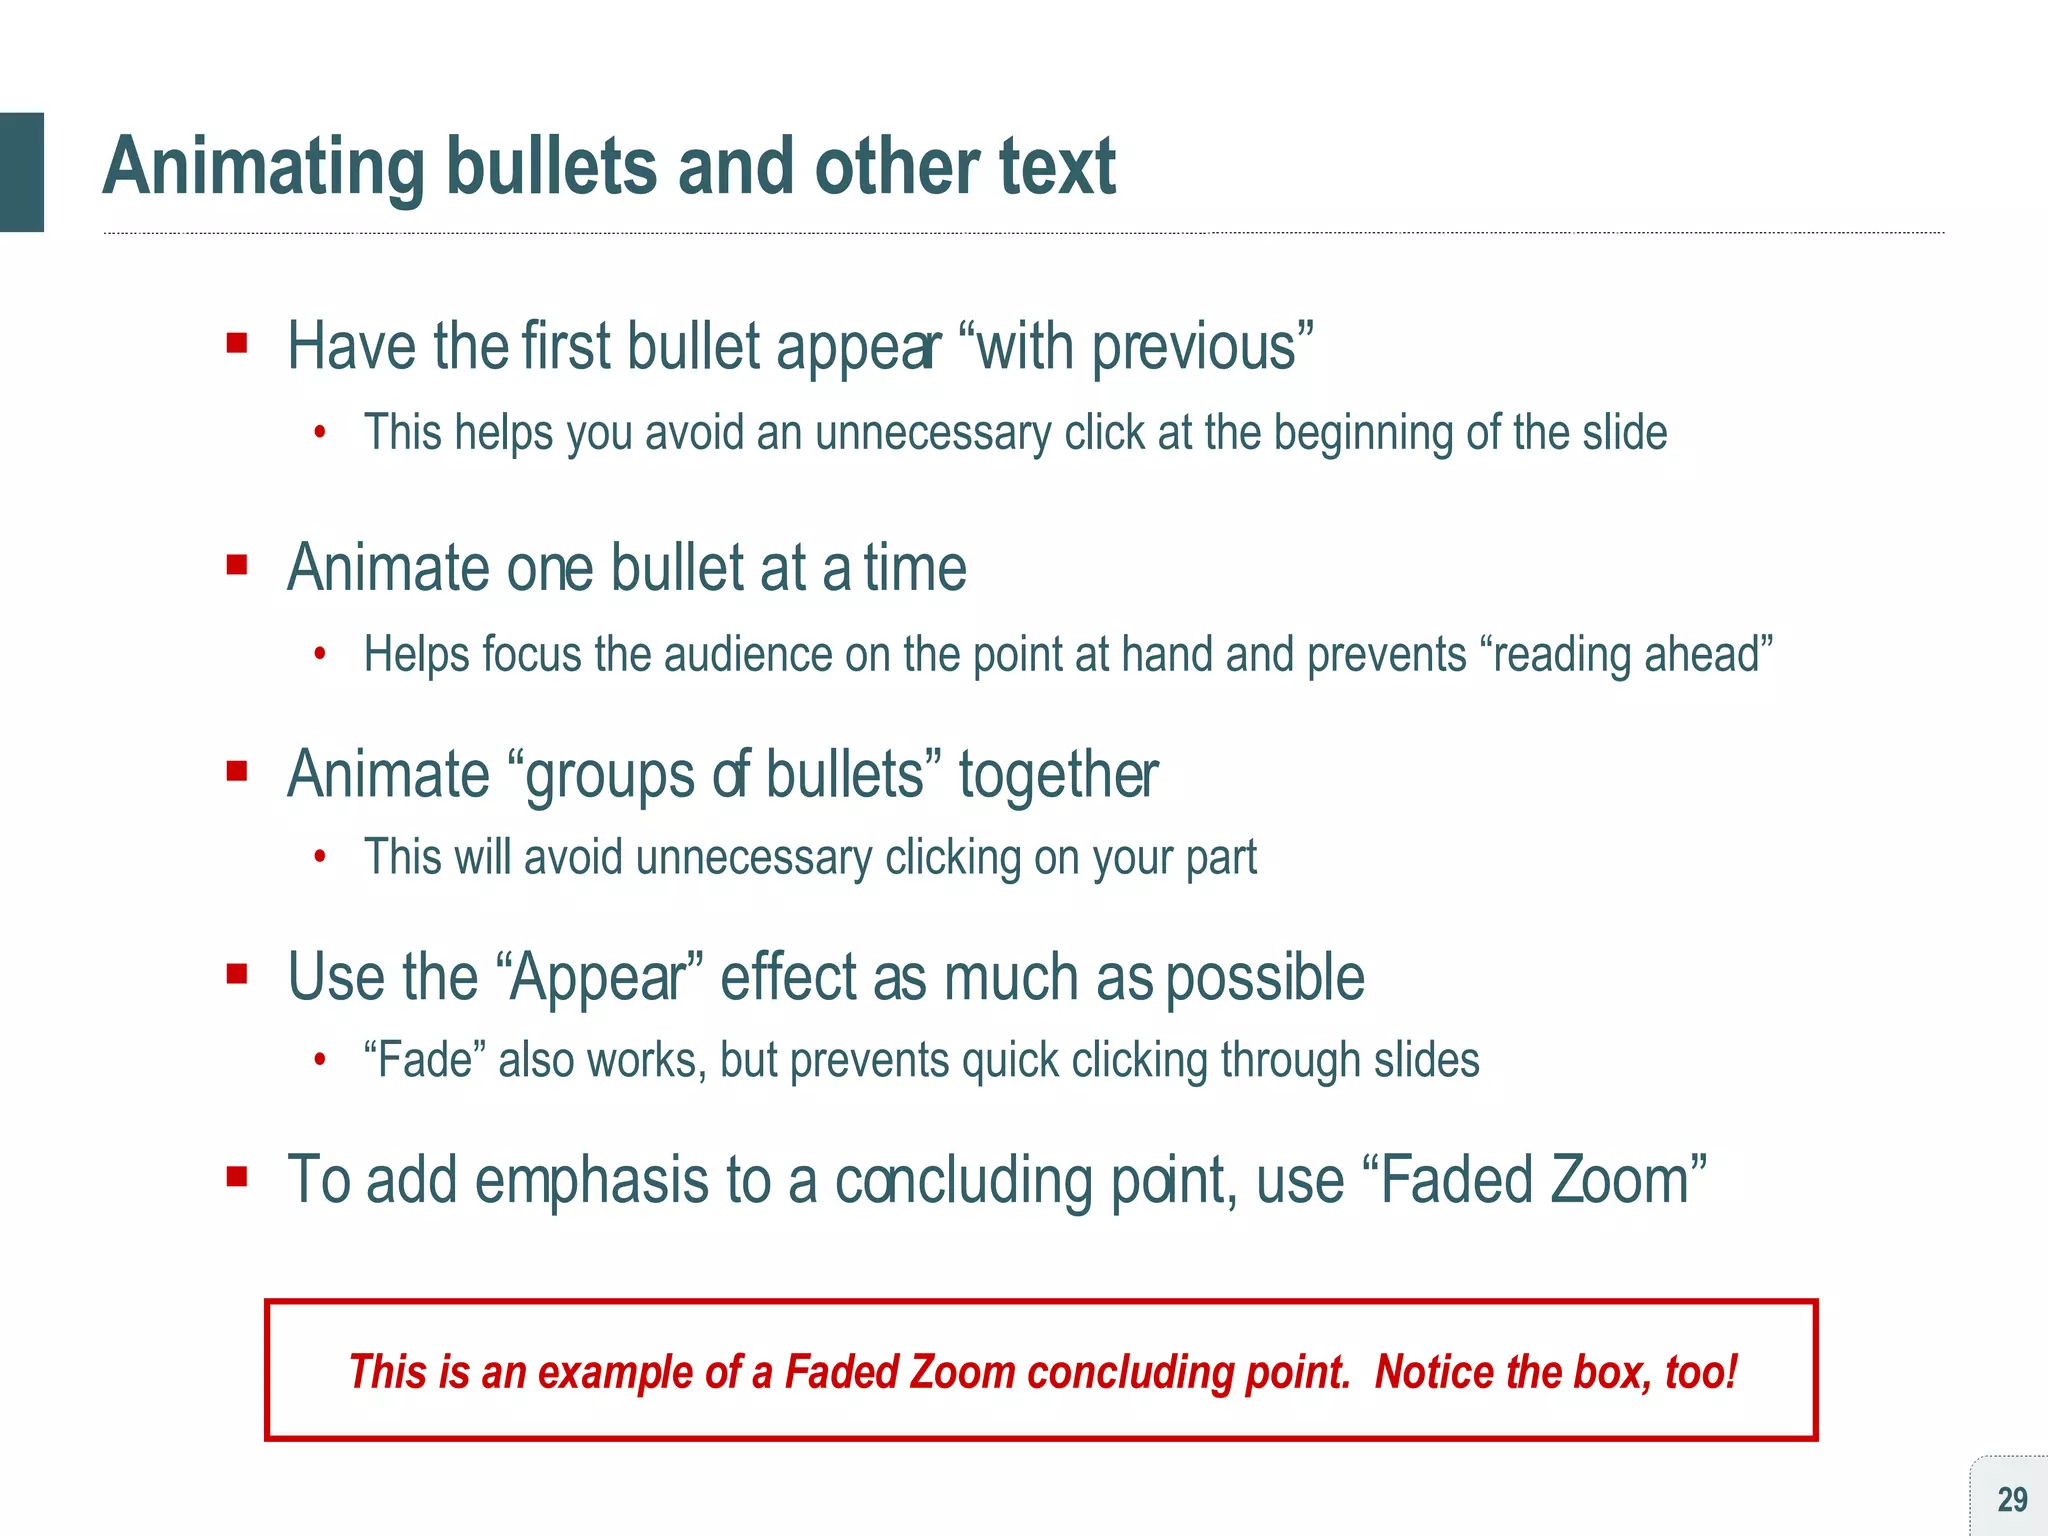
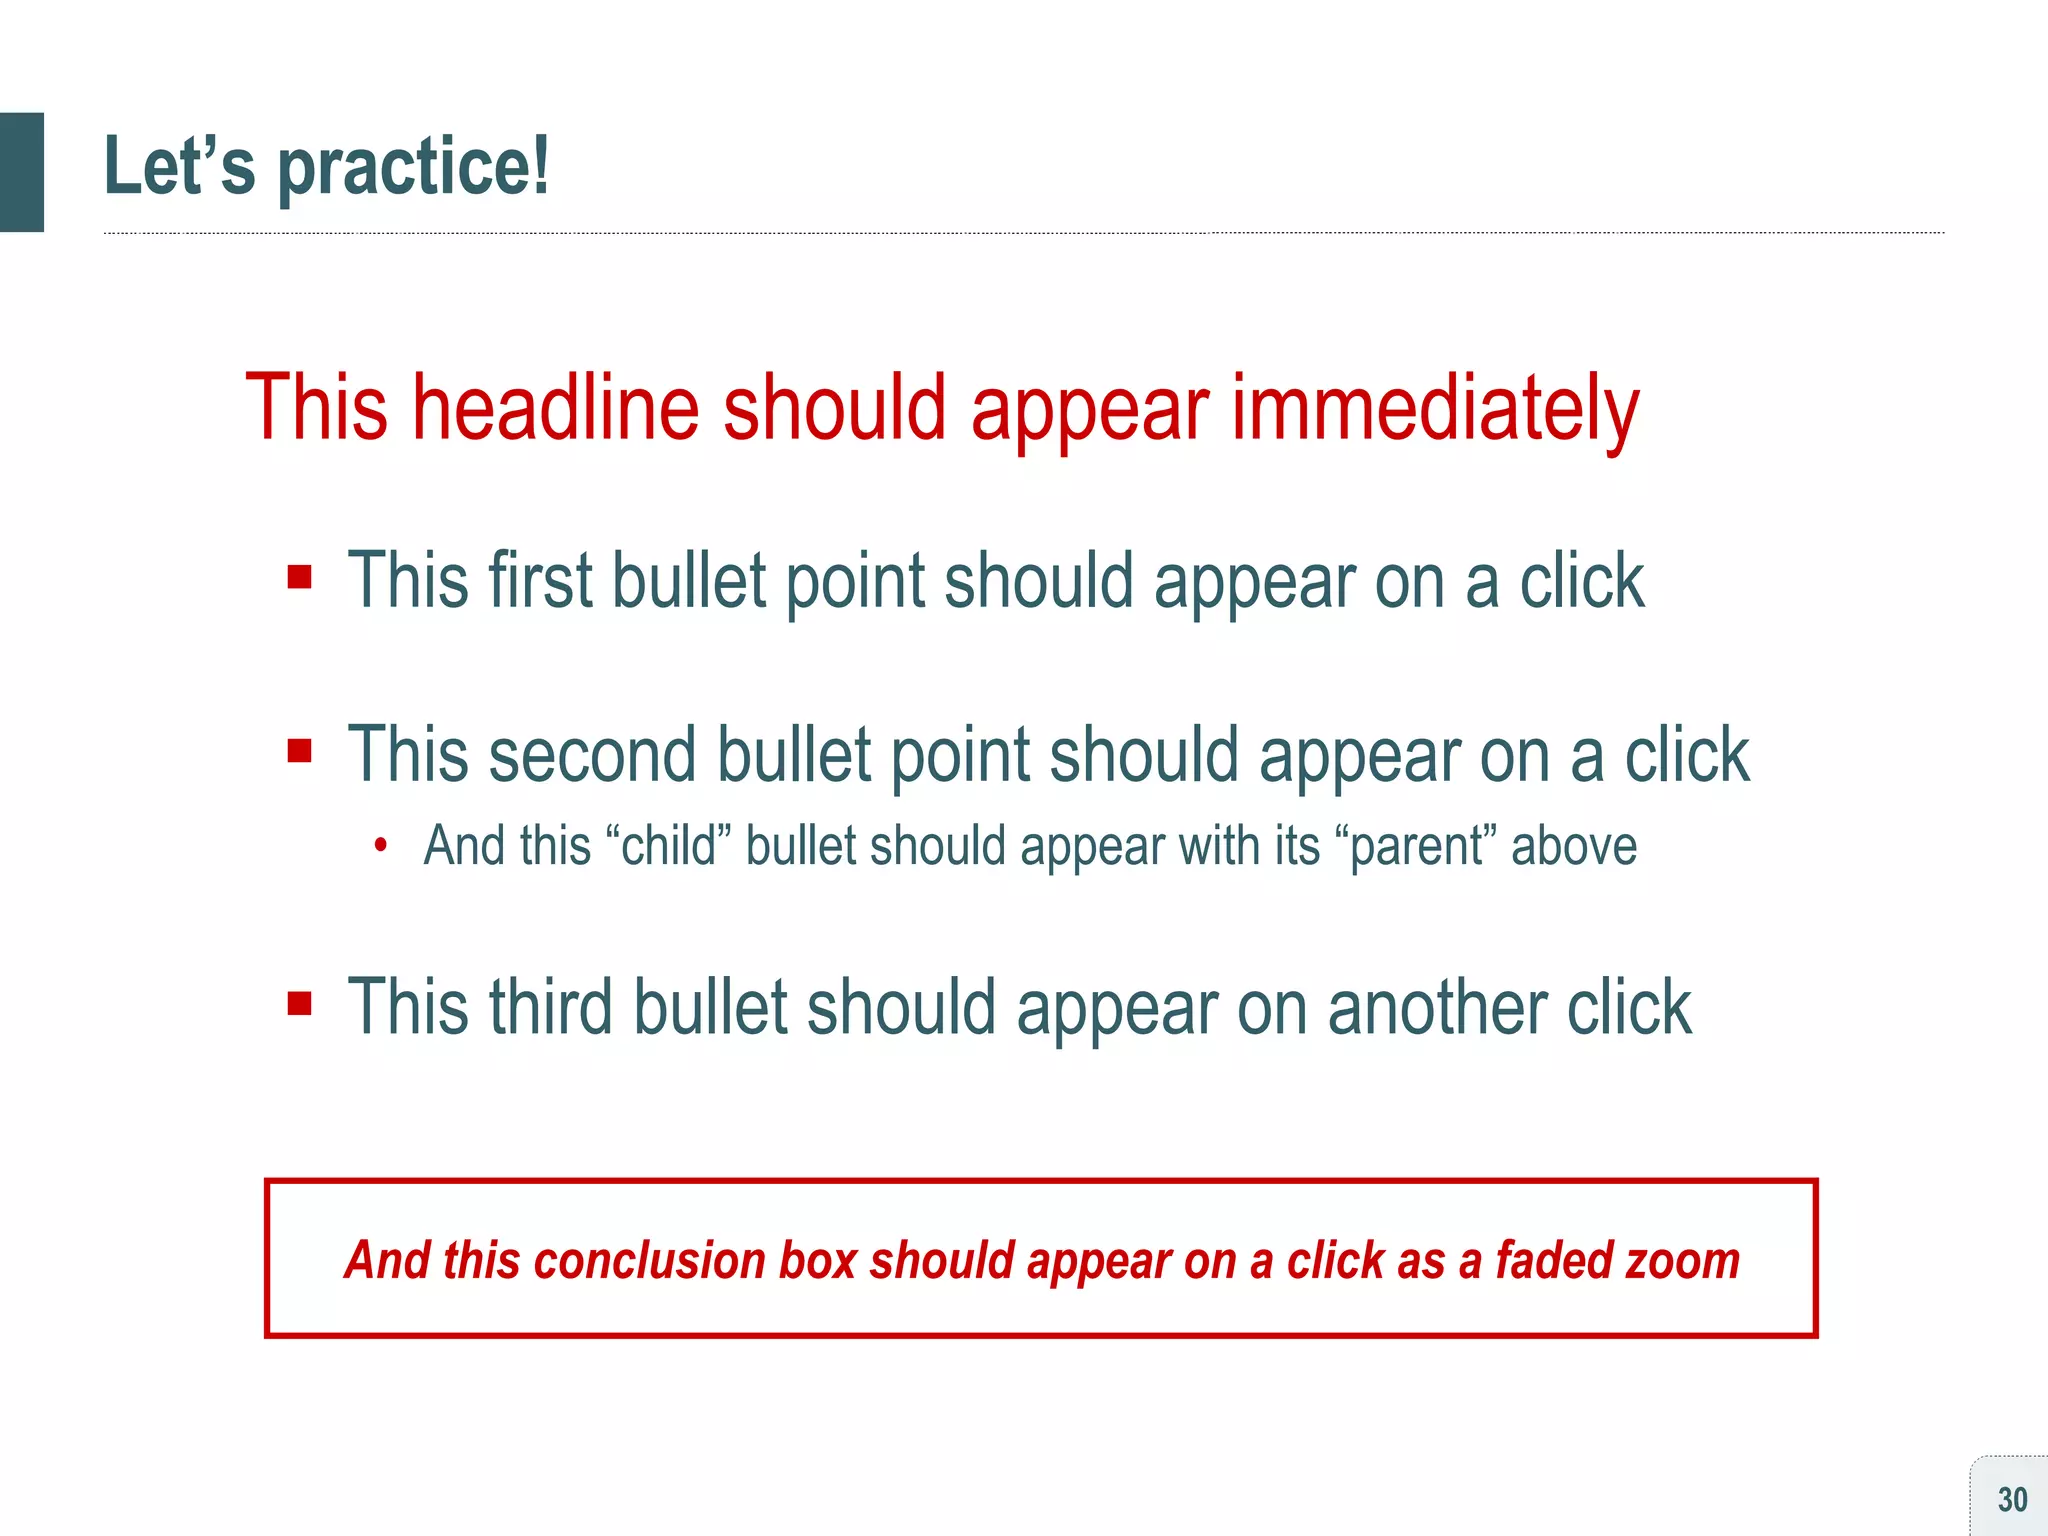
![[ habit #4 ] Animate to narrate, not exaggerate](https://image.slidesharecdn.com/persuading3-1210034841268967-8/85/Persuading-with-Powerpoint-22-320.jpg)
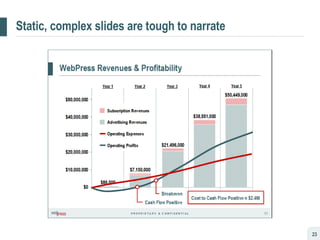


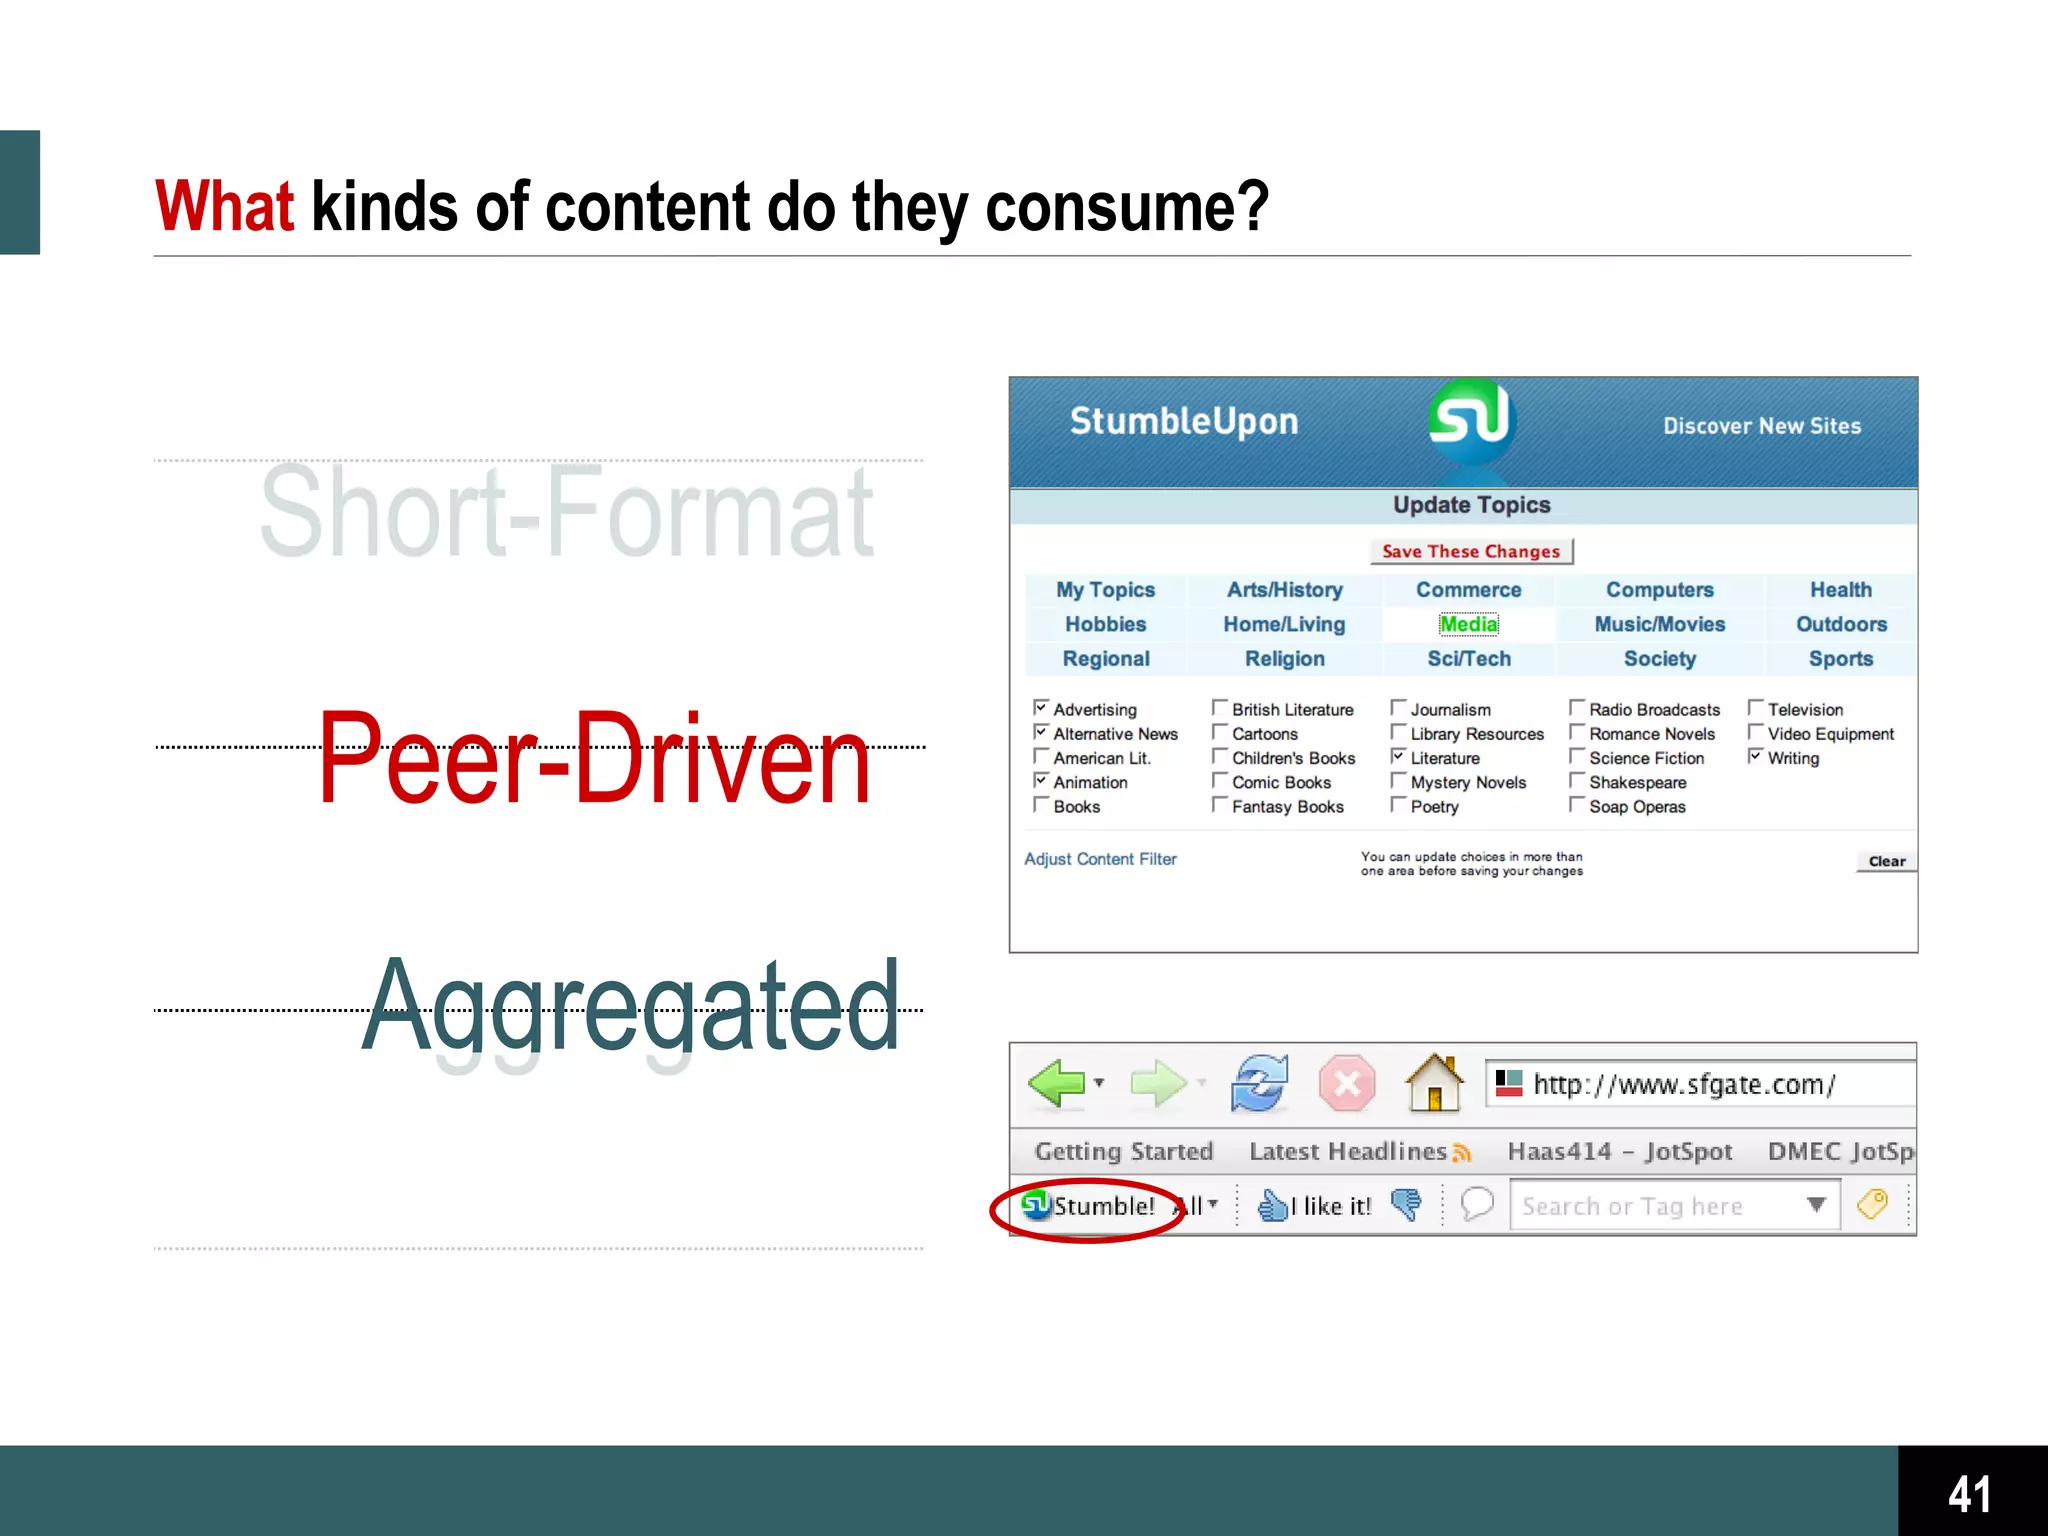
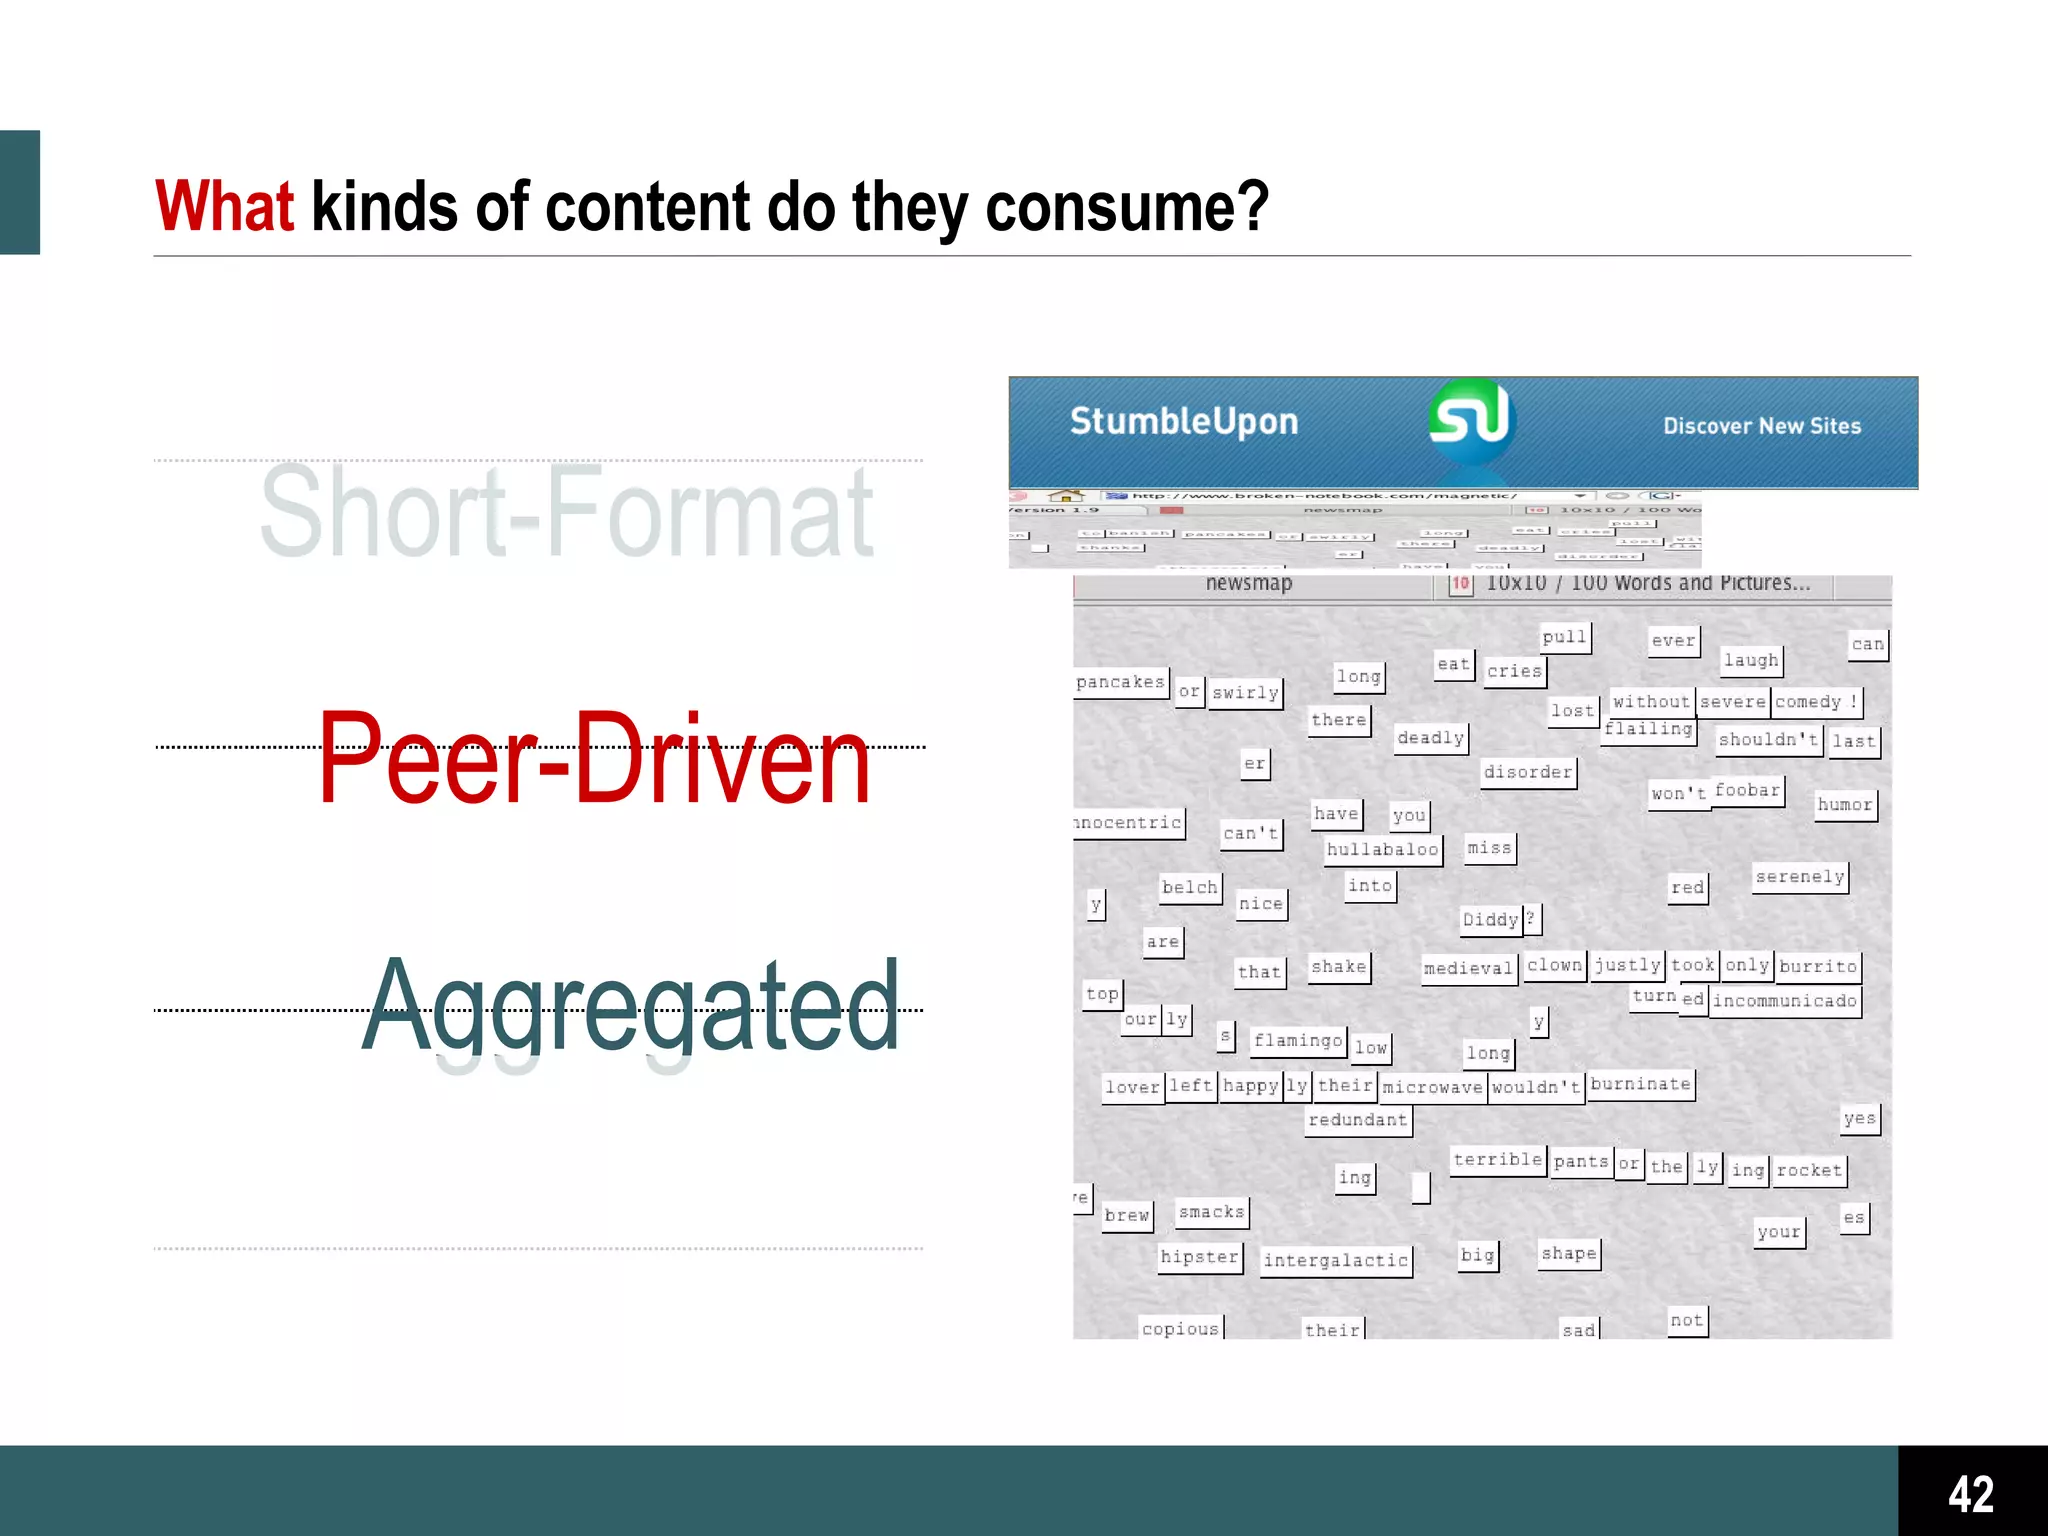
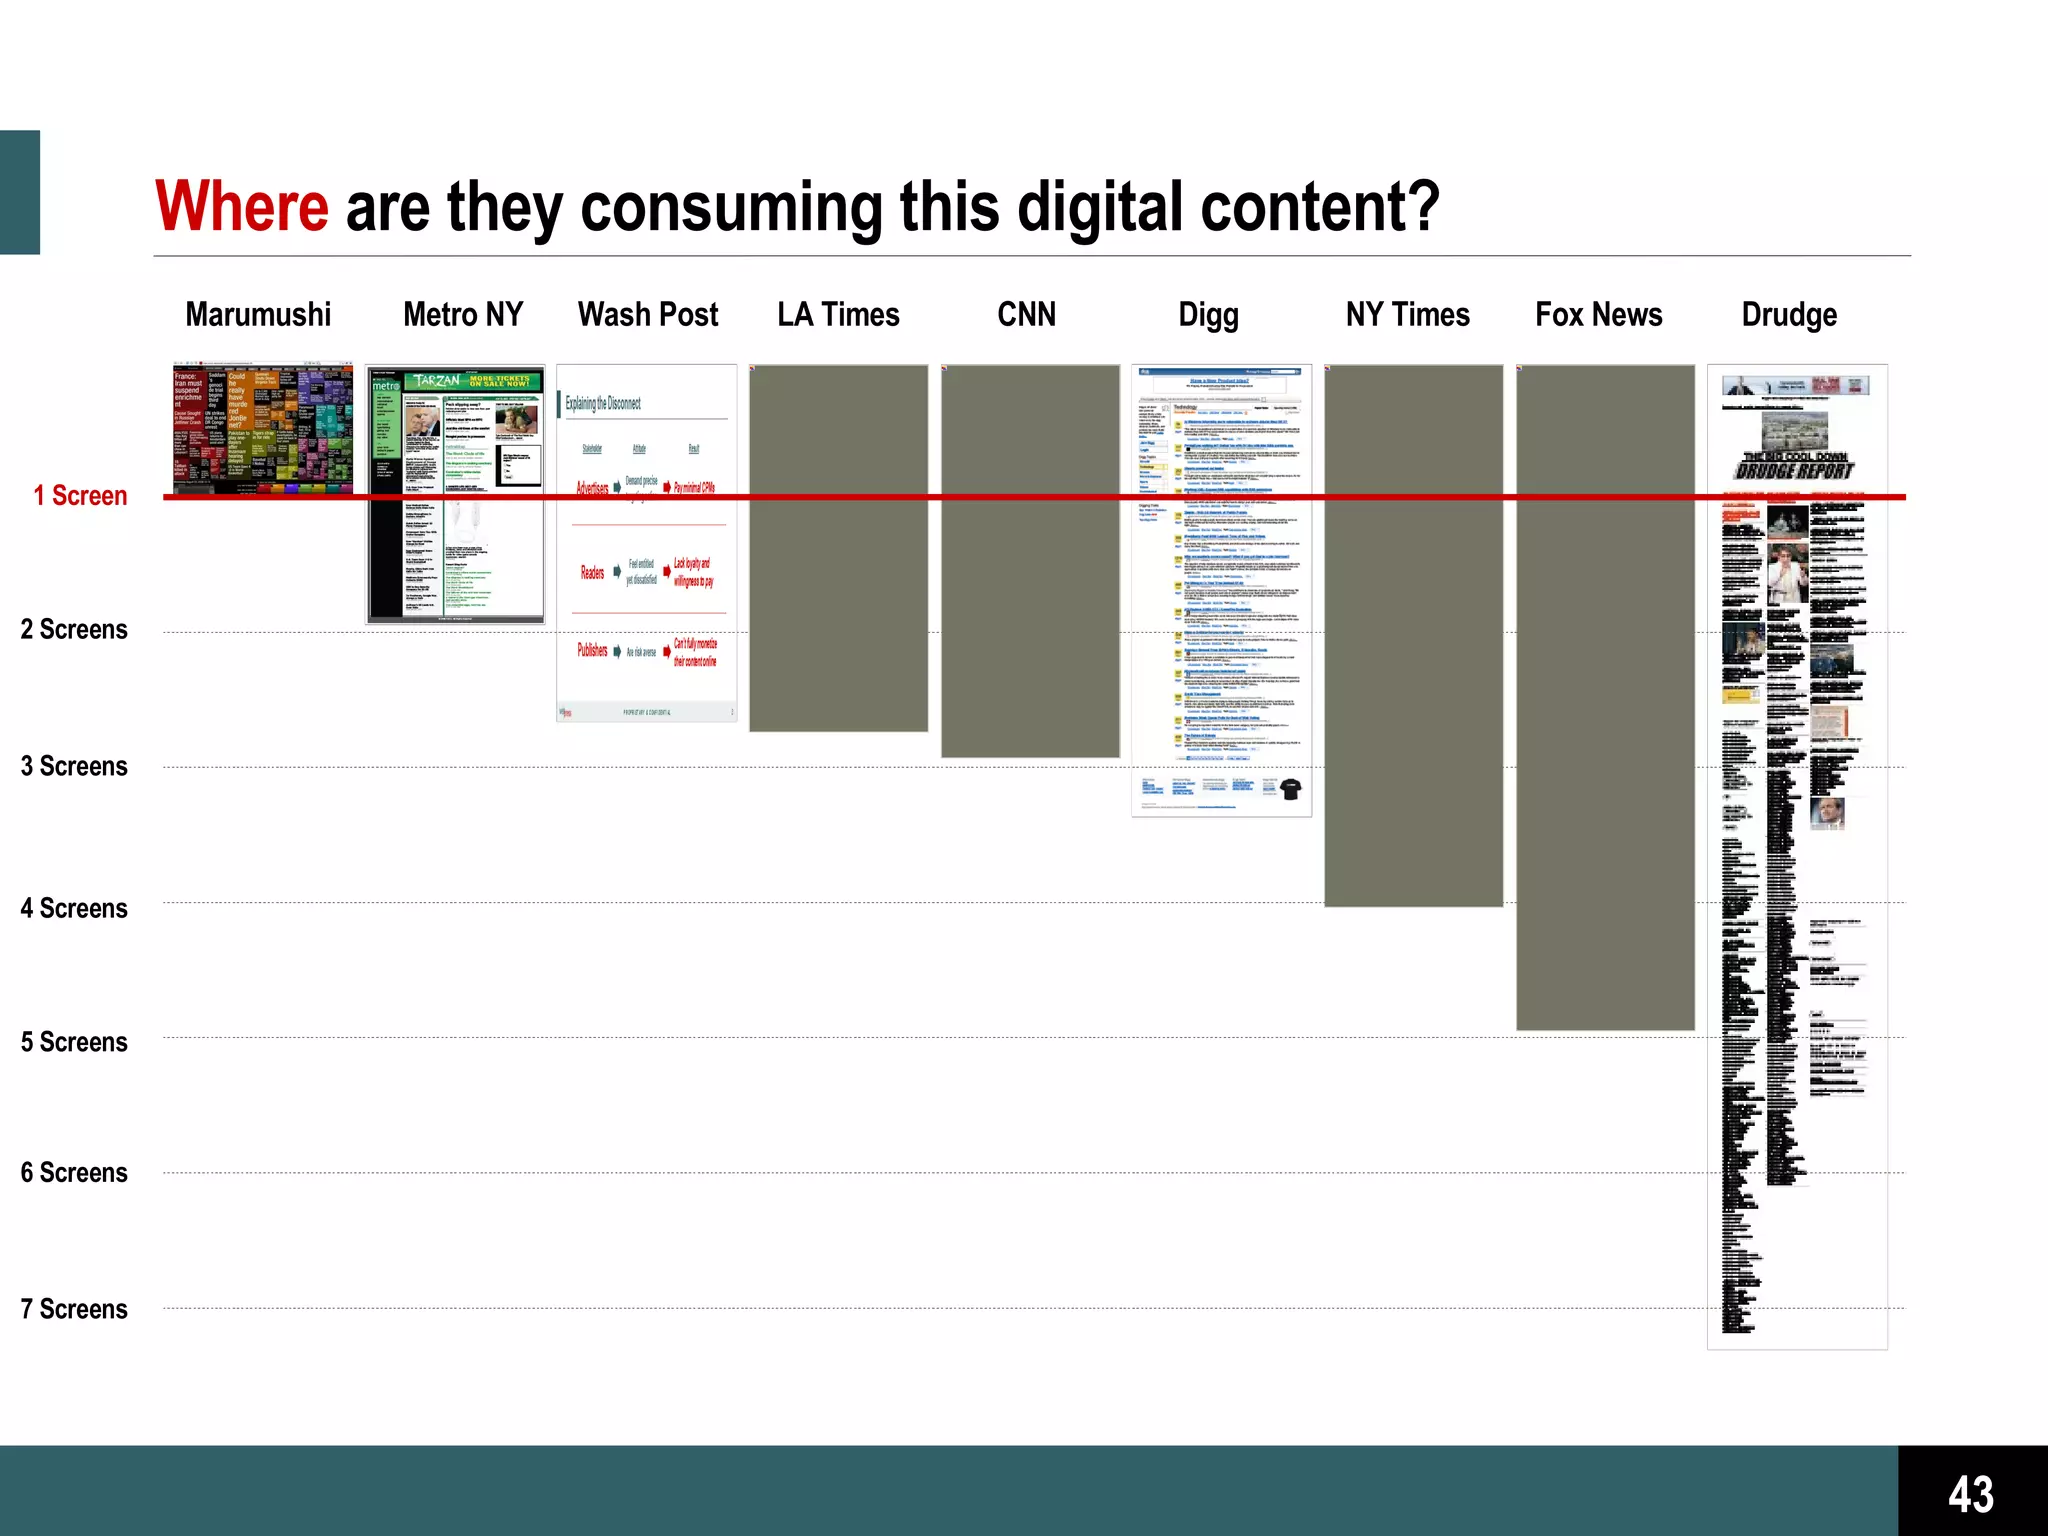
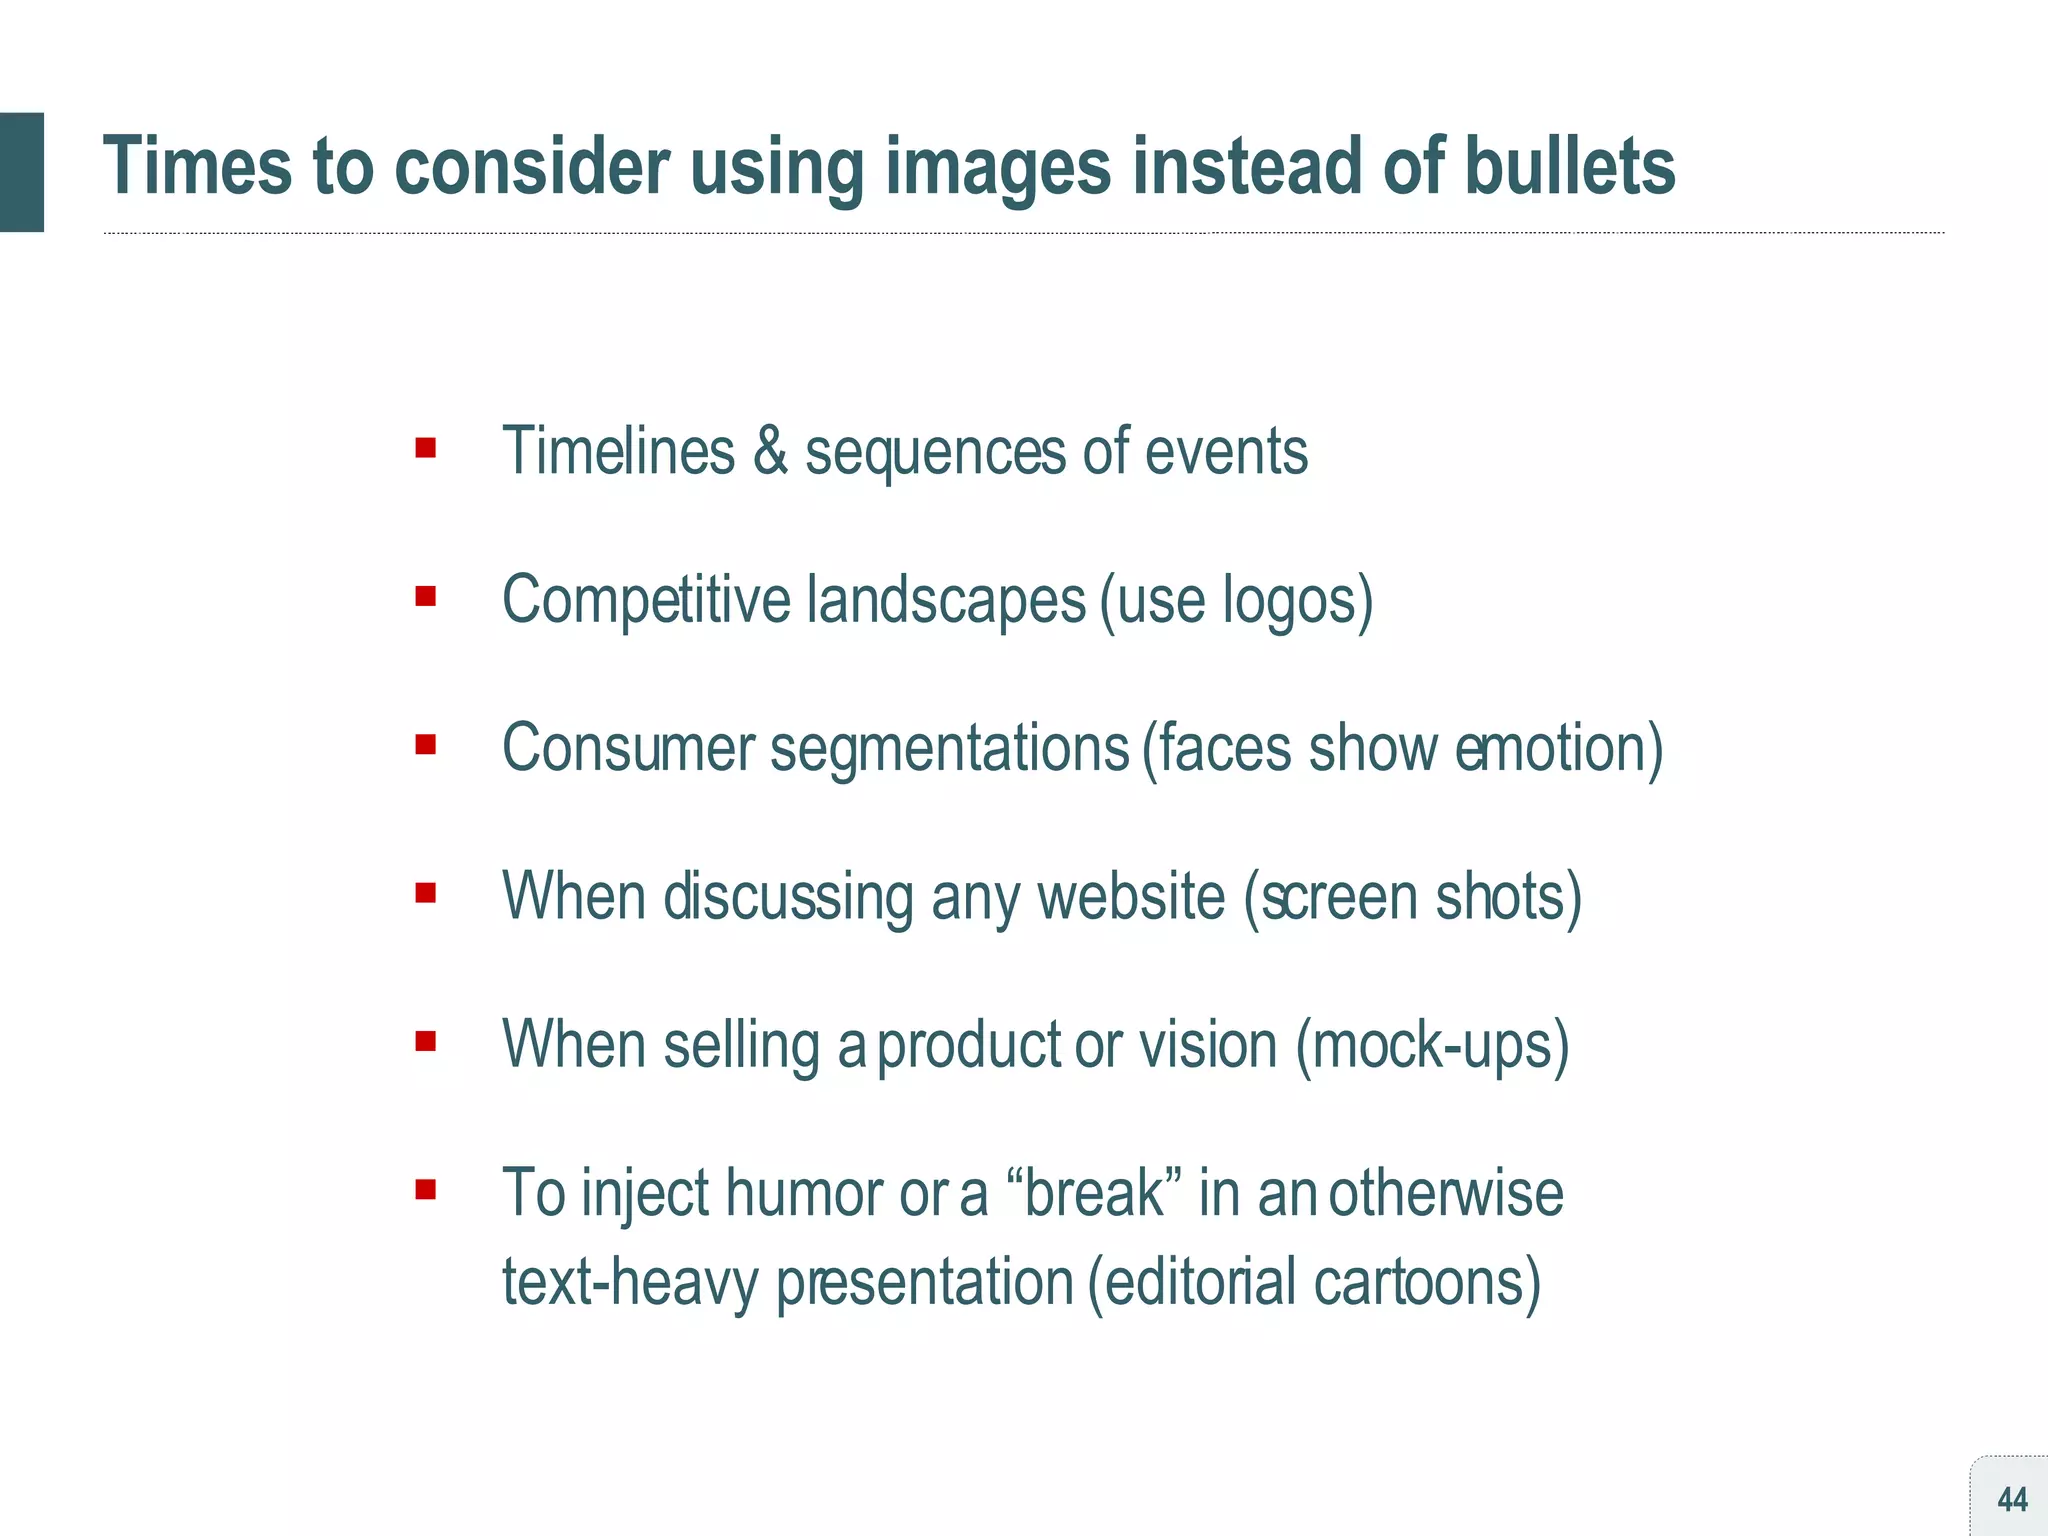
![[ habit #5 ] Show with images, then tell with voiceover Let’s start with an example…](https://image.slidesharecdn.com/persuading3-1210034841268967-8/85/Persuading-with-Powerpoint-39-320.jpg)


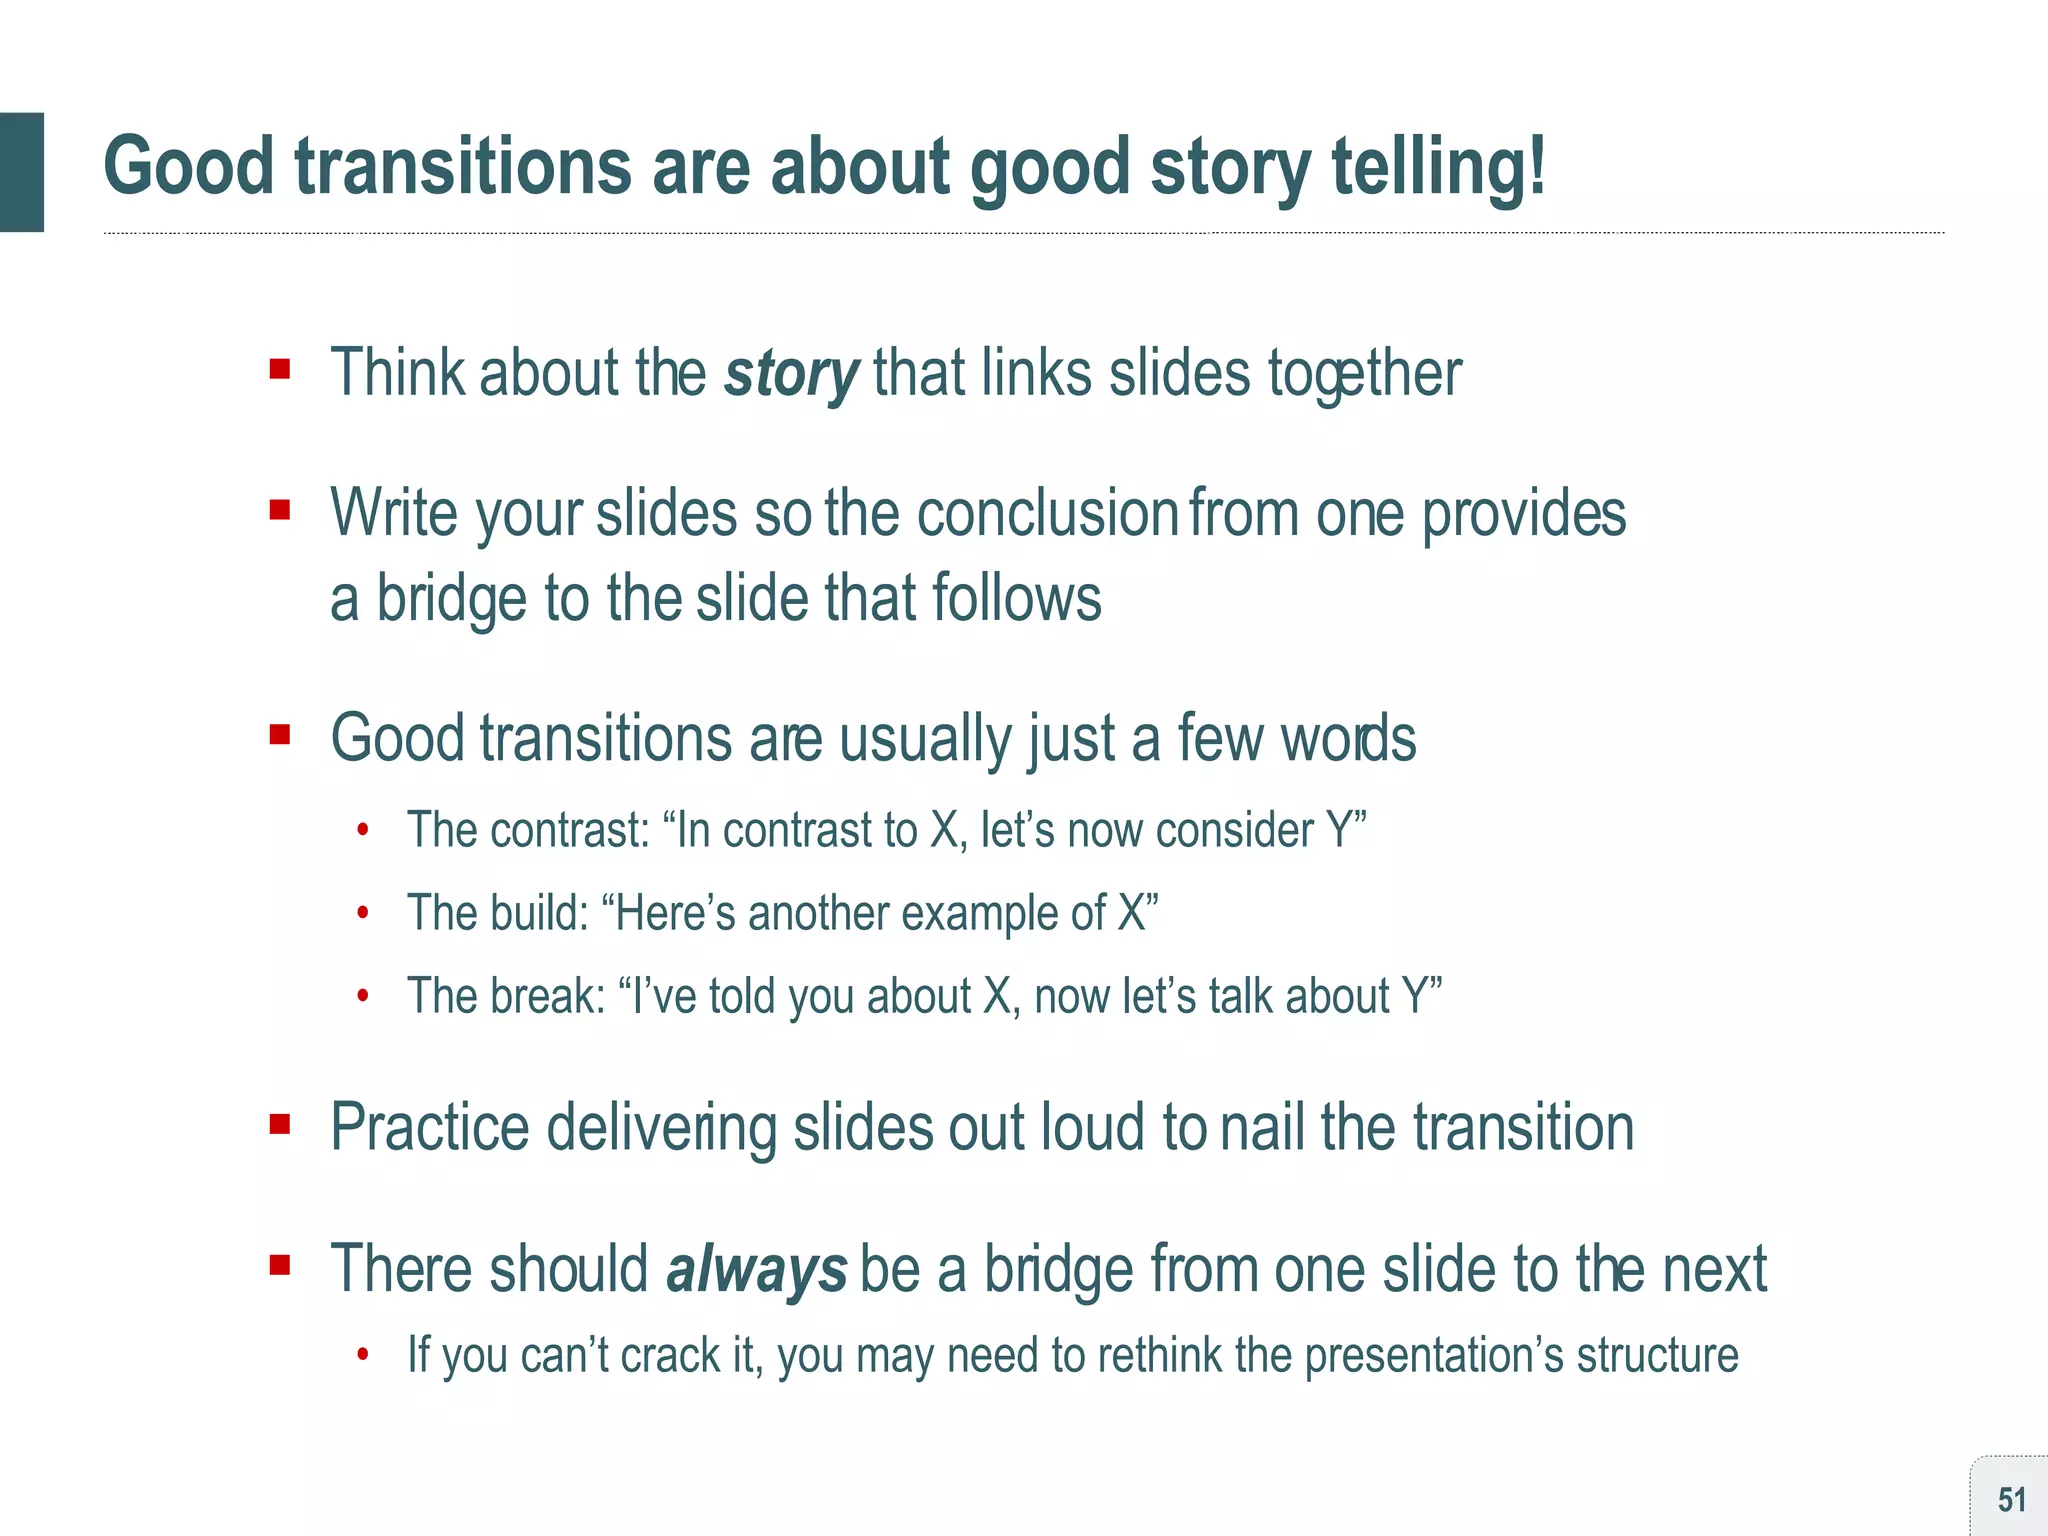
![[ habit #6 ] Build your slides around the transition](https://image.slidesharecdn.com/persuading3-1210034841268967-8/85/Persuading-with-Powerpoint-46-320.jpg)


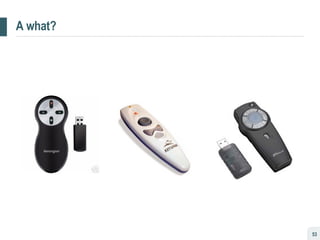
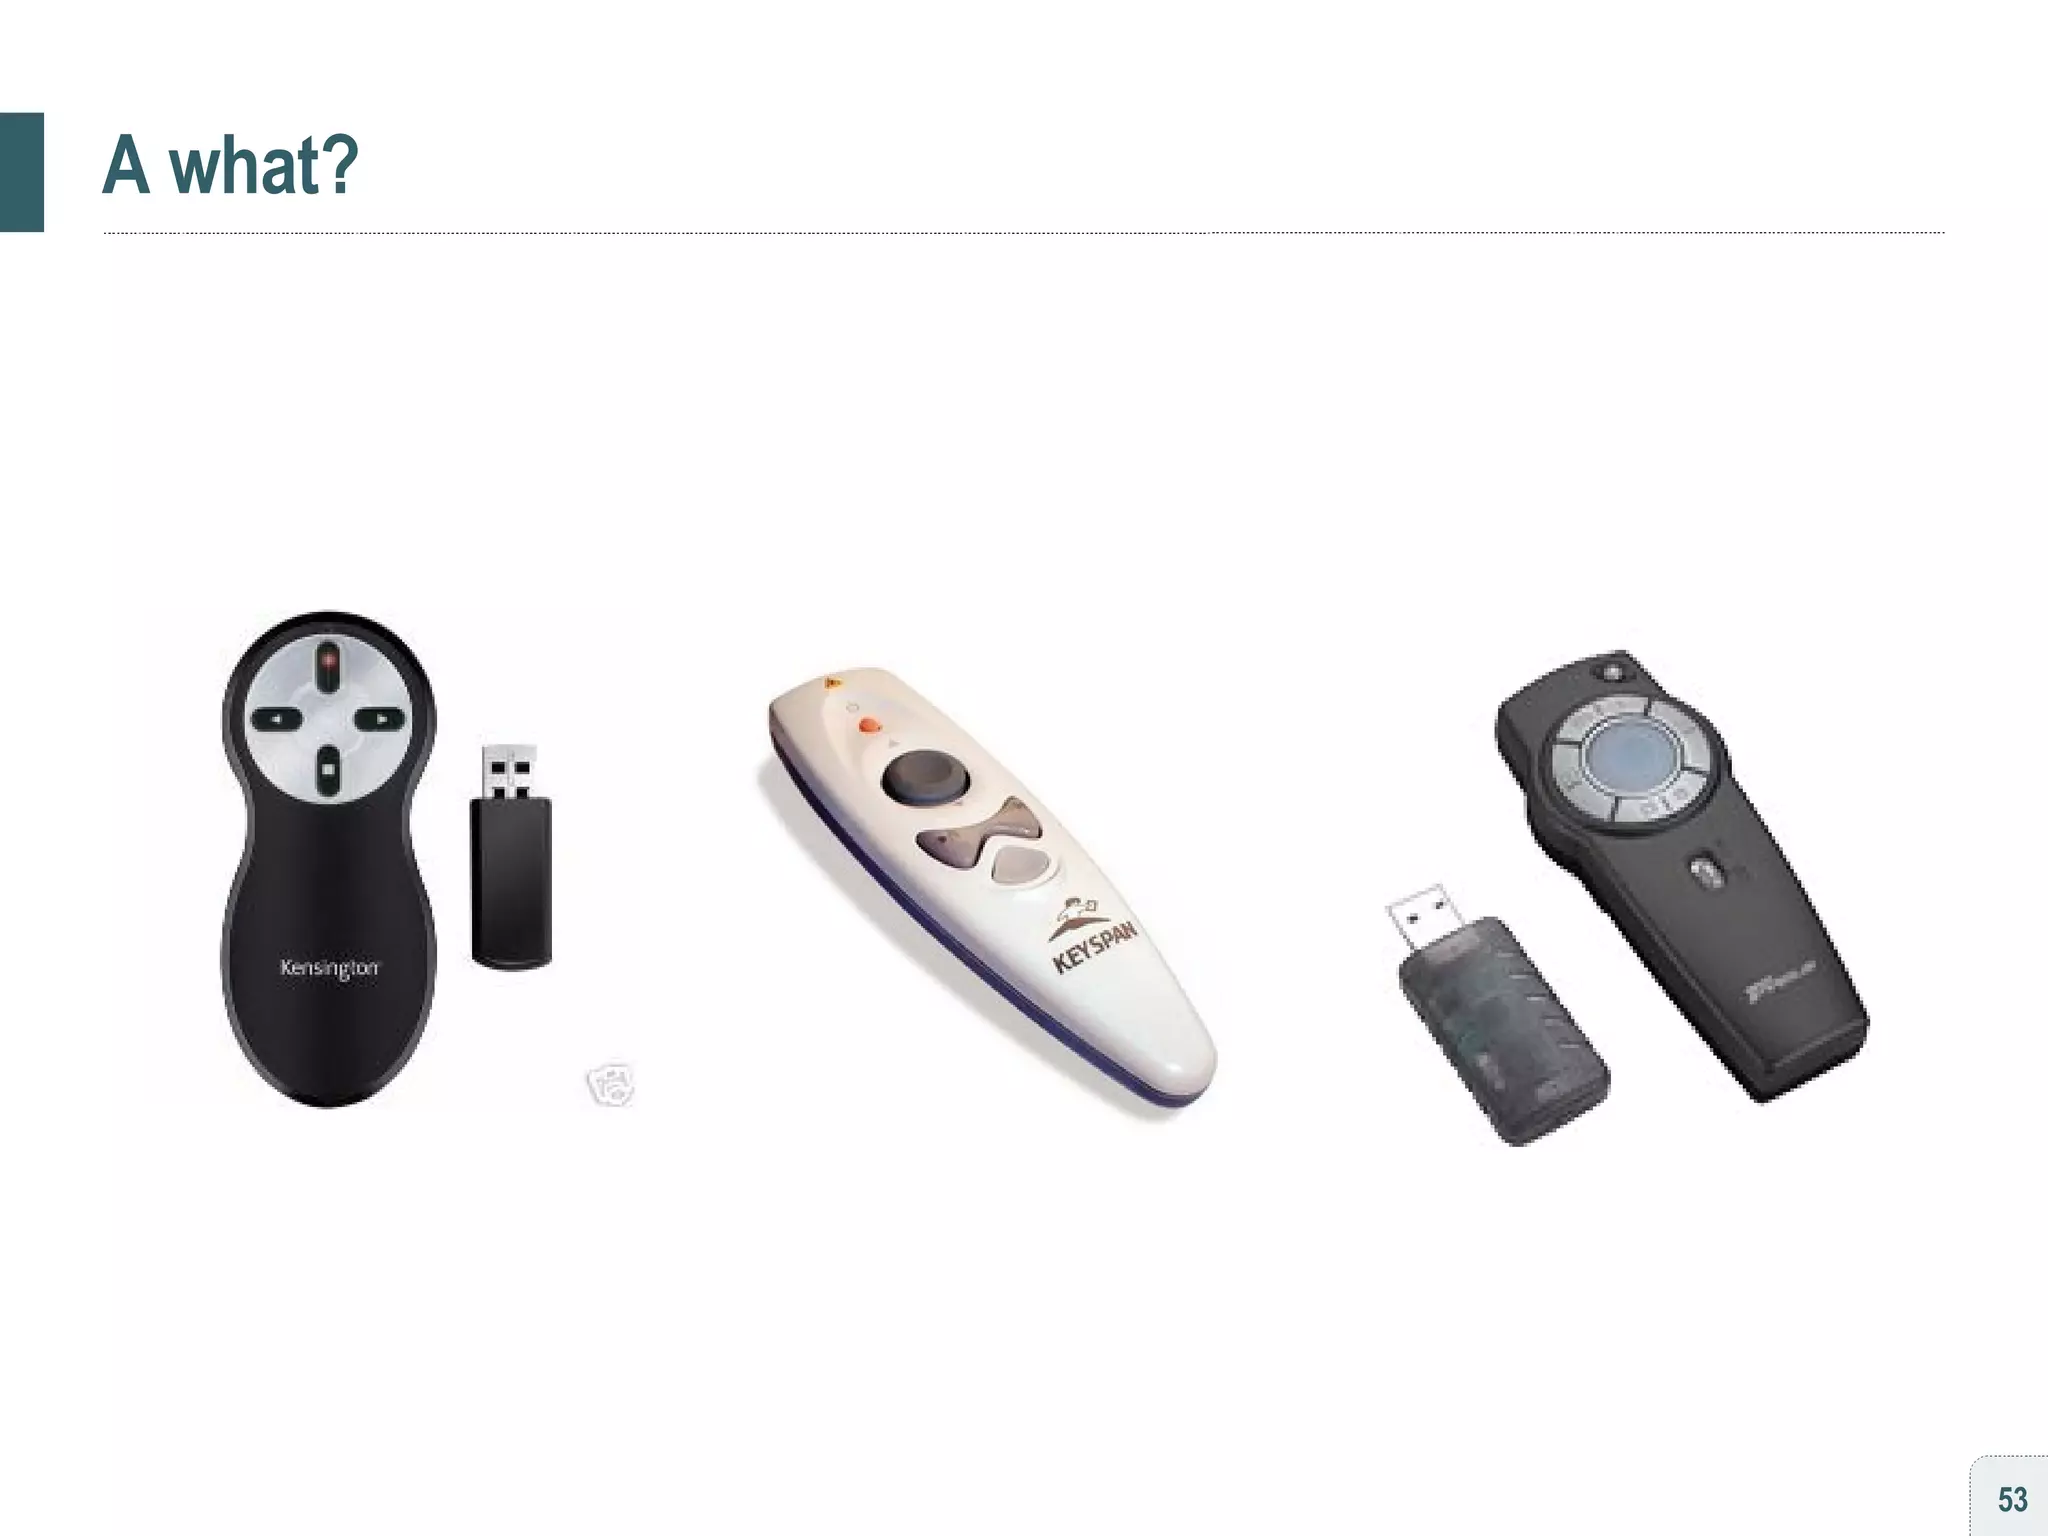
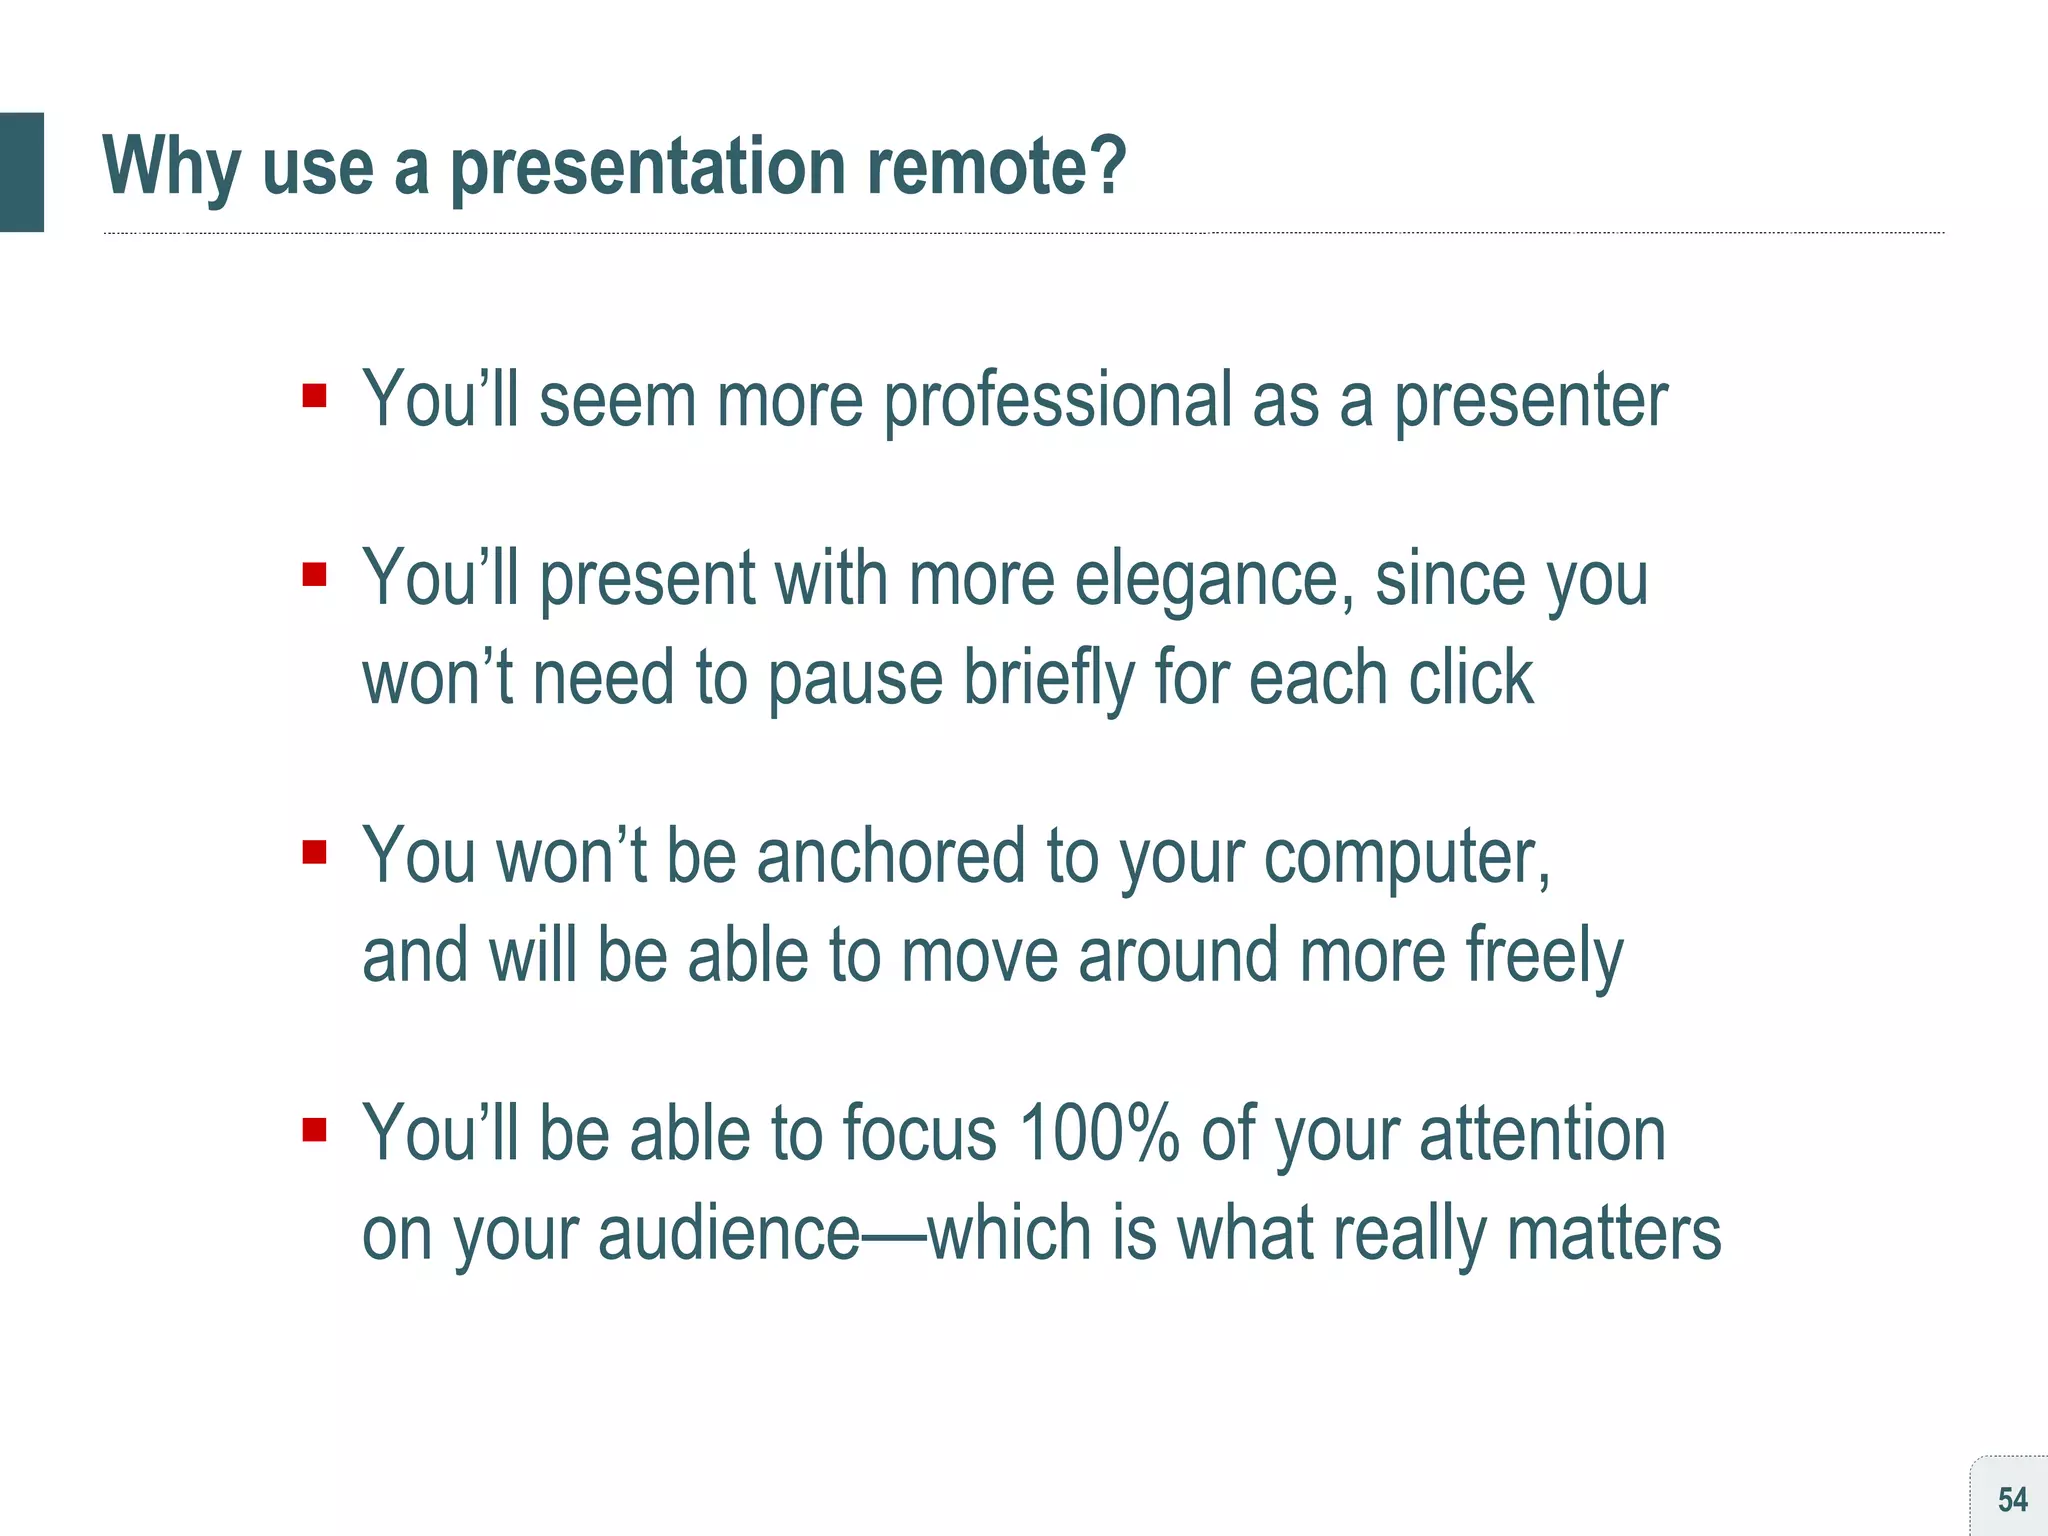
![[ habit #7 ] Learn to love the presentation remote](https://image.slidesharecdn.com/persuading3-1210034841268967-8/85/Persuading-with-Powerpoint-52-320.jpg)
![To review… [ 1 ] Start with a structured story [ 2 ] Standardize your design language [ 3 ] Standardize your written language [ 4 ] Animate to narrate, not exaggerate [ 5 ] Show with images, tell with voiceover [ 6 ] Build slides around the transition [ 7 ] Learn to love the presentation remote](https://image.slidesharecdn.com/persuading3-1210034841268967-8/85/Persuading-with-Powerpoint-55-320.jpg)
![The Seven Habits of Highly Effective Presentations [ 1 ] Start with a structured story [ 2 ] Standardize your design language [ 3 ] Standardize your written language [ 4 ] Animate to narrate, not exaggerate [ 5 ] Show with images, tell with voiceover [ 6 ] Build slides around the transition [ 7 ] Learn to love the presentation remote](https://image.slidesharecdn.com/persuading3-1210034841268967-8/75/Persuading-with-Powerpoint-2-2048.jpg)
![[ habit #1 ] Start with a structured story](https://image.slidesharecdn.com/persuading3-1210034841268967-8/75/Persuading-with-Powerpoint-3-2048.jpg)
![[ habit #2 ] Standardize your design language](https://image.slidesharecdn.com/persuading3-1210034841268967-8/75/Persuading-with-Powerpoint-7-2048.jpg)

![[ habit #3 ] Standardize your written language](https://image.slidesharecdn.com/persuading3-1210034841268967-8/75/Persuading-with-Powerpoint-19-2048.jpg)

![[ habit #4 ] Animate to narrate, not exaggerate](https://image.slidesharecdn.com/persuading3-1210034841268967-8/75/Persuading-with-Powerpoint-22-2048.jpg)


![[ habit #5 ] Show with images, then tell with voiceover Let’s start with an example…](https://image.slidesharecdn.com/persuading3-1210034841268967-8/75/Persuading-with-Powerpoint-39-2048.jpg)

![[ habit #6 ] Build your slides around the transition](https://image.slidesharecdn.com/persuading3-1210034841268967-8/75/Persuading-with-Powerpoint-46-2048.jpg)

![[ habit #7 ] Learn to love the presentation remote](https://image.slidesharecdn.com/persuading3-1210034841268967-8/75/Persuading-with-Powerpoint-52-2048.jpg)
![To review… [ 1 ] Start with a structured story [ 2 ] Standardize your design language [ 3 ] Standardize your written language [ 4 ] Animate to narrate, not exaggerate [ 5 ] Show with images, tell with voiceover [ 6 ] Build slides around the transition [ 7 ] Learn to love the presentation remote](https://image.slidesharecdn.com/persuading3-1210034841268967-8/75/Persuading-with-Powerpoint-55-2048.jpg)

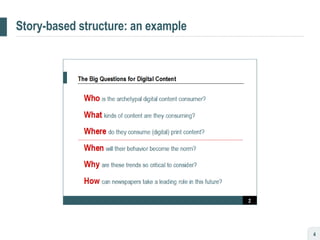
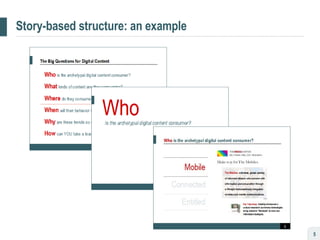
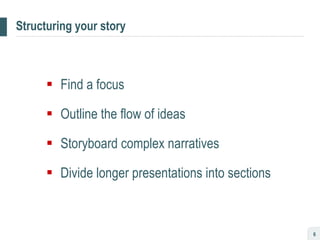
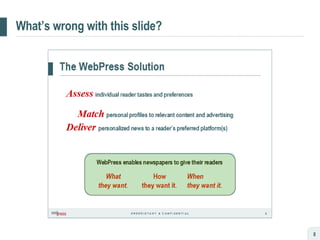
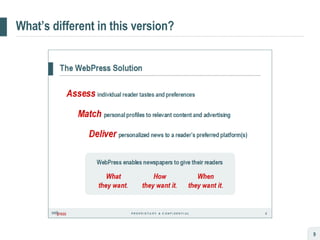
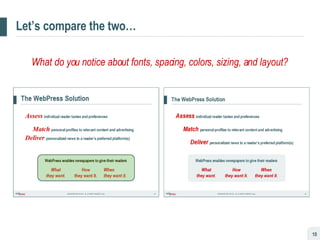
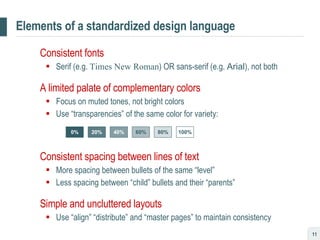
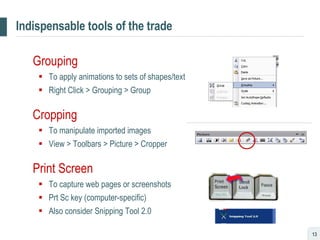
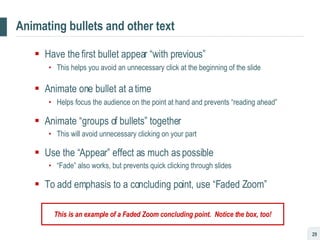
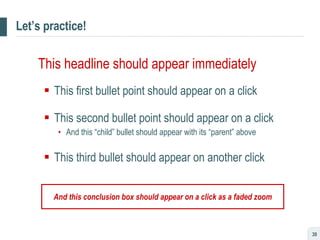
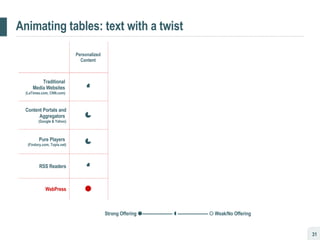
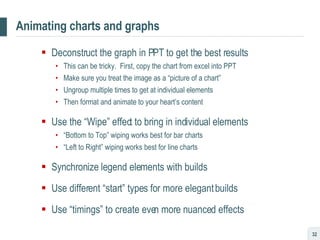
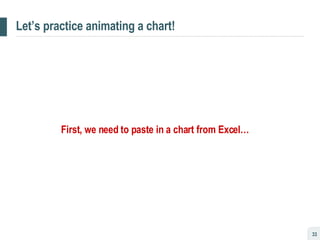
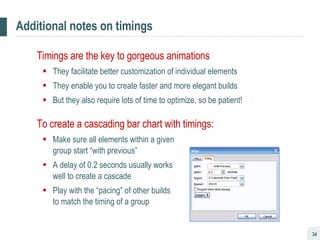
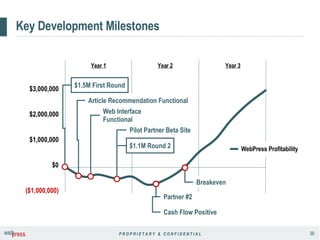
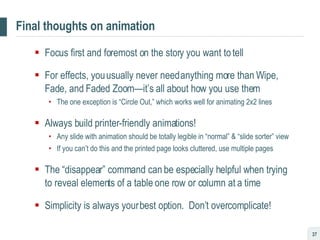
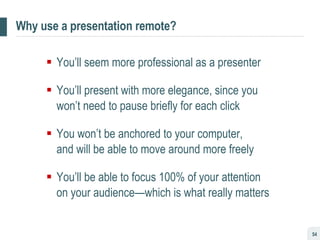
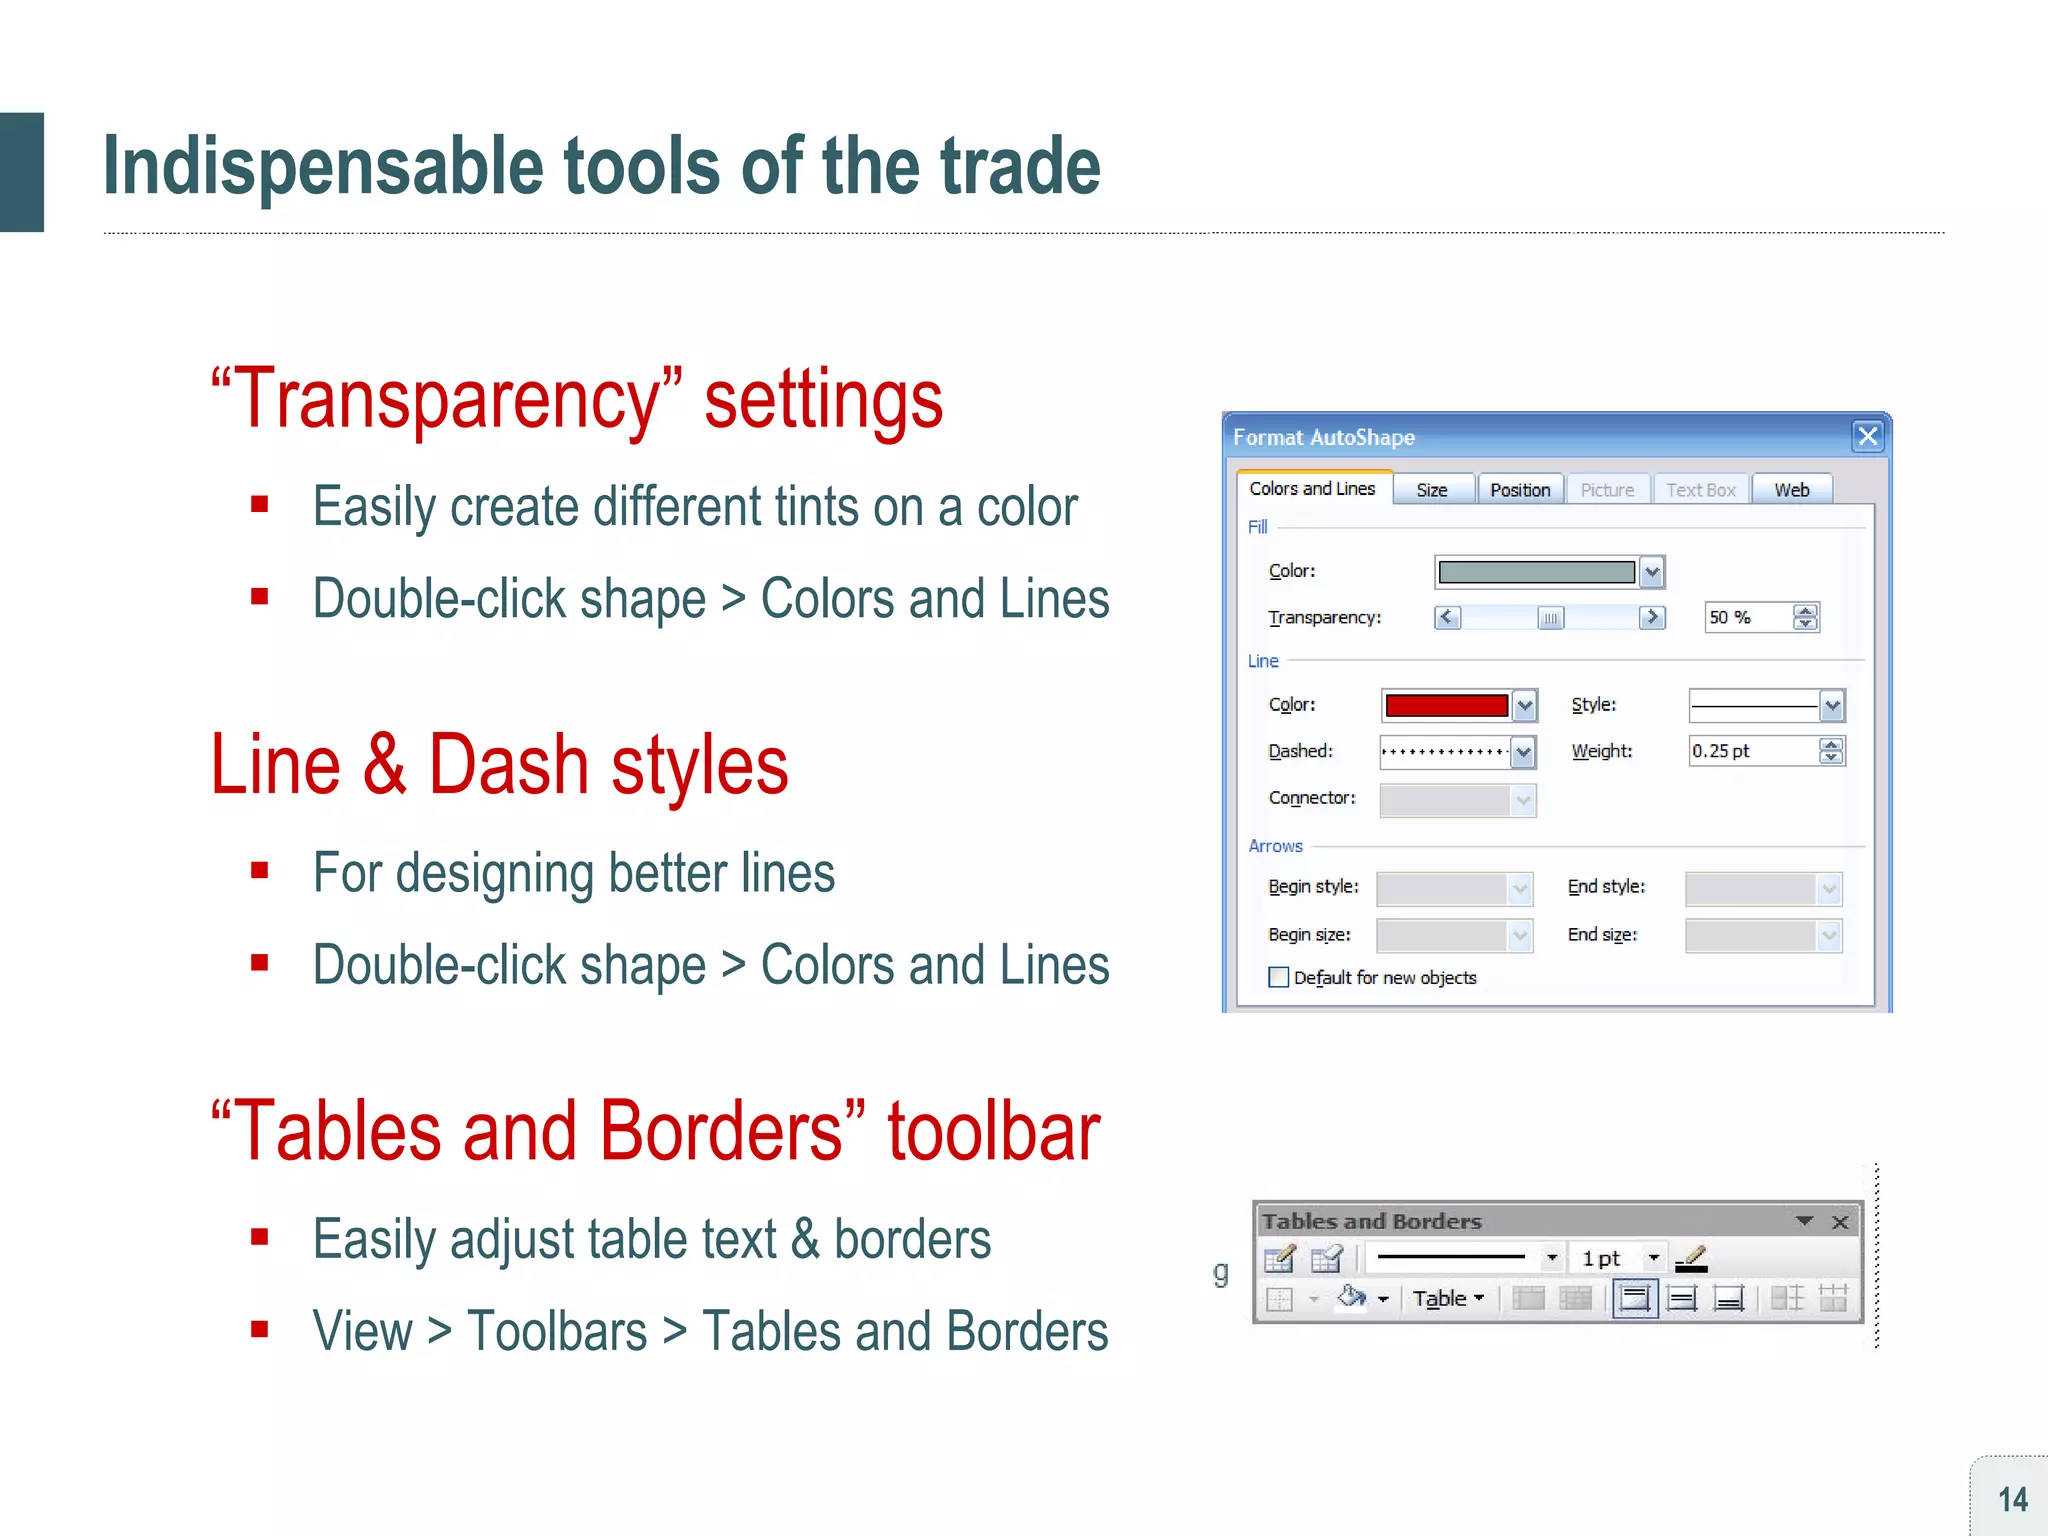
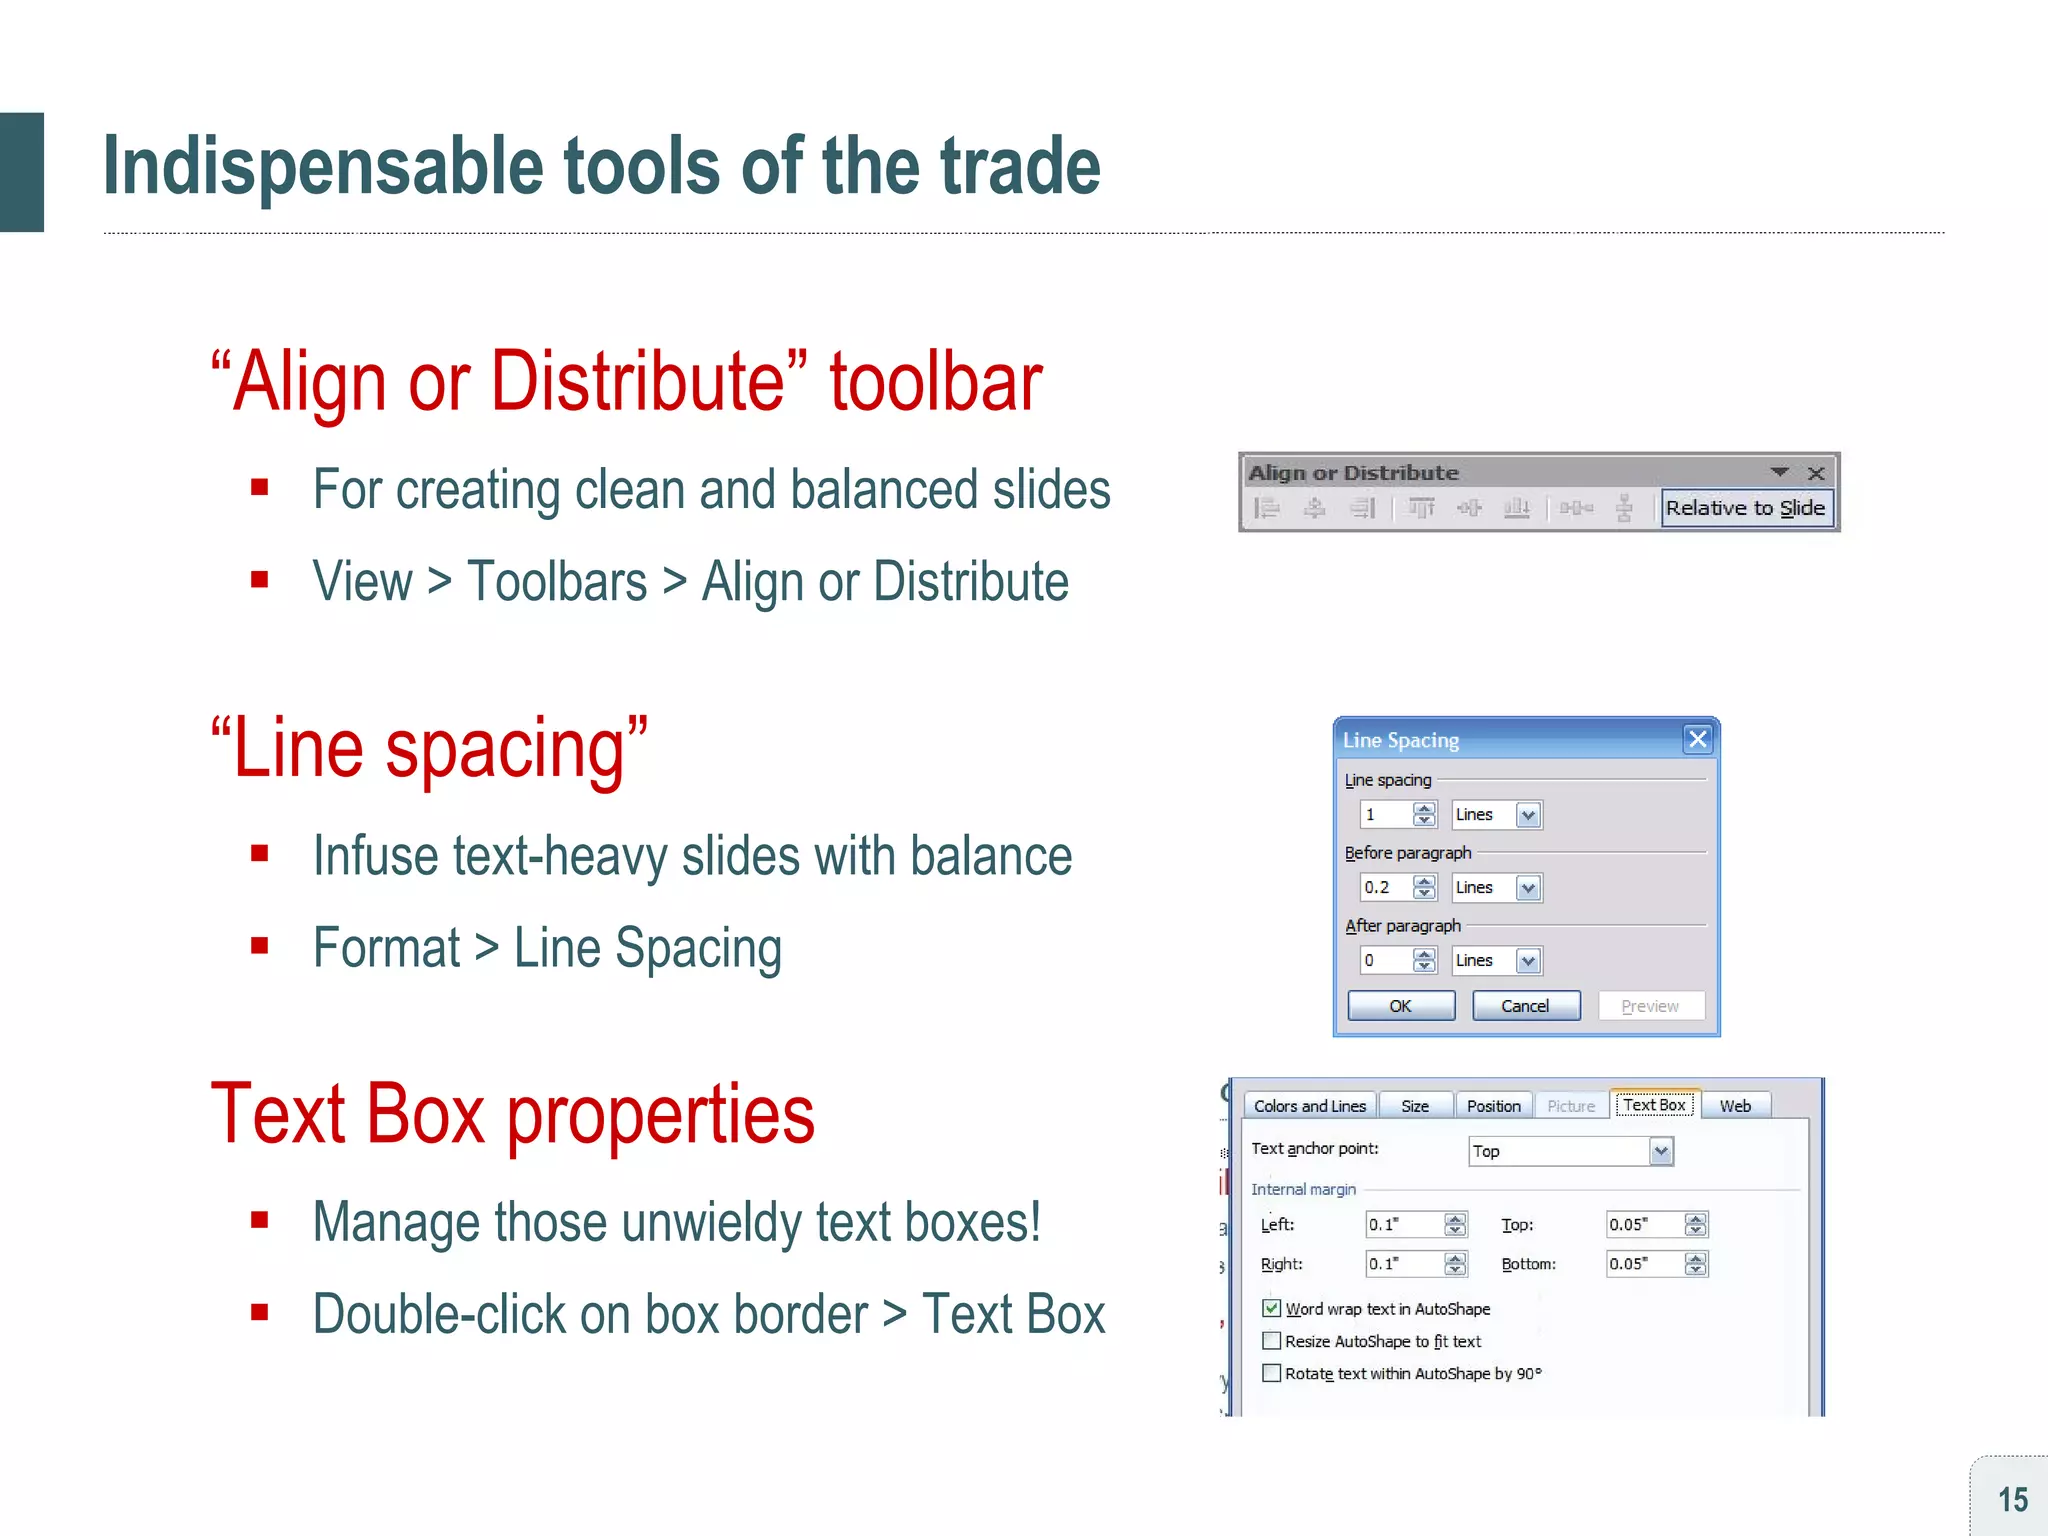
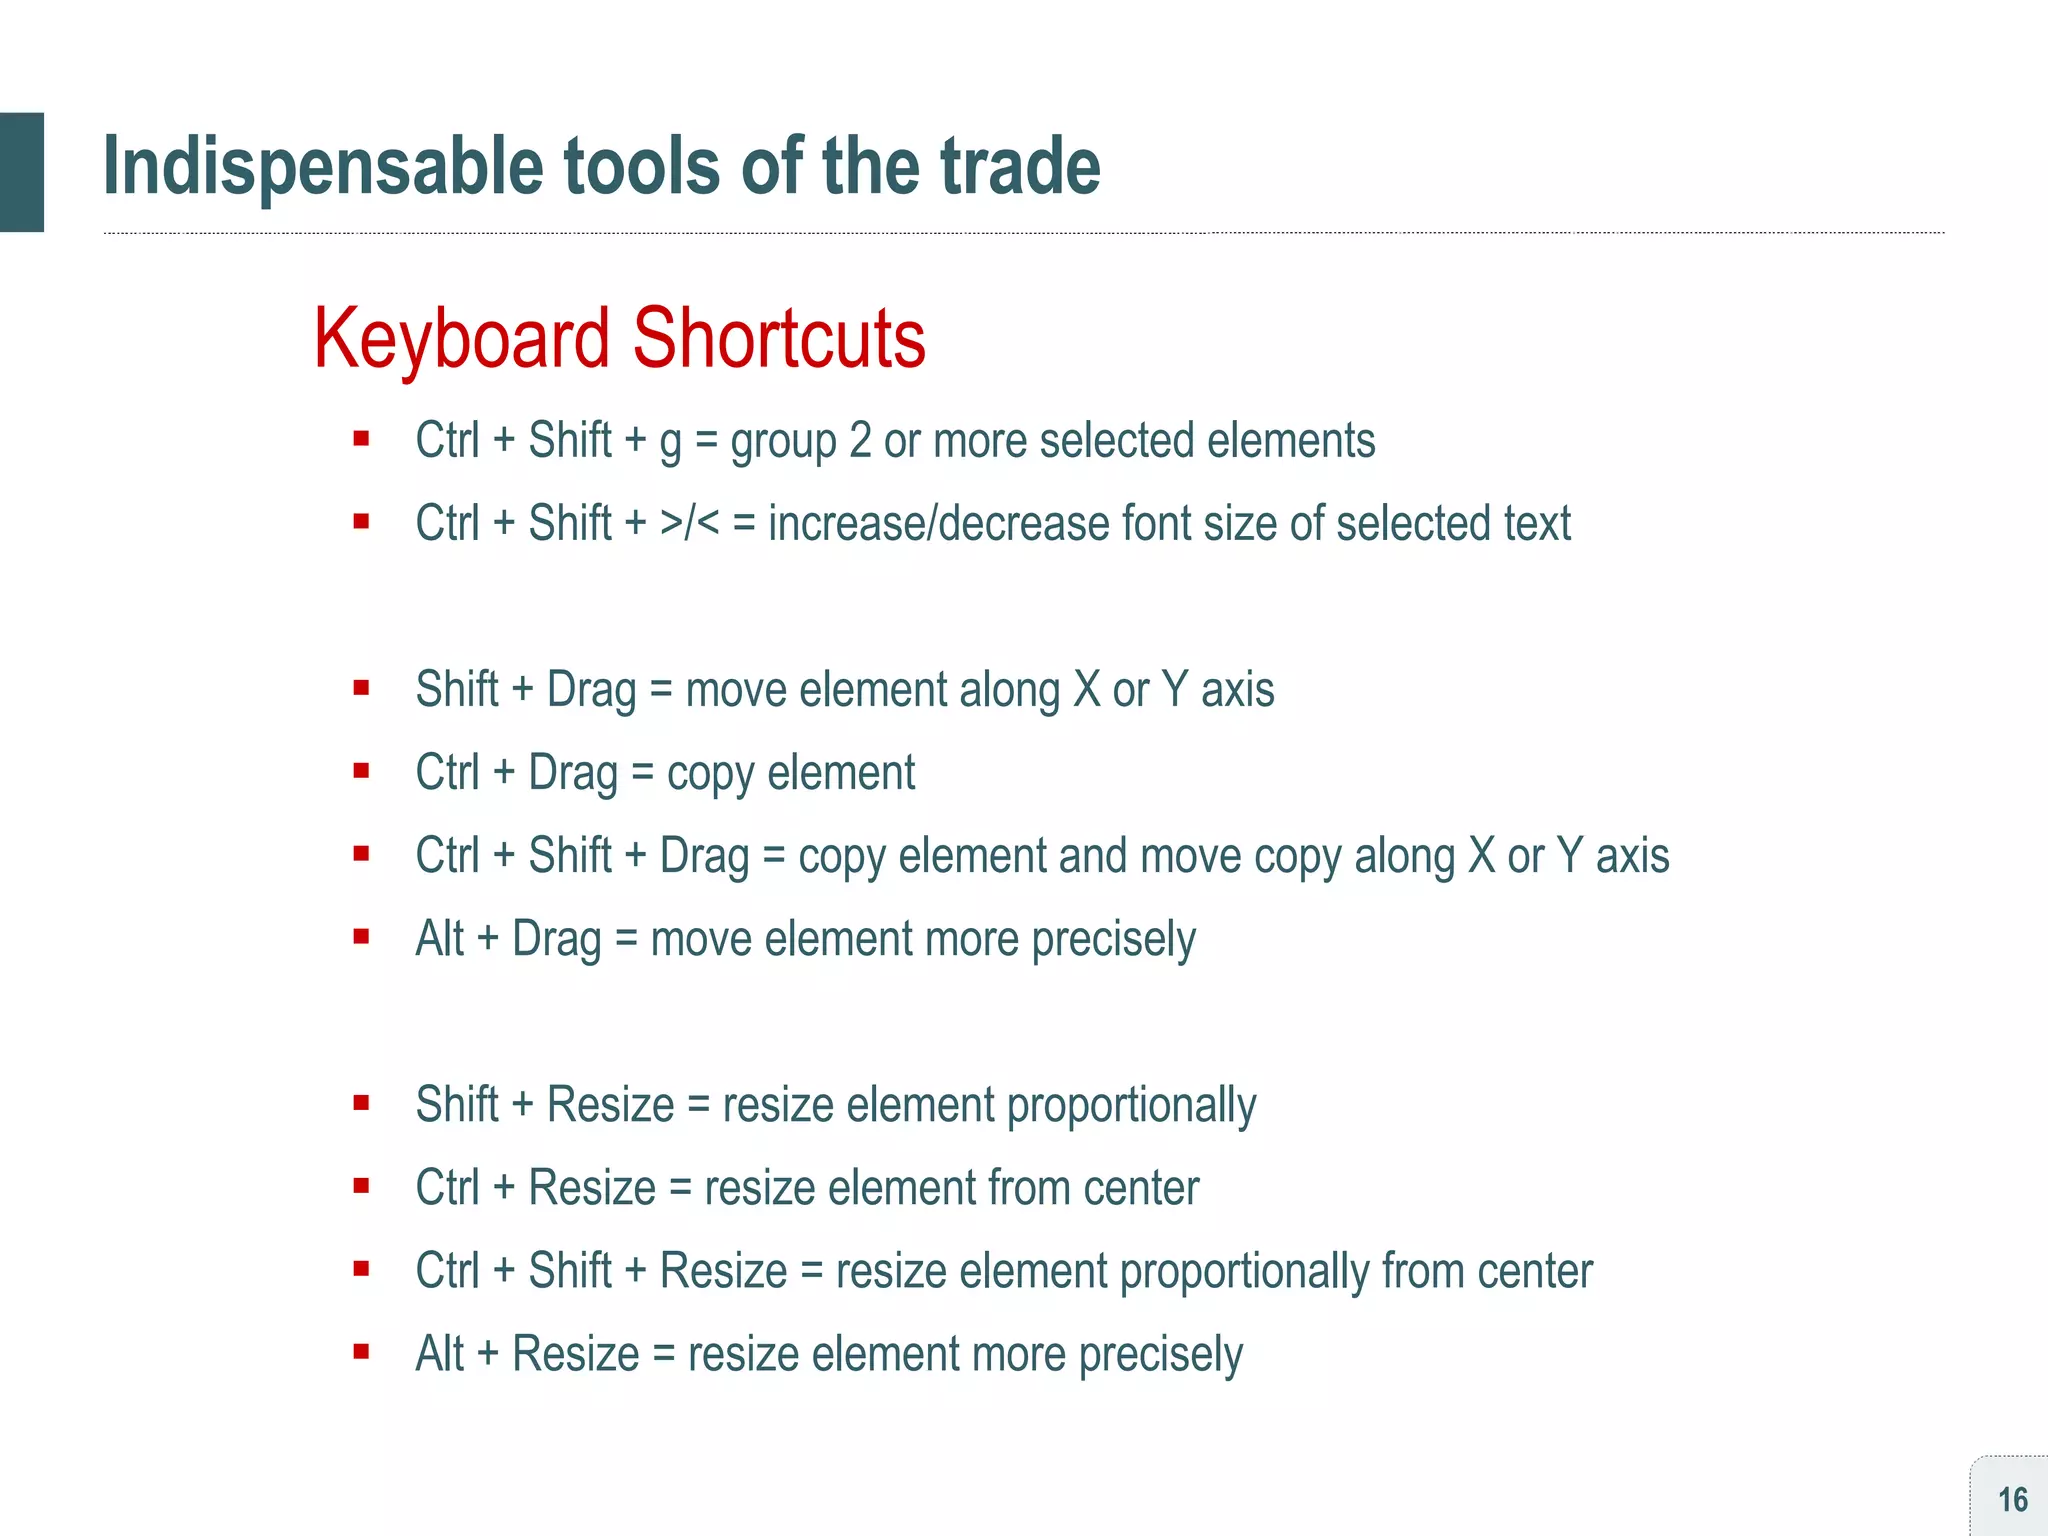
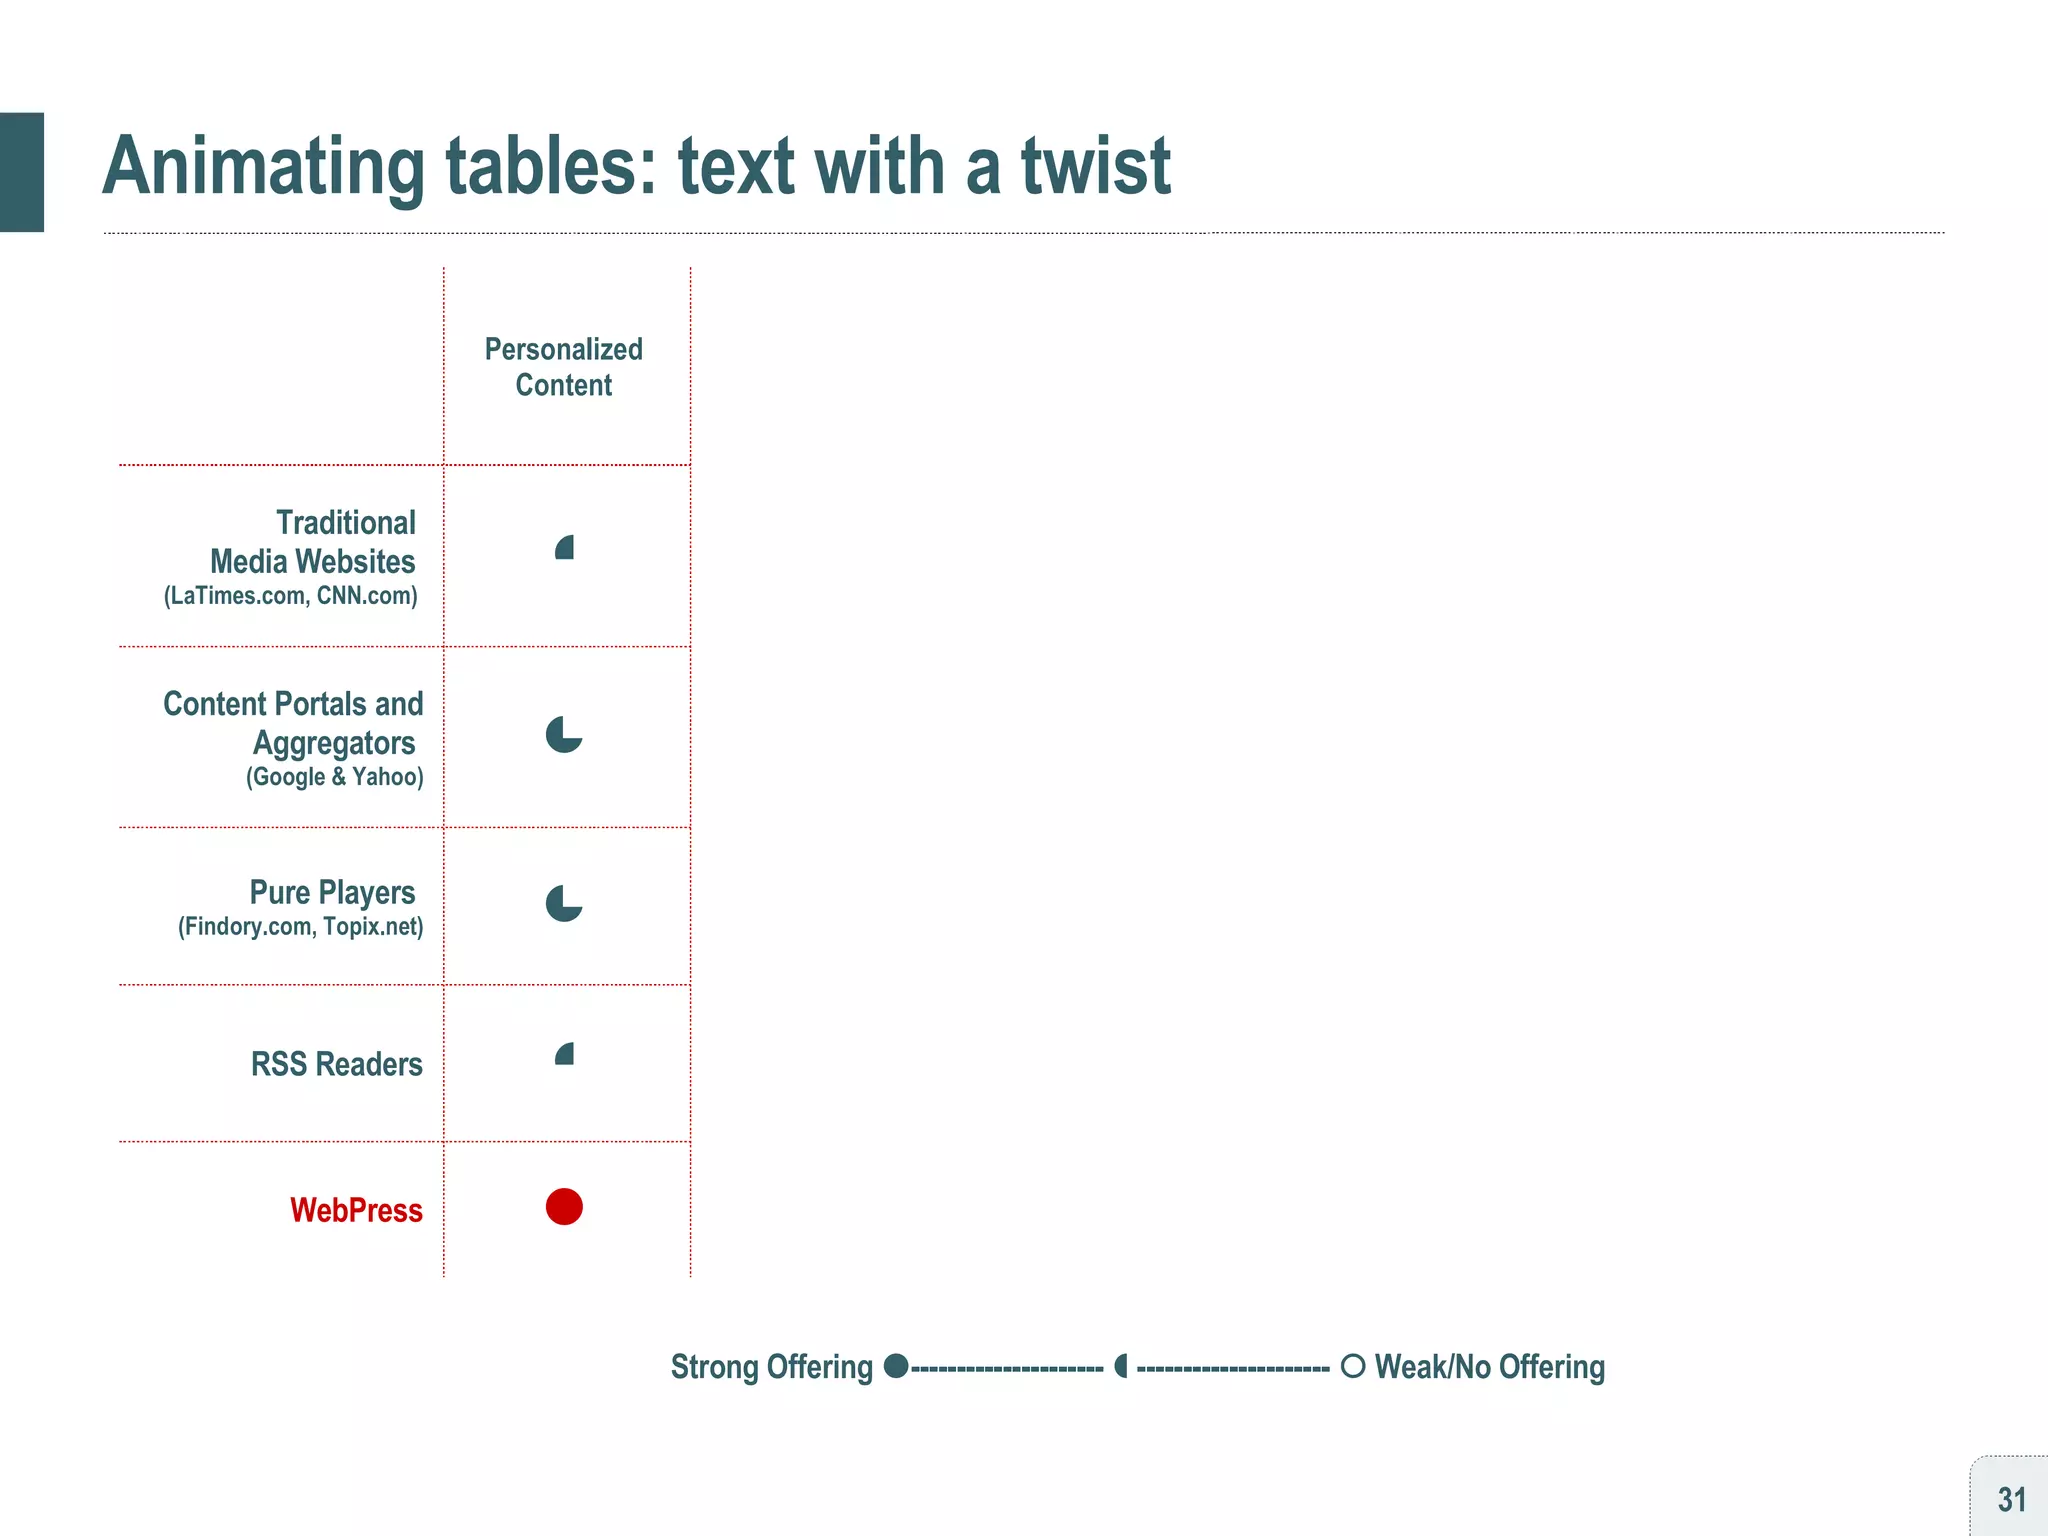
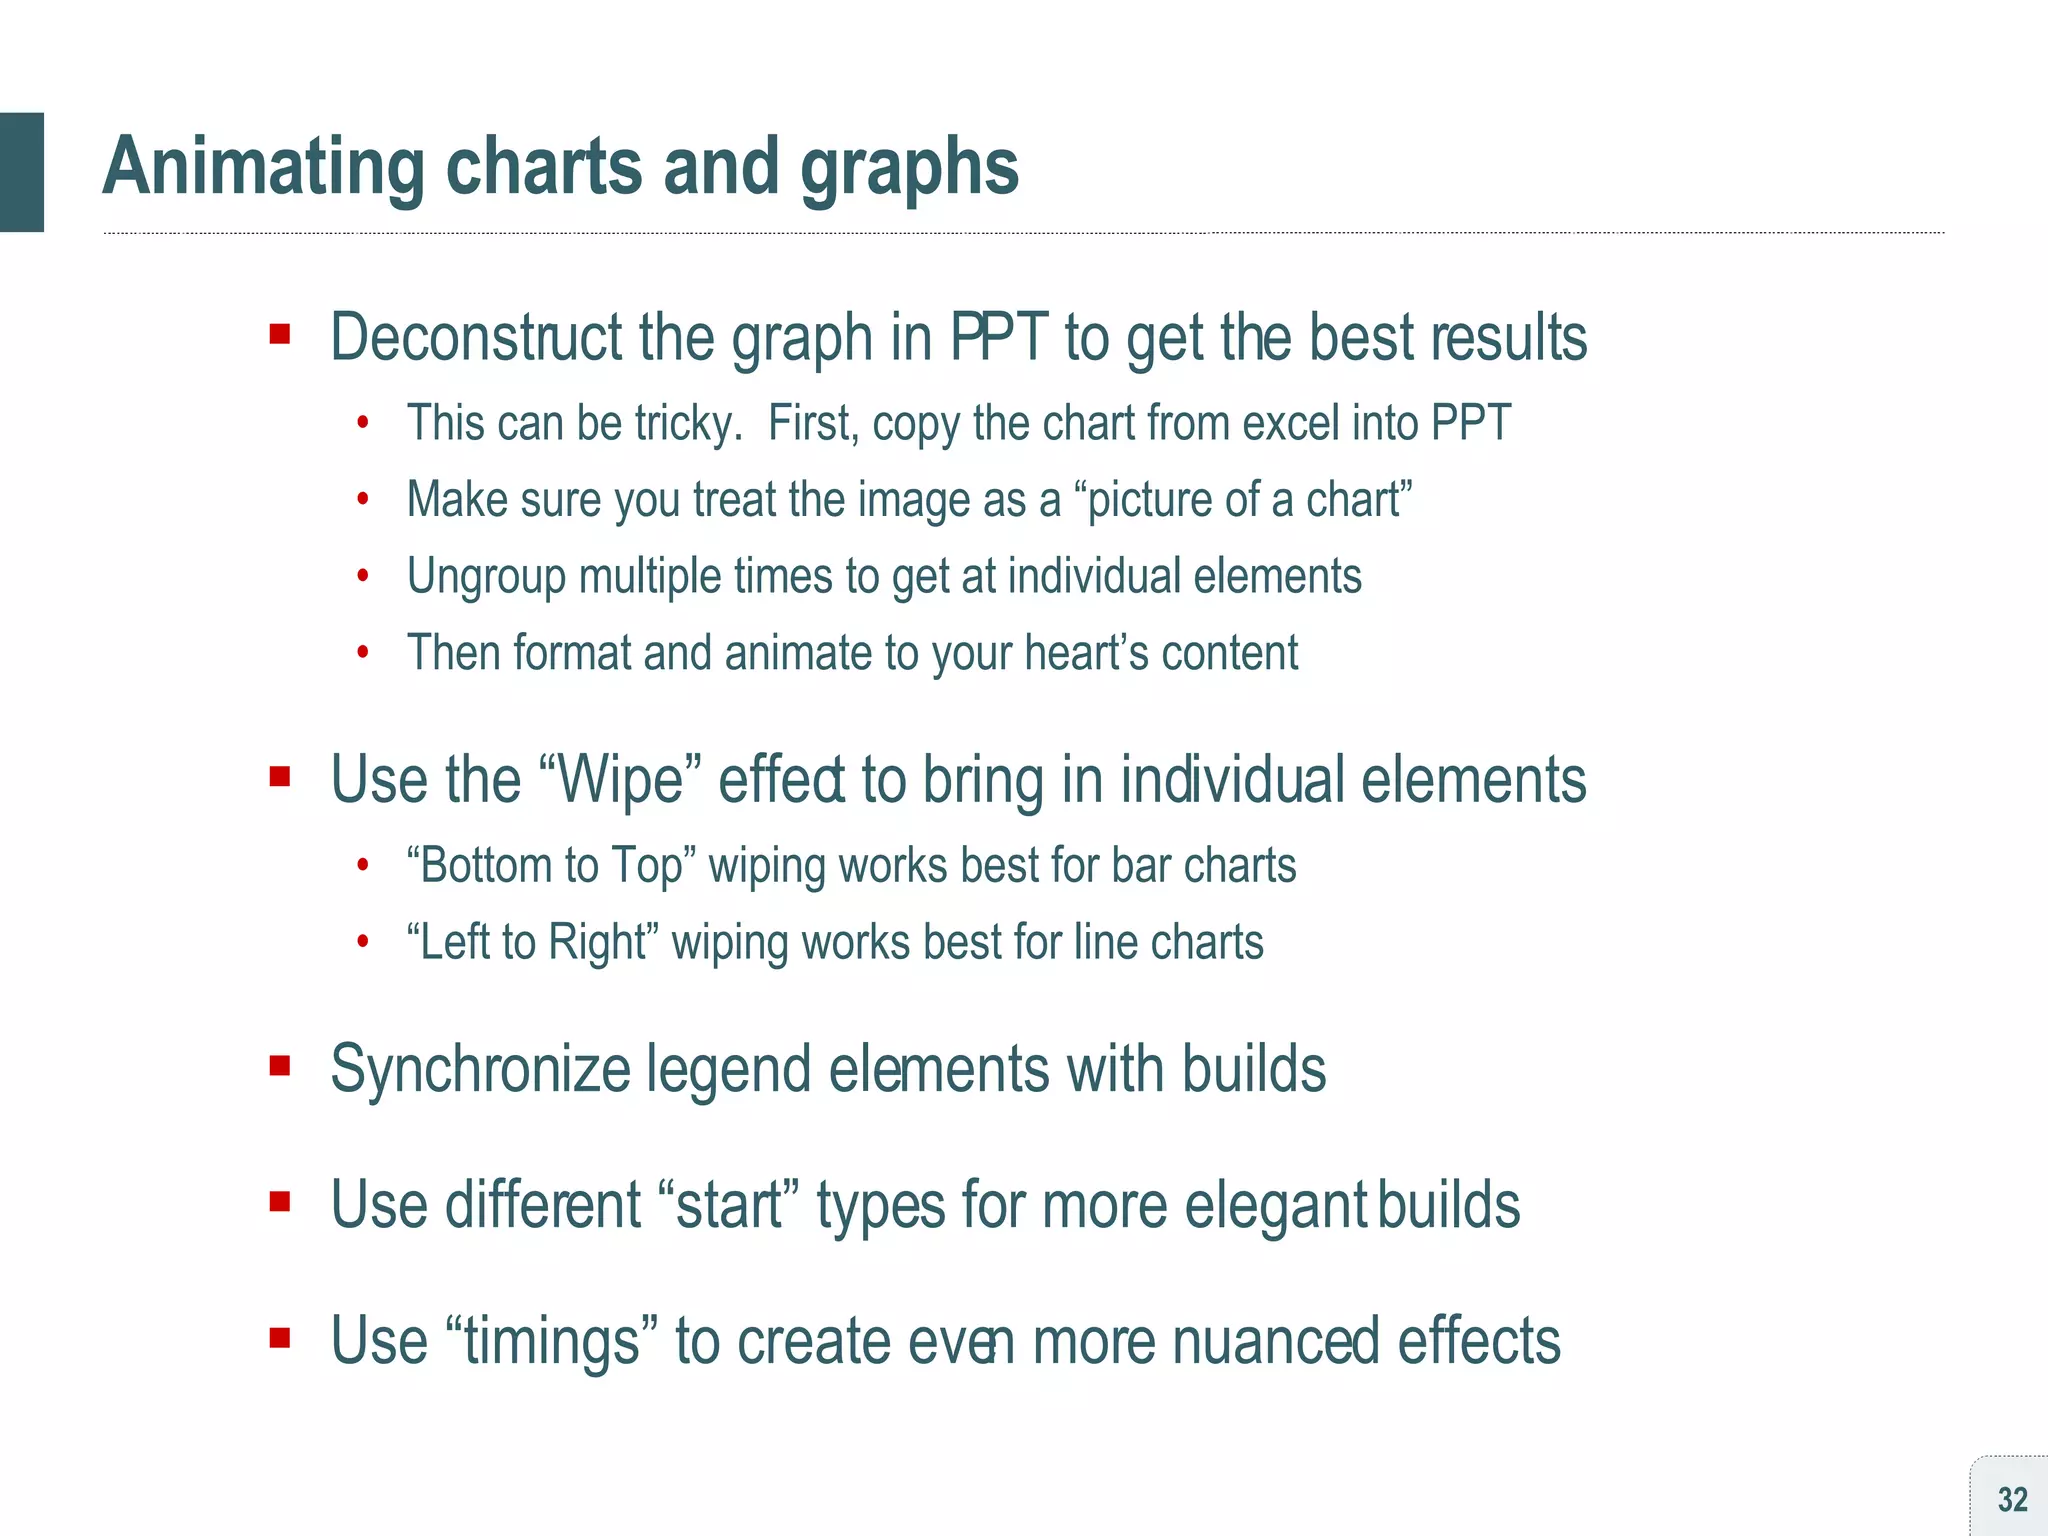
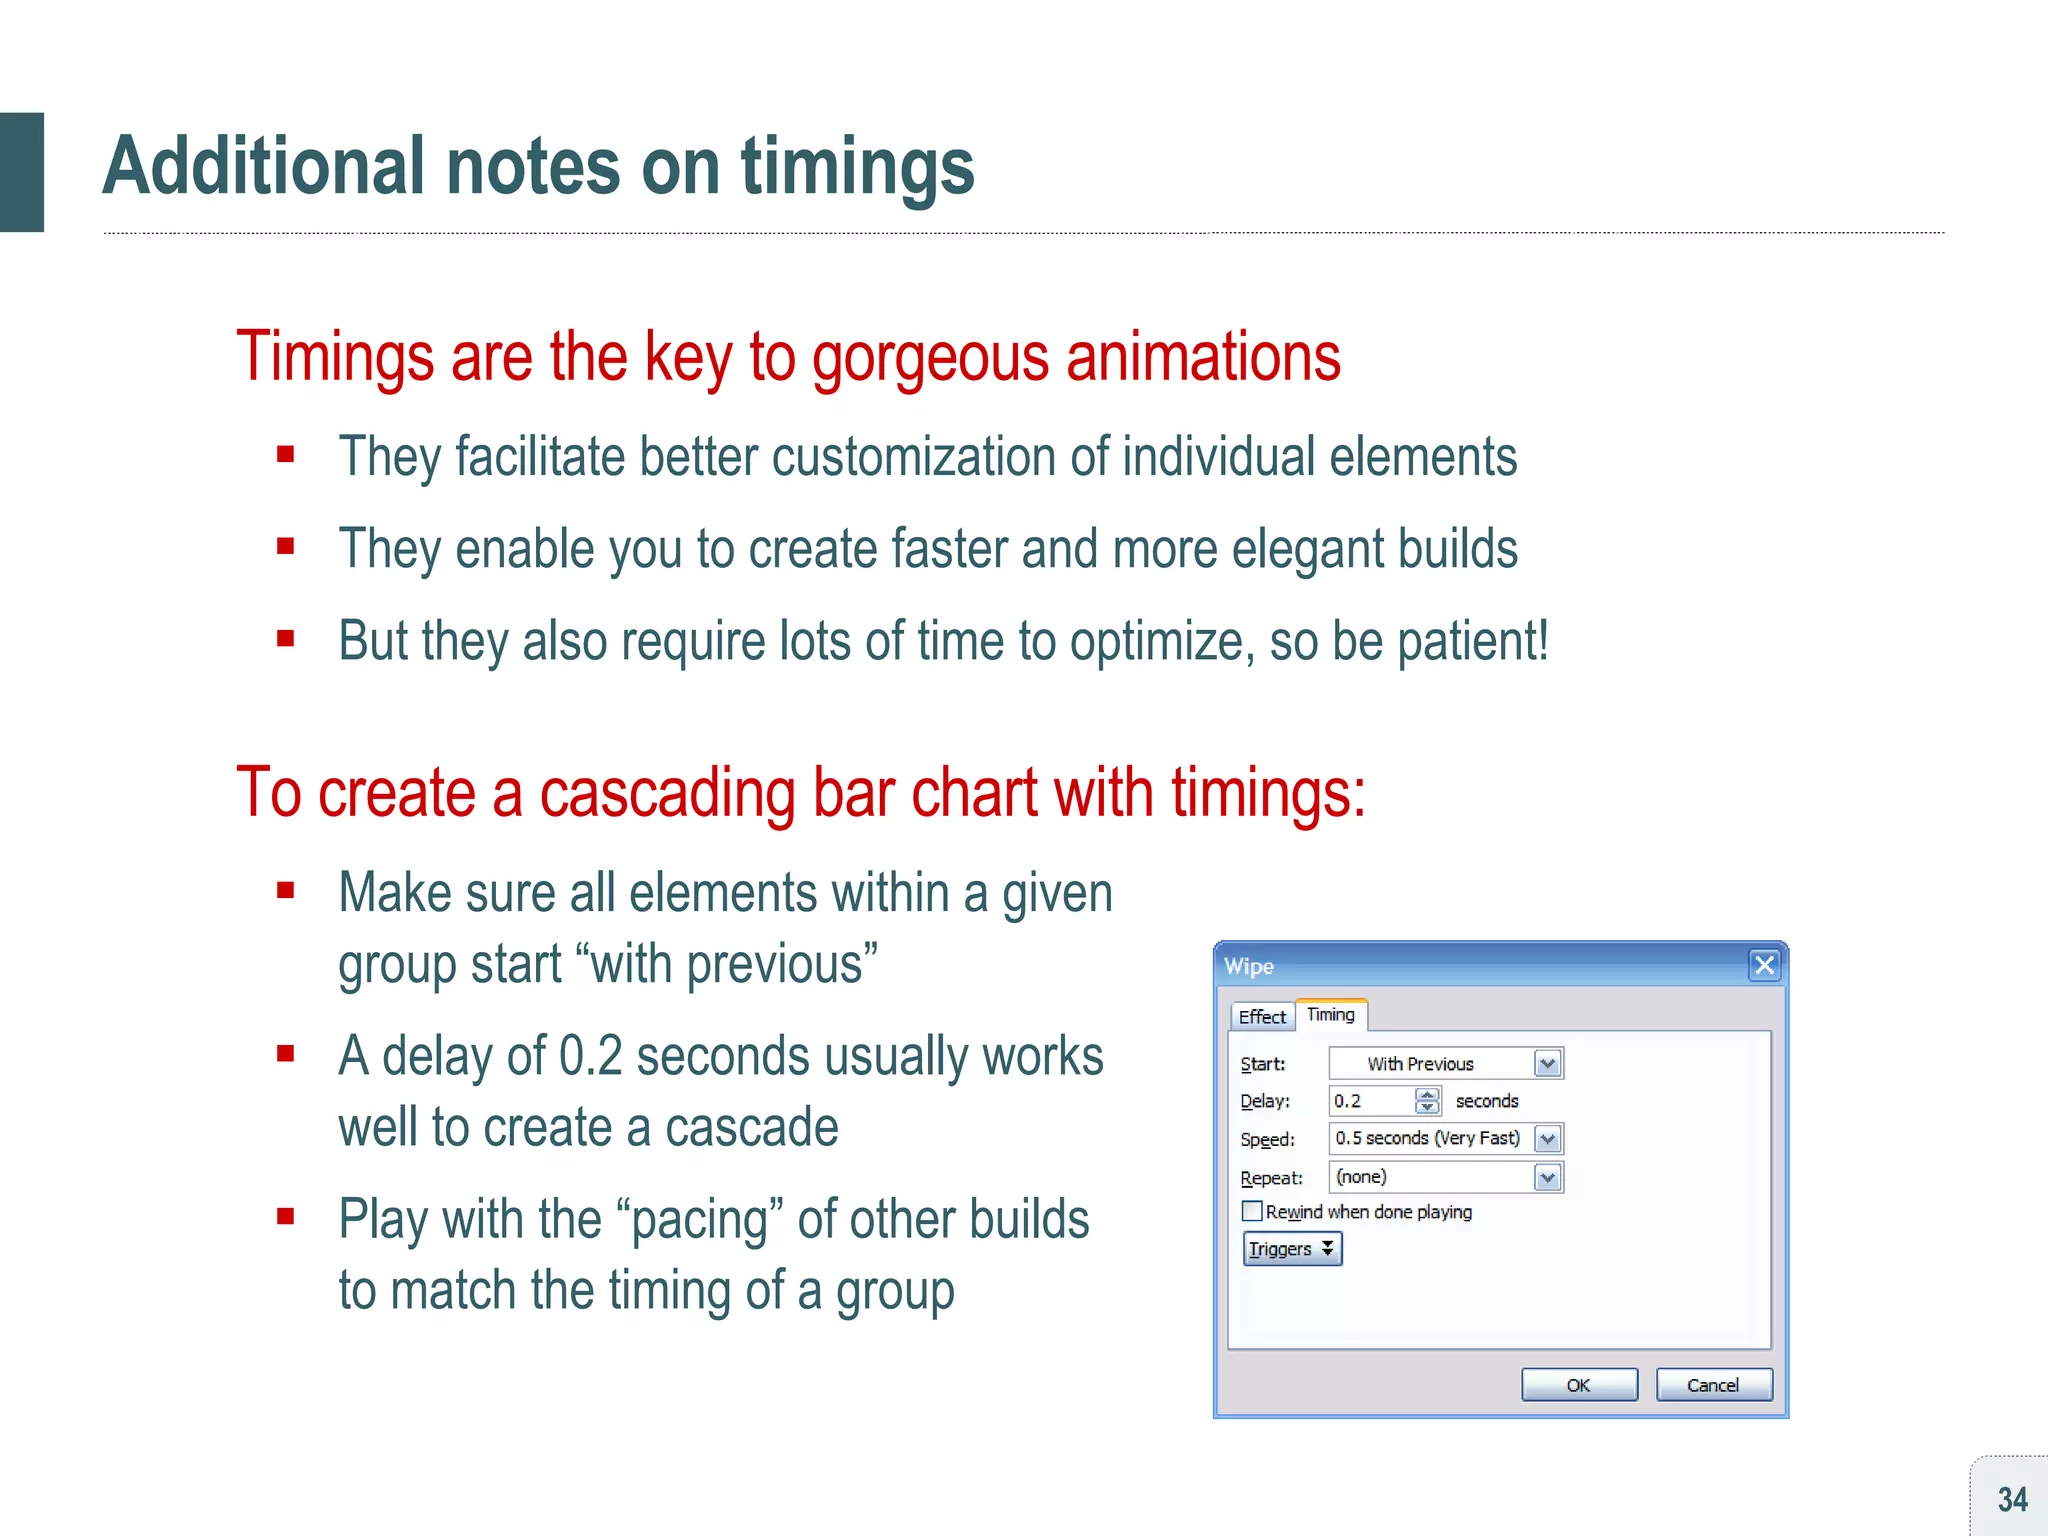
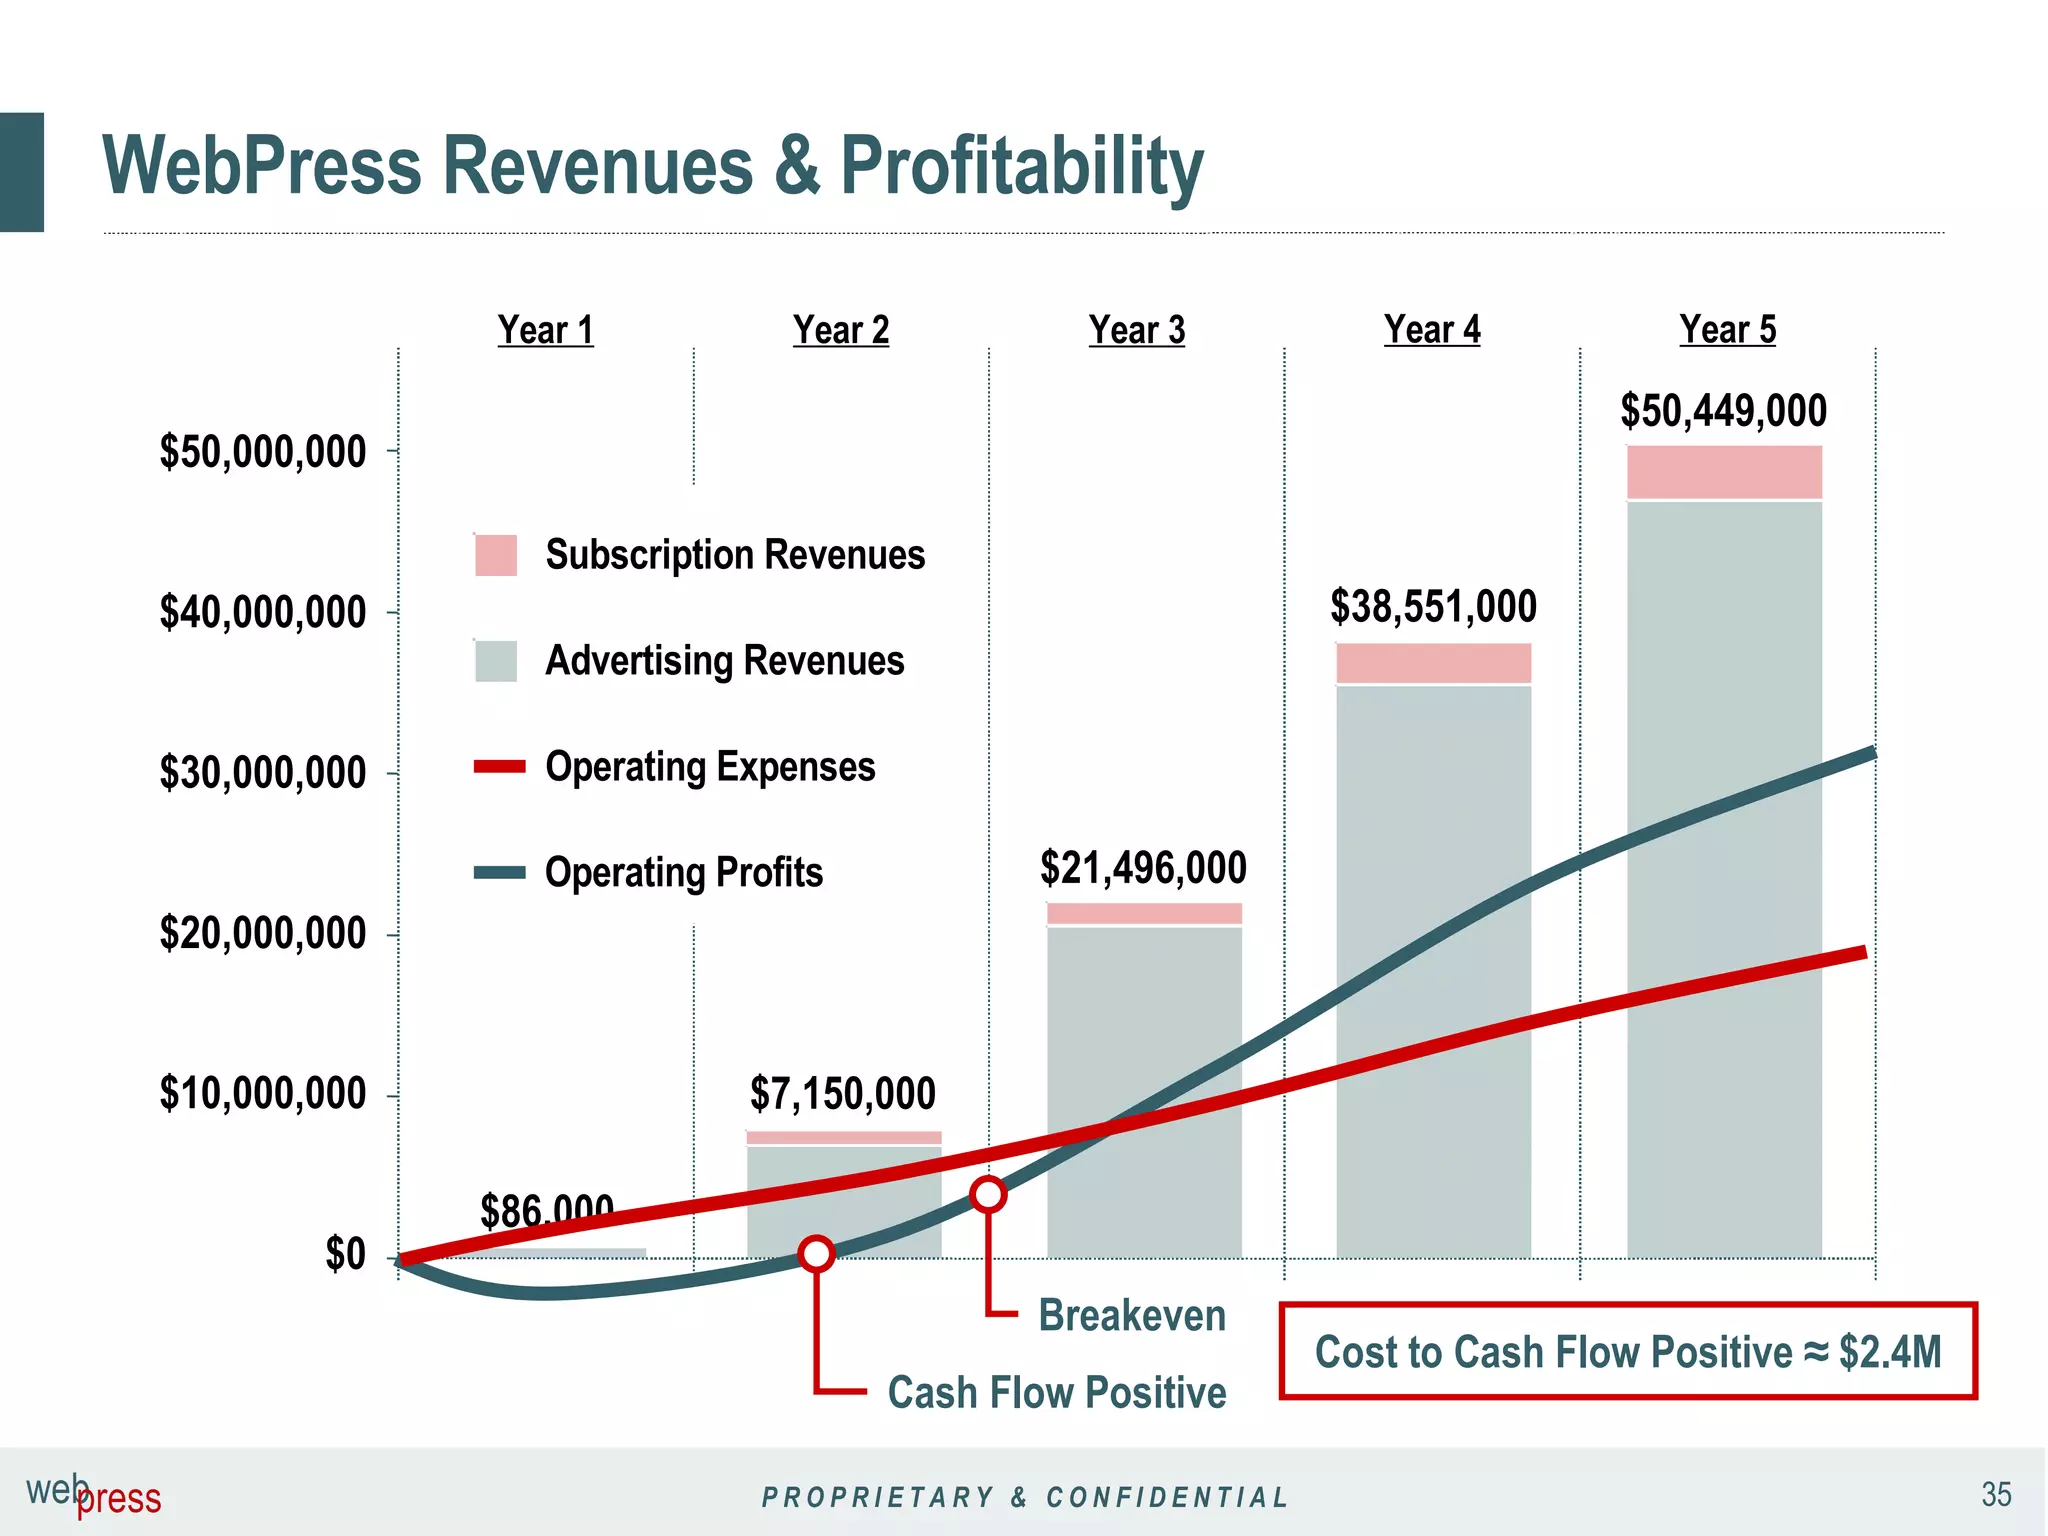
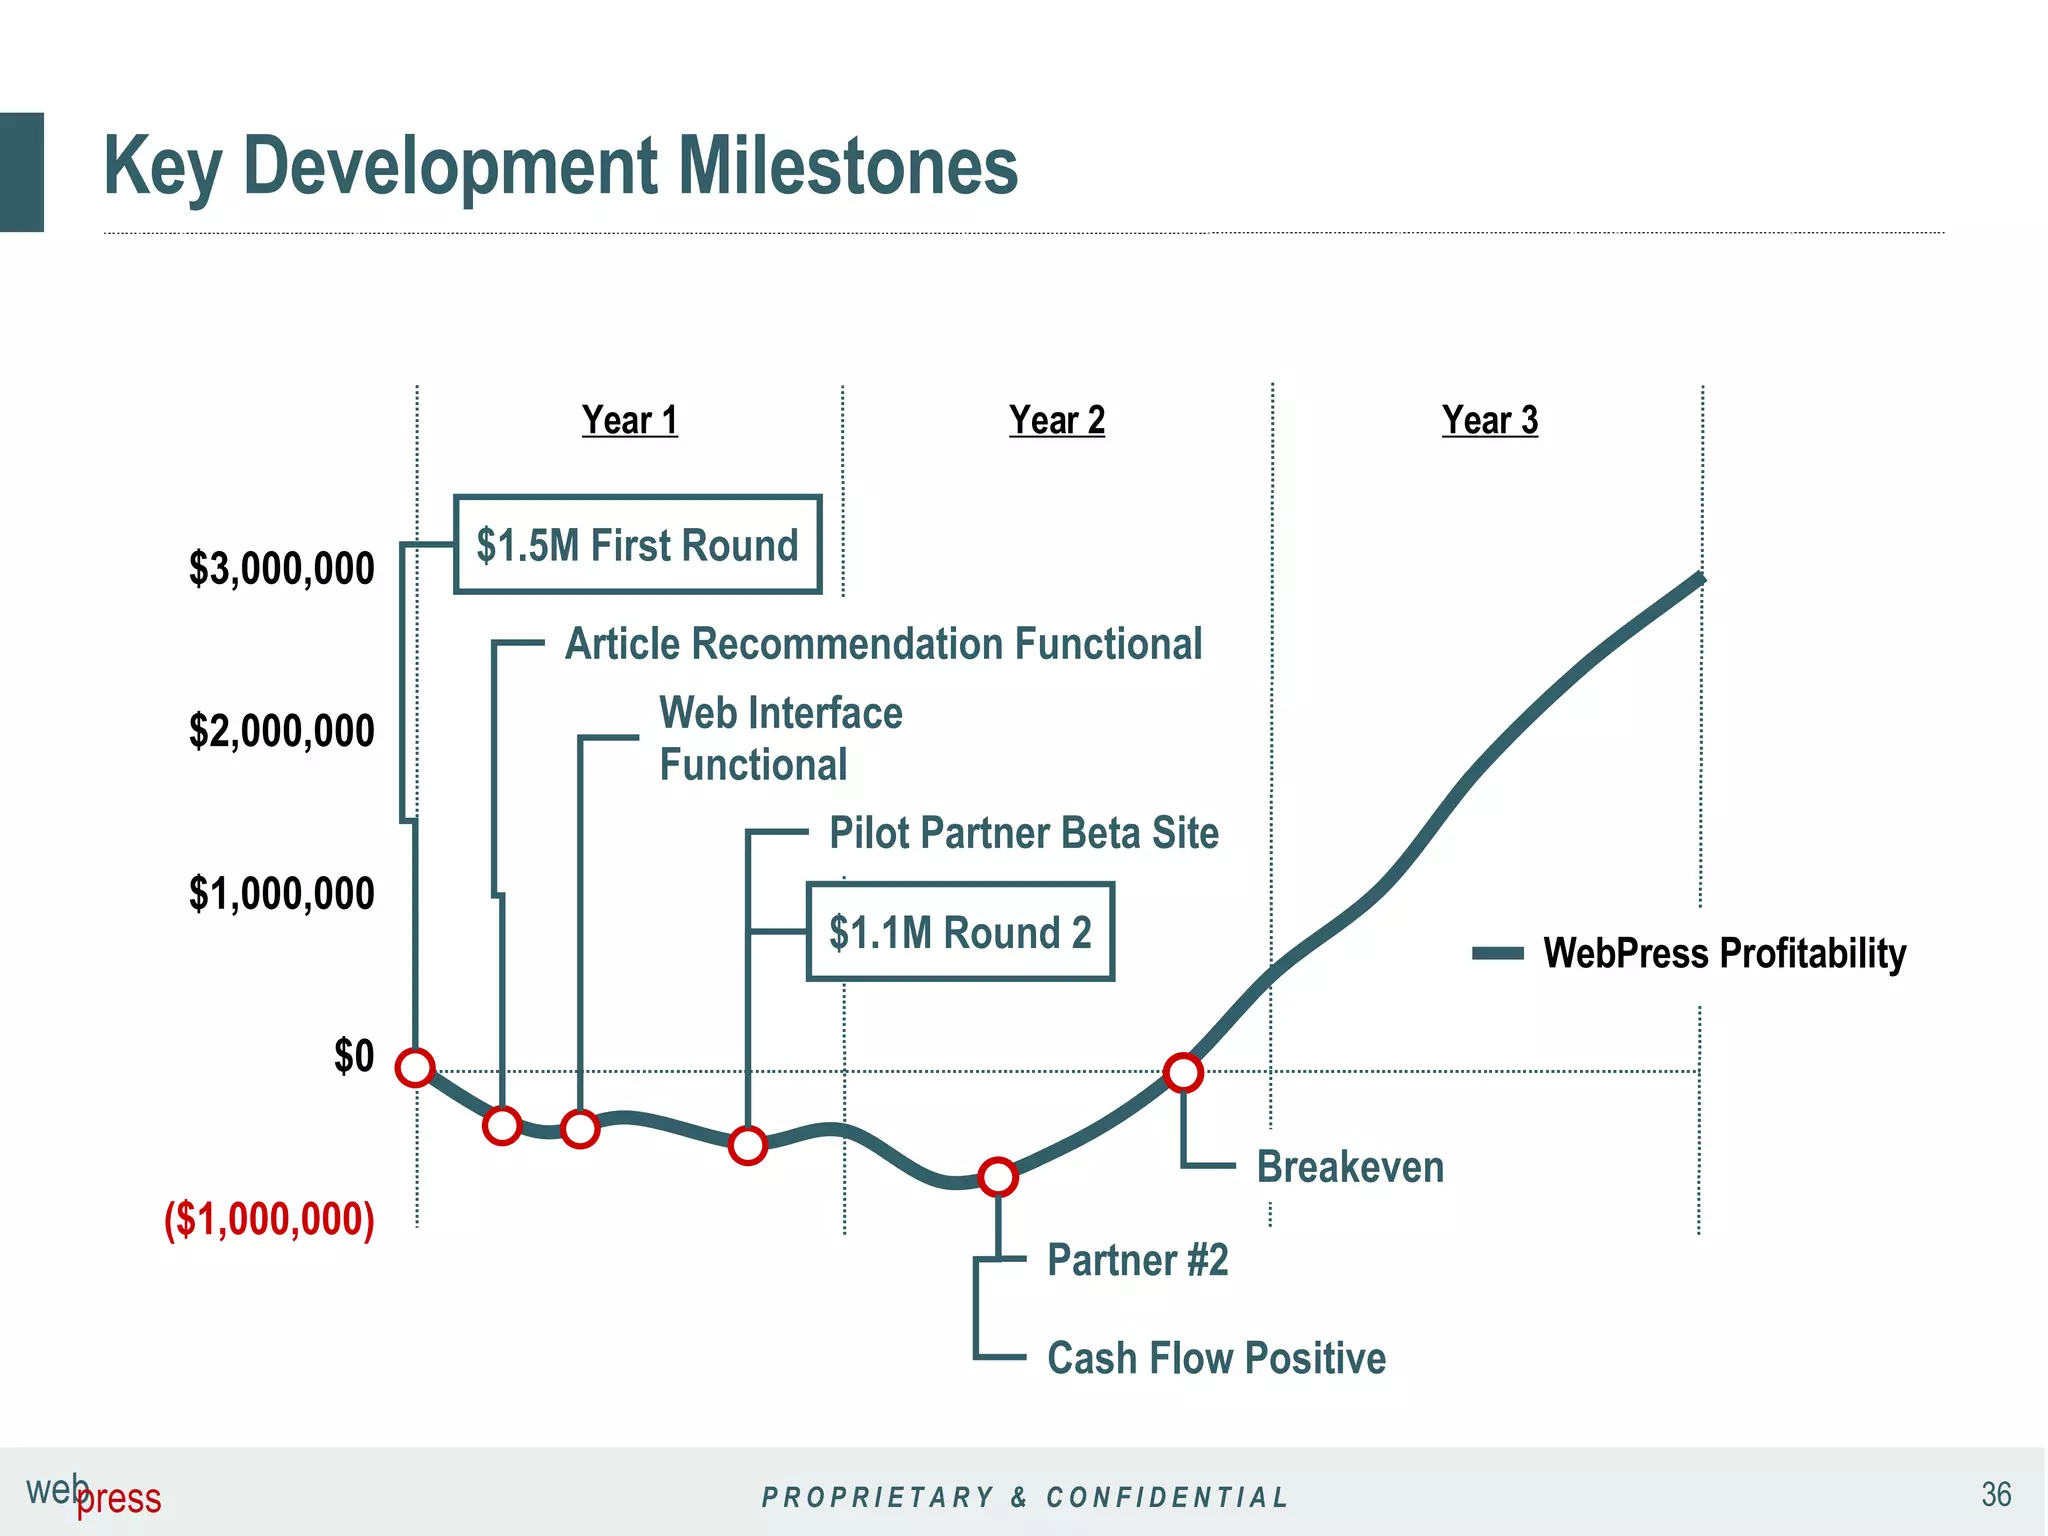
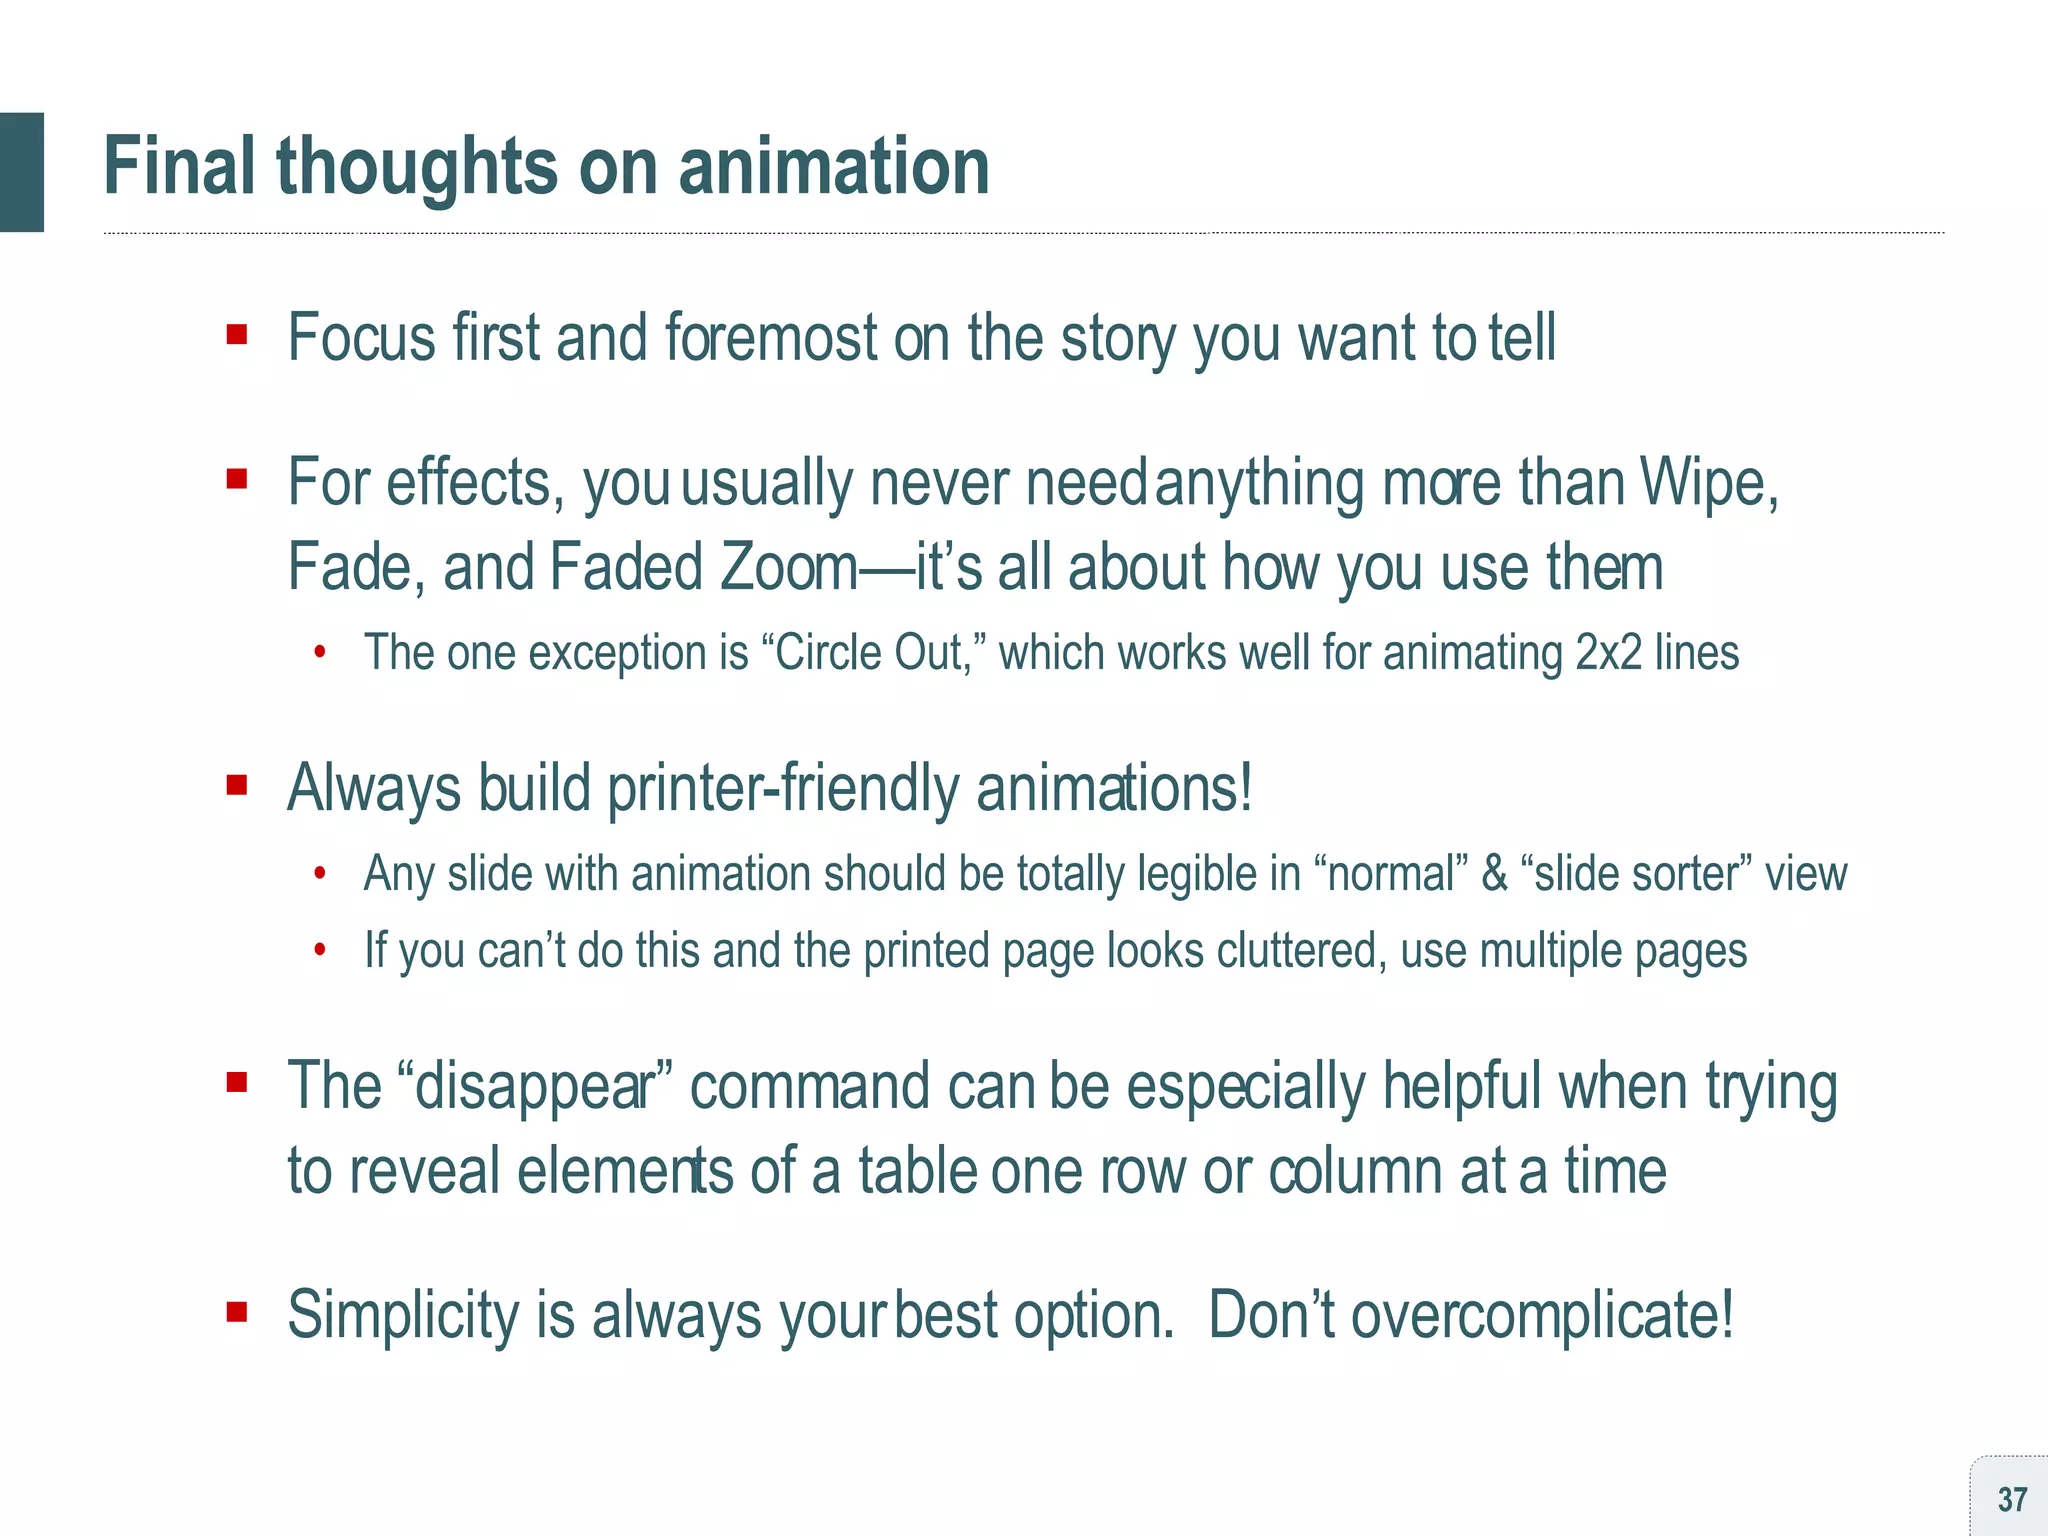
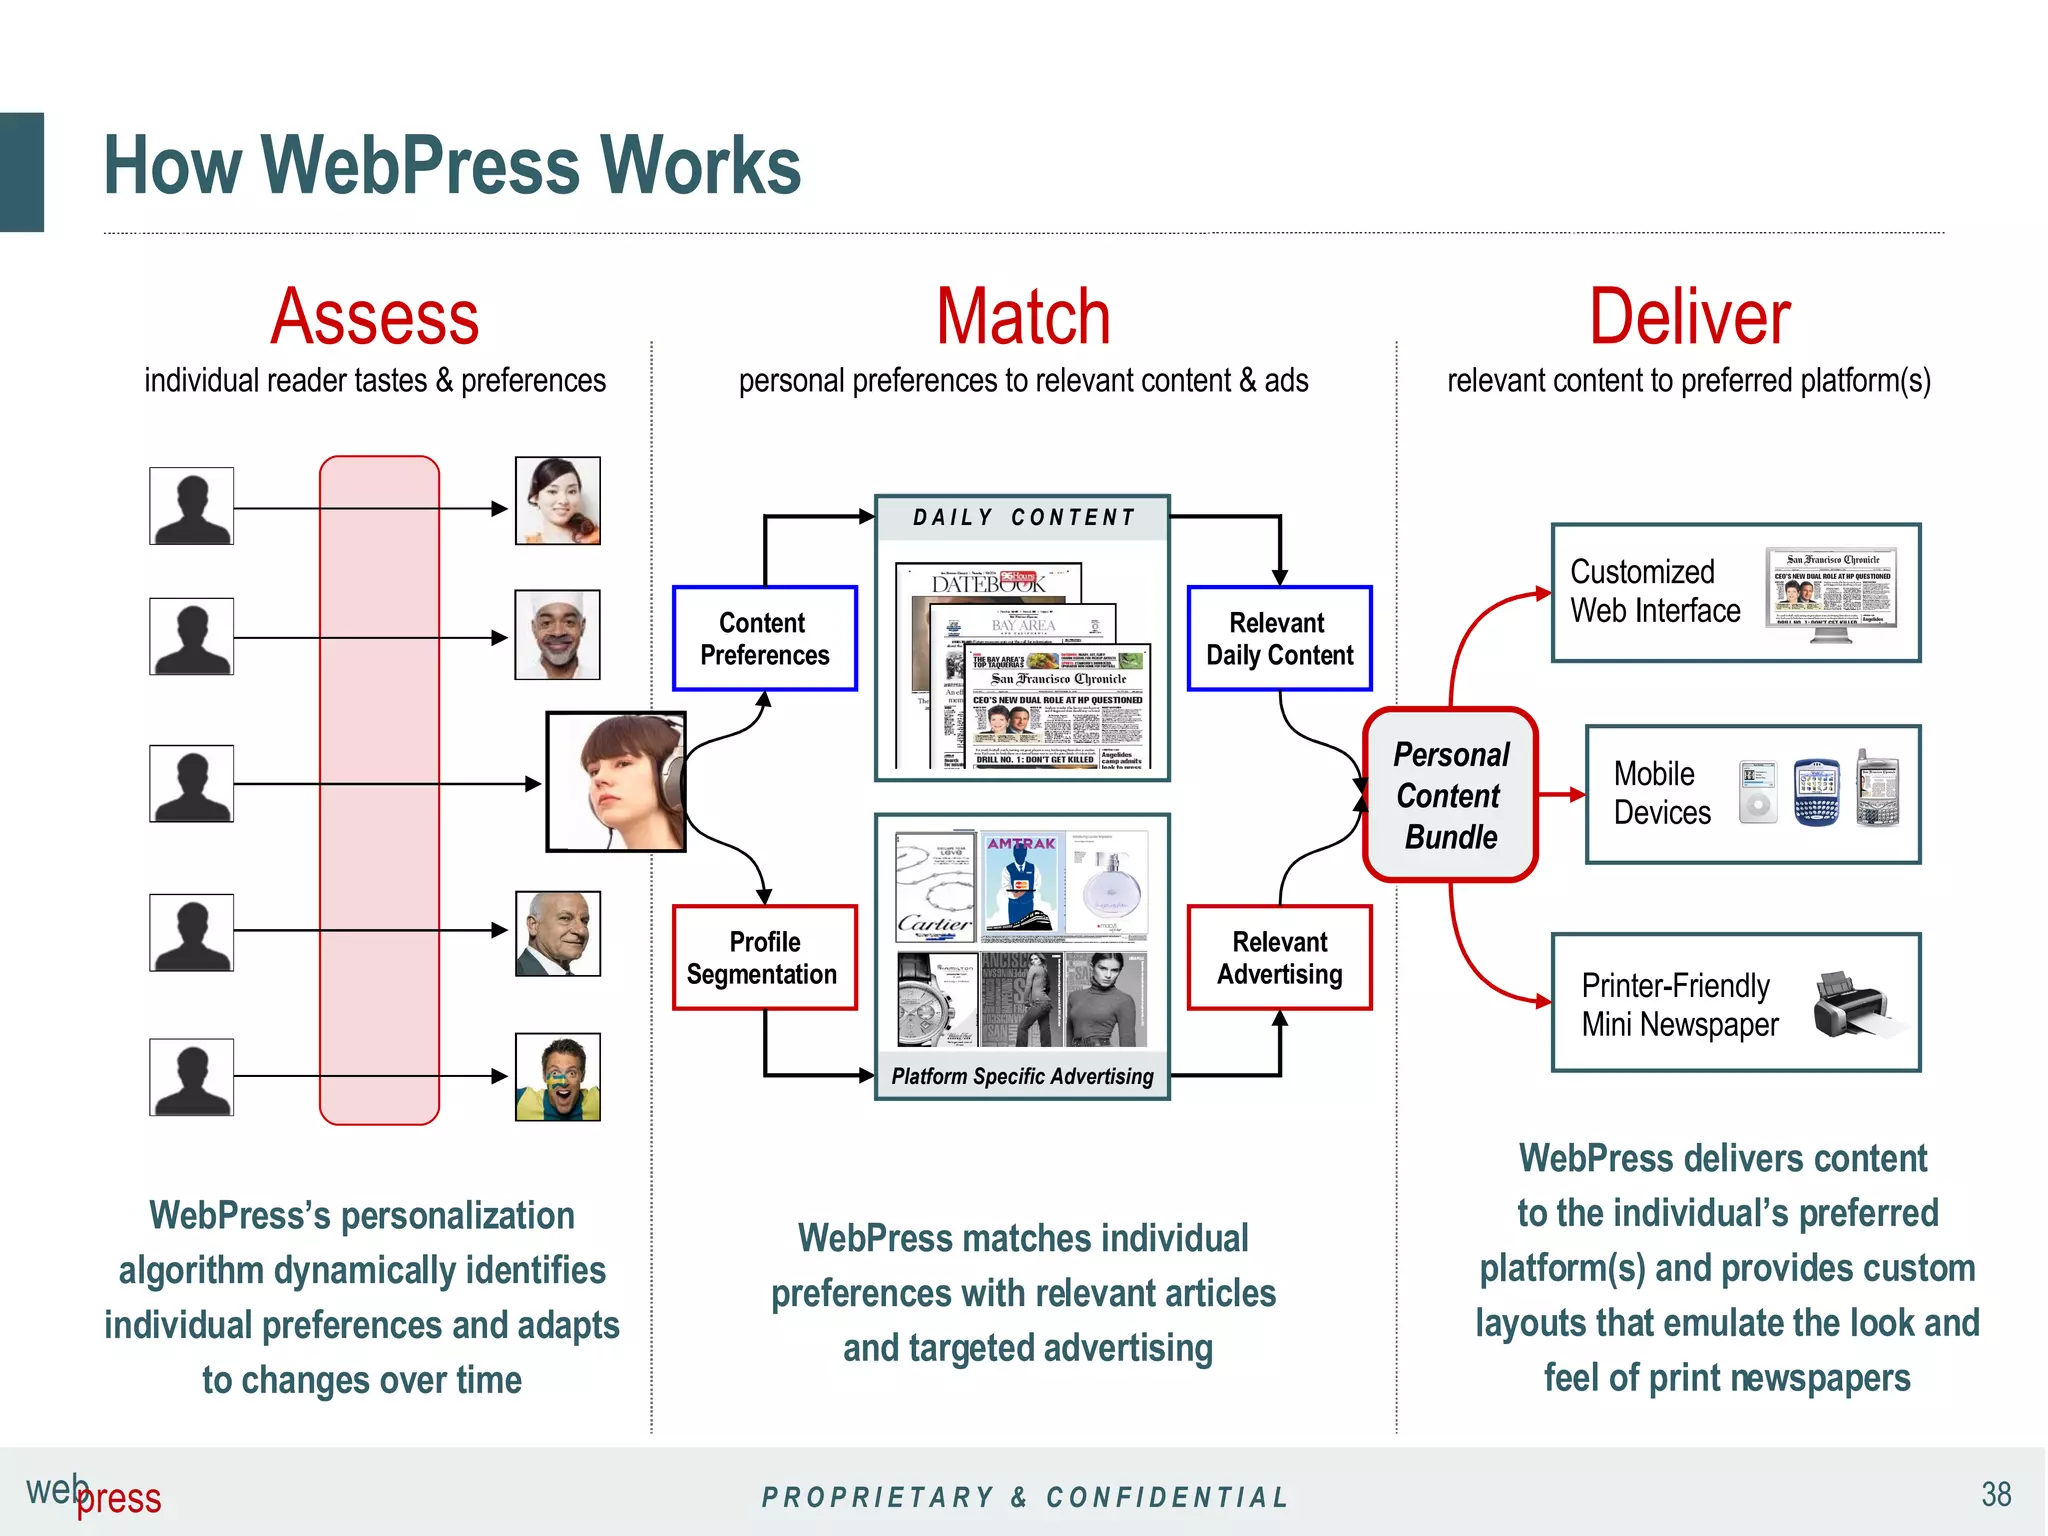
The document outlines seven habits of effective PowerPoint presentations: 1) start with a structured story, 2) standardize design language, 3) standardize written language, 4) animate to narrate not exaggerate, 5) show with images and tell with voiceover, 6) build slides around transitions, and 7) use a presentation remote. It provides tips and best practices for each habit, including examples of slide design, animation techniques, and effective narration.


![Q1 WEEK 6 IN TLE 7 [Autosaved].pp777777777777777tx](https://cdn.slidesharecdn.com/ss_thumbnails/q1week6intle7autosaved-250902232032-e9a66c0d-thumbnail.jpg?width=600ounds&width=560&fit=bounds)


