Download as PDF, PPTX


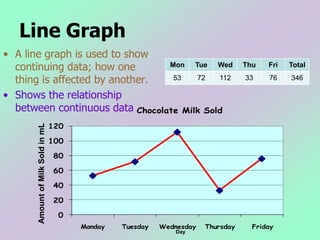


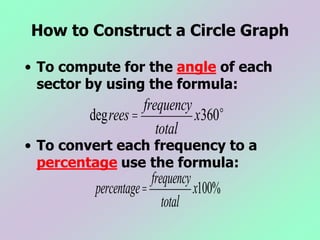

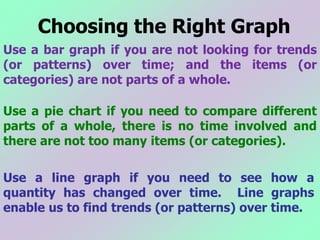


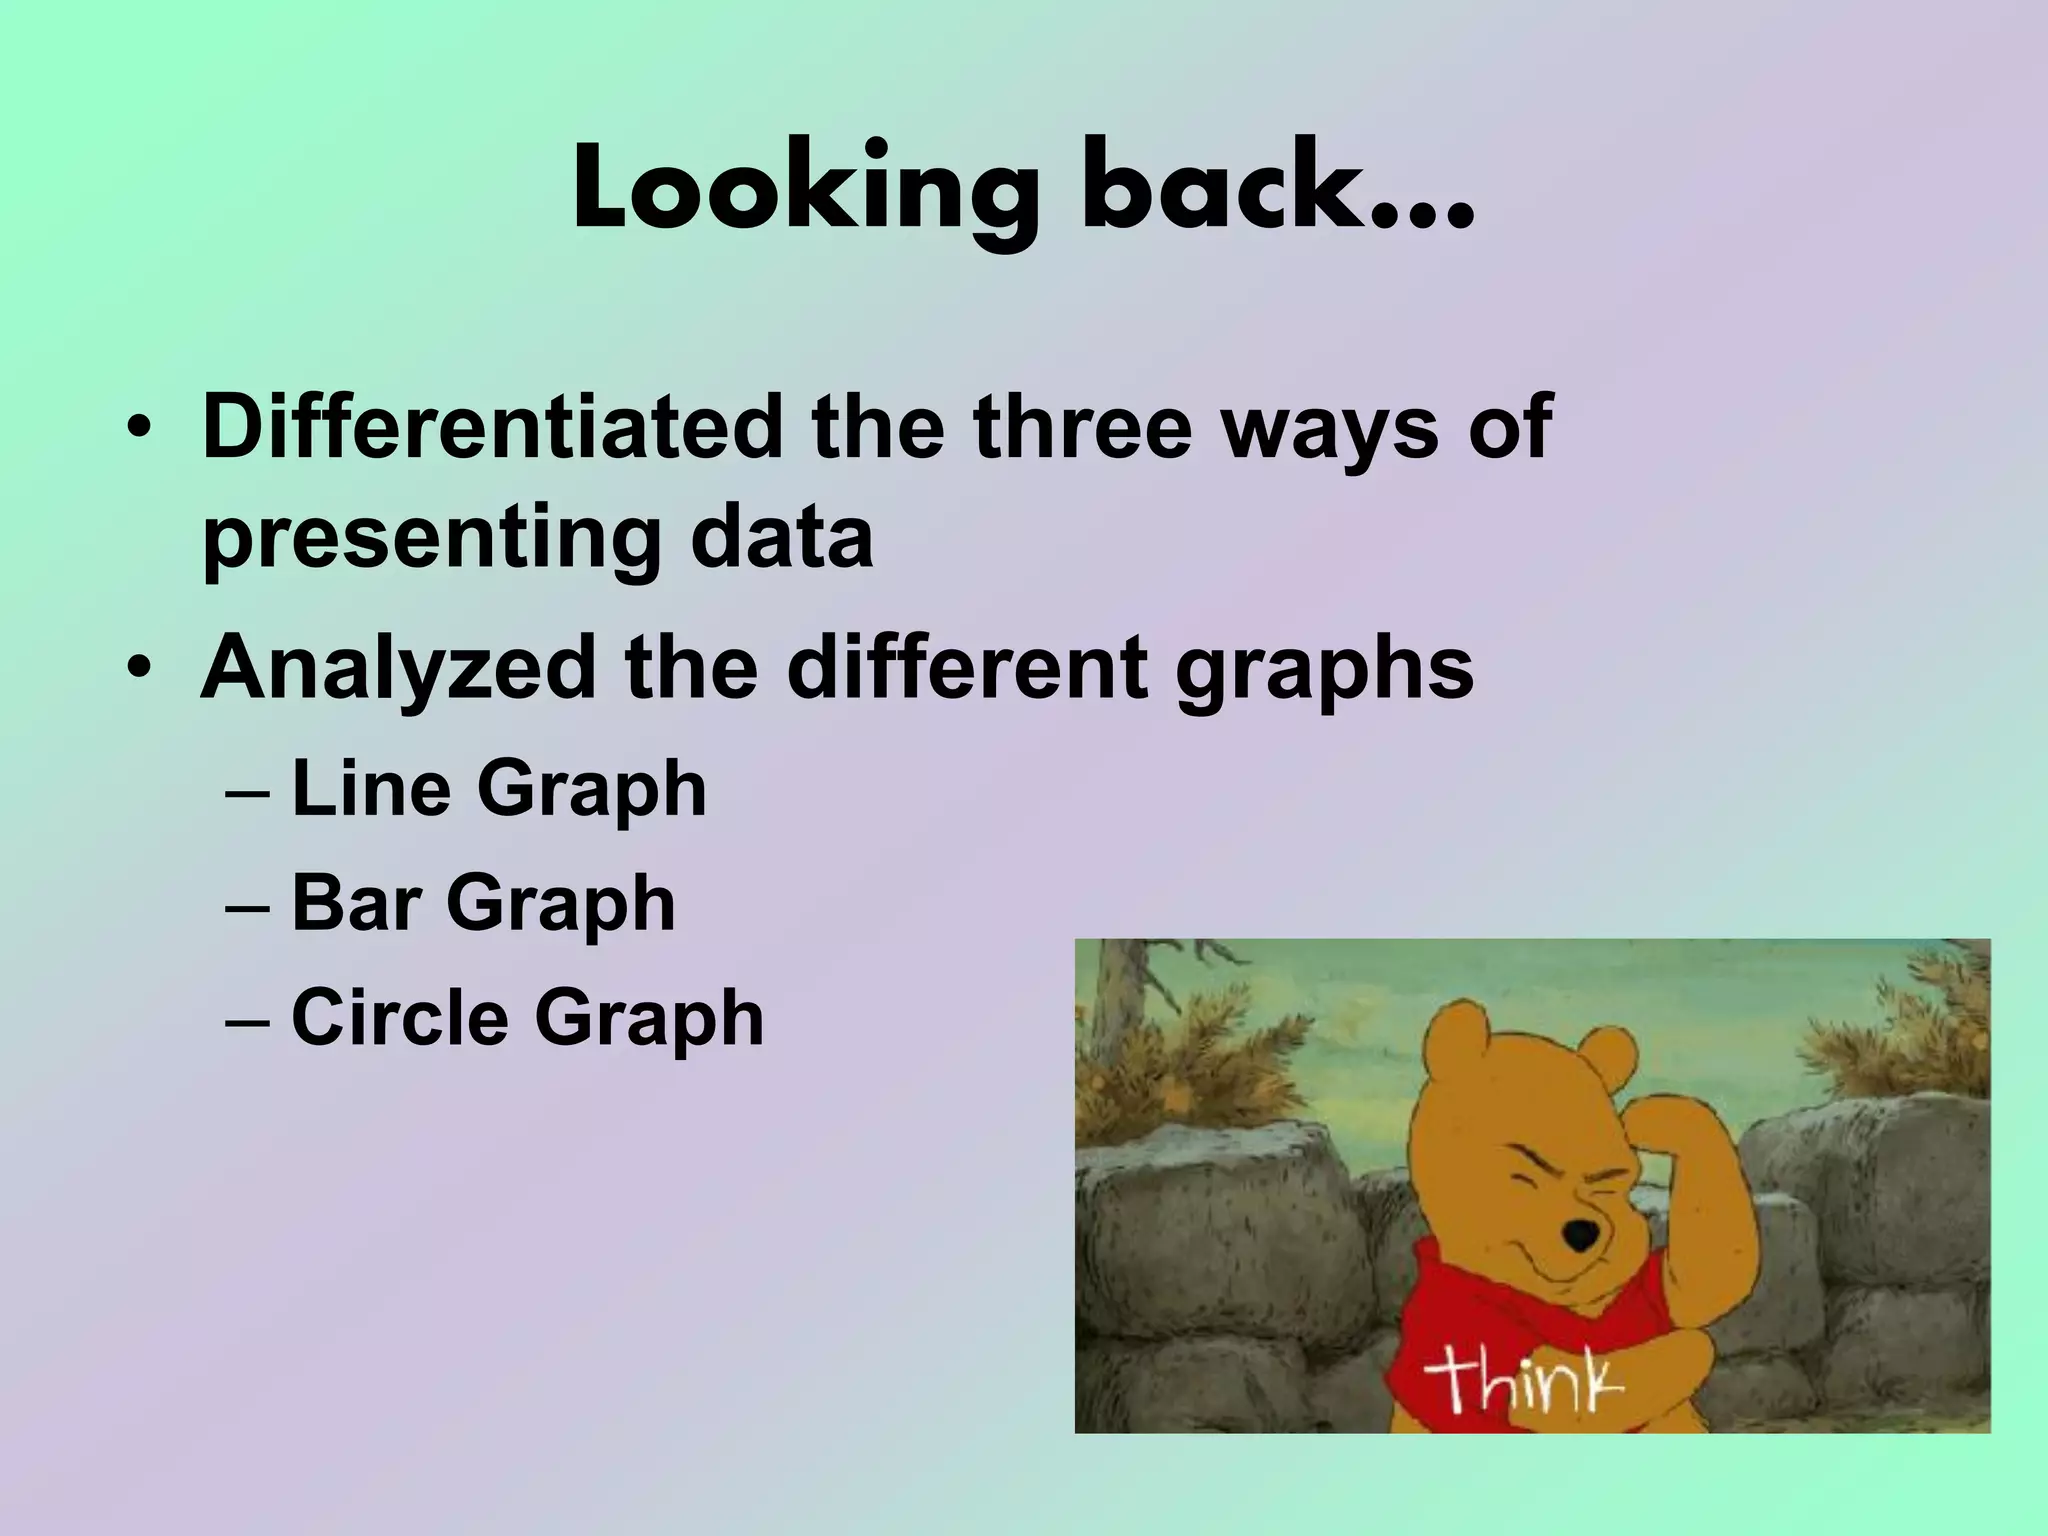


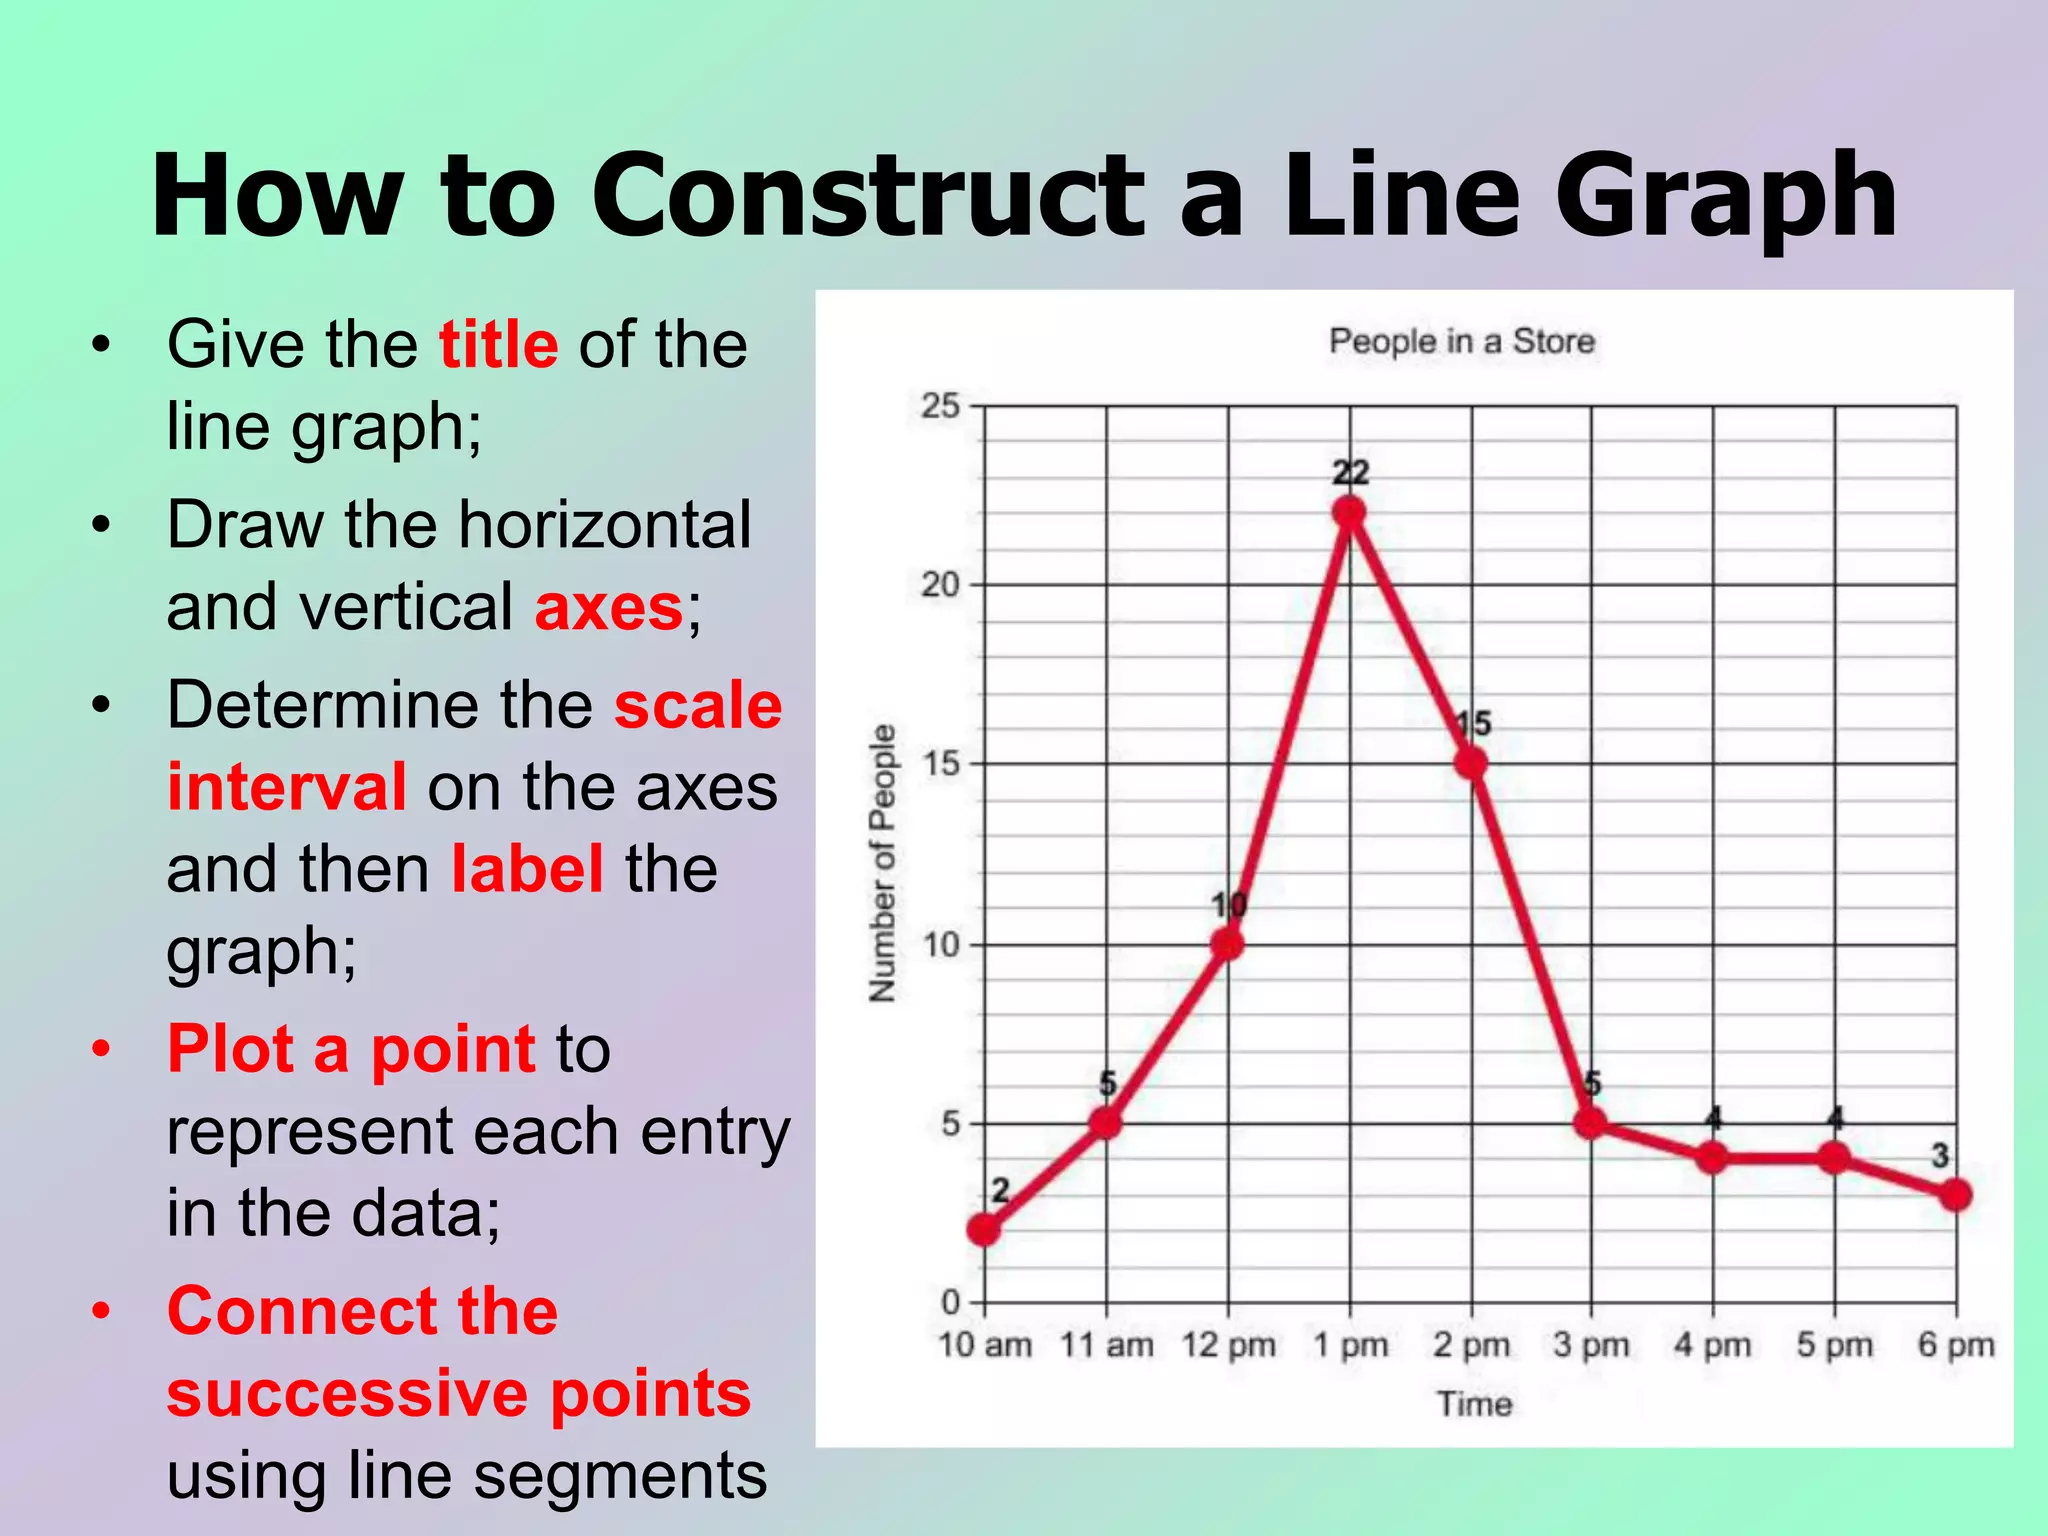
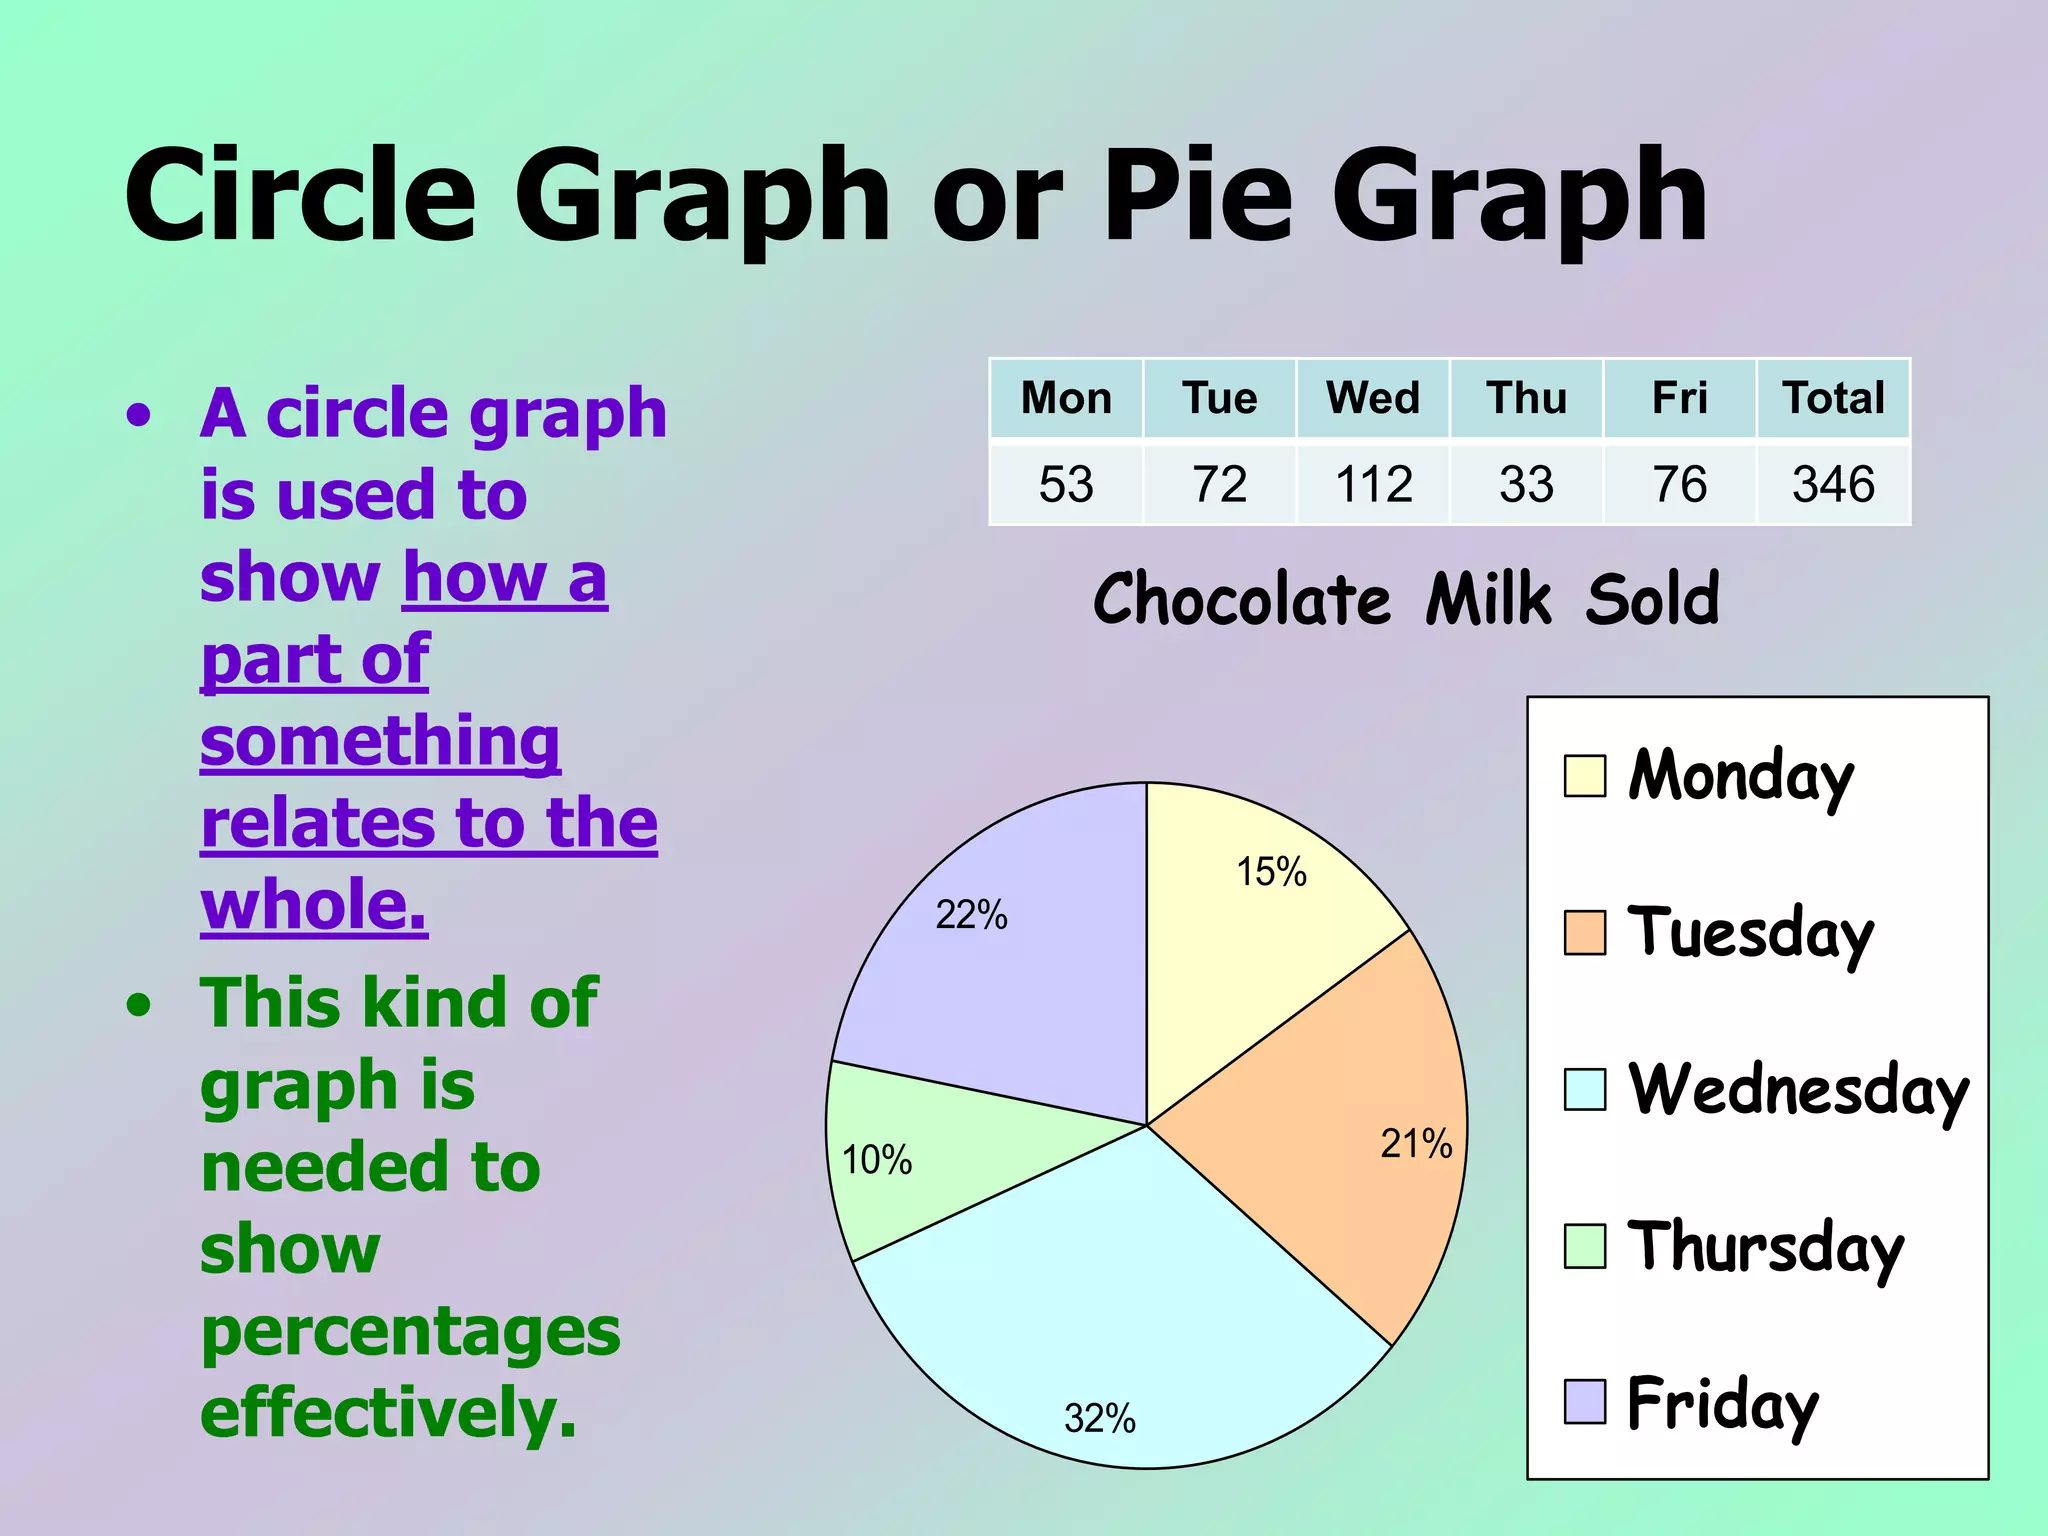
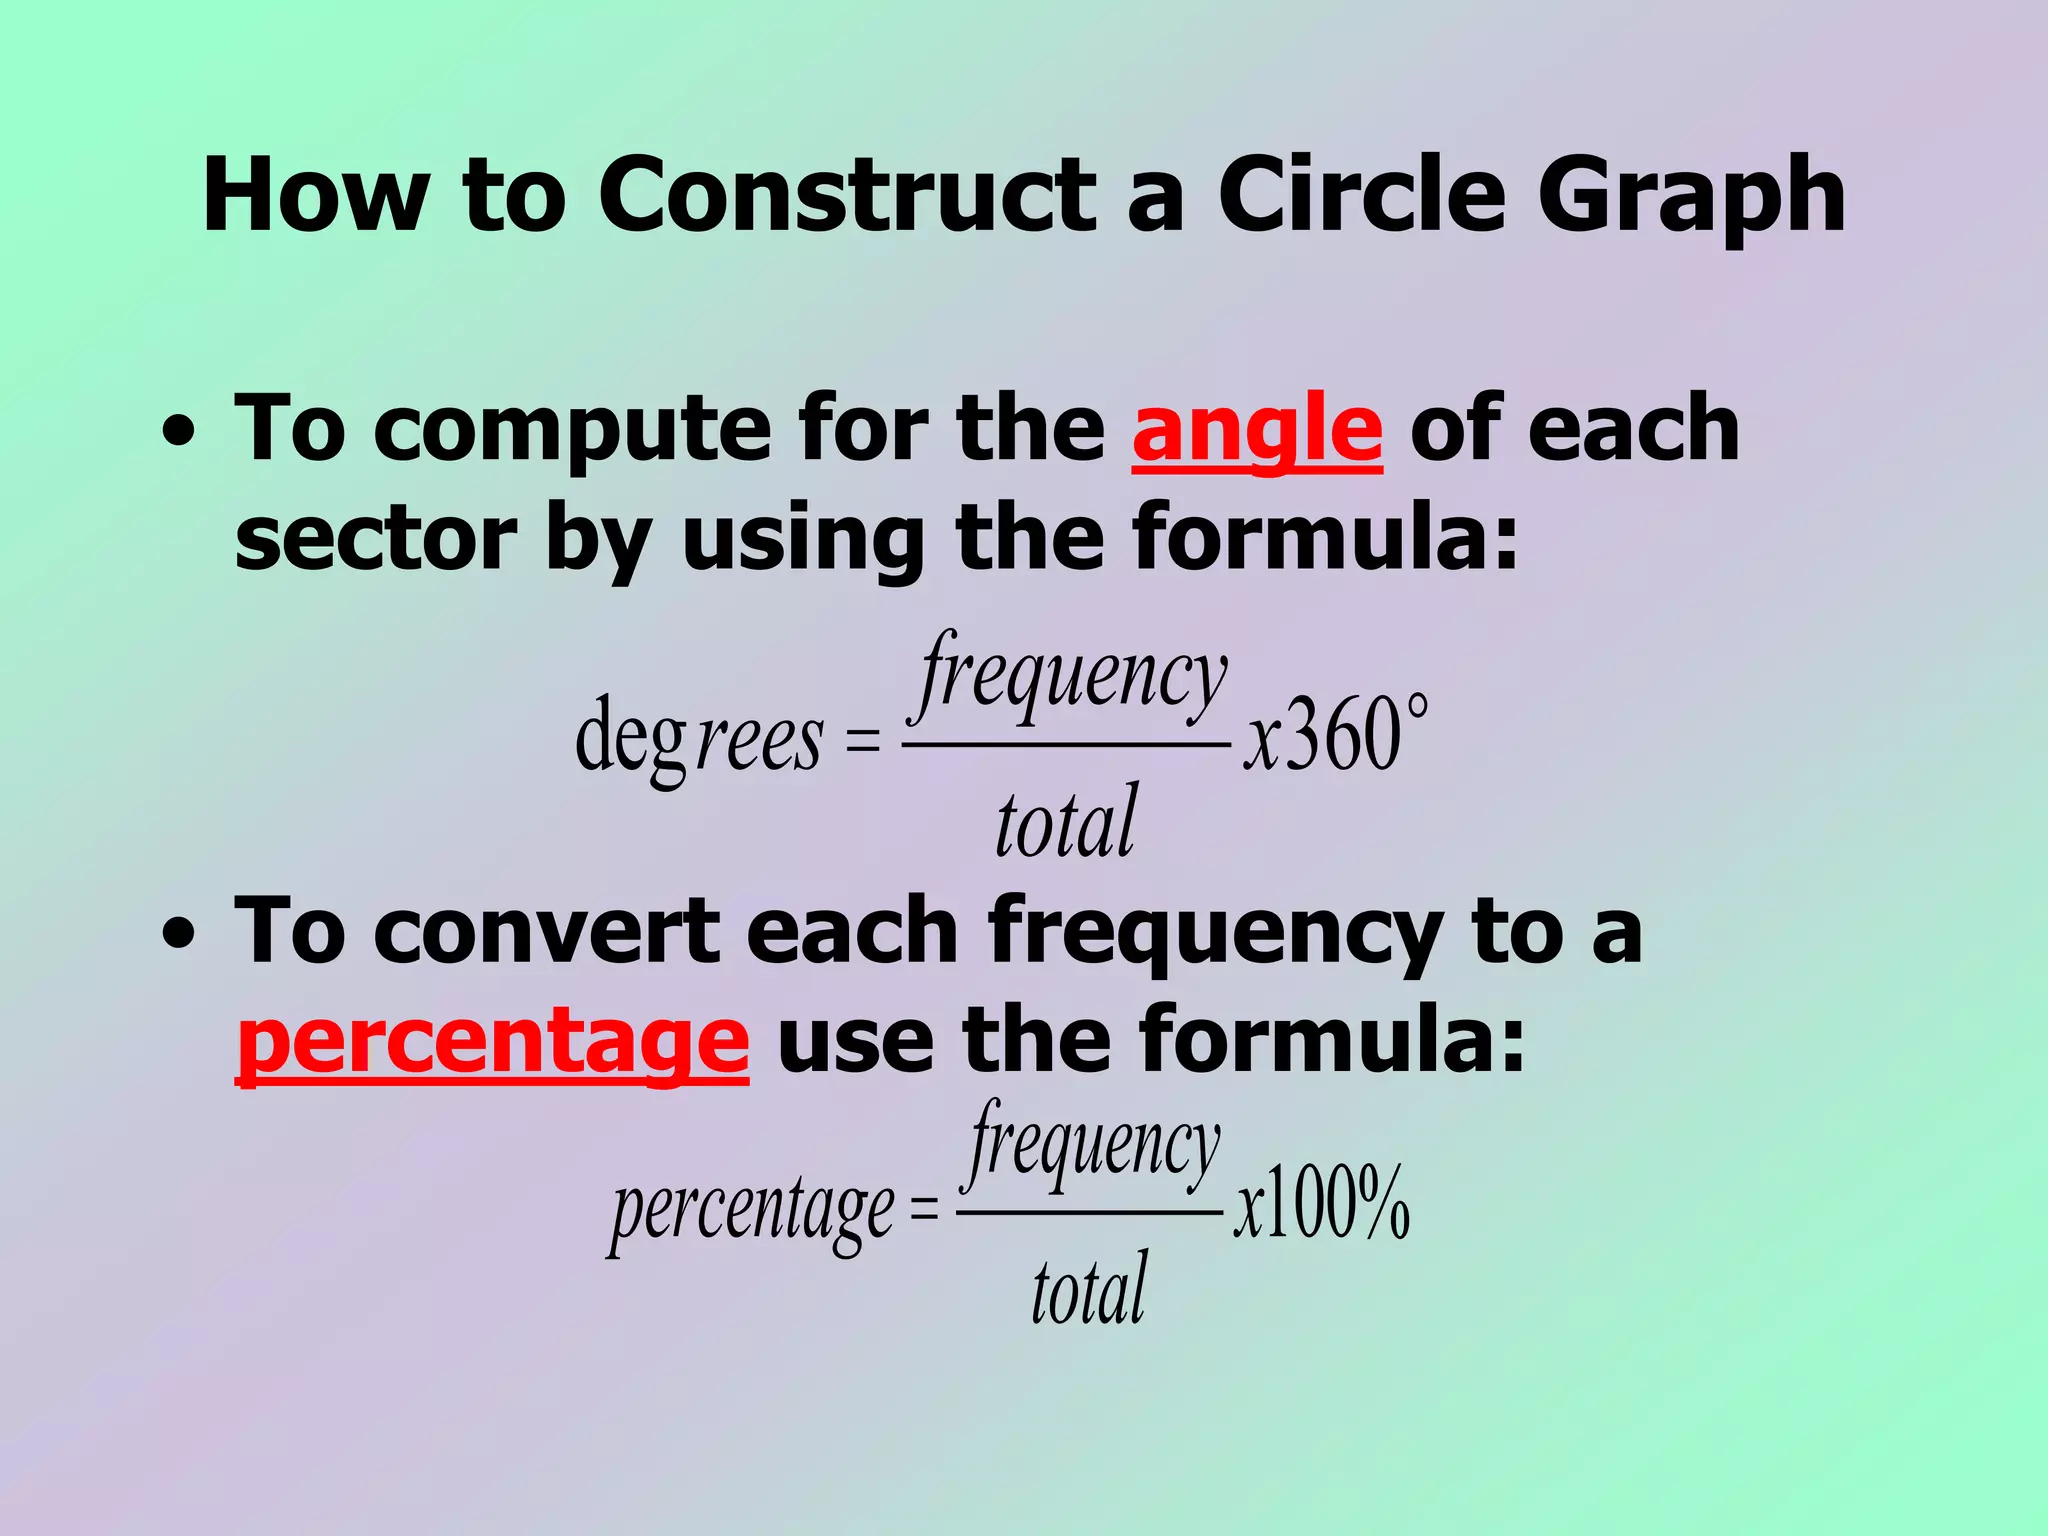
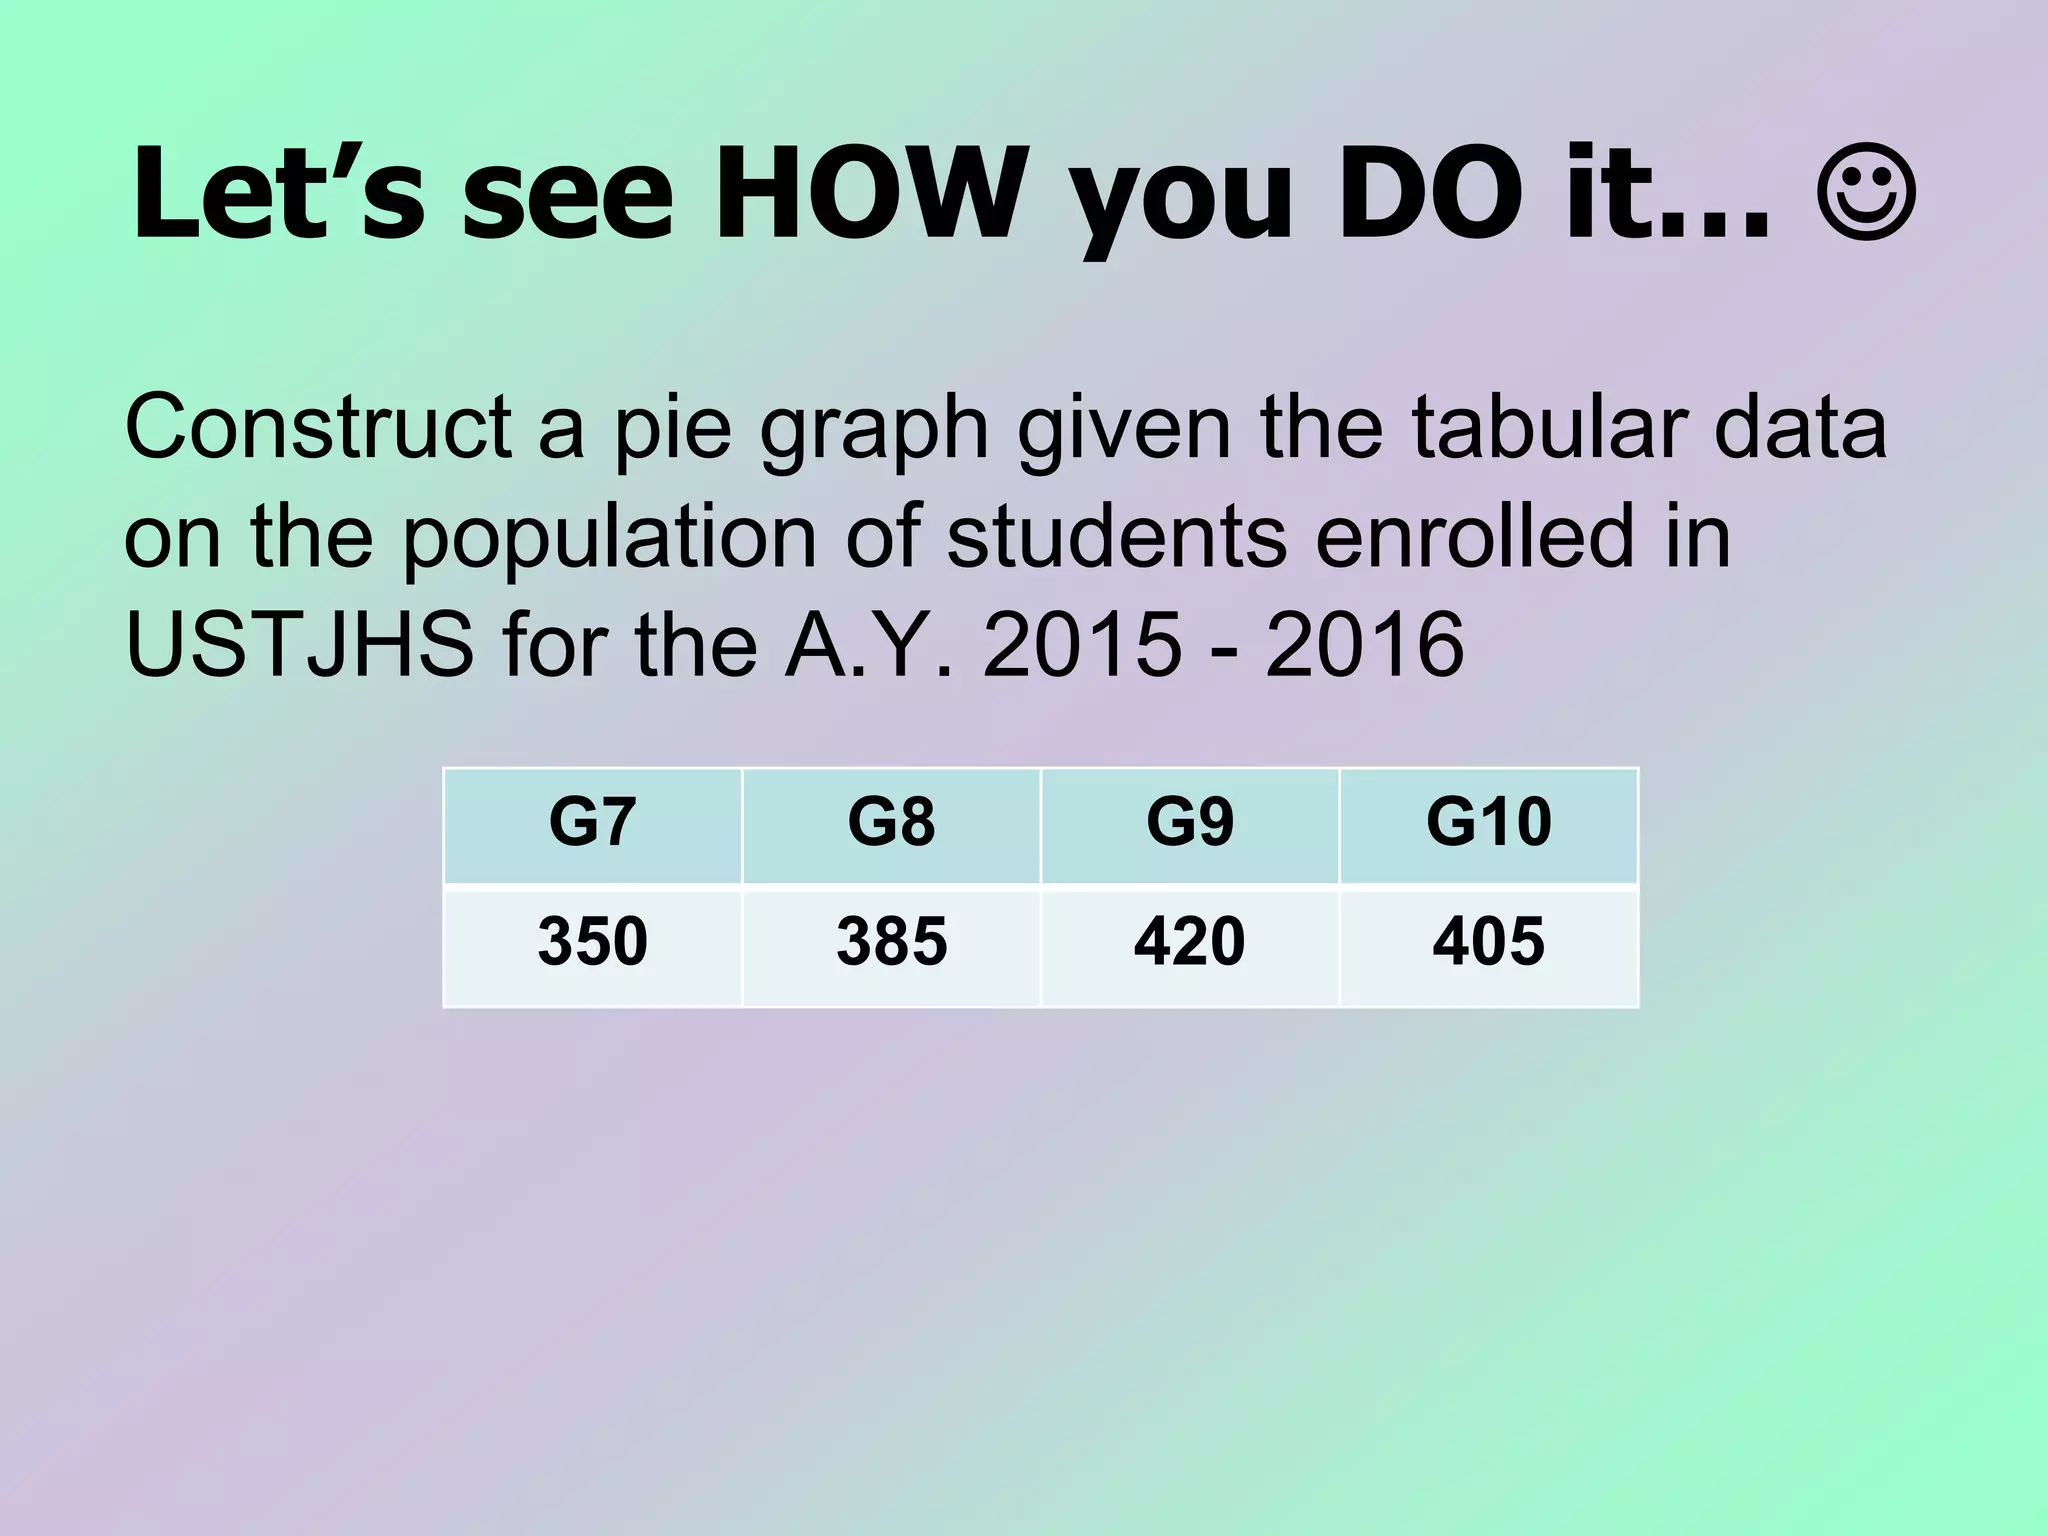
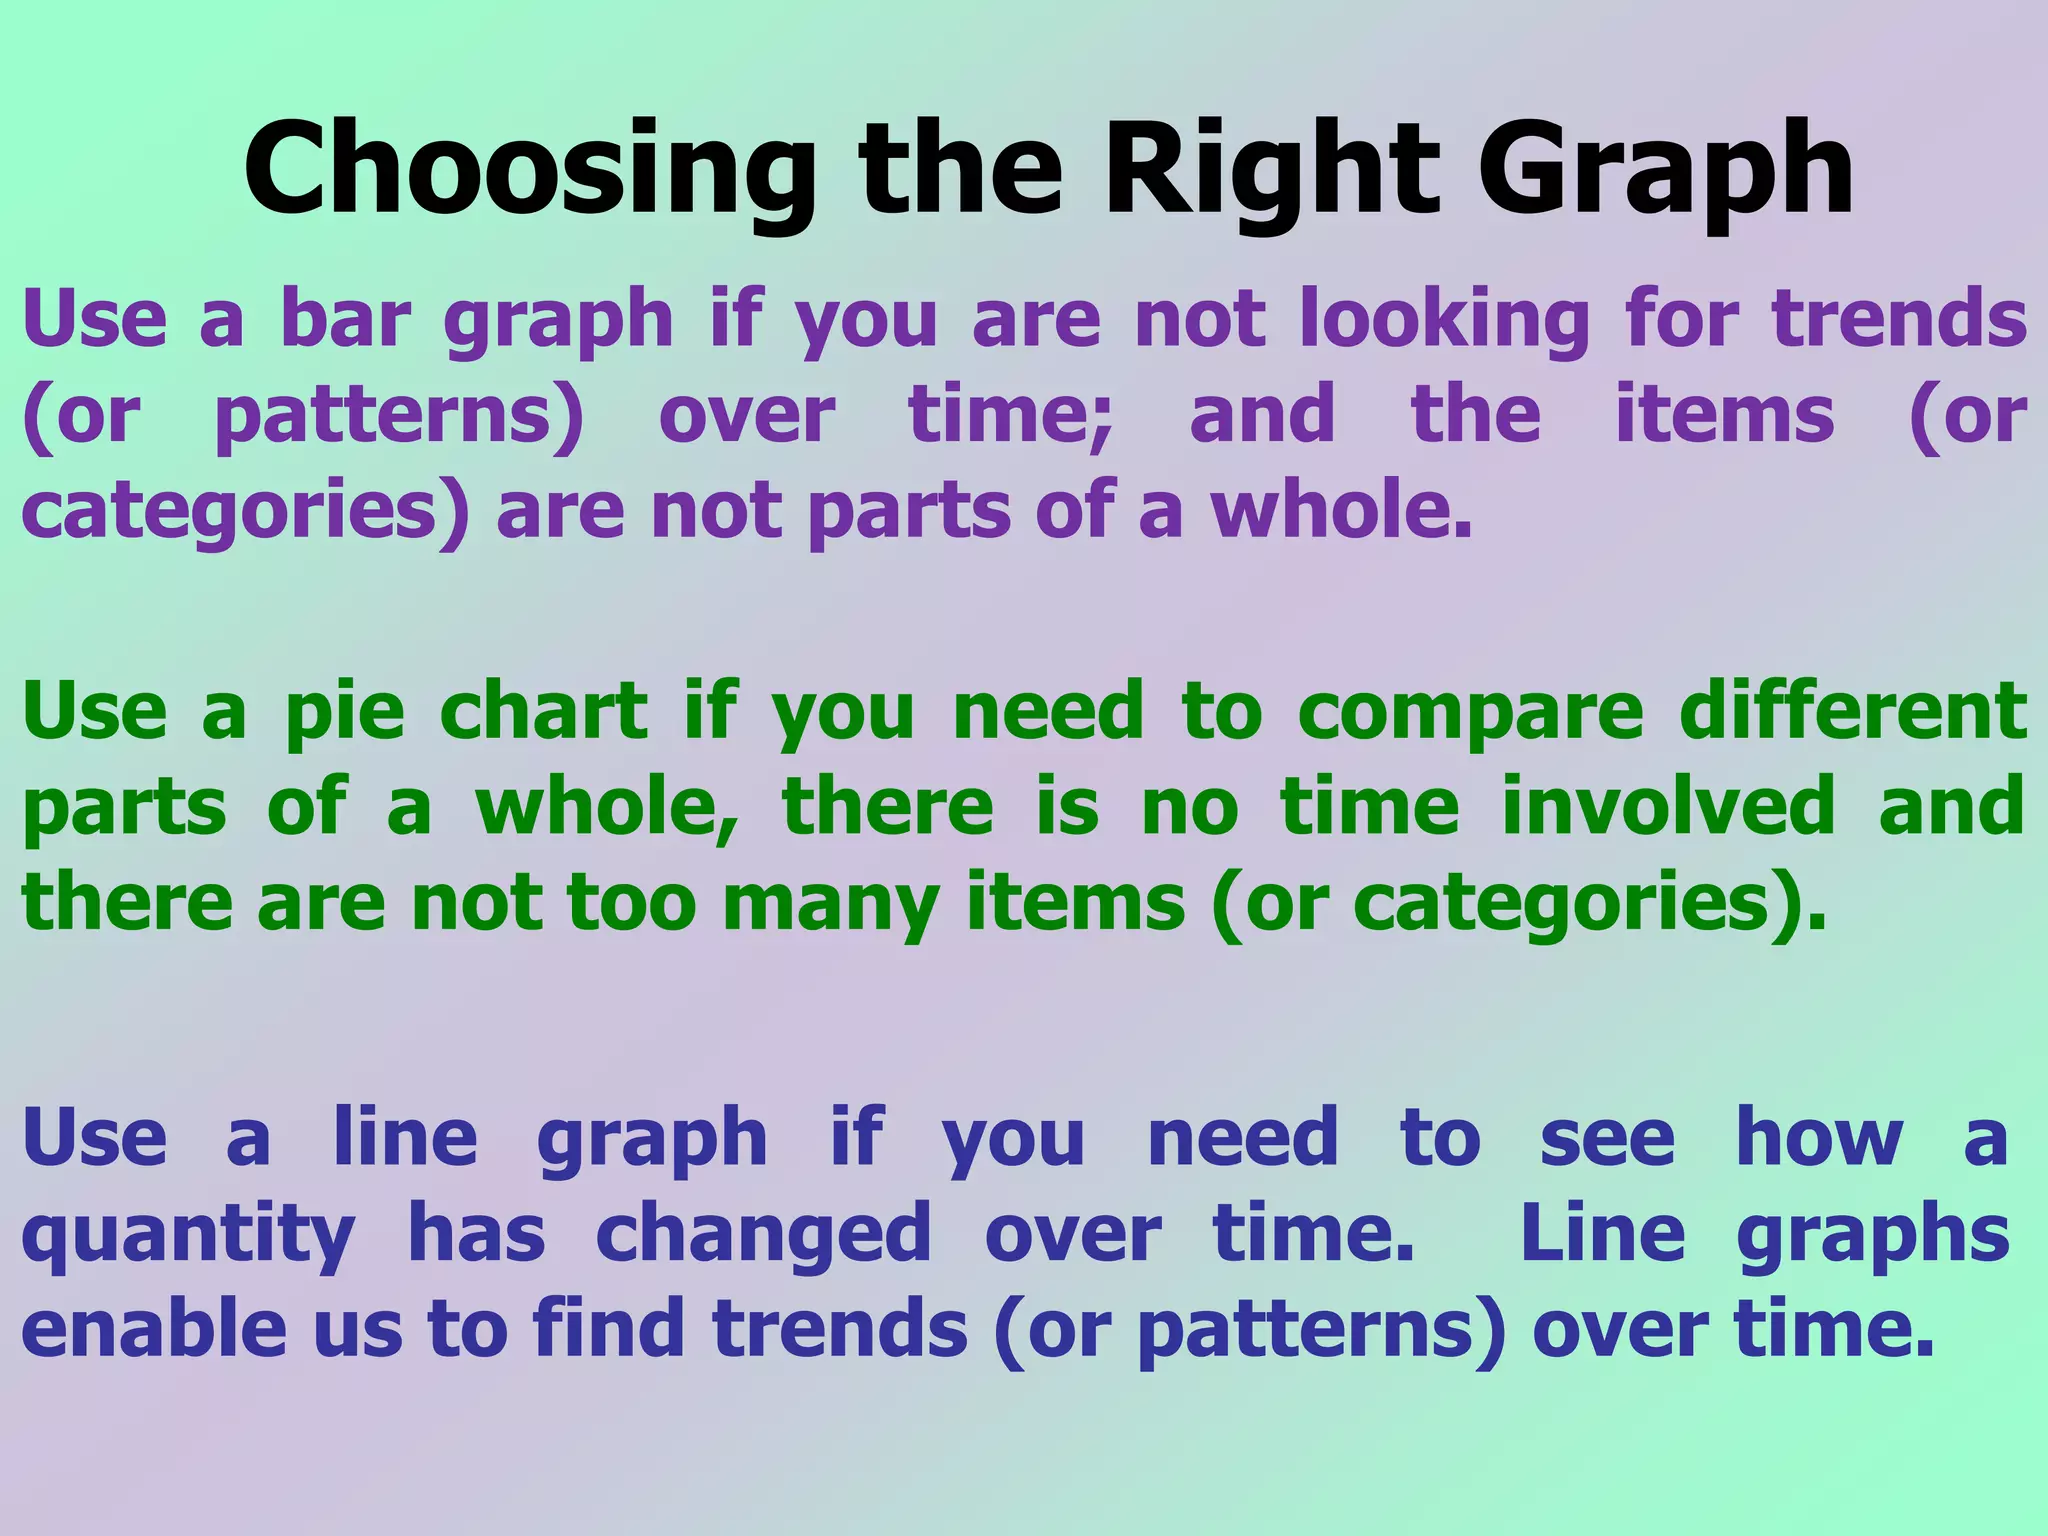
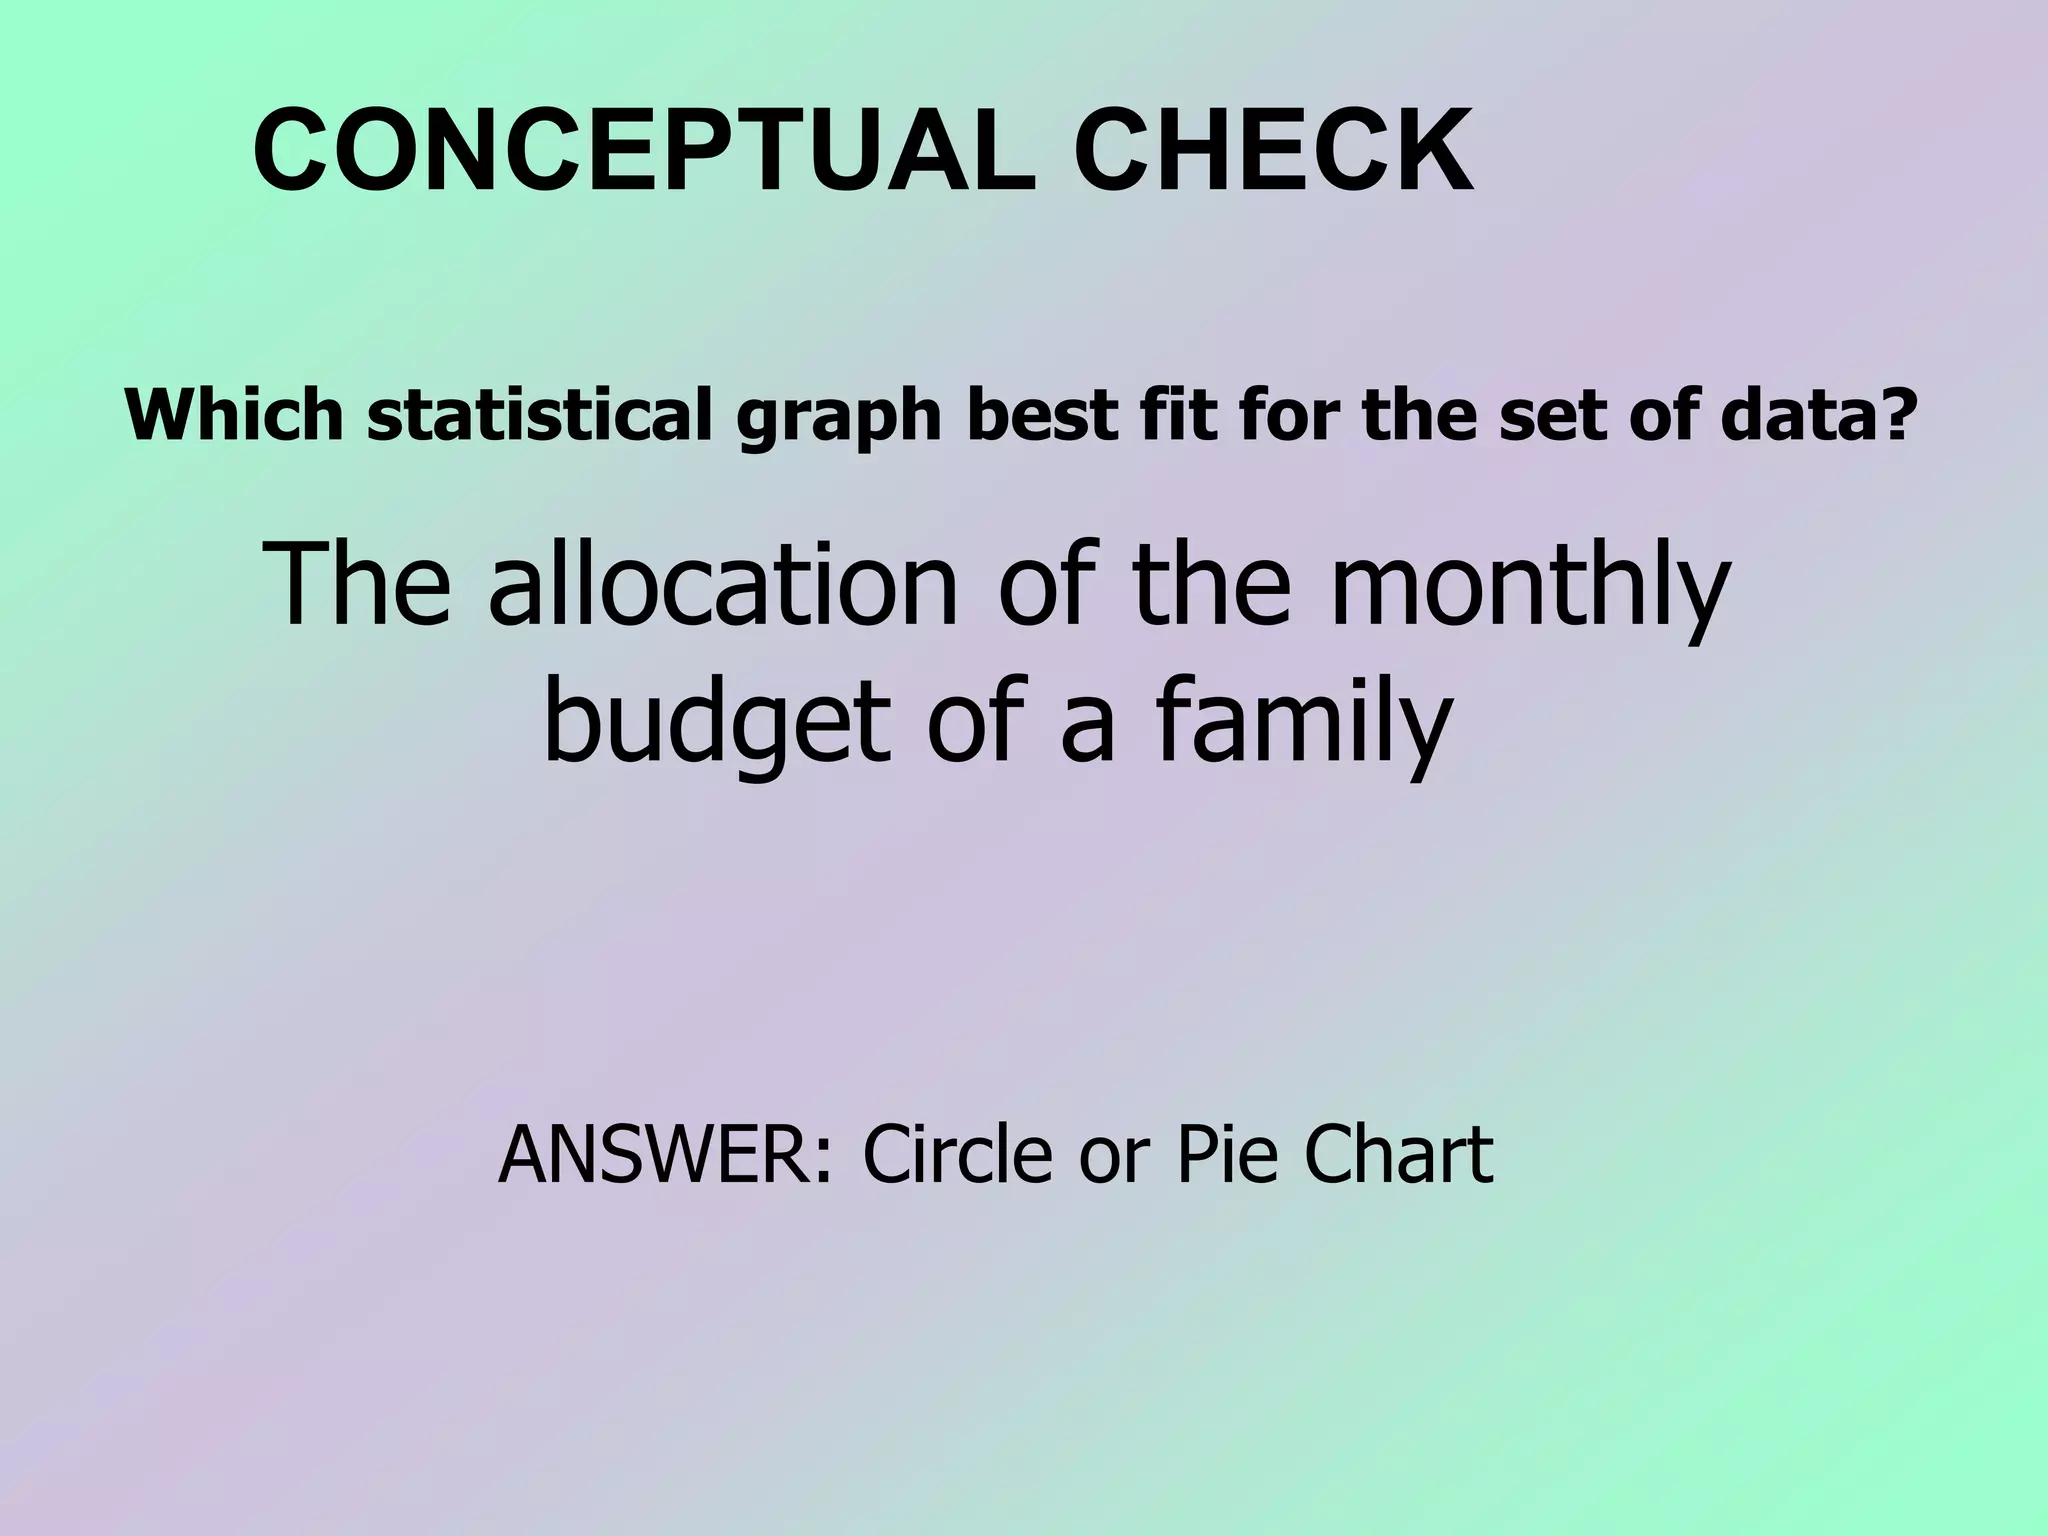

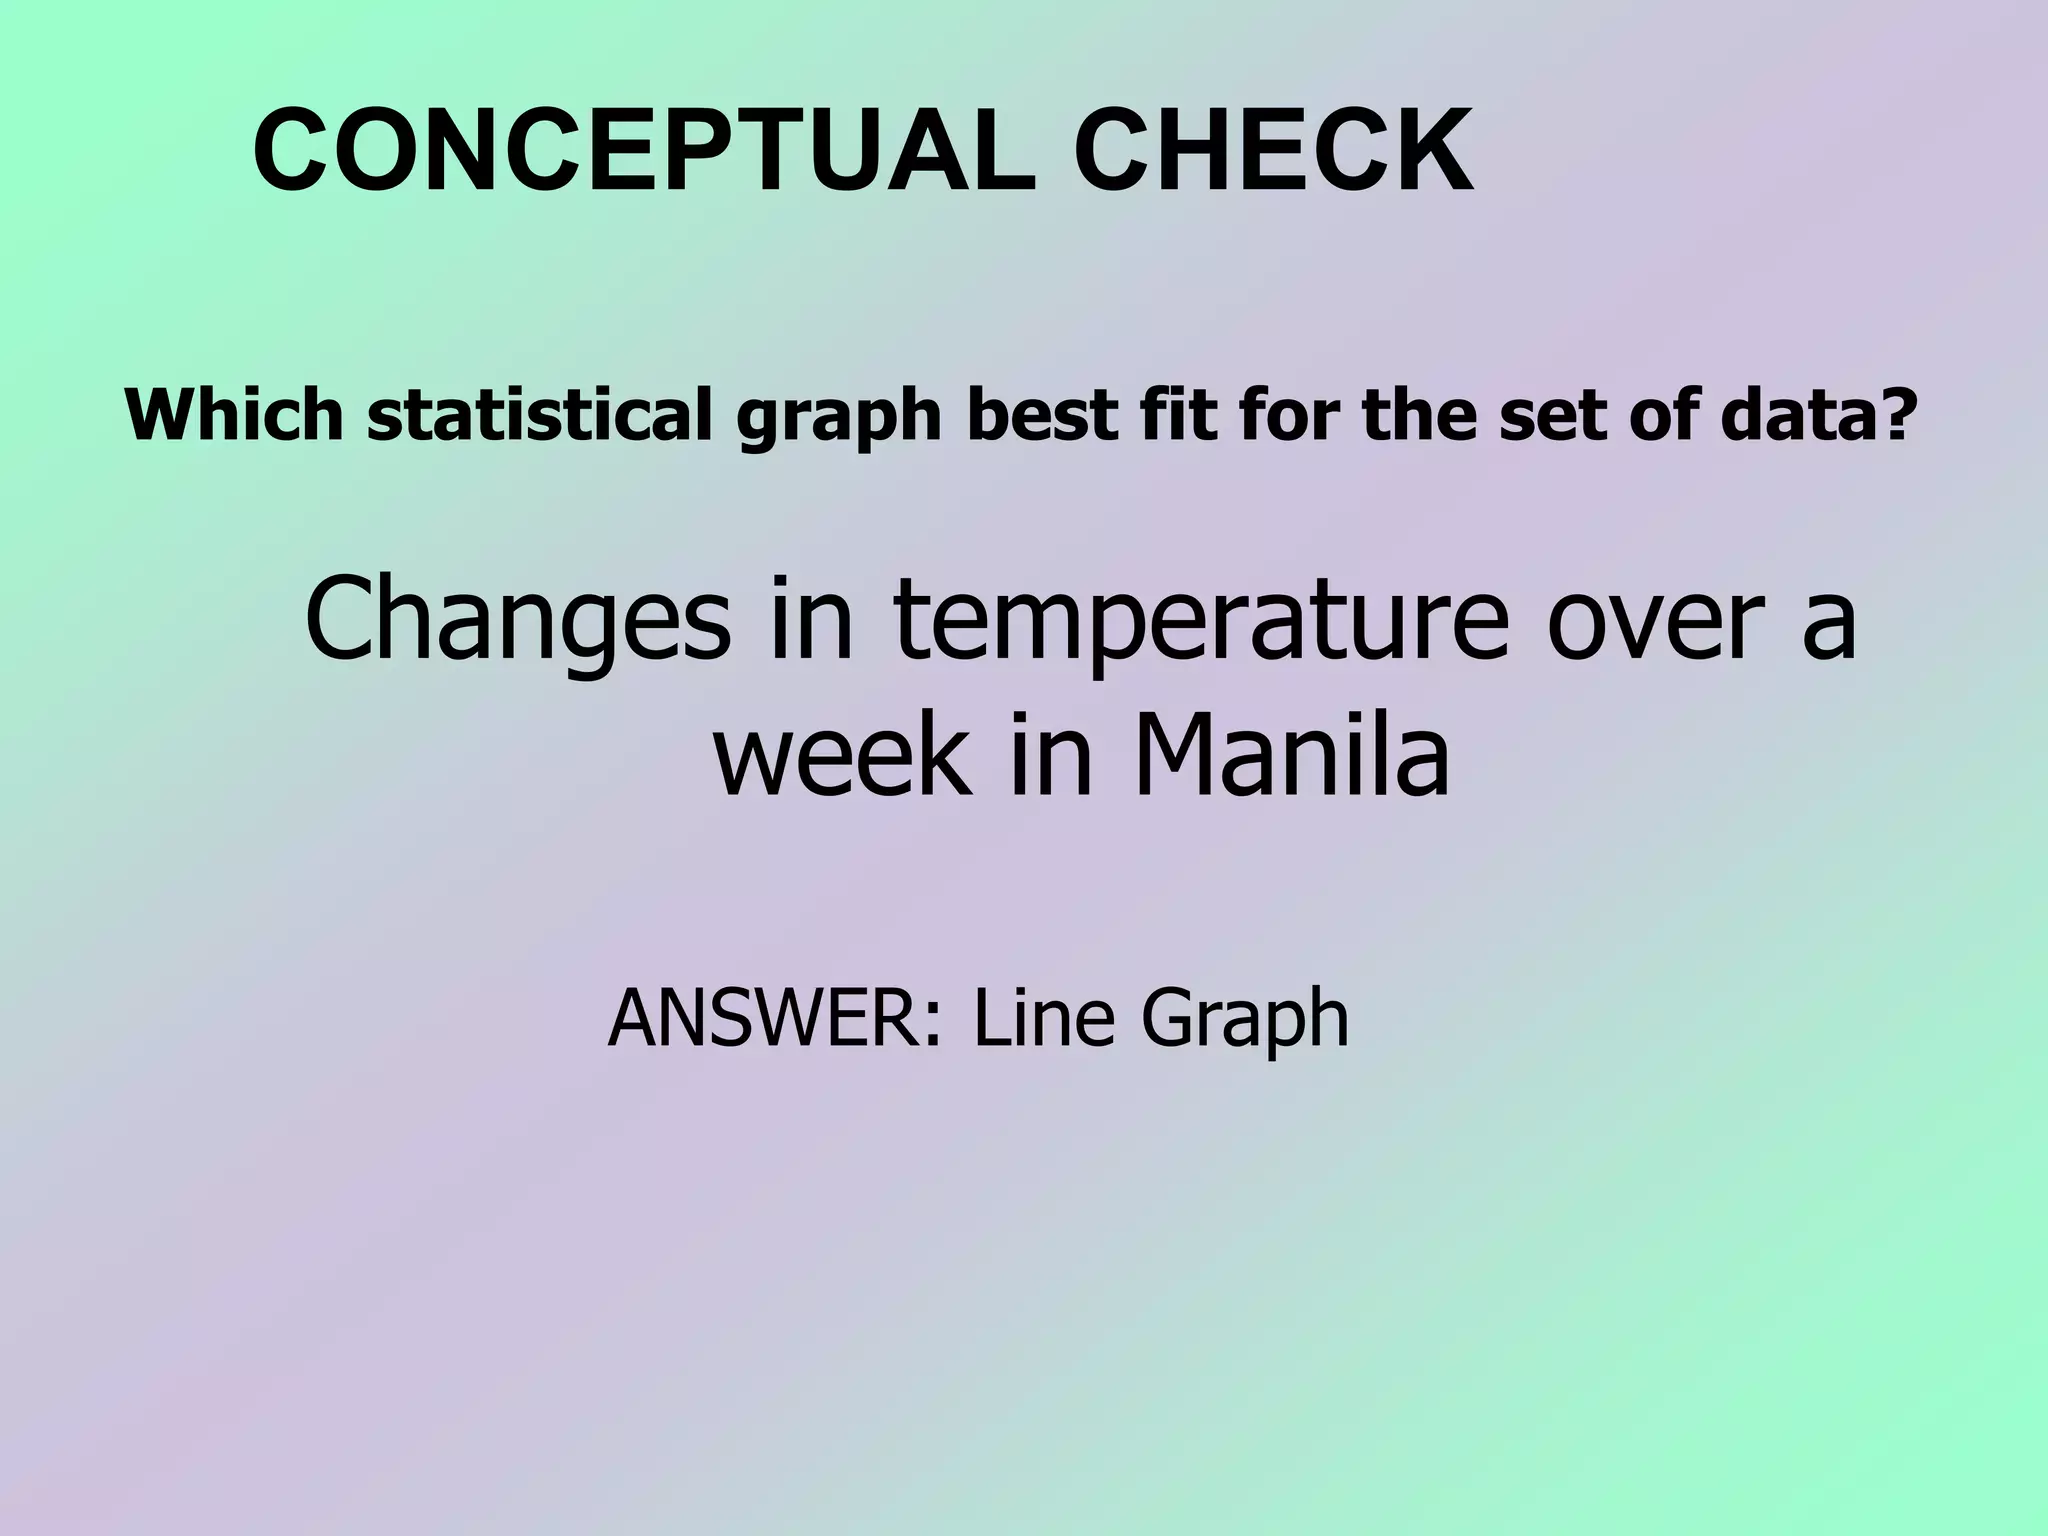

This document provides information and instructions on constructing different types of graphs: bar graphs, line graphs, and circle/pie graphs. It includes examples of each graph type using sample data. Steps are outlined for properly constructing each graph, including labeling axes, determining scale intervals, plotting points, and connecting data. The document emphasizes choosing the right graph based on whether the data involves categories, parts of a whole, or trends over time. Conceptual check questions test understanding of which graph type is best suited for different data sets.


![Presenting-Experimental-Data-Grade-8 [Autosaved].pptx](https://cdn.slidesharecdn.com/ss_thumbnails/presenting-experimental-data-grade-8autosaved-240925105557-9775d0ae-thumbnail.jpg?width=600ounds&width=560&fit=bounds)
![Presenting-Experimental-Data-Grade-8 [Autosaved].pptx](https://cdn.slidesharecdn.com/ss_thumbnails/presenting-experimental-data-grade-8autosaved-240925104859-008a237a-thumbnail.jpg?width=600ounds&width=560&fit=bounds)


