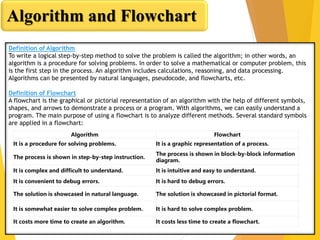
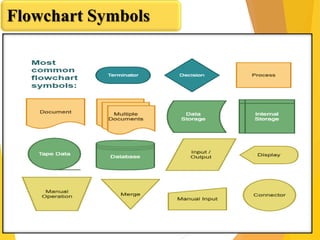
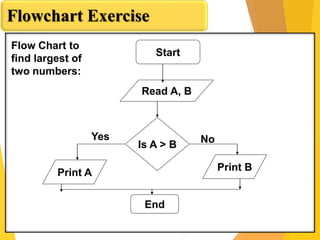
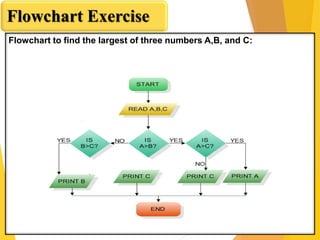
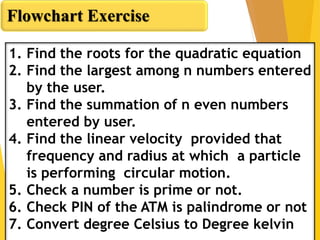
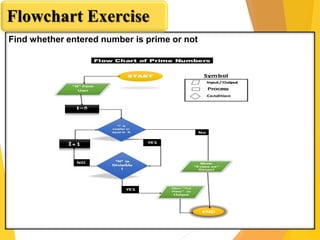
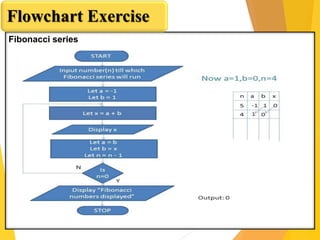
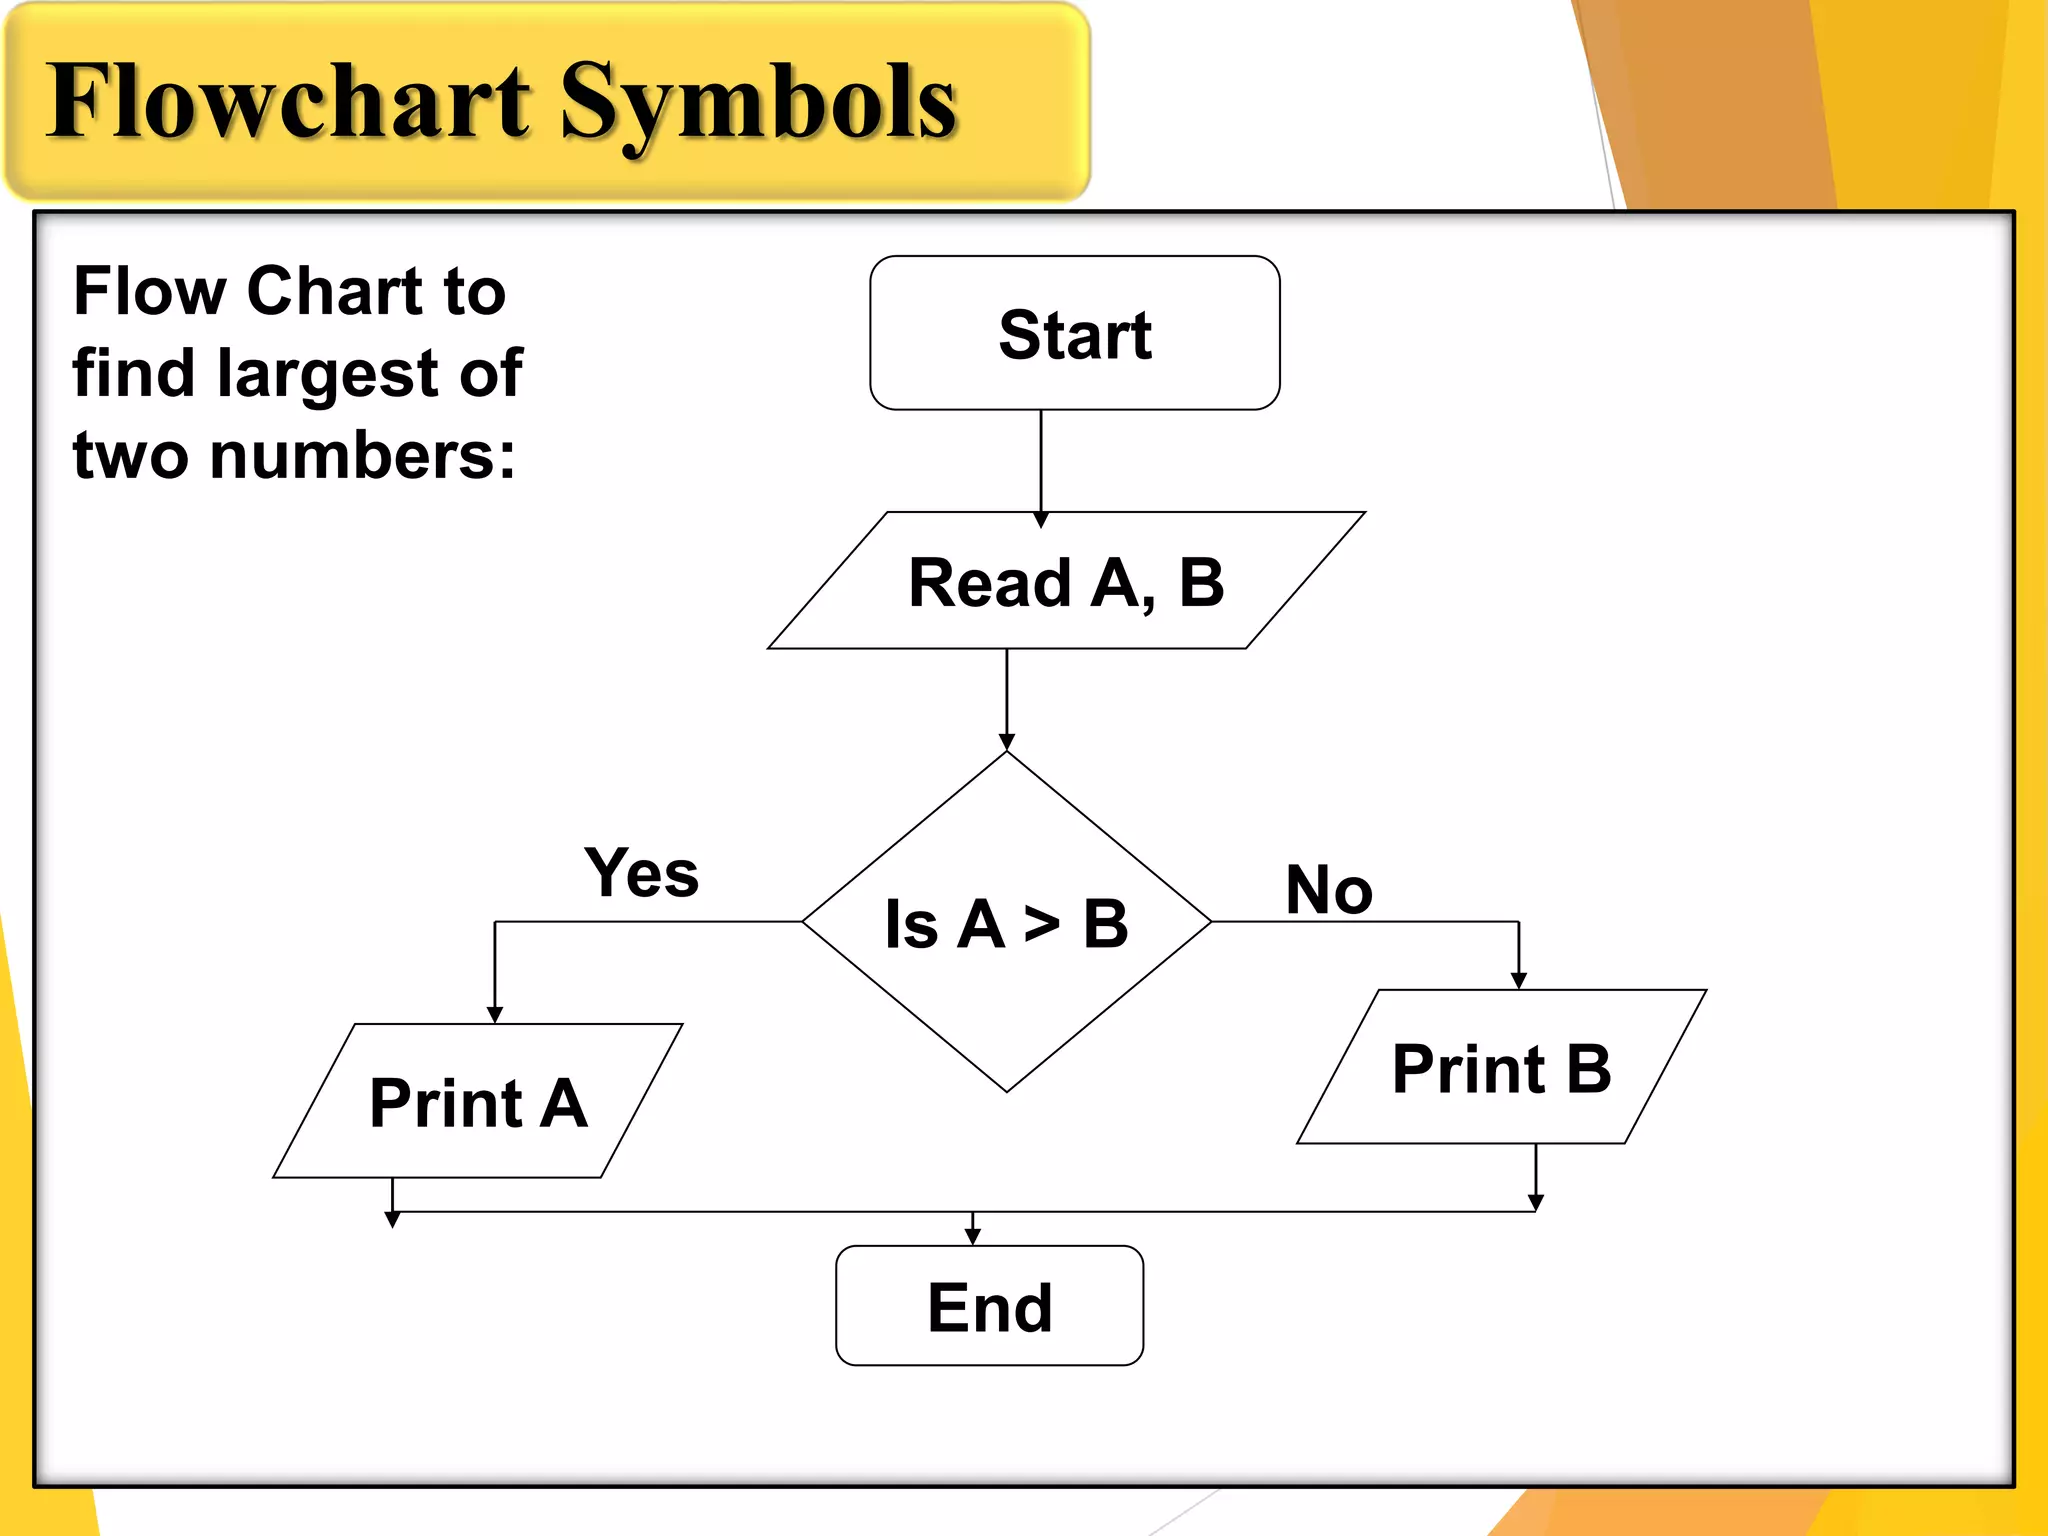
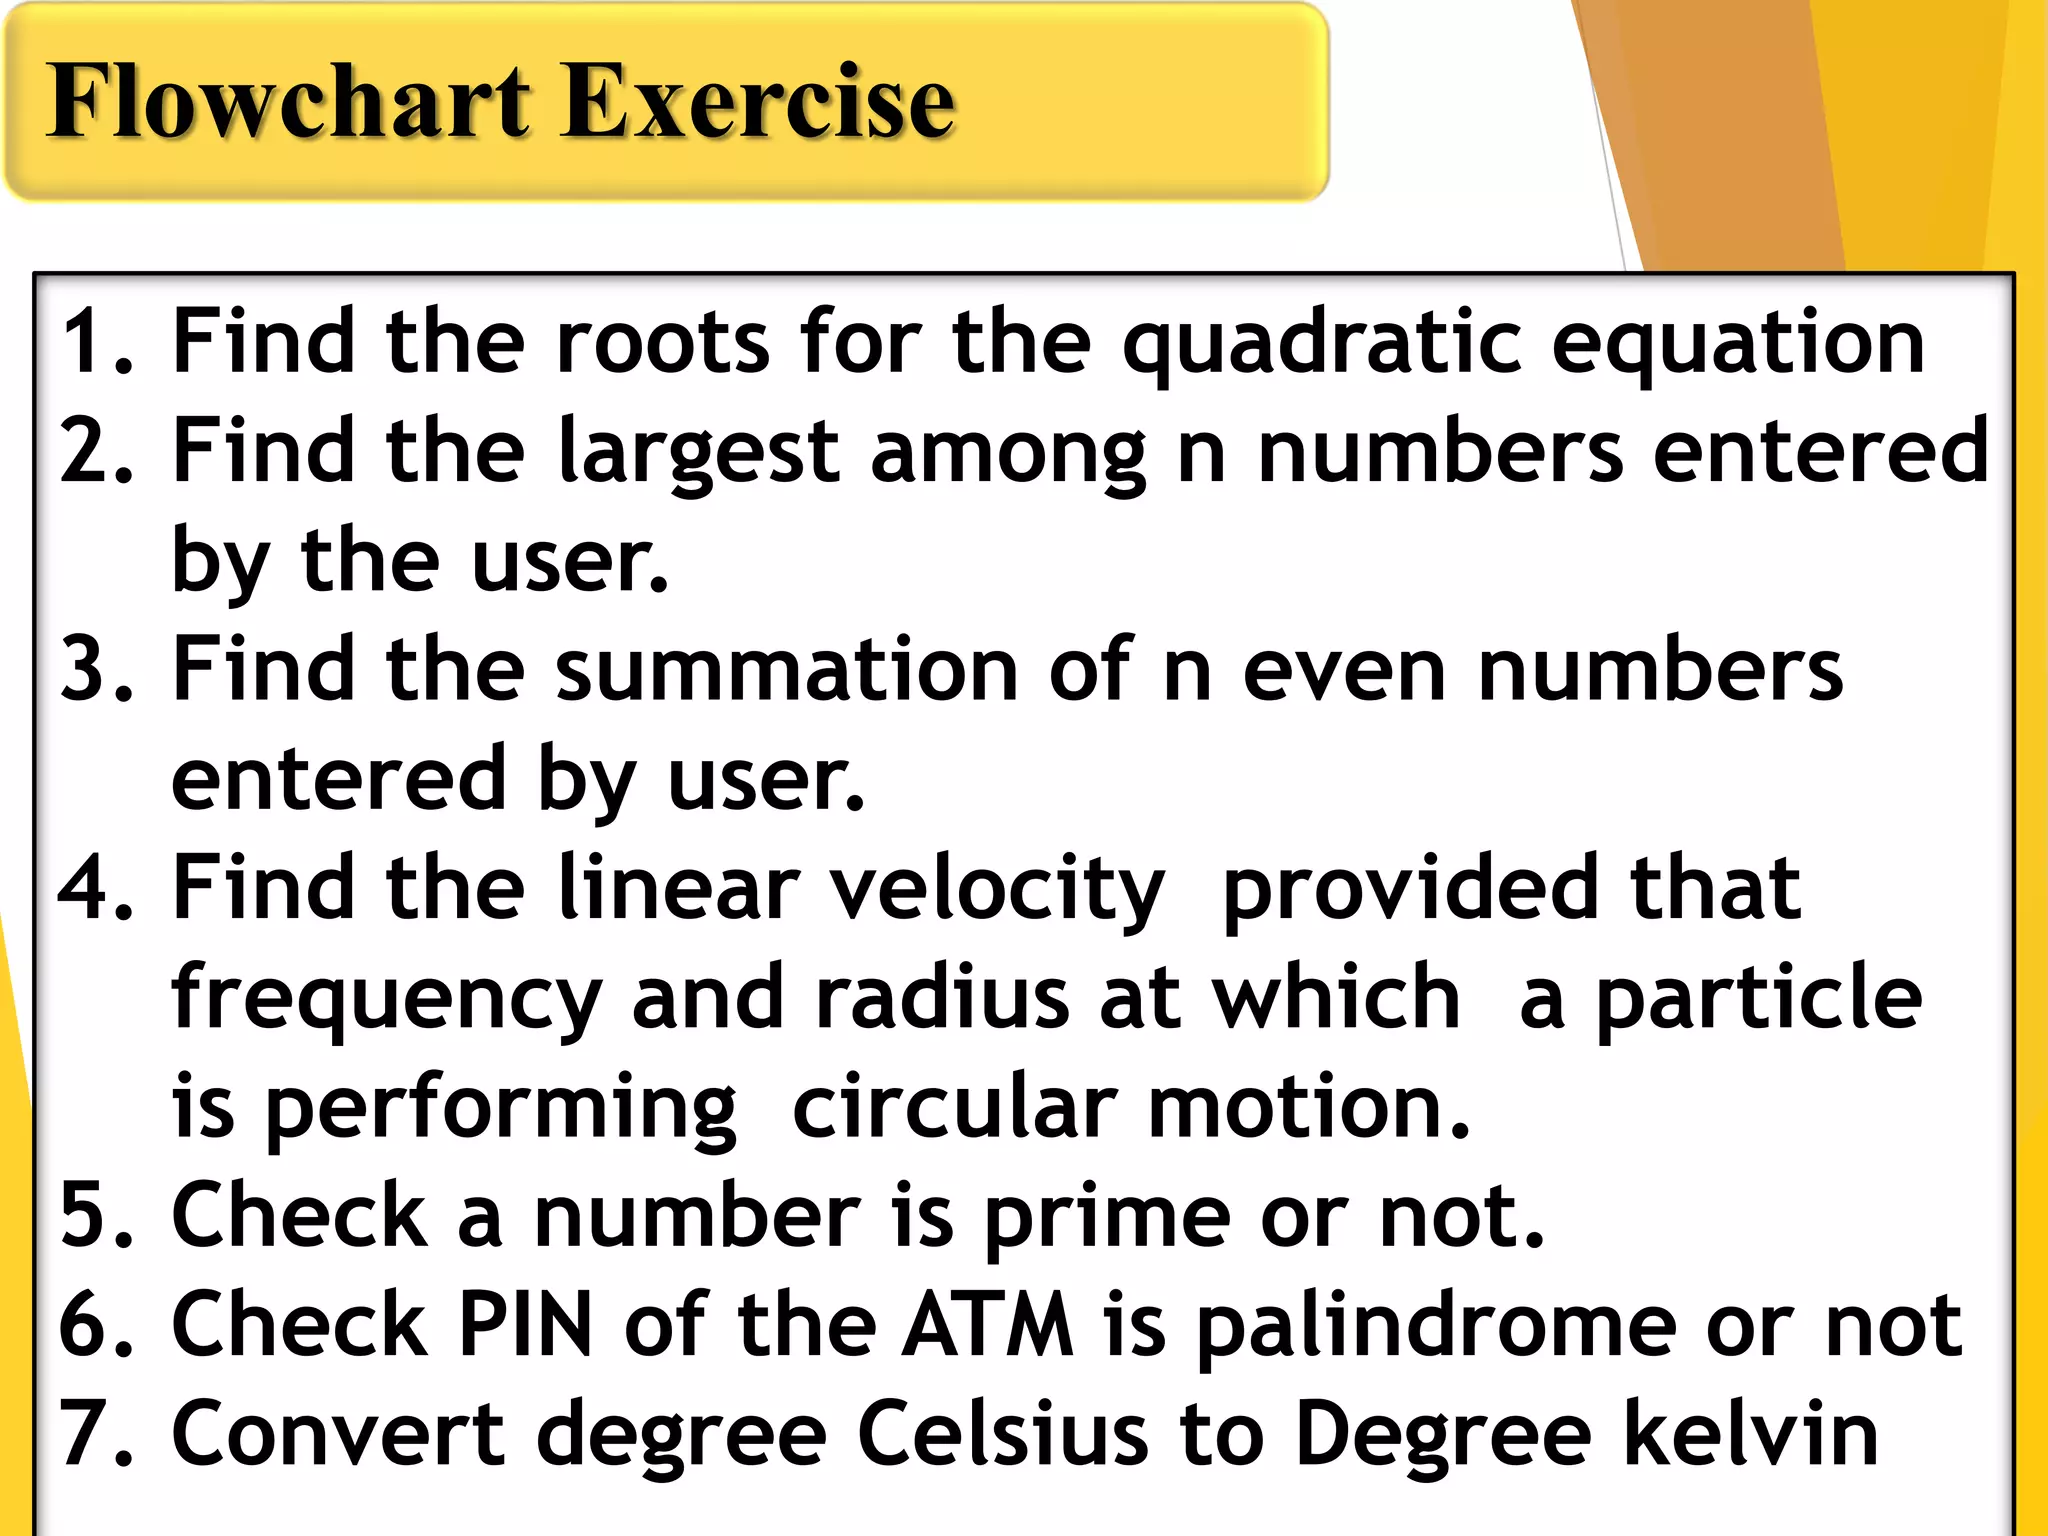
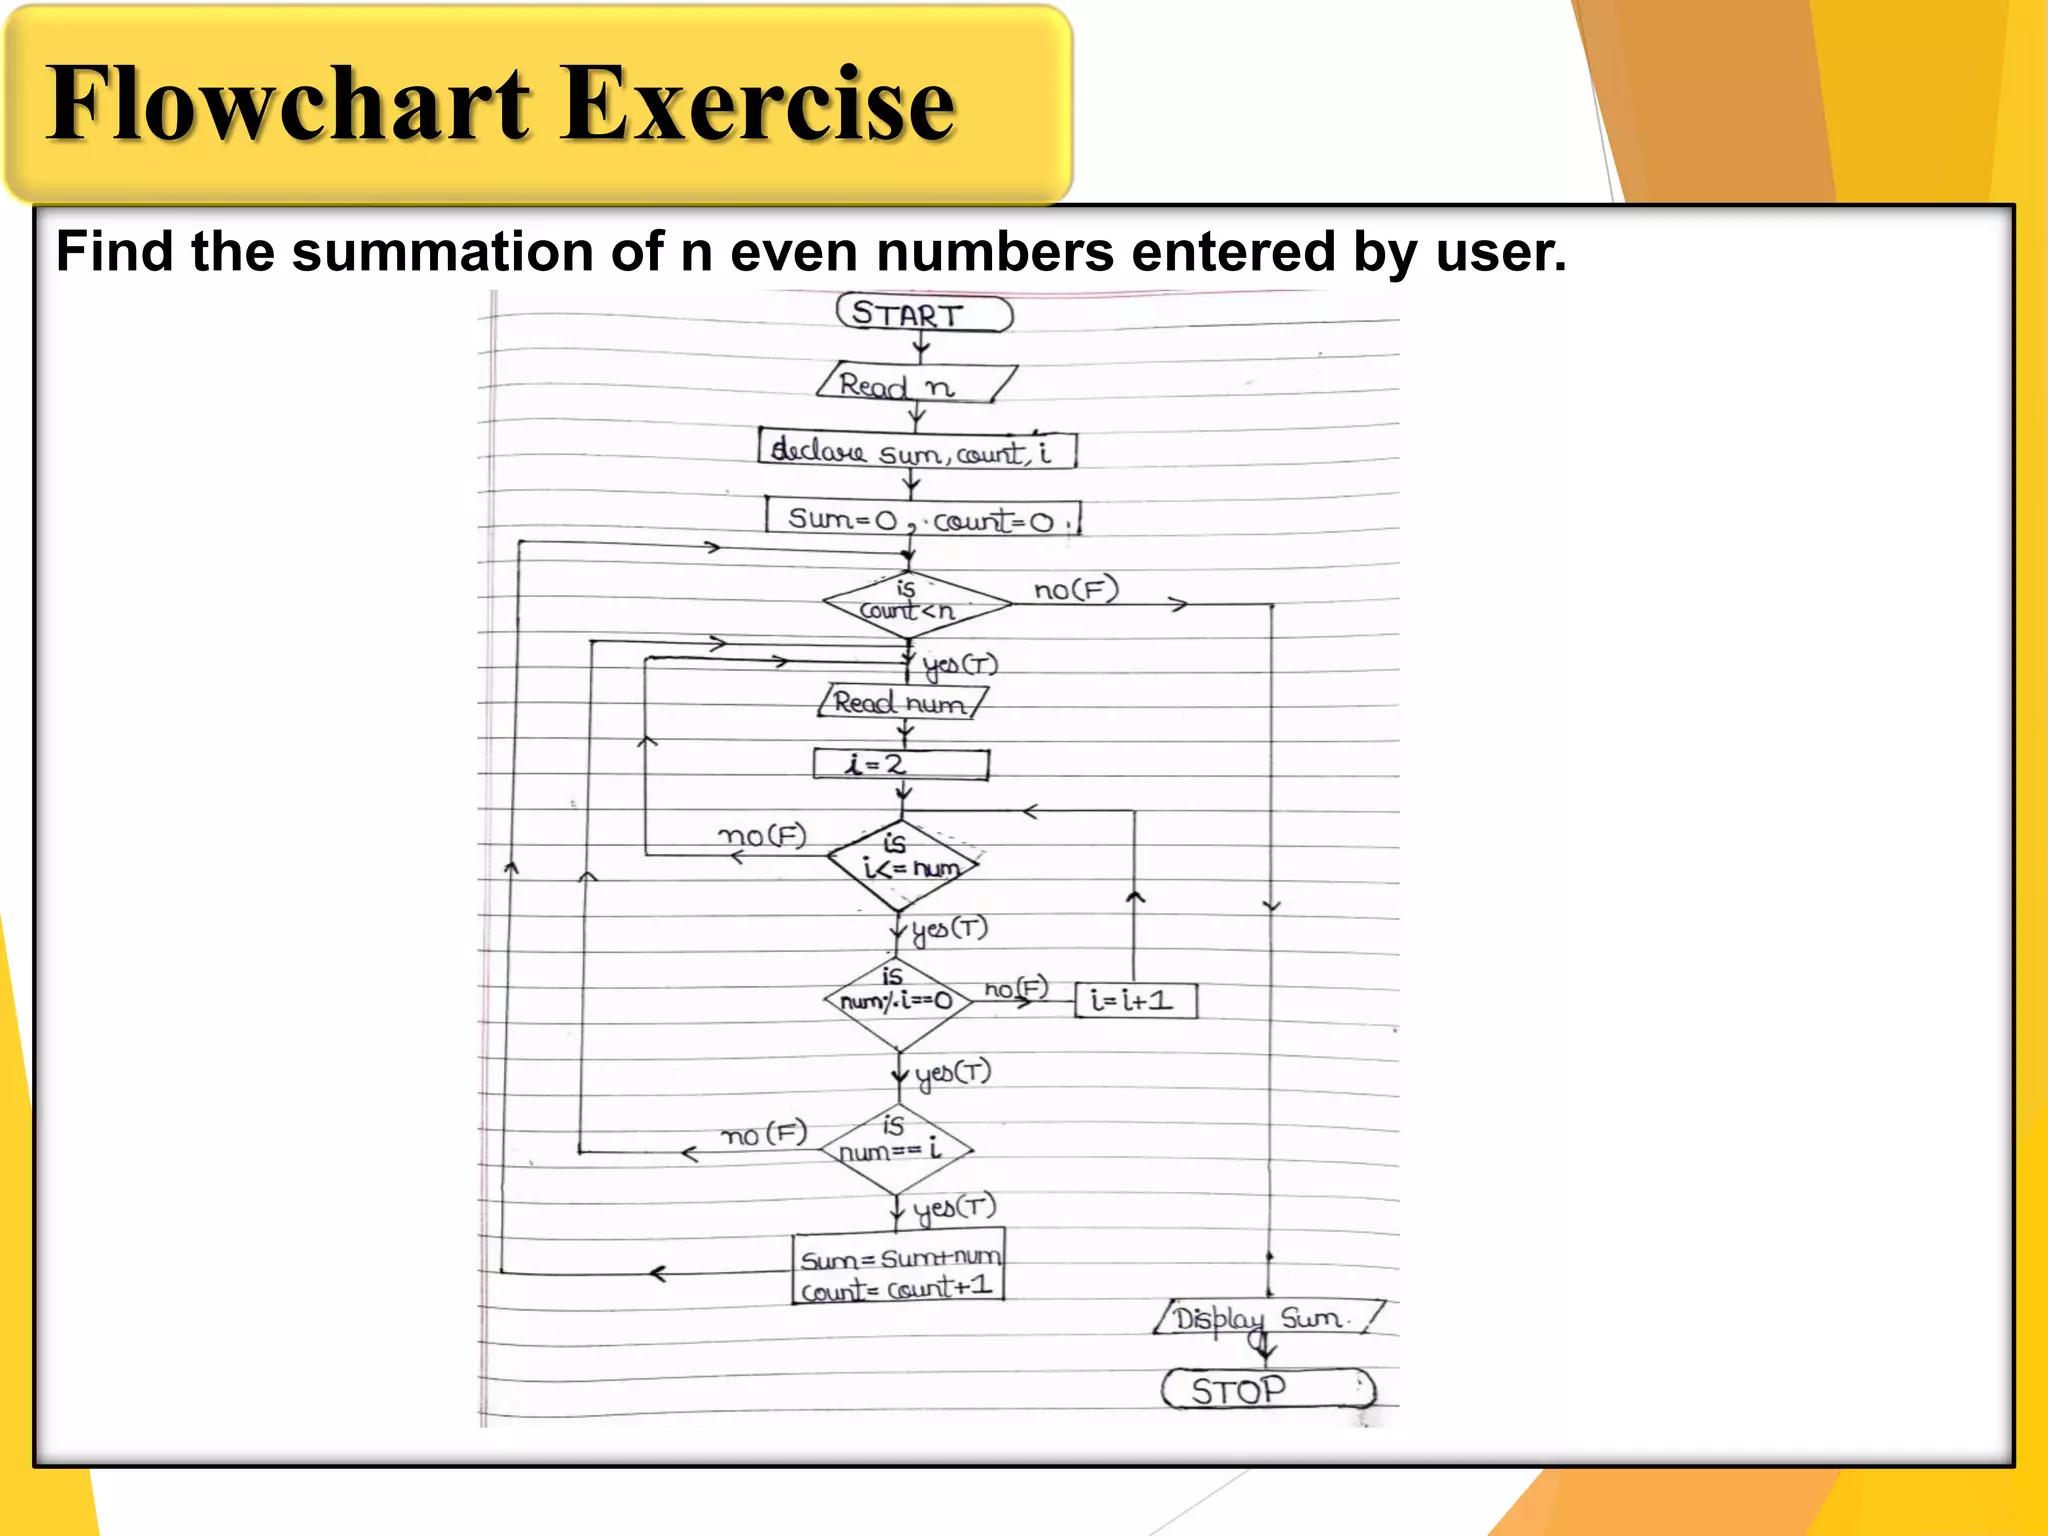
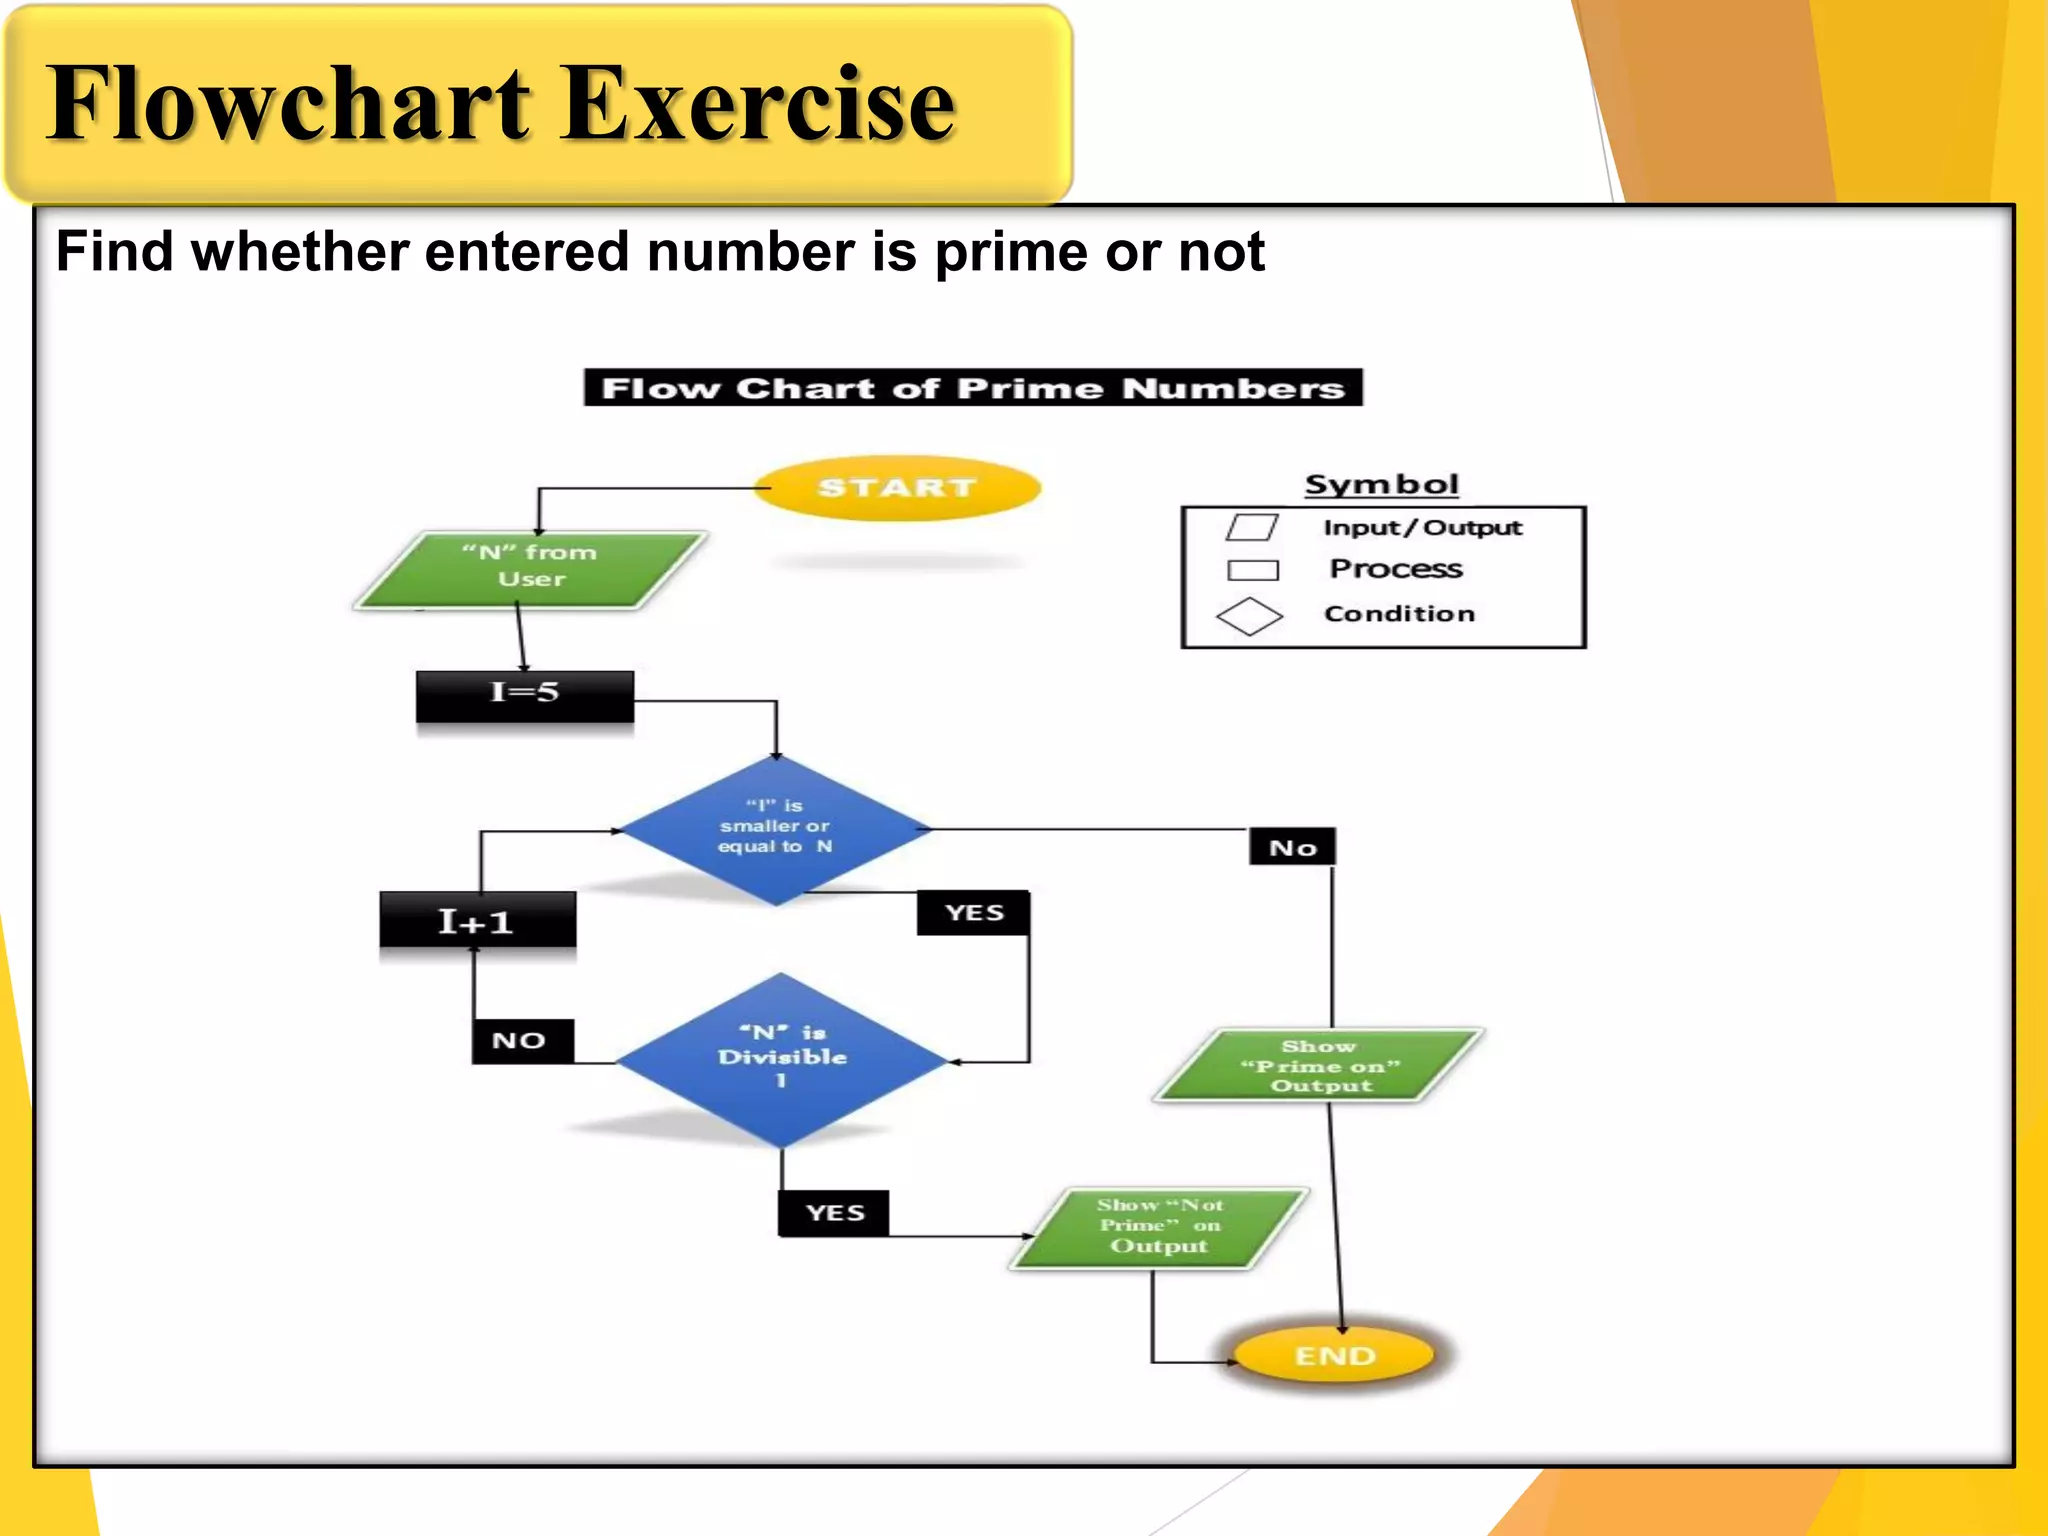
KEMBAR78
Programming with matlab session 3 notes | PDF
SESSION-3 :MATLAB
Algorithm and Flowchart
By: Prof. Ganesh Ingle
Session objective
Arrays
Array Creation , Accessing Elements
Sub Arrays, Representation, Operations
Maximum and Minimum values in Matrix
Potential Energy-Spring Problem
SUMMARY
Algorithm and Flowchart
Definition of Algorithm
To write a logical step-by-step method to solve the problem is called the algorithm; in other words, an
algorithm is a procedure for solving problems. In order to solve a mathematical or computer problem, this
is the first step in the process. An algorithm includes calculations, reasoning, and data processing.
Algorithms can be presented by natural languages, pseudocode, and flowcharts, etc.
Definition of Flowchart
A flowchart is the graphical or pictorial representation of an algorithm with the help of different symbols,
shapes, and arrows to demonstrate a process or a program. With algorithms, we can easily understand a
program. The main purpose of using a flowchart is to analyze different methods. Several standard symbols
are applied in a flowchart:
Algorithm Flowchart
It is a procedure for solving problems. It is a graphic representation of a process.
The process is shown in step-by-step instruction.
The process is shown in block-by-block information
diagram.
It is complex and difficult to understand. It is intuitive and easy to understand.
It is convenient to debug errors. It is hard to debug errors.
The solution is showcased in natural language. The solution is showcased in pictorial format.
It is somewhat easier to solve complex problem. It is hard to solve complex problem.
It costs more time to create an algorithm. It costs less time to create a flowchart.
Flowchart Symbols
Flowchart Symbols
Flowchart Symbols
Start
Read A, B
Is A > B
Print A
Print B
End
Yes No
Flow Chart to
find largest of
two numbers:
Flowchart Exercise
Start
Read A, B
Is A > B
Print A
Print B
End
Yes No
Flow Chart to
find largest of
two numbers:
Flowchart to find the largest of three numbers A,B, and C:
Flowchart Exercise
1. Find the roots for the quadratic equation
2. Find the largest among n numbers entered
by the user.
3. Find the summation of n even numbers
entered by user.
4. Find the linear velocity provided that
frequency and radius at which a particle
is performing circular motion.
5. Check a number is prime or not.
6. Check PIN of the ATM is palindrome or not
7. Convert degree Celsius to Degree kelvin
Flowchart Exercise
Find the summation of n even numbers entered by user.
Flowchart Exercise
Find whether entered number is prime or not
Flowchart Exercise
Fibonacci series
Flowchart Exercise
Design Process Flowchart
Flowchart Exercise
THANK YOU
Image Source
searchenterpriseai.techtarget.com
wikipedia

Programming with matlab session 3 notes

  • 1.
    SESSION-3 :MATLAB Algorithm andFlowchart By: Prof. Ganesh Ingle
  • 2.
    Session objective Arrays Array Creation, Accessing Elements Sub Arrays, Representation, Operations Maximum and Minimum values in Matrix Potential Energy-Spring Problem SUMMARY
  • 3.
    Algorithm and Flowchart Definitionof Algorithm To write a logical step-by-step method to solve the problem is called the algorithm; in other words, an algorithm is a procedure for solving problems. In order to solve a mathematical or computer problem, this is the first step in the process. An algorithm includes calculations, reasoning, and data processing. Algorithms can be presented by natural languages, pseudocode, and flowcharts, etc. Definition of Flowchart A flowchart is the graphical or pictorial representation of an algorithm with the help of different symbols, shapes, and arrows to demonstrate a process or a program. With algorithms, we can easily understand a program. The main purpose of using a flowchart is to analyze different methods. Several standard symbols are applied in a flowchart: Algorithm Flowchart It is a procedure for solving problems. It is a graphic representation of a process. The process is shown in step-by-step instruction. The process is shown in block-by-block information diagram. It is complex and difficult to understand. It is intuitive and easy to understand. It is convenient to debug errors. It is hard to debug errors. The solution is showcased in natural language. The solution is showcased in pictorial format. It is somewhat easier to solve complex problem. It is hard to solve complex problem. It costs more time to create an algorithm. It costs less time to create a flowchart.
  • 4.
  • 5.
  • 6.
    Flowchart Symbols Start Read A,B Is A > B Print A Print B End Yes No Flow Chart to find largest of two numbers:
  • 7.
    Flowchart Exercise Start Read A,B Is A > B Print A Print B End Yes No Flow Chart to find largest of two numbers:
  • 8.
    Flowchart to findthe largest of three numbers A,B, and C: Flowchart Exercise
  • 9.
    1. Find theroots for the quadratic equation 2. Find the largest among n numbers entered by the user. 3. Find the summation of n even numbers entered by user. 4. Find the linear velocity provided that frequency and radius at which a particle is performing circular motion. 5. Check a number is prime or not. 6. Check PIN of the ATM is palindrome or not 7. Convert degree Celsius to Degree kelvin Flowchart Exercise
  • 10.
    Find the summationof n even numbers entered by user. Flowchart Exercise
  • 11.
    Find whether enterednumber is prime or not Flowchart Exercise
  • 12.
  • 13.
  • 14.