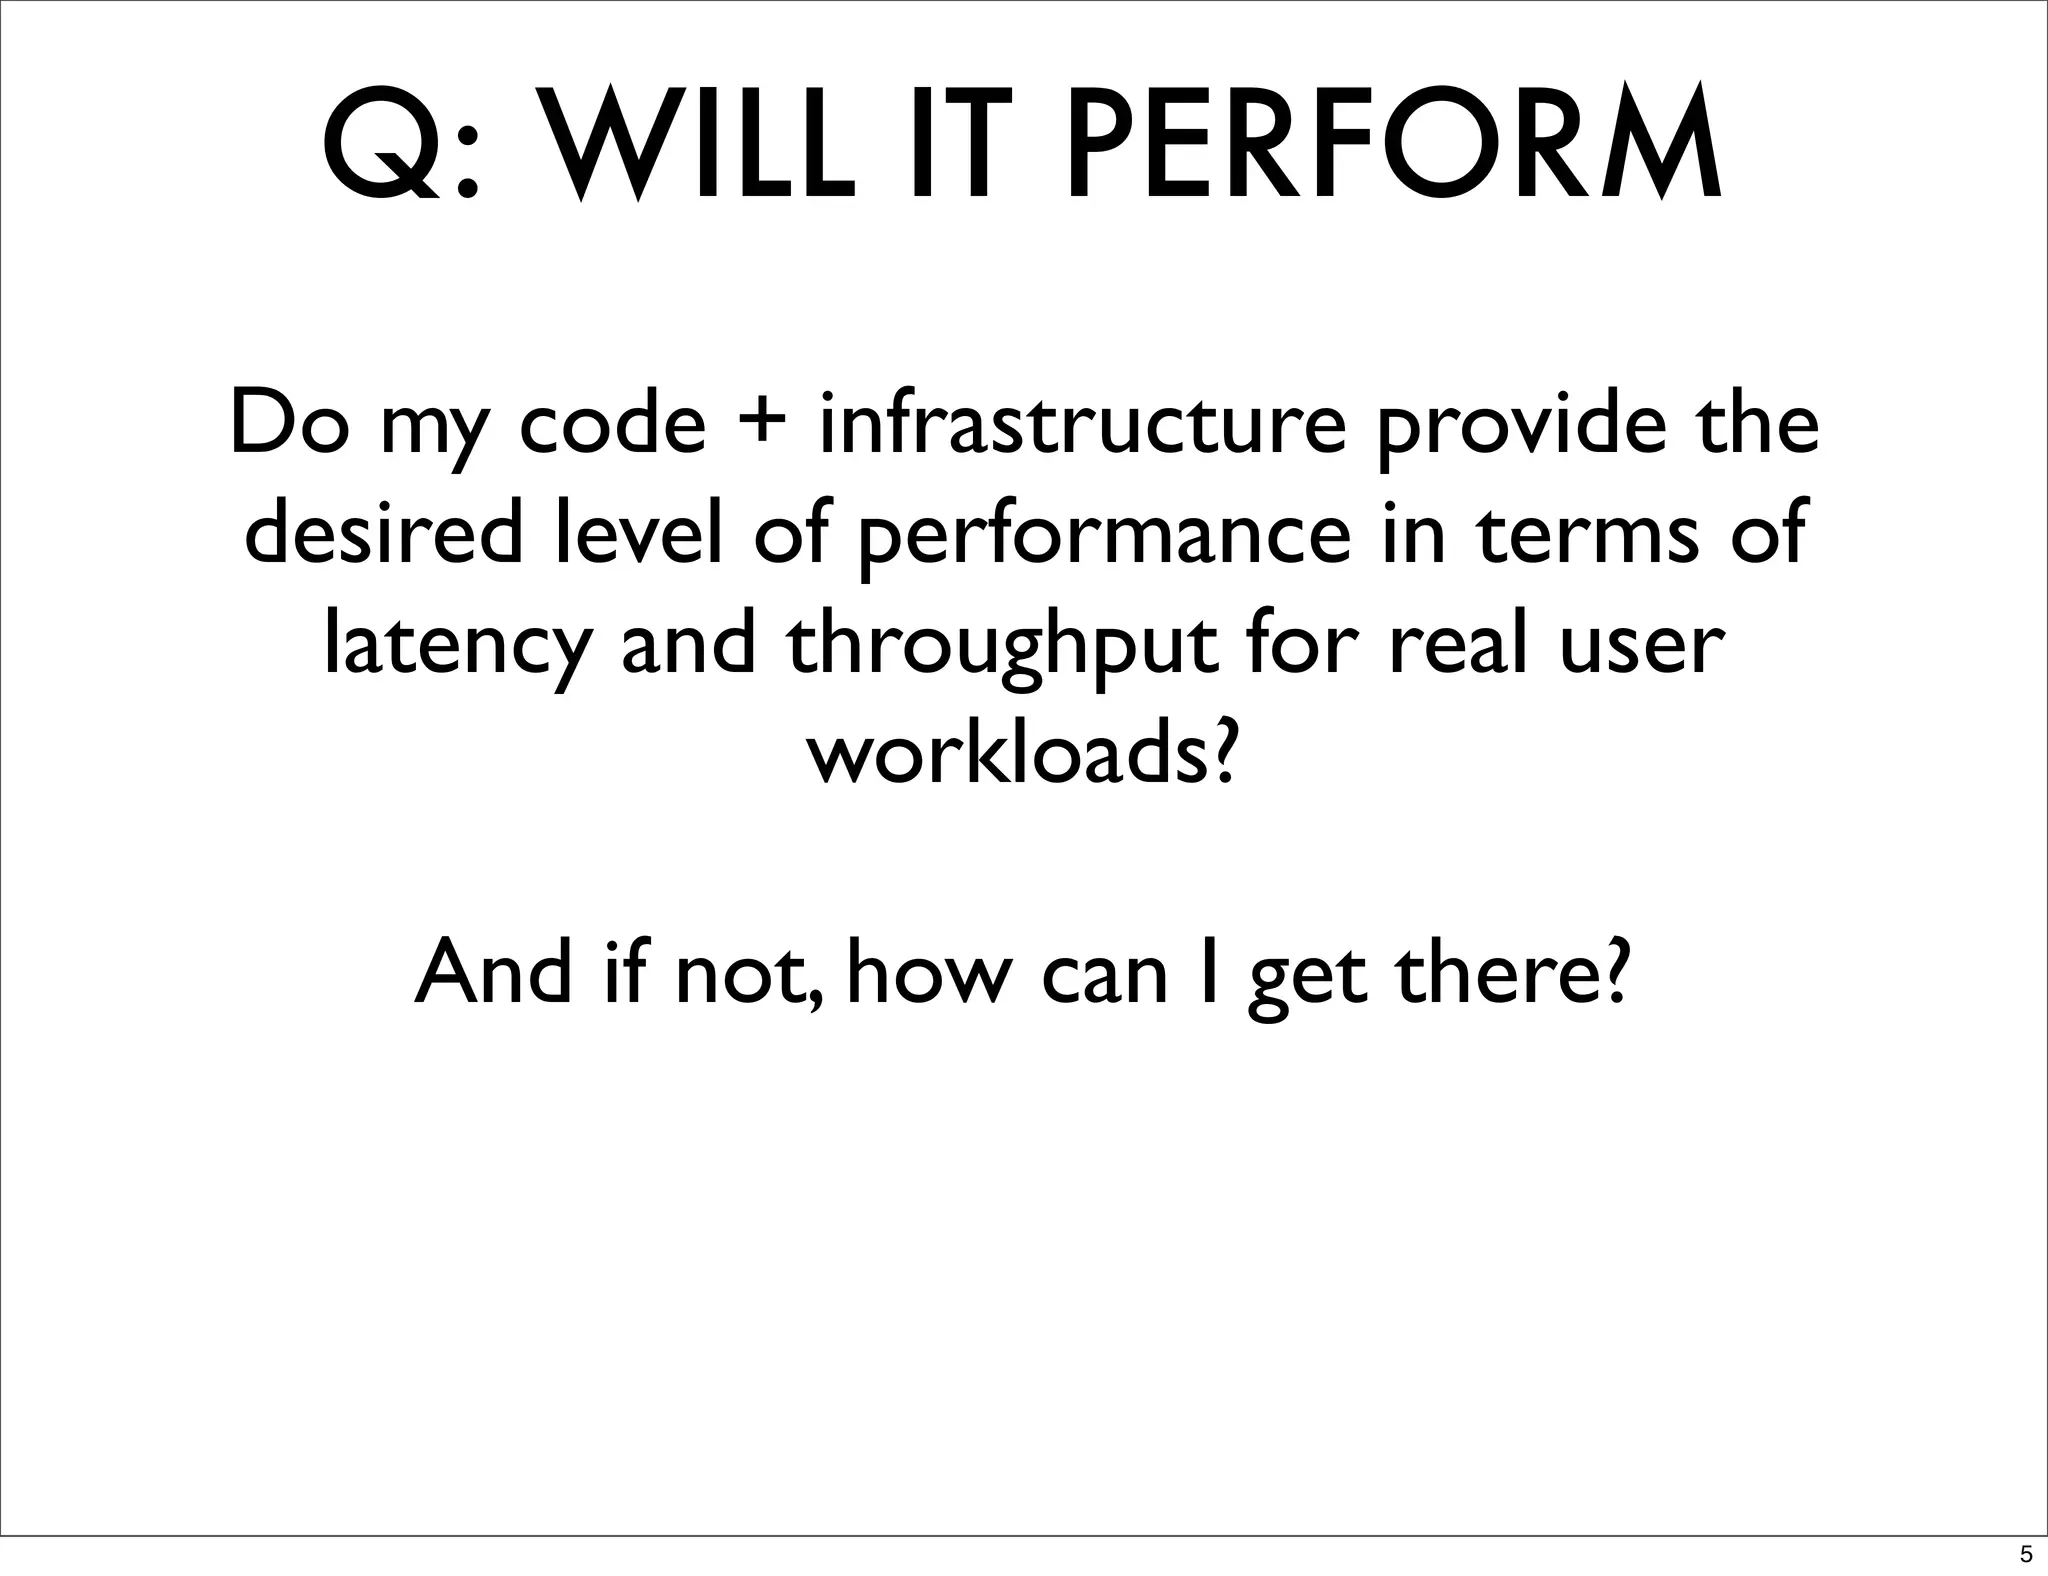
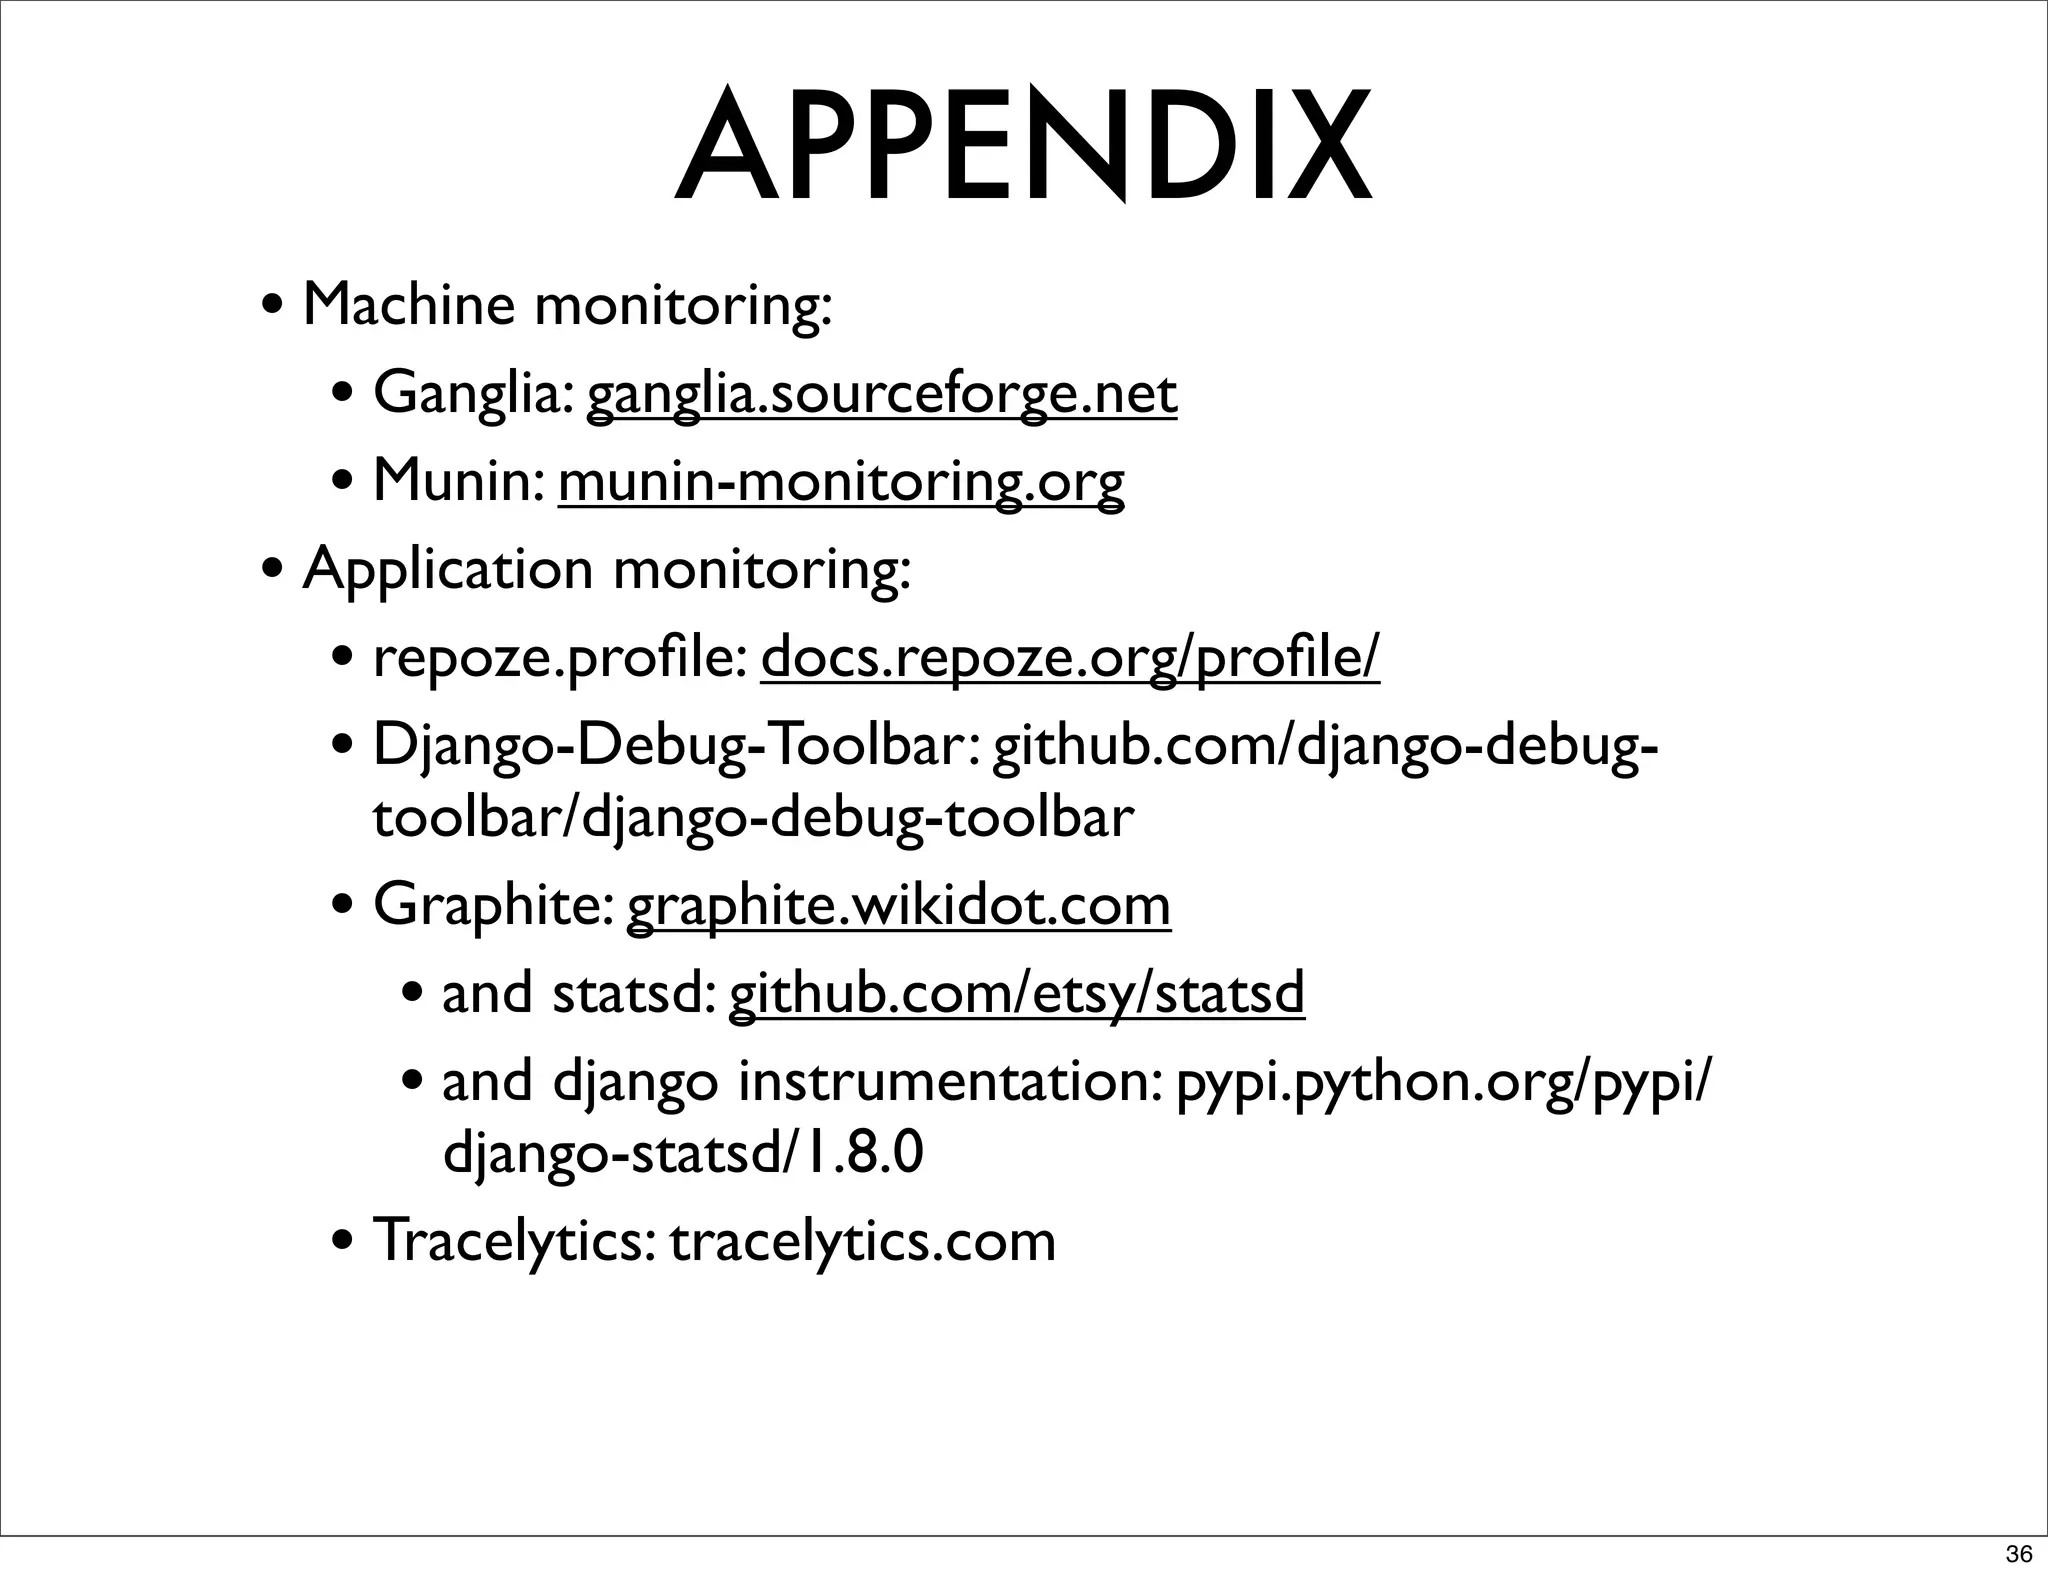
Downloaded 61 times


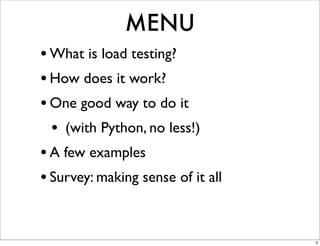
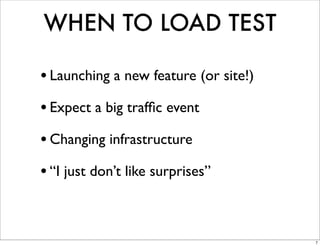


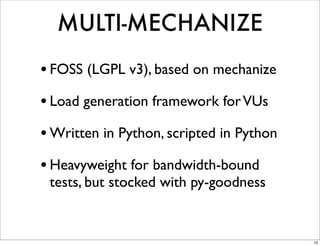
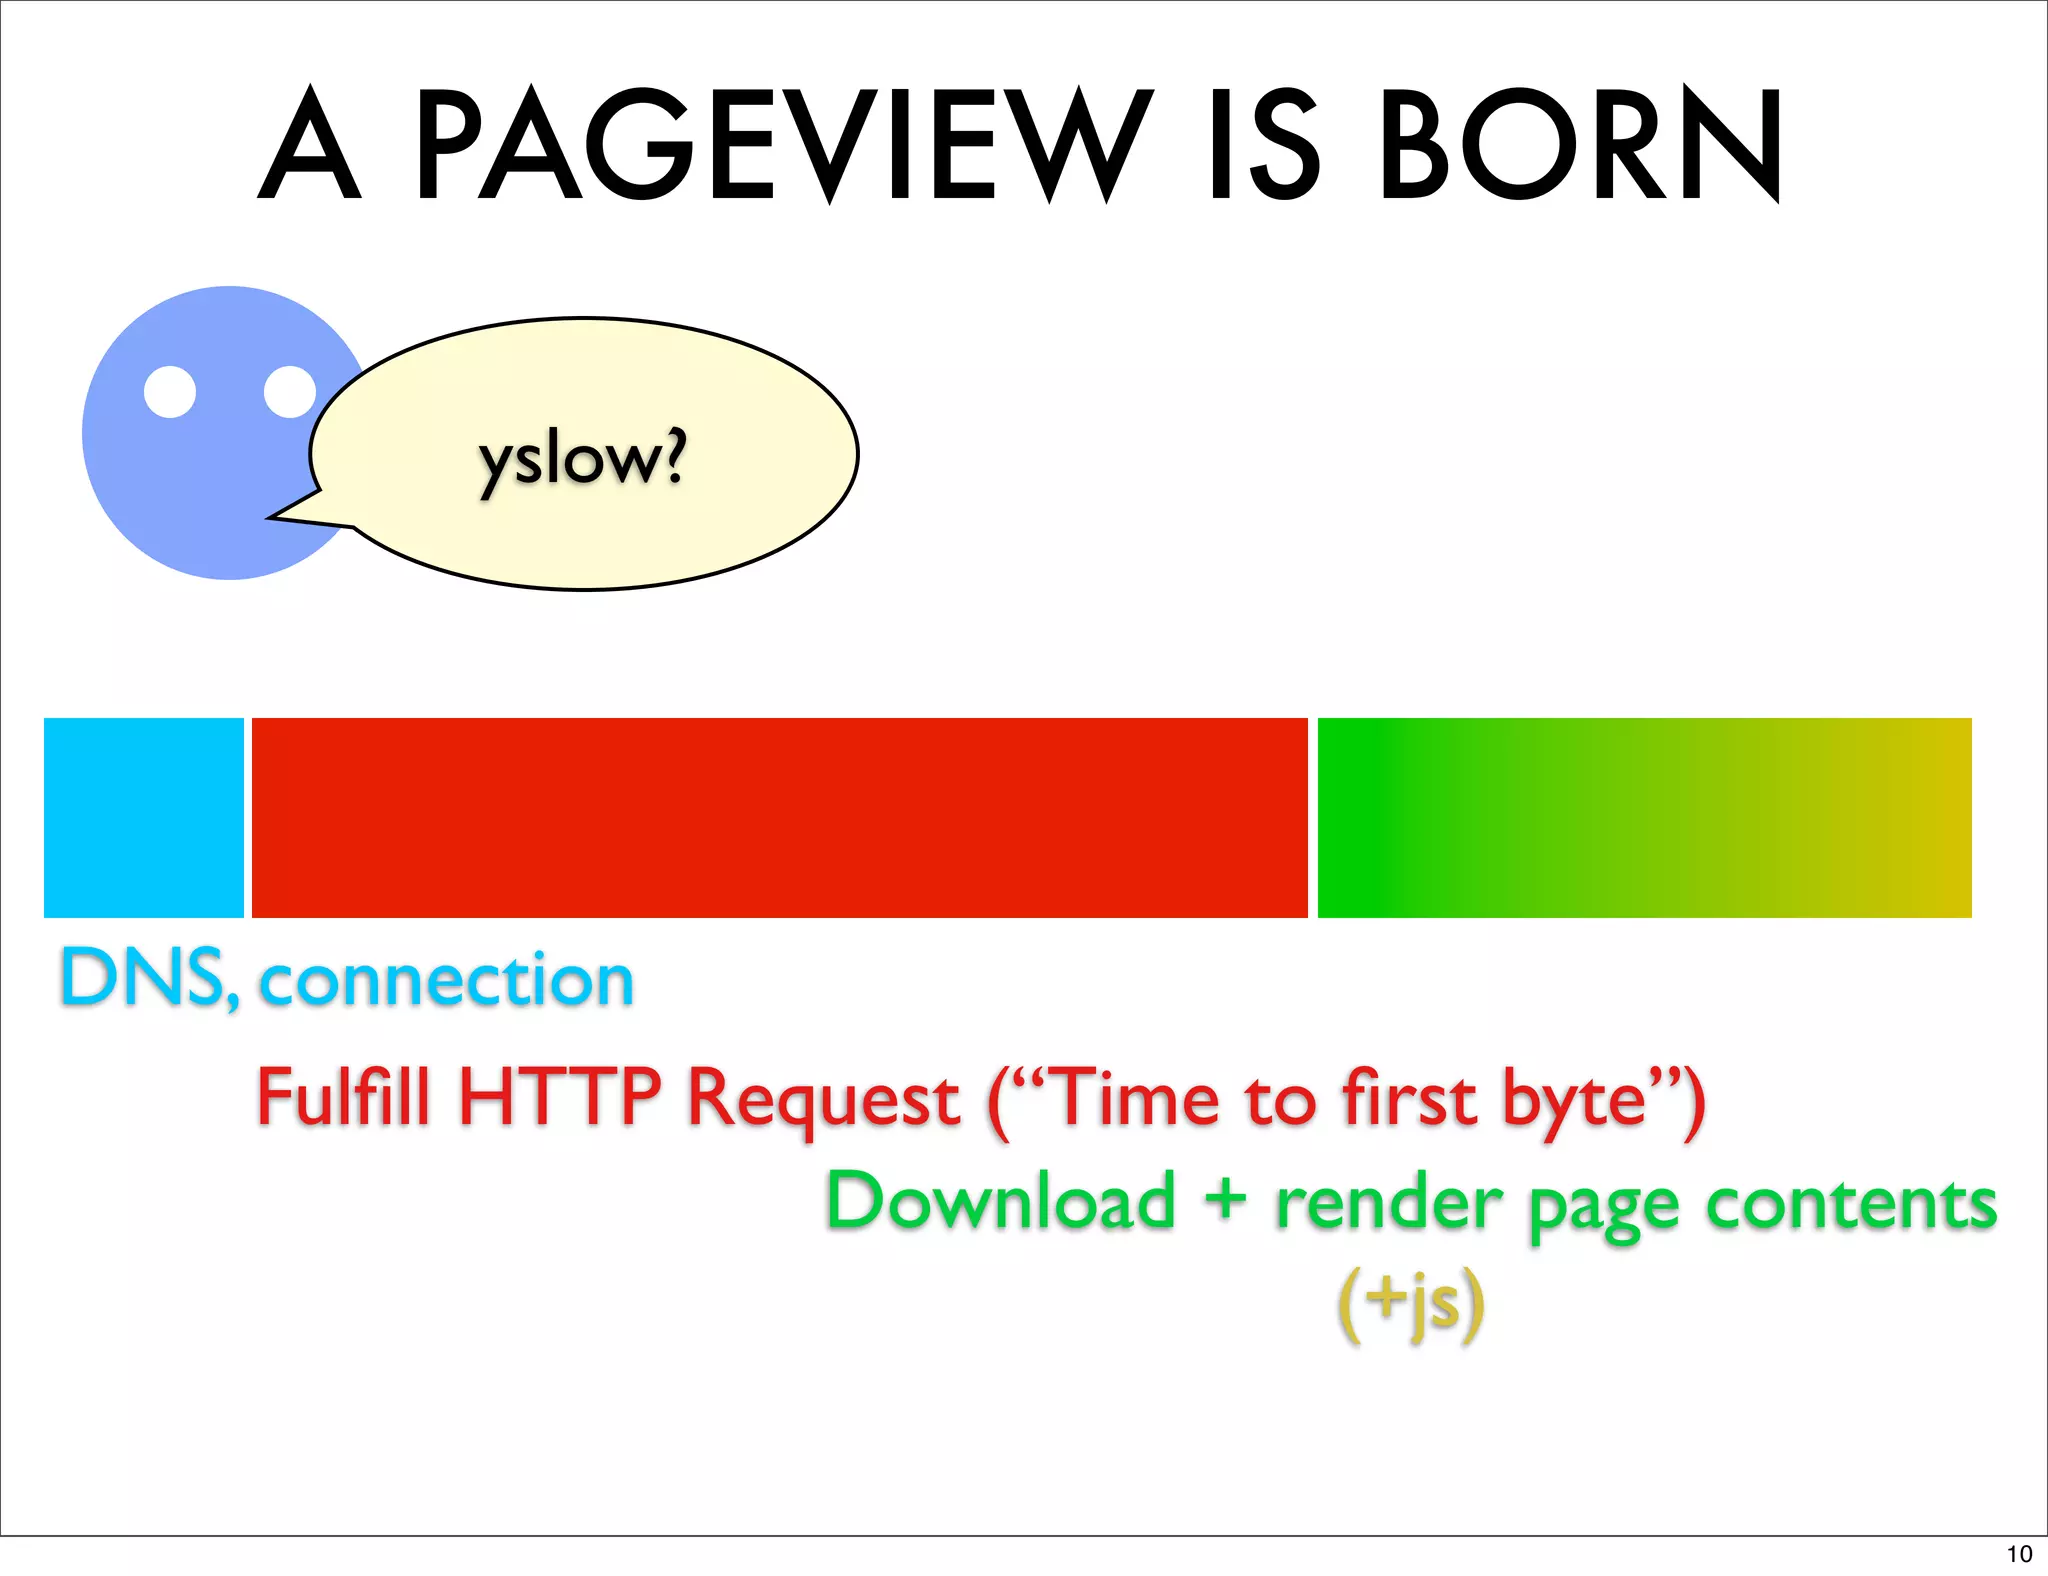
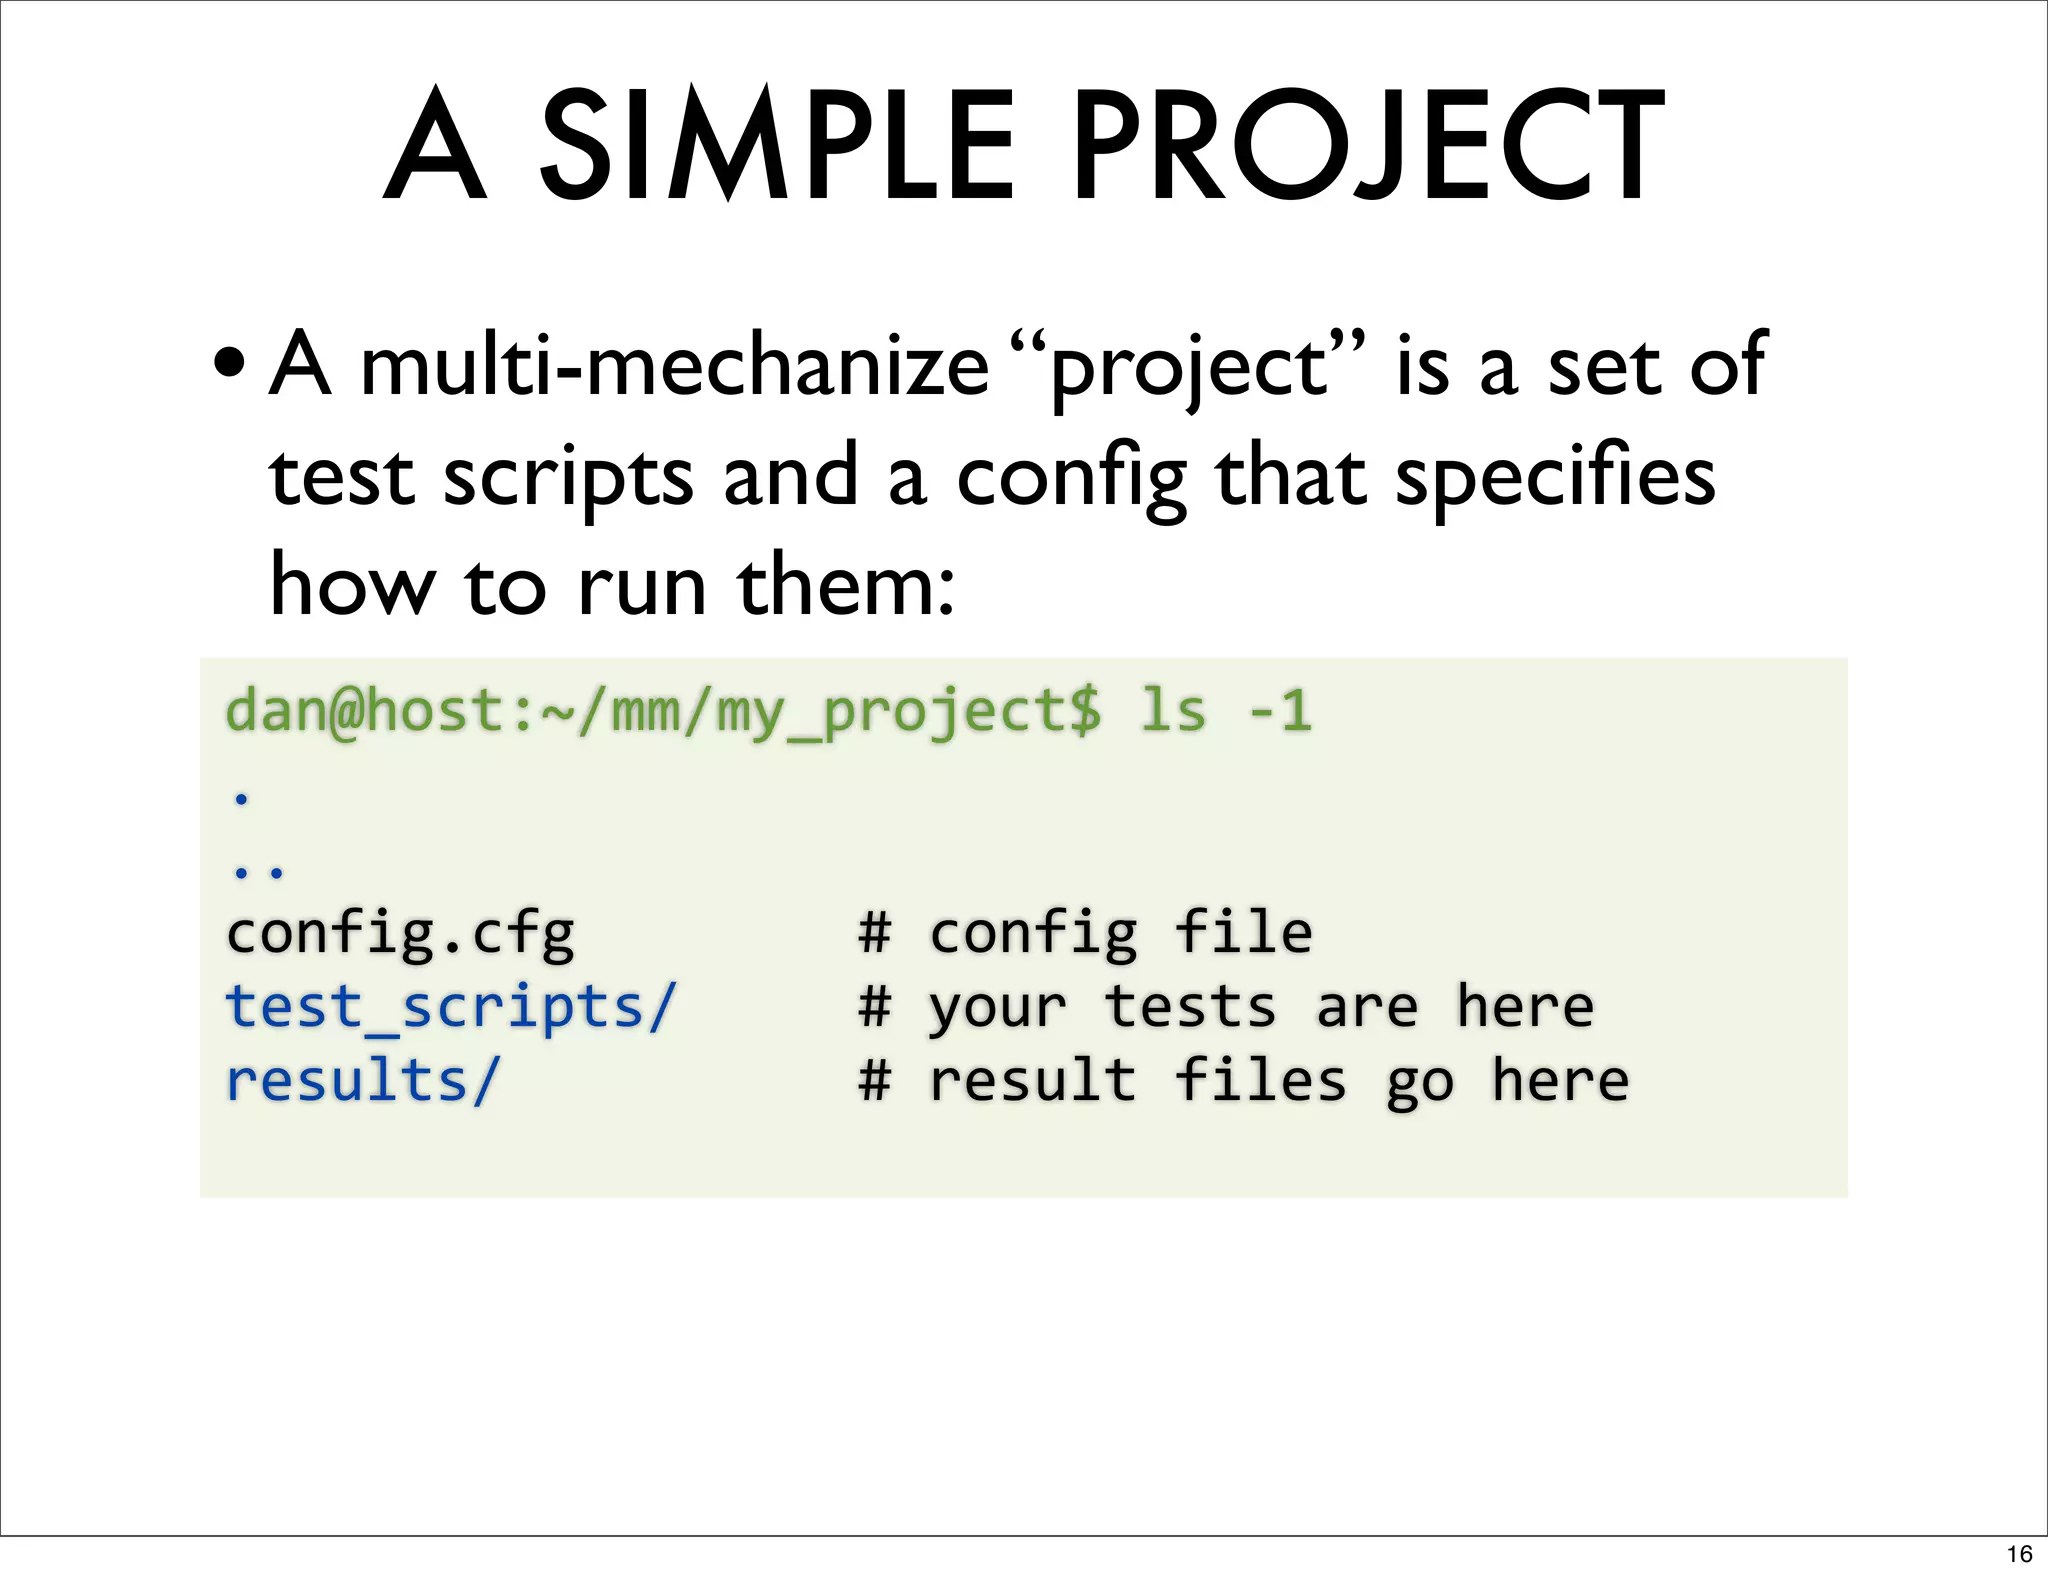
![A SIMPLE PROJECT
config.cfg
[global]
run_time:
60
rampup:
60
results_ts_interval:
60
console_logging:
off
progress_bar:
on
[user_group-‐1]
threads:
25
script:
get_index.py
17](https://image.slidesharecdn.com/webperfpygotham-120609101019-phpapp02/85/Python-Load-Testing-Pygotham-2012-17-320.jpg)
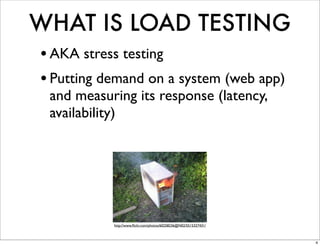
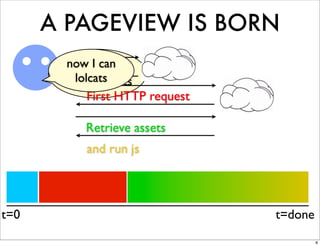
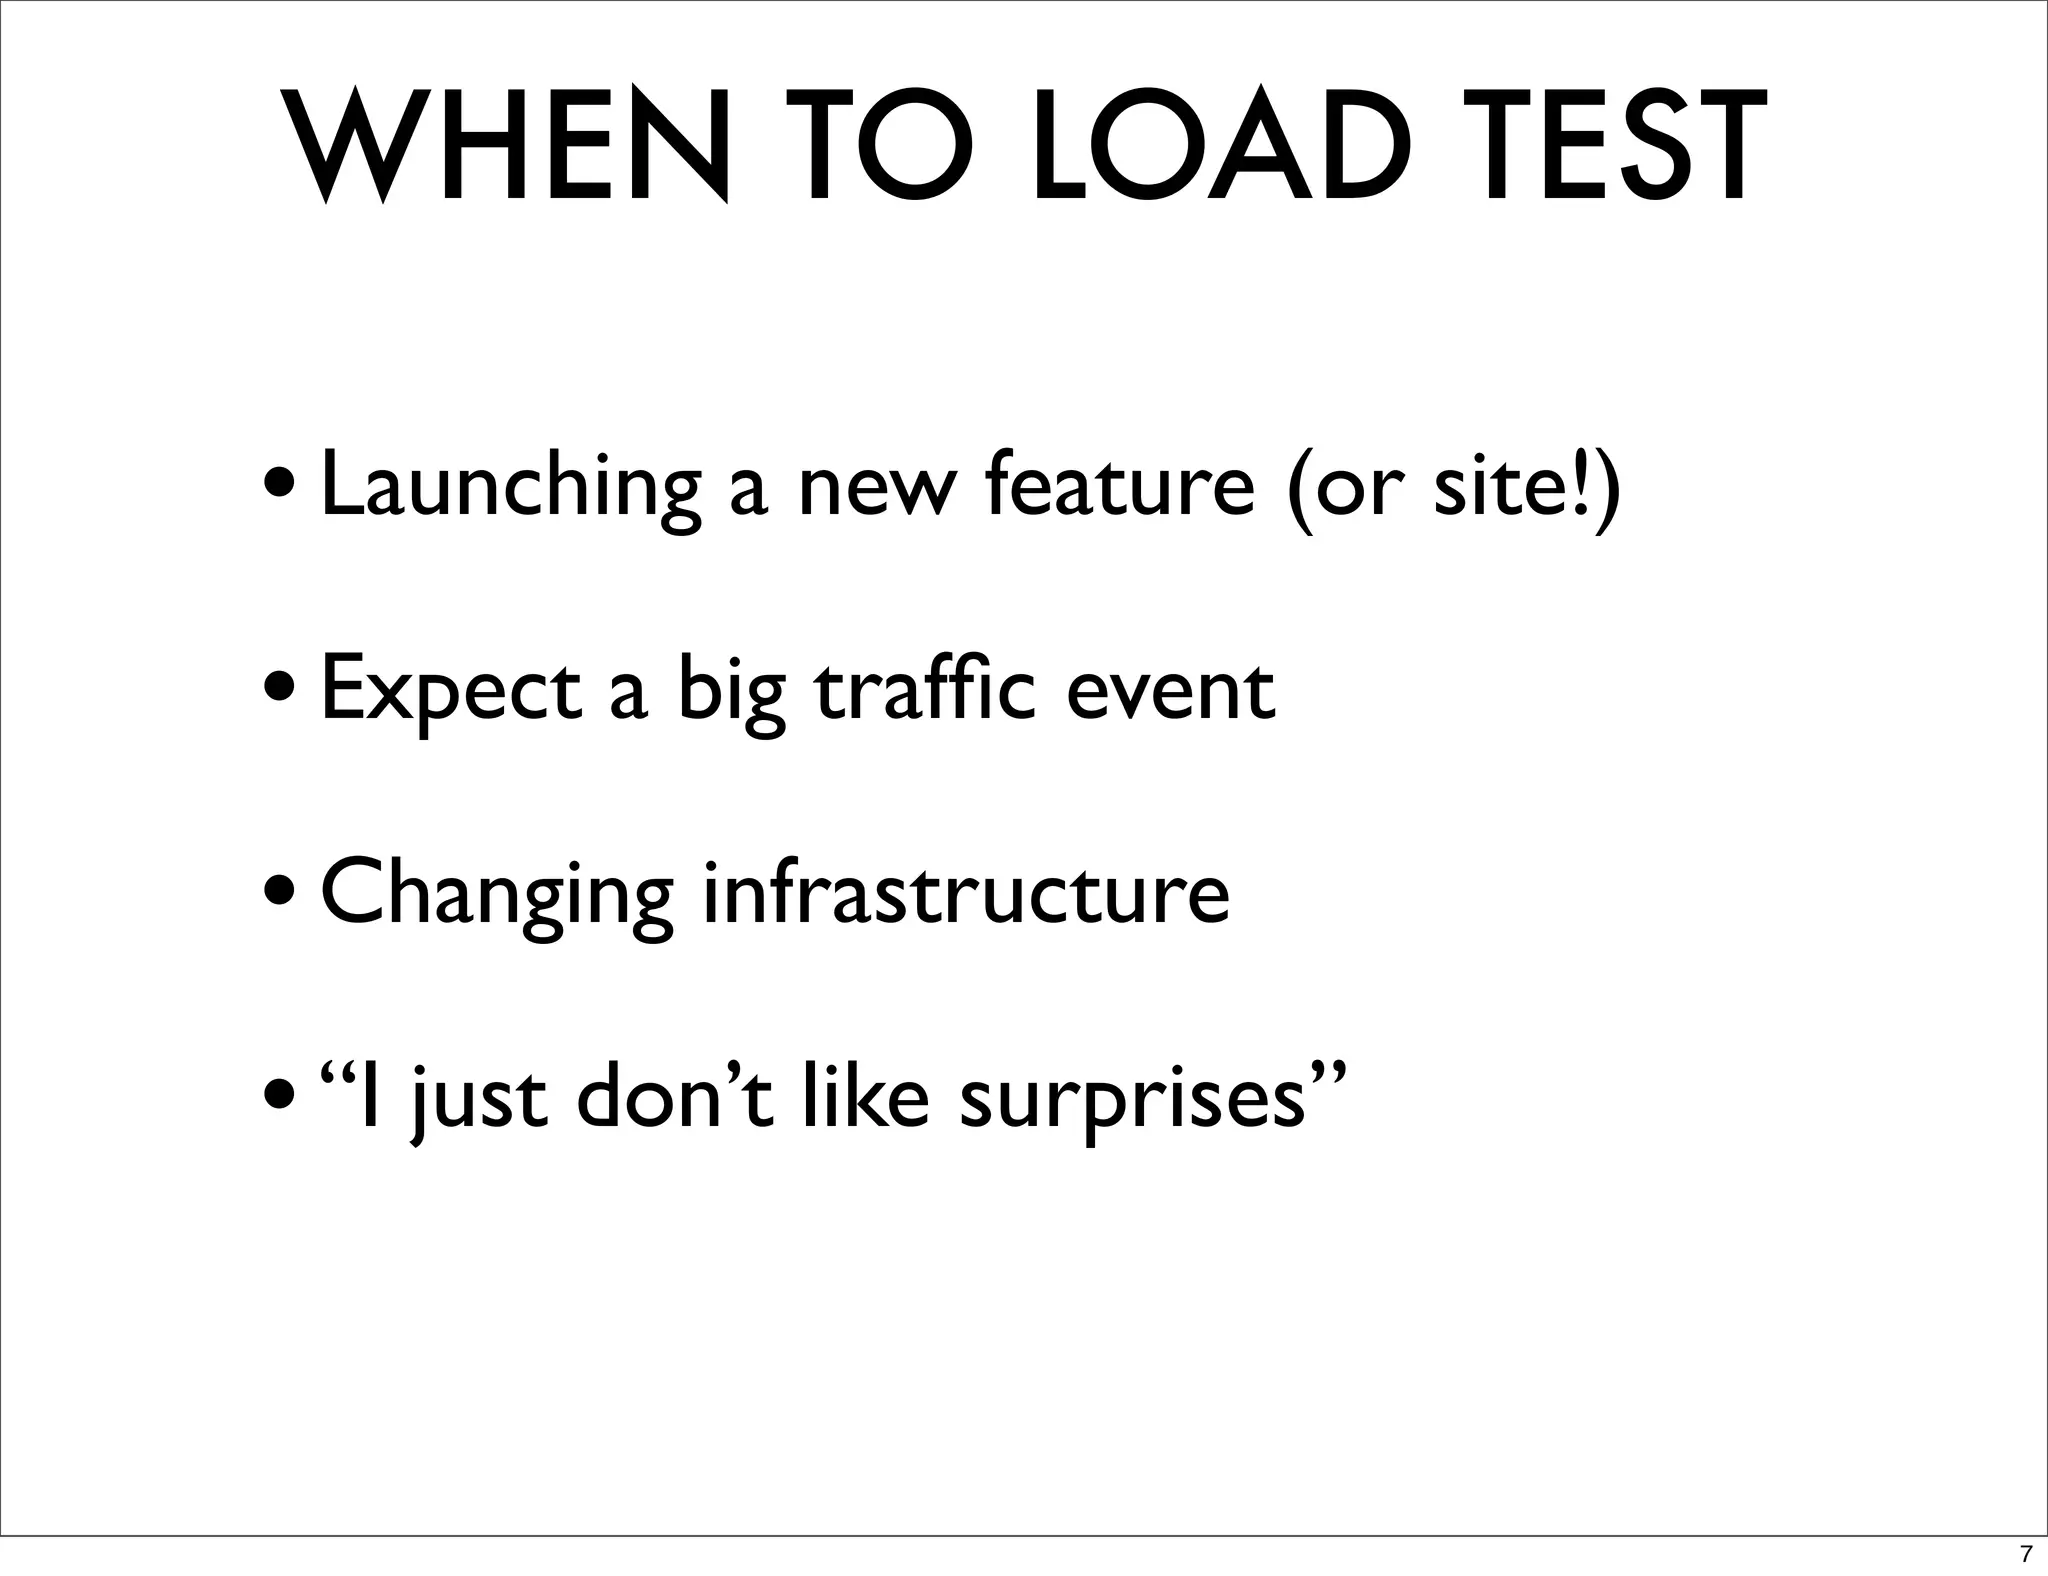
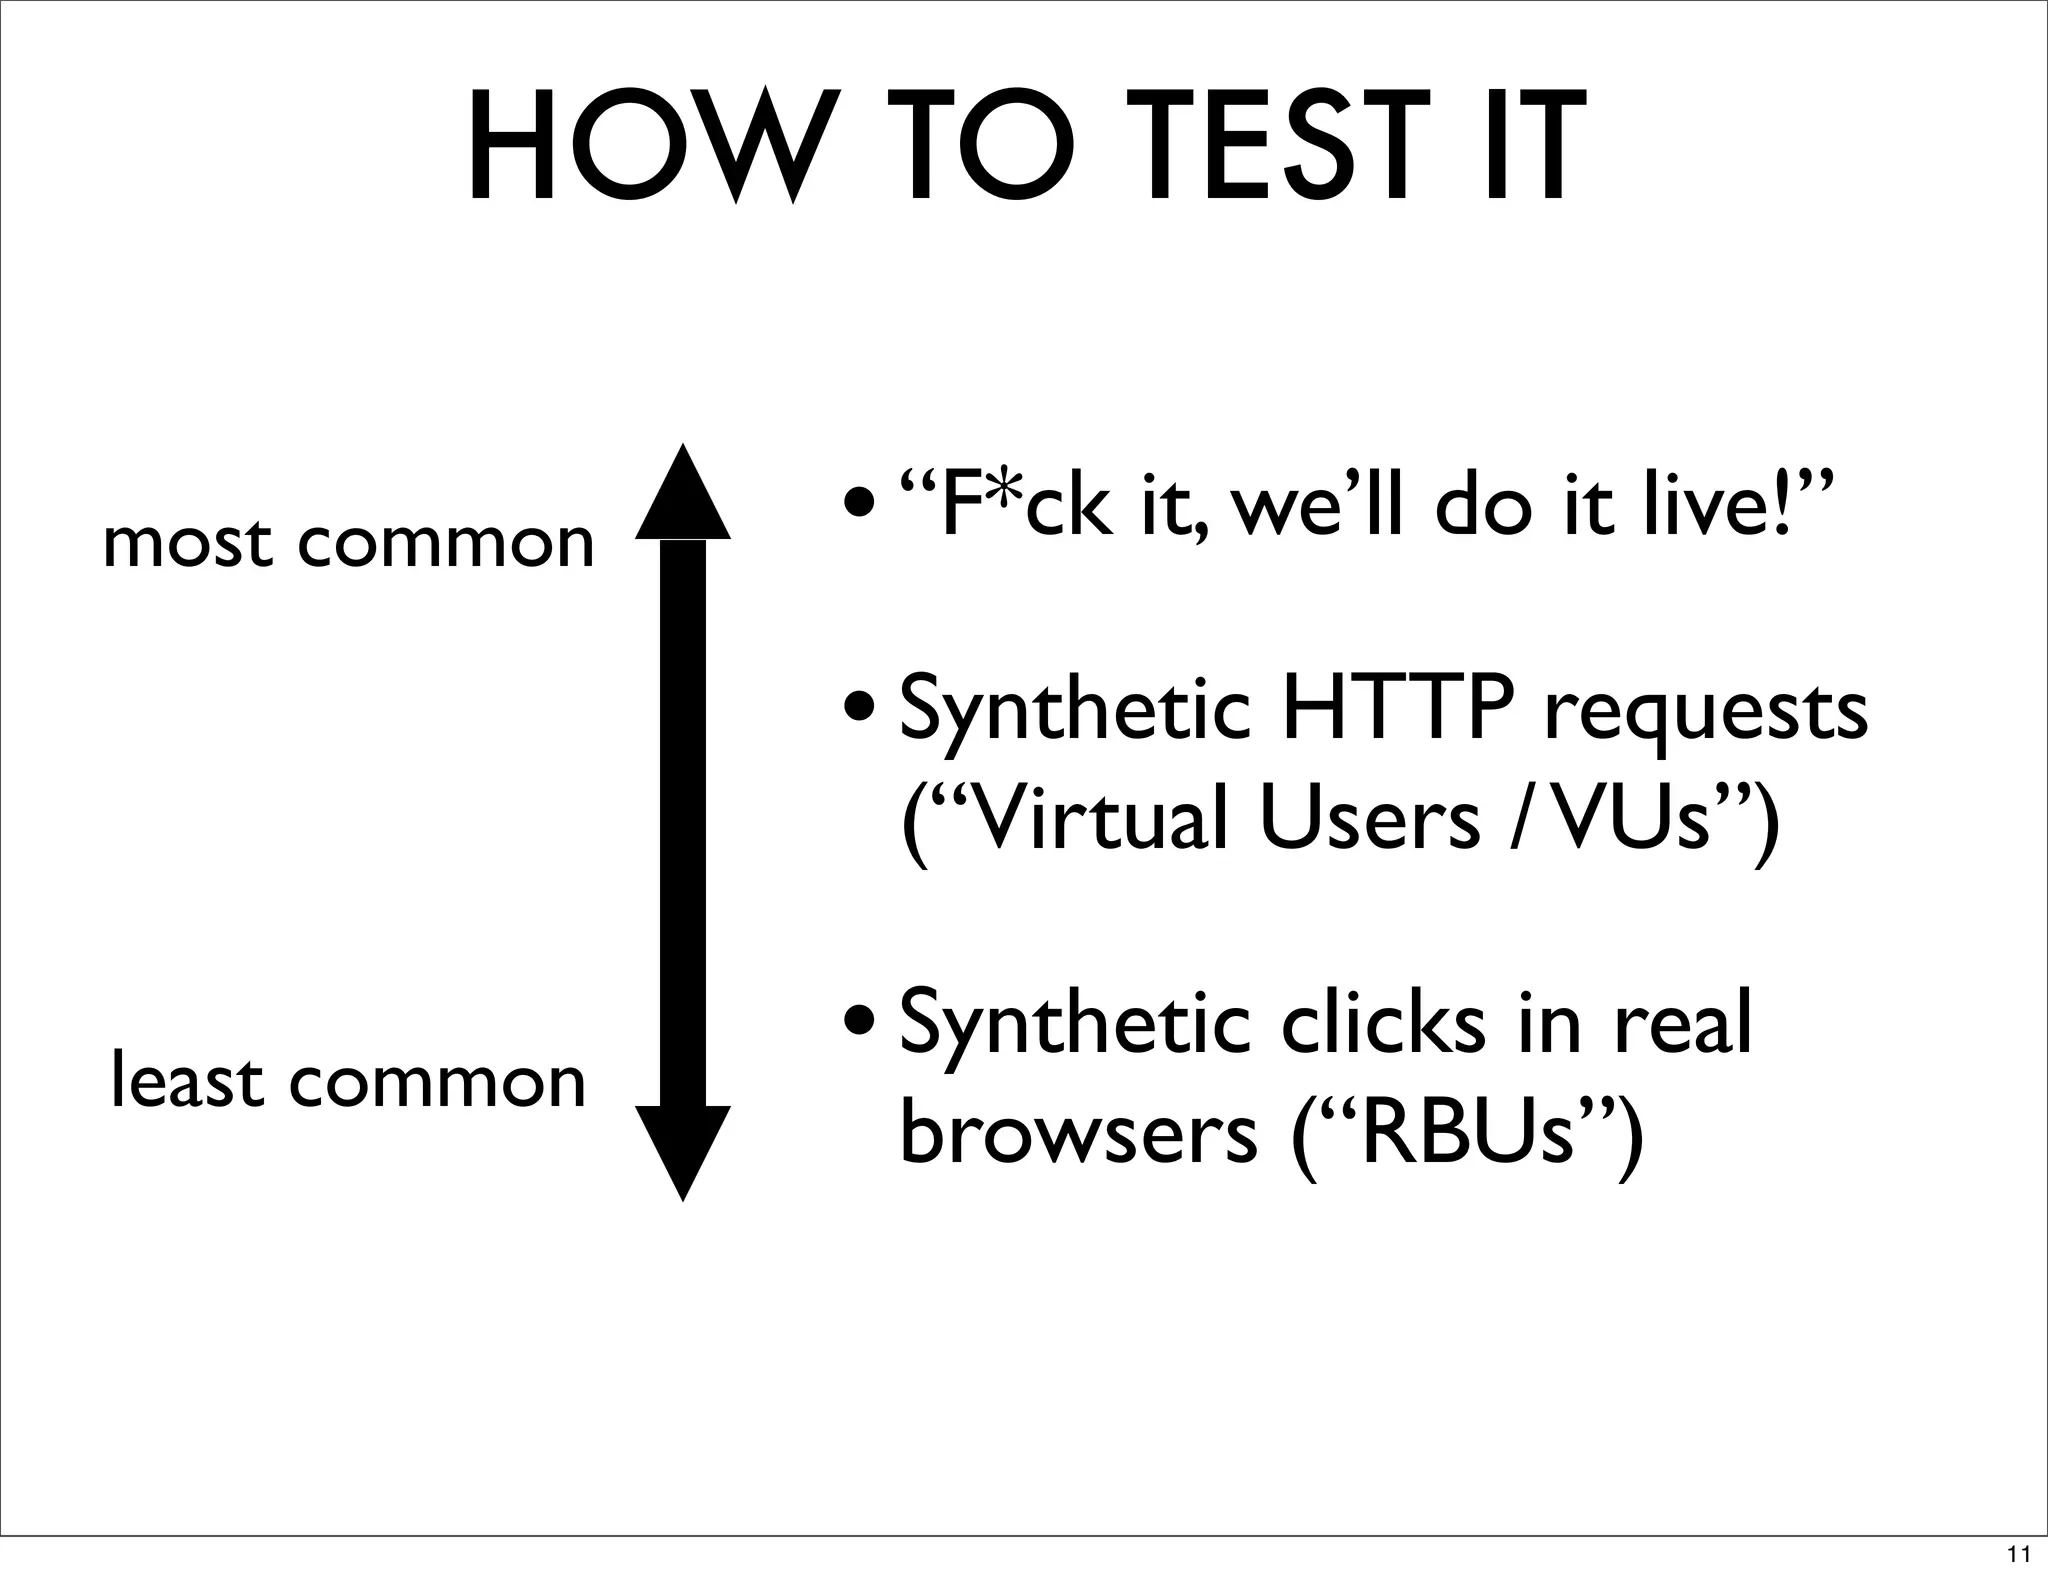
![A FEW M-M FEATURES
features.py
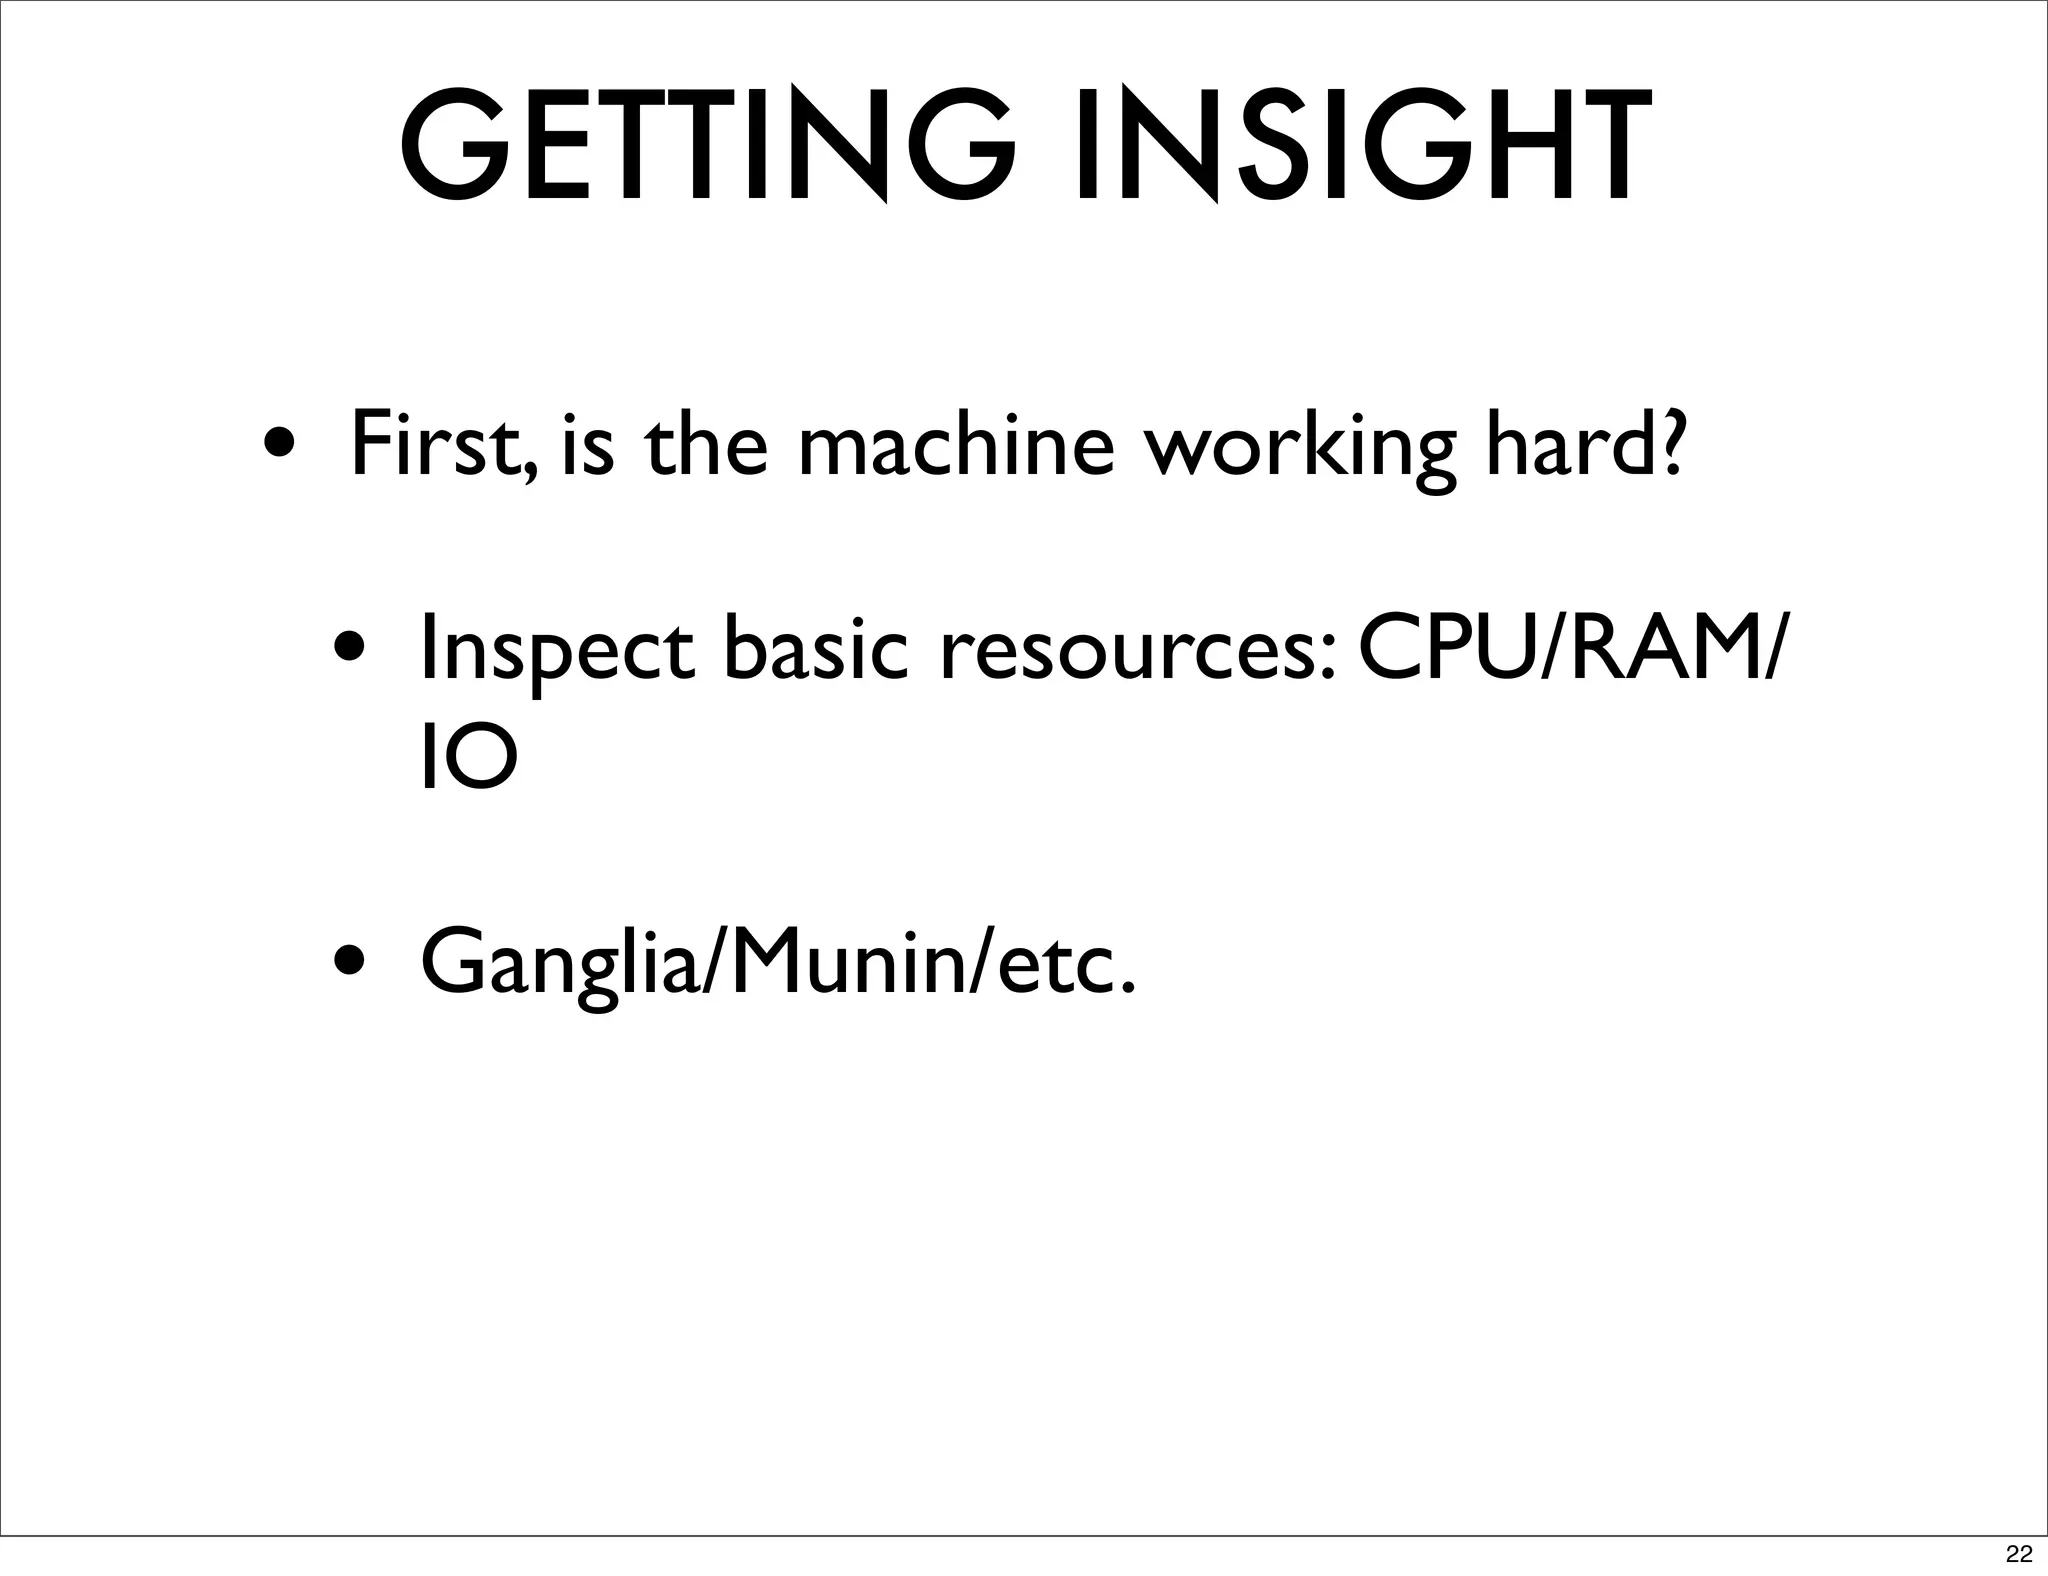
import
requests
import
time
class
Transaction(object):
def
run(self):
r
=
requests.get(‘http://website.com/a’)
r.raw.read()
assert
(r.status_code
==
200),
‘not
200’
assert
(‘Error’
not
in
r.text)
t1
=
time.time()
r
=
requests.get(‘http://website.com/b’)
r.raw.read()
latency
=
time.time()
-‐
t1
self.custom_timers[‘b’]
=
latency
18](https://image.slidesharecdn.com/webperfpygotham-120609101019-phpapp02/85/Python-Load-Testing-Pygotham-2012-18-320.jpg)
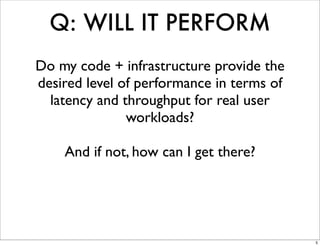
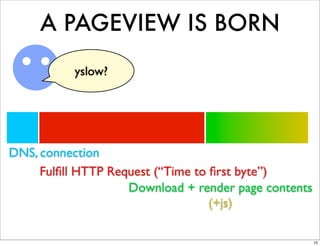
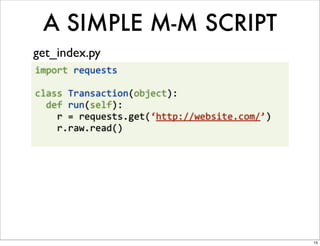
![[
$
multimech-‐run
example
]
19](https://image.slidesharecdn.com/webperfpygotham-120609101019-phpapp02/85/Python-Load-Testing-Pygotham-2012-19-320.jpg)
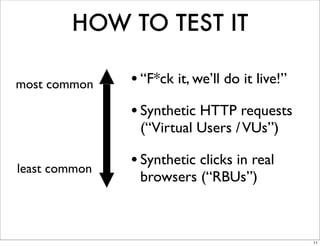
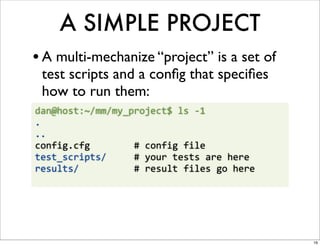
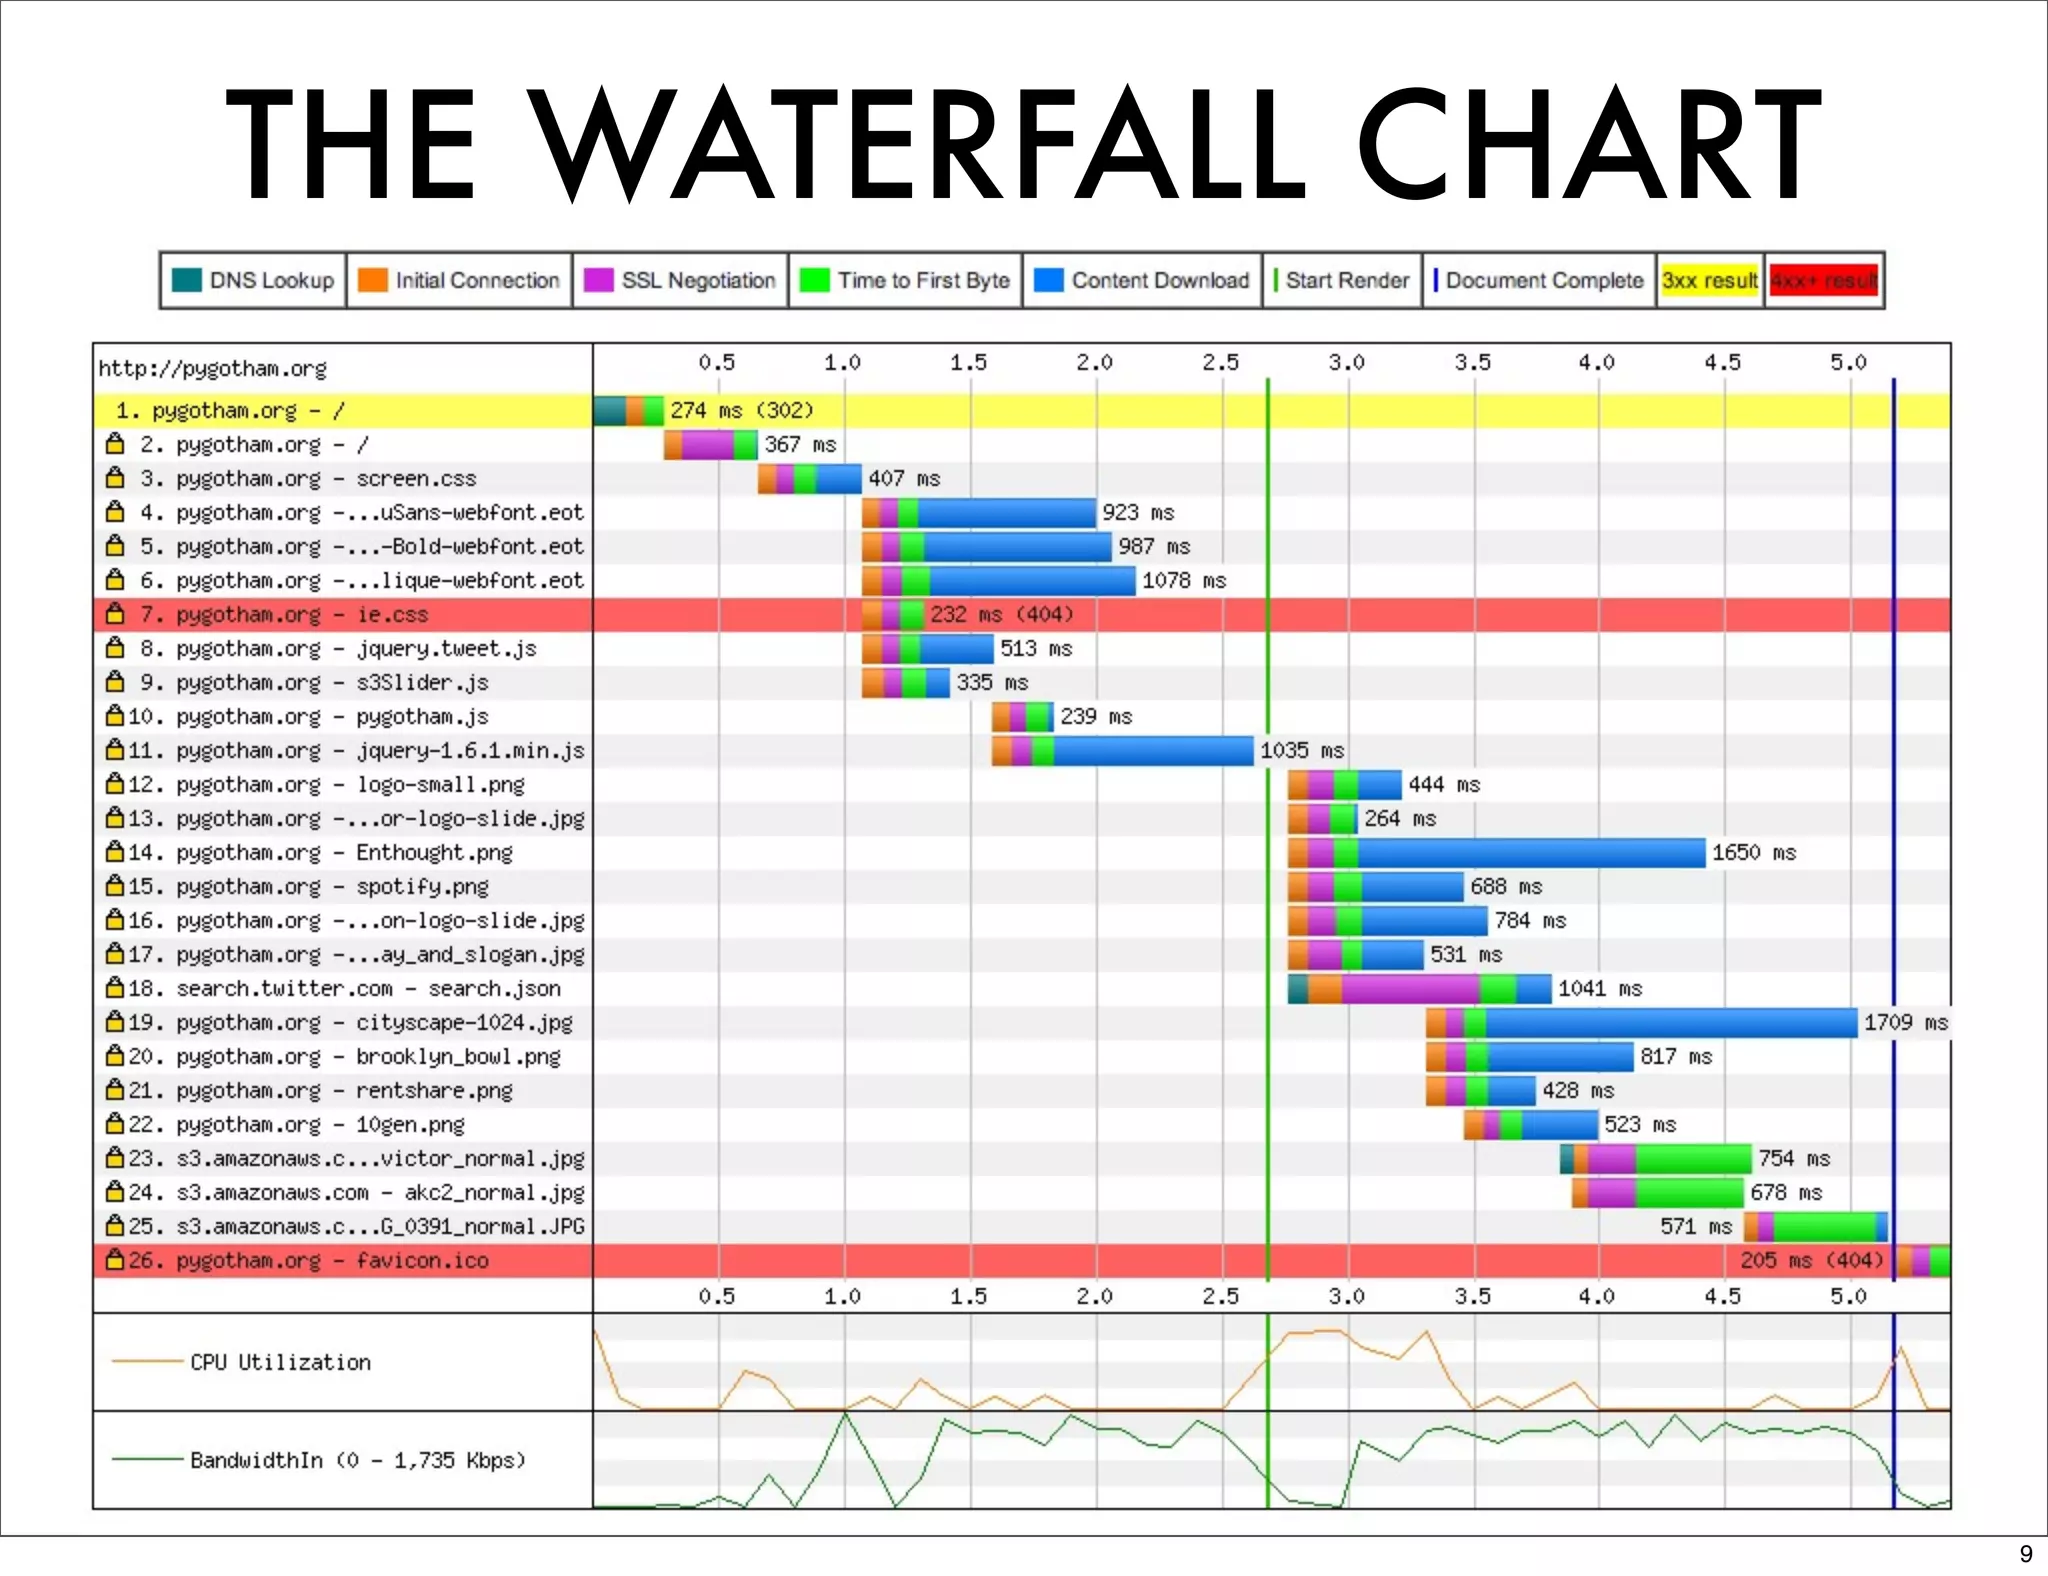
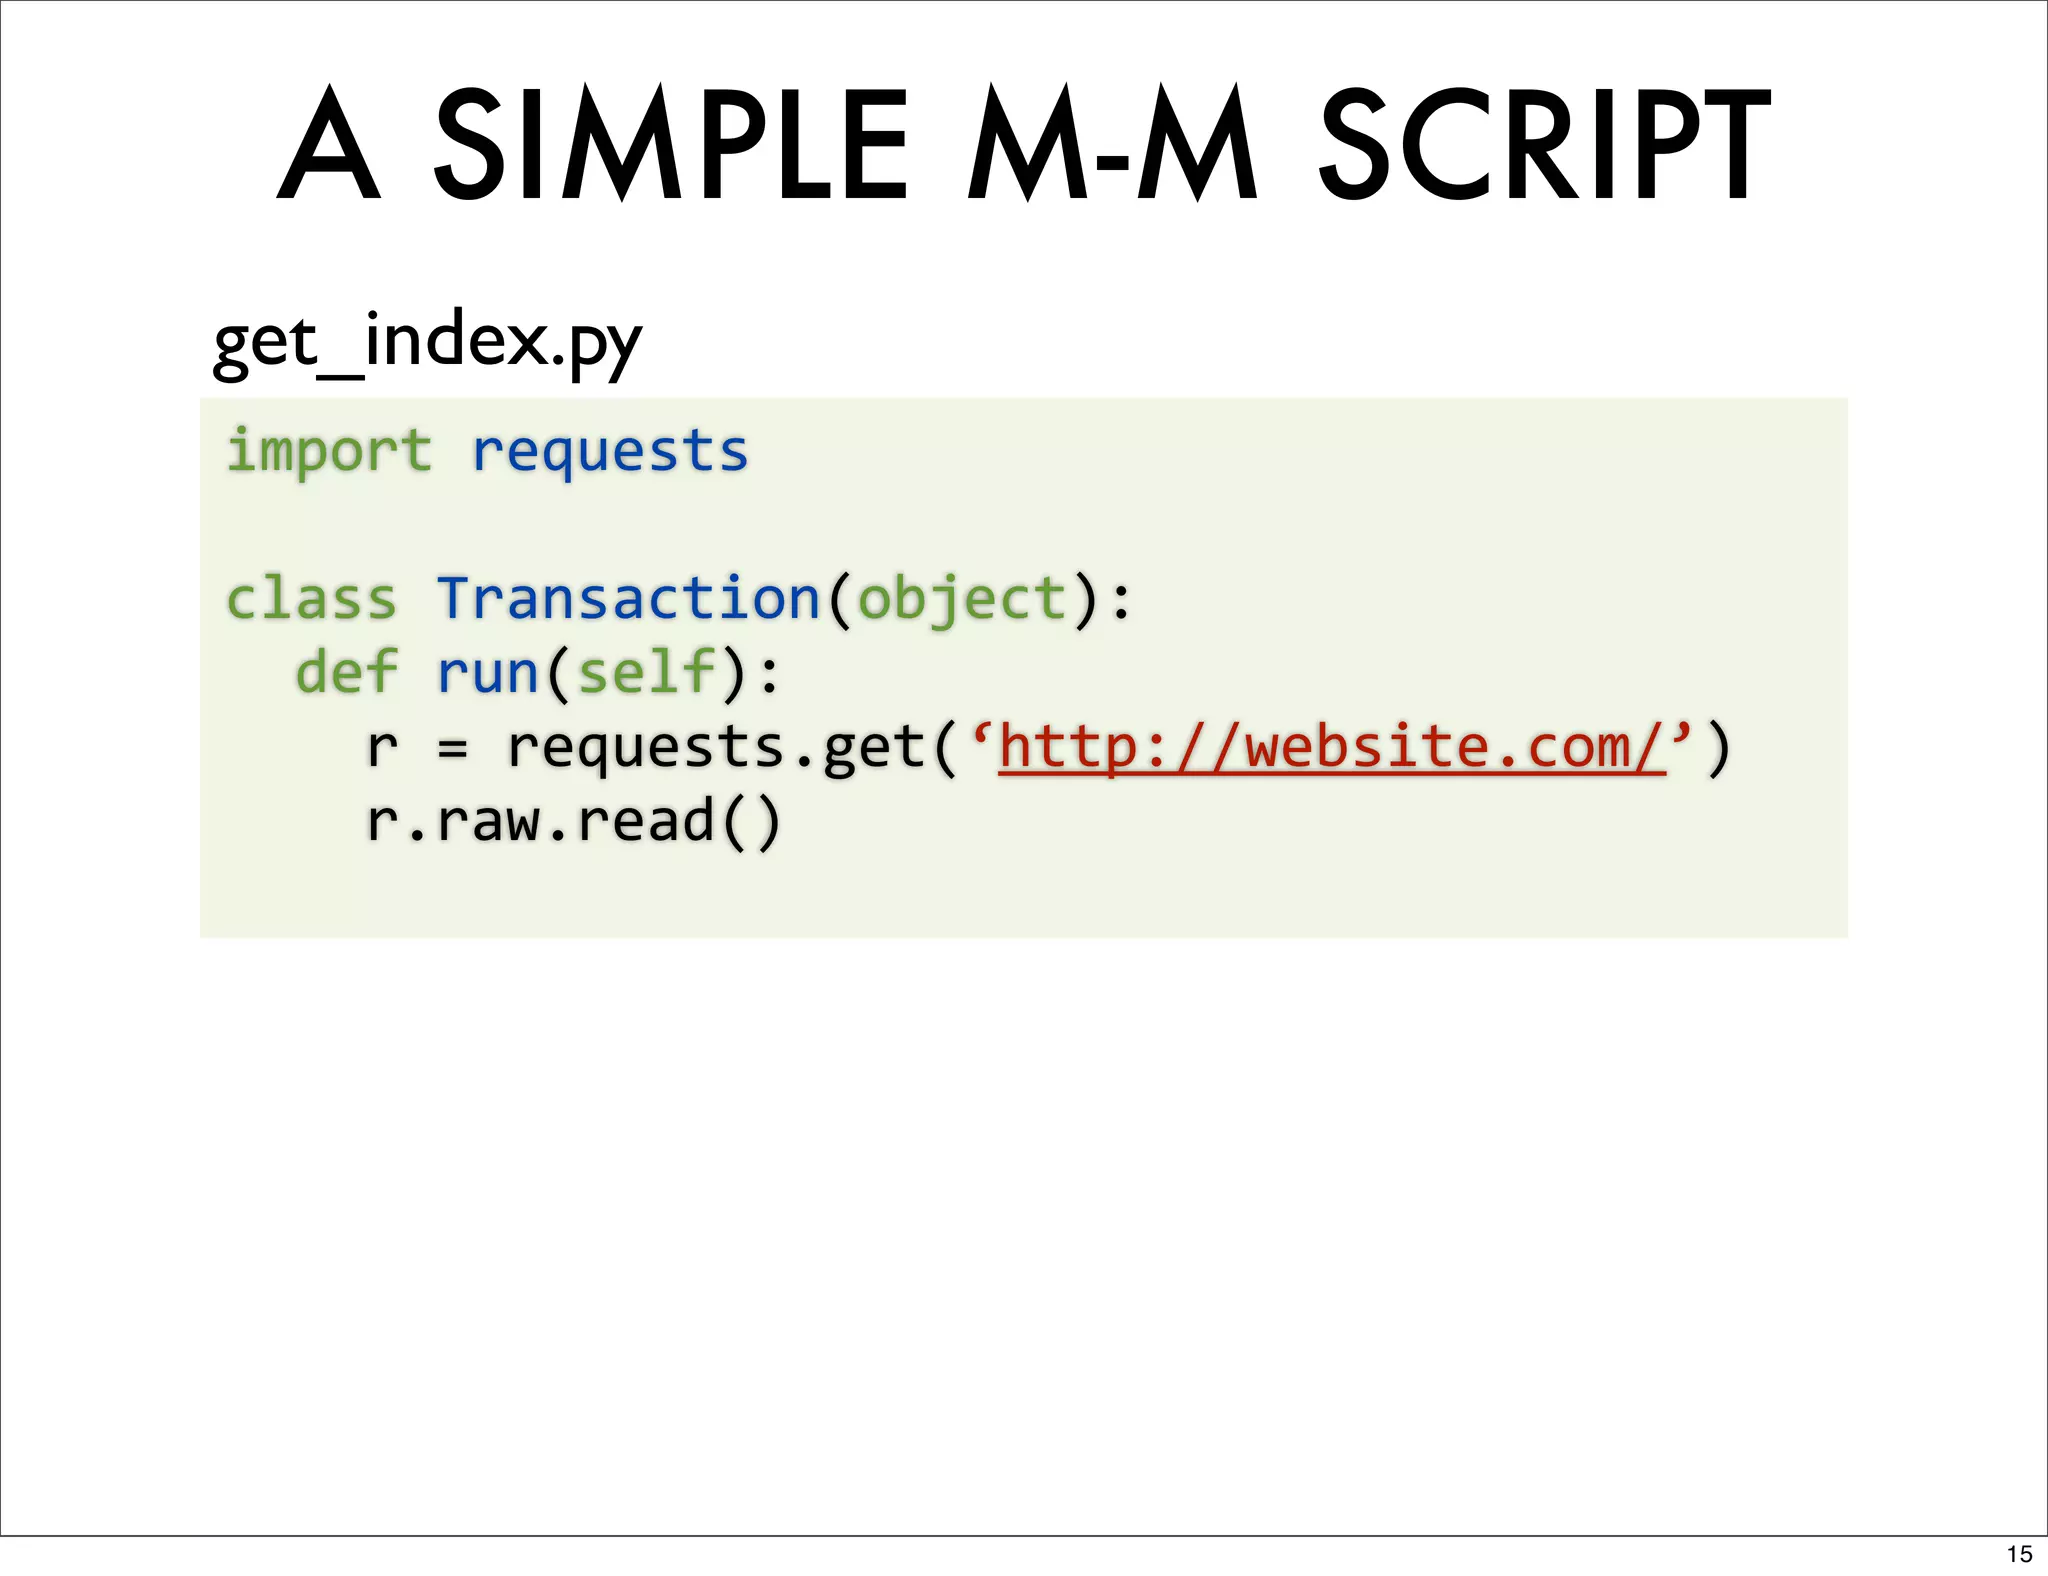
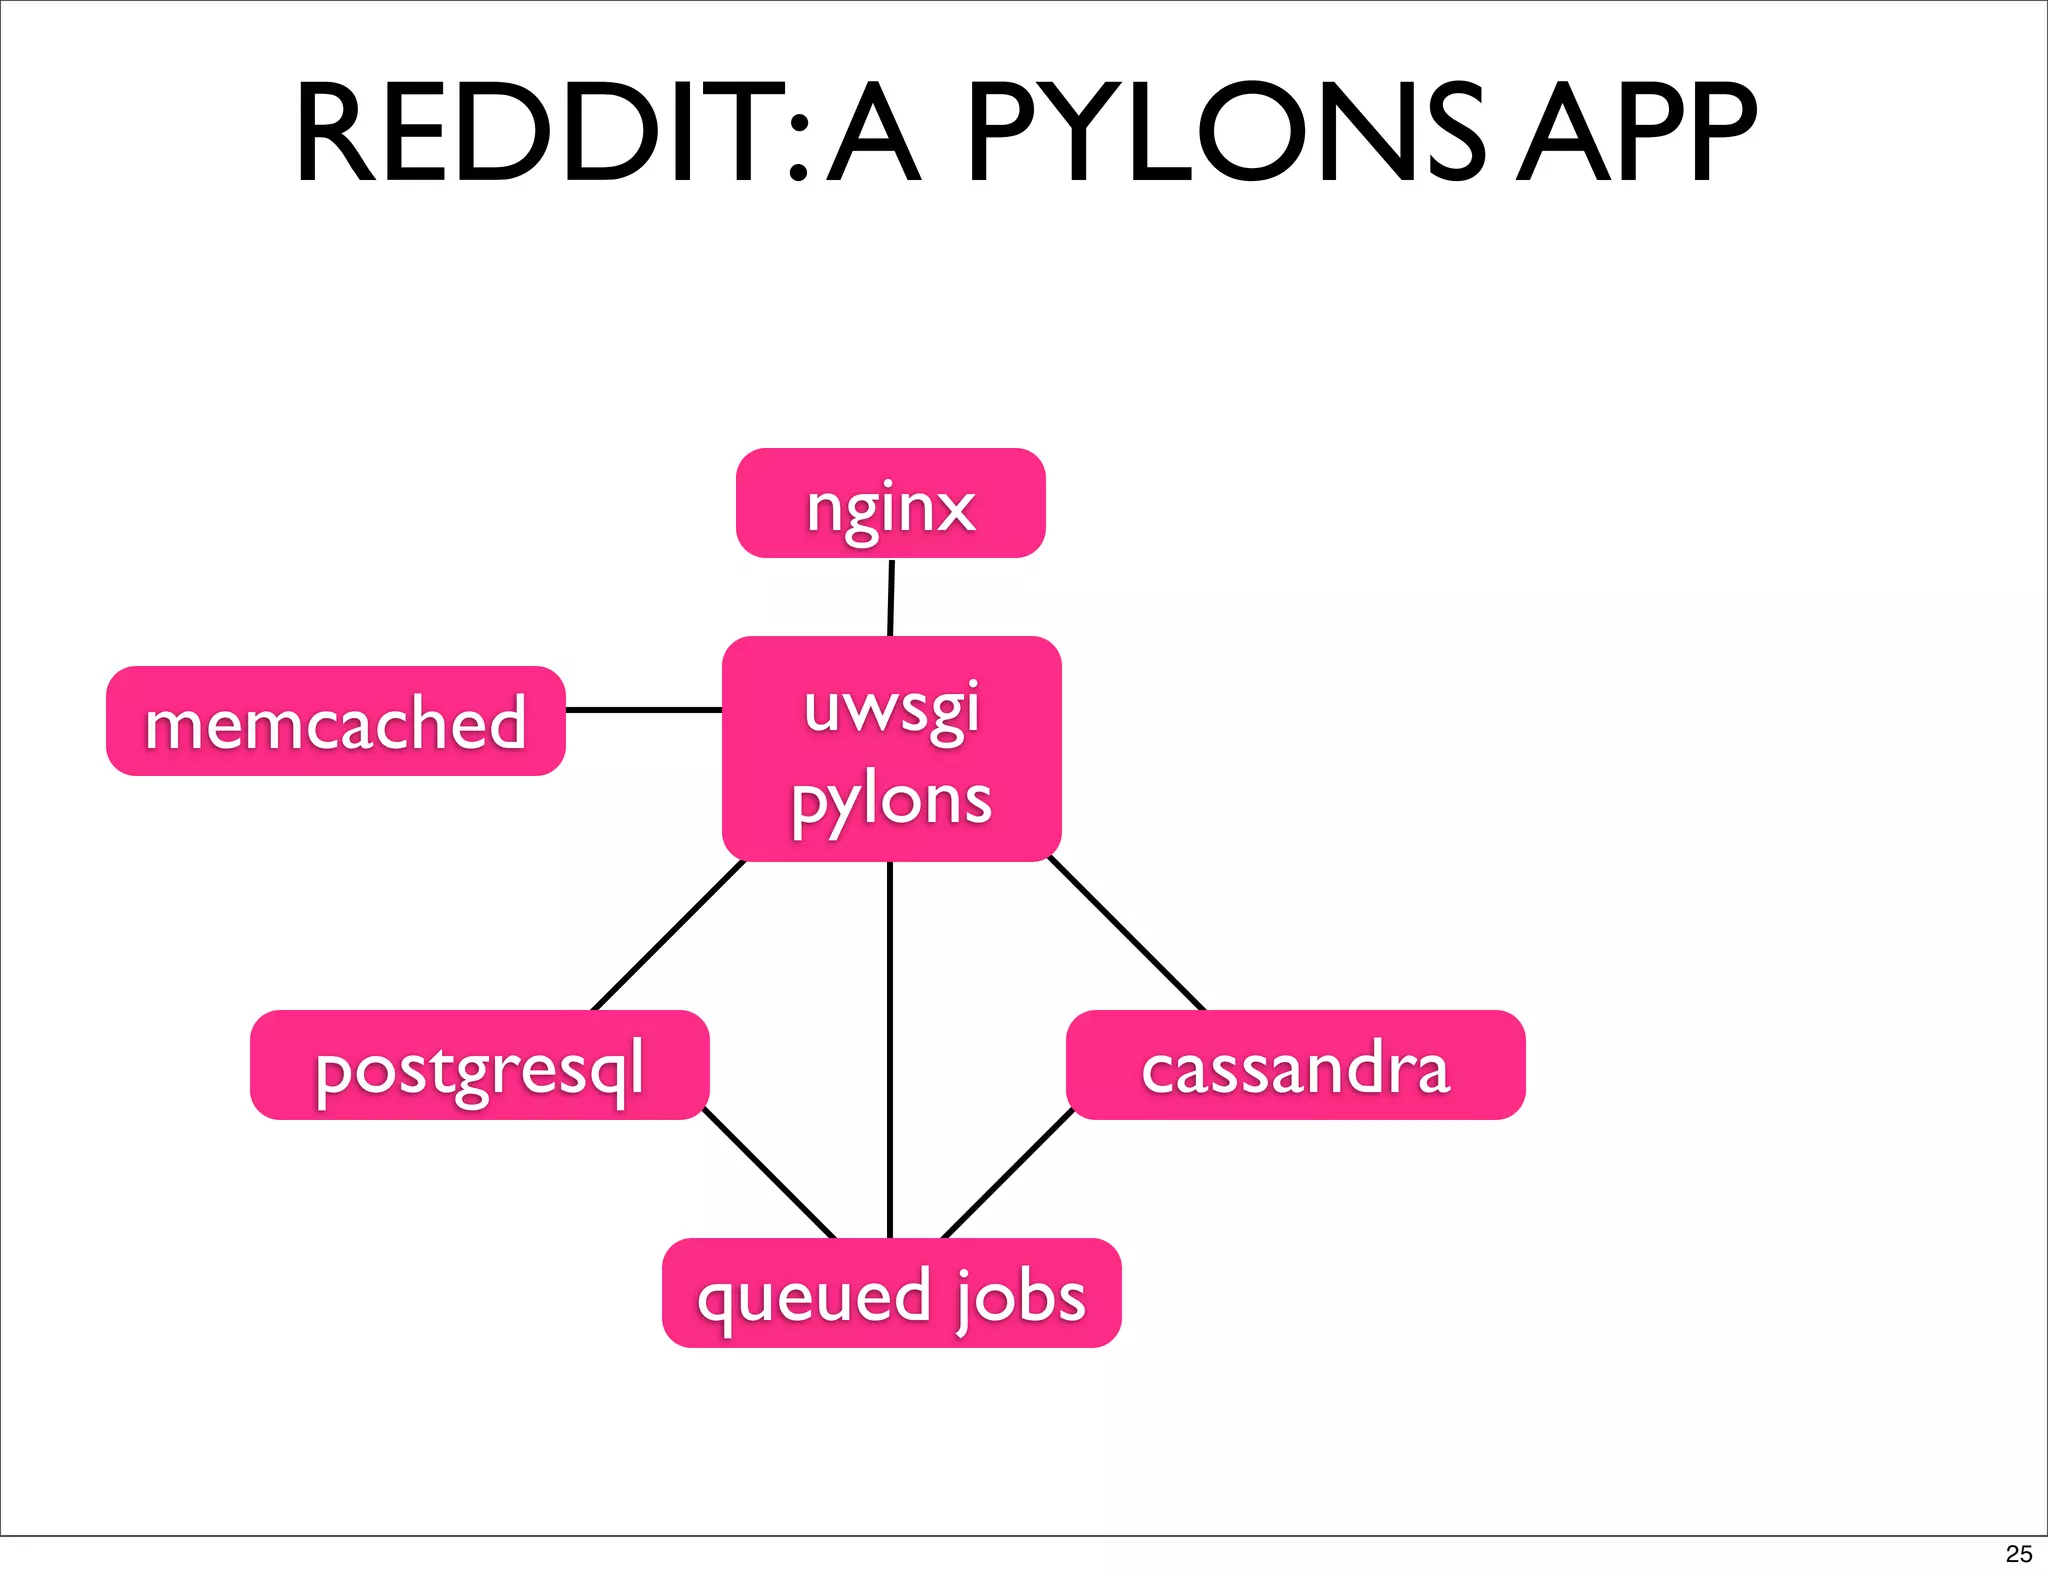
![INTERACTION
login.py
import
mechanize
as
m
class
MyTransaction(object):
def
run(self):
br
=
m.Browser()
br.set_handle_equiv(True)
br.set_handle_gzip(True)
br.set_handle_redirect(True)
br.set_handle_referer(True)
br.set_handle_robots(False)
br.set_handle_refresh(m._http.HTTPRefreshProcessor(),
max_time=1)
_
=
br.open(‘http://reddit.tlys.us’)
br.select_form(nr=1)
br.form['user']
=
u
br.form['passwd']
=
p
r
=
br.submit()
r.read()
20](https://image.slidesharecdn.com/webperfpygotham-120609101019-phpapp02/85/Python-Load-Testing-Pygotham-2012-20-320.jpg)
![[
$
cat
more-‐advanced-‐example.py
]
[
$
multimech-‐run
more-‐advanced
]
21](https://image.slidesharecdn.com/webperfpygotham-120609101019-phpapp02/85/Python-Load-Testing-Pygotham-2012-21-320.jpg)


![A SIMPLE PROJECT
config.cfg
[global]
run_time:
60
rampup:
60
results_ts_interval:
60
console_logging:
off
progress_bar:
on
[user_group-‐1]
threads:
25
script:
get_index.py
17](https://image.slidesharecdn.com/webperfpygotham-120609101019-phpapp02/75/Python-Load-Testing-Pygotham-2012-17-2048.jpg)
![A FEW M-M FEATURES
features.py
import
requests
import
time
class
Transaction(object):
def
run(self):
r
=
requests.get(‘http://website.com/a’)
r.raw.read()
assert
(r.status_code
==
200),
‘not
200’
assert
(‘Error’
not
in
r.text)
t1
=
time.time()
r
=
requests.get(‘http://website.com/b’)
r.raw.read()
latency
=
time.time()
-‐
t1
self.custom_timers[‘b’]
=
latency
18](https://image.slidesharecdn.com/webperfpygotham-120609101019-phpapp02/75/Python-Load-Testing-Pygotham-2012-18-2048.jpg)
![[
$
multimech-‐run
example
]
19](https://image.slidesharecdn.com/webperfpygotham-120609101019-phpapp02/75/Python-Load-Testing-Pygotham-2012-19-2048.jpg)
![INTERACTION
login.py
import
mechanize
as
m
class
MyTransaction(object):
def
run(self):
br
=
m.Browser()
br.set_handle_equiv(True)
br.set_handle_gzip(True)
br.set_handle_redirect(True)
br.set_handle_referer(True)
br.set_handle_robots(False)
br.set_handle_refresh(m._http.HTTPRefreshProcessor(),
max_time=1)
_
=
br.open(‘http://reddit.tlys.us’)
br.select_form(nr=1)
br.form['user']
=
u
br.form['passwd']
=
p
r
=
br.submit()
r.read()
20](https://image.slidesharecdn.com/webperfpygotham-120609101019-phpapp02/75/Python-Load-Testing-Pygotham-2012-20-2048.jpg)
![[
$
cat
more-‐advanced-‐example.py
]
[
$
multimech-‐run
more-‐advanced
]
21](https://image.slidesharecdn.com/webperfpygotham-120609101019-phpapp02/75/Python-Load-Testing-Pygotham-2012-21-2048.jpg)


The document discusses load testing, specifically using Python and a framework called multi-mechanize, to evaluate web application performance in terms of latency and throughput. It outlines when to conduct load tests, the differences between virtual users and real browser simulations, and provides examples of scripting and configuration for testing. Additionally, it covers monitoring machine performance and offers resources for tools and techniques related to load testing.


![[231] the simplicity of cluster apps with circuit](https://cdn.slidesharecdn.com/ss_thumbnails/213thesimplicityofclusterappswithcircuit-150915022150-lva1-app6892-thumbnail.jpg?width=600ounds&width=560&fit=bounds)


