Download to read offline


The document outlines the process of creating and decorating various types of graphs using Python's NumPy and Matplotlib libraries. It includes instructions for importing modules, plotting functions, adding labels and titles, and executing multiple plots on a single graph. Additionally, it provides code examples for bar graphs and answers a multiple-choice question regarding setting axis limits.
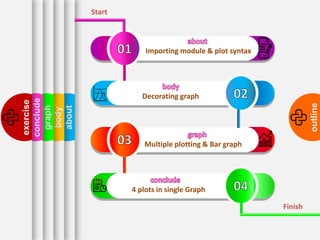
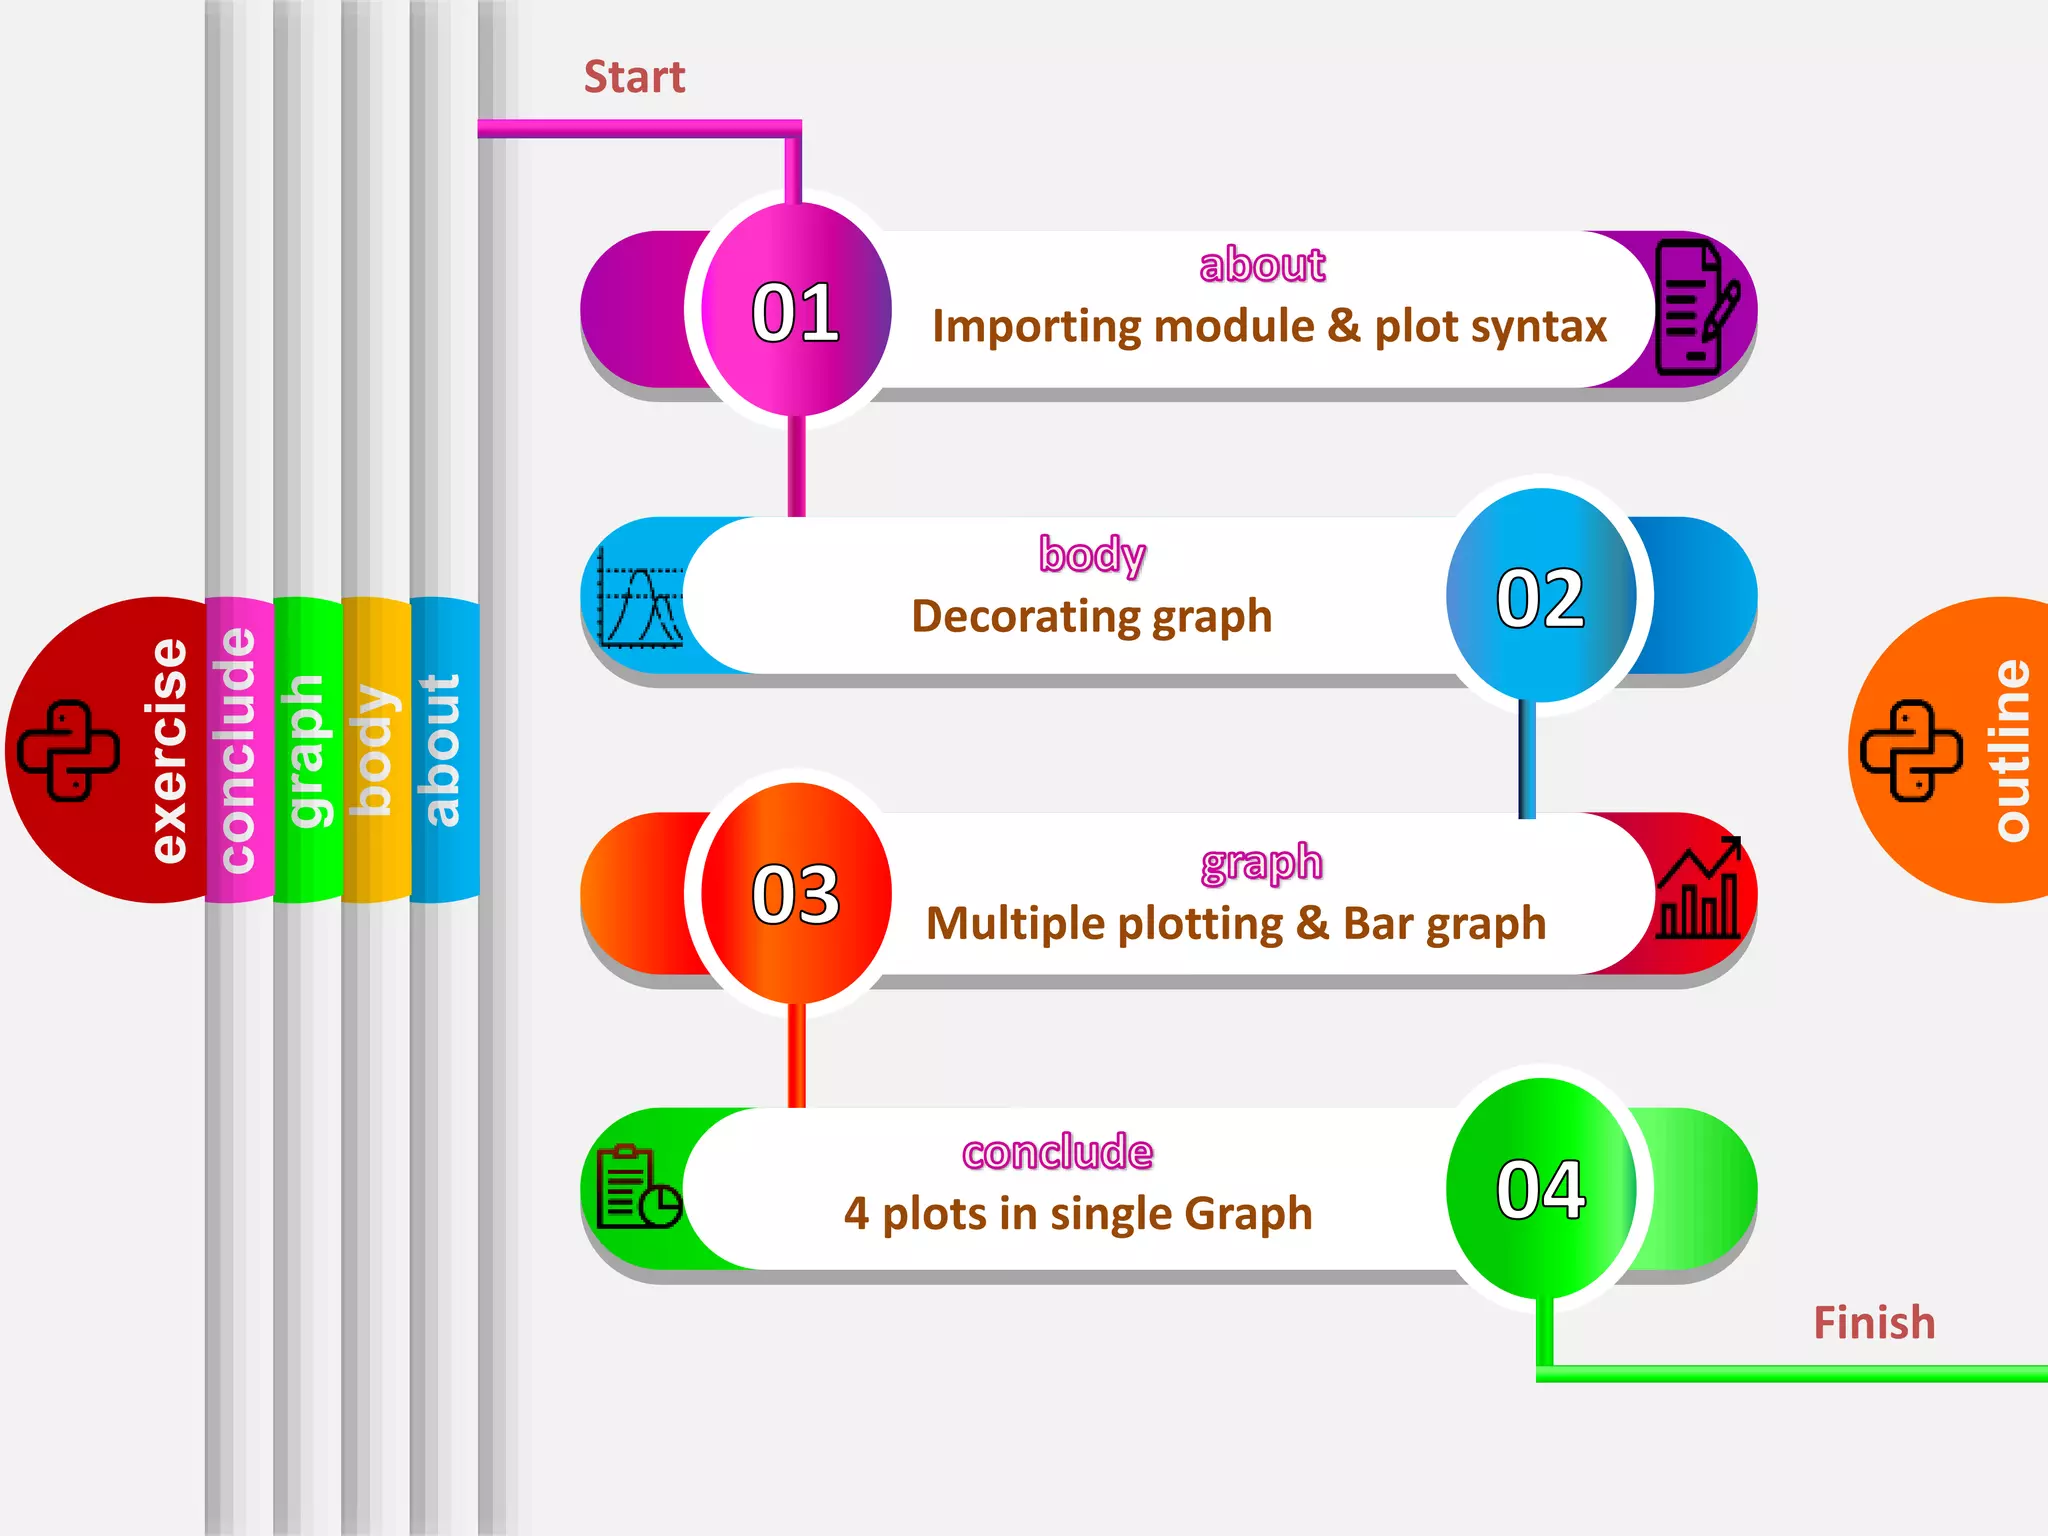
Overview of presentation structure, including main sections: about, body, graph, conclusion, and exercise.
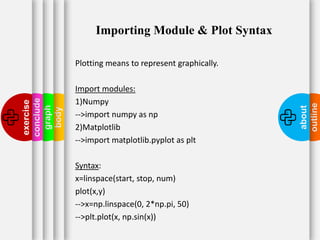
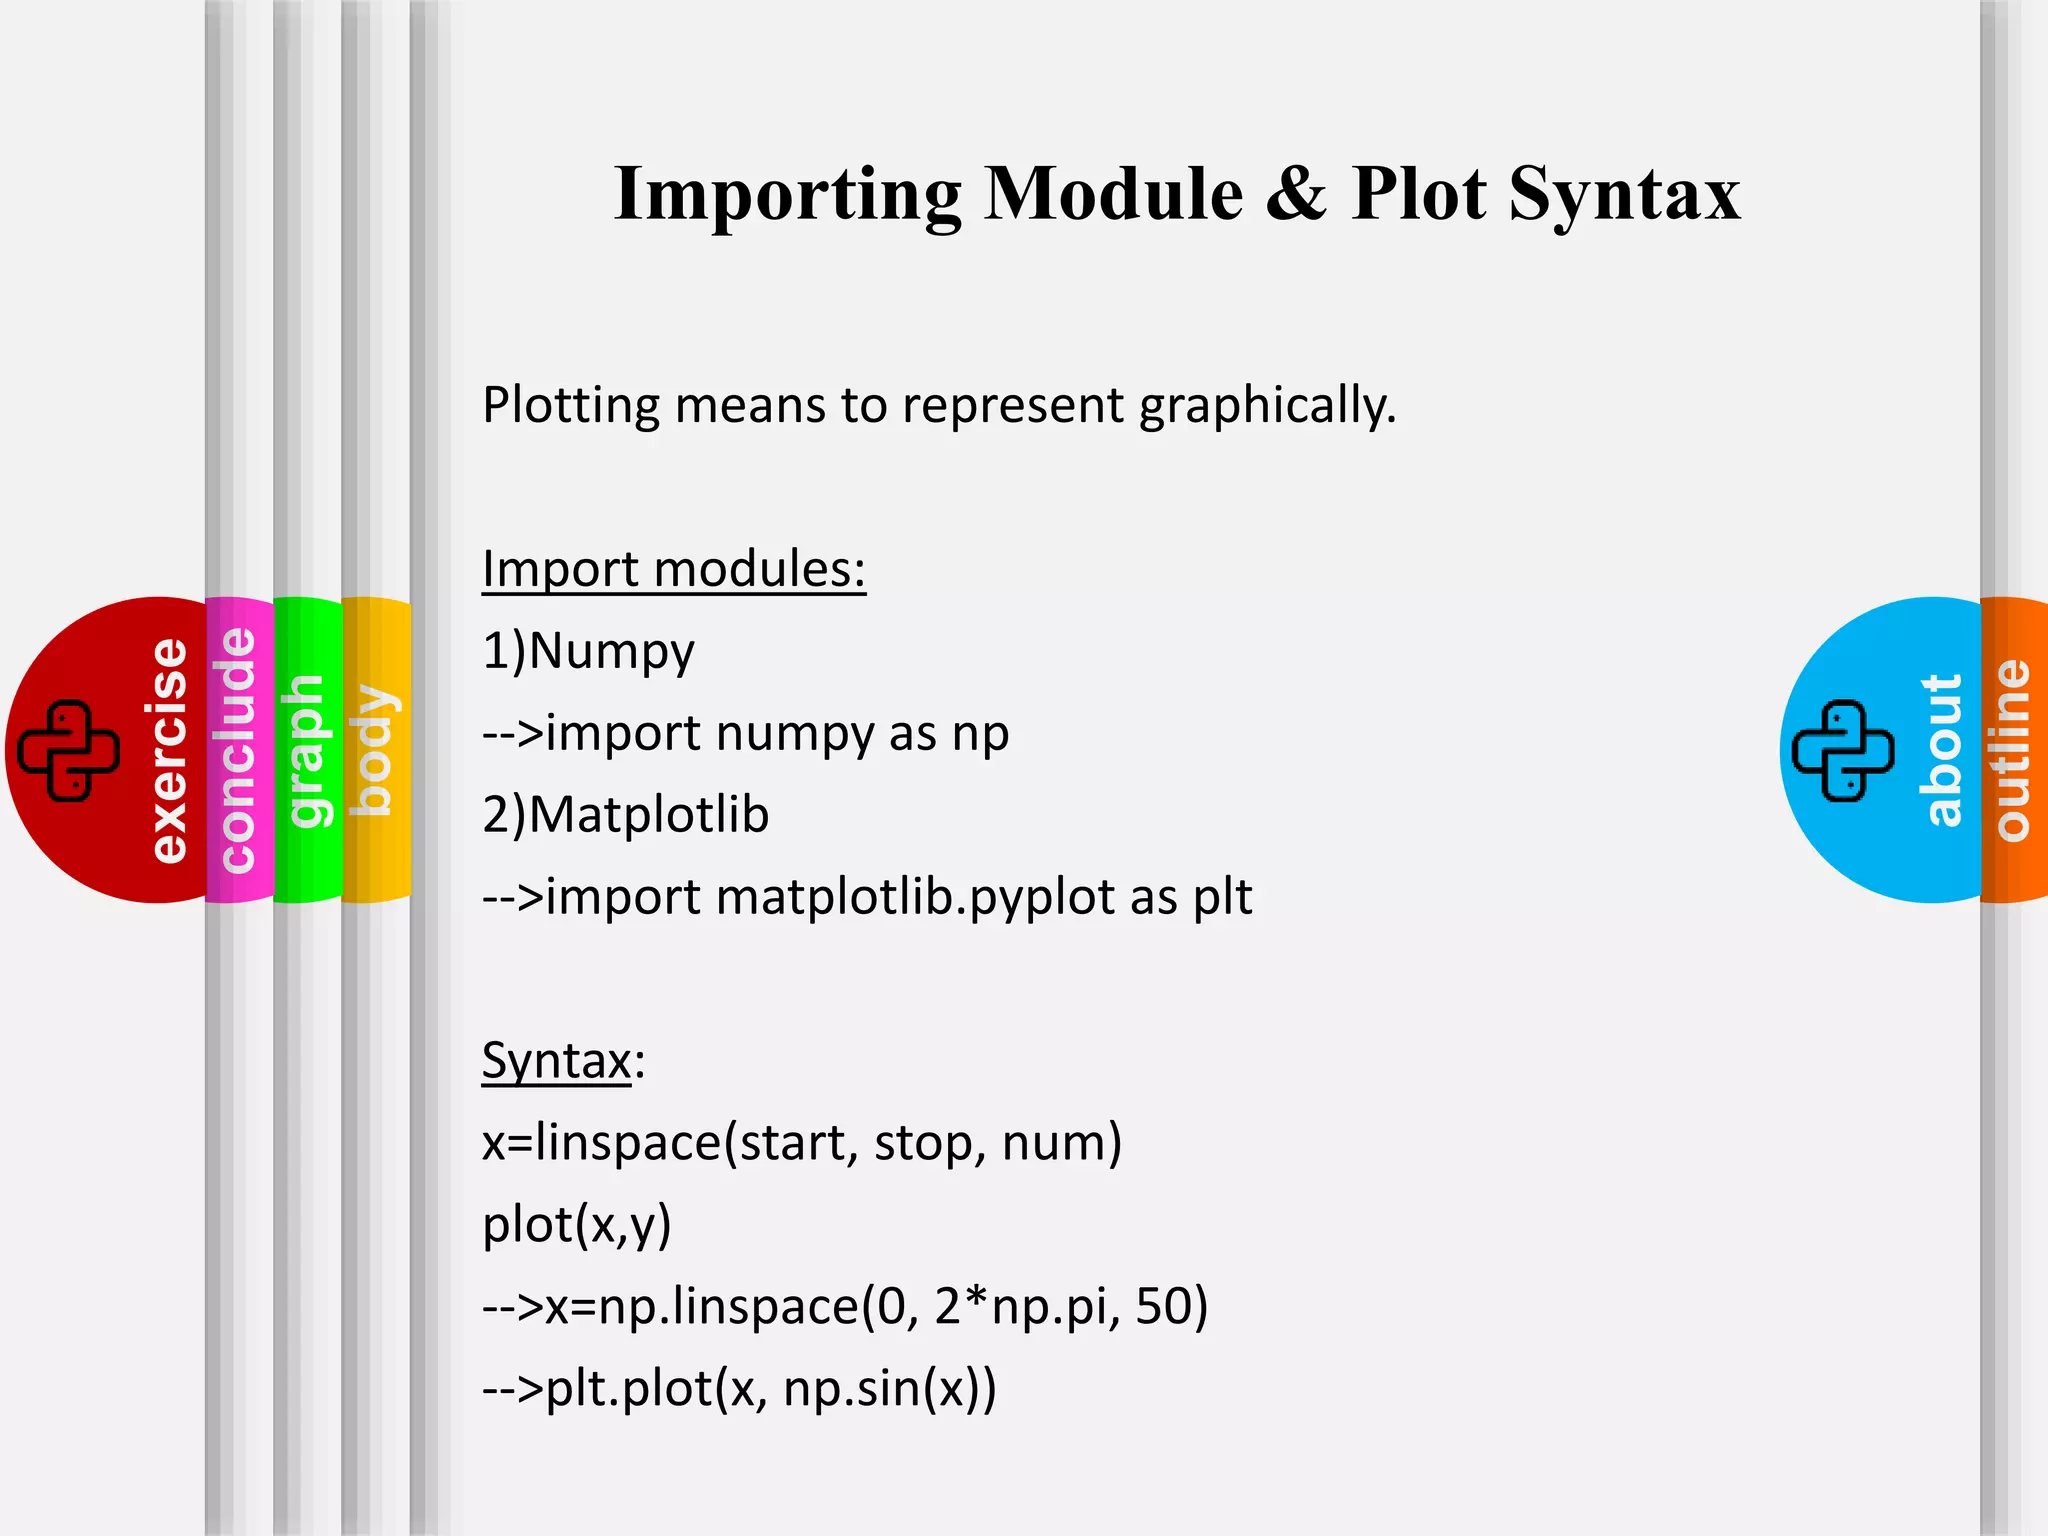
Introduction to importing modules and syntax for plotting; includes multiple plotting techniques.
Details on using Numpy and Matplotlib for plotting, with syntax examples for creating simple plots.
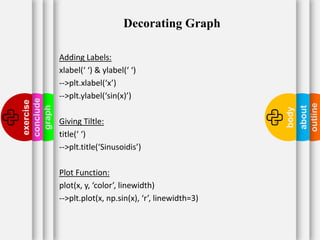
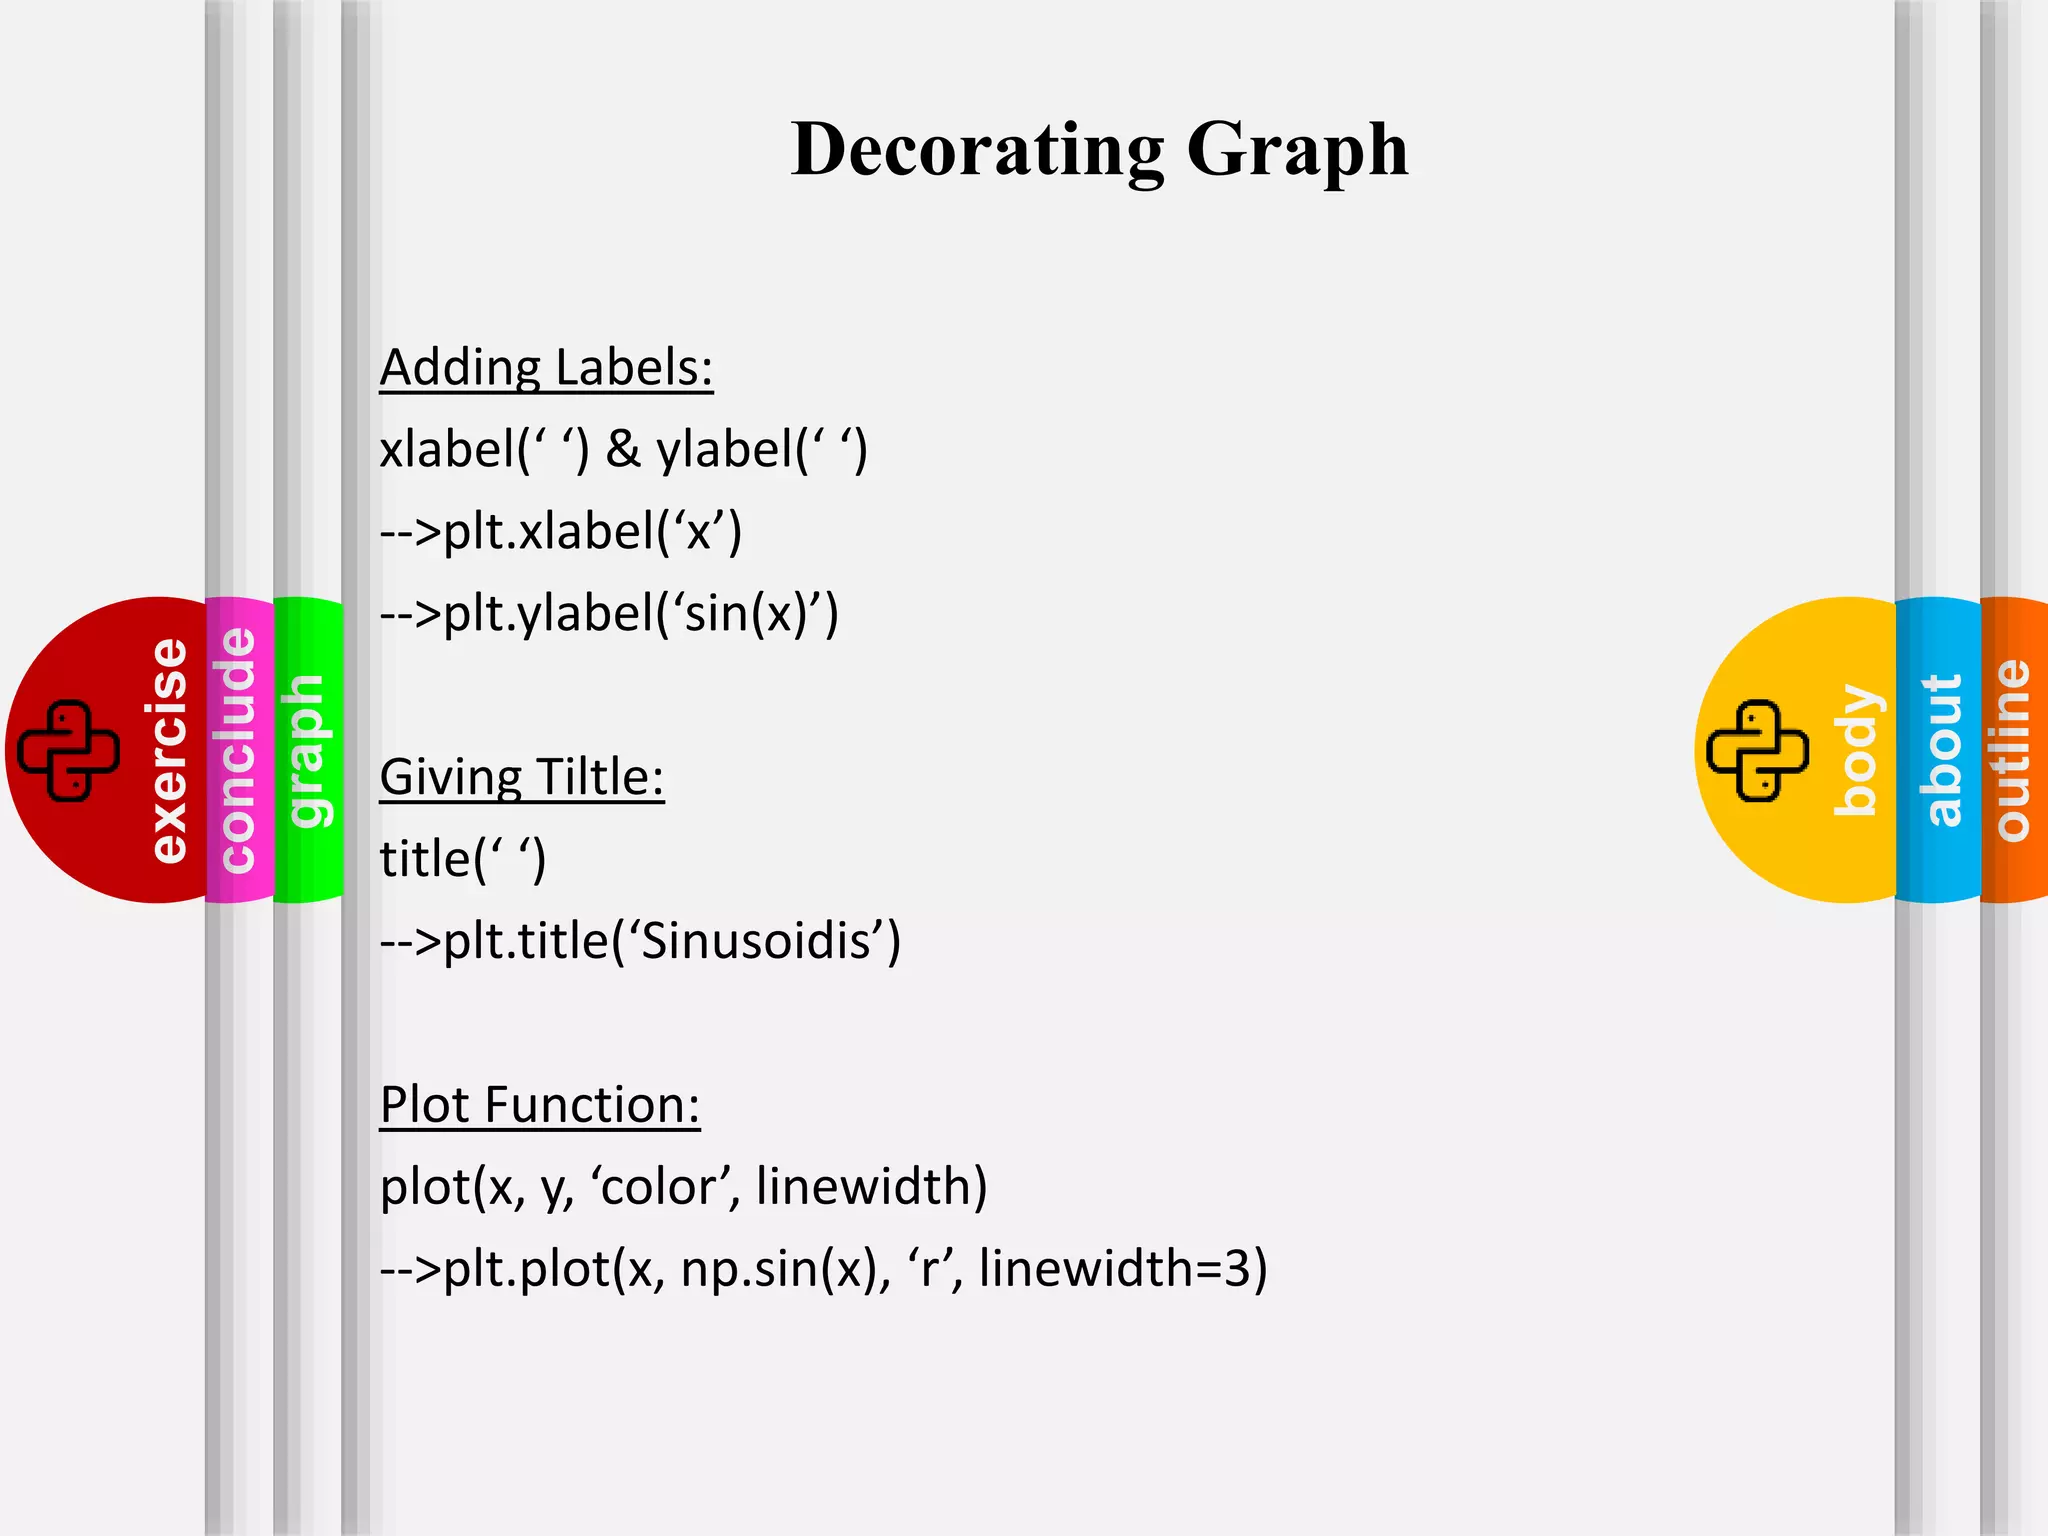
Methods for enhancing plots, including adding labels, titles, and setting properties like line width.
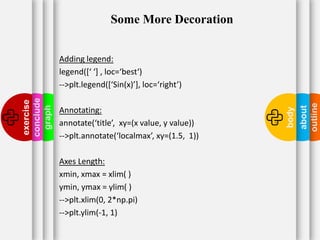
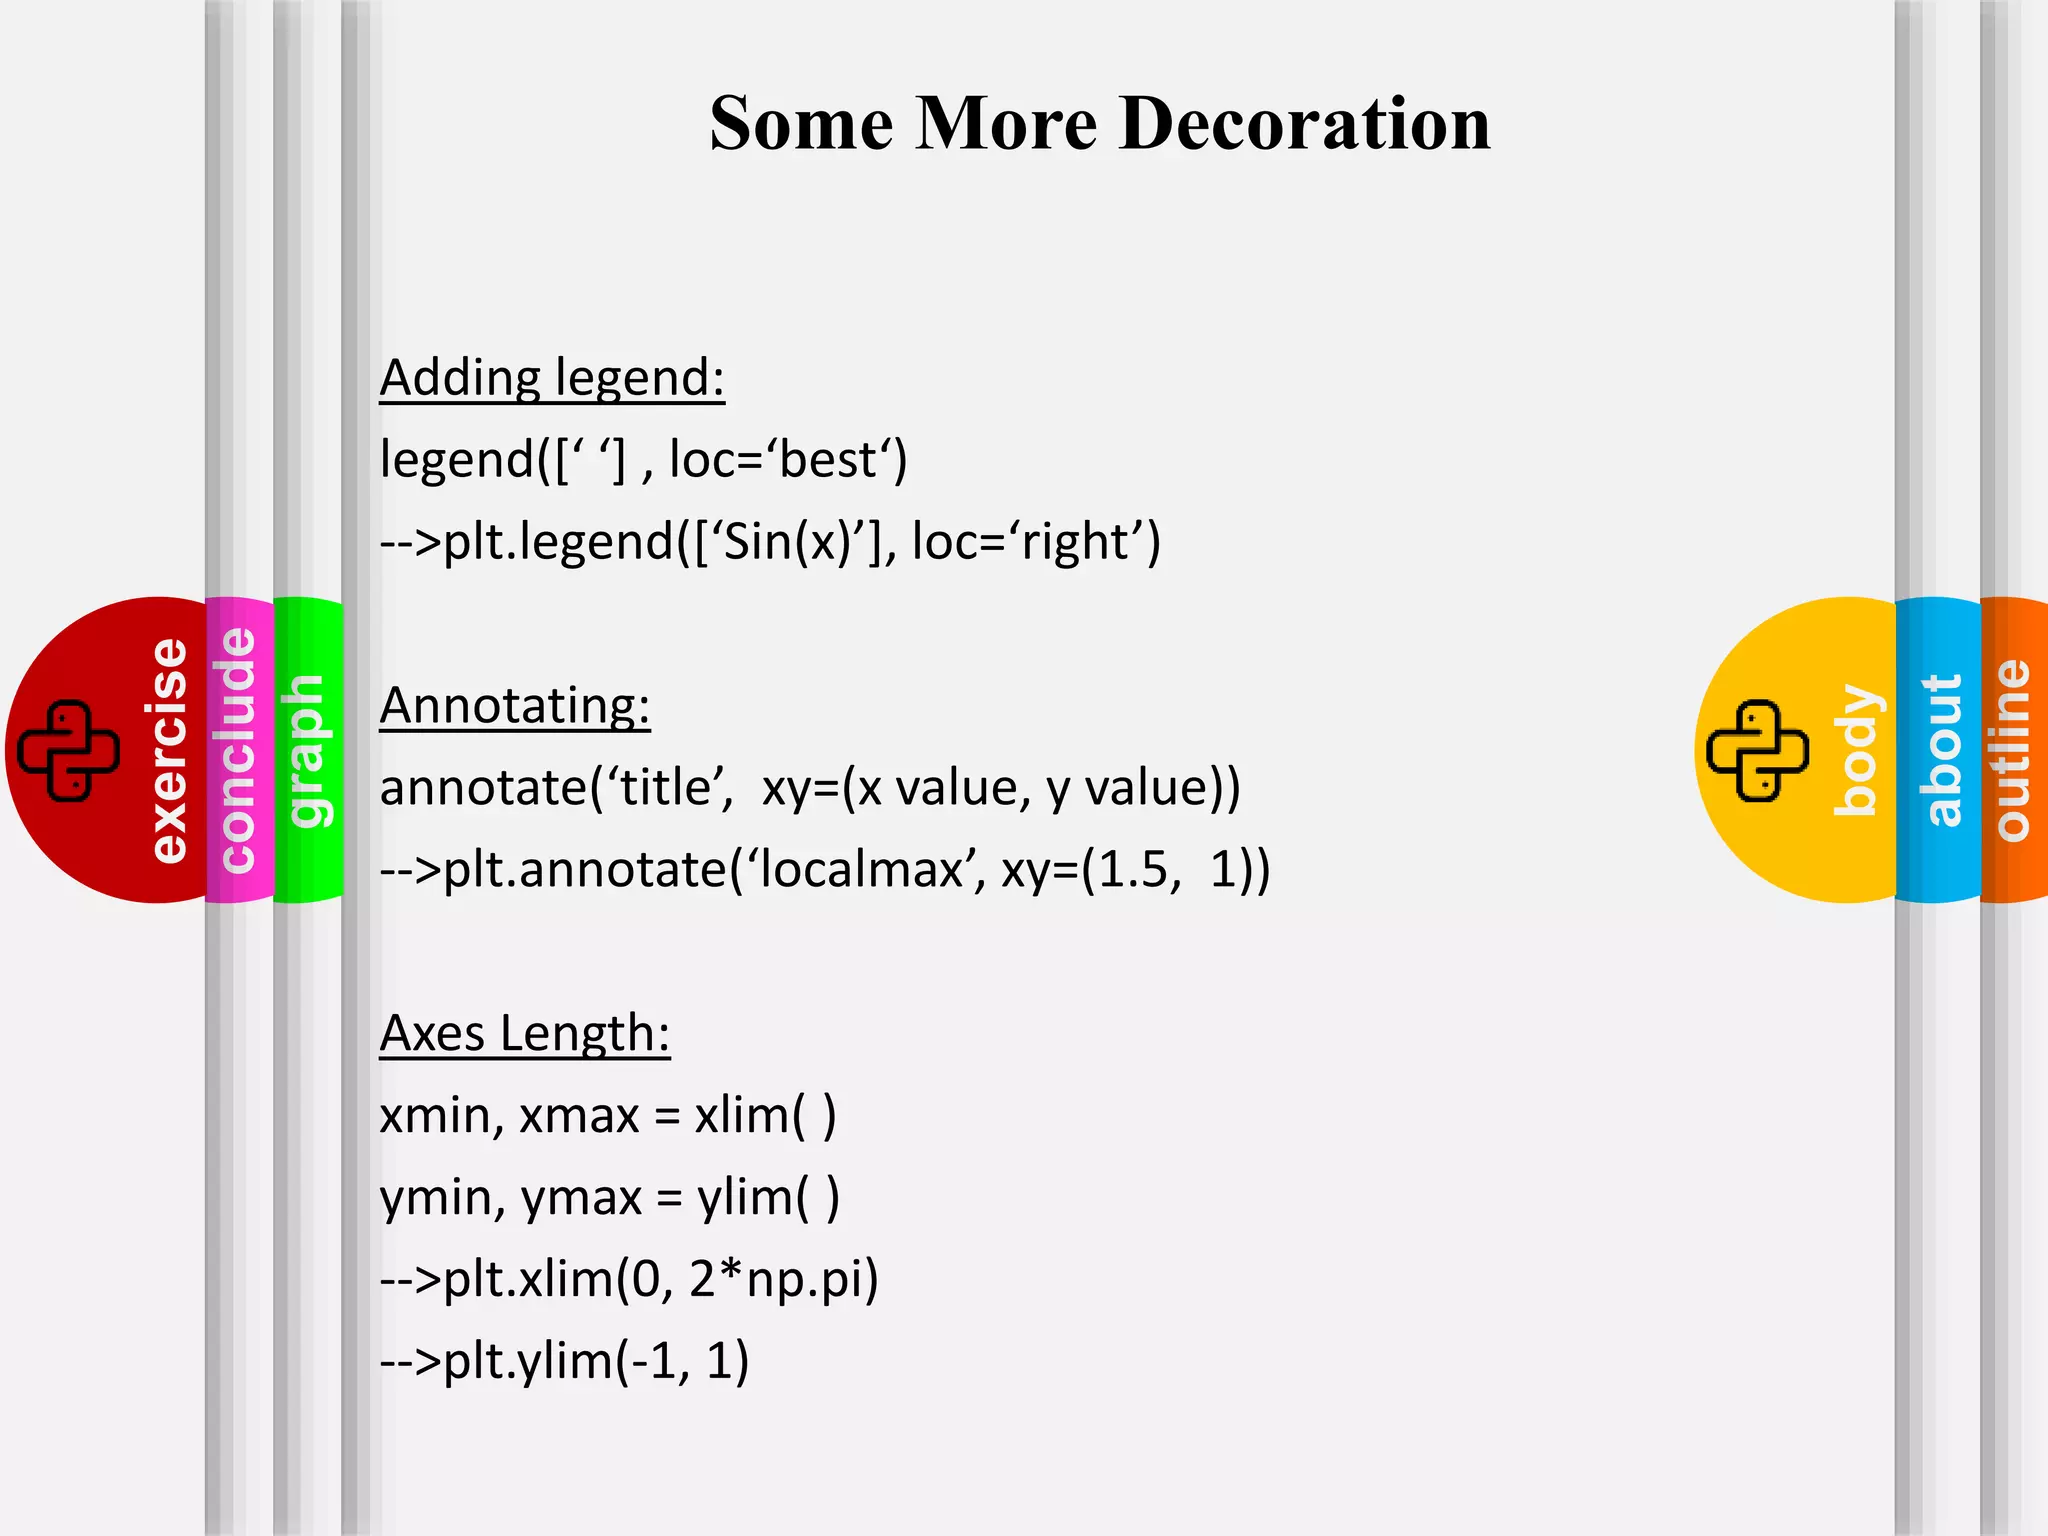
Further decoration techniques such as legends, annotations, and setting axis limits for better visualization.
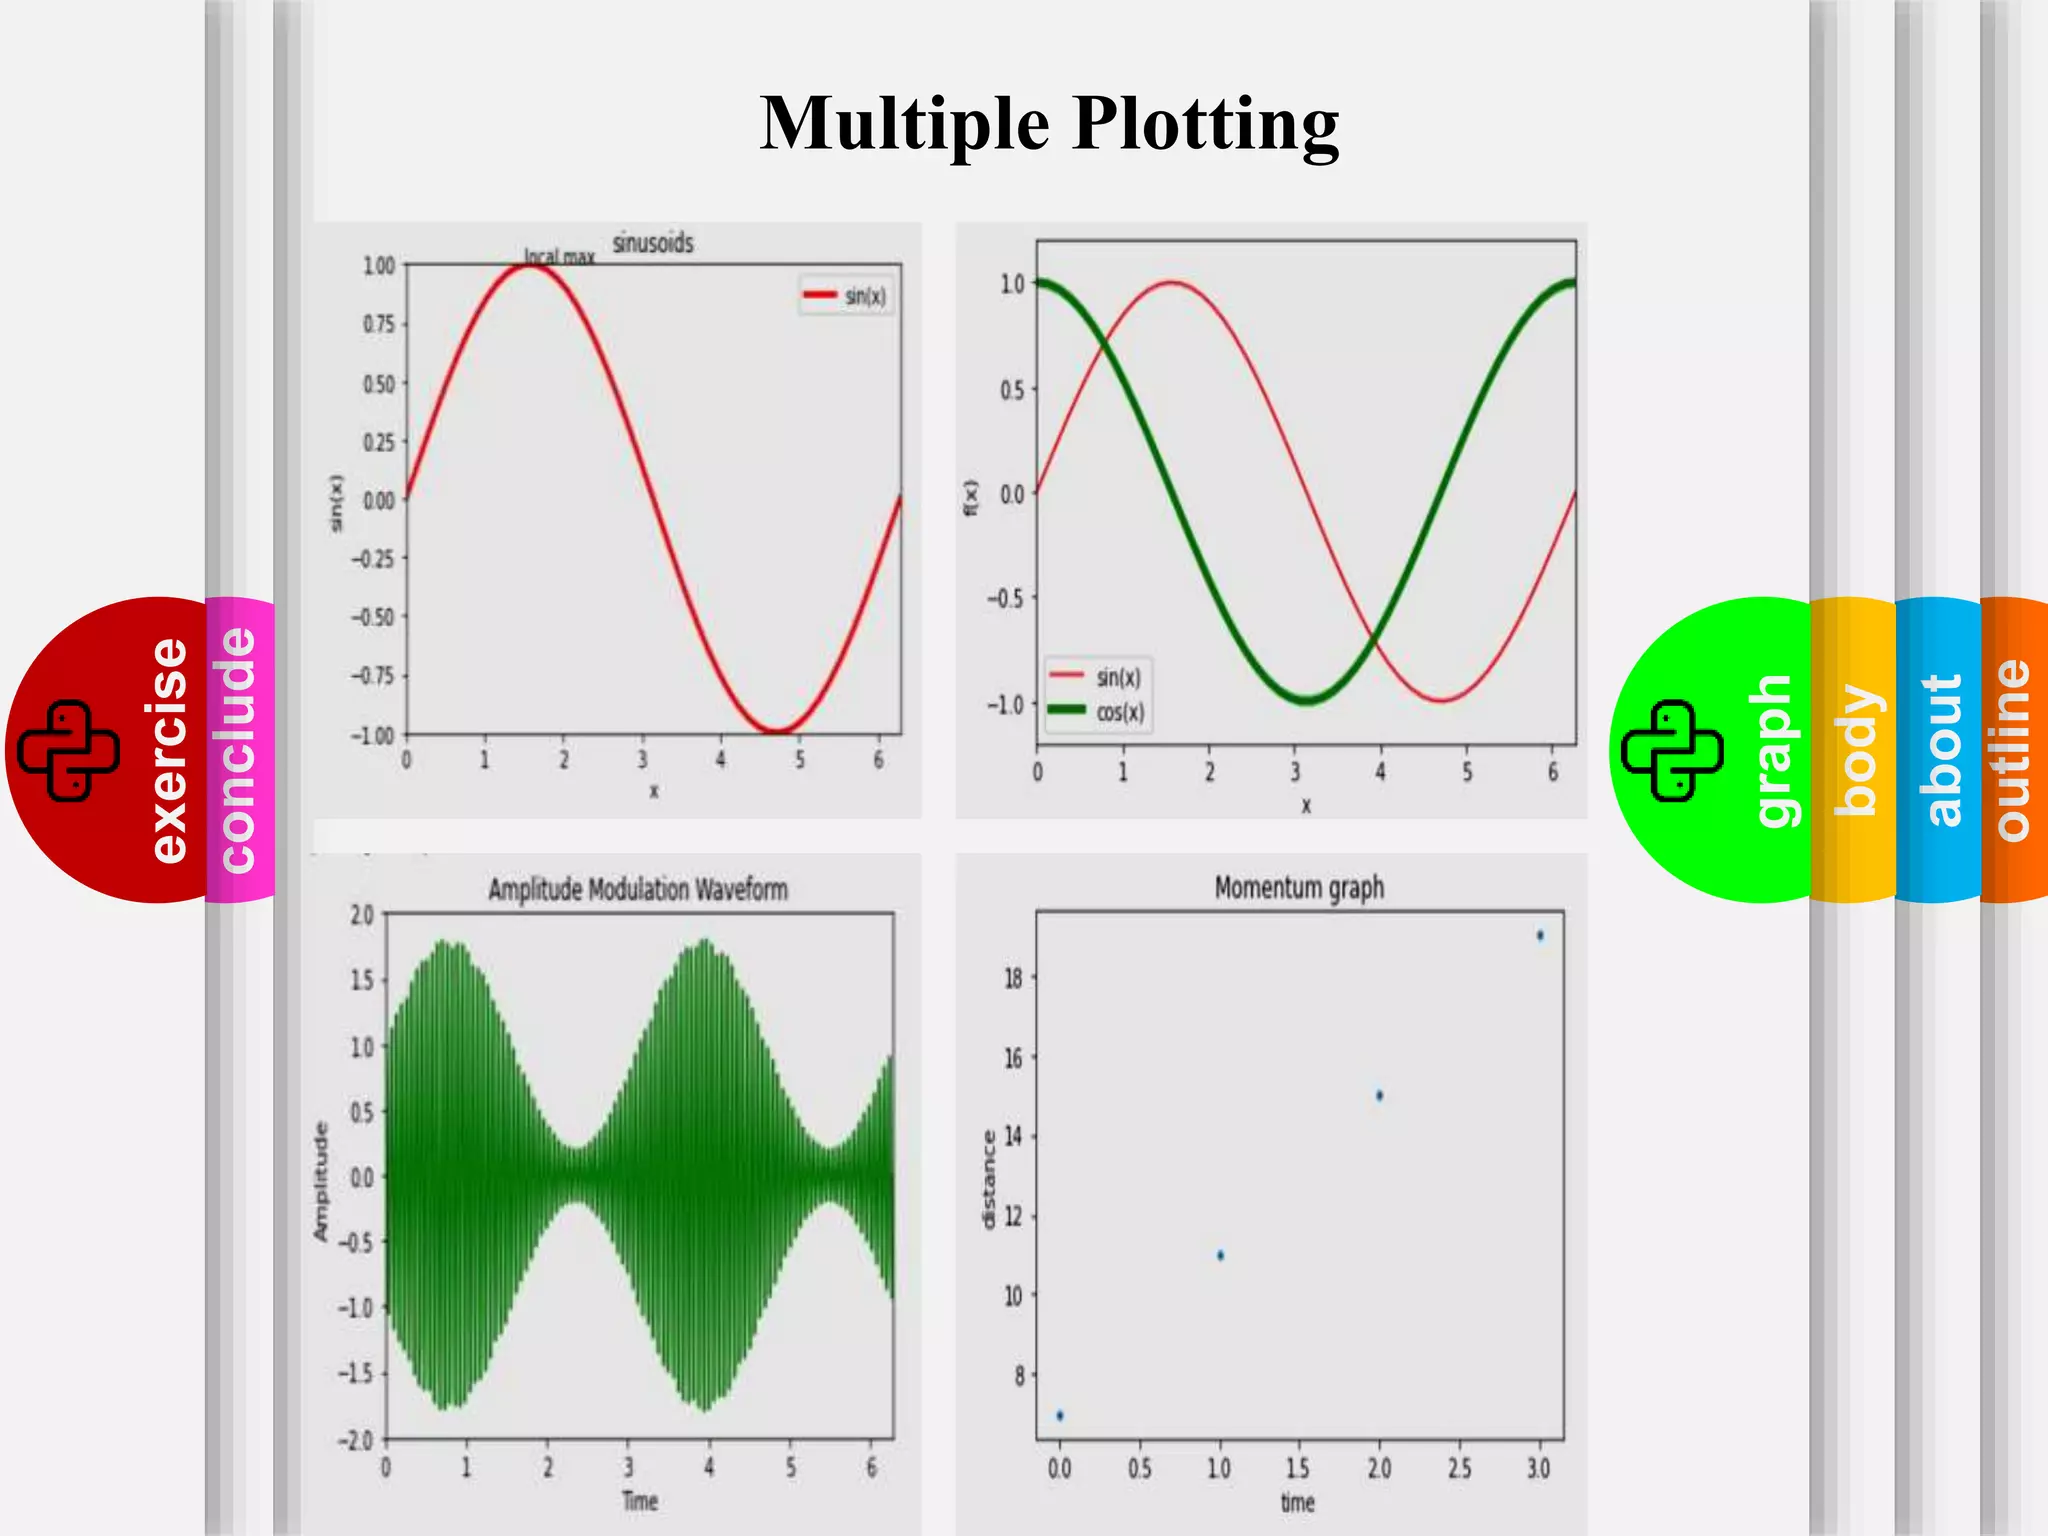
Focus on the capability to plot multiple graphs in a single figure.
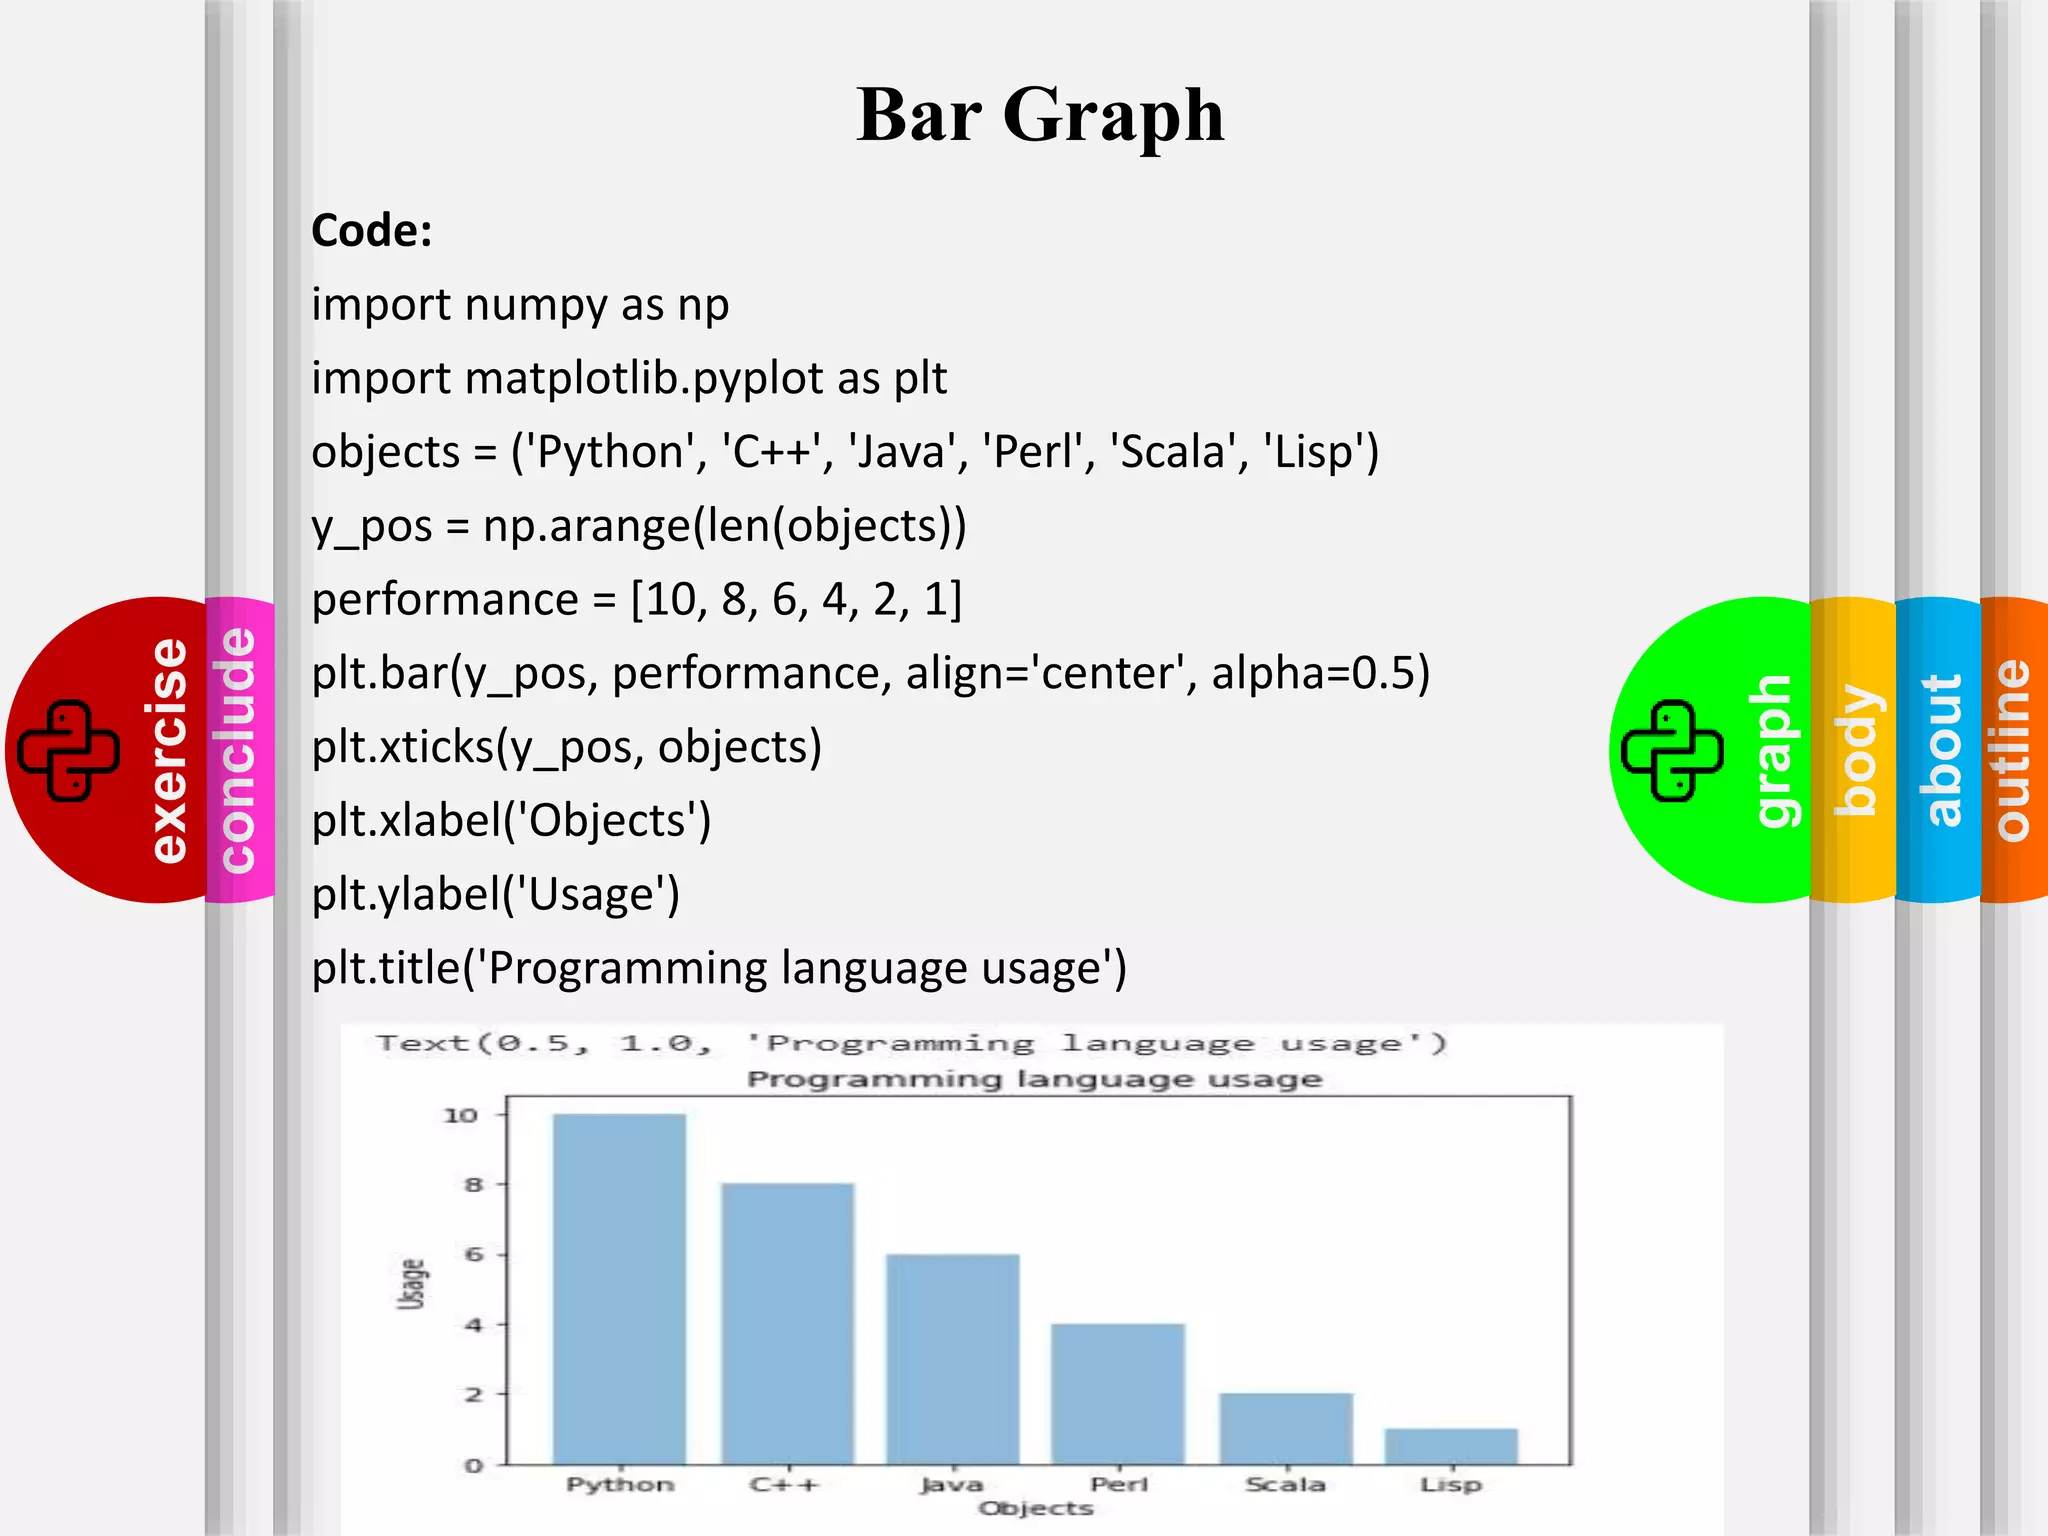
Guidance on constructing bar graphs using programming languages' performance data with example code.
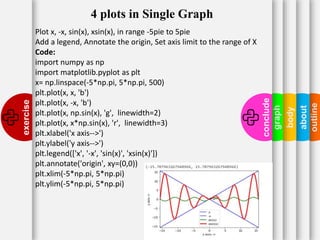
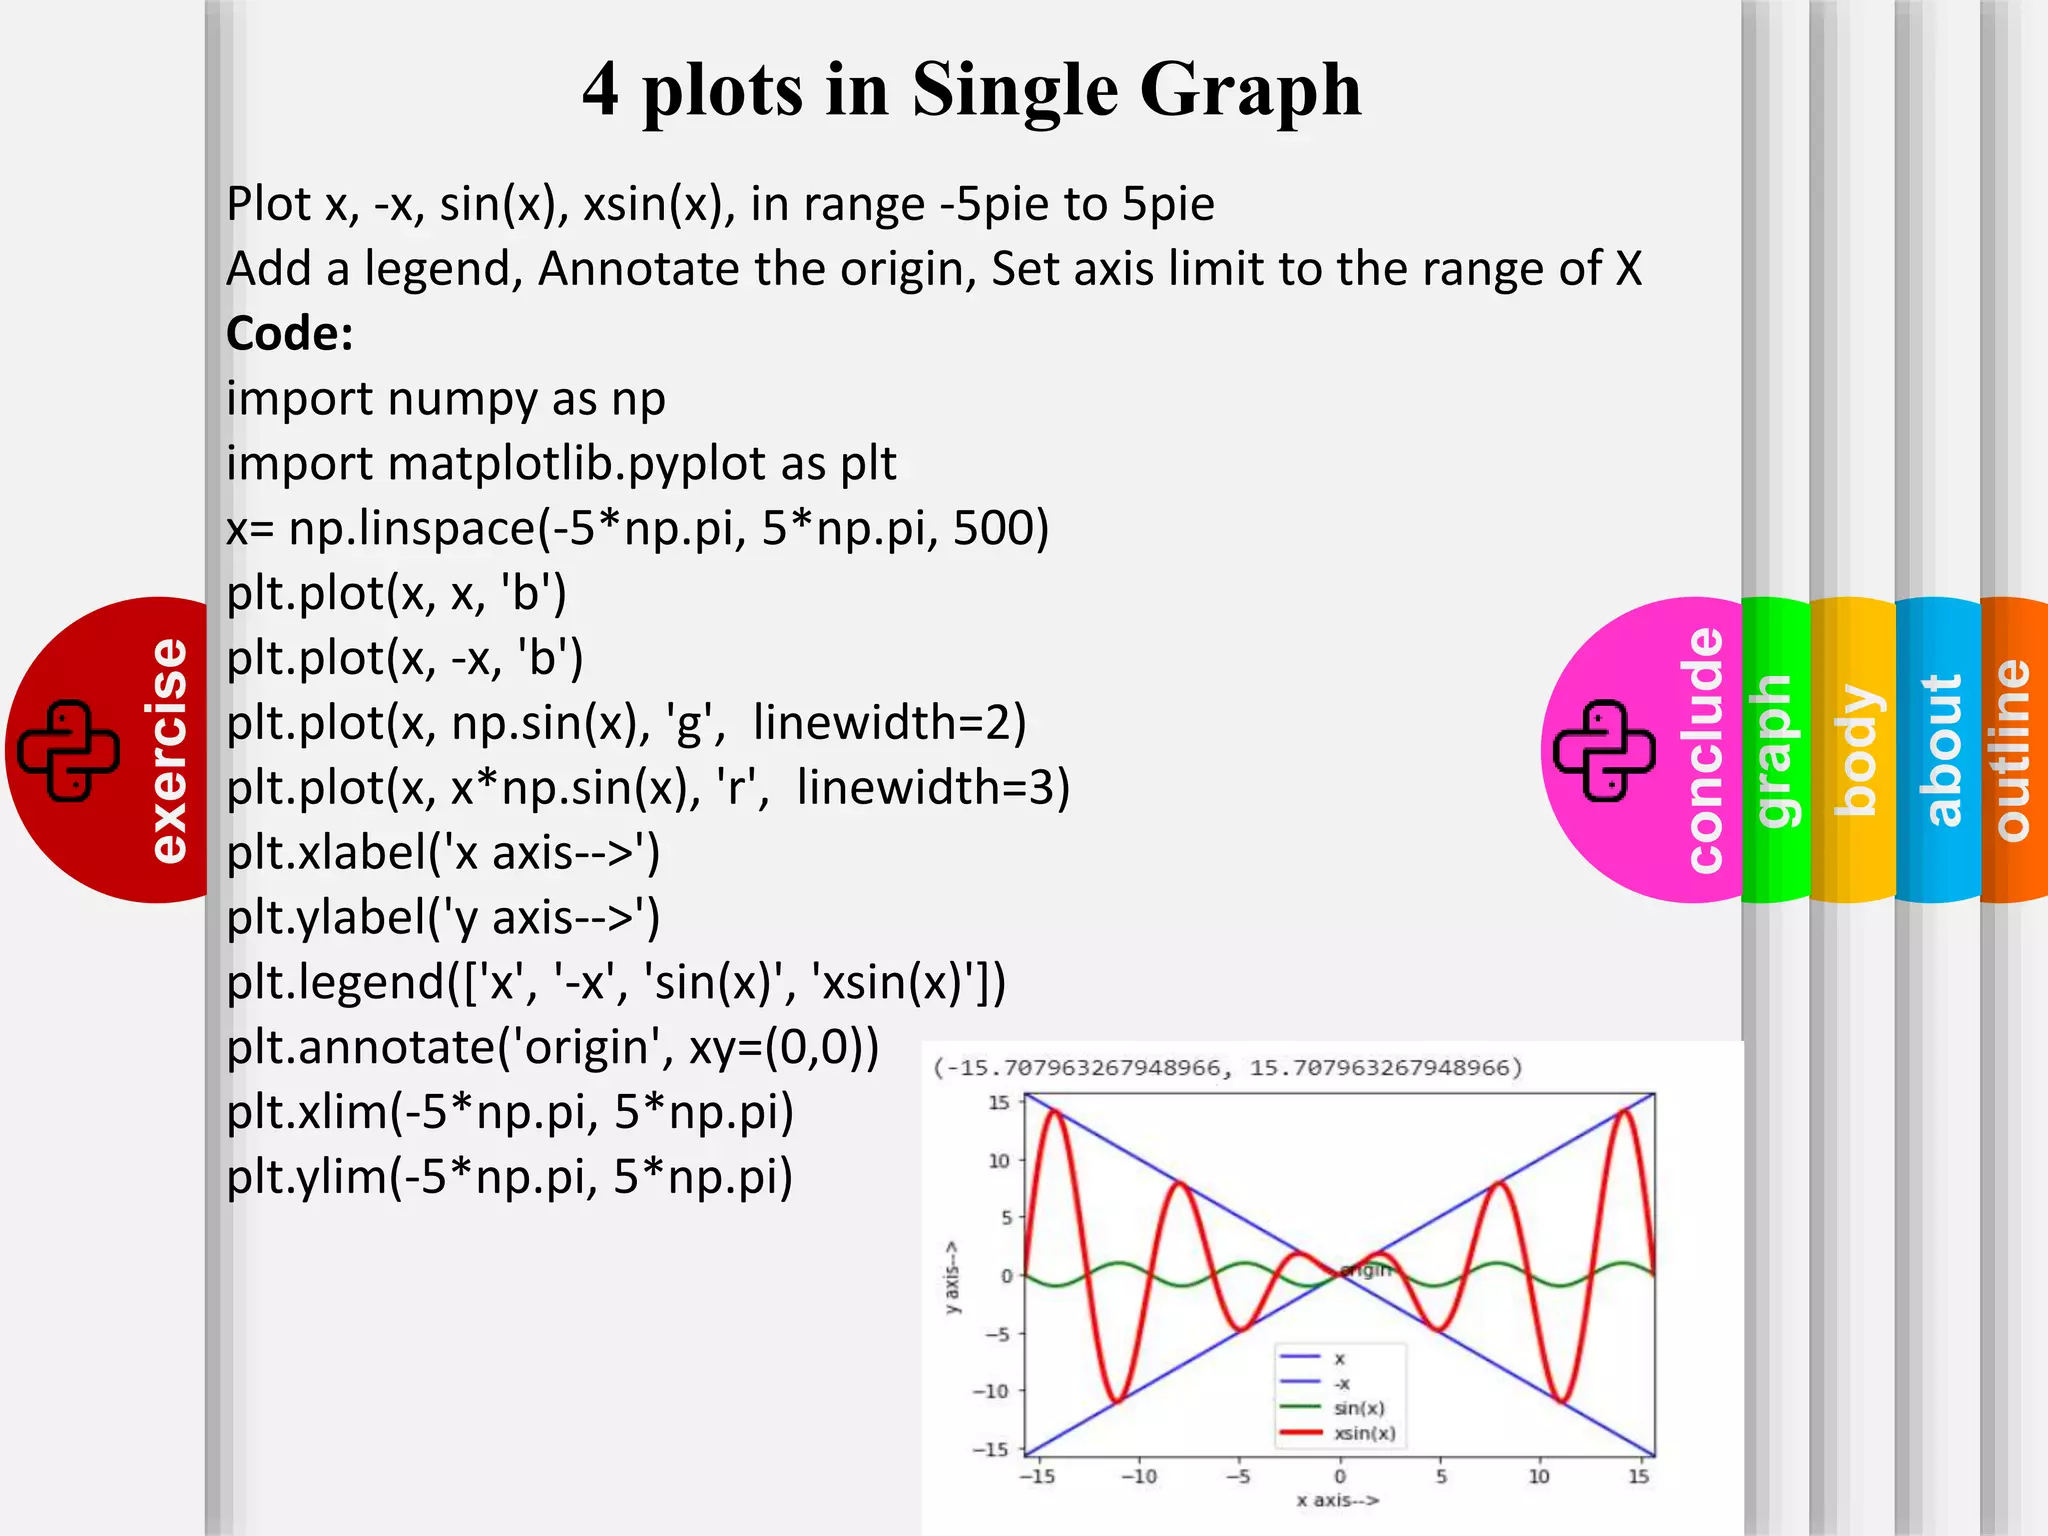
Instructions for plotting multiple functions on a single graph with annotations and axis limits.
Multiple choice question related to setting the X and Y axis limits of a plot based on specified coordinates.


