Downloaded 53 times


![Integrating Mahout
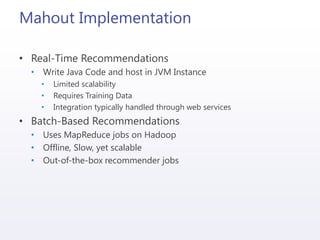
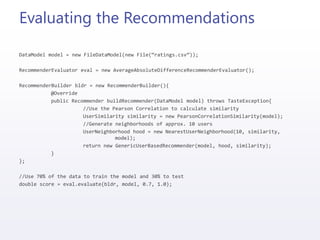
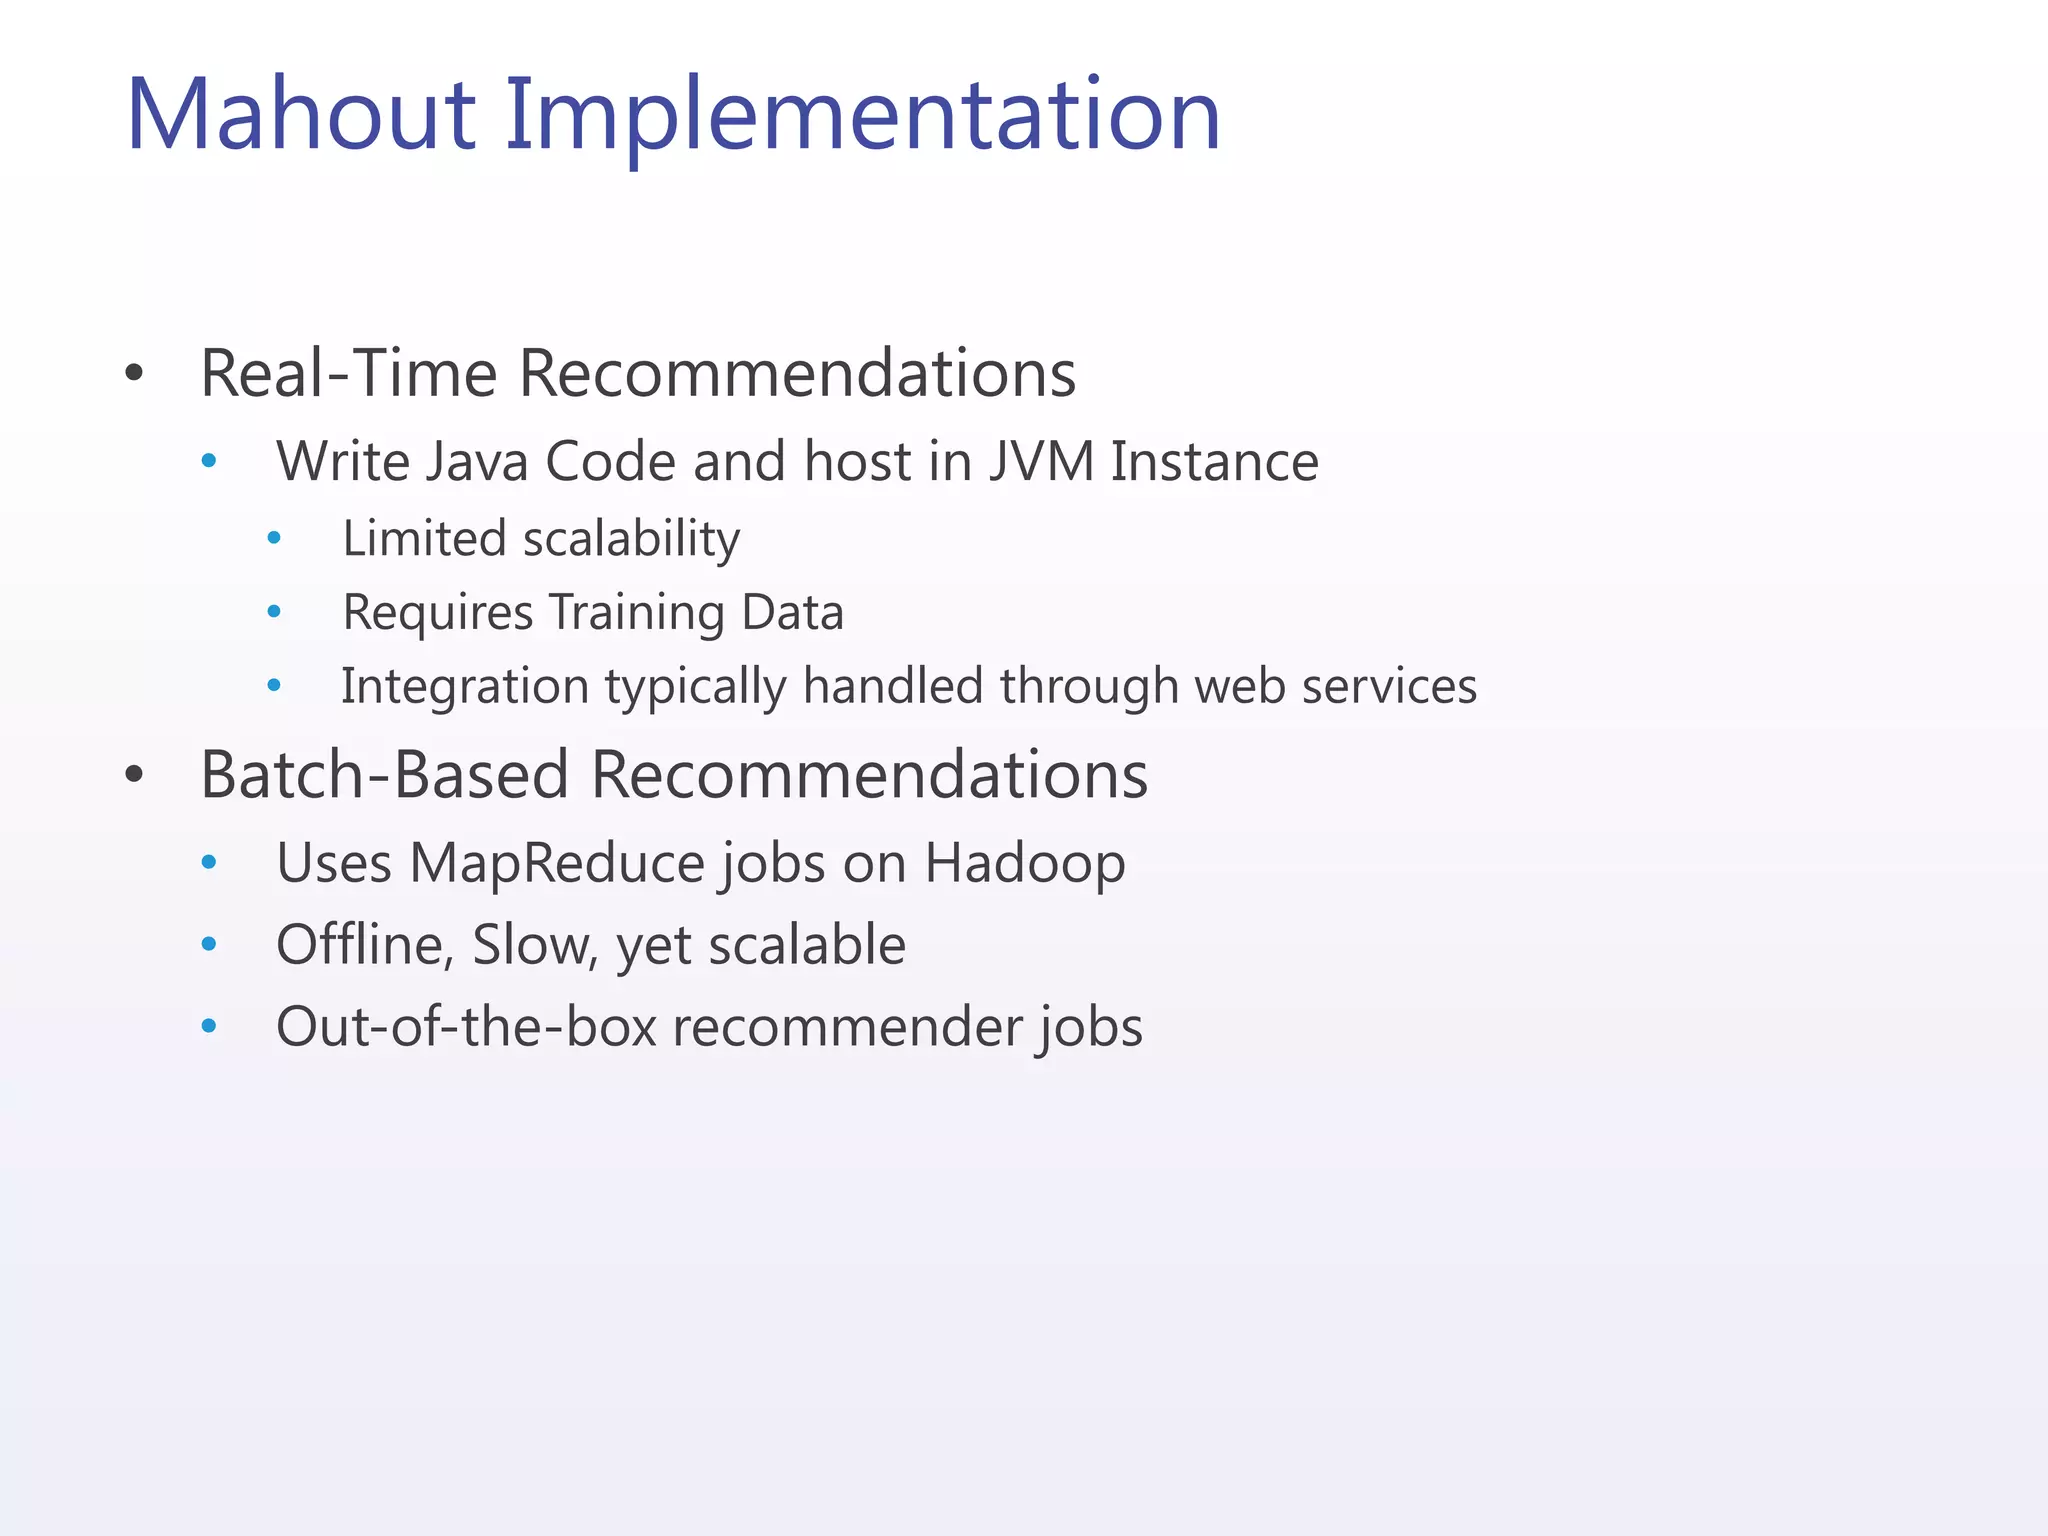
• Real-Time
• Requires Java coding
• Web Service
• Process:
• Load training data (memory pressure)
• Generate recommendations
• Batch
• ETL from source
• Generate input file (UserID, ItemID, Rating)
• Load to HDFS
• Process with Mahout/Hadoop
• ETL output from HDFS/Hadoop
• 7 [1:4.5,2:4.5,3:4.5,4:4.5,5:4.5,6:4.5,7:4.5]
• UserID [ItemID:Estimate Rating, ………]](https://image.slidesharecdn.com/runningwithelephants-130830202408-phpapp02/85/Running-with-Elephants-Predictive-Analytics-with-HDInsight-21-320.jpg)
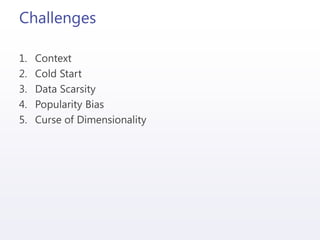


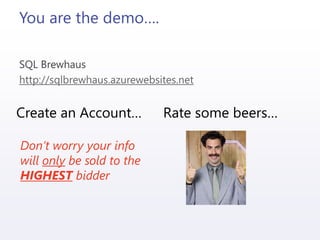
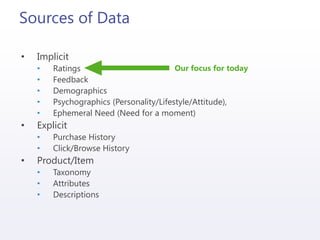
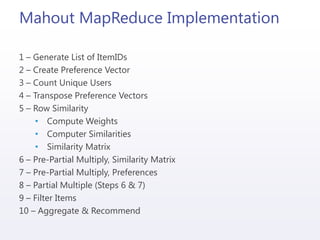
![Integrating Mahout
• Real-Time
• Requires Java coding
• Web Service
• Process:
• Load training data (memory pressure)
• Generate recommendations
• Batch
• ETL from source
• Generate input file (UserID, ItemID, Rating)
• Load to HDFS
• Process with Mahout/Hadoop
• ETL output from HDFS/Hadoop
• 7 [1:4.5,2:4.5,3:4.5,4:4.5,5:4.5,6:4.5,7:4.5]
• UserID [ItemID:Estimate Rating, ………]](https://image.slidesharecdn.com/runningwithelephants-130830202408-phpapp02/75/Running-with-Elephants-Predictive-Analytics-with-HDInsight-21-2048.jpg)

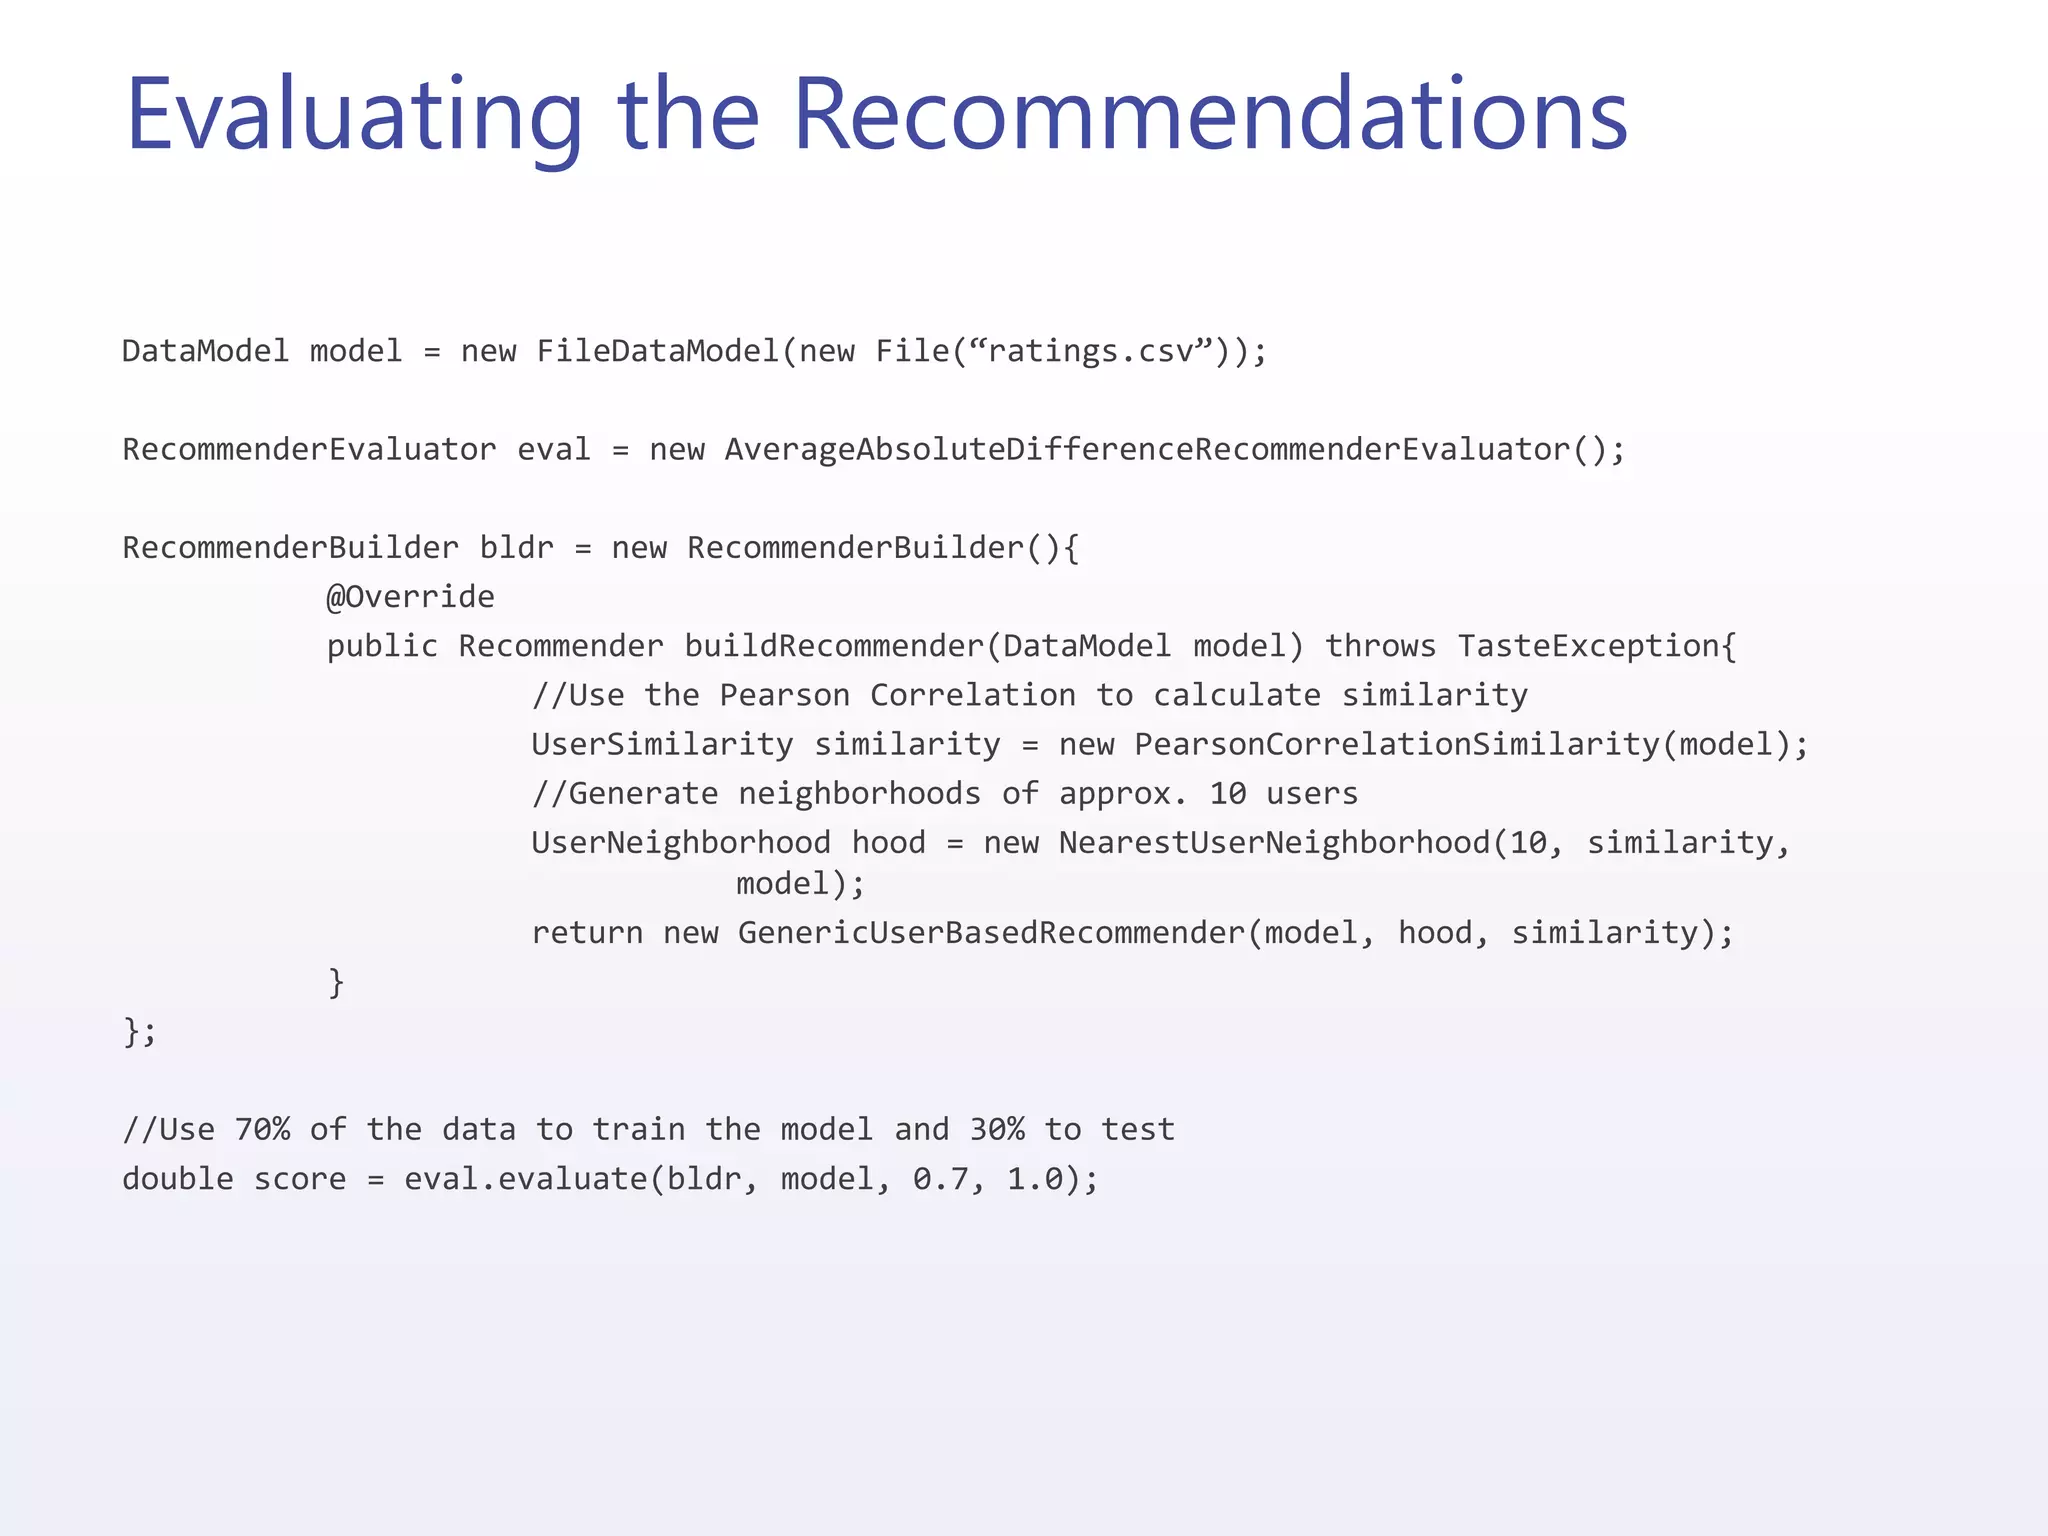

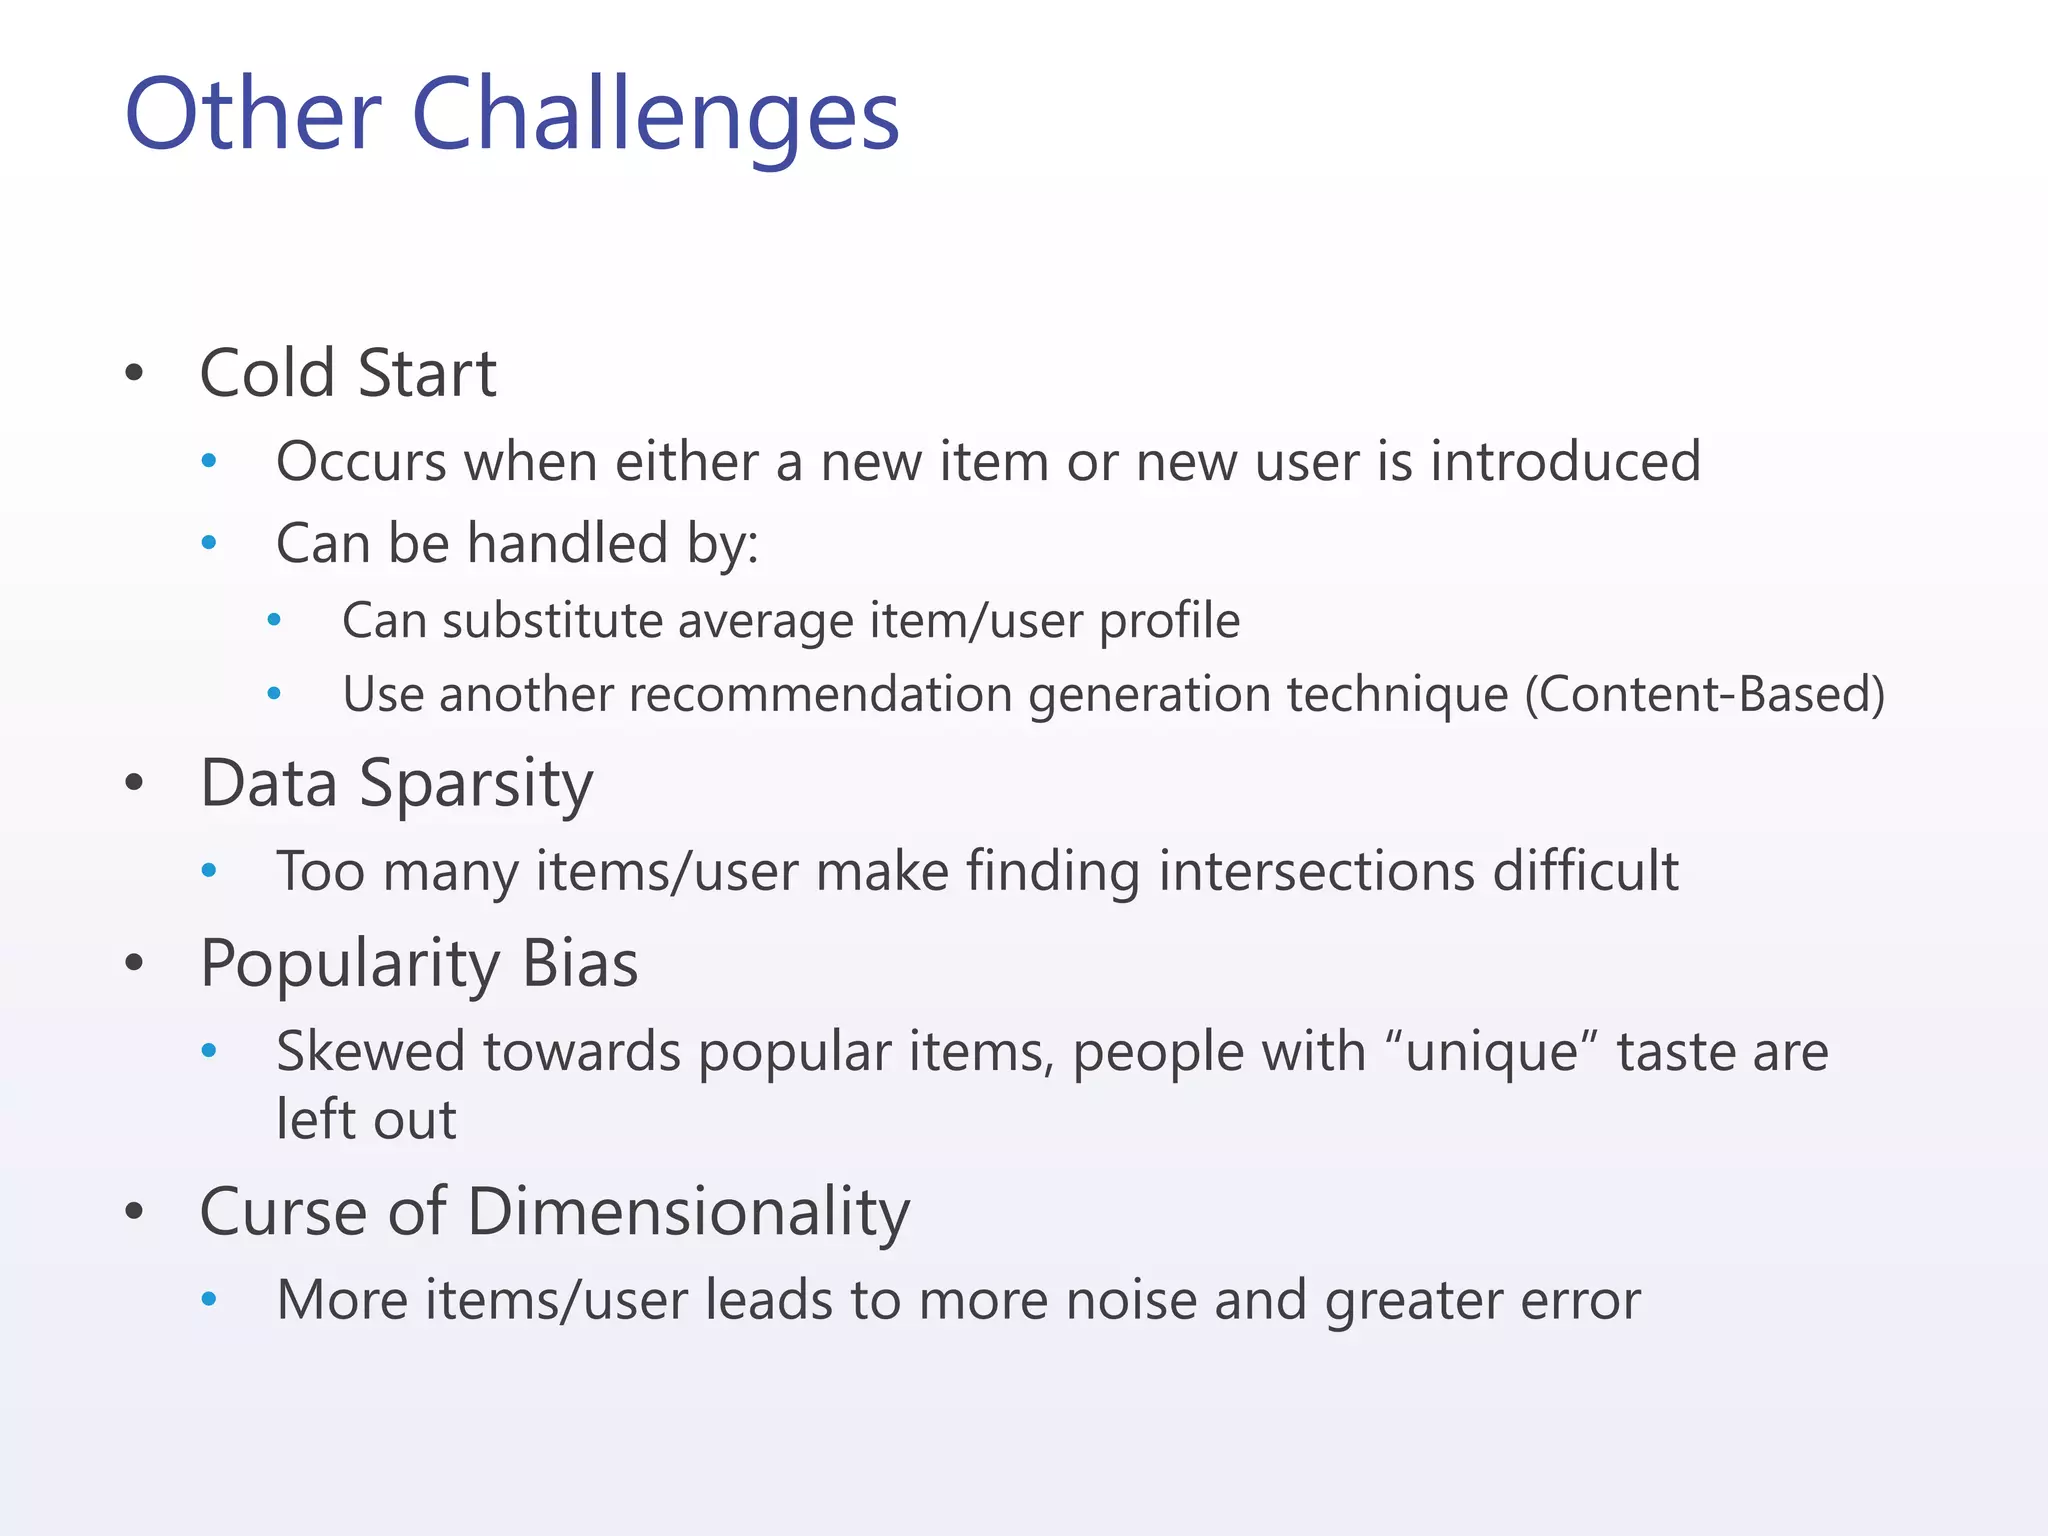

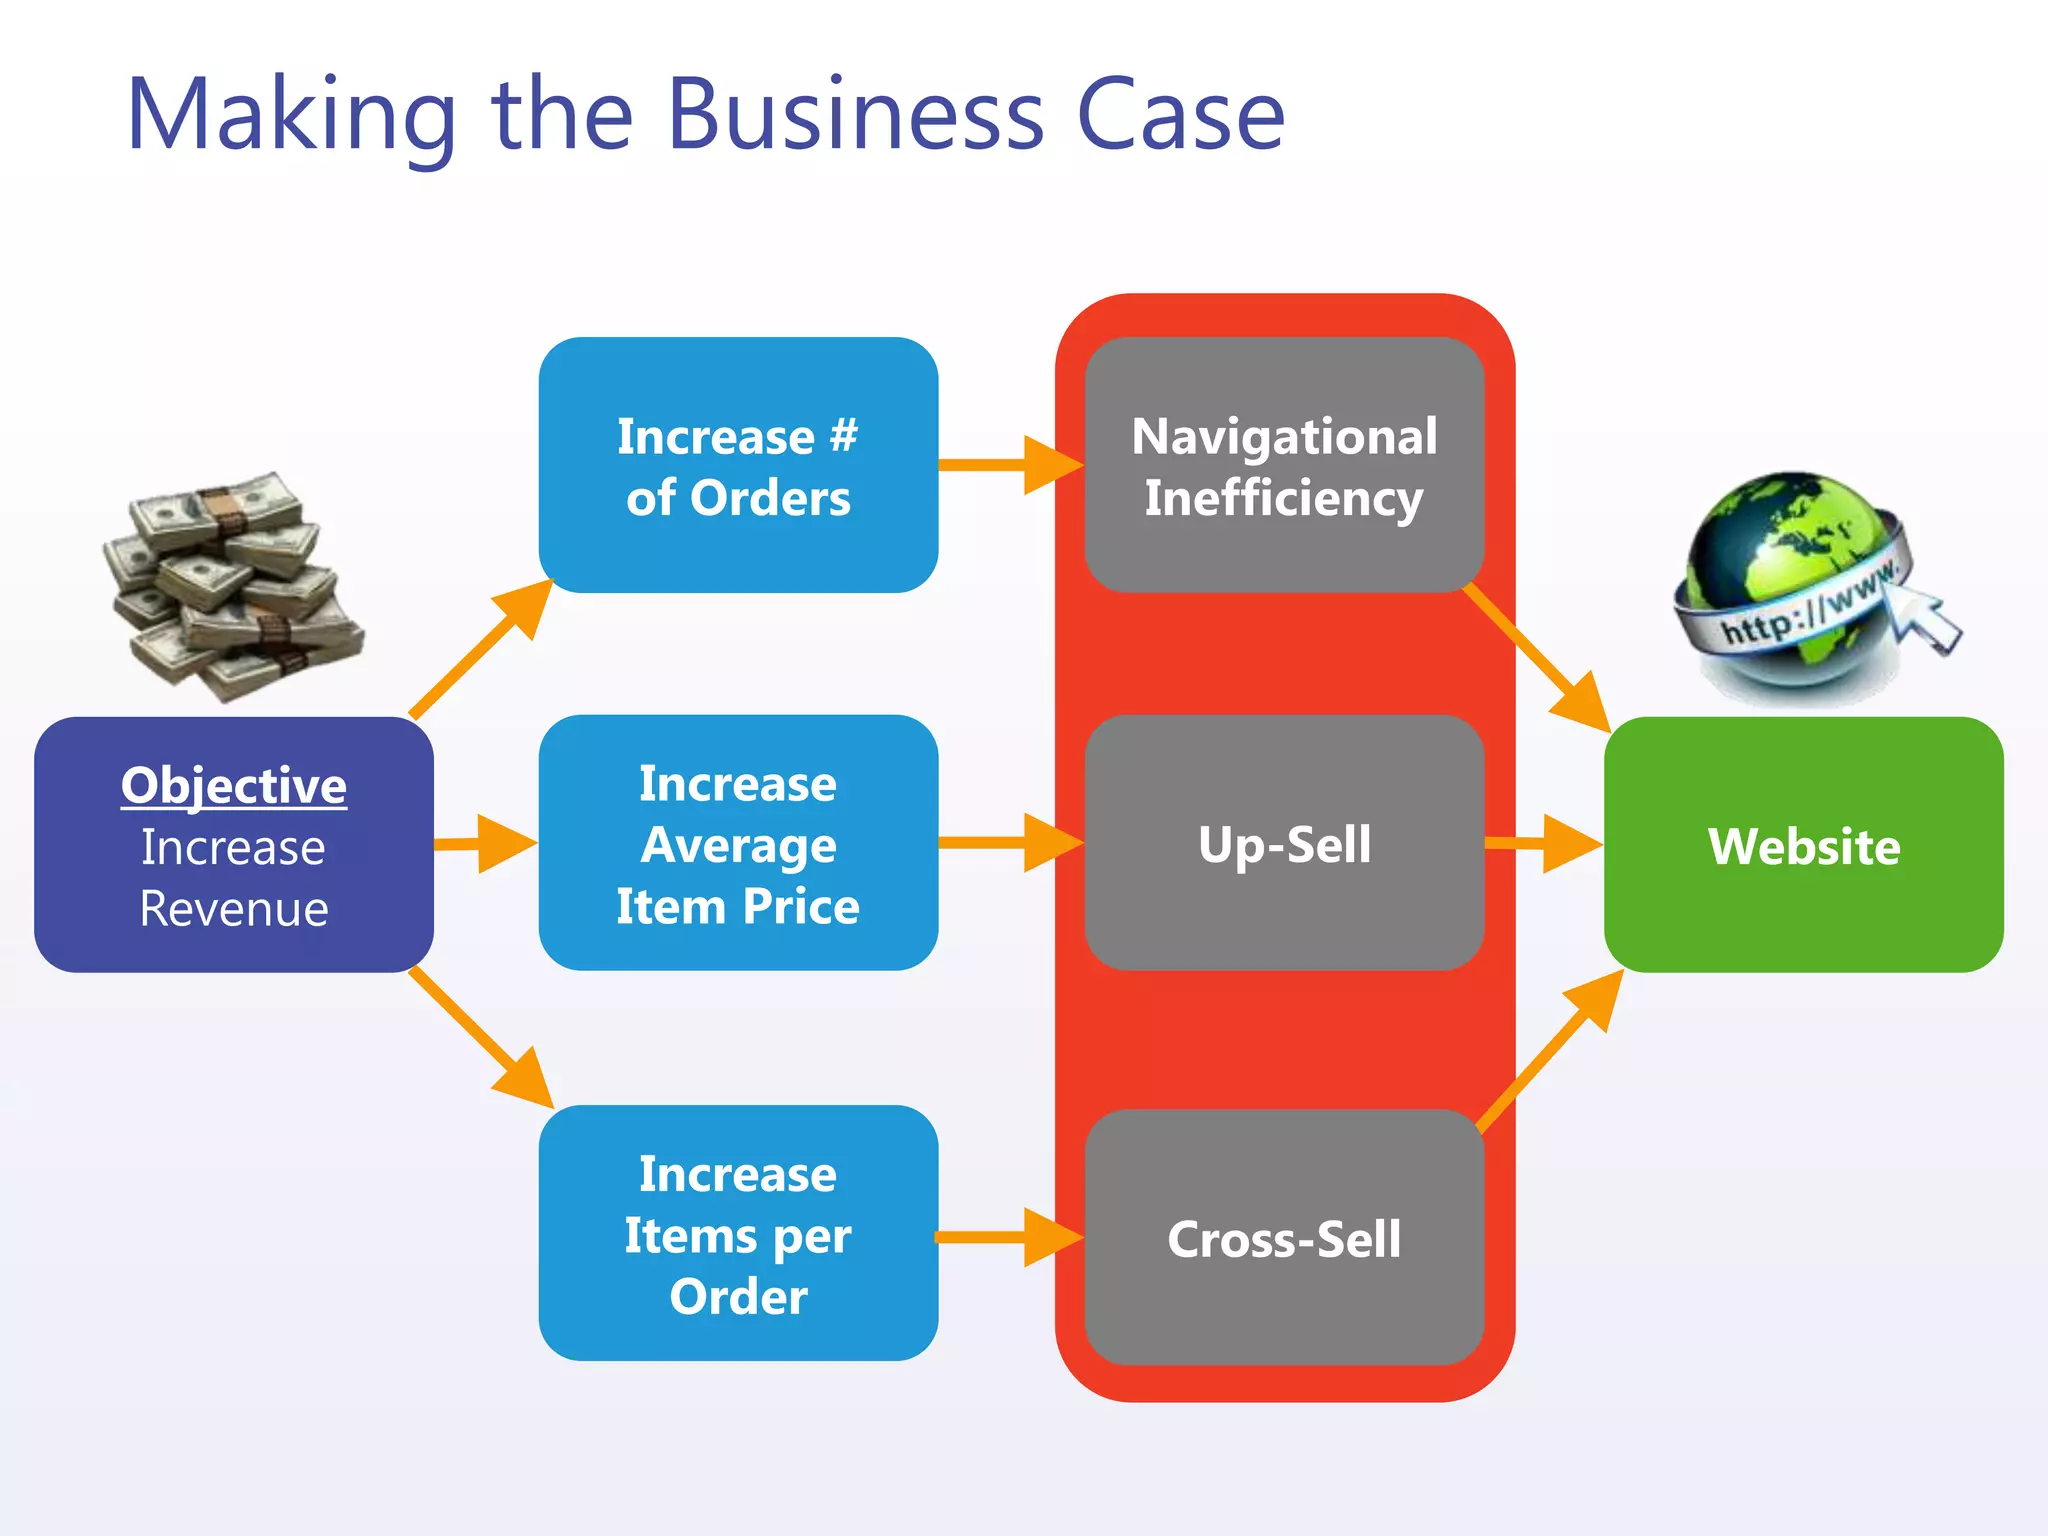
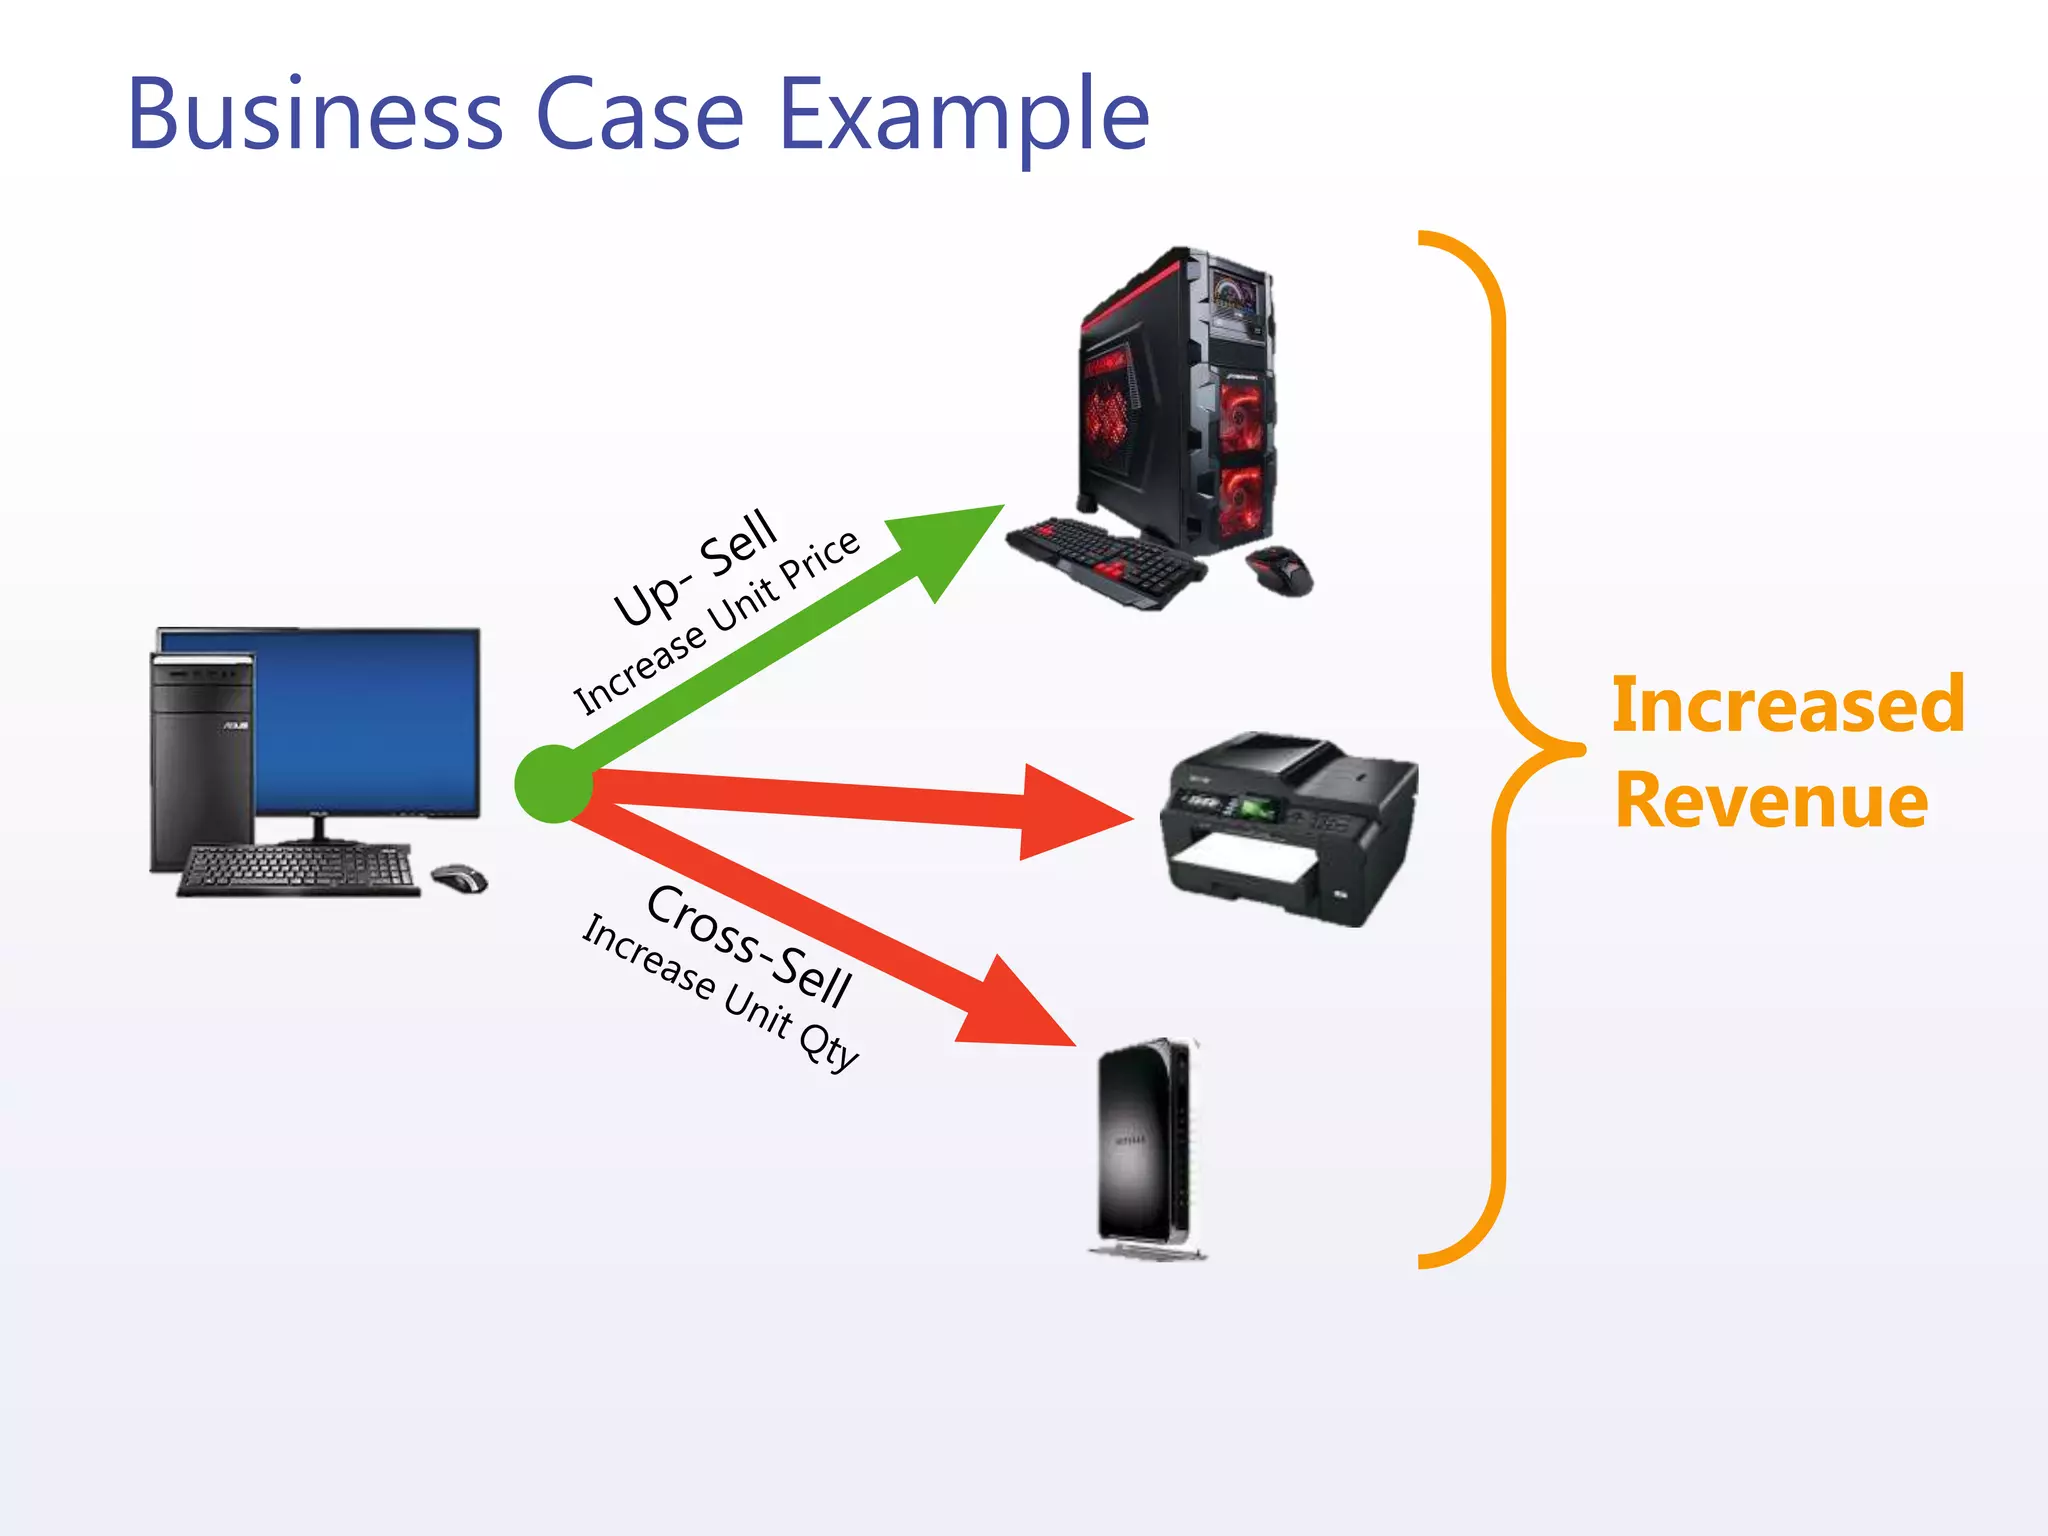
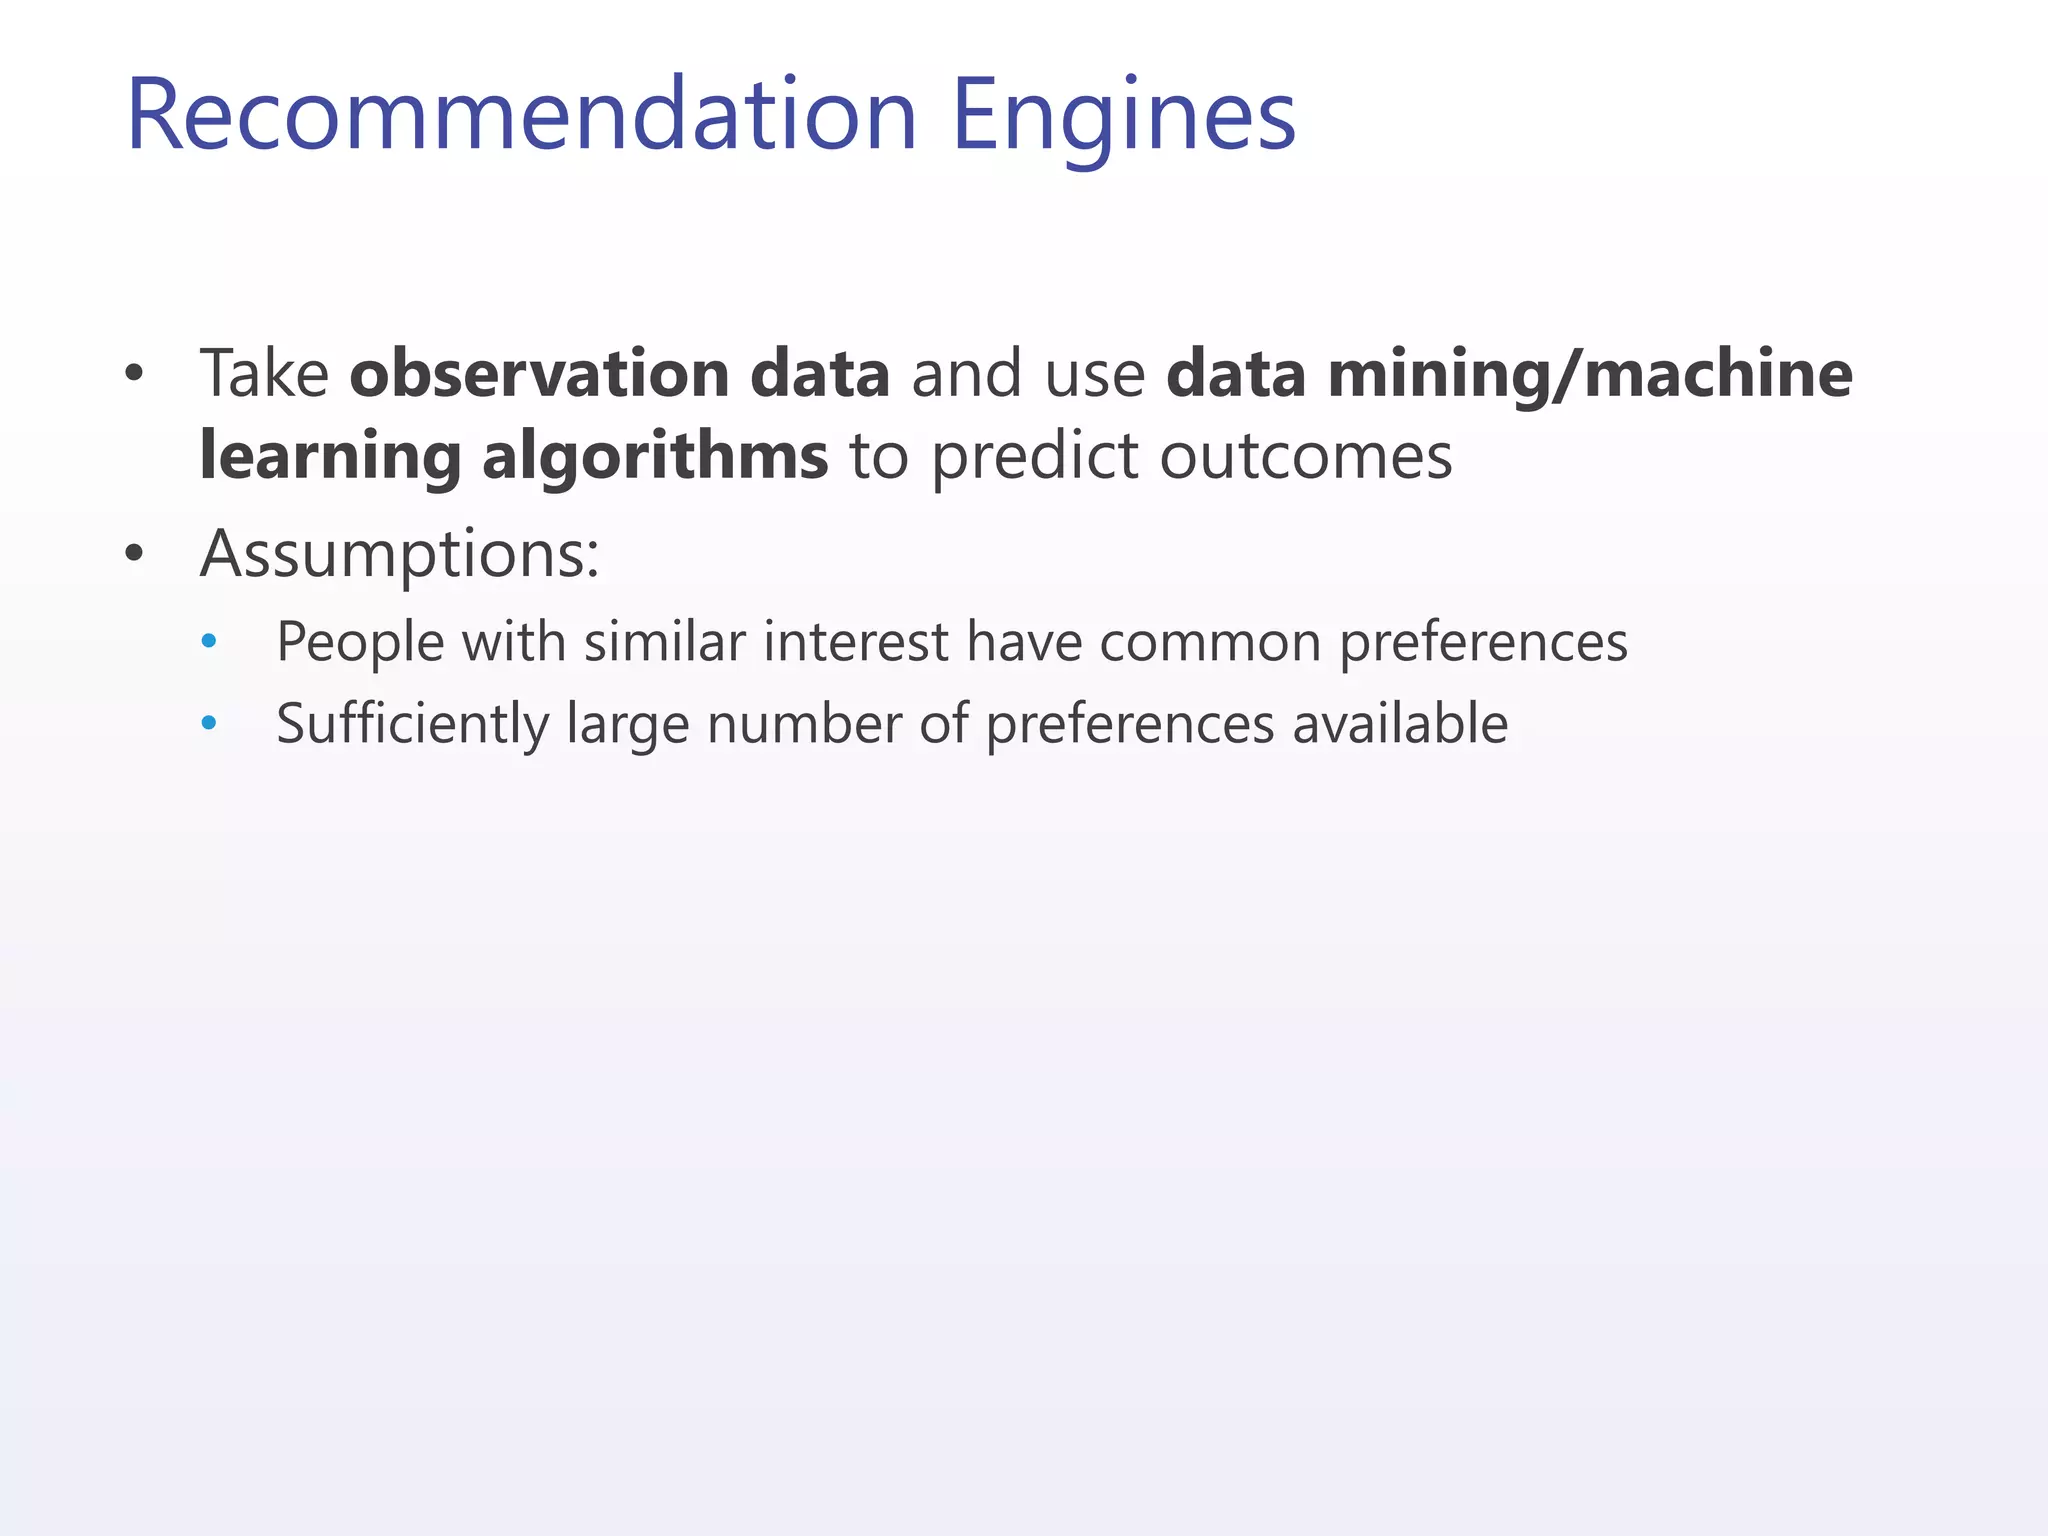
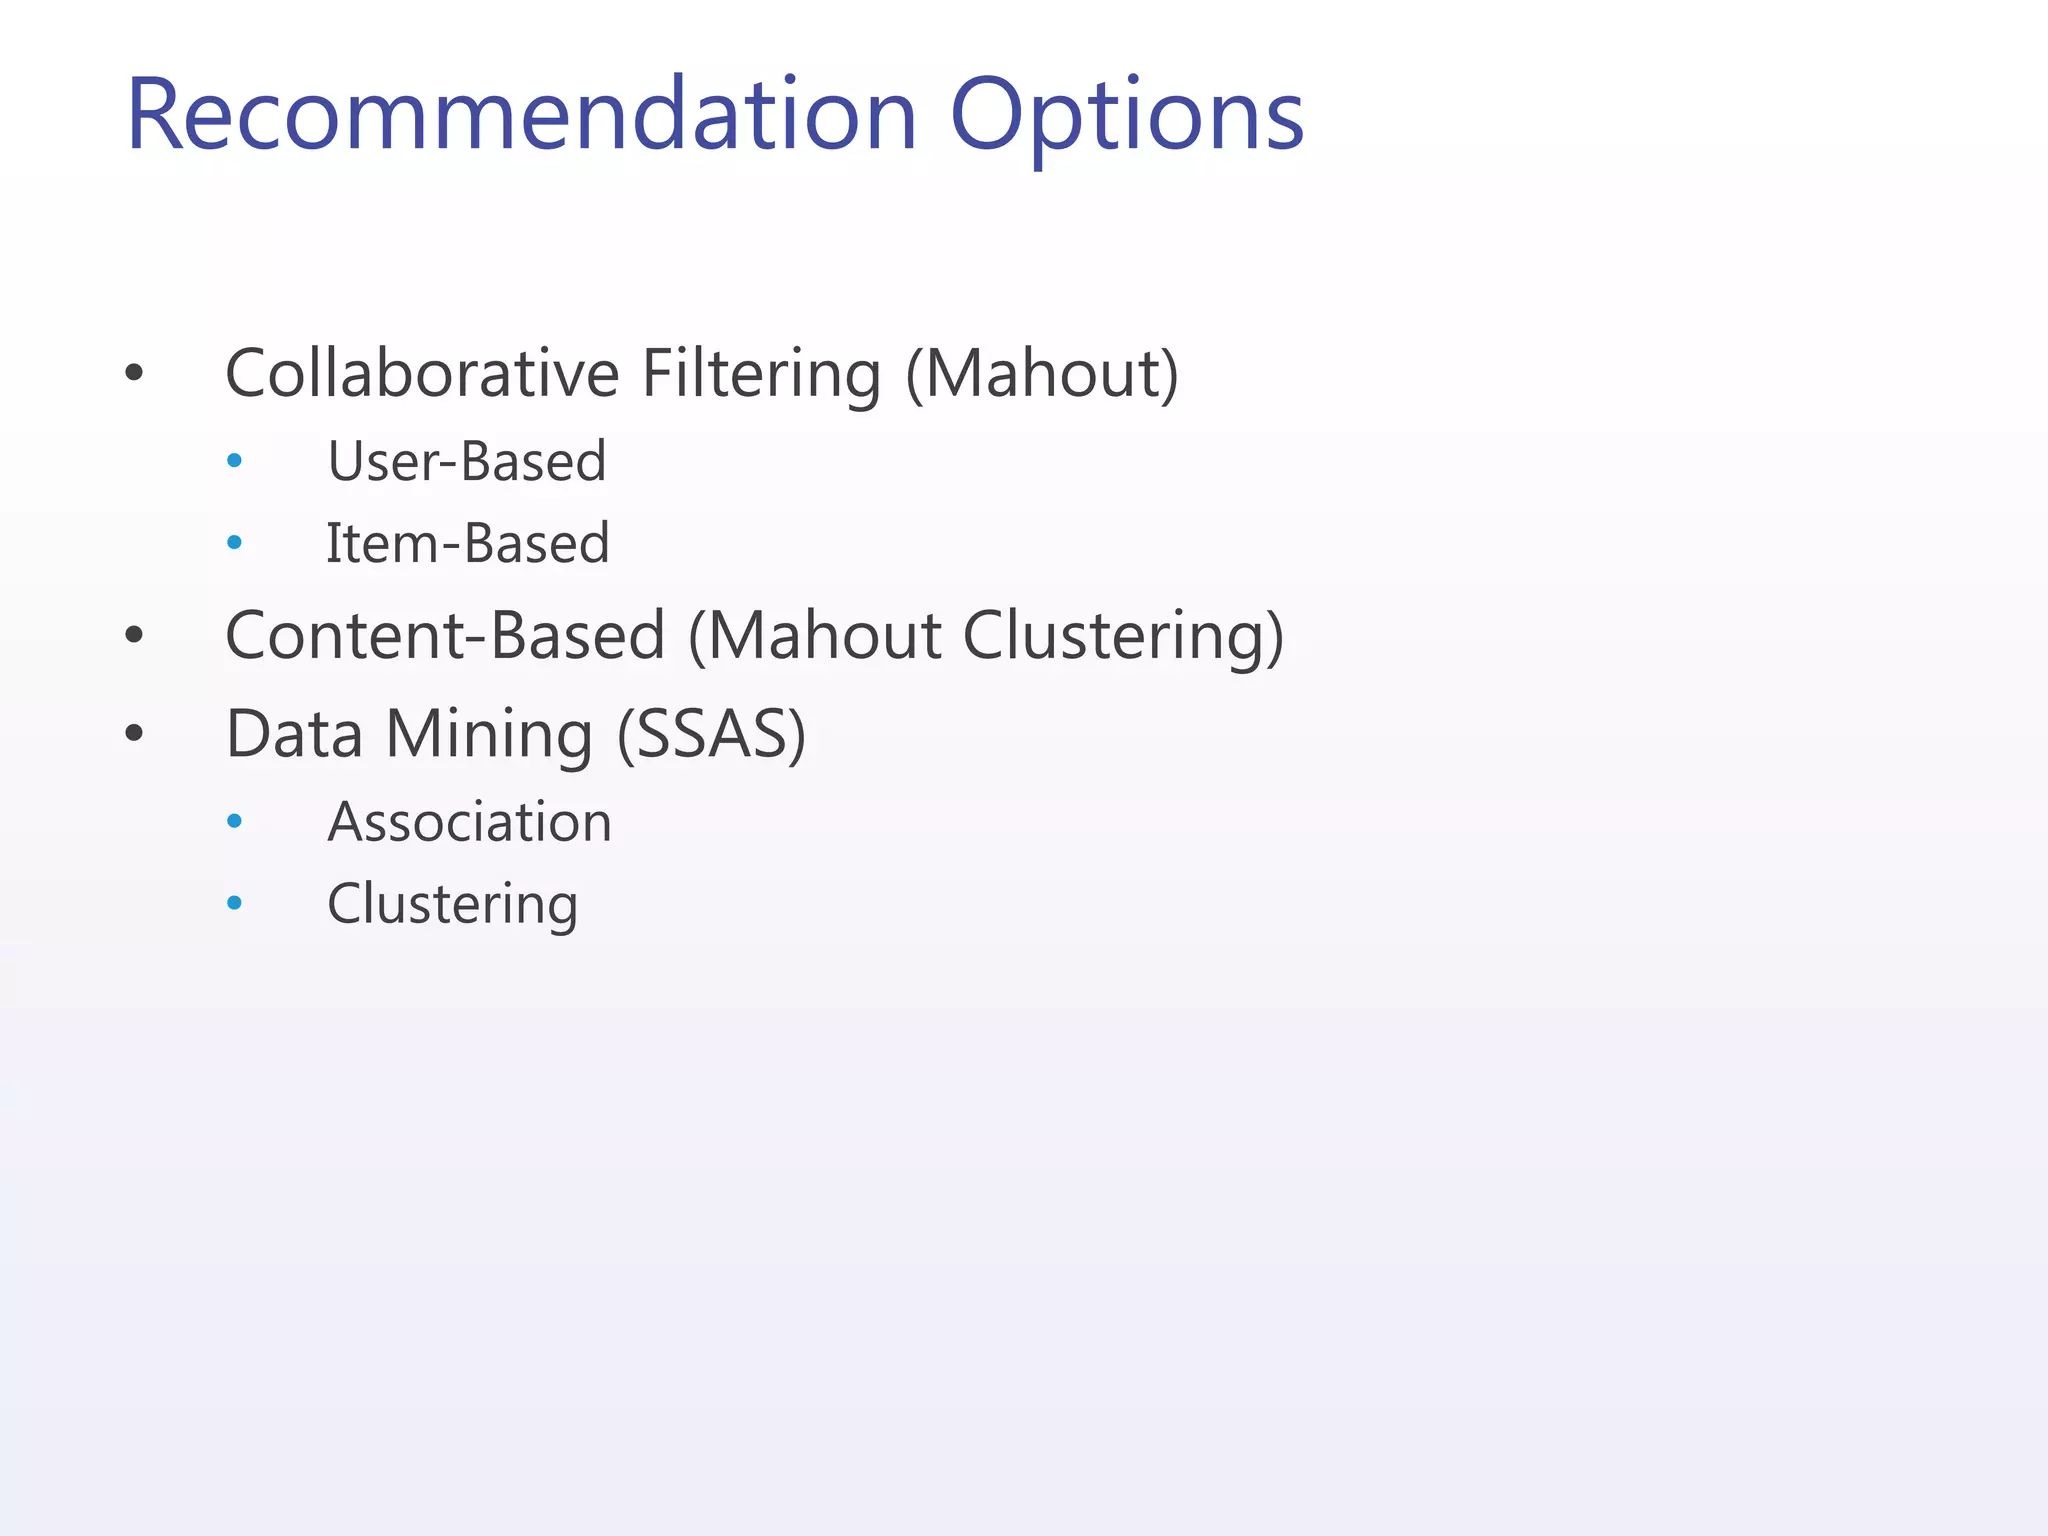
The document discusses the implementation and integration of recommendation engines using predictive analytics with Mahout and HDInsight. It outlines the business case, data preparation, generation of recommendations, and evaluation of their effectiveness while addressing challenges such as cold starts and data sparsity. Key technologies mentioned include machine learning algorithms, collaborative filtering, and methods for storing and integrating recommendation data.


![UiPath Automation Suite Installation (Hands-On) [2/3]](https://cdn.slidesharecdn.com/ss_thumbnails/automationsuitecommunitysession2-251015095633-a6d862f1-thumbnail.jpg?width=600ounds&width=560&fit=bounds)


