Download as PDF, PPTX


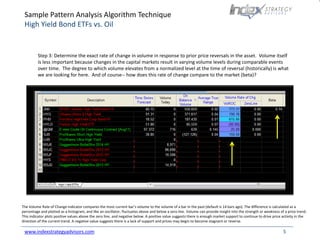
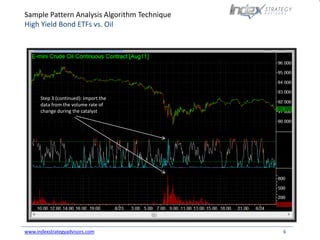


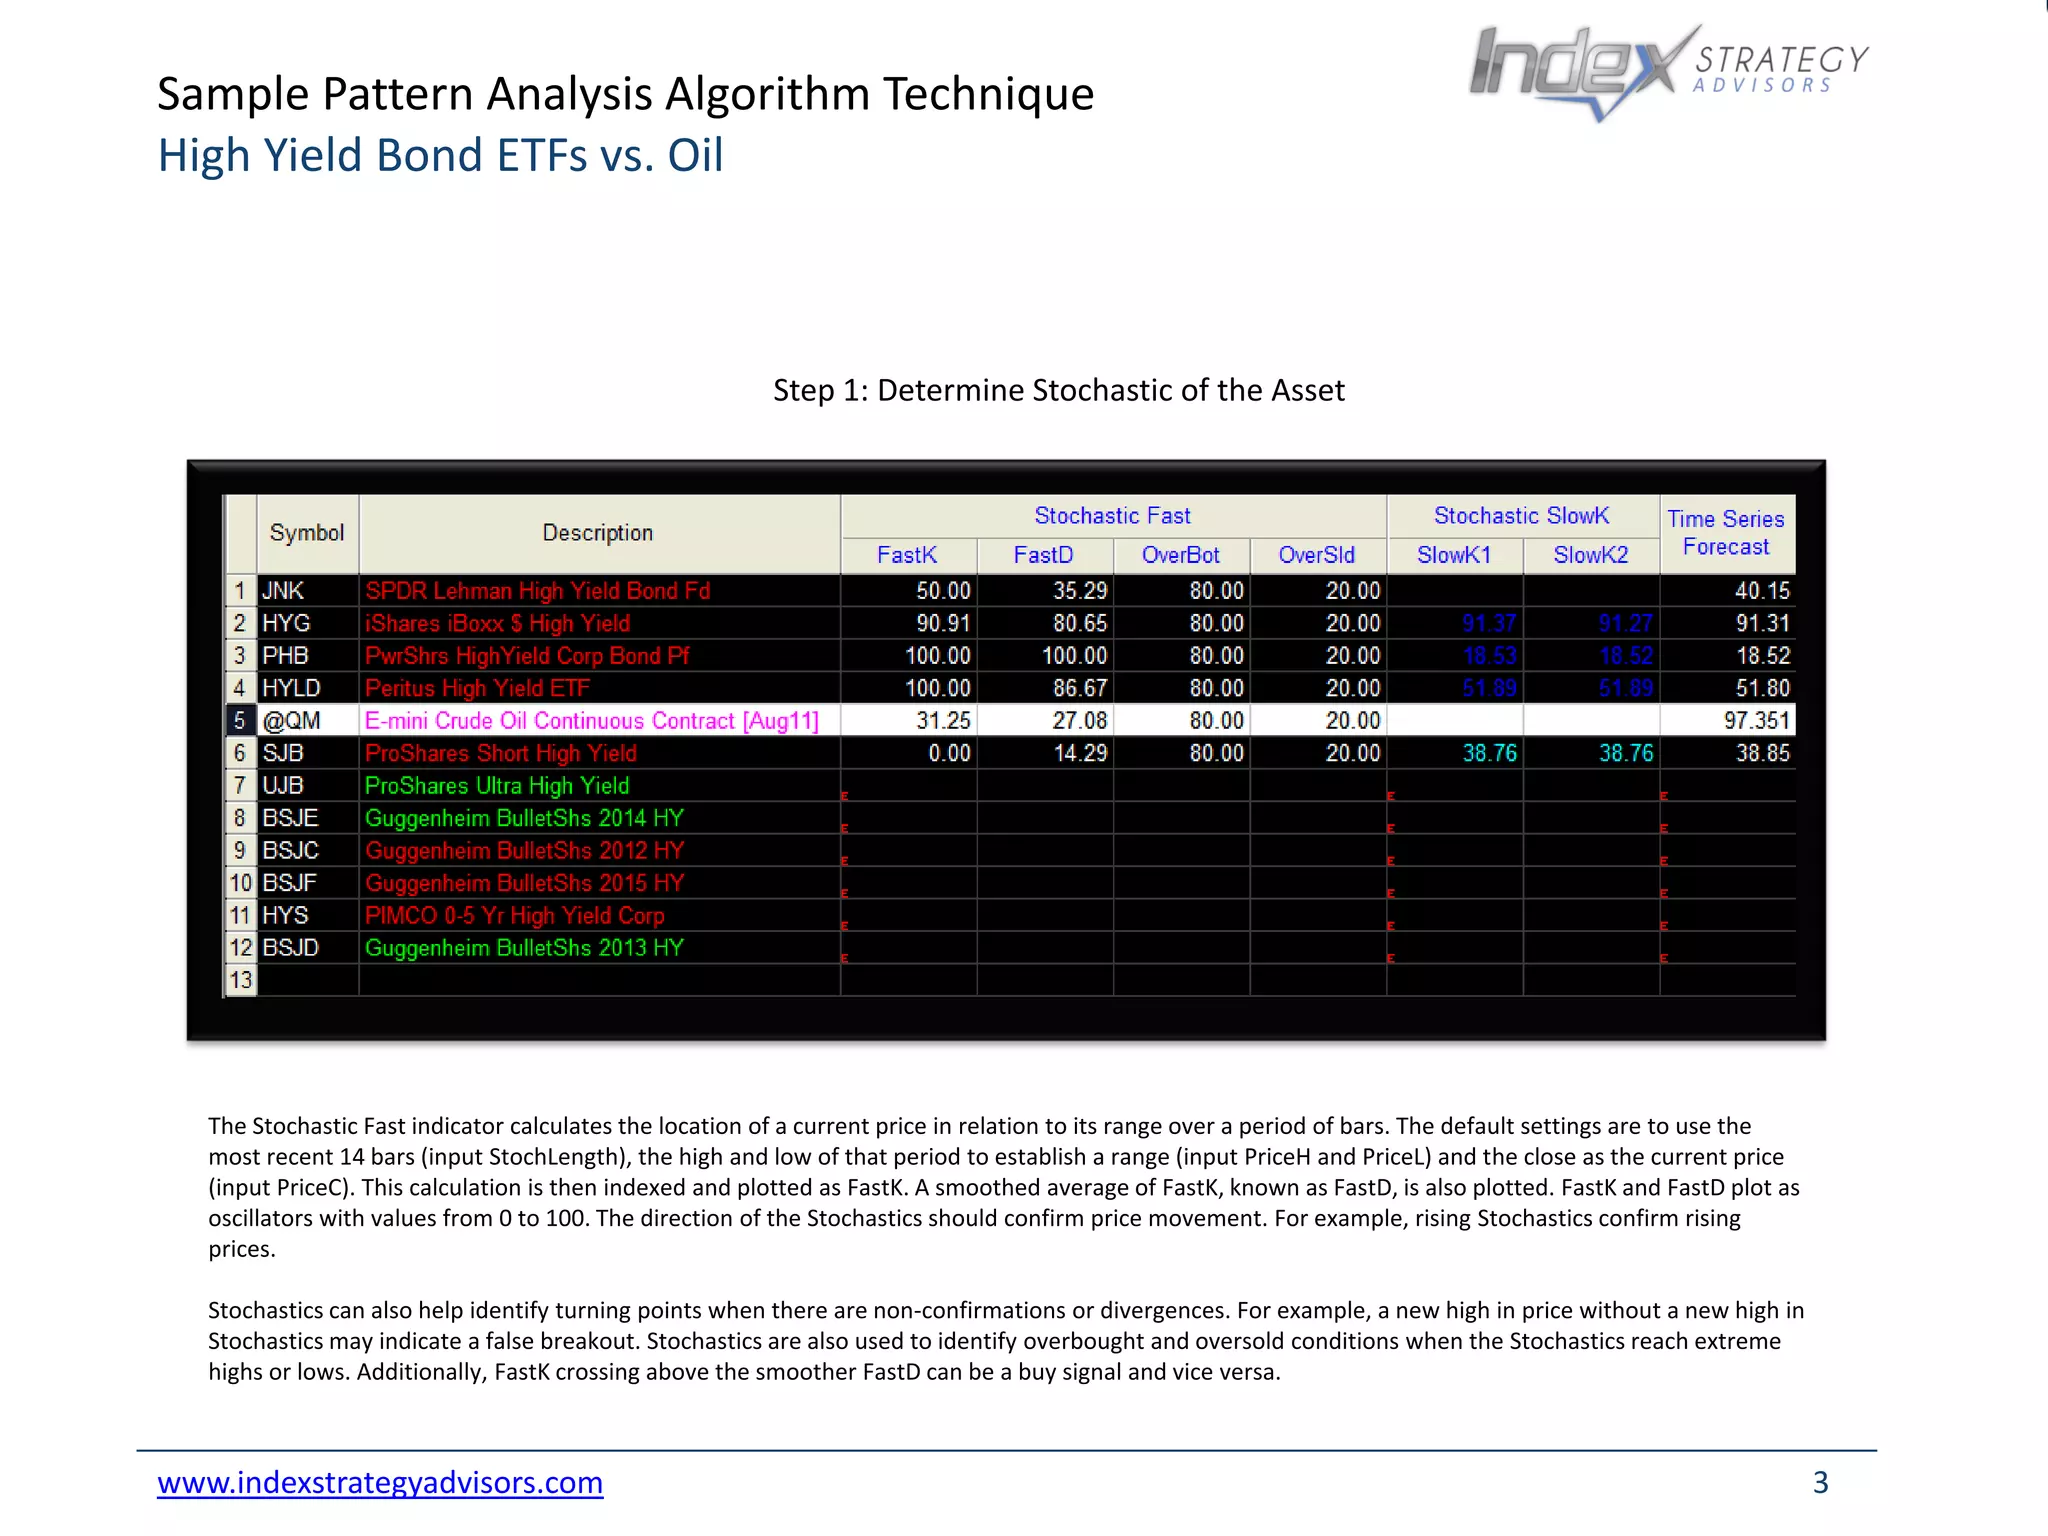


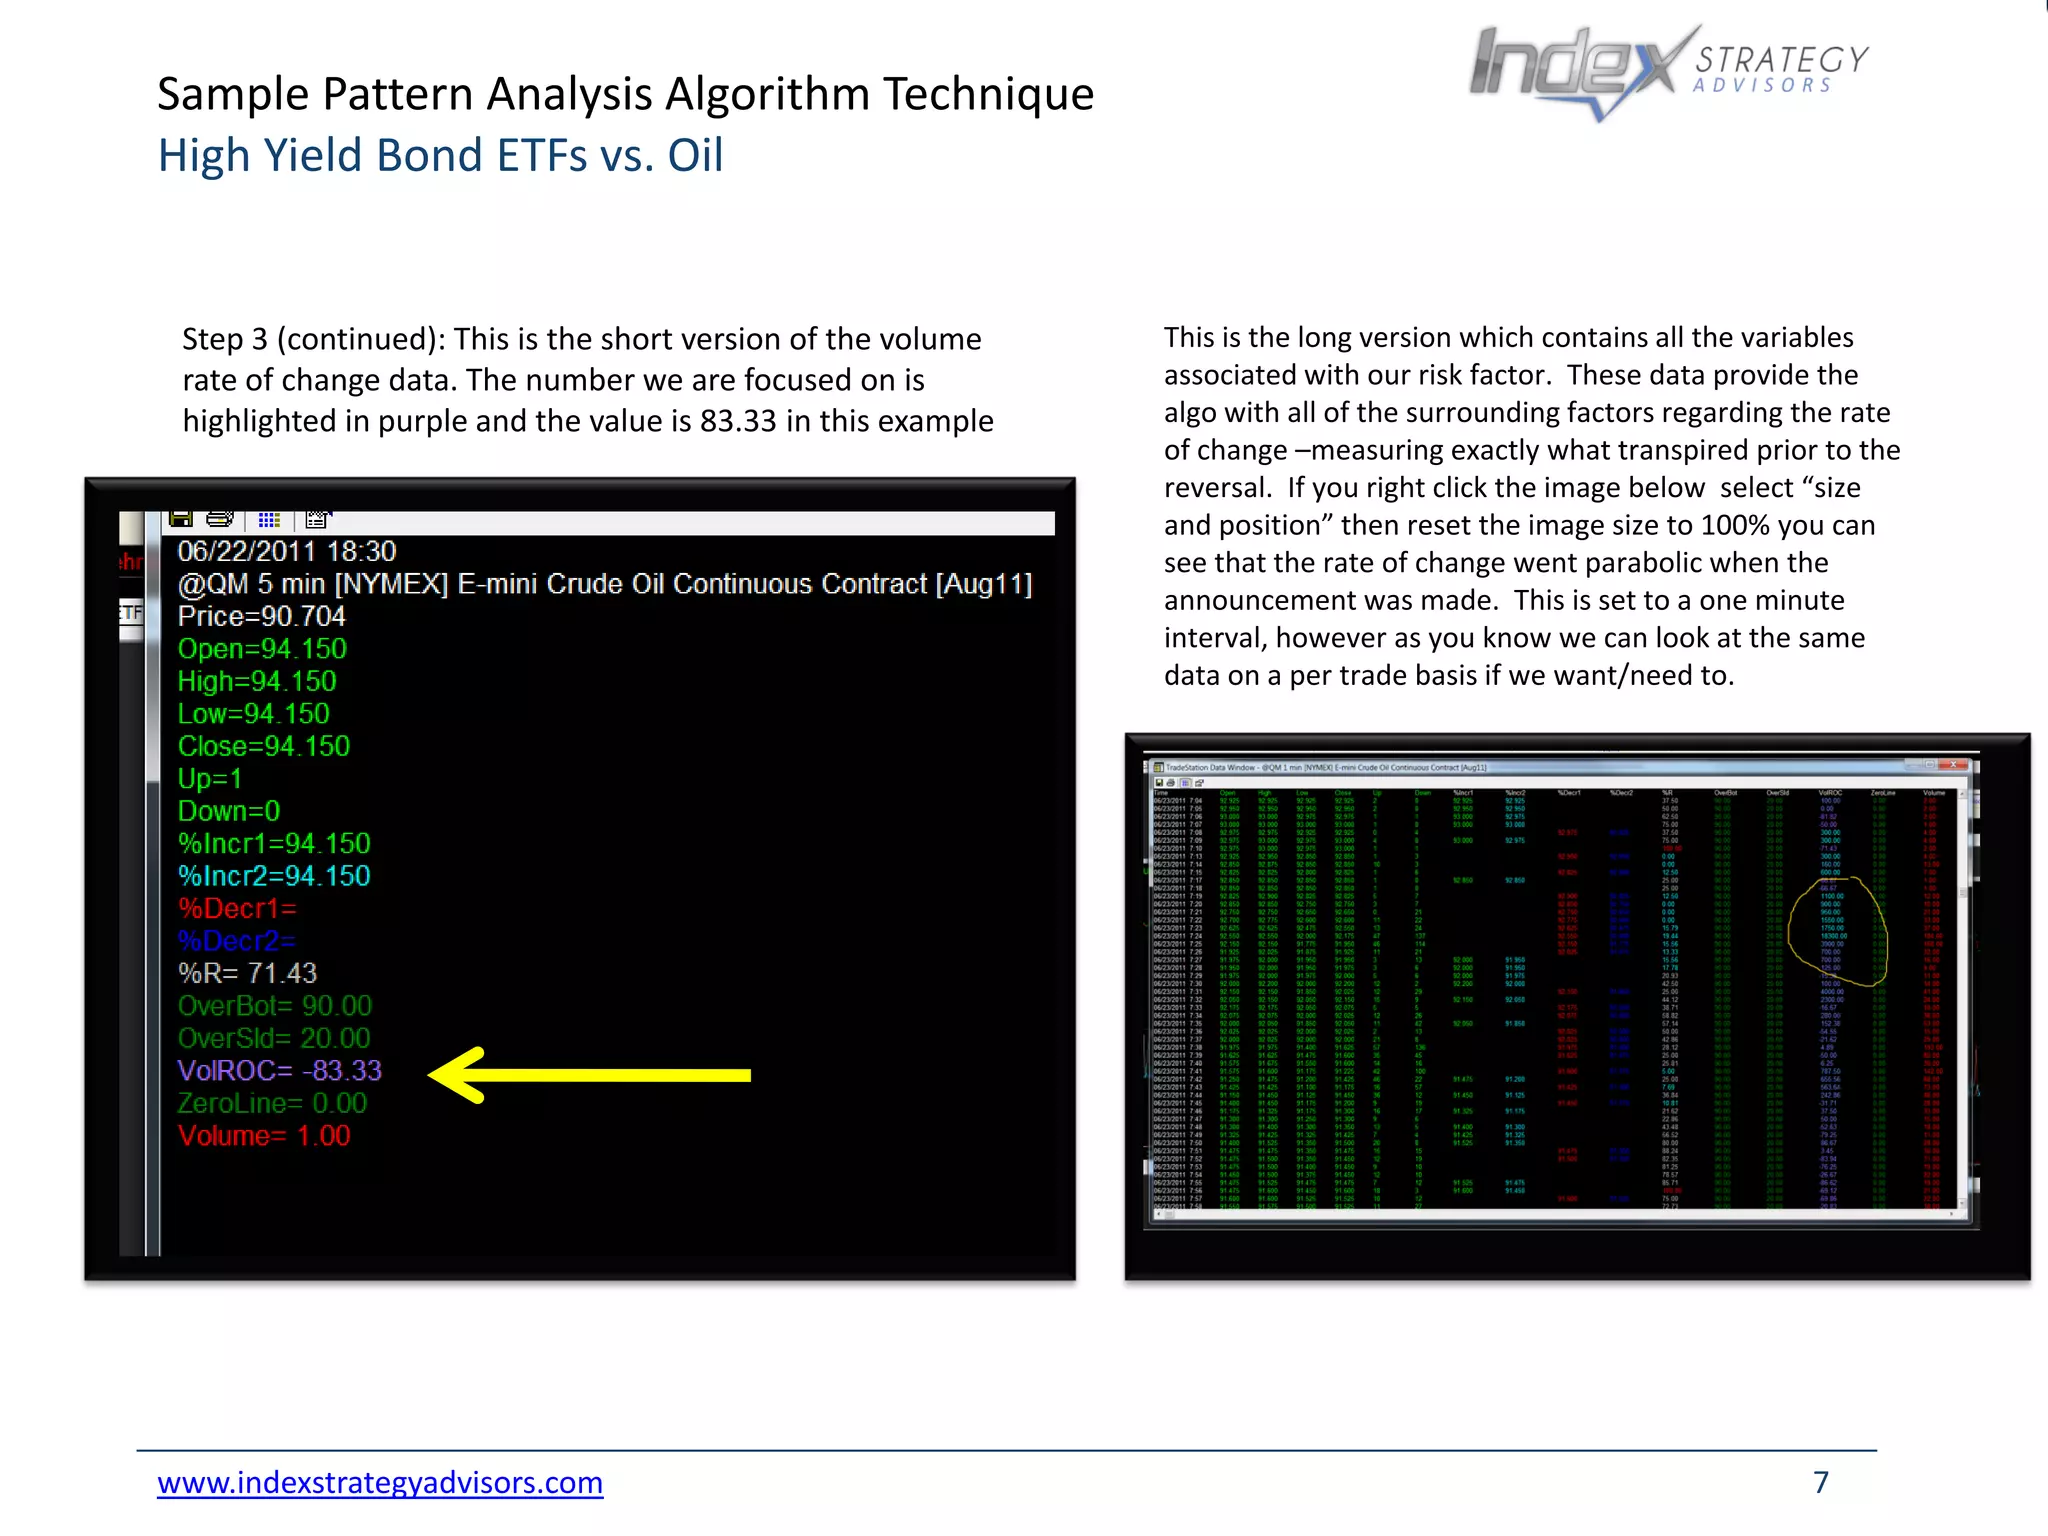
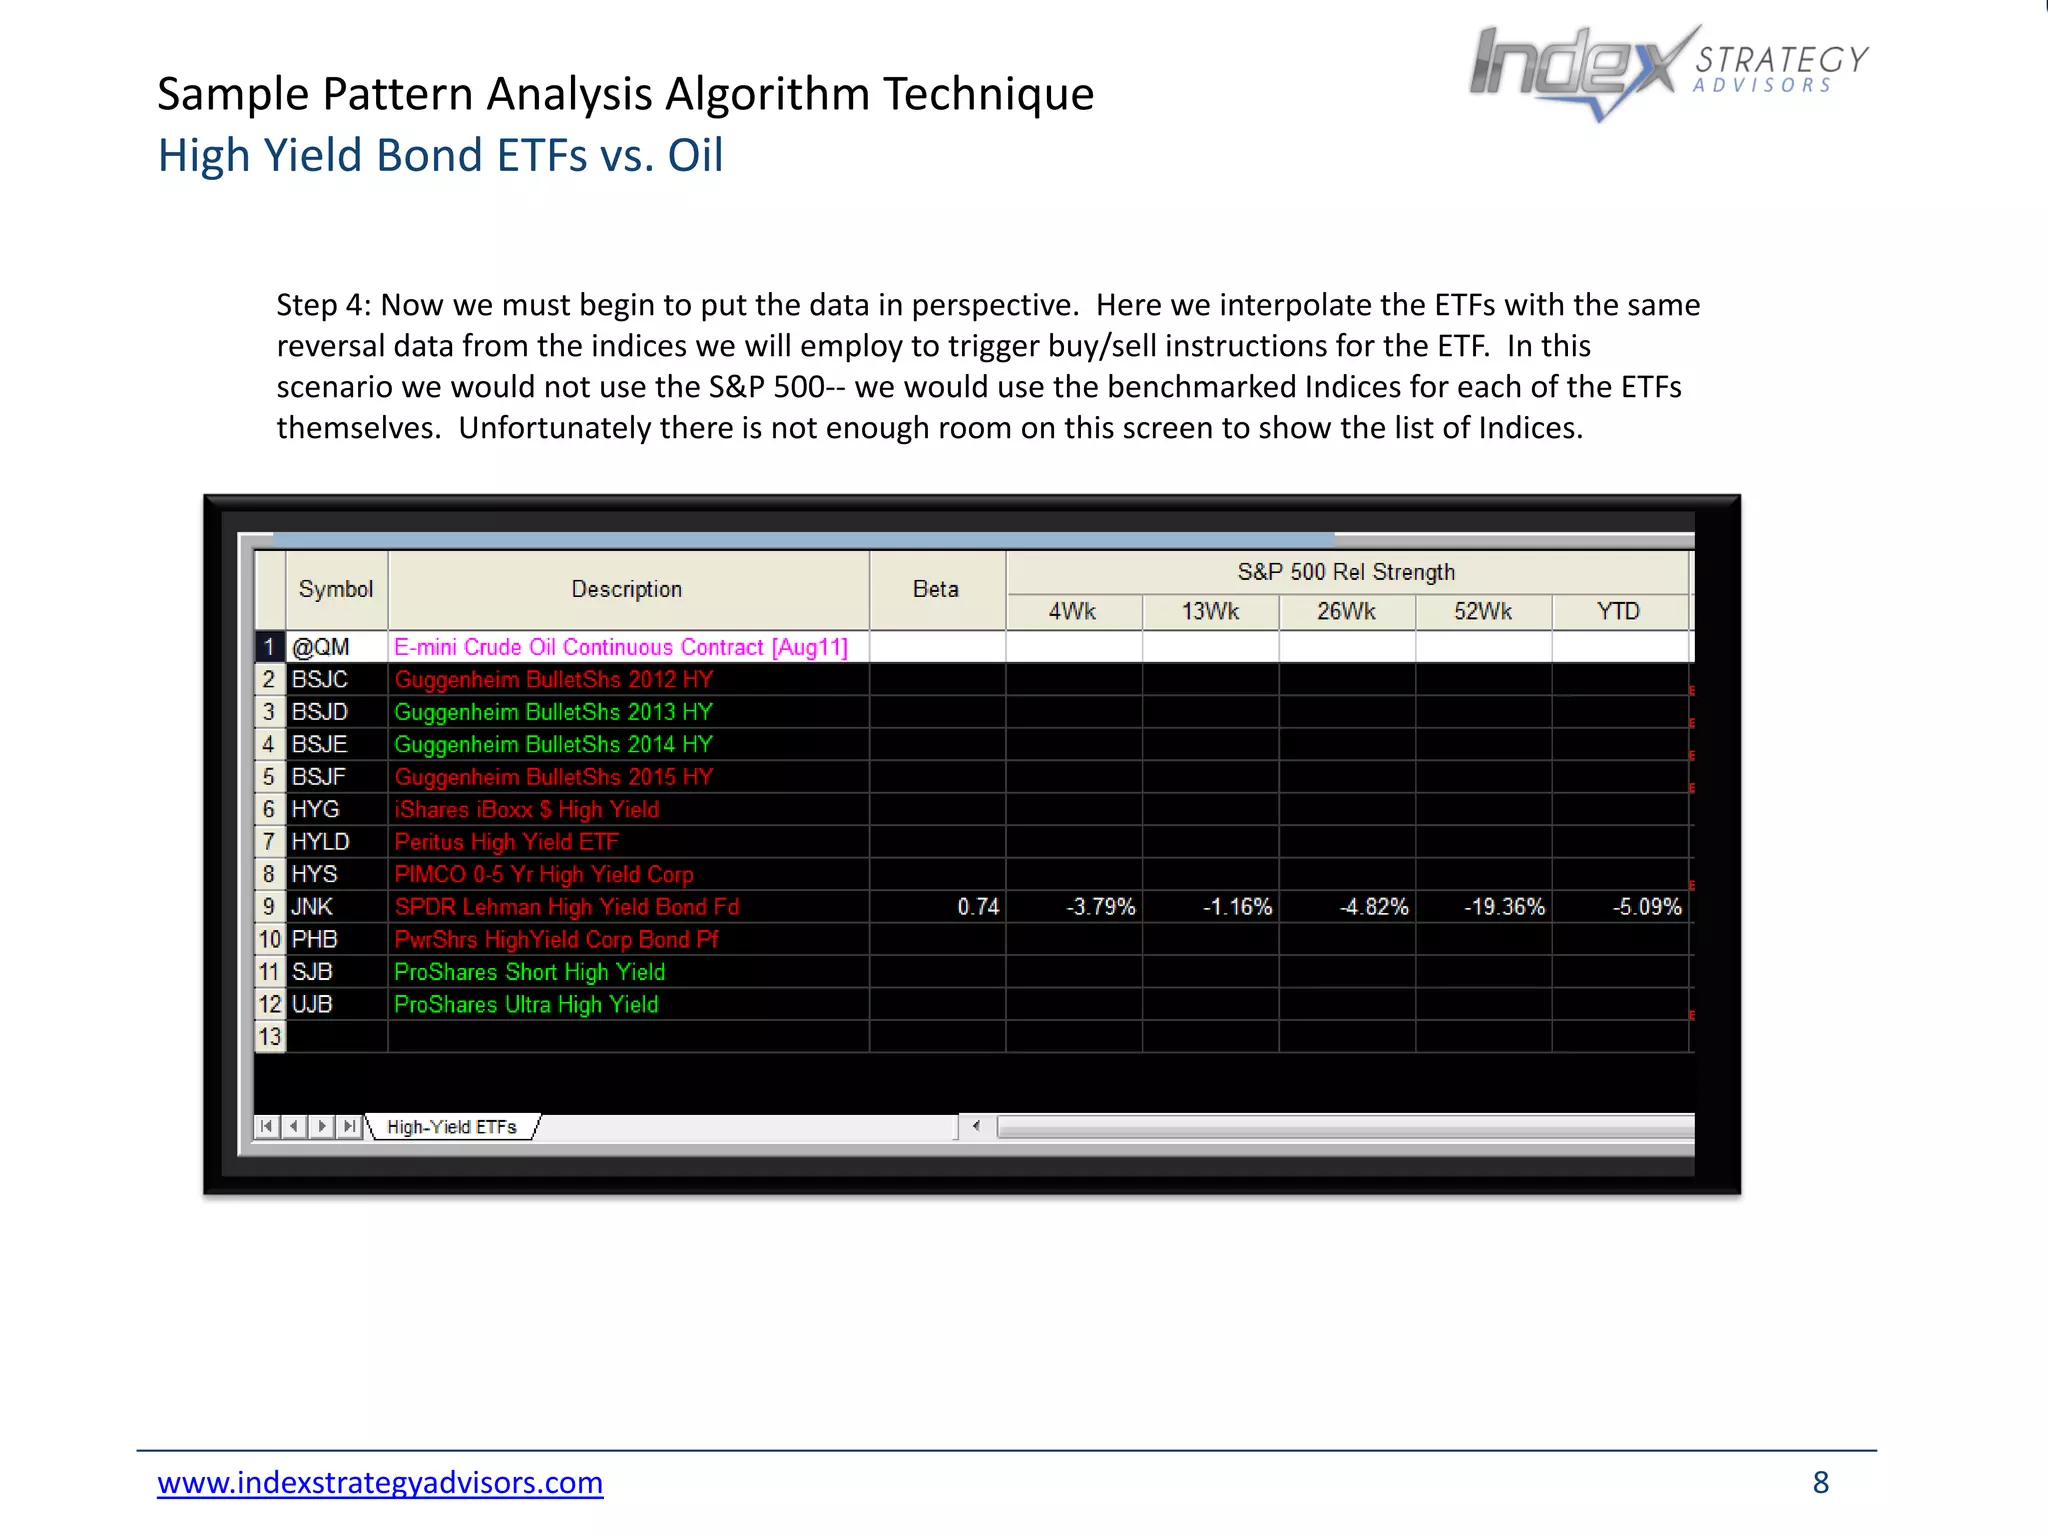
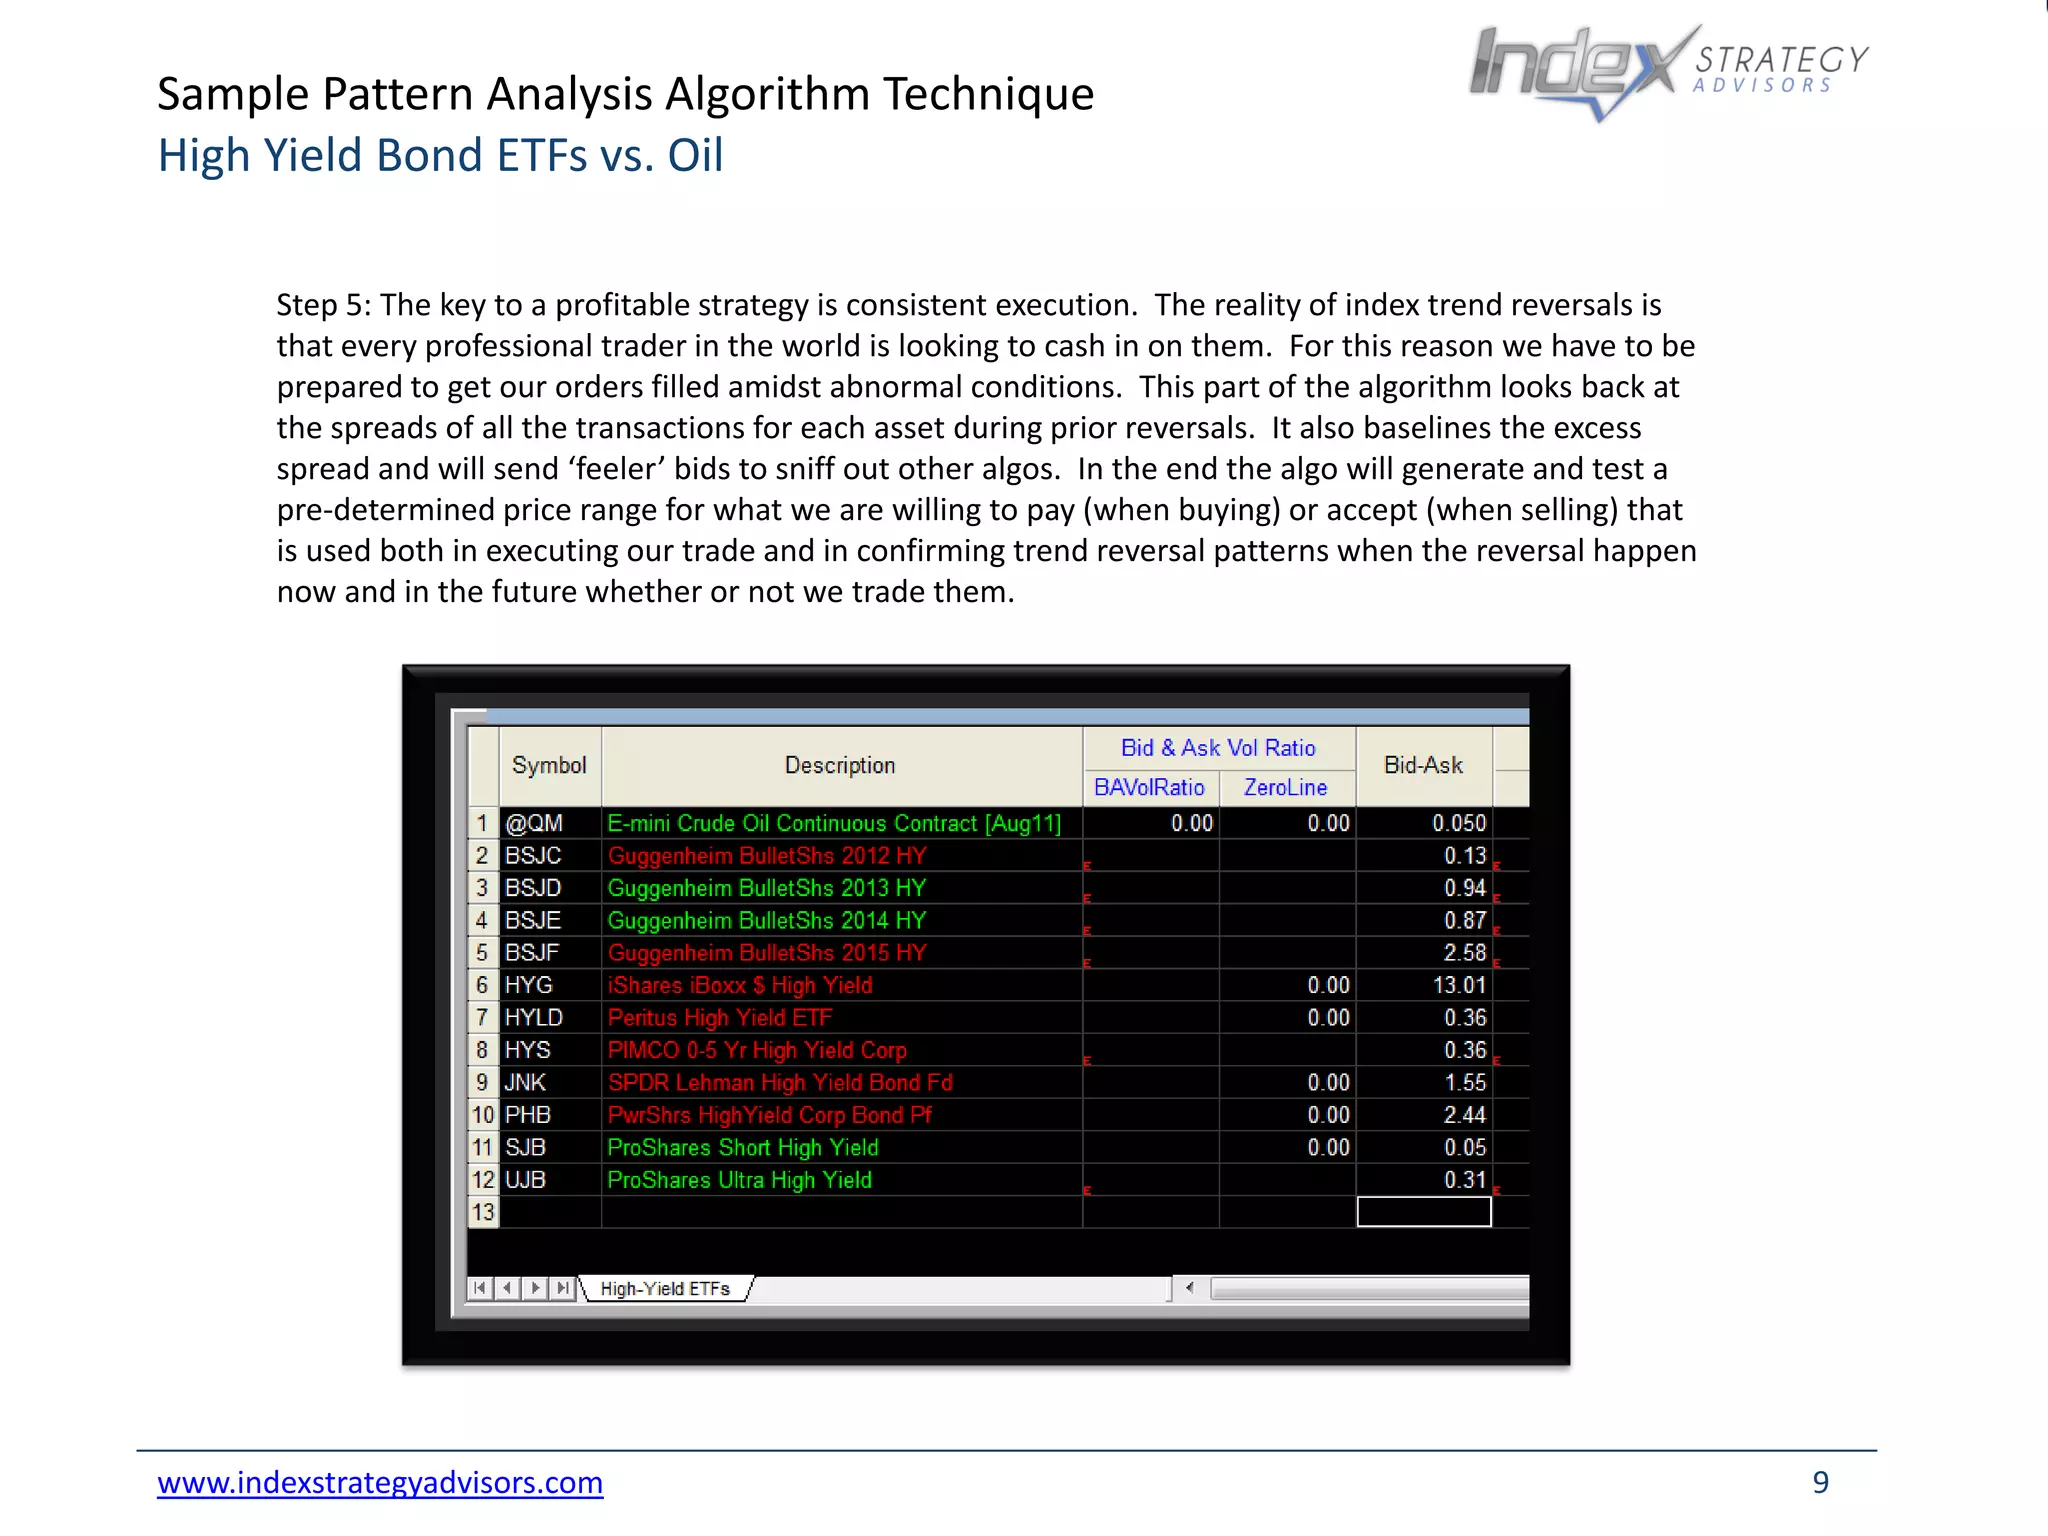


This document outlines a sample pattern analysis algorithm technique for analyzing high yield bond ETFs in relation to oil price trends, emphasizing the use of various indicators like stochastics, volume rate of change, and institutional buying/selling. It details a systematic process for executing trades based on identified trend reversals and the importance of backtesting, risk factors, and consistent execution. Ultimately, the algorithm incorporates 33 indicators to generate factors critical for trading decisions and maximizing profit potential.


