


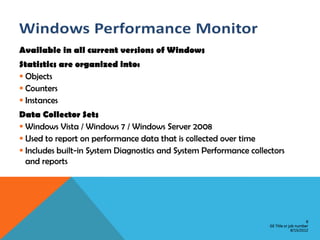


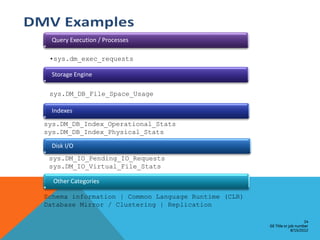


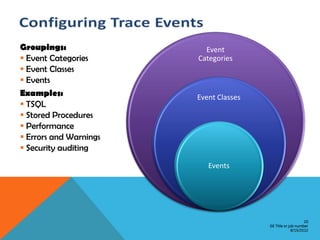

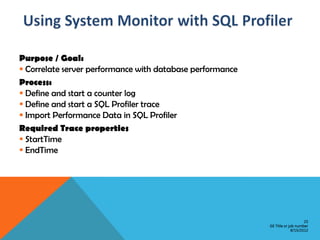

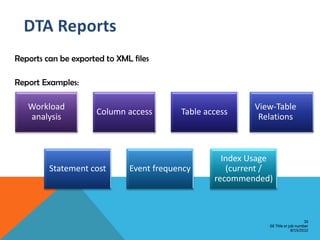

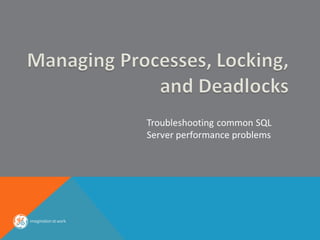

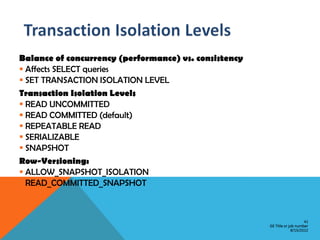
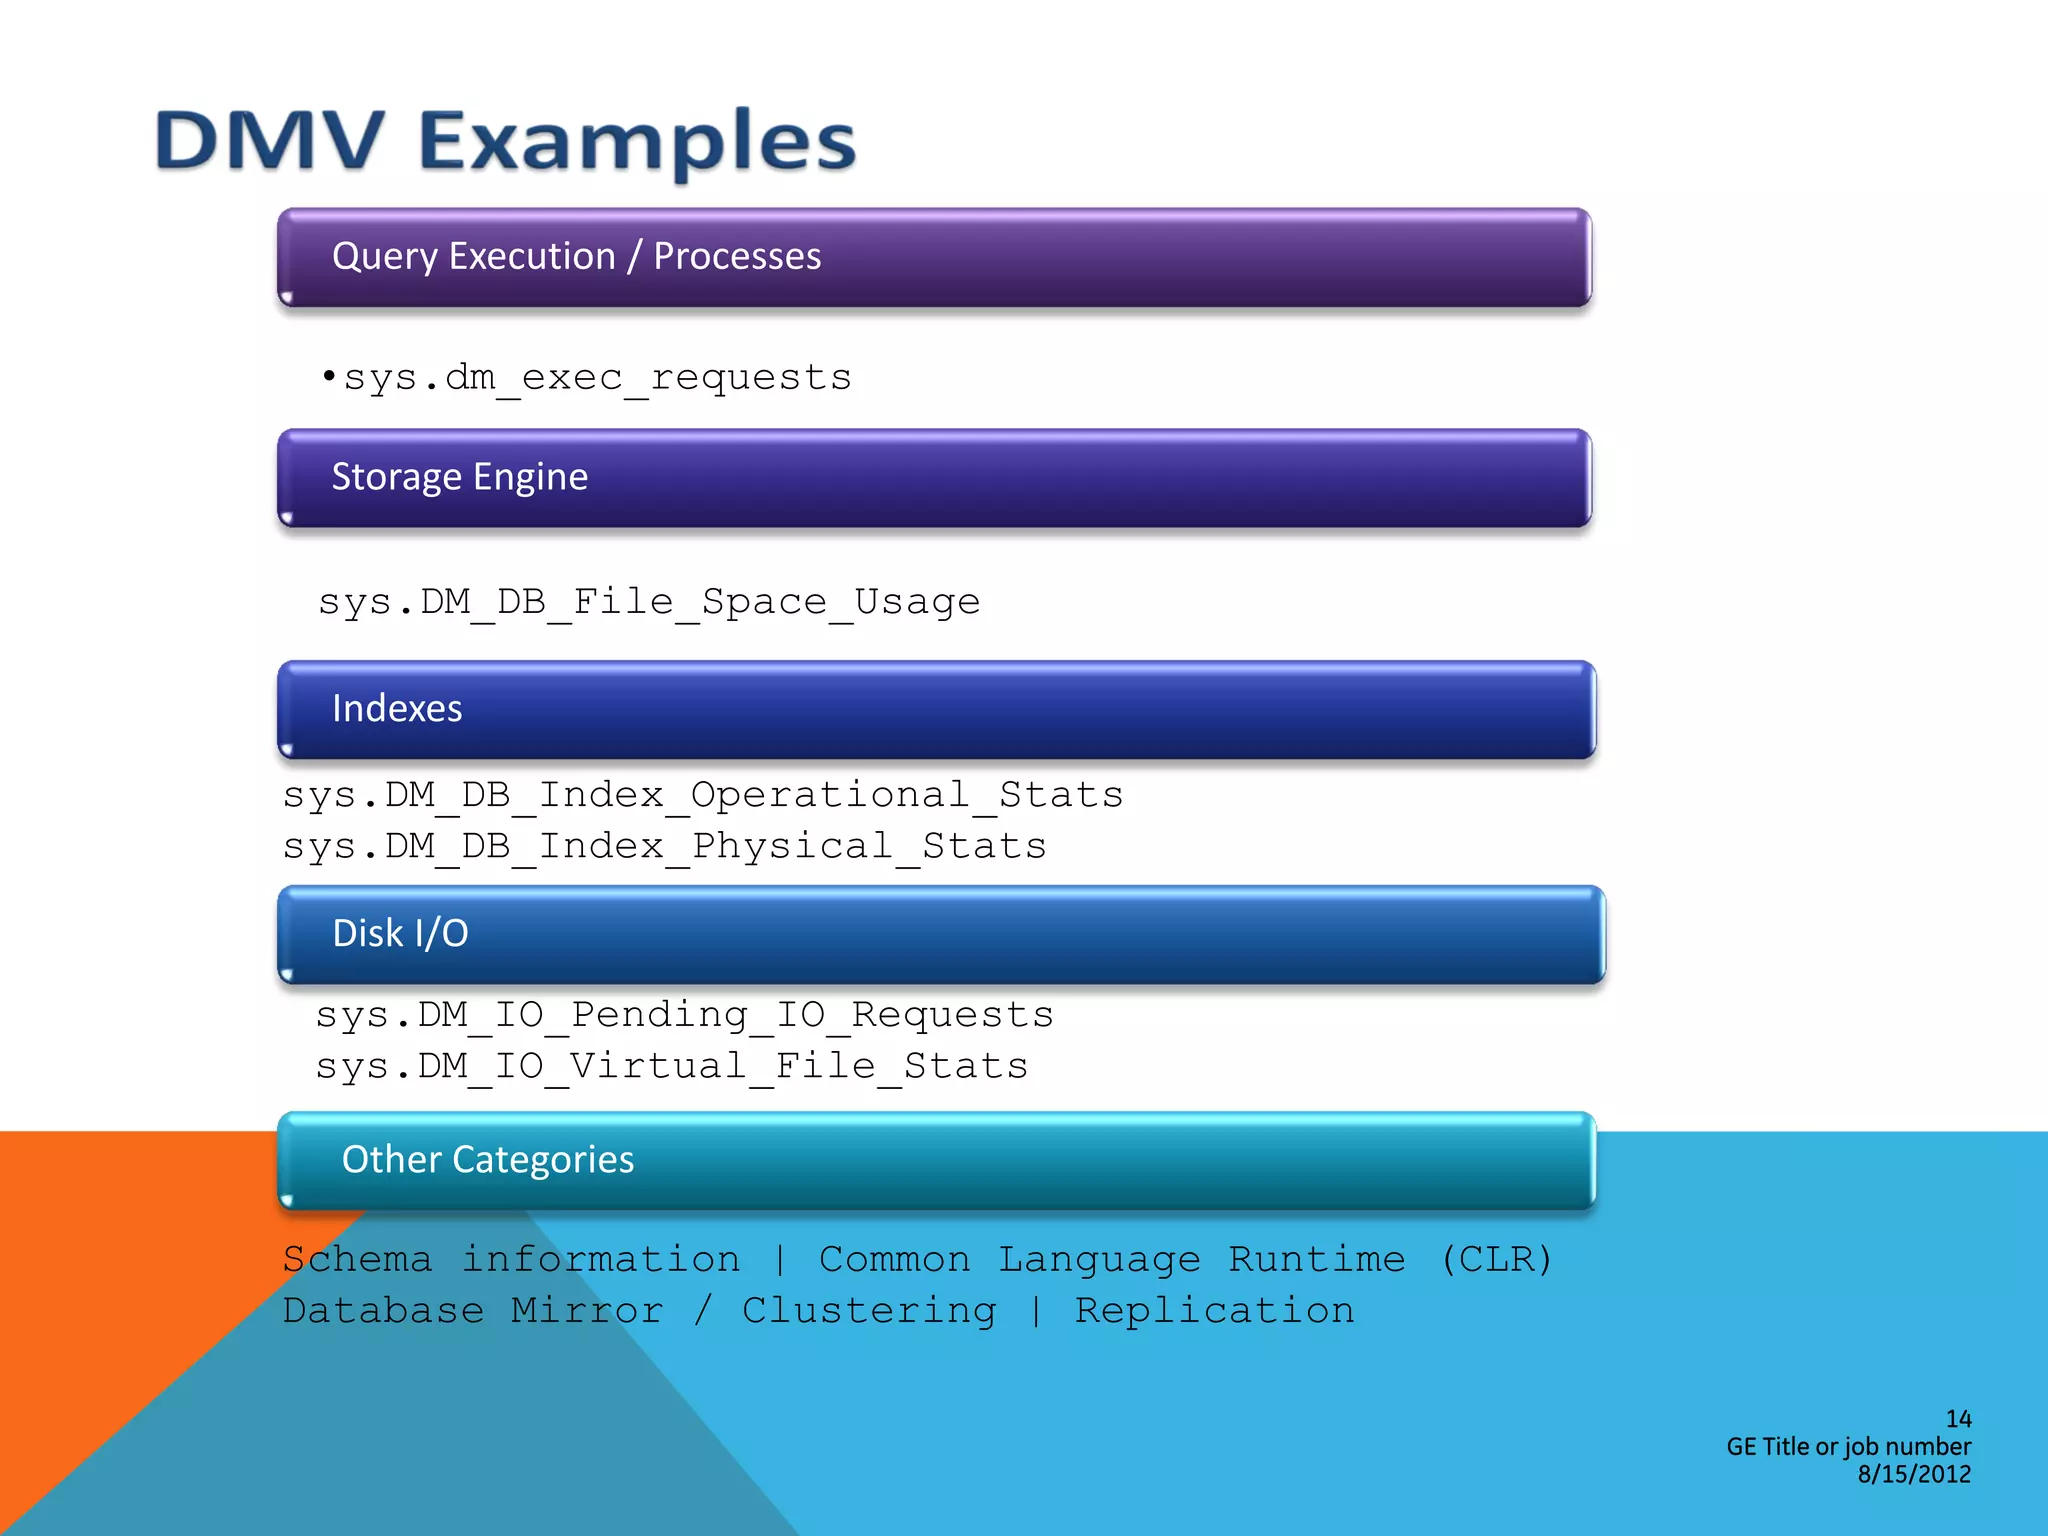
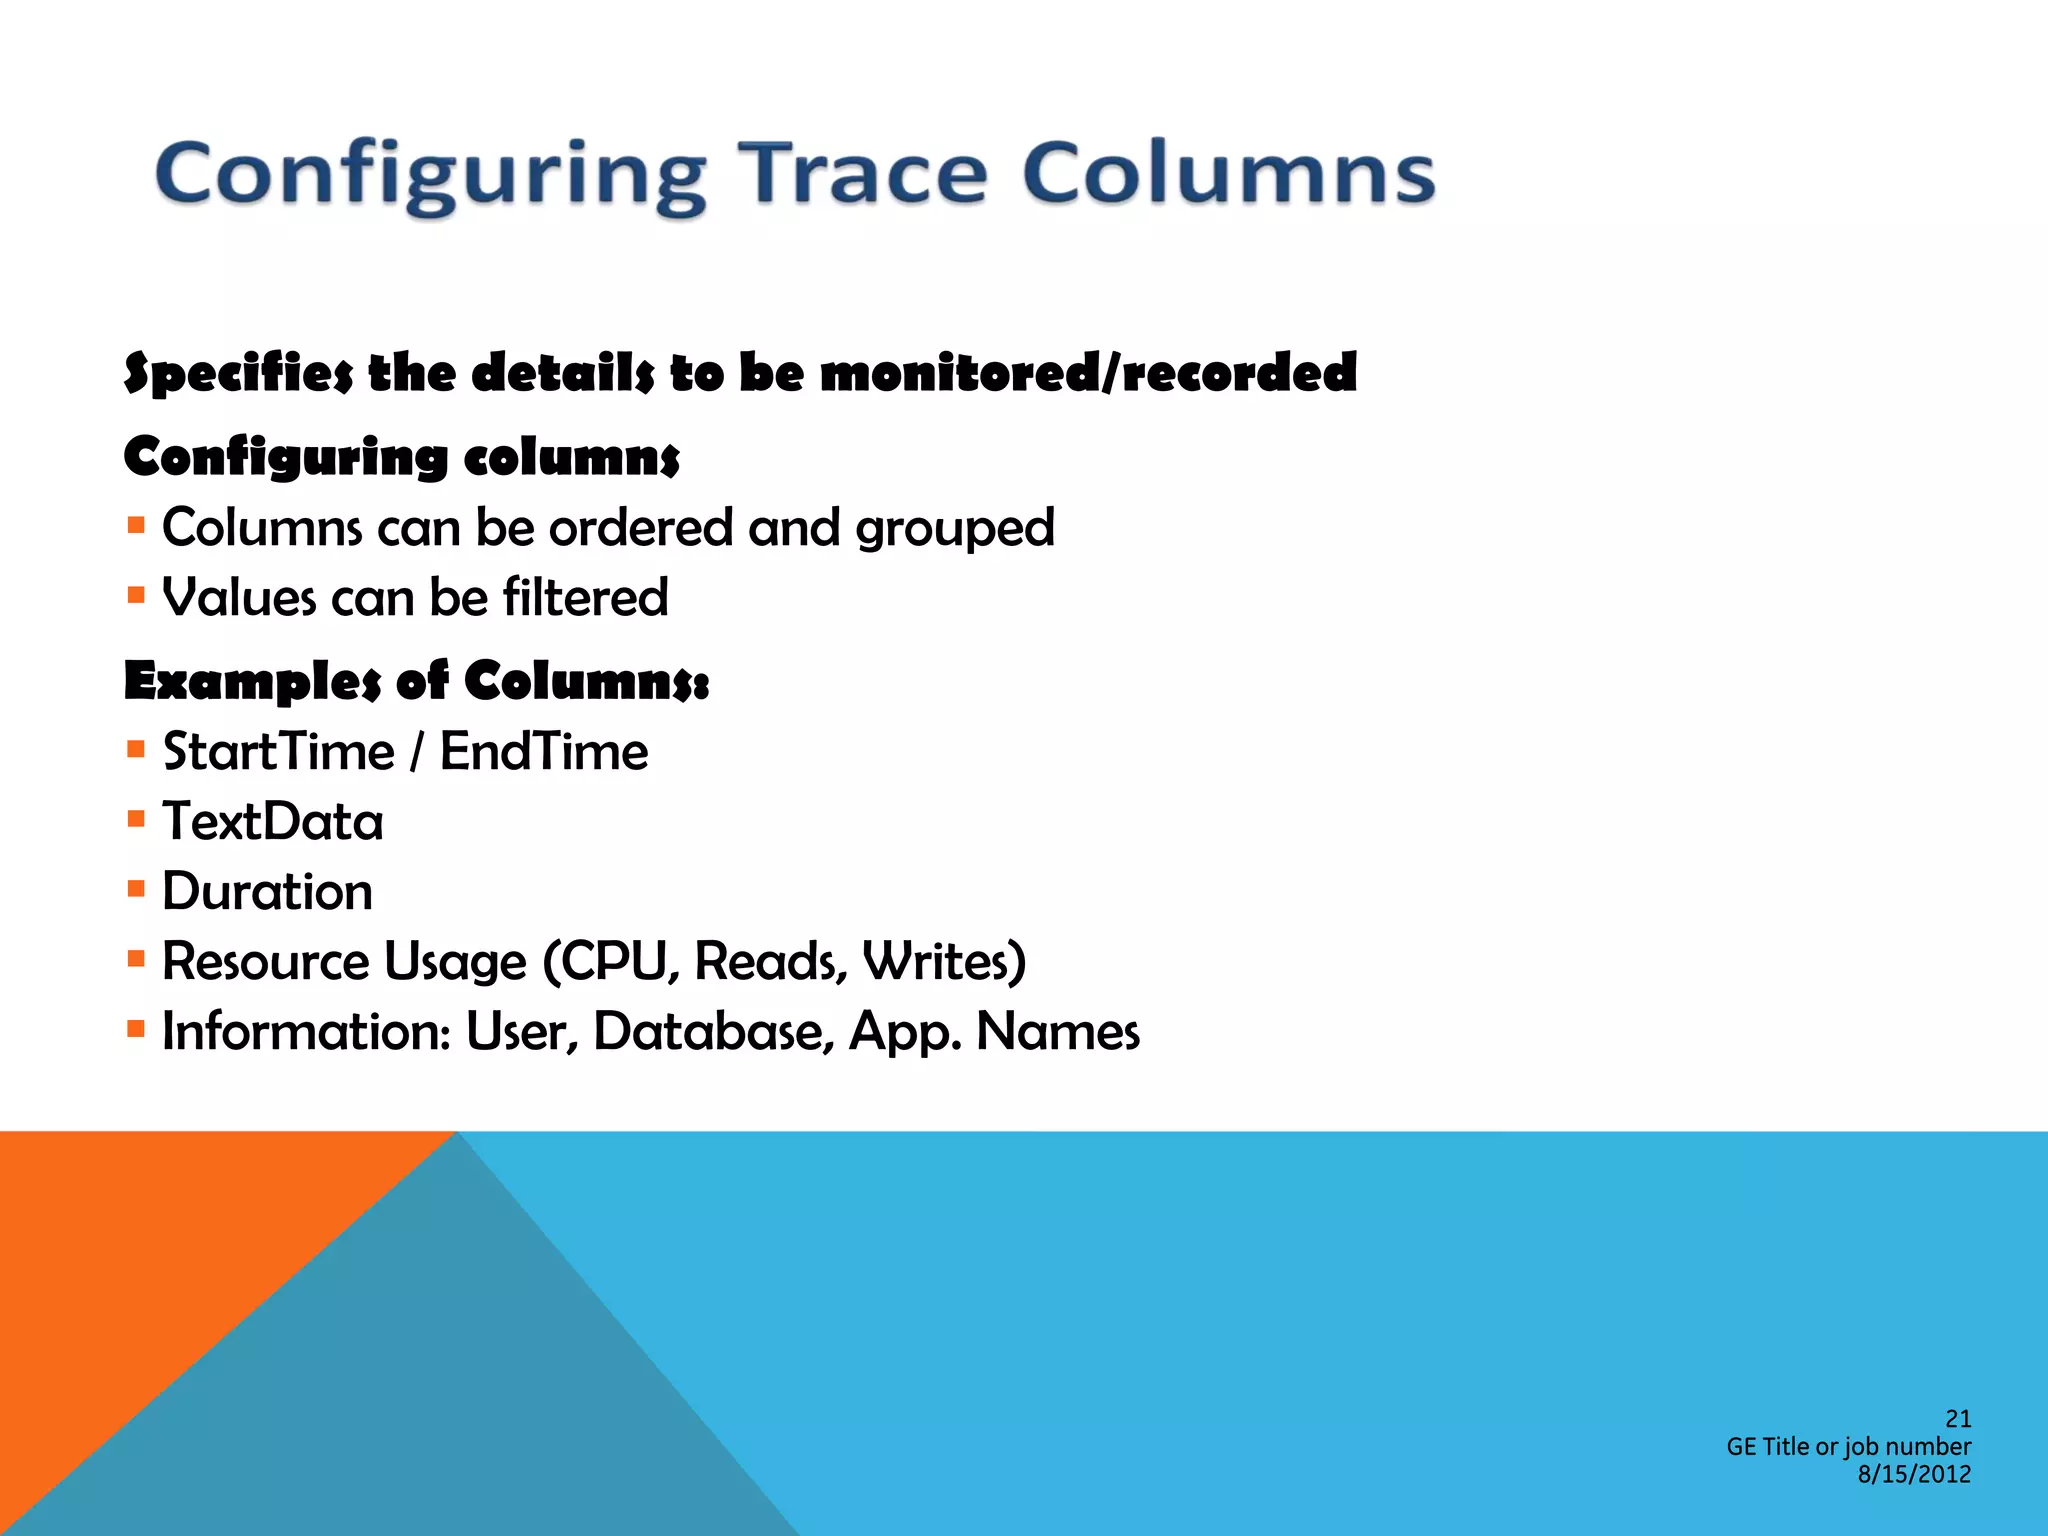
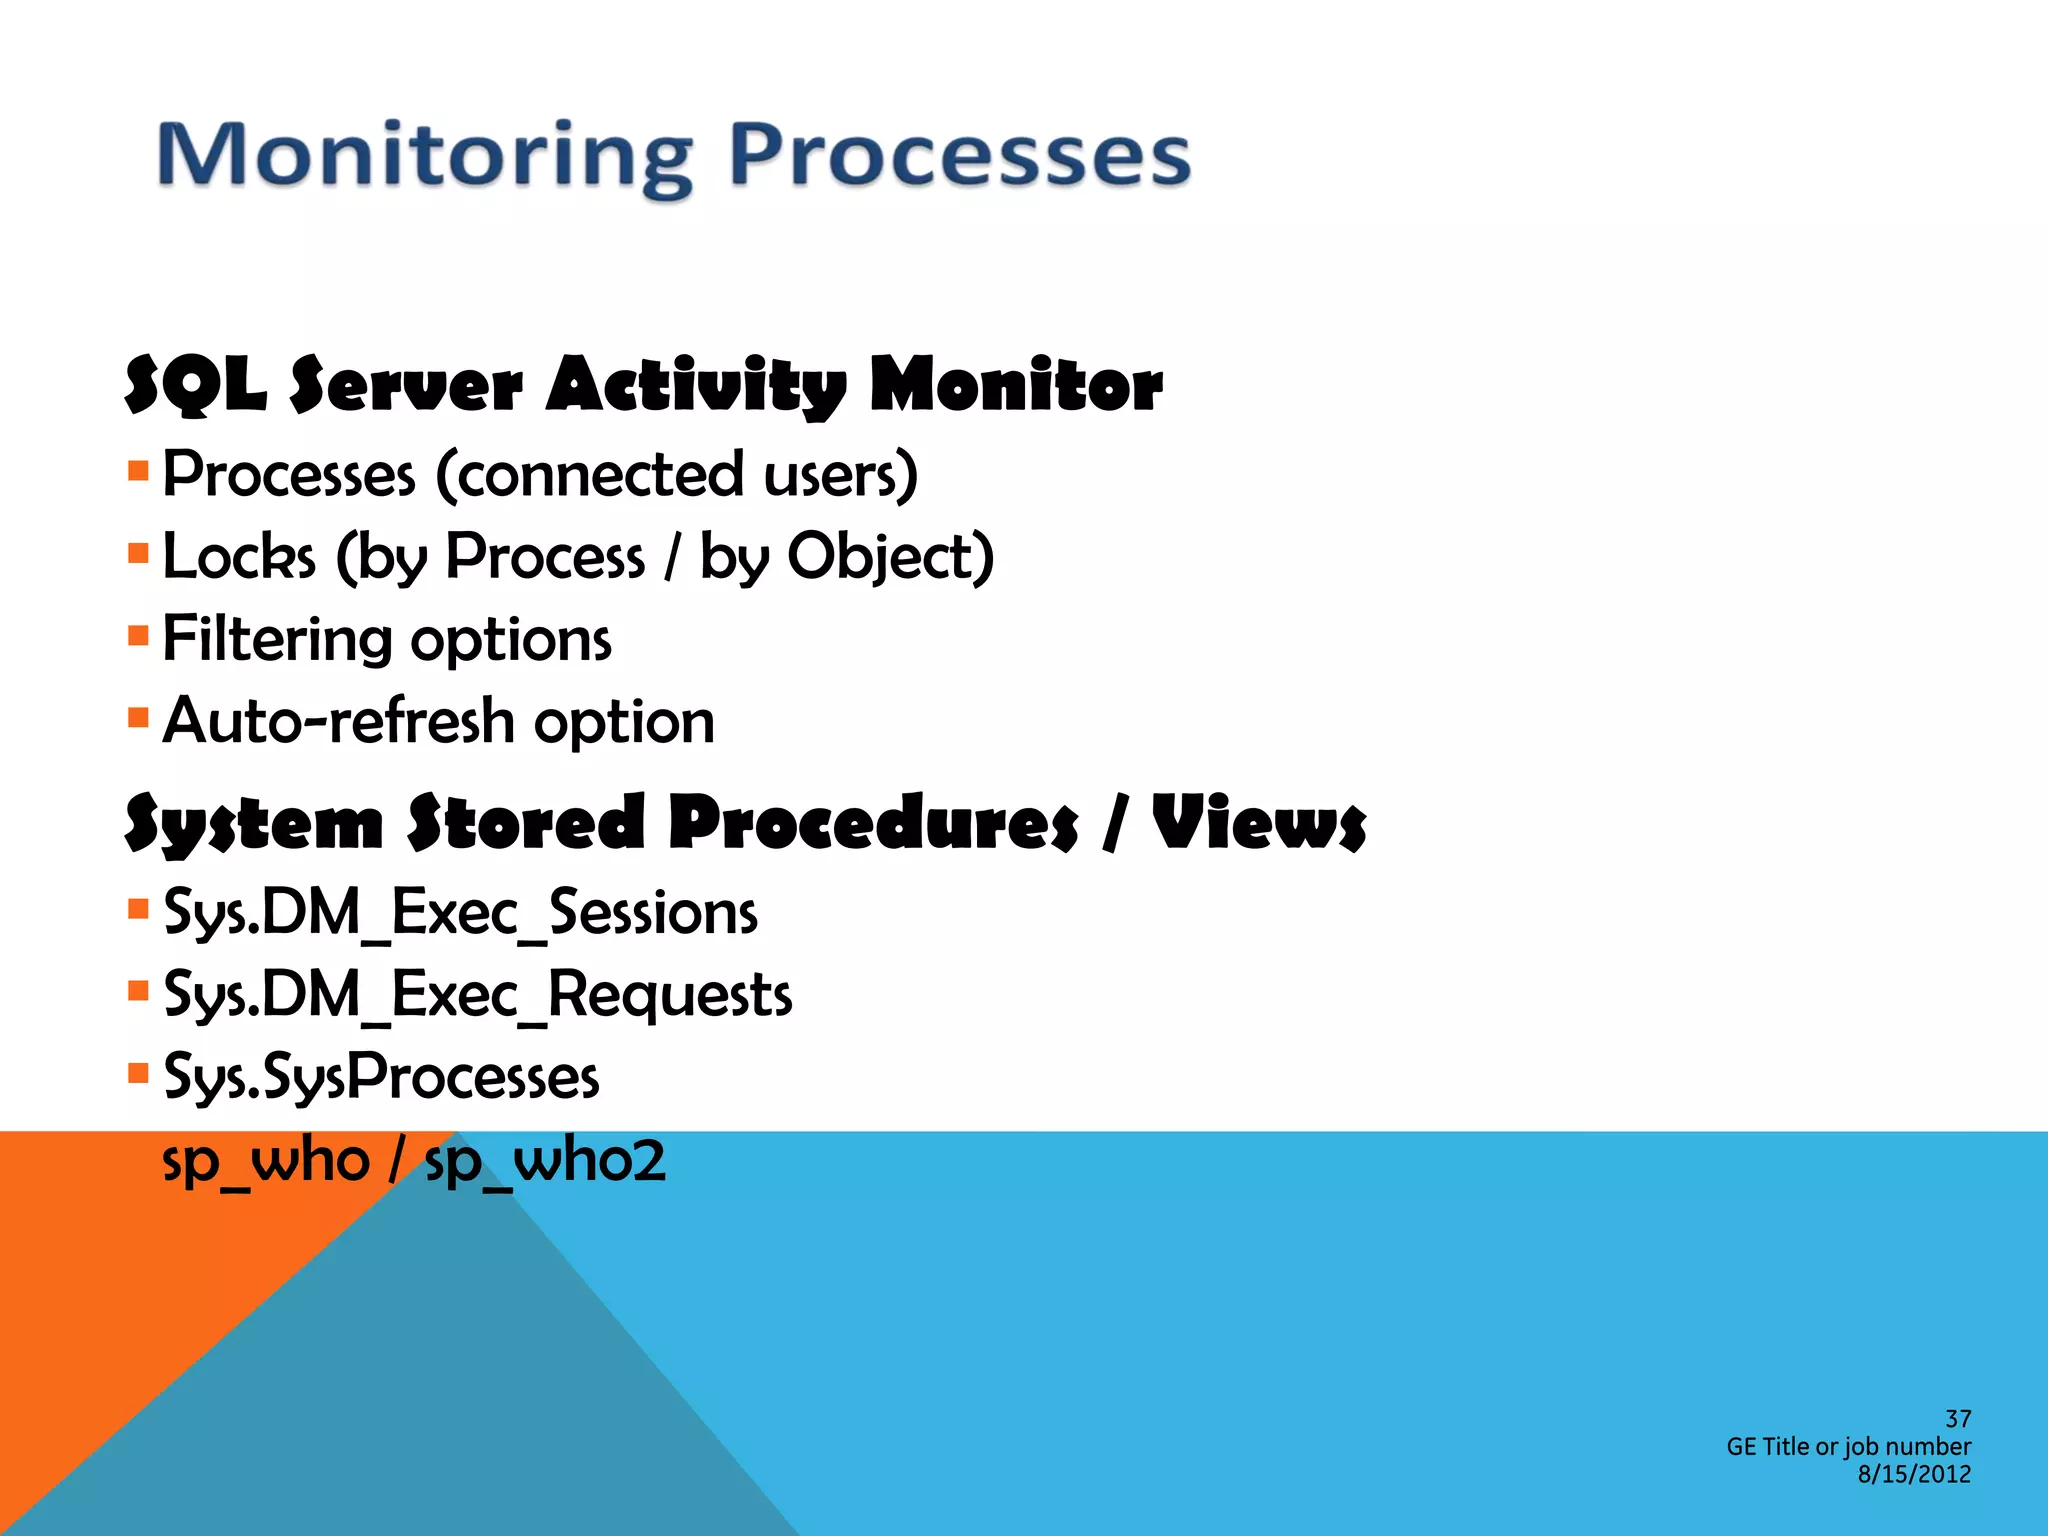
![Process Information
Current Process ID: @@SPID
Session Options: DBCC USEROPTIONS
Killing Processes
KILL ProcessID [WITH STATUSONLY]
Viewing Last Activity
DBCC INPUTBUFFER(ProcessID)
DBCC OUTPUTBUFFER(ProcessID)
38
GE Title or job number
8/15/2012](https://image.slidesharecdn.com/sqlserverperformancetuning-120815004343-phpapp02/85/SQL-Server-Performance-Tuning-Baseline-38-320.jpg)
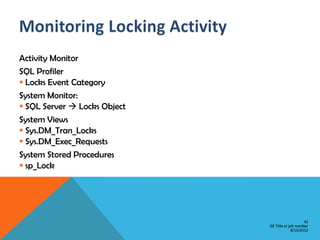


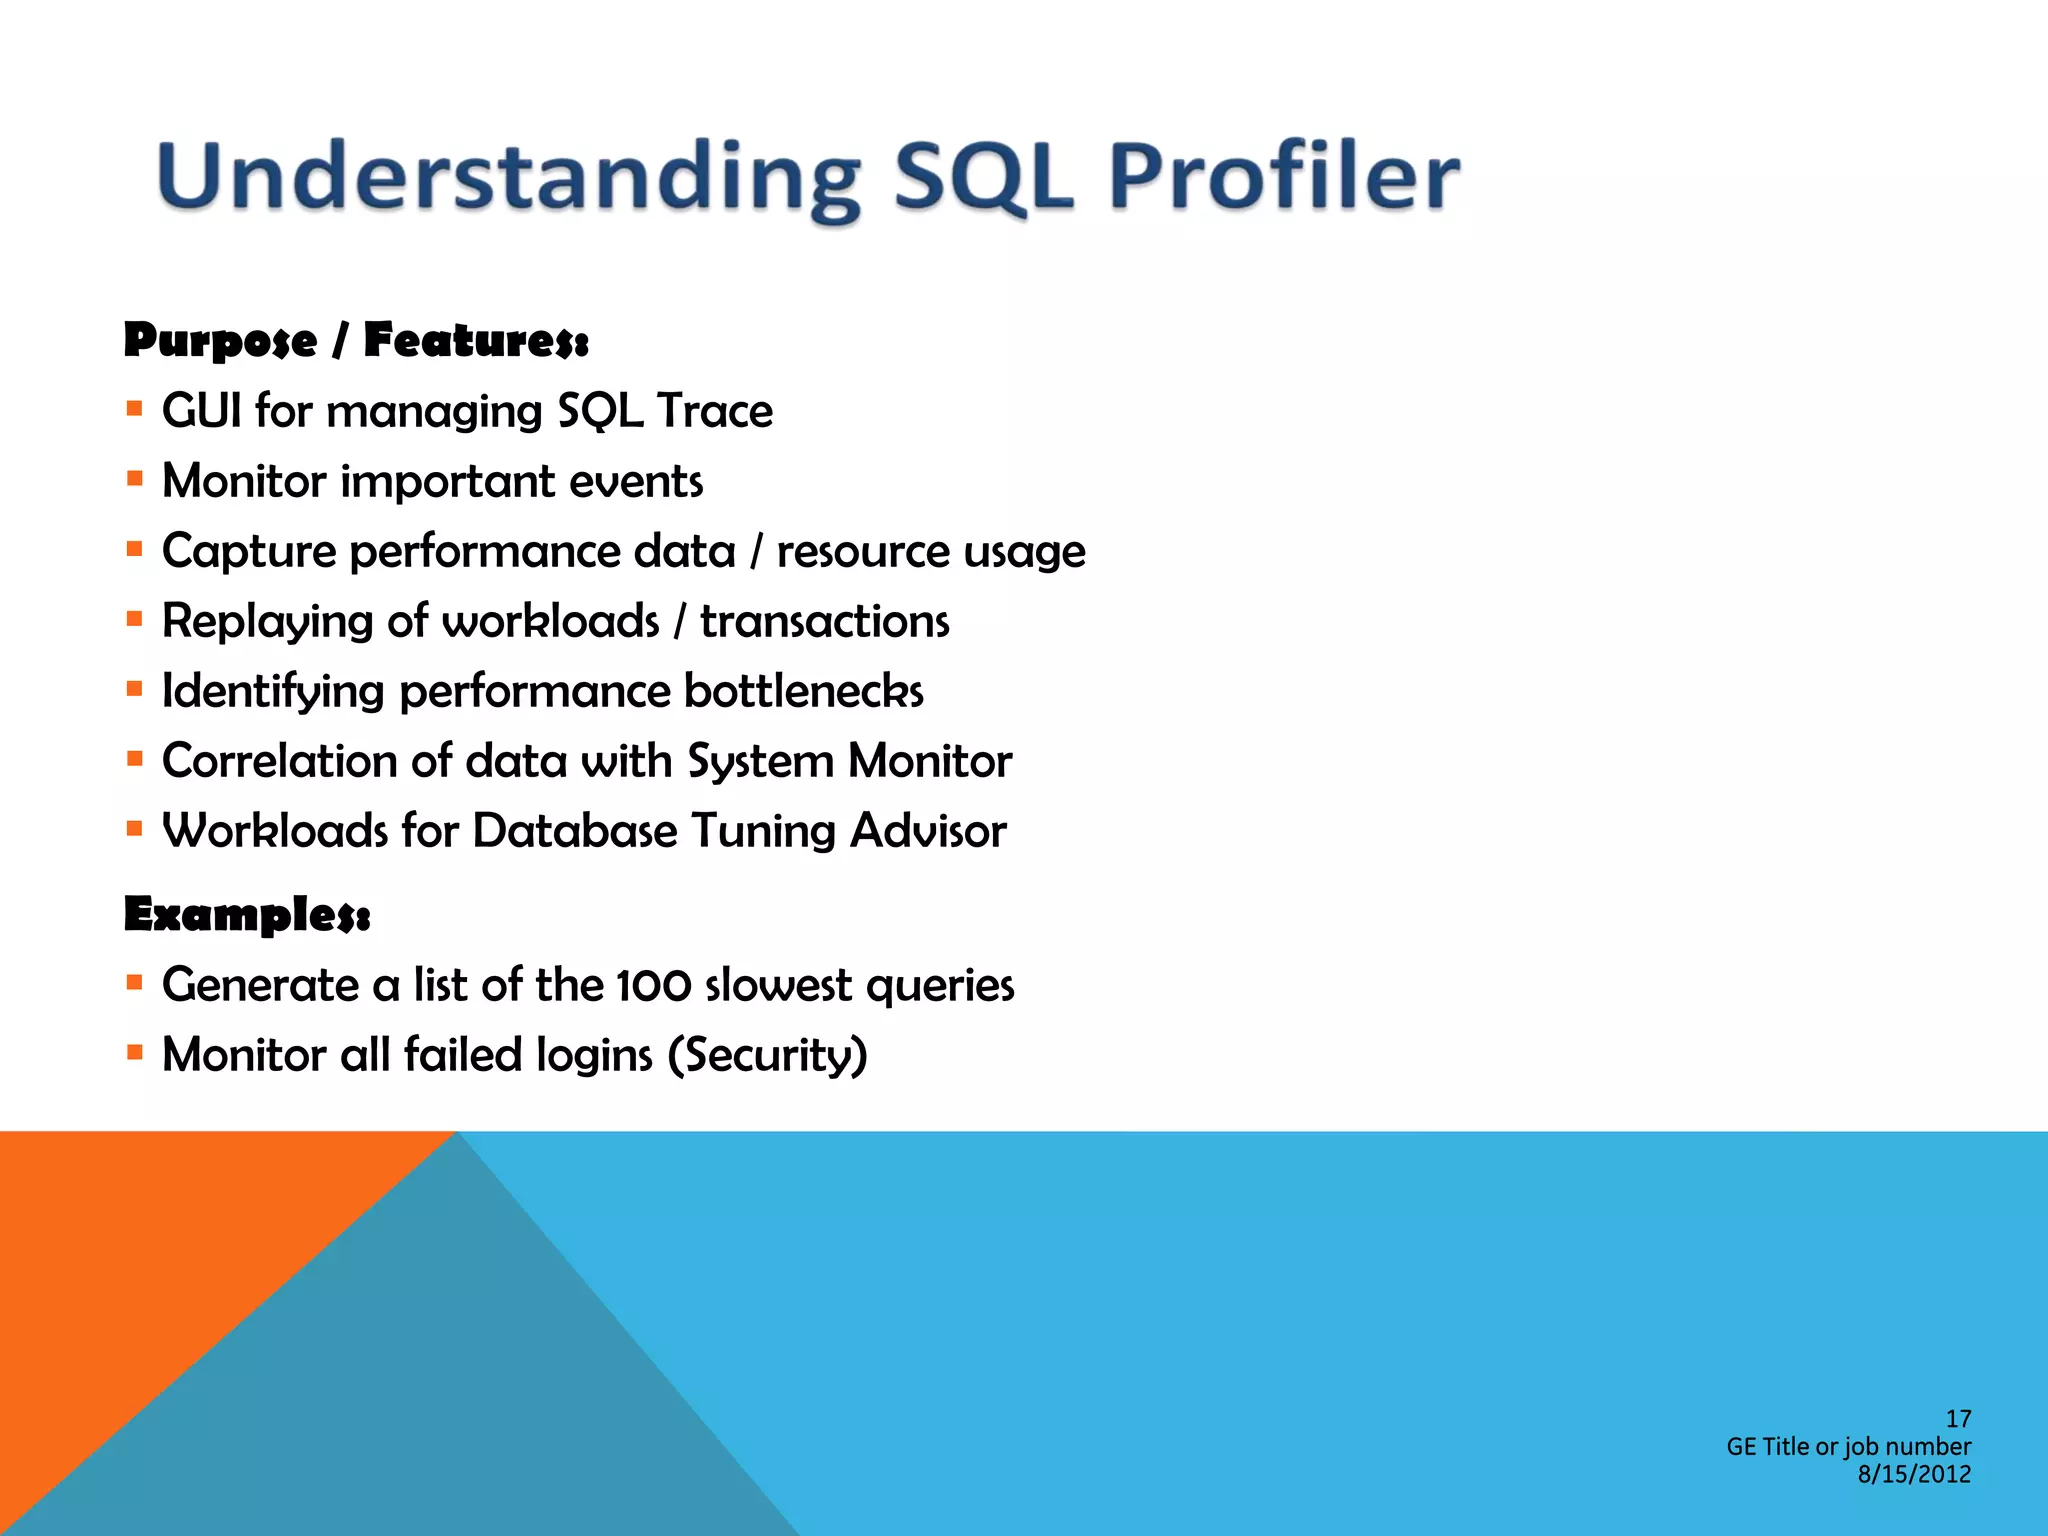

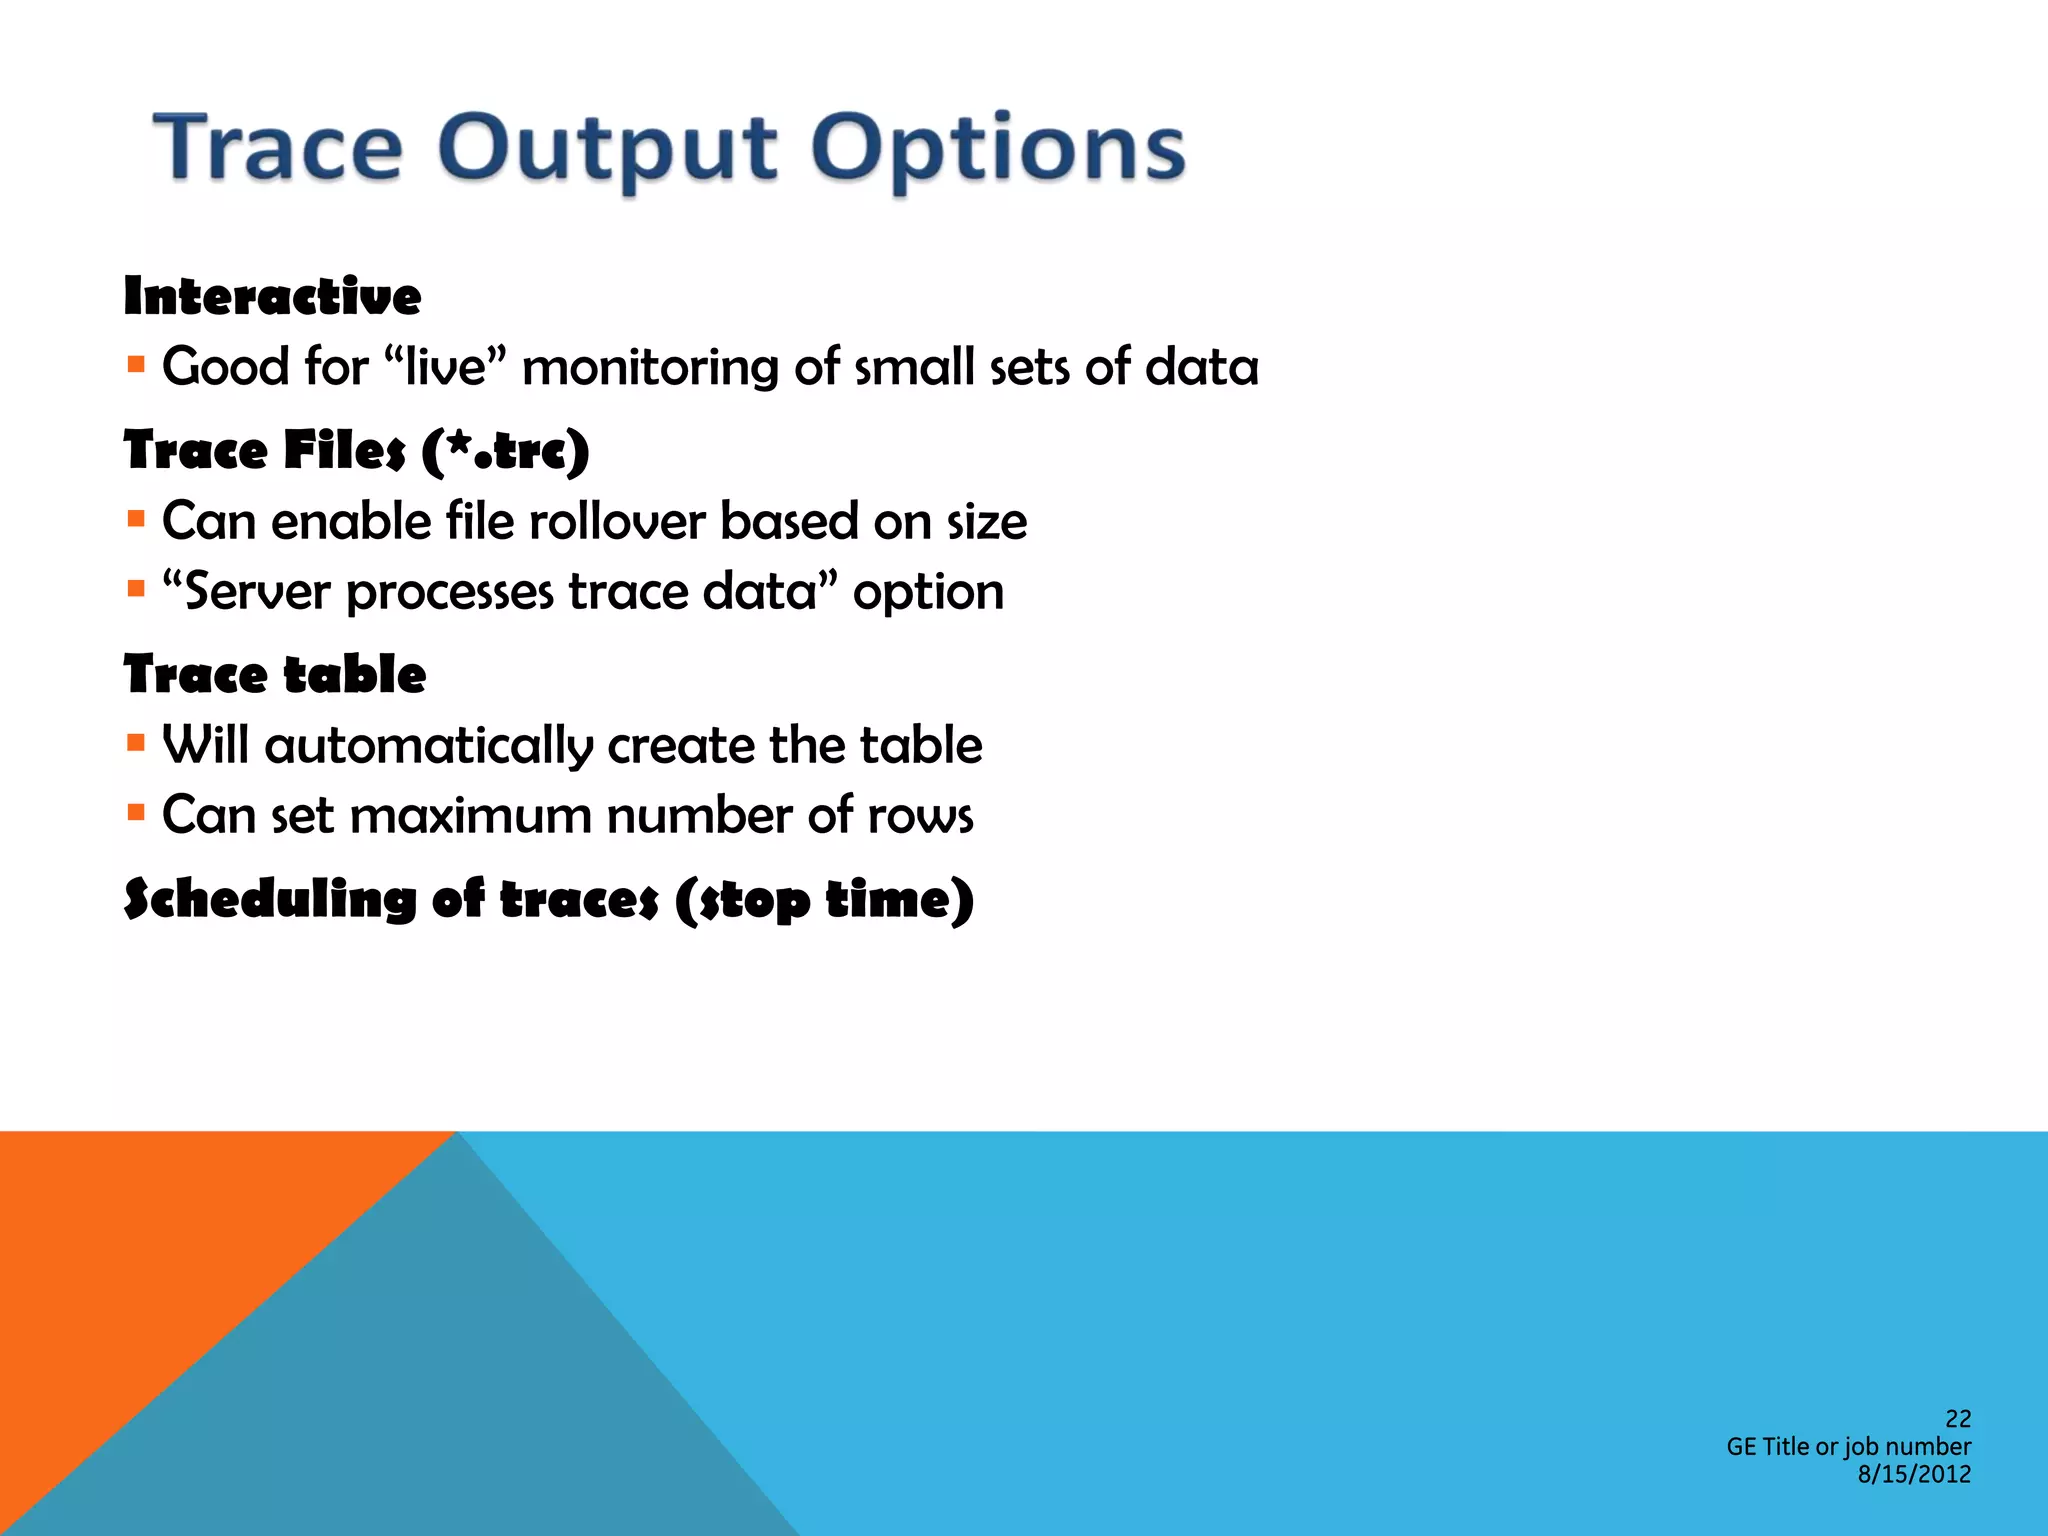


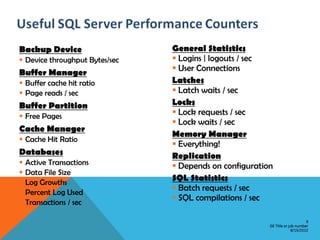
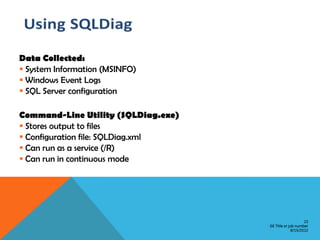
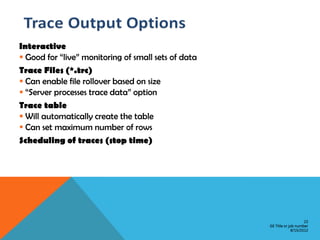
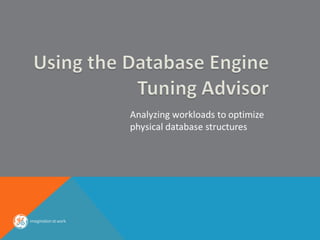
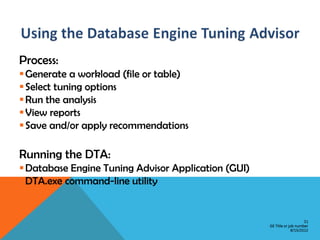
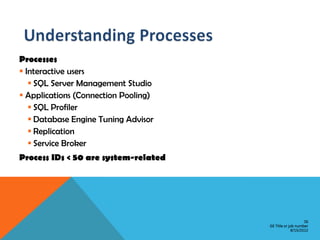
![Process Information
Current Process ID: @@SPID
Session Options: DBCC USEROPTIONS
Killing Processes
KILL ProcessID [WITH STATUSONLY]
Viewing Last Activity
DBCC INPUTBUFFER(ProcessID)
DBCC OUTPUTBUFFER(ProcessID)
38
GE Title or job number
8/15/2012](https://image.slidesharecdn.com/sqlserverperformancetuning-120815004343-phpapp02/75/SQL-Server-Performance-Tuning-Baseline-38-2048.jpg)


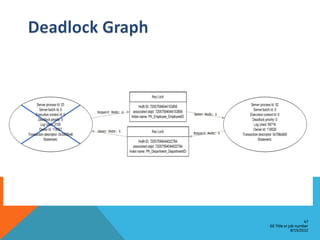
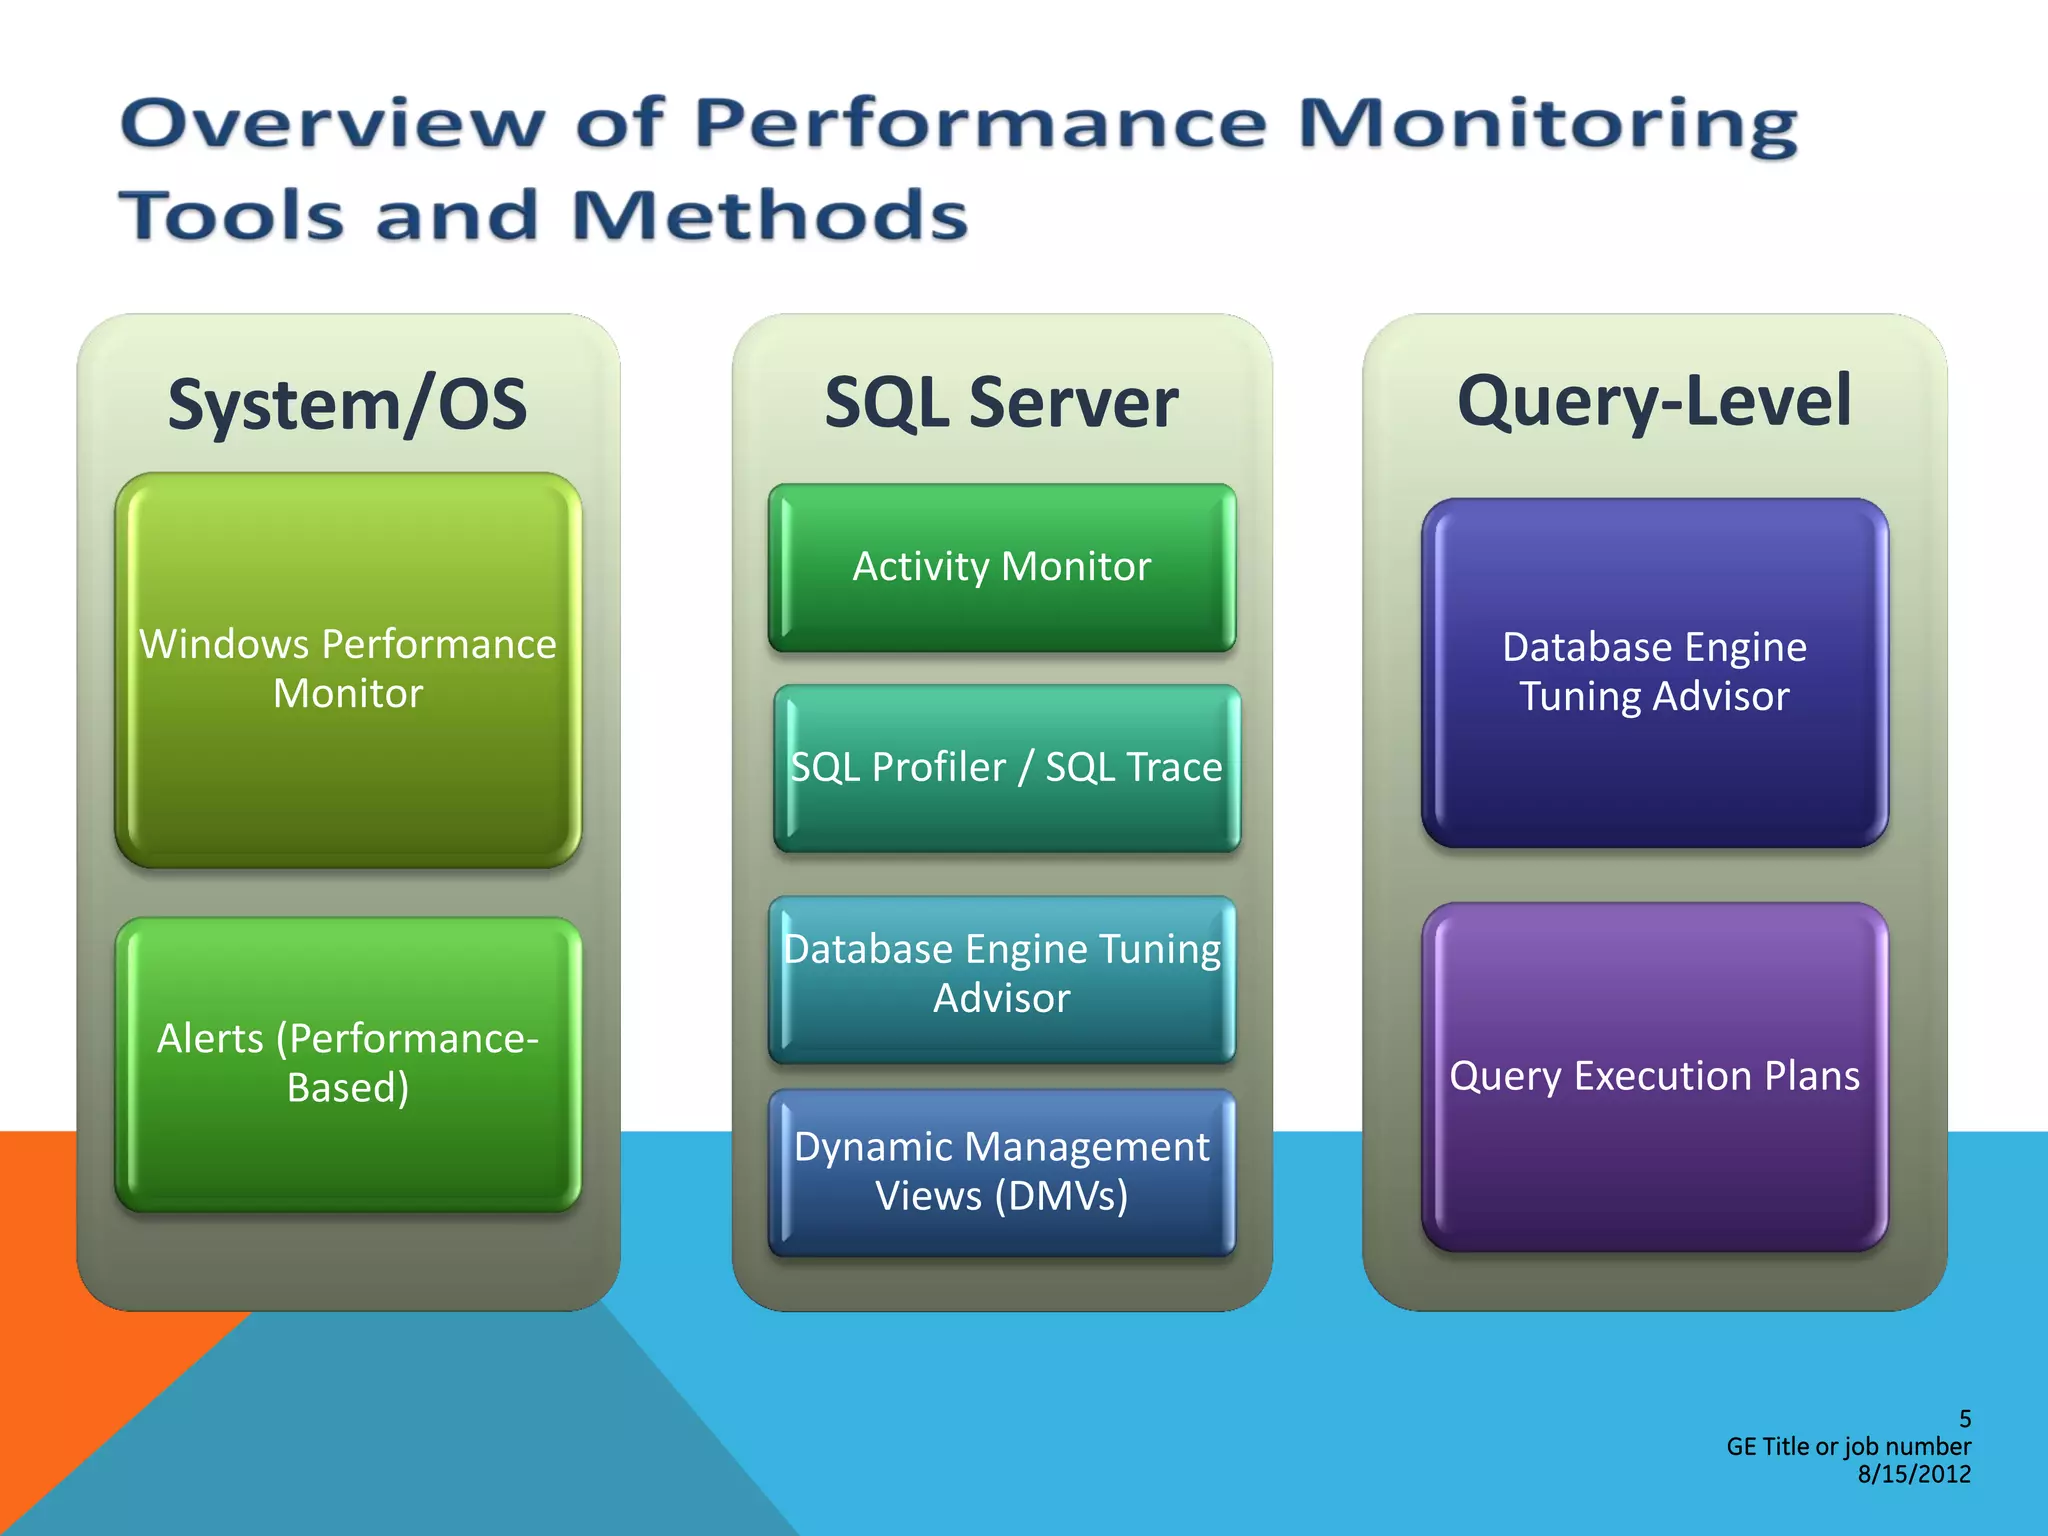
This document provides an overview of performance monitoring and optimization for SQL Server databases. It discusses monitoring database activity using tools like SQL Profiler and Activity Monitor, identifying bottlenecks, using the Database Engine Tuning Advisor to generate optimization recommendations, and addressing issues related to processes, locking, and deadlocks. Best practices emphasized establishing a performance baseline, making incremental changes while measuring impact, and focusing on specific issues to optimize real-world workloads.


![UiPath Automation Suite Installation (Hands-On) [2/3]](https://cdn.slidesharecdn.com/ss_thumbnails/automationsuitecommunitysession2-251015095633-a6d862f1-thumbnail.jpg?width=600ounds&width=560&fit=bounds)


