Download to read offline

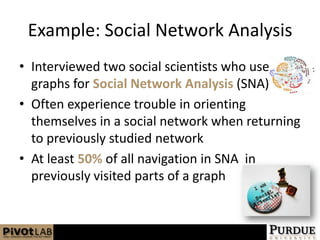

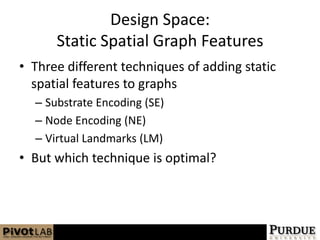
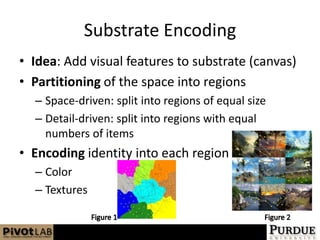
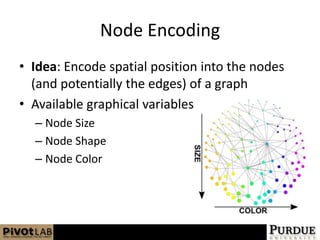
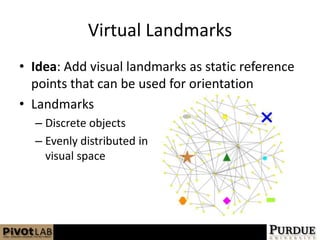


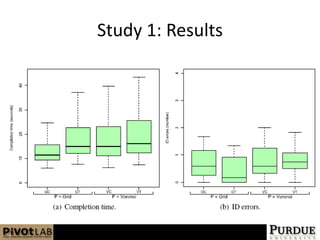

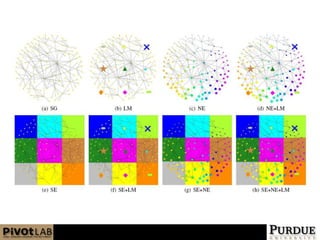

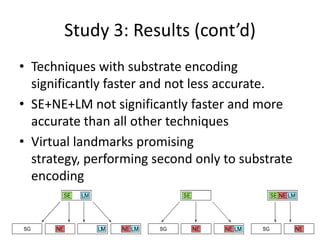
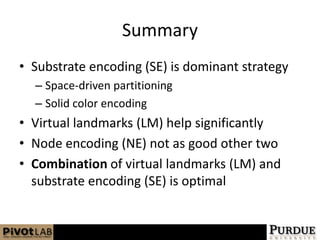
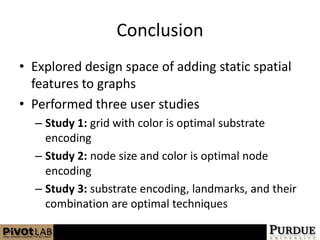

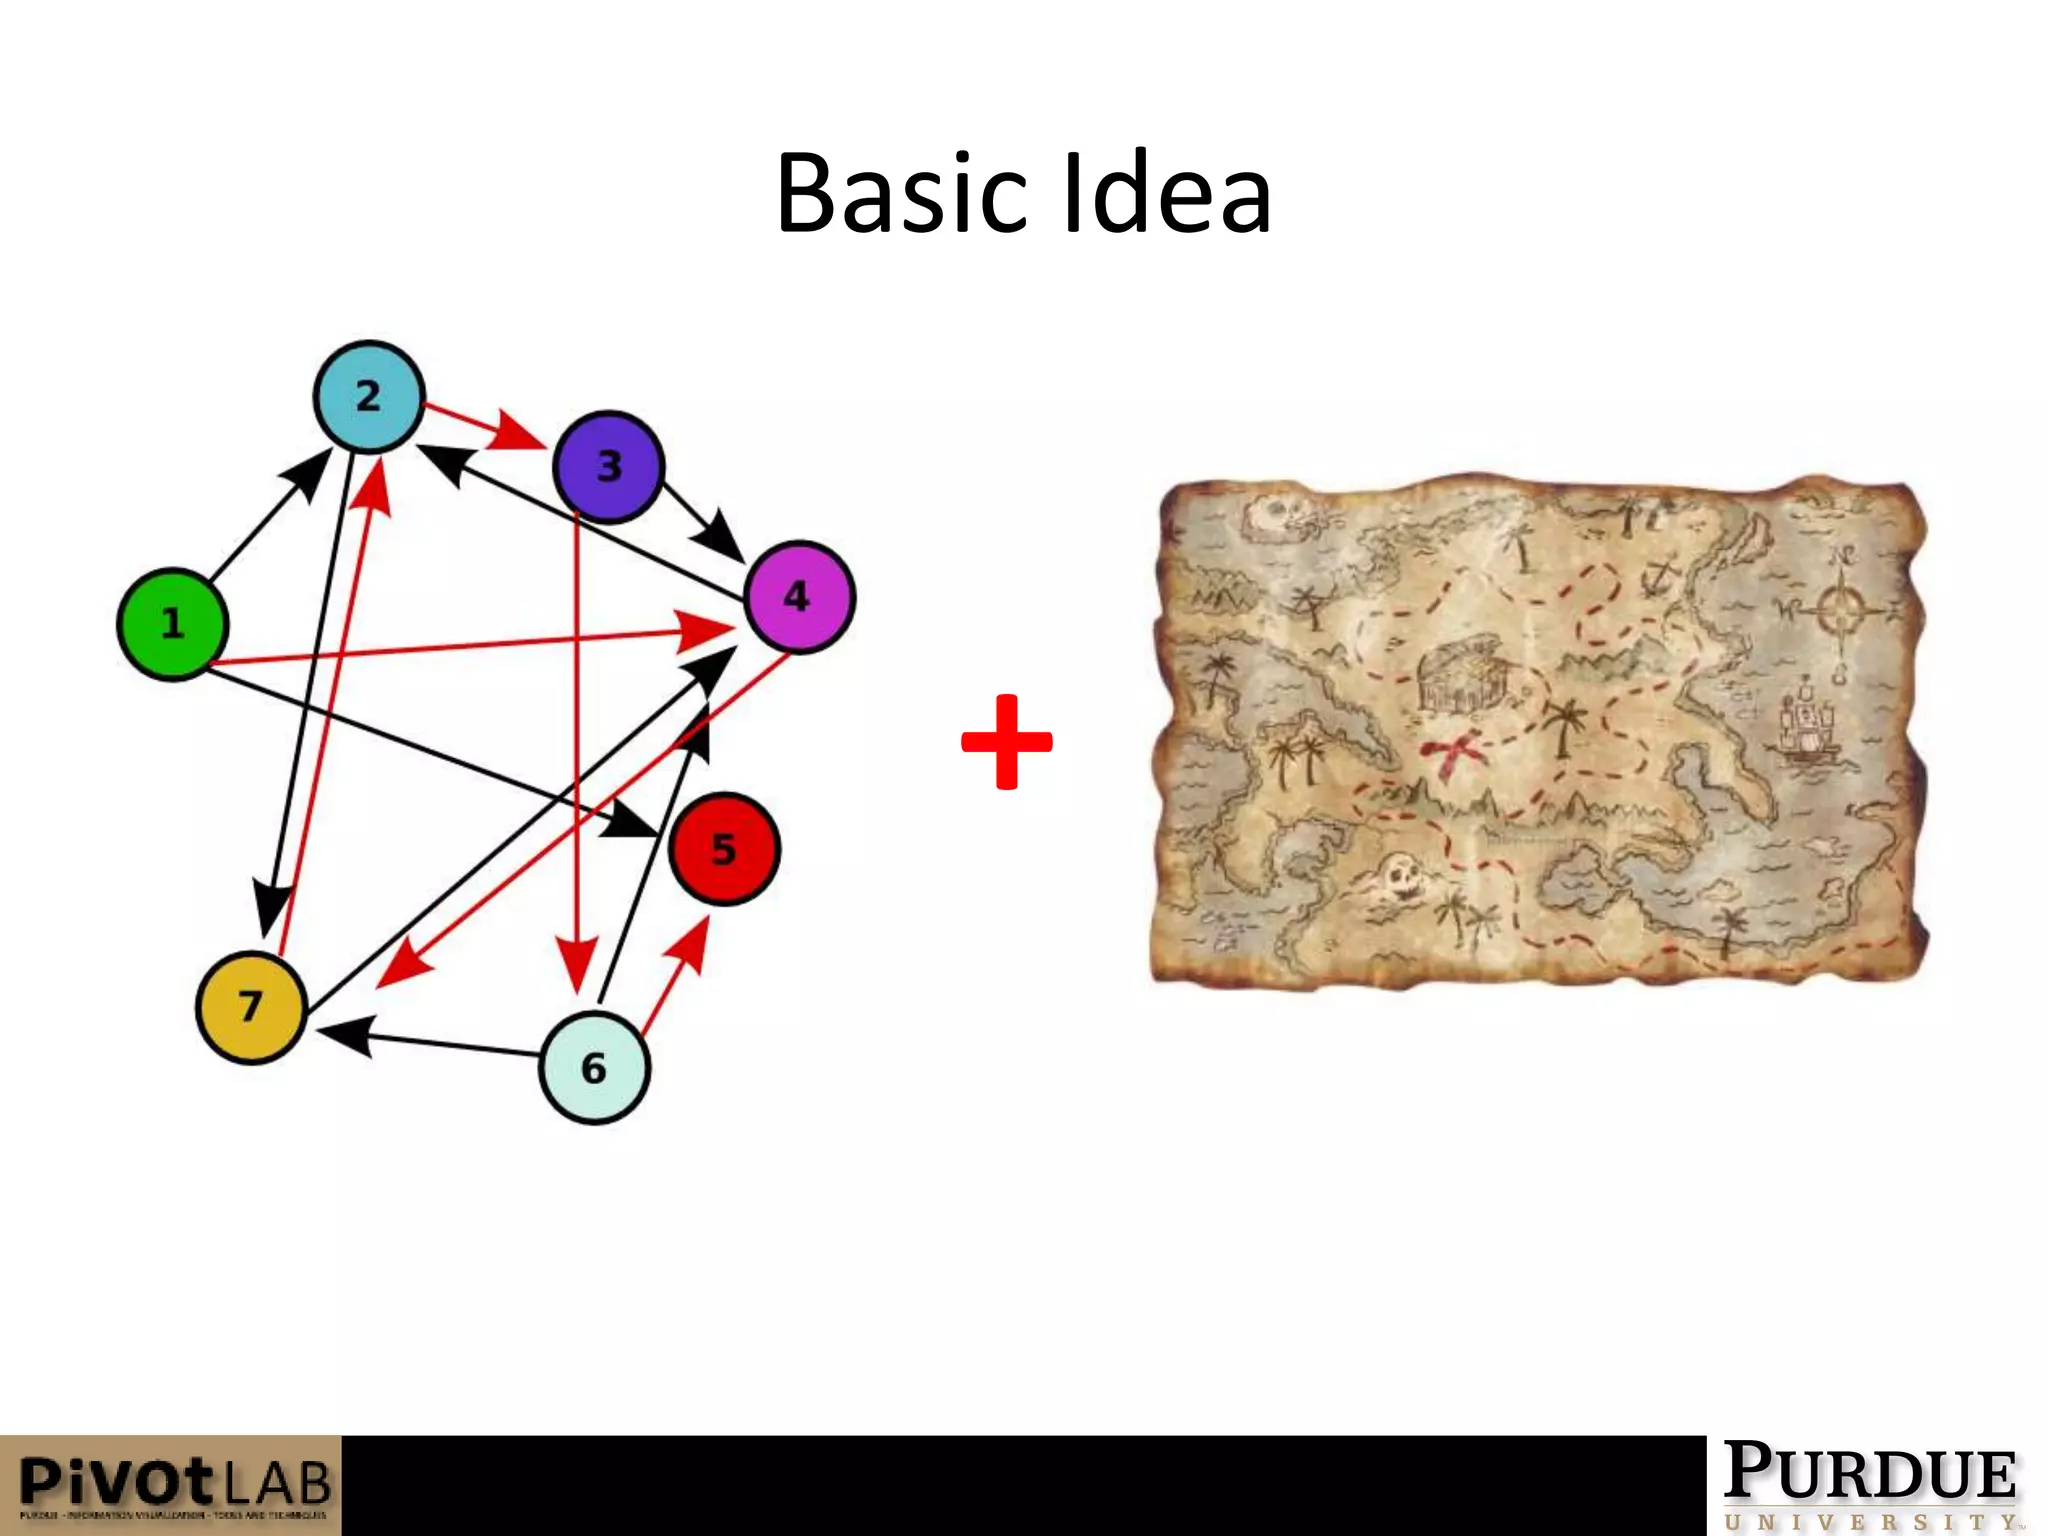
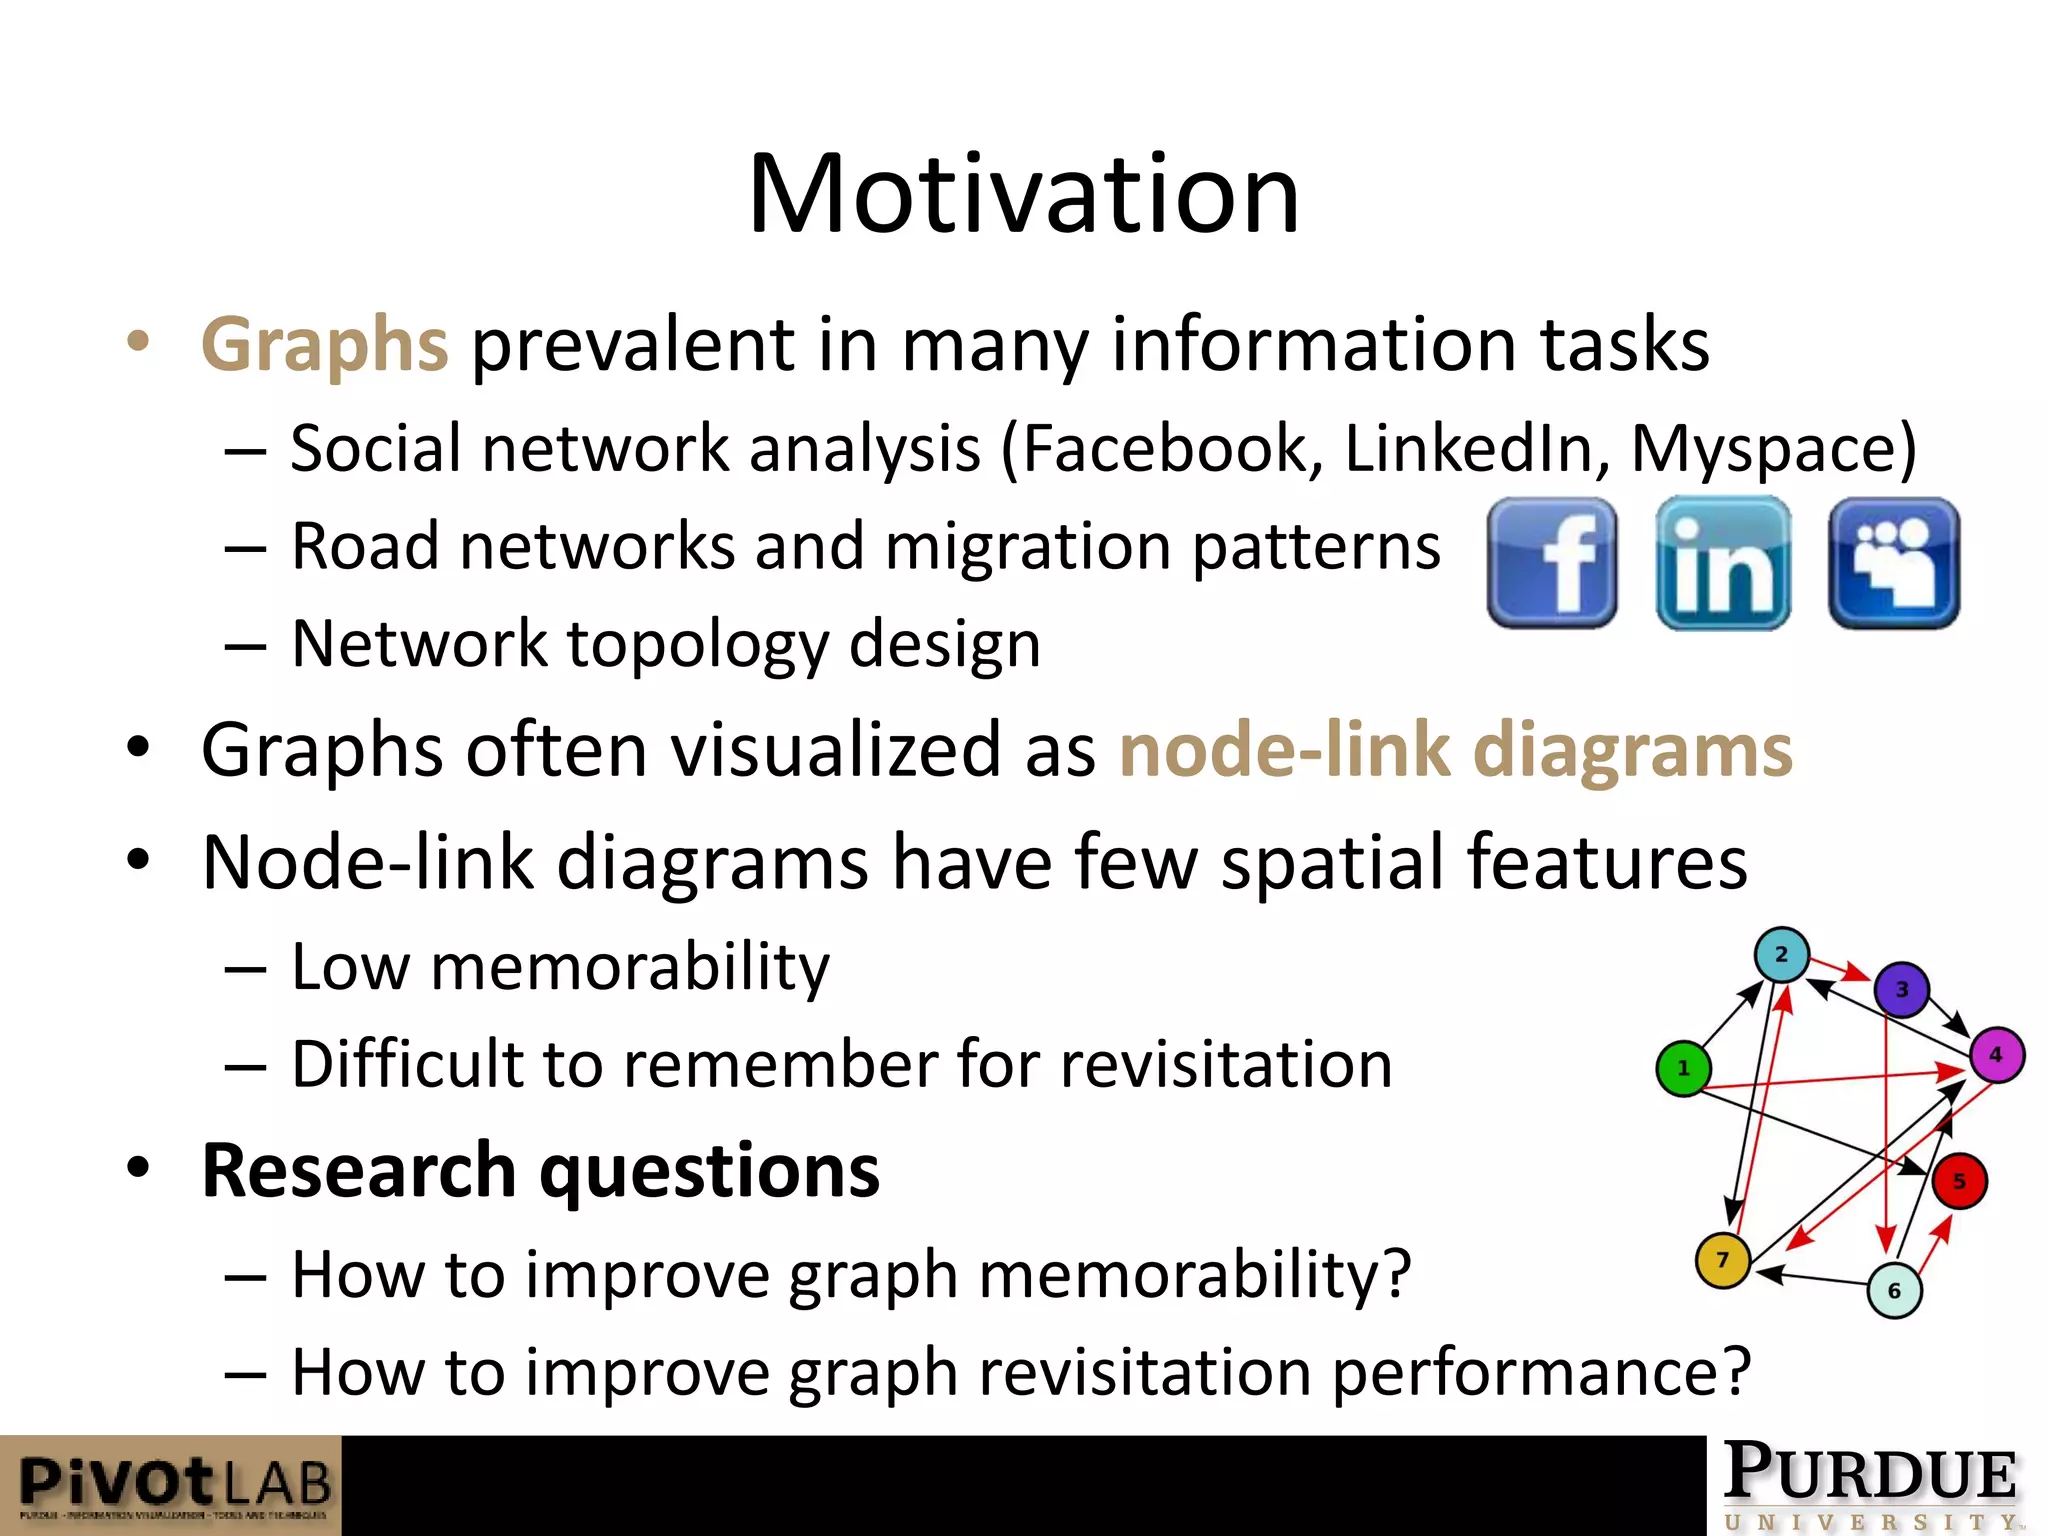


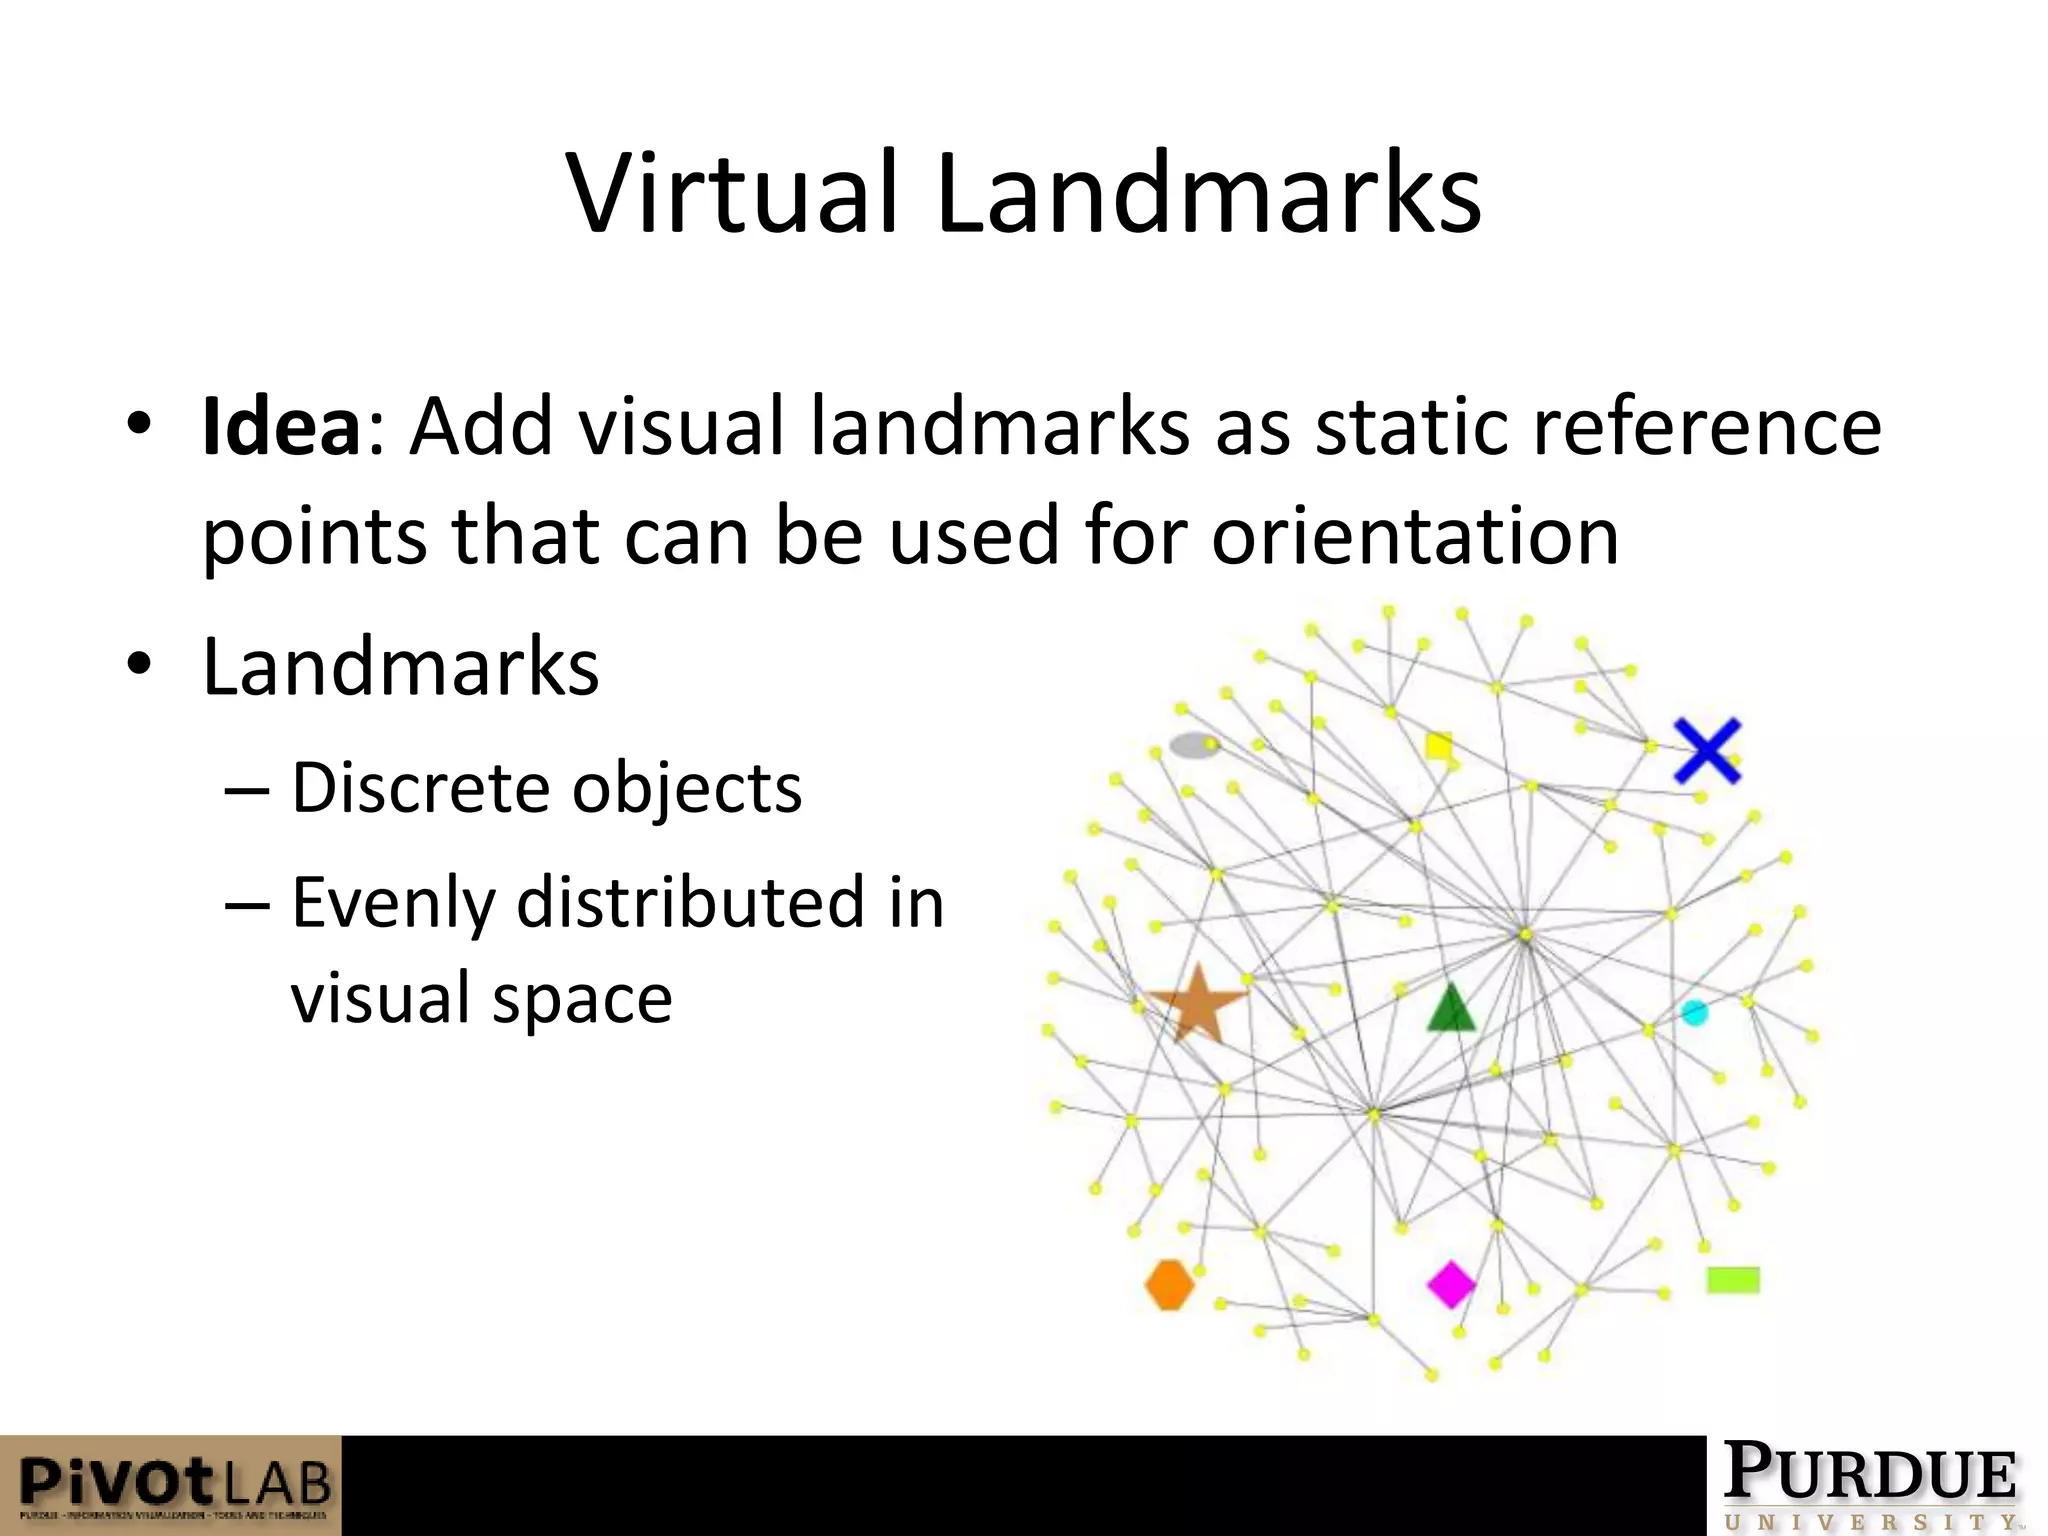
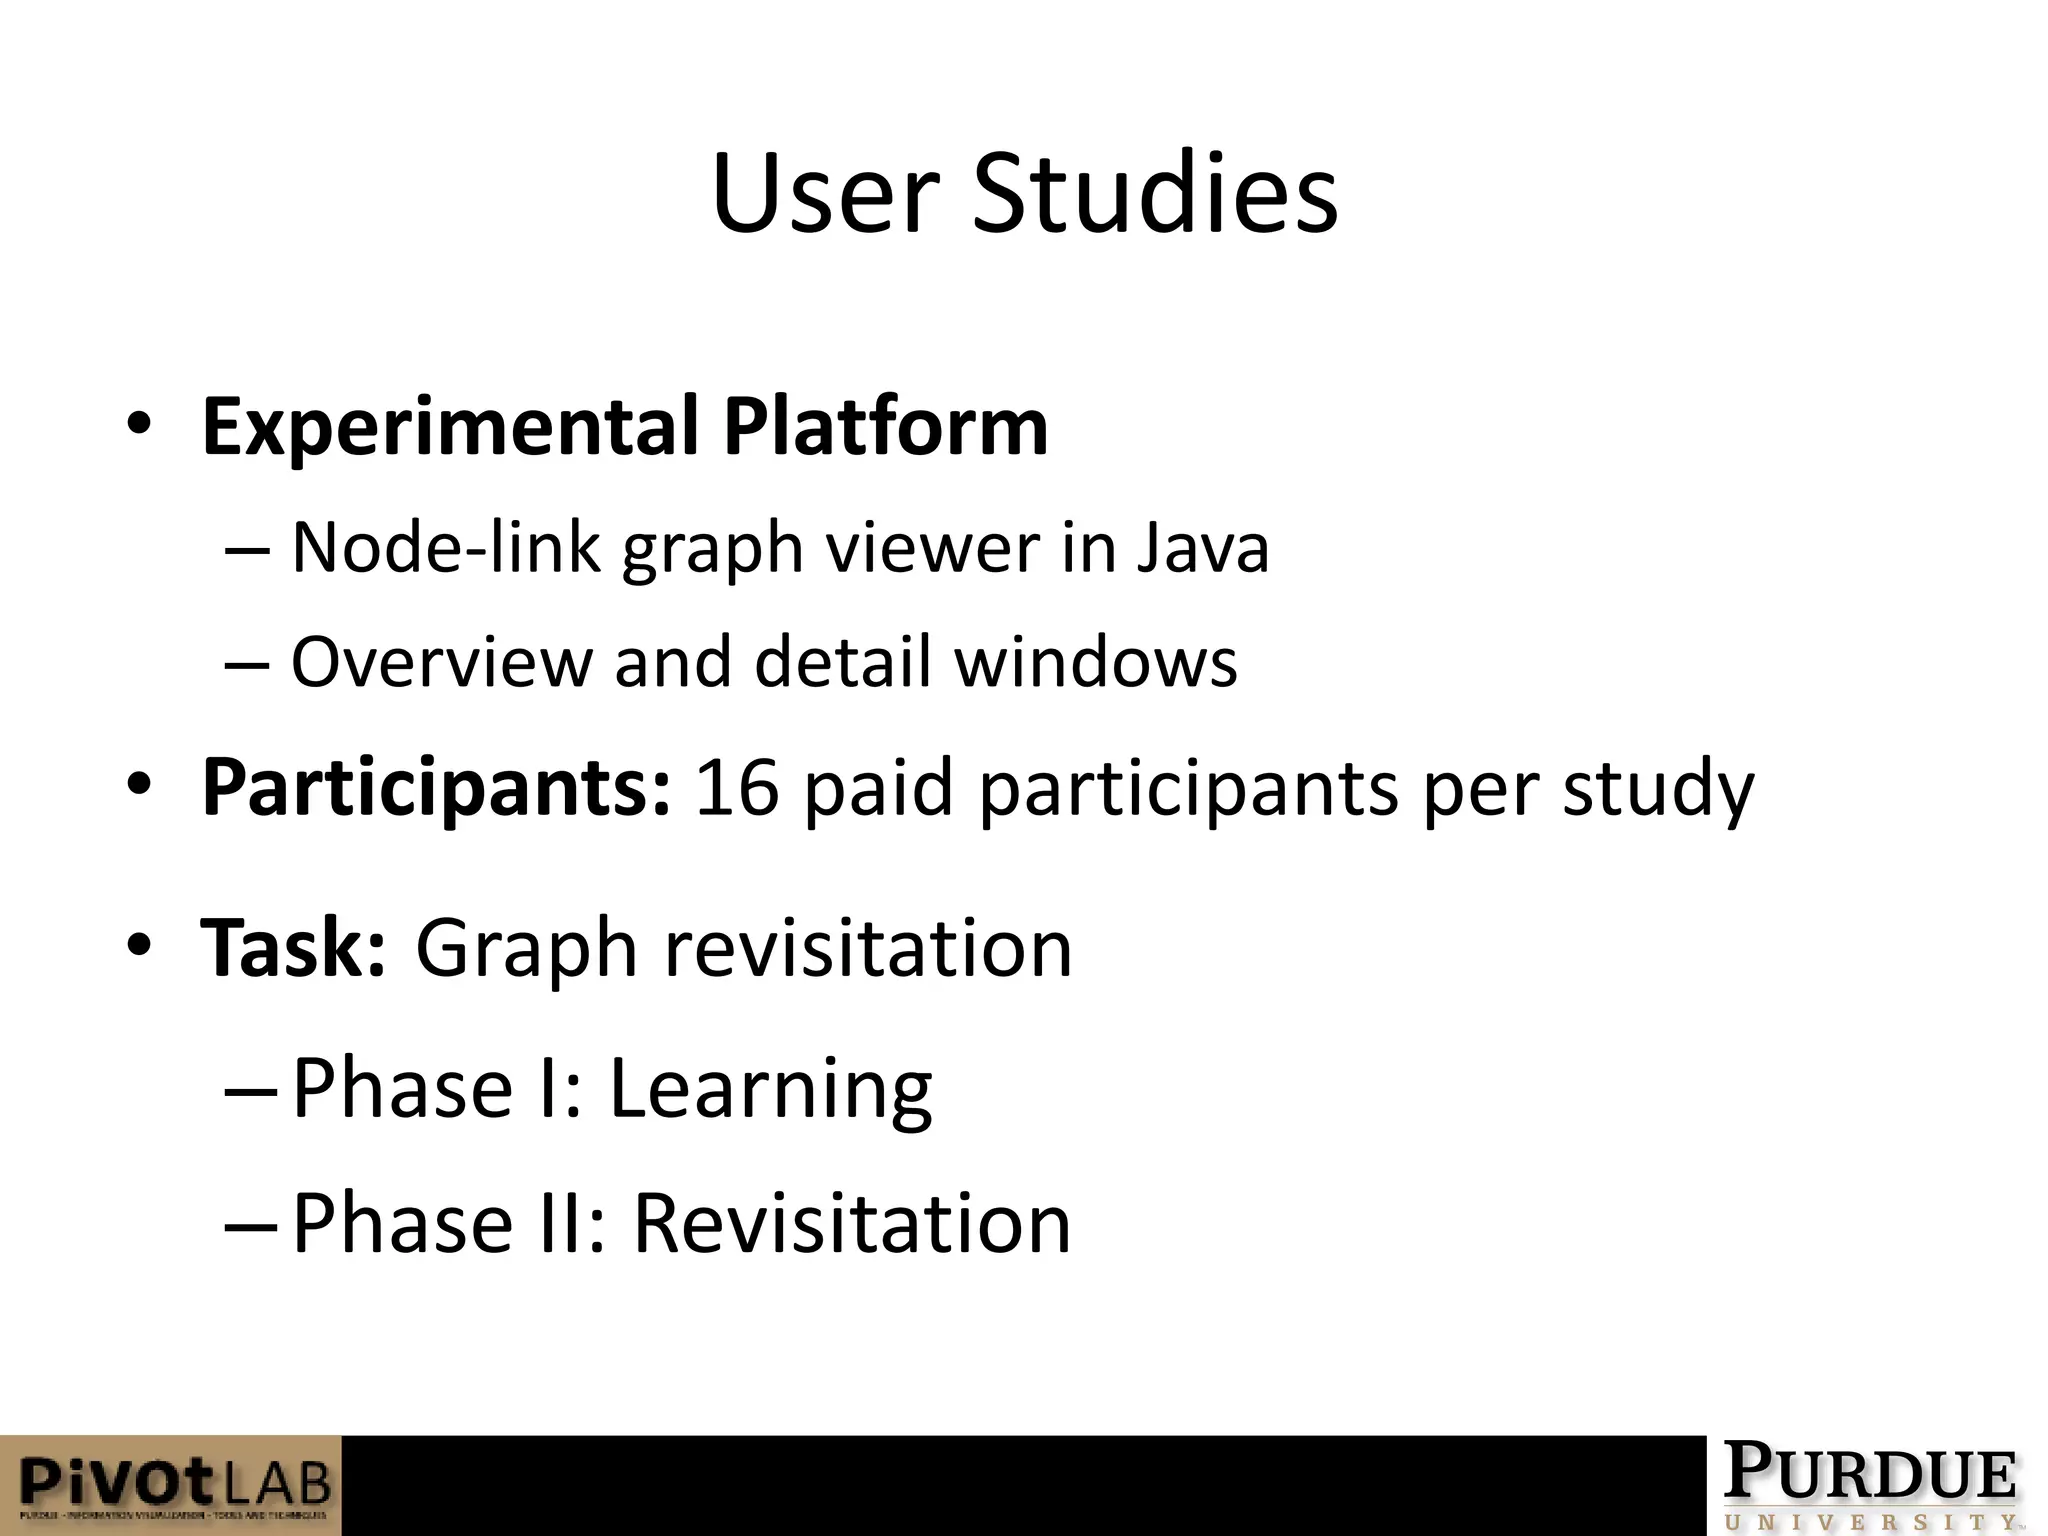
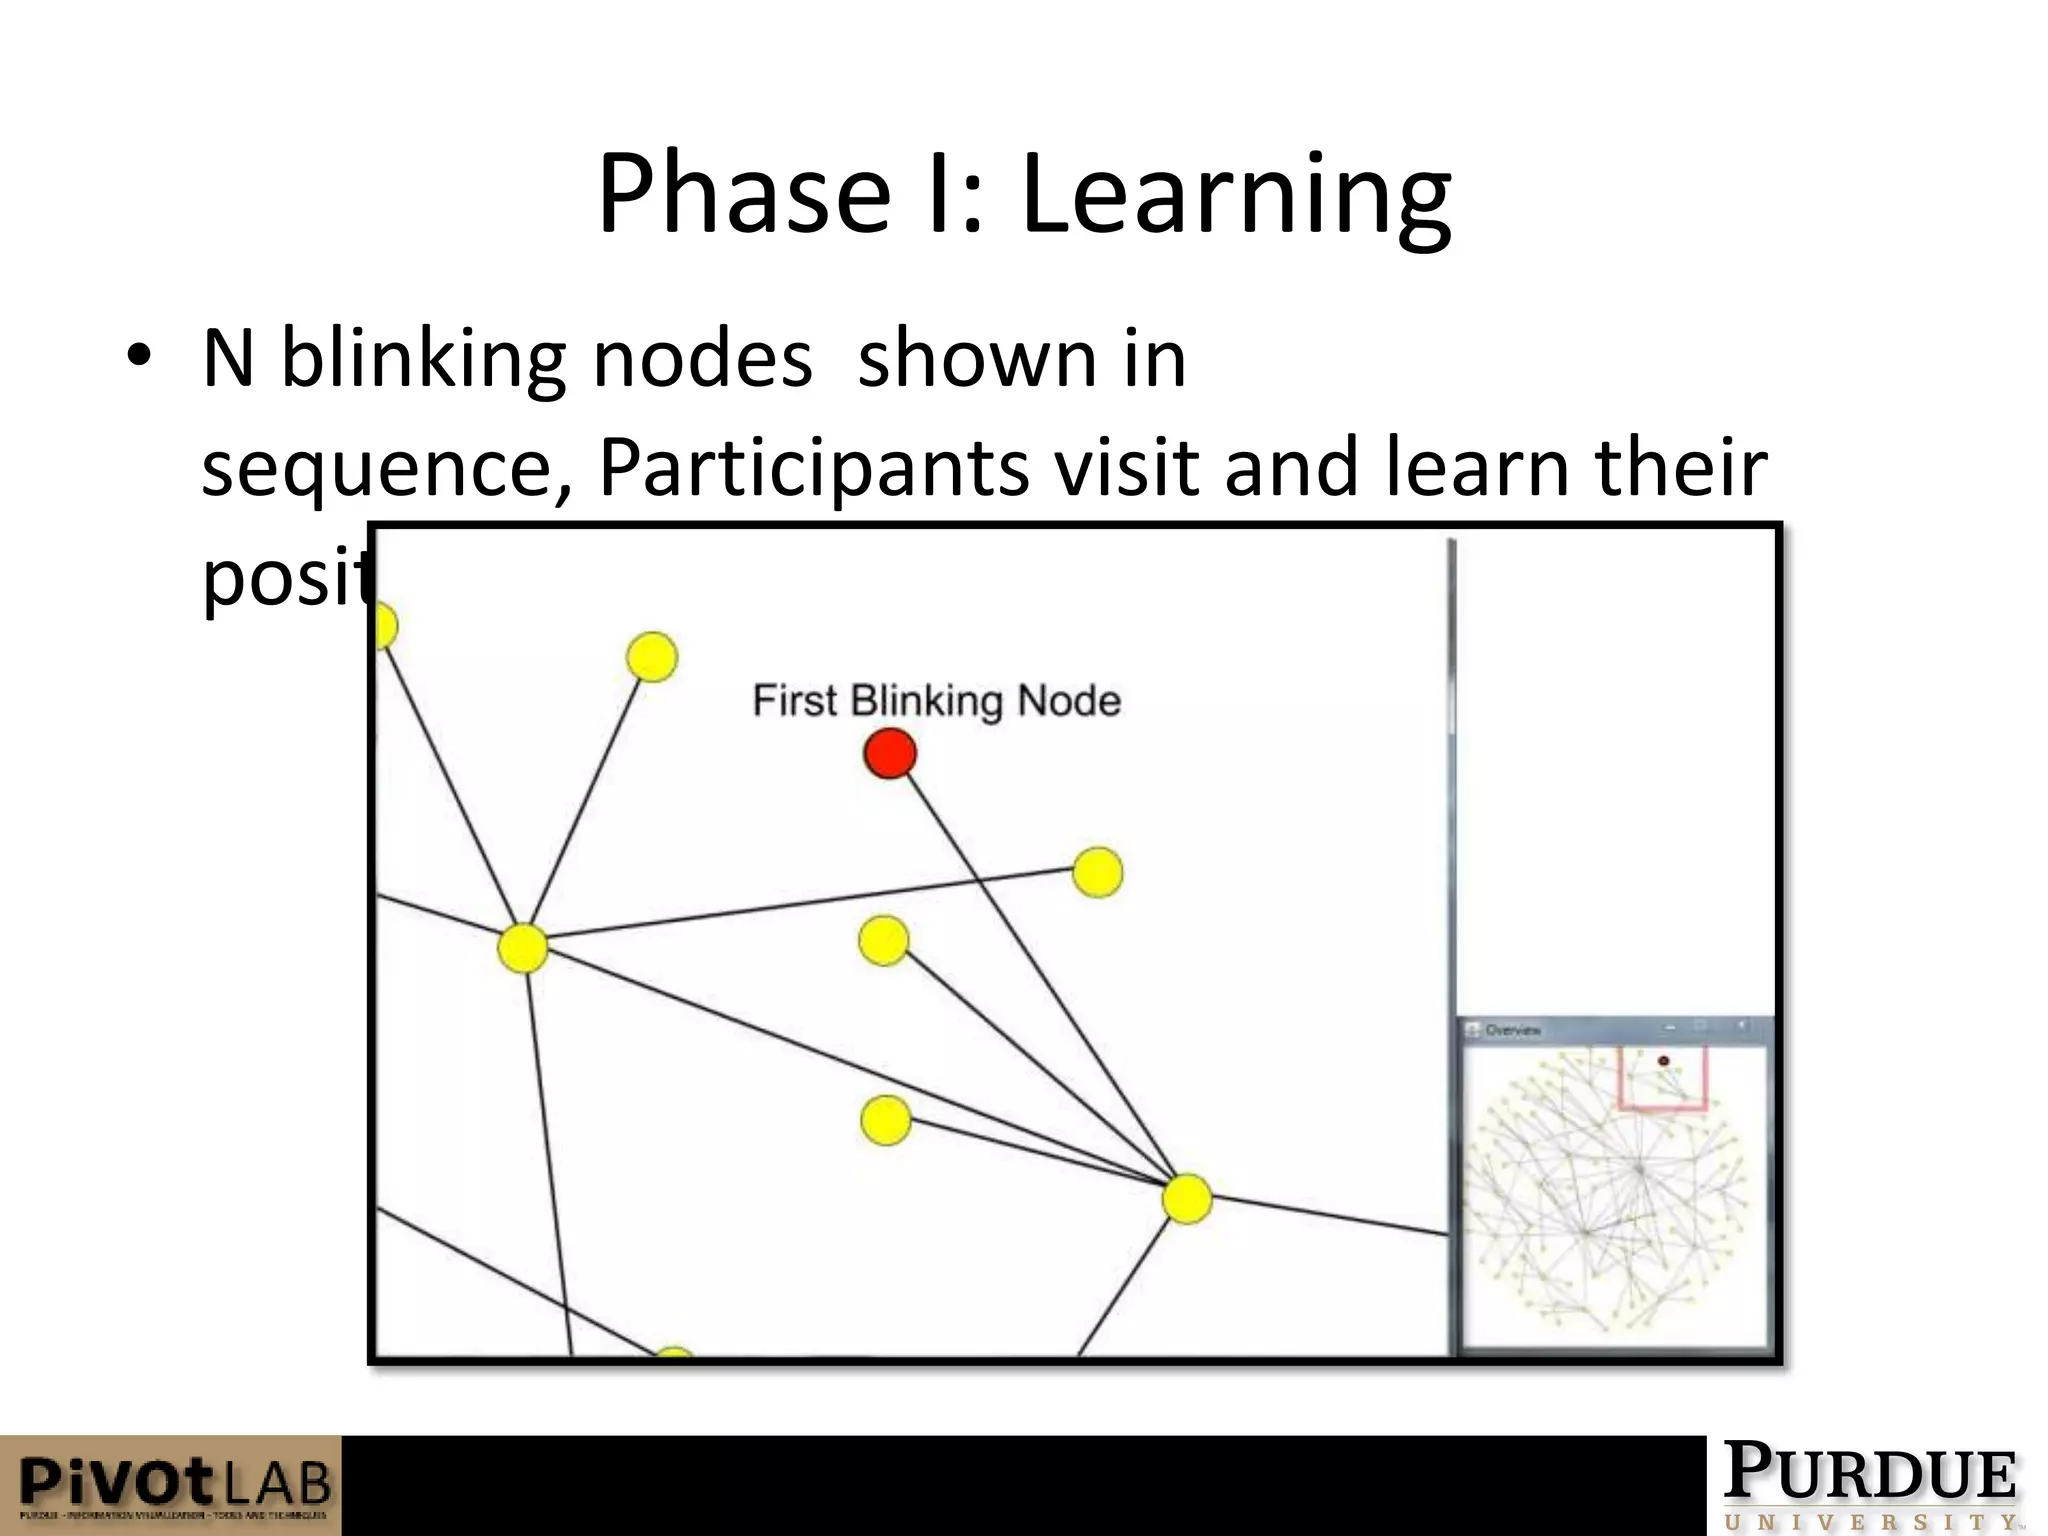
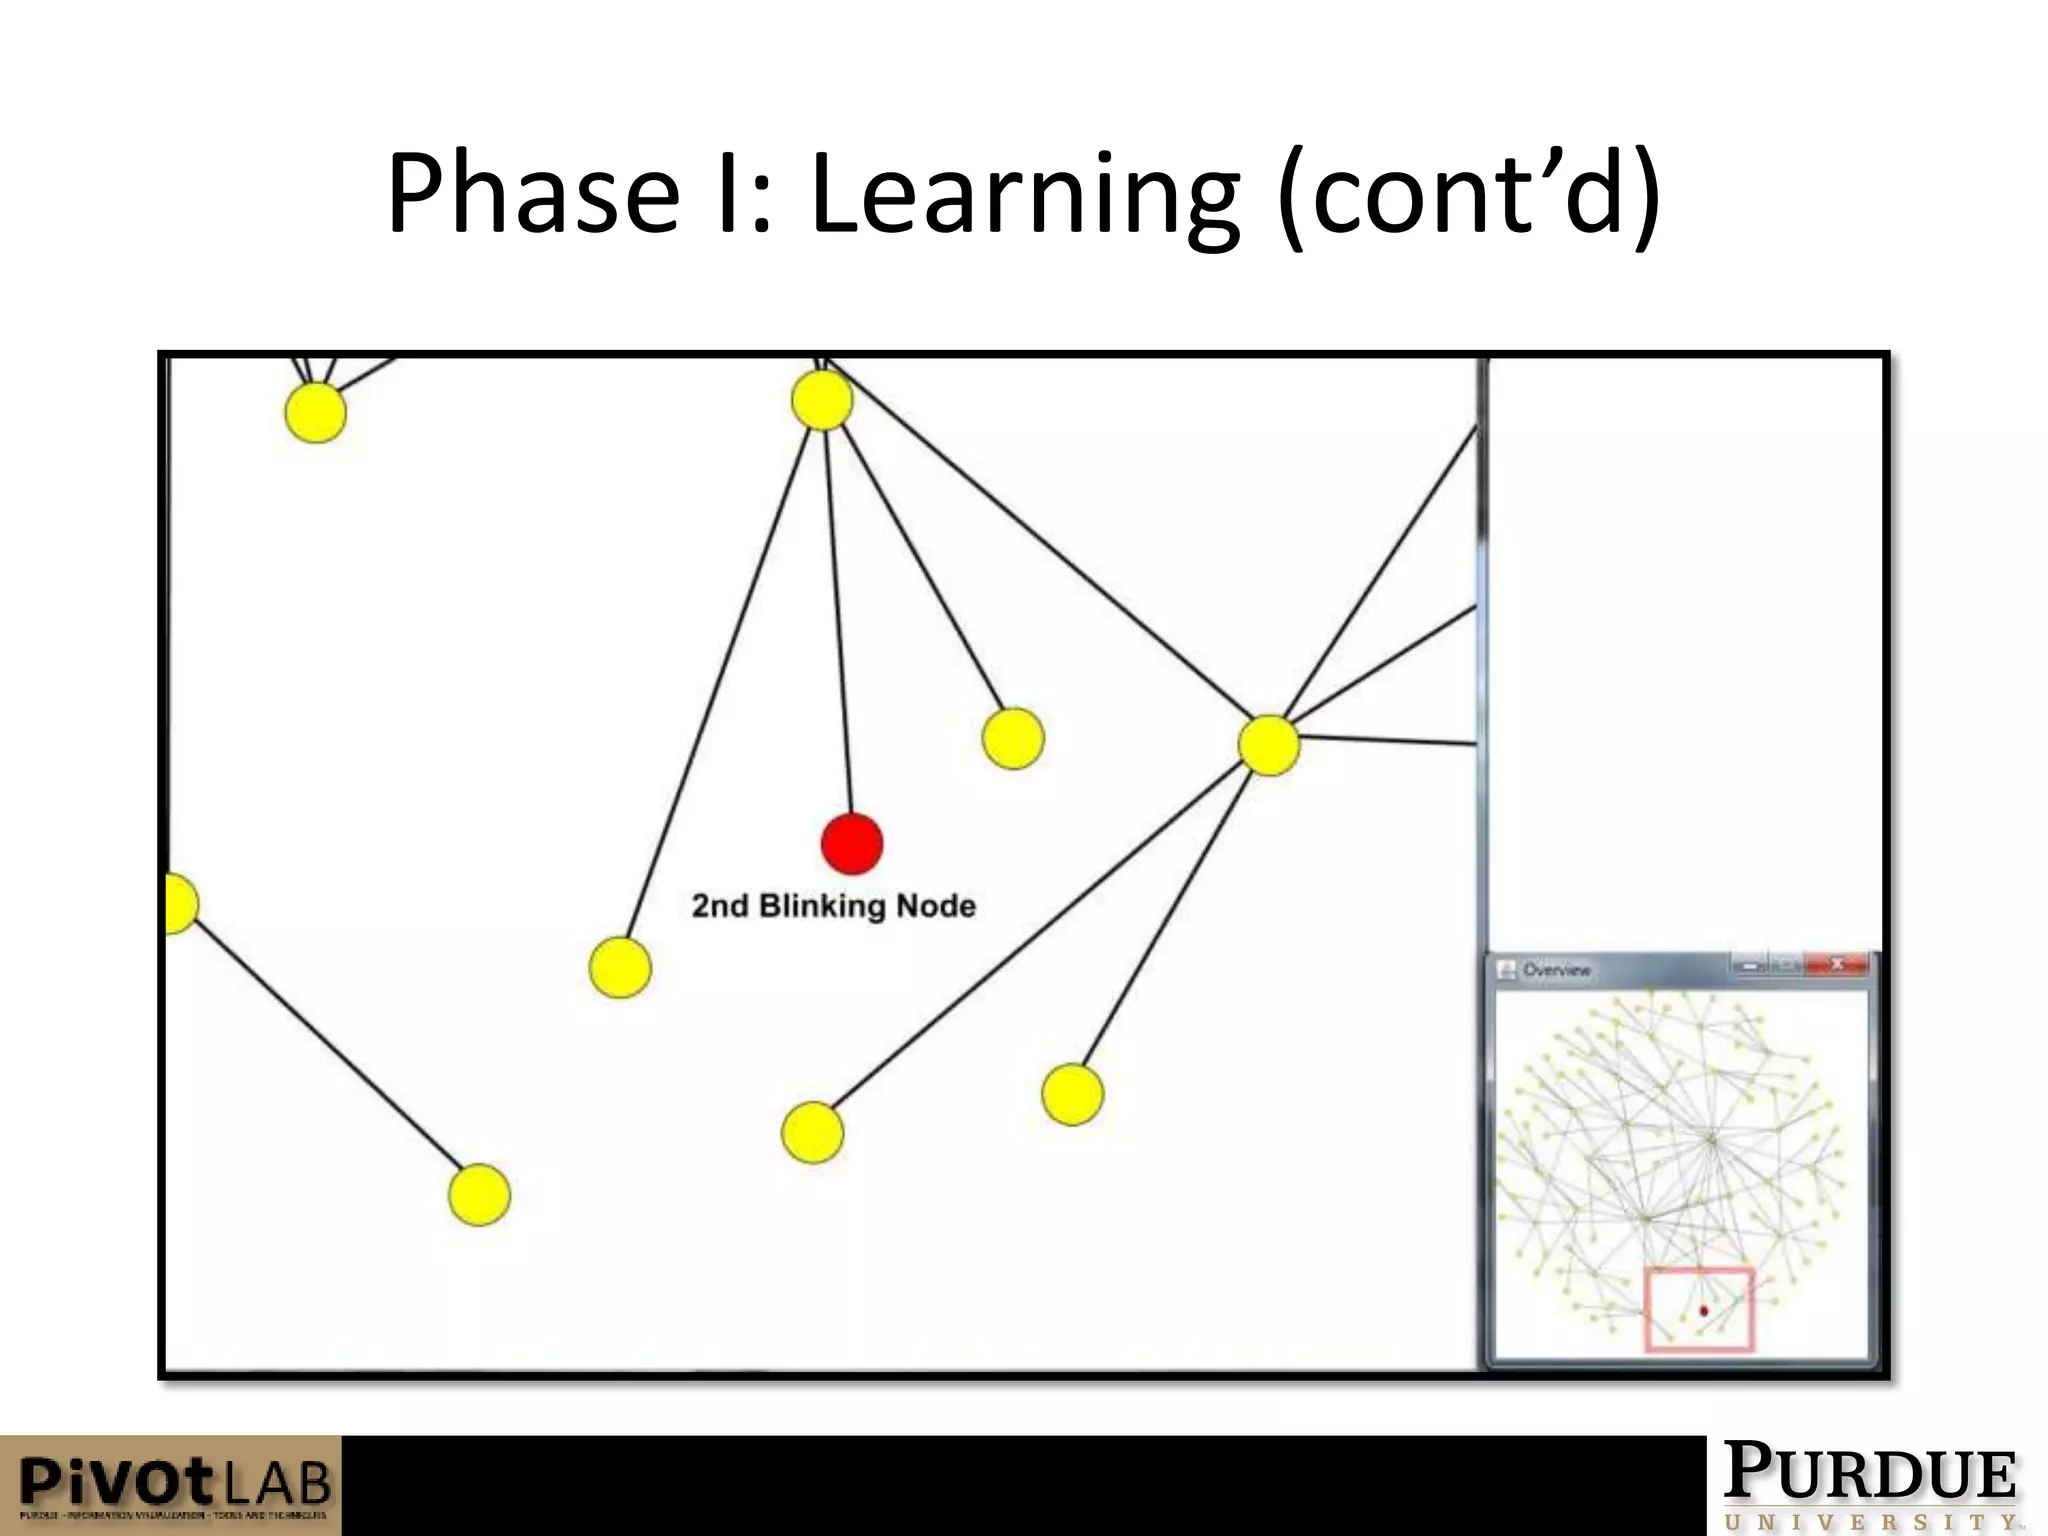
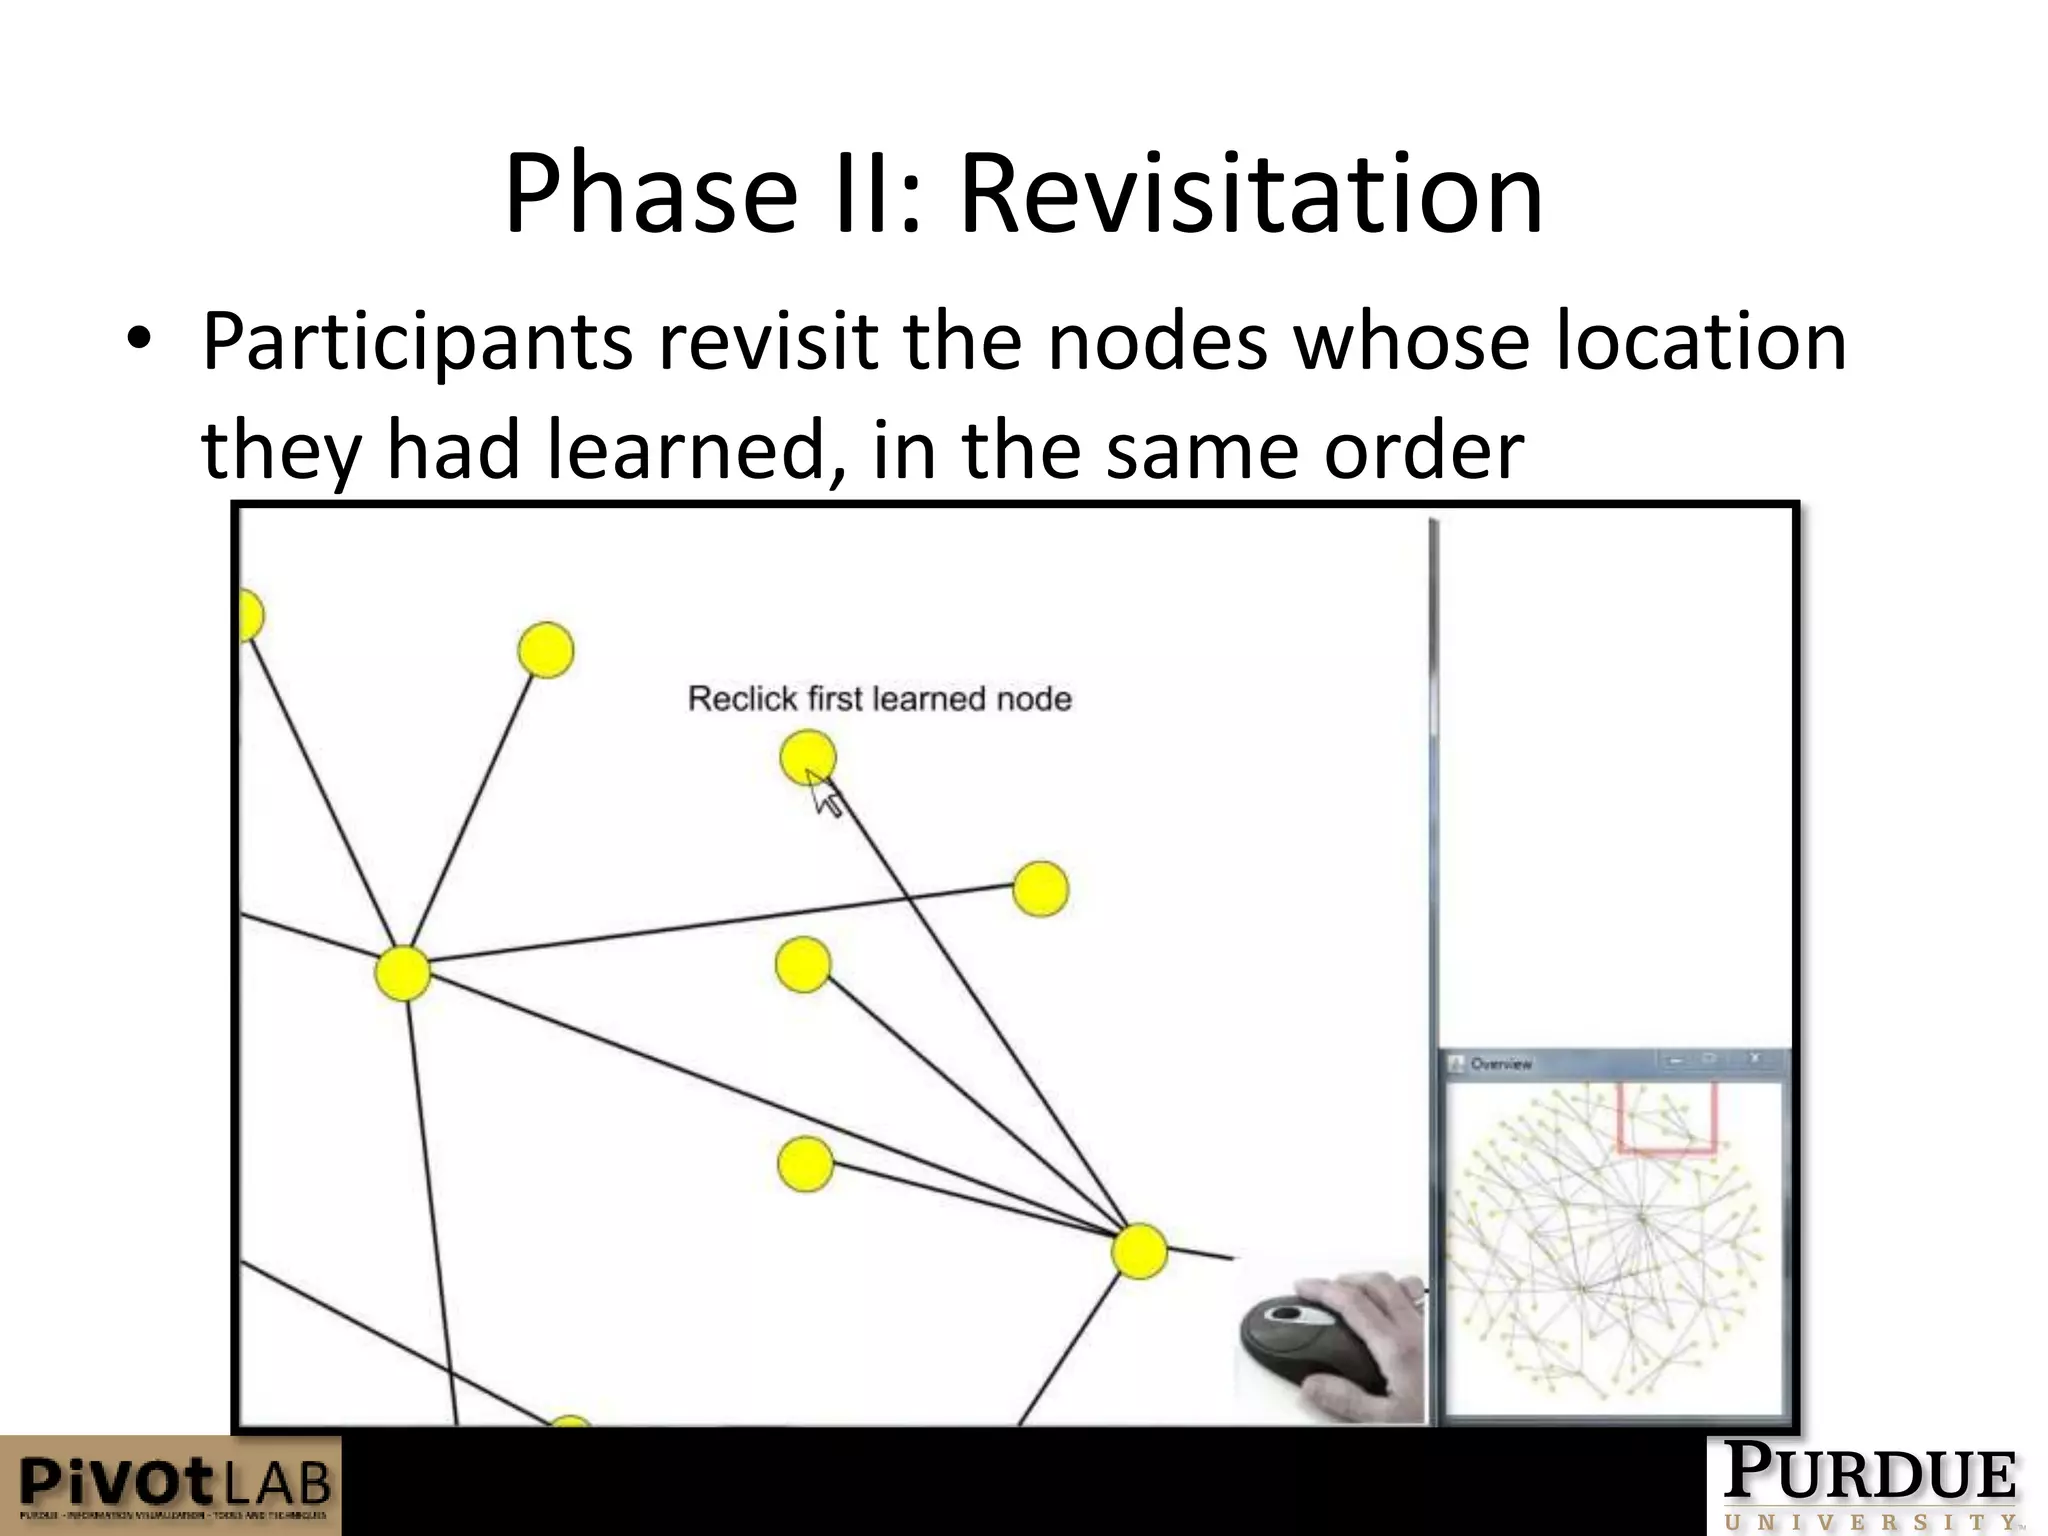
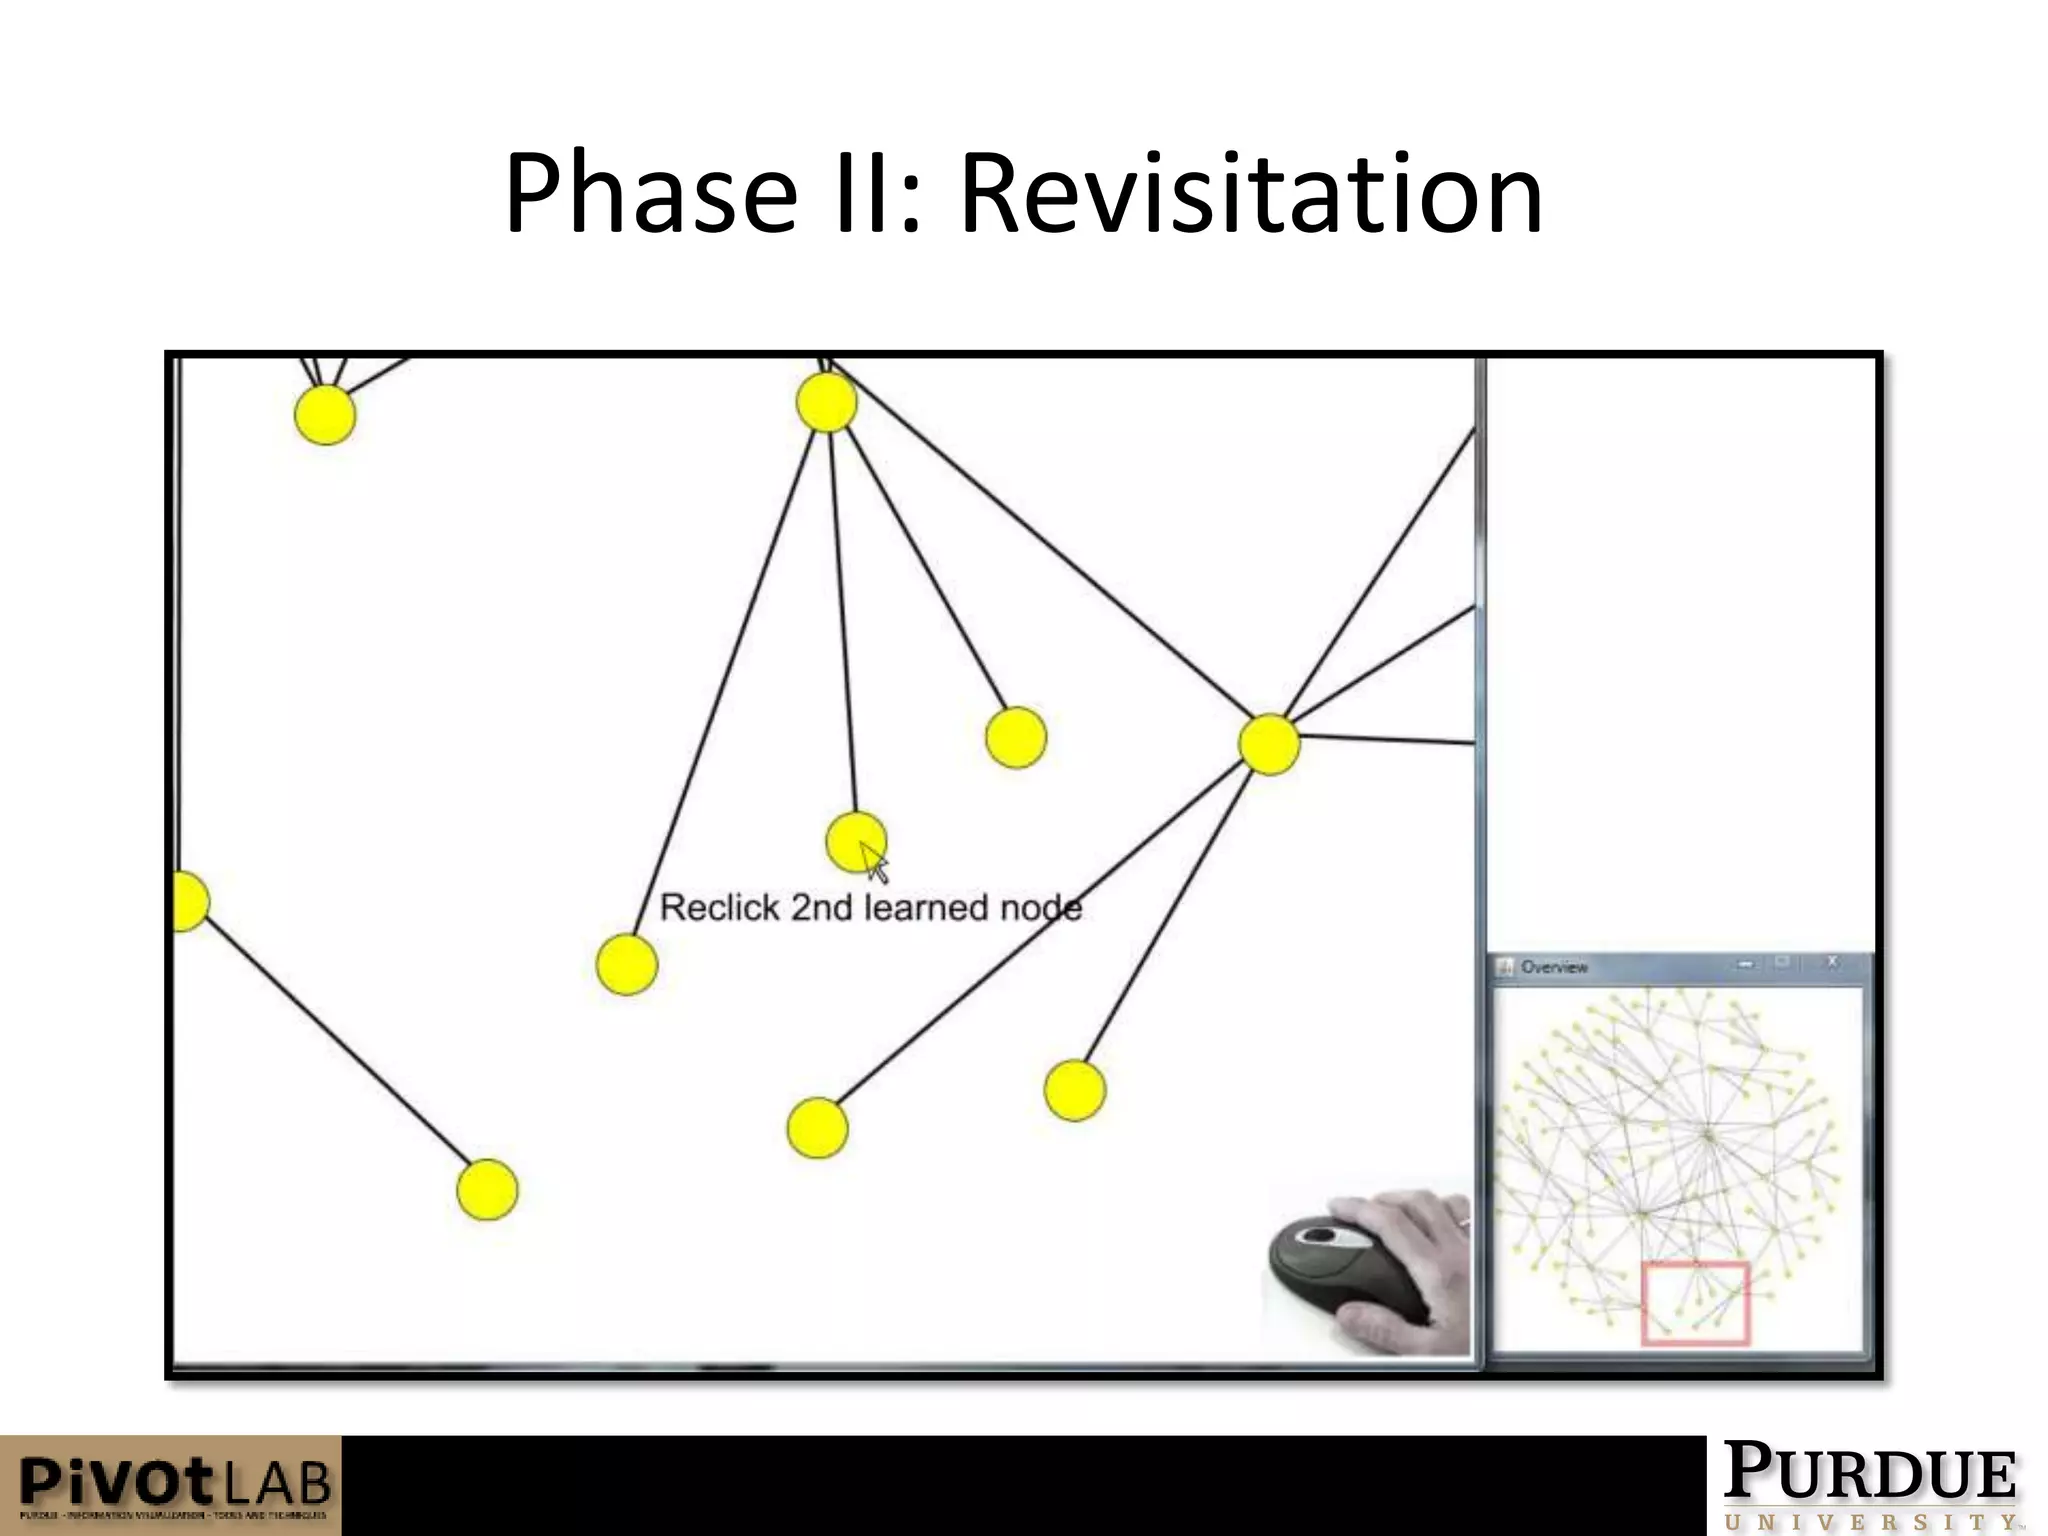
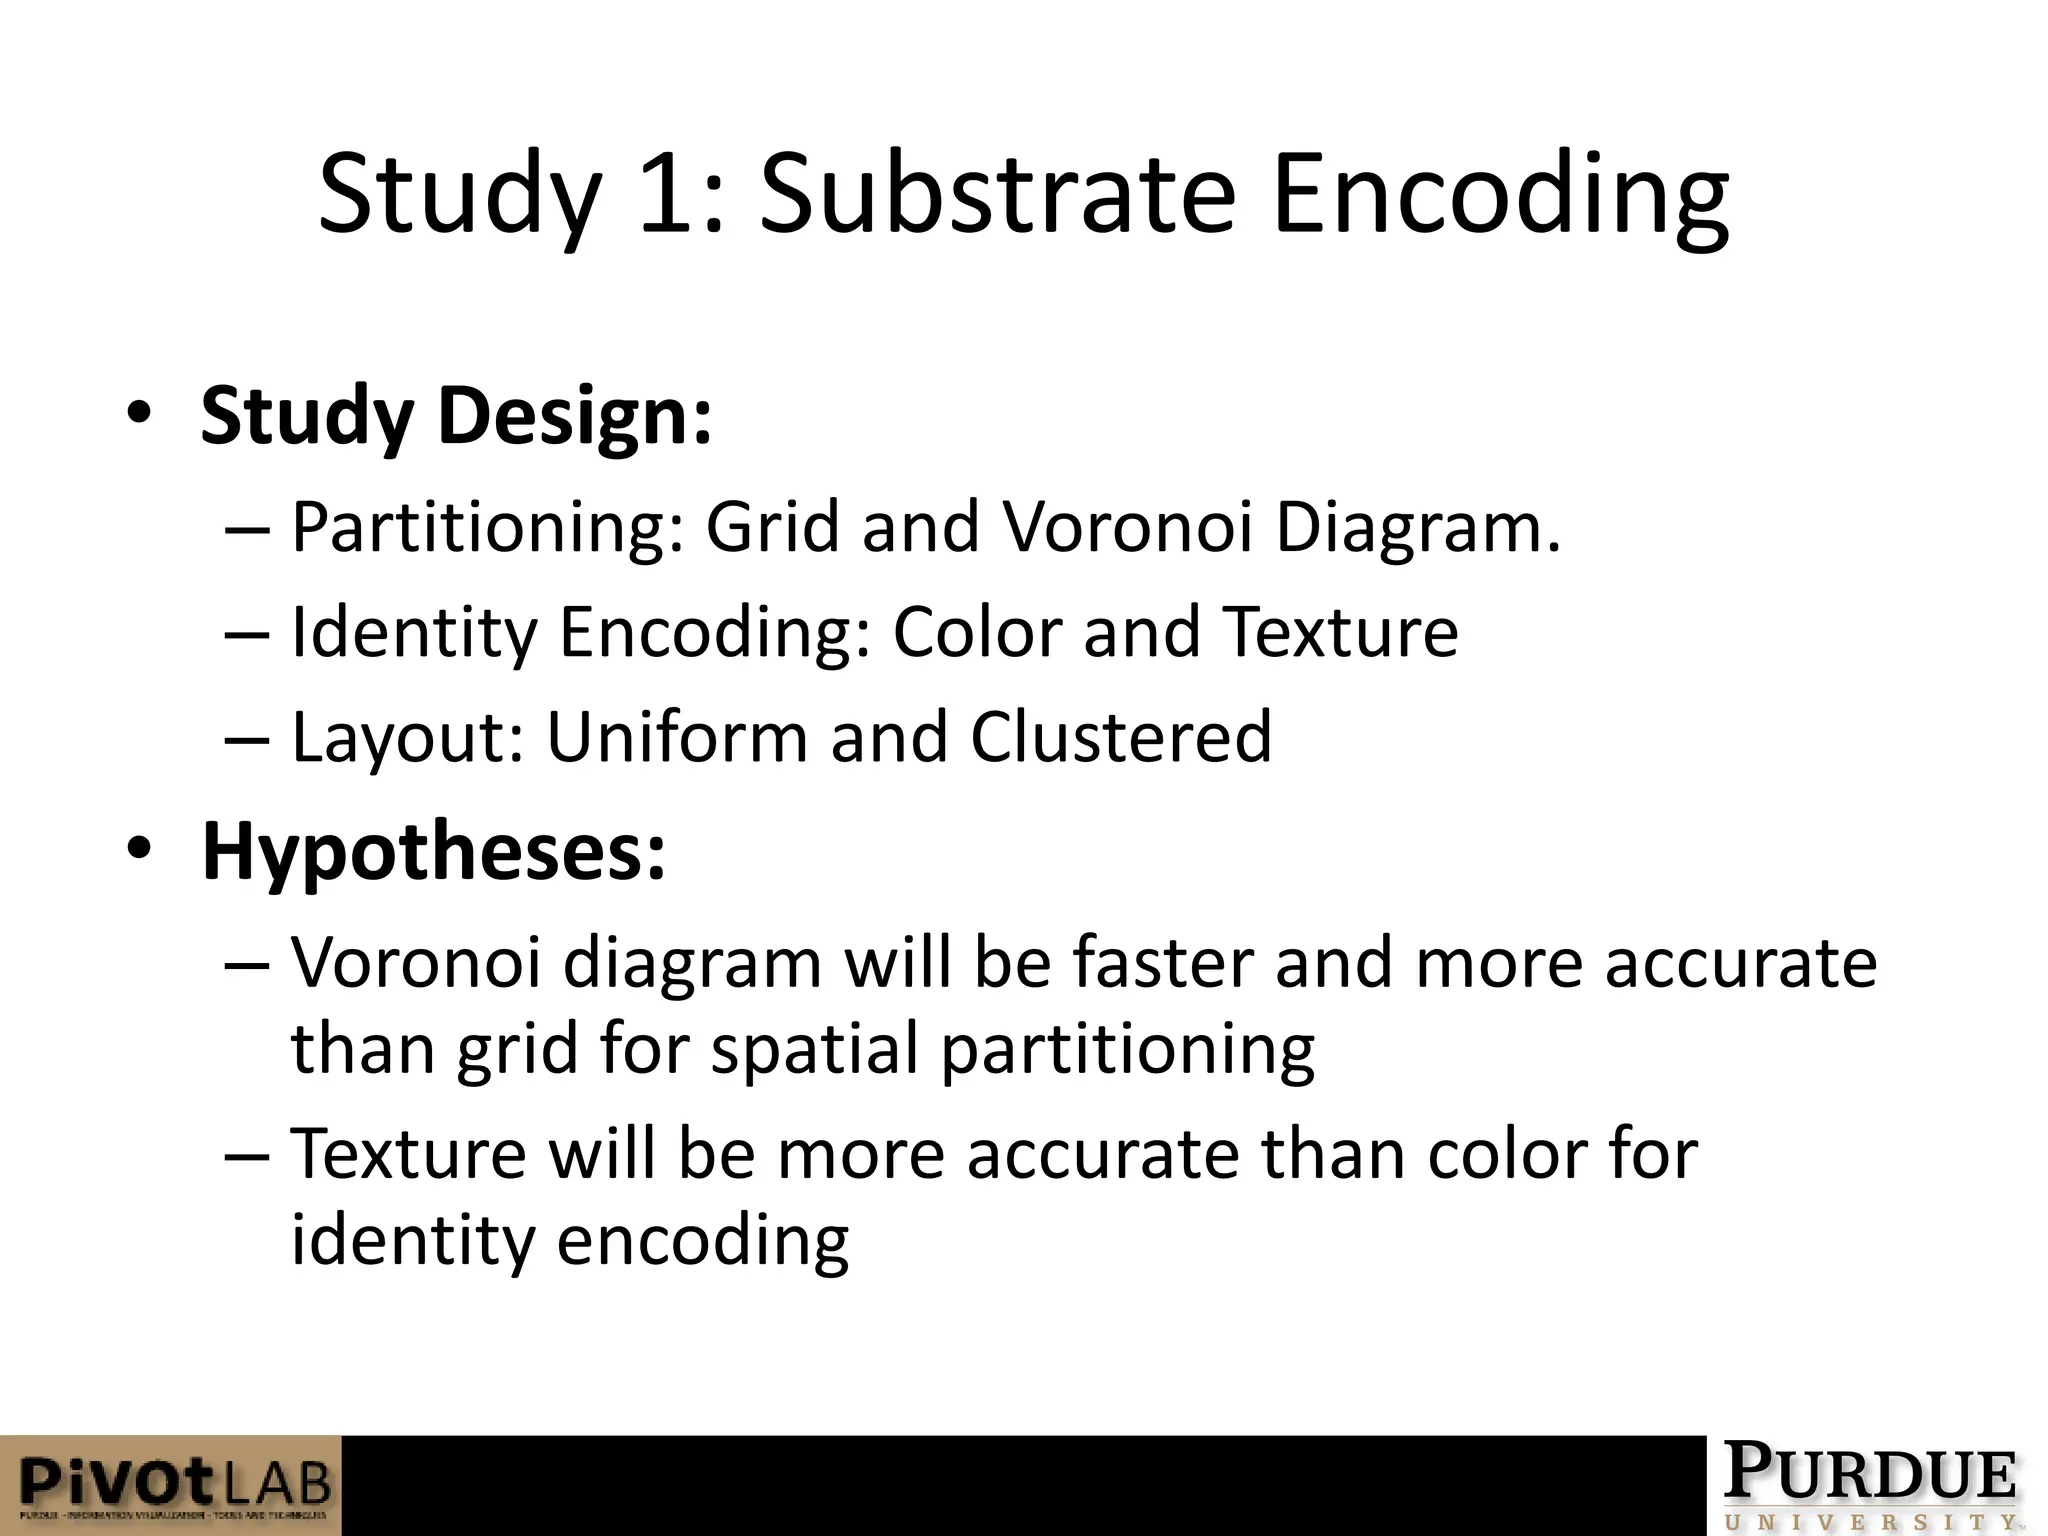
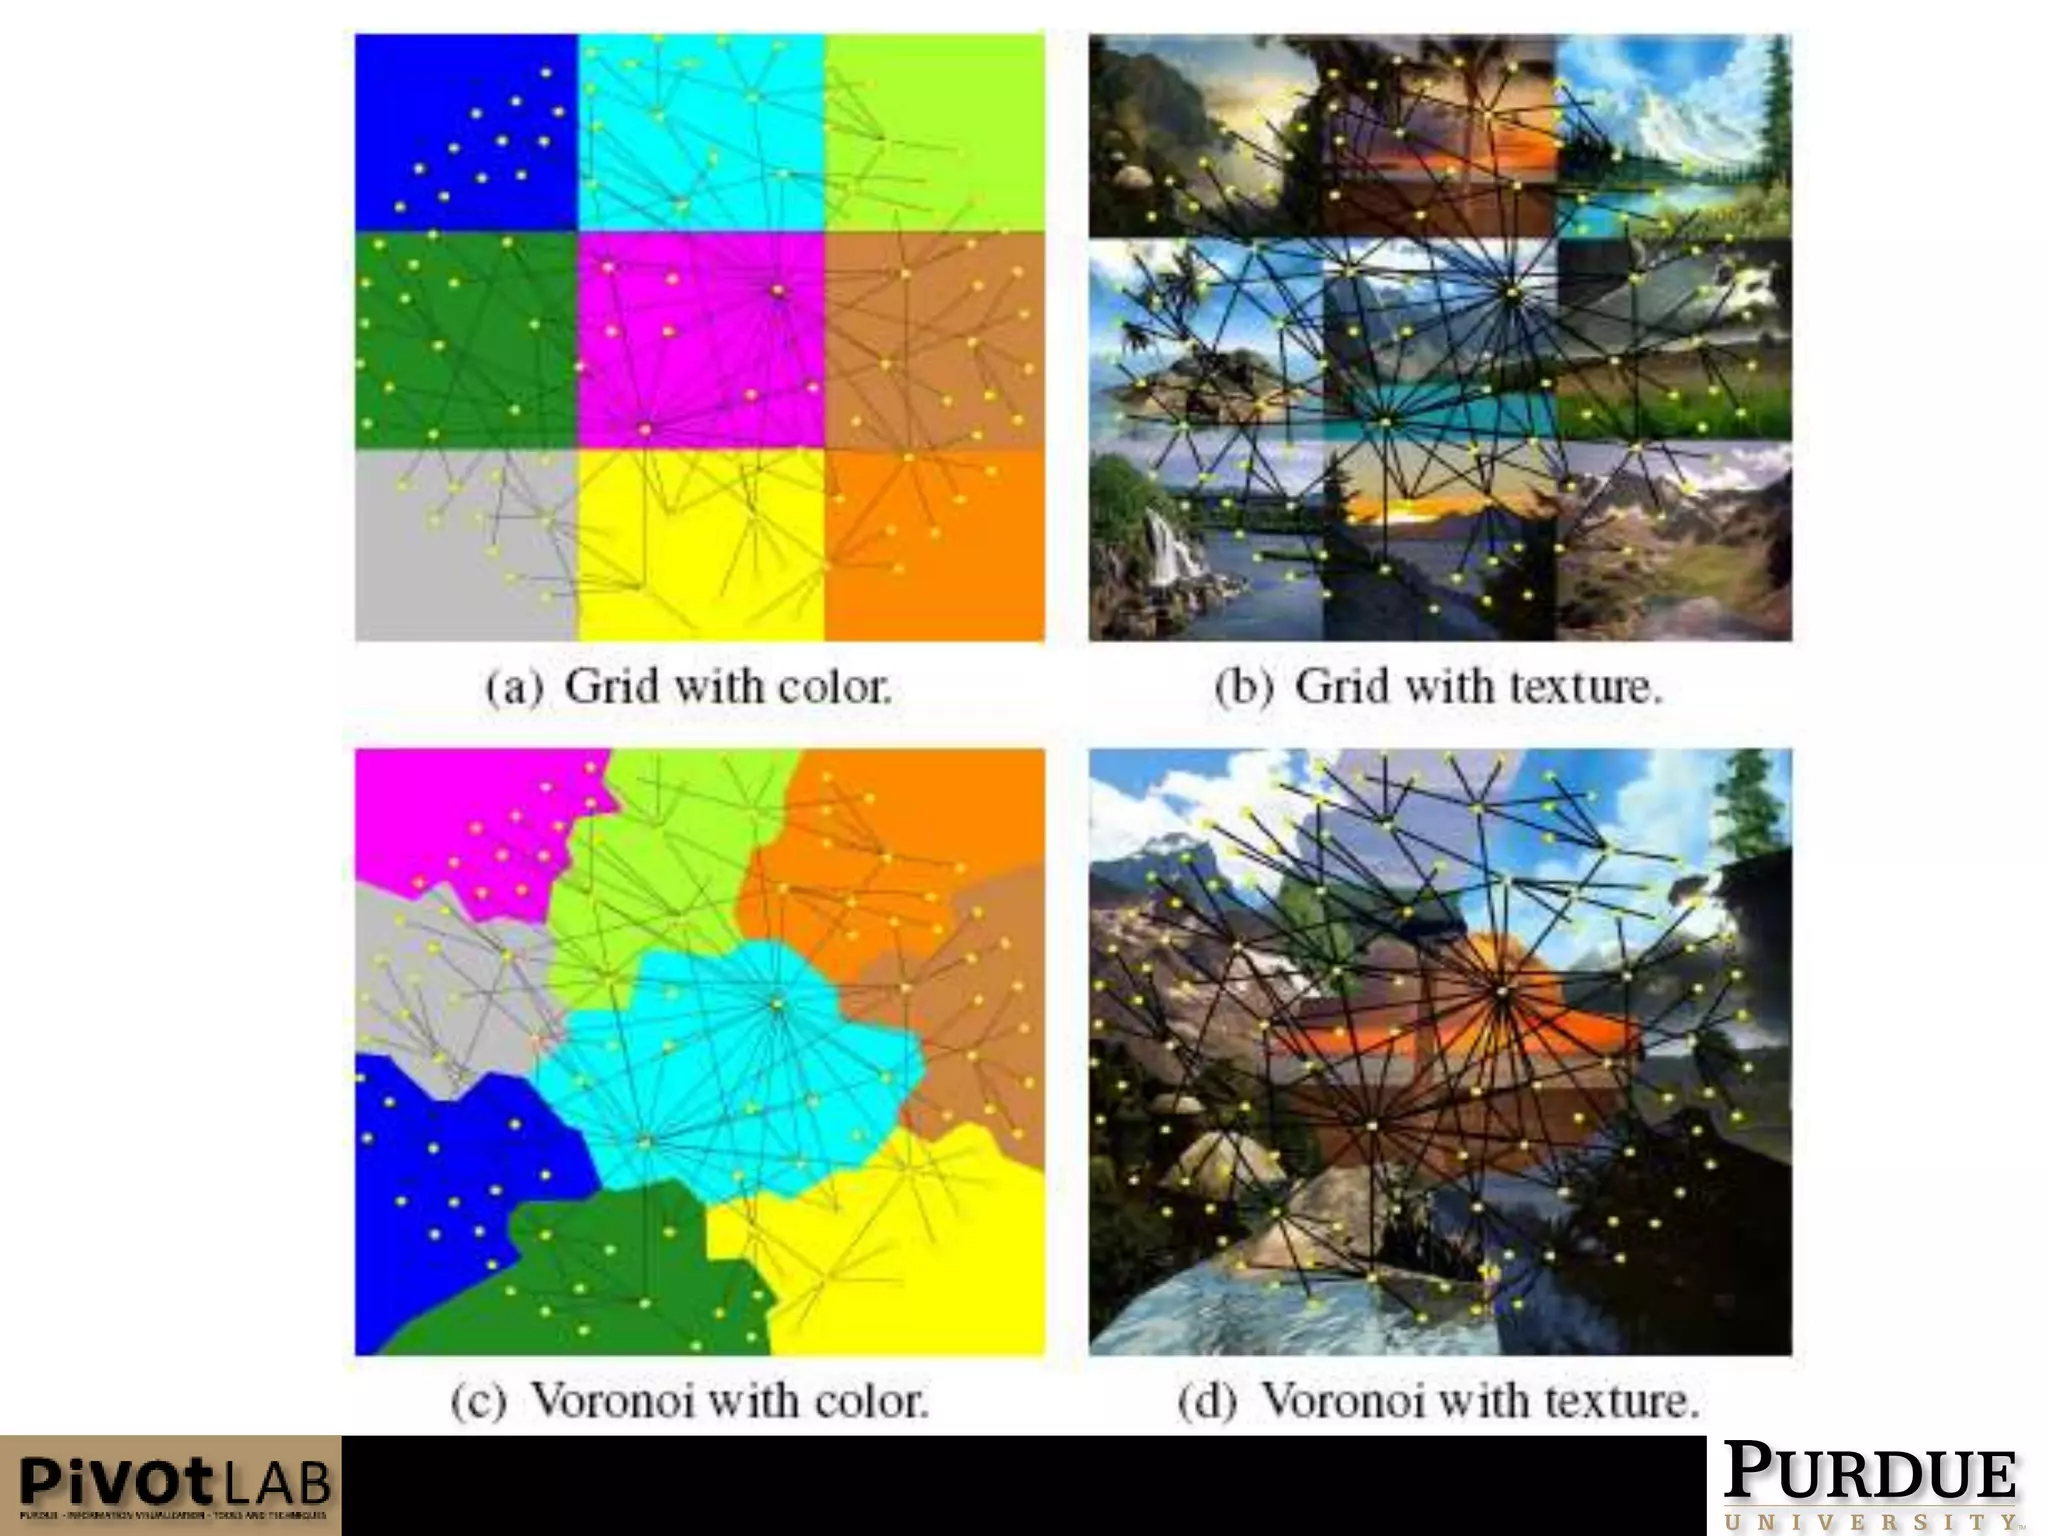


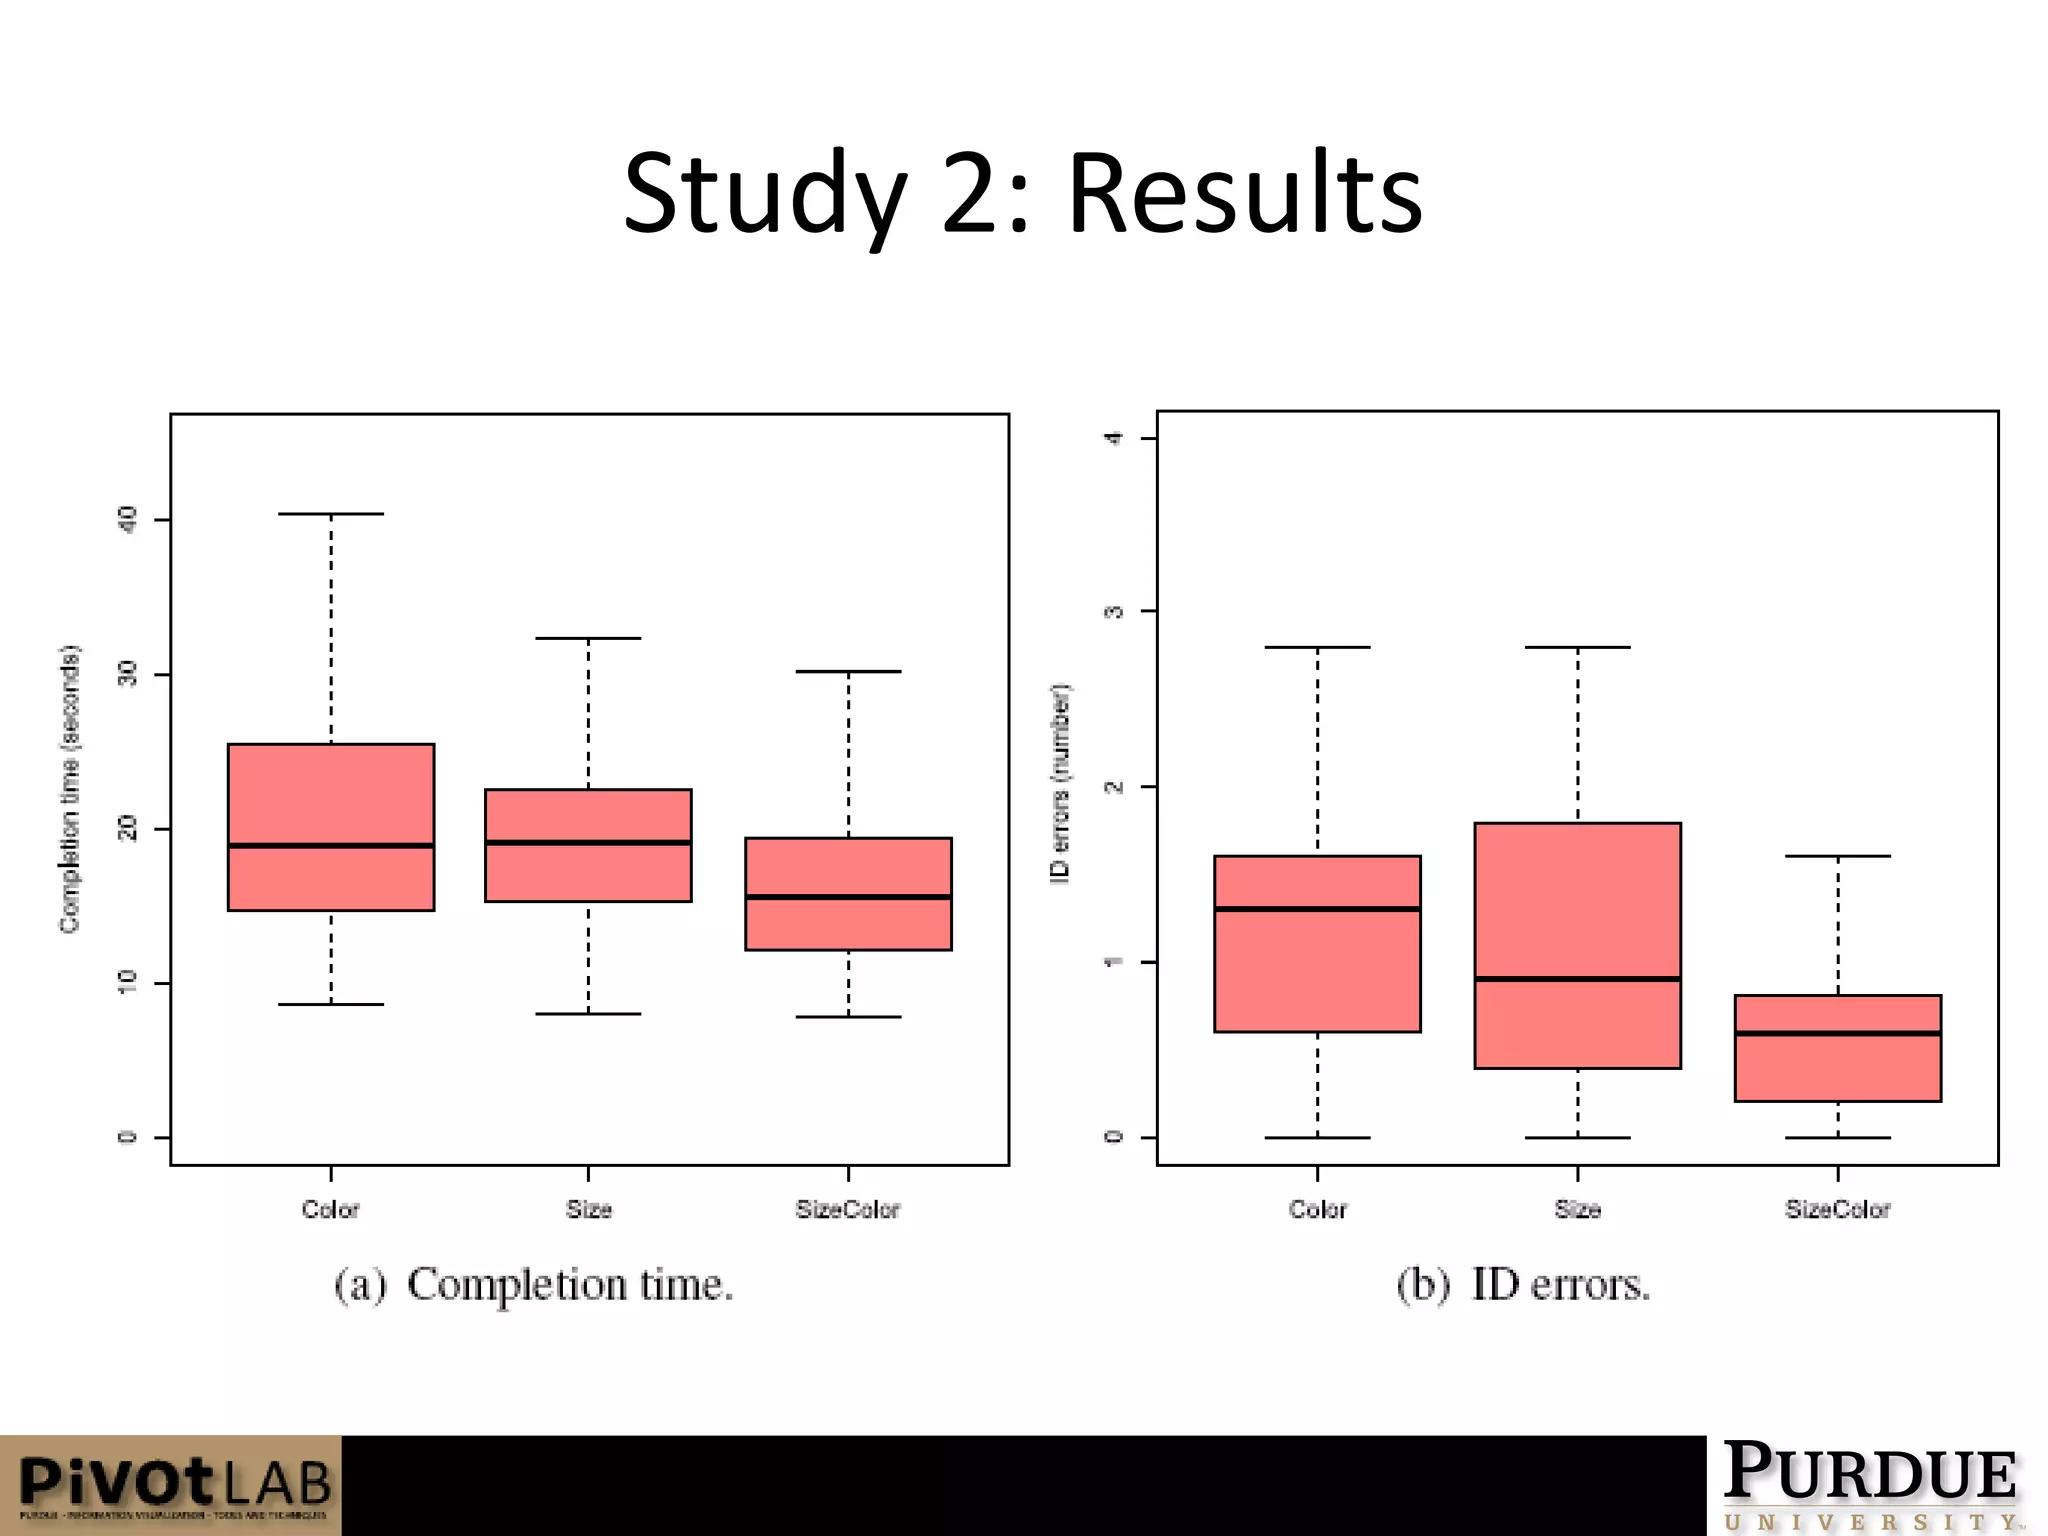

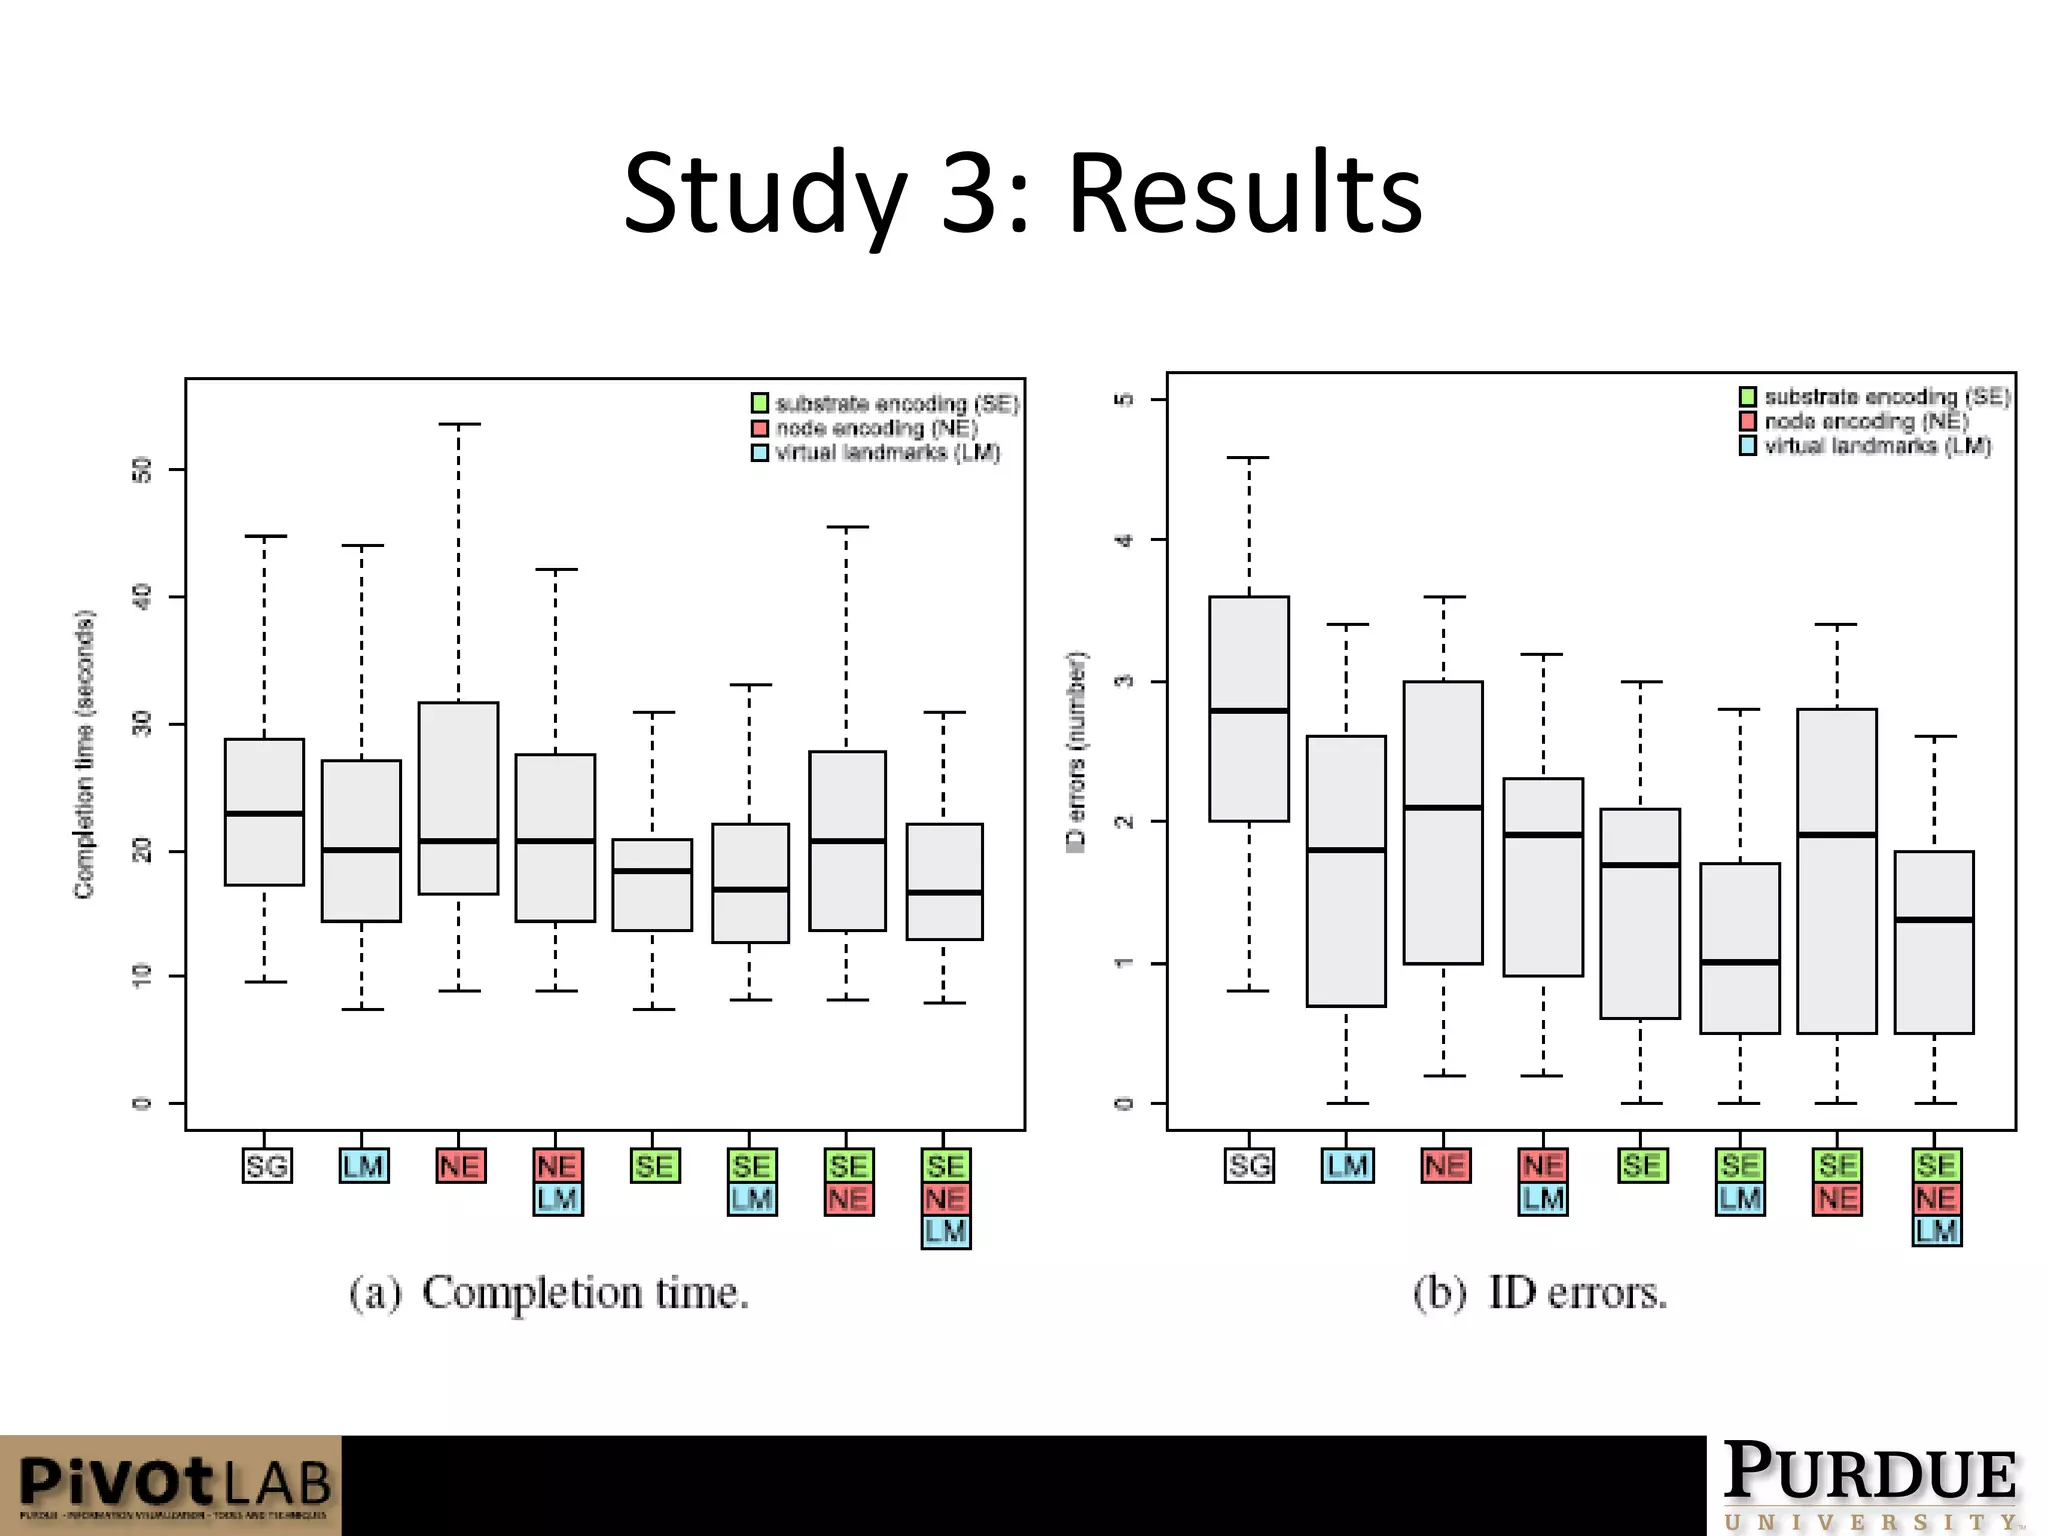


The document discusses improving revisitation in graphs by incorporating static spatial features to enhance memorability and navigational abilities. Three user studies evaluated different techniques, including substrate encoding, node encoding, and virtual landmarks, with findings indicating that substrate encoding is the most effective strategy. The combination of spatial features significantly aids users in recalling and navigating previously studied graph information.


![UiPath Automation Suite Installation (Hands-On) [2/3]](https://cdn.slidesharecdn.com/ss_thumbnails/automationsuitecommunitysession2-251015095633-a6d862f1-thumbnail.jpg?width=600ounds&width=560&fit=bounds)
