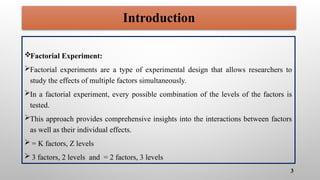
Factorial Experiment:
Factorial experimentsare a type of experimental design that allows researchers to
study the effects of multiple factors simultaneously.
In a factorial experiment, every possible combination of the levels of the factors is
tested.
This approach provides comprehensive insights into the interactions between factors
as well as their individual effects.
= K factors, Z levels
3 factors, 2 levels and = 2 factors, 3 levels
3
Introduction
4.
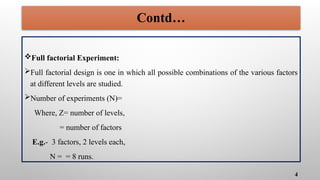
Full factorial Experiment:
Fullfactorial design is one in which all possible combinations of the various factors
at different levels are studied.
Number of experiments (N)=
Where, Z= number of levels,
= number of factors
E.g.- 3 factors, 2 levels each,
N = = 8 runs.
4
Contd…
5.
With increase inthe number of factors and their levels, the number of experiments
would be prohibitively large.
For conducting so many experiments a number of batches of materials, different
process conditions, etc. results in heterogeneity and the experimental results tend to
become inaccurate (results in more experimental error).
Hence care must be taken that variations in the experimental material, background
conditions, etc. do not bias the conclusions to be drawn.
To address these issues, statisticians have developed Fractional Replicate Designs
(Fractional Factorial Designs).
Contd..
5
Krishnaiah and Shahabudeen (2012)
6.
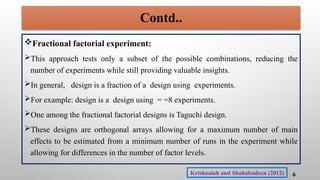
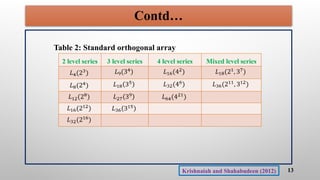
Fractional factorial experiment:
Thisapproach tests only a subset of the possible combinations, reducing the
number of experiments while still providing valuable insights.
In general, design is a fraction of a design using experiments.
For example: design is a design using = =8 experiments.
One among the fractional factorial designs is Taguchi design.
These designs are orthogonal arrays allowing for a maximum number of main
effects to be estimated from a minimum number of runs in the experiment while
allowing for differences in the number of factor levels.
6
Contd..
Krishnaiah and Shahabudeen (2012)
7.
Taguchi Method
The Taguchimethods are statistical methods developed by Japanese scientist Genichi
Taguchi in 1950.
This method was developed based on orthogonal array experiments which gives much
reduced variance for the experiment with optimum setting of control parameters.
The principle of design of experiments along with optimization of control parameters
to obtain best results is achieved in the Taguchi method.
The Taguchi approach enables a comprehensive understanding of the individual and
combined effects of various design parameters to be obtained from a minimum
number of experimental trials.
7
Shyam and Rajeshwar (2012)
8.
Contd…
The aim ofthe Taguchi design method is to establish the parameter settings that
render the product quality robust to unavoidable variations in external noise.
ANOVA is a standard statistical technique to interpret the experimental results
and is used extensively to identify the performance of the group of parameters
under investigation.
The purpose of ANOVA is to investigate the parameters, whose combination to
total variation is significant.
If a design parameter is found to be significant, it implies that this parameter
plays a fundamental role in determining the optimal solution of the design
problem.
8
Shyam and Rajeshwar (2012)
9.
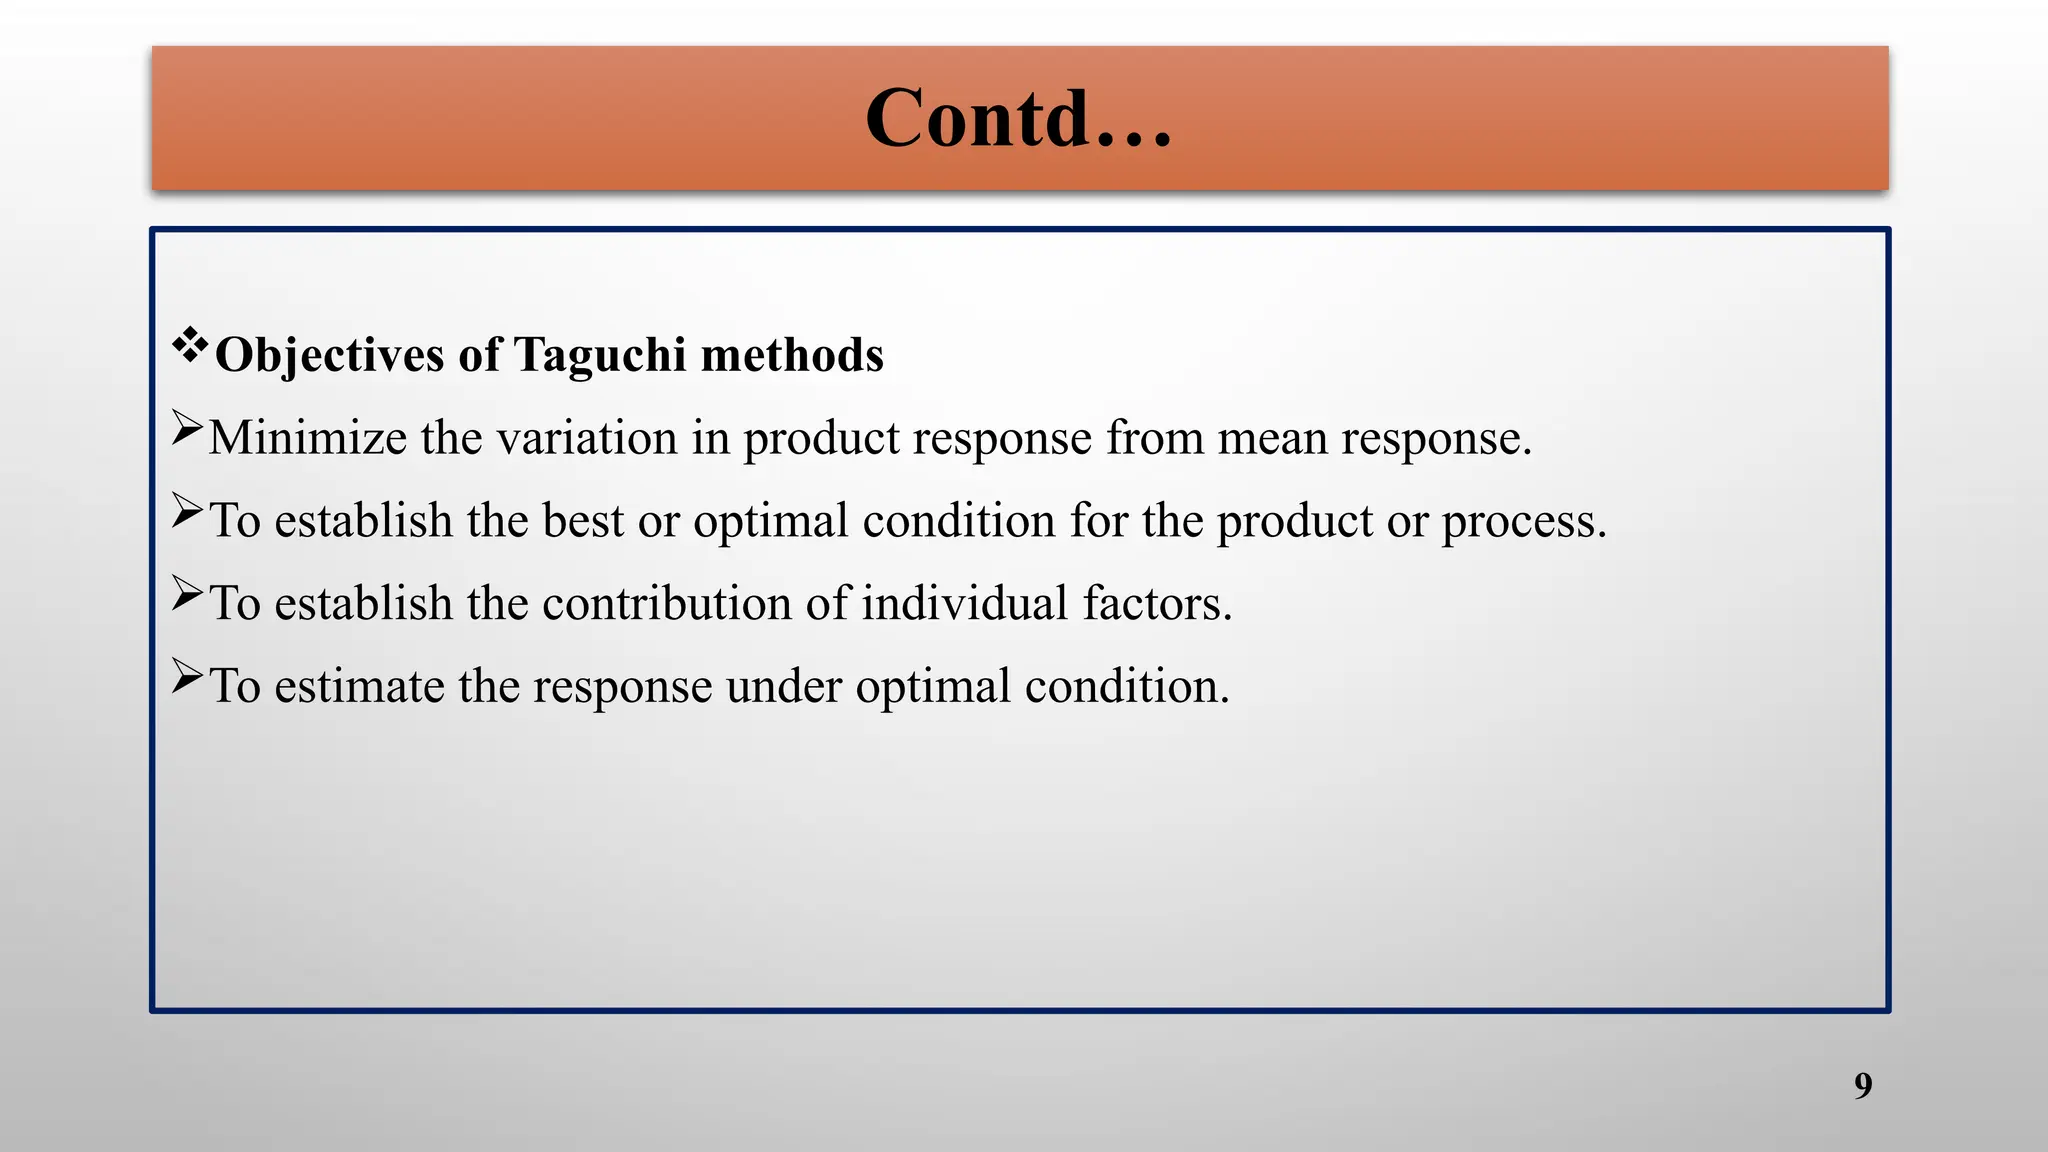
Contd…
Objectives of Taguchimethods
Minimize the variation in product response from mean response.
To establish the best or optimal condition for the product or process.
To establish the contribution of individual factors.
To estimate the response under optimal condition.
9
10.
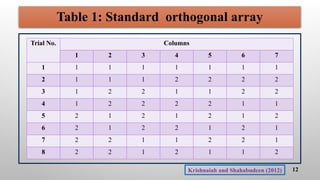
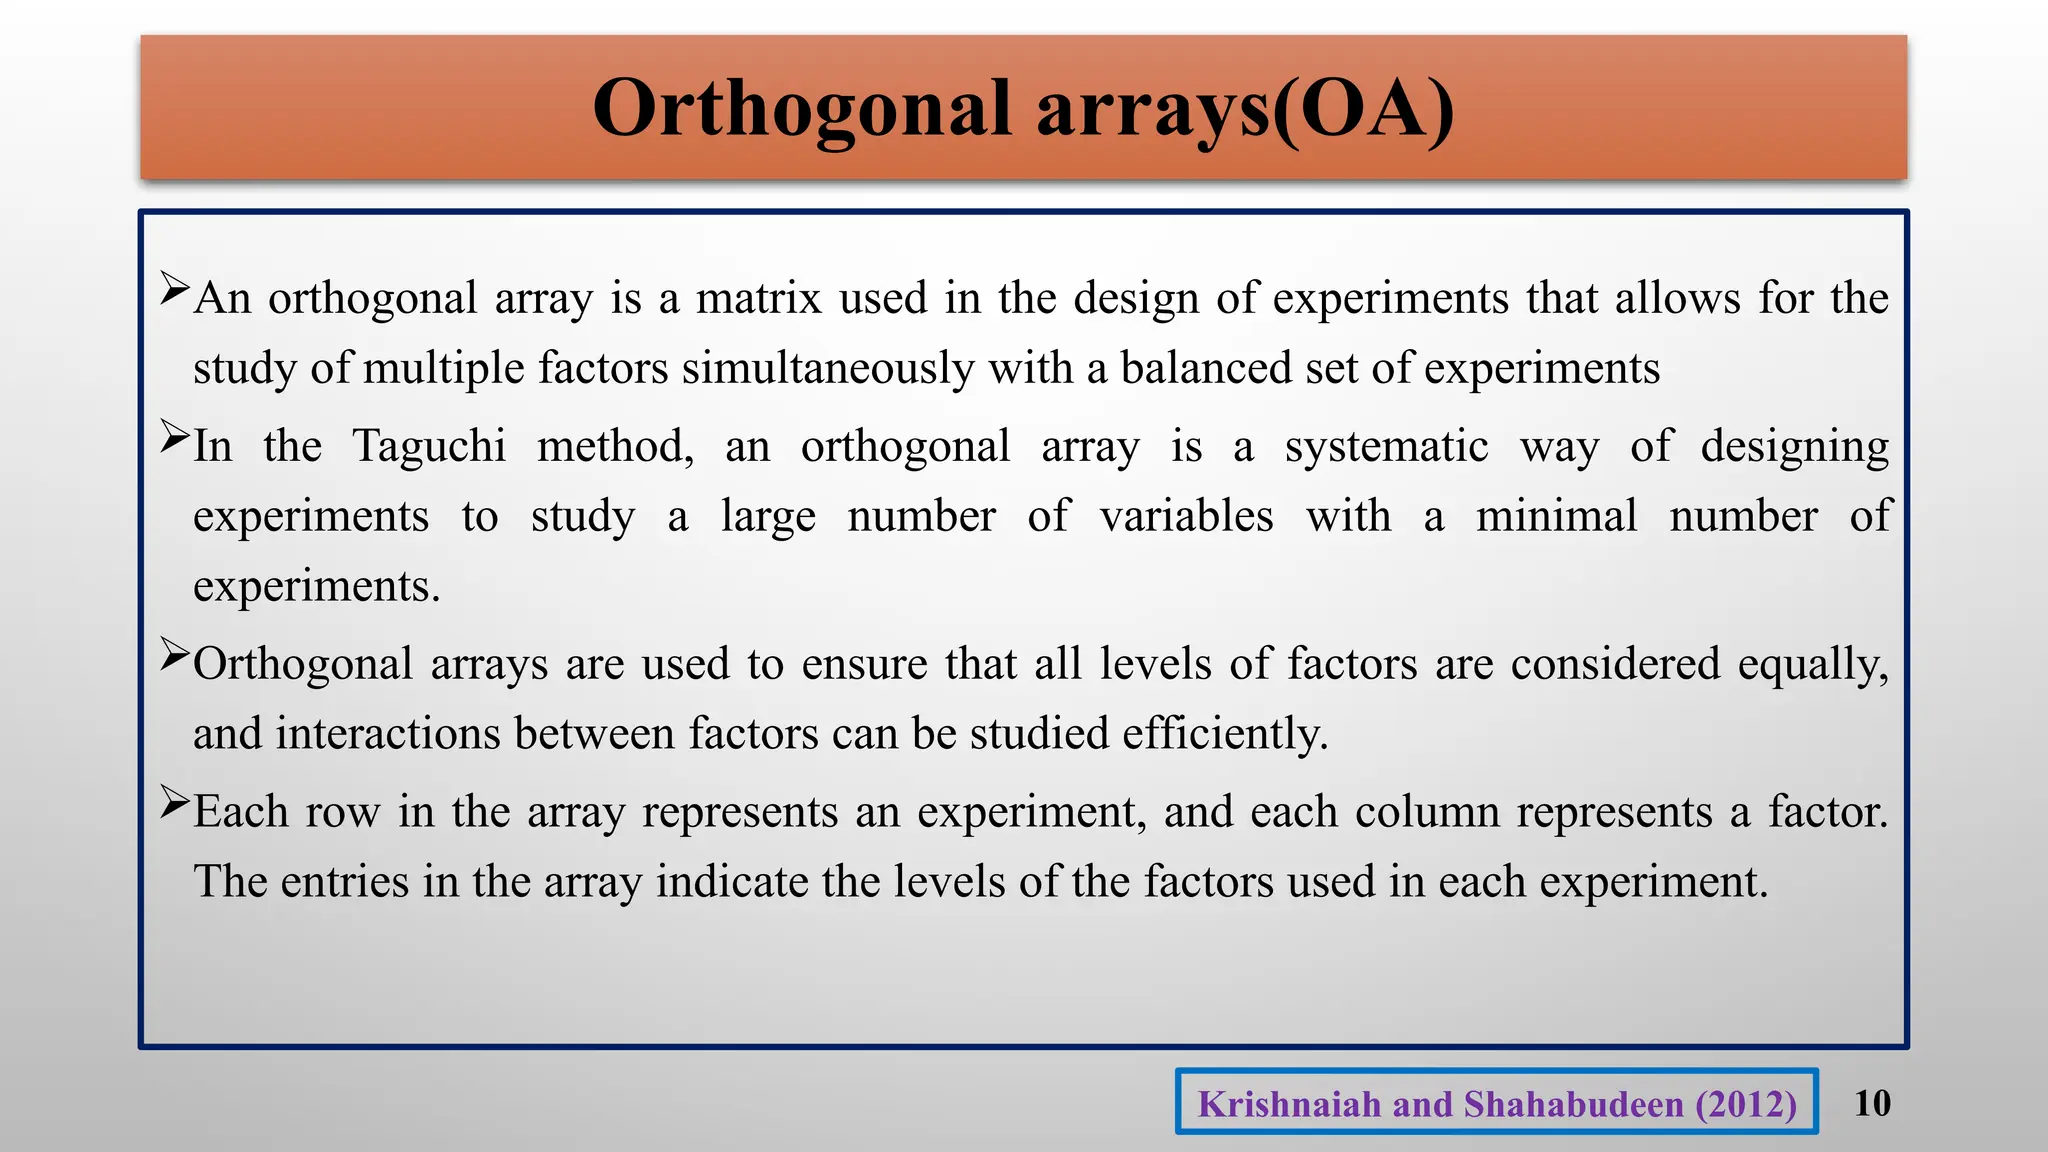
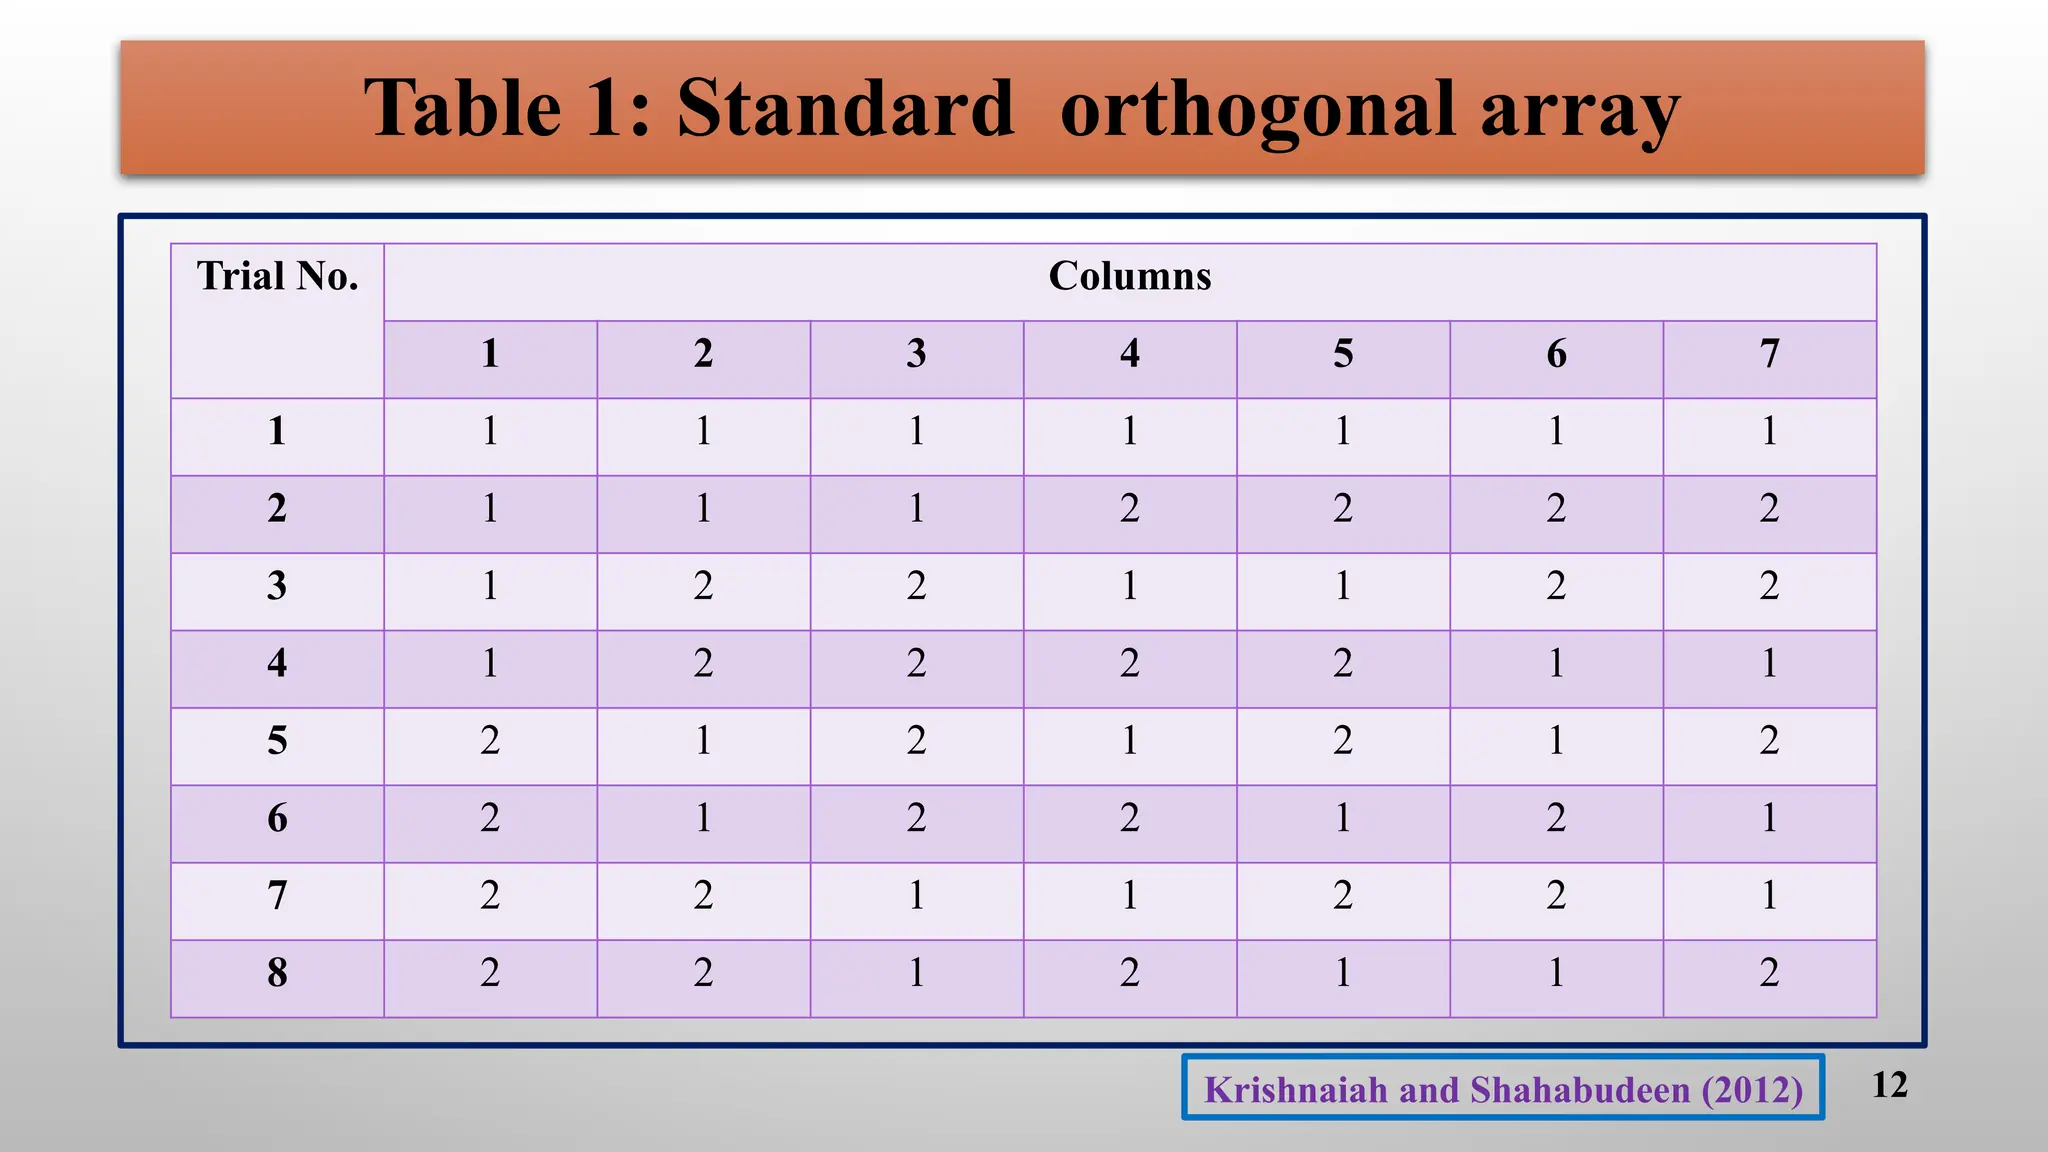
Orthogonal arrays(OA)
An orthogonalarray is a matrix used in the design of experiments that allows for the
study of multiple factors simultaneously with a balanced set of experiments
In the Taguchi method, an orthogonal array is a systematic way of designing
experiments to study a large number of variables with a minimal number of
experiments.
Orthogonal arrays are used to ensure that all levels of factors are considered equally,
and interactions between factors can be studied efficiently.
Each row in the array represents an experiment, and each column represents a factor.
The entries in the array indicate the levels of the factors used in each experiment.
10
Krishnaiah and Shahabudeen (2012)
11.
Contd…
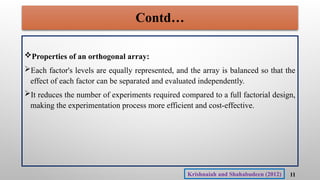
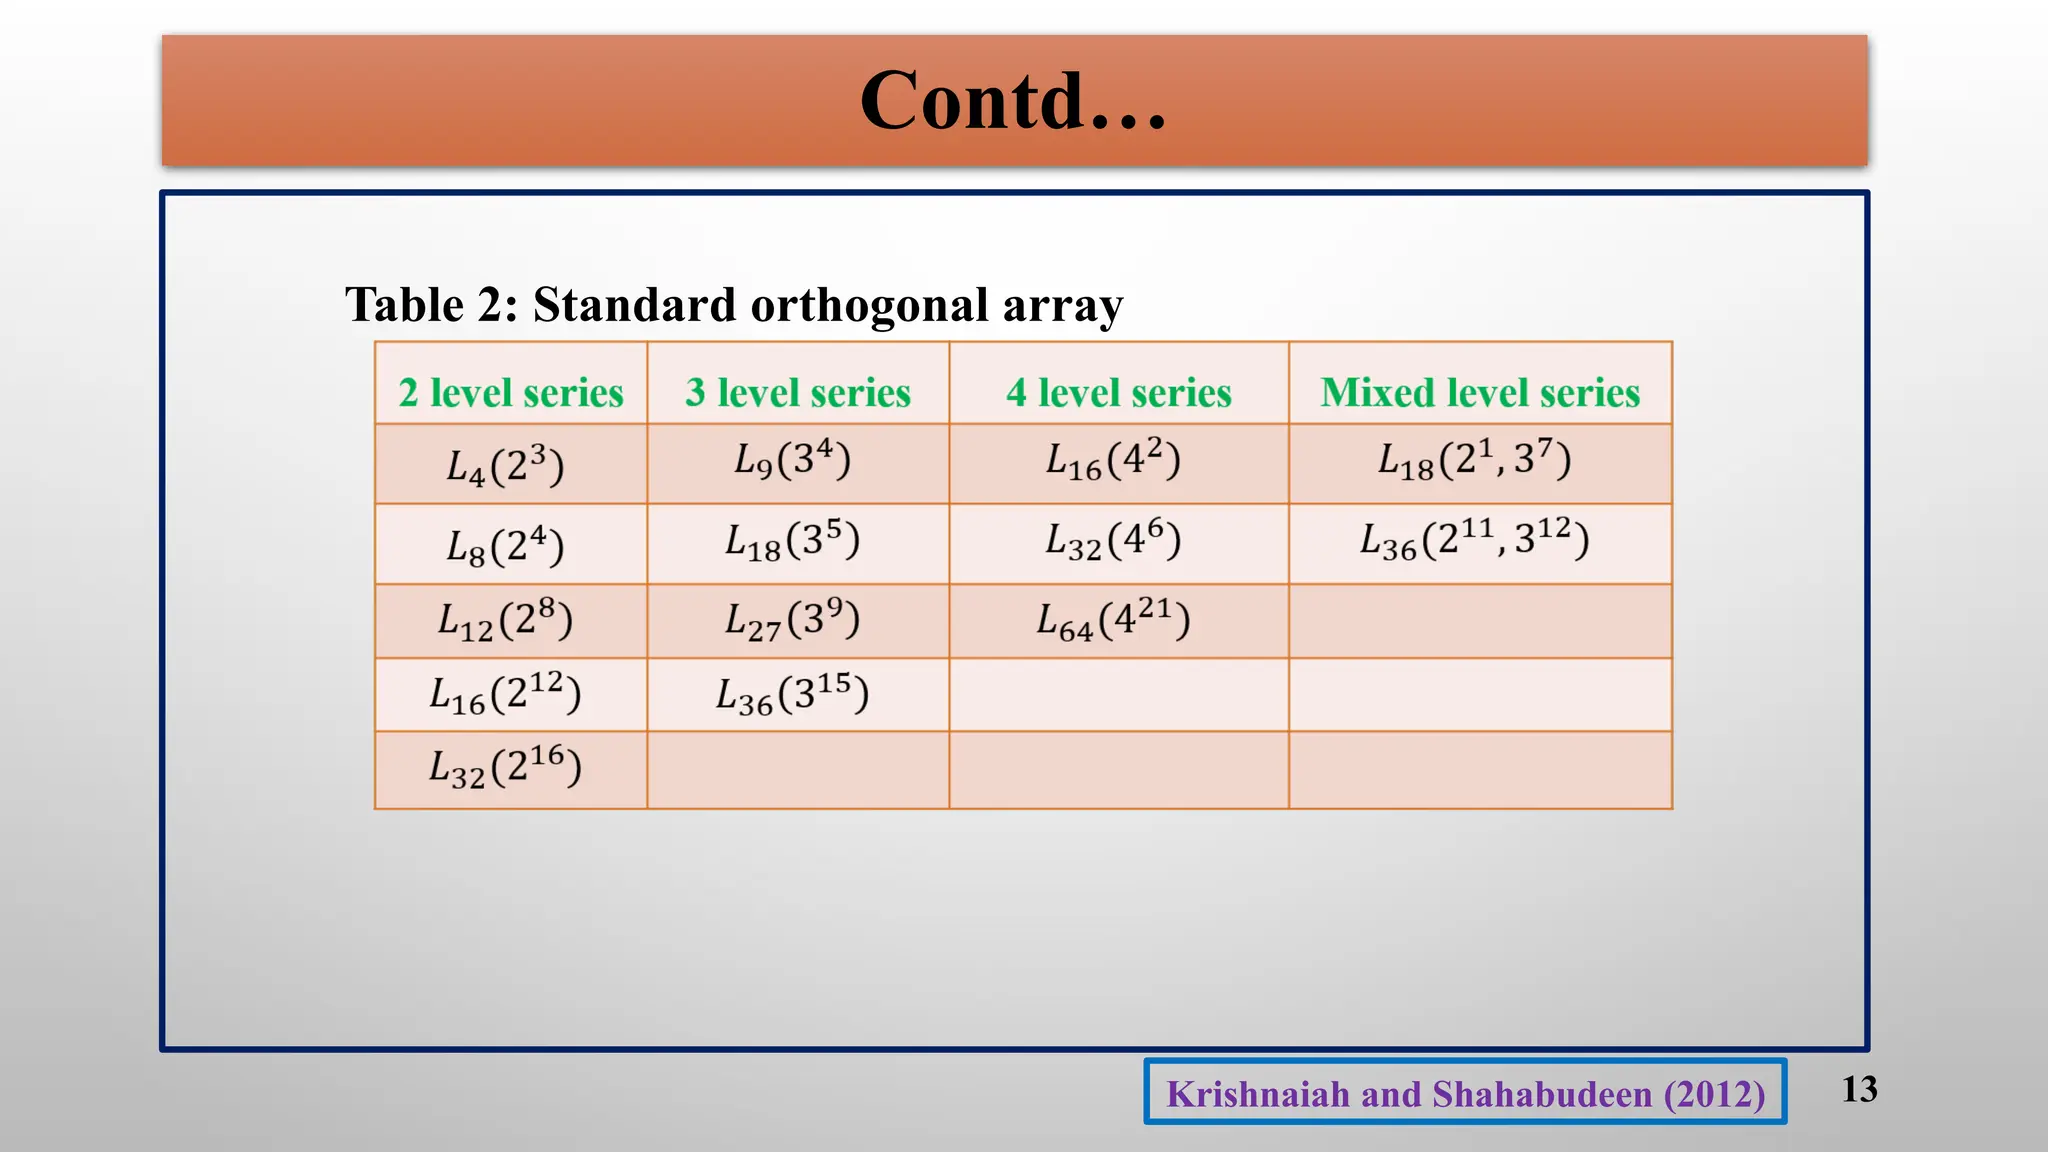
Properties of anorthogonal array:
Each factor's levels are equally represented, and the array is balanced so that the
effect of each factor can be separated and evaluated independently.
It reduces the number of experiments required compared to a full factorial design,
making the experimentation process more efficient and cost-effective.
11
Krishnaiah and Shahabudeen (2012)
Contd…
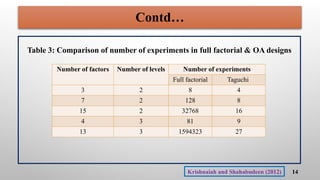
Table 3: Comparisonof number of experiments in full factorial & OA designs
Number of factors Number of levels Number of experiments
Full factorial Taguchi
3 2 8 4
7 2 128 8
15 2 32768 16
4 3 81 9
13 3 1594323 27
14
Krishnaiah and Shahabudeen (2012)
15.
Contd…
Taguchi method contains
1.System design,
2. Parameter design and
3. Tolerance design procedures to achieve a robust process and result for the
best product quality.
1. System design:
System design is the first step in the design of any product or process. This
design at the conceptual levels involves creation, exploration and presentation of
ideas.
15
Shyam and Rajeshwar (2012)
16.
Contd…
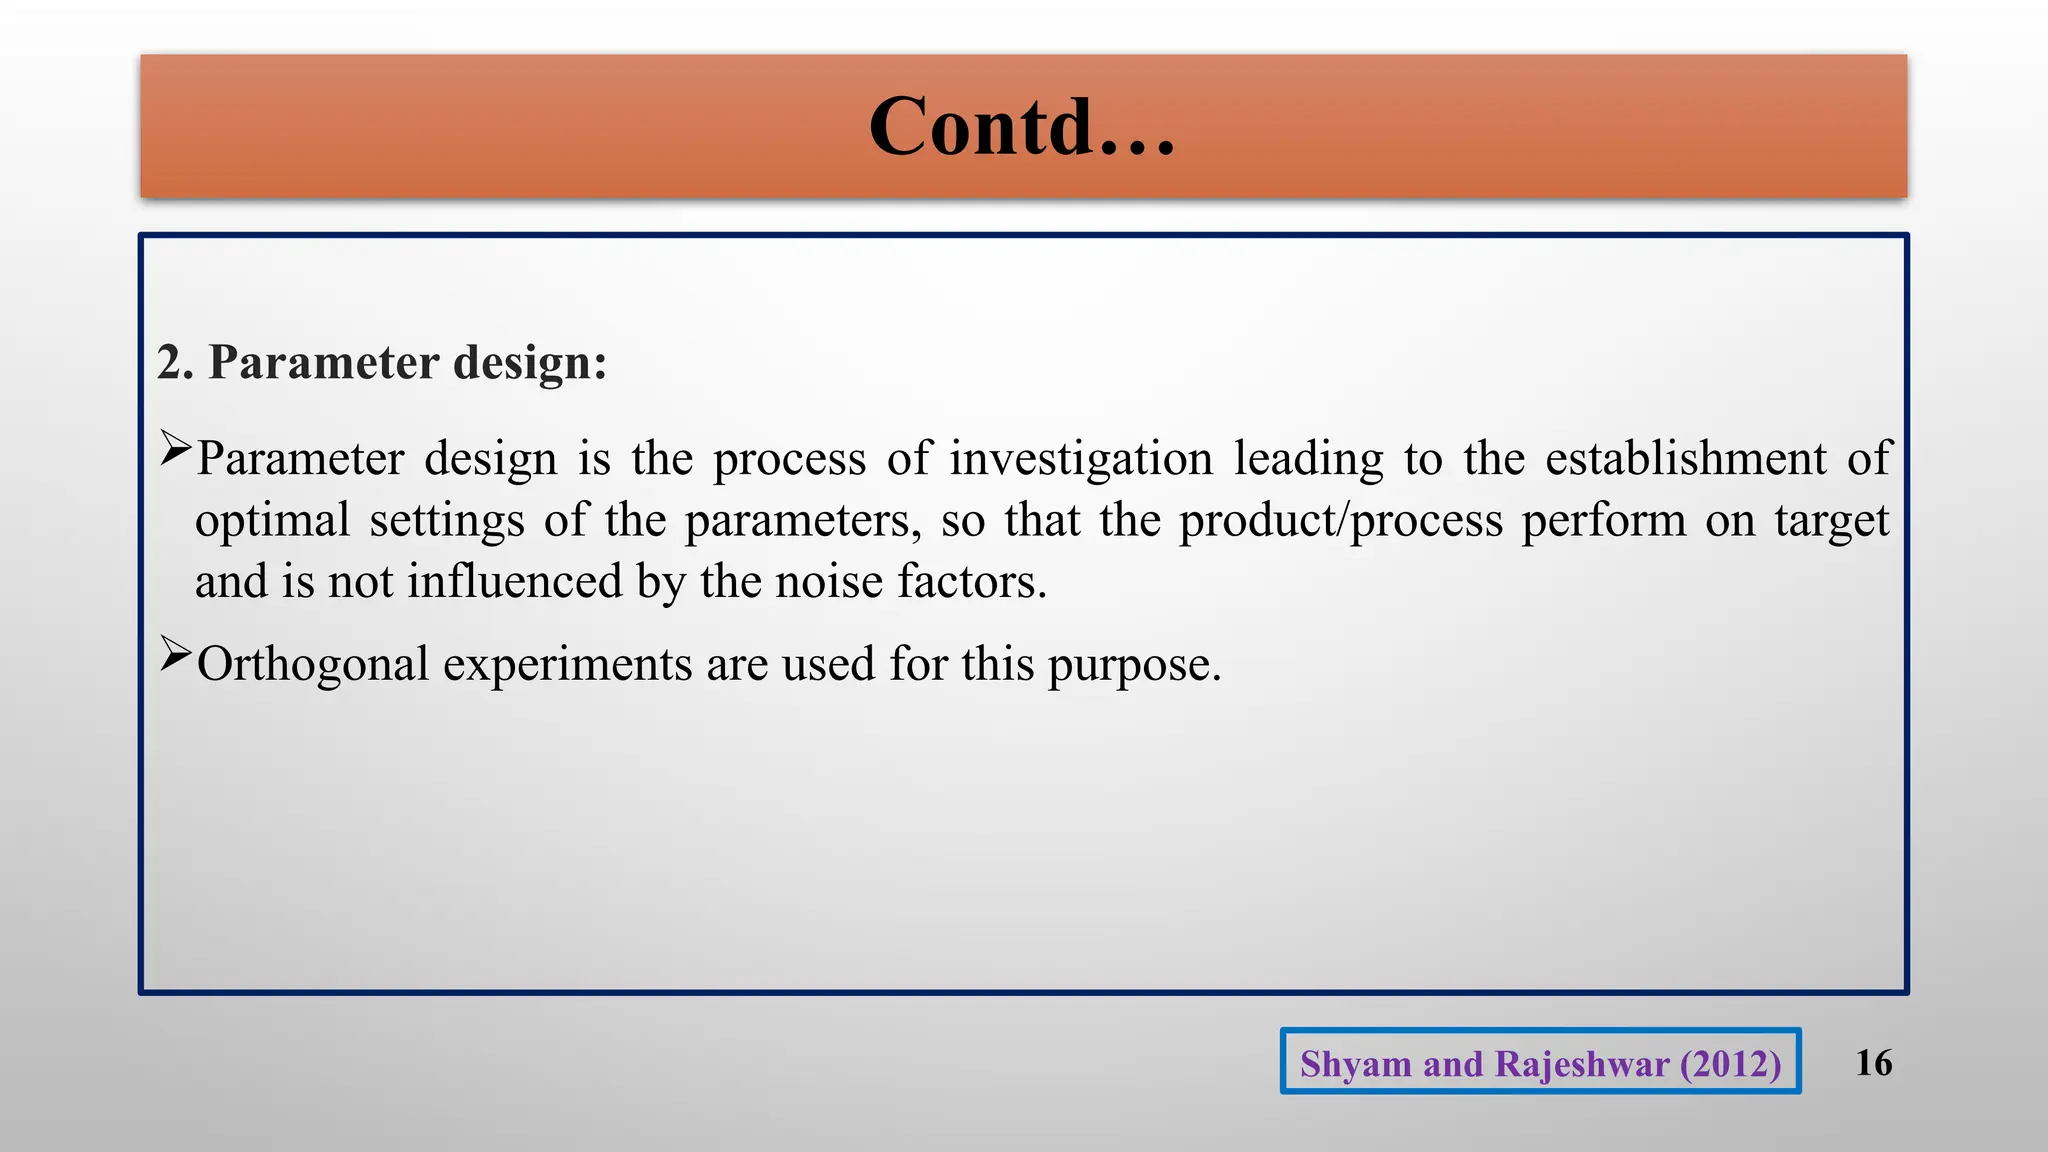
2. Parameter design:
Parameterdesign is the process of investigation leading to the establishment of
optimal settings of the parameters, so that the product/process perform on target
and is not influenced by the noise factors.
Orthogonal experiments are used for this purpose.
16
Shyam and Rajeshwar (2012)
17.
Contd…
3.Tolerance design:
Tolerance designis the process of determining the tolerances around the nominal
settings identified in parameter design process.
Tolerances should be set such that the performance of the product/process is on
target and at the same time they are achievable at minimum manufacturing cost.
The optimal tolerances should be developed in order to minimize the total costs of
manufacturing and quality.
17
Shyam and Rajeshwar (2012)
18.
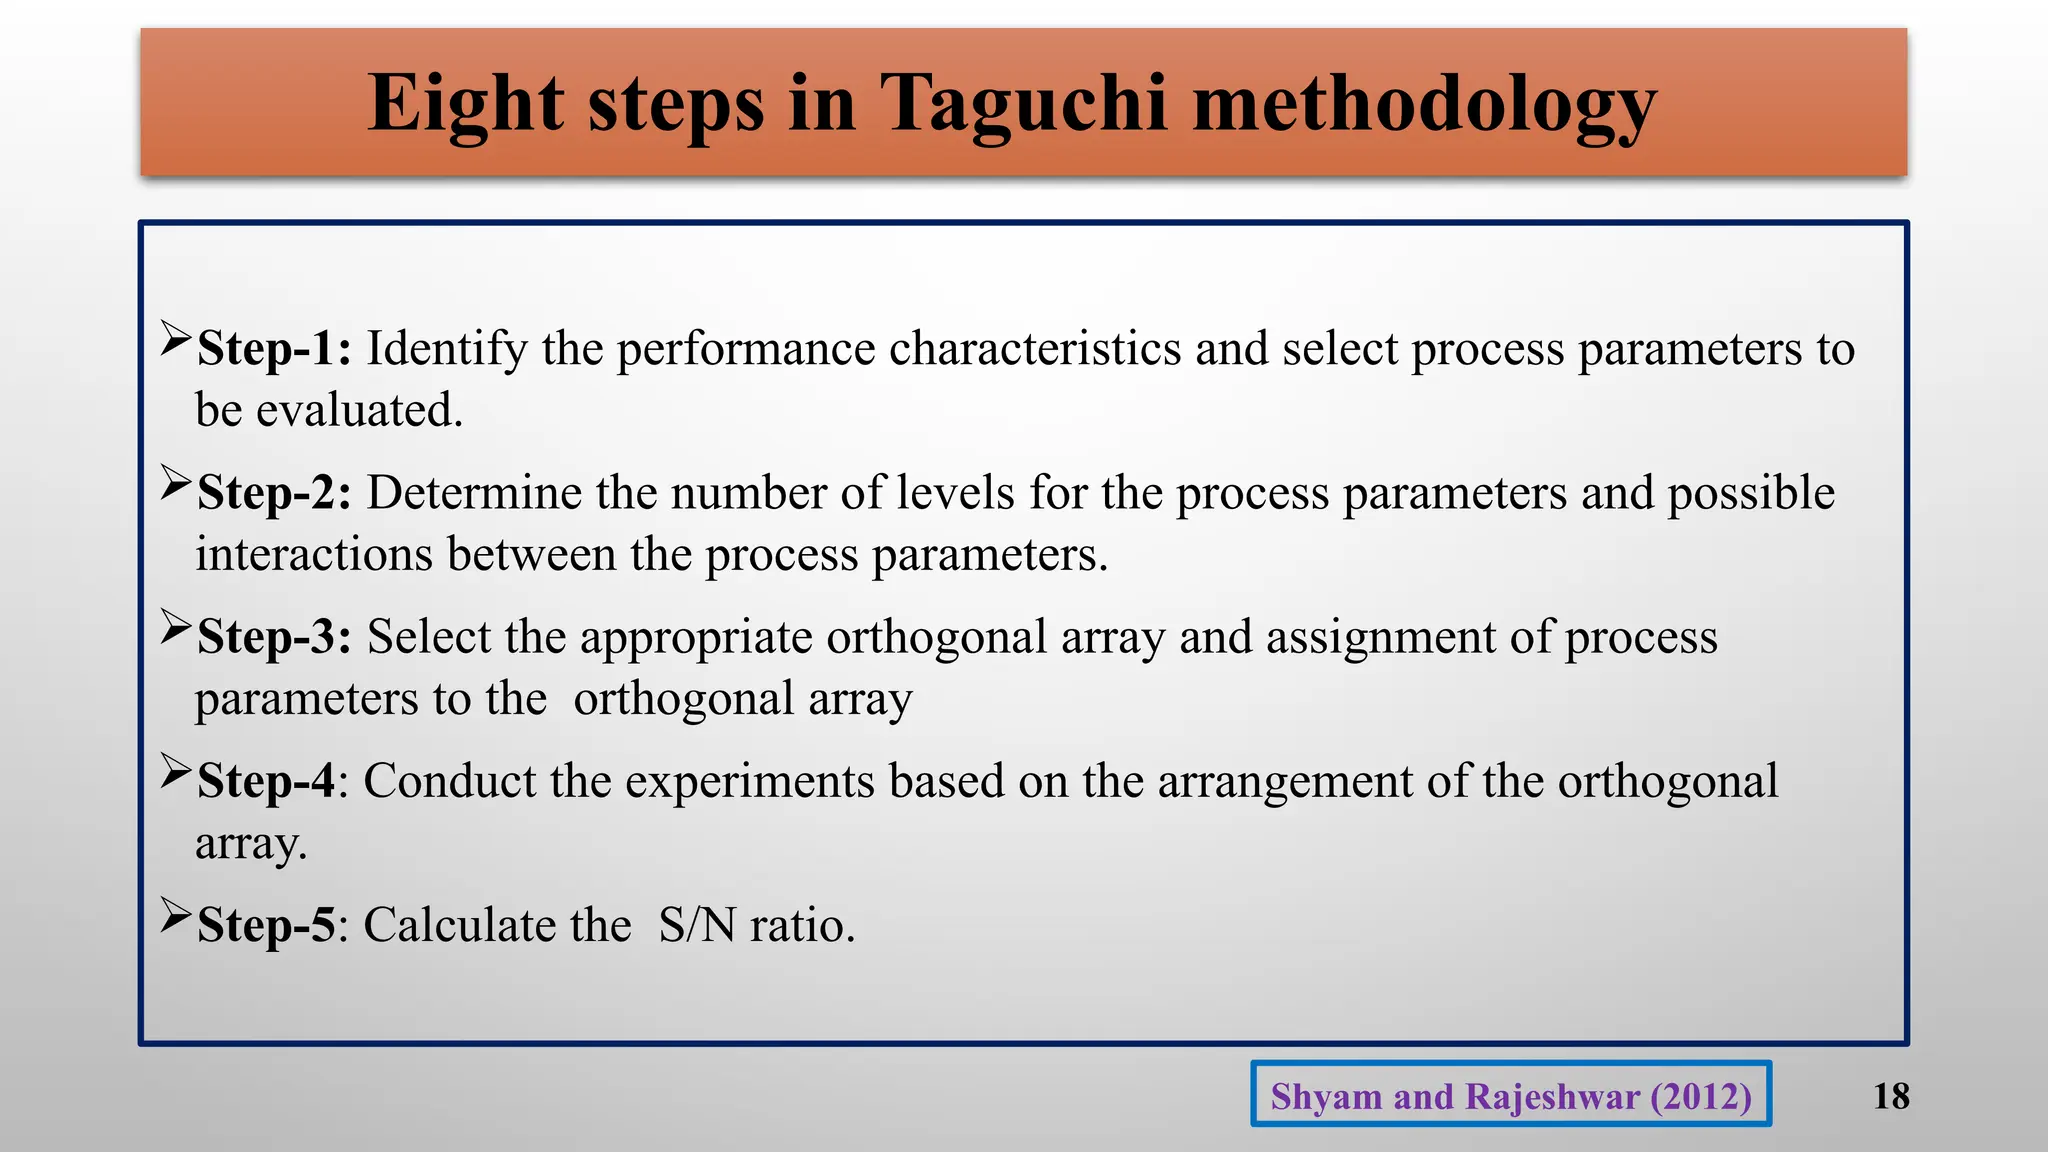
Eight steps inTaguchi methodology
Step-1: Identify the performance characteristics and select process parameters to
be evaluated.
Step-2: Determine the number of levels for the process parameters and possible
interactions between the process parameters.
Step-3: Select the appropriate orthogonal array and assignment of process
parameters to the orthogonal array
Step-4: Conduct the experiments based on the arrangement of the orthogonal
array.
Step-5: Calculate the S/N ratio.
18
Shyam and Rajeshwar (2012)
19.
19
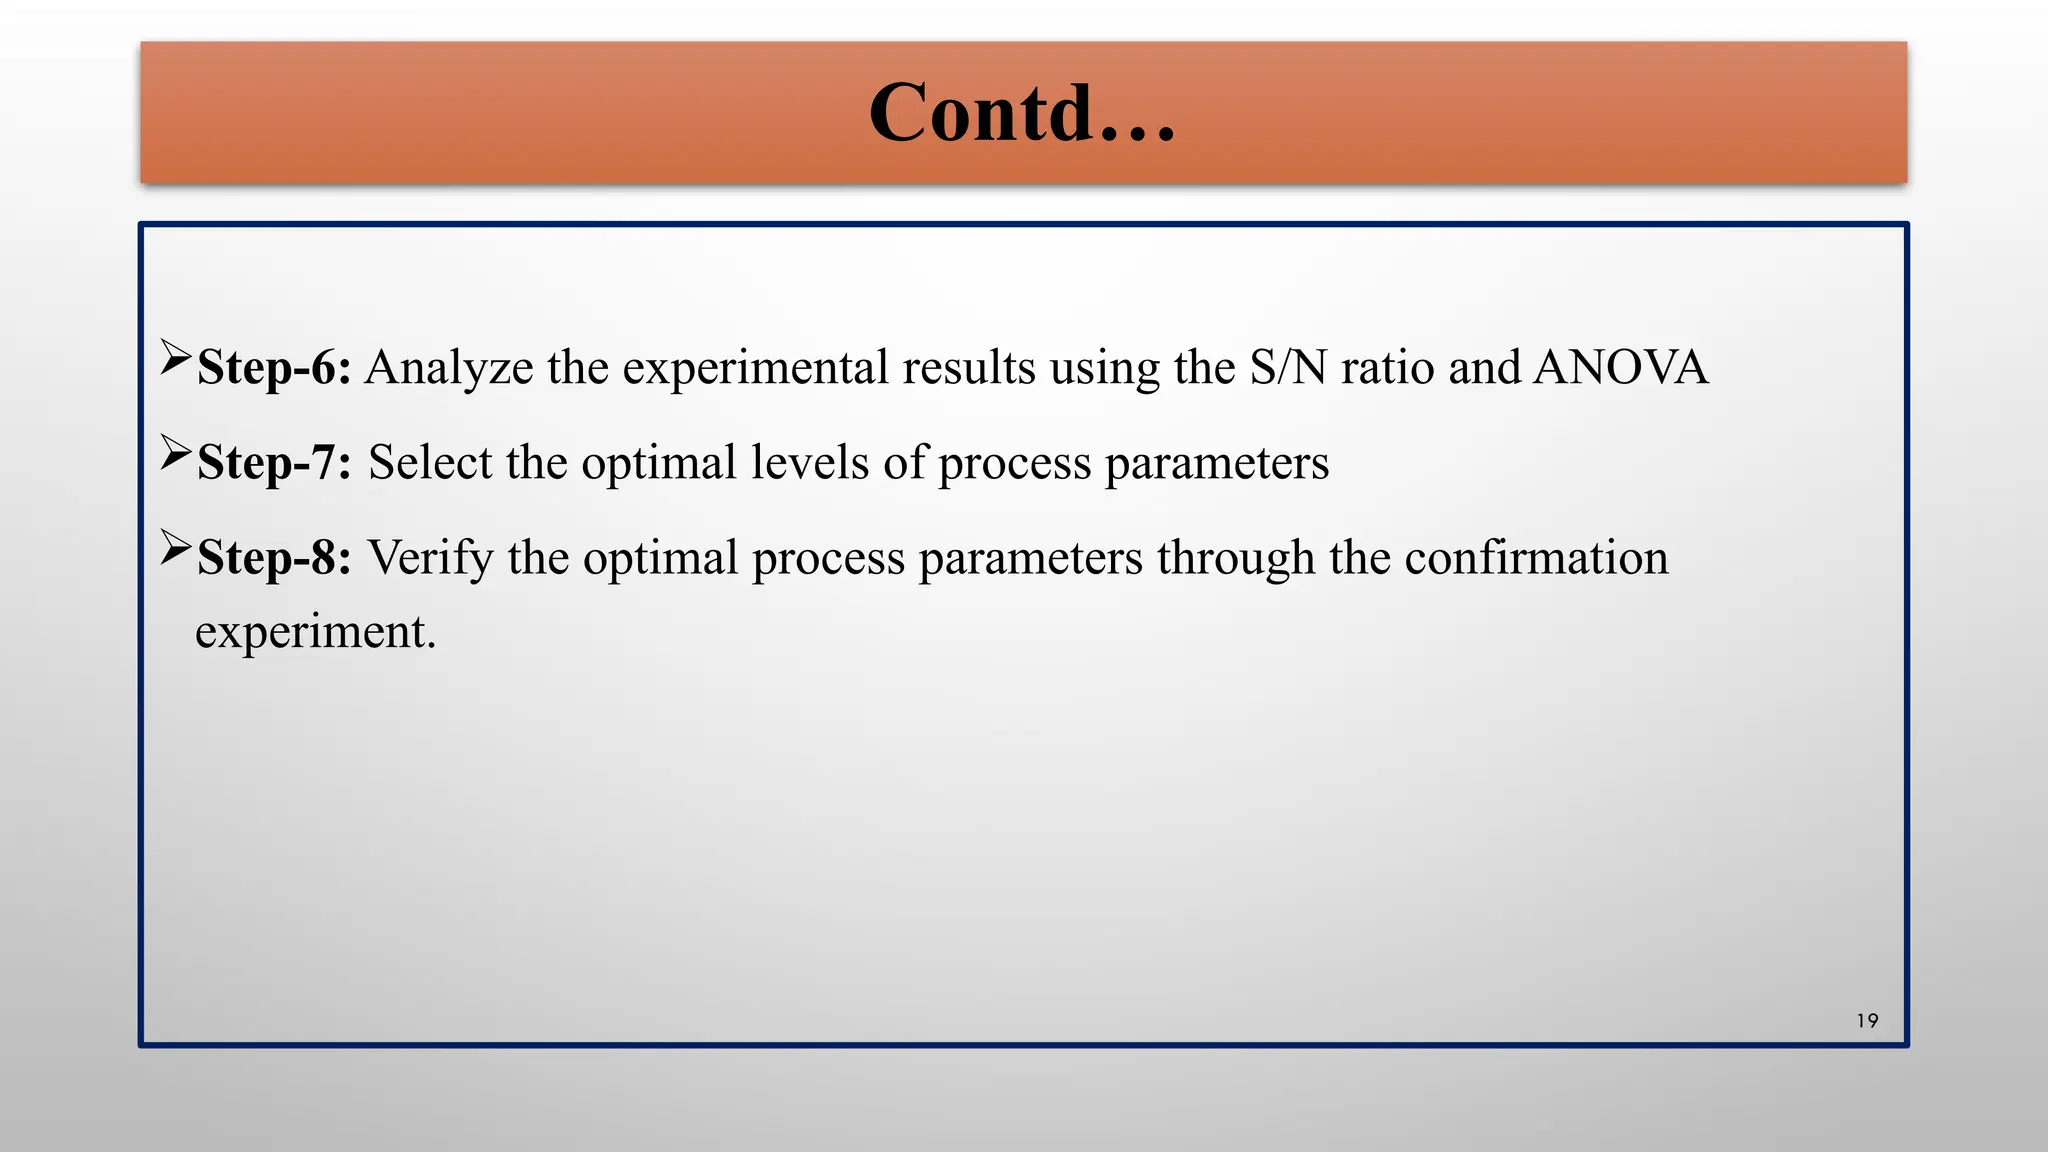
Step-6: Analyze theexperimental results using the S/N ratio and ANOVA
Step-7: Select the optimal levels of process parameters
Step-8: Verify the optimal process parameters through the confirmation
experiment.
Contd…
20.
Methodology used inTaguchi method
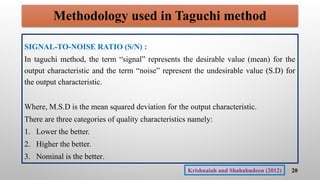
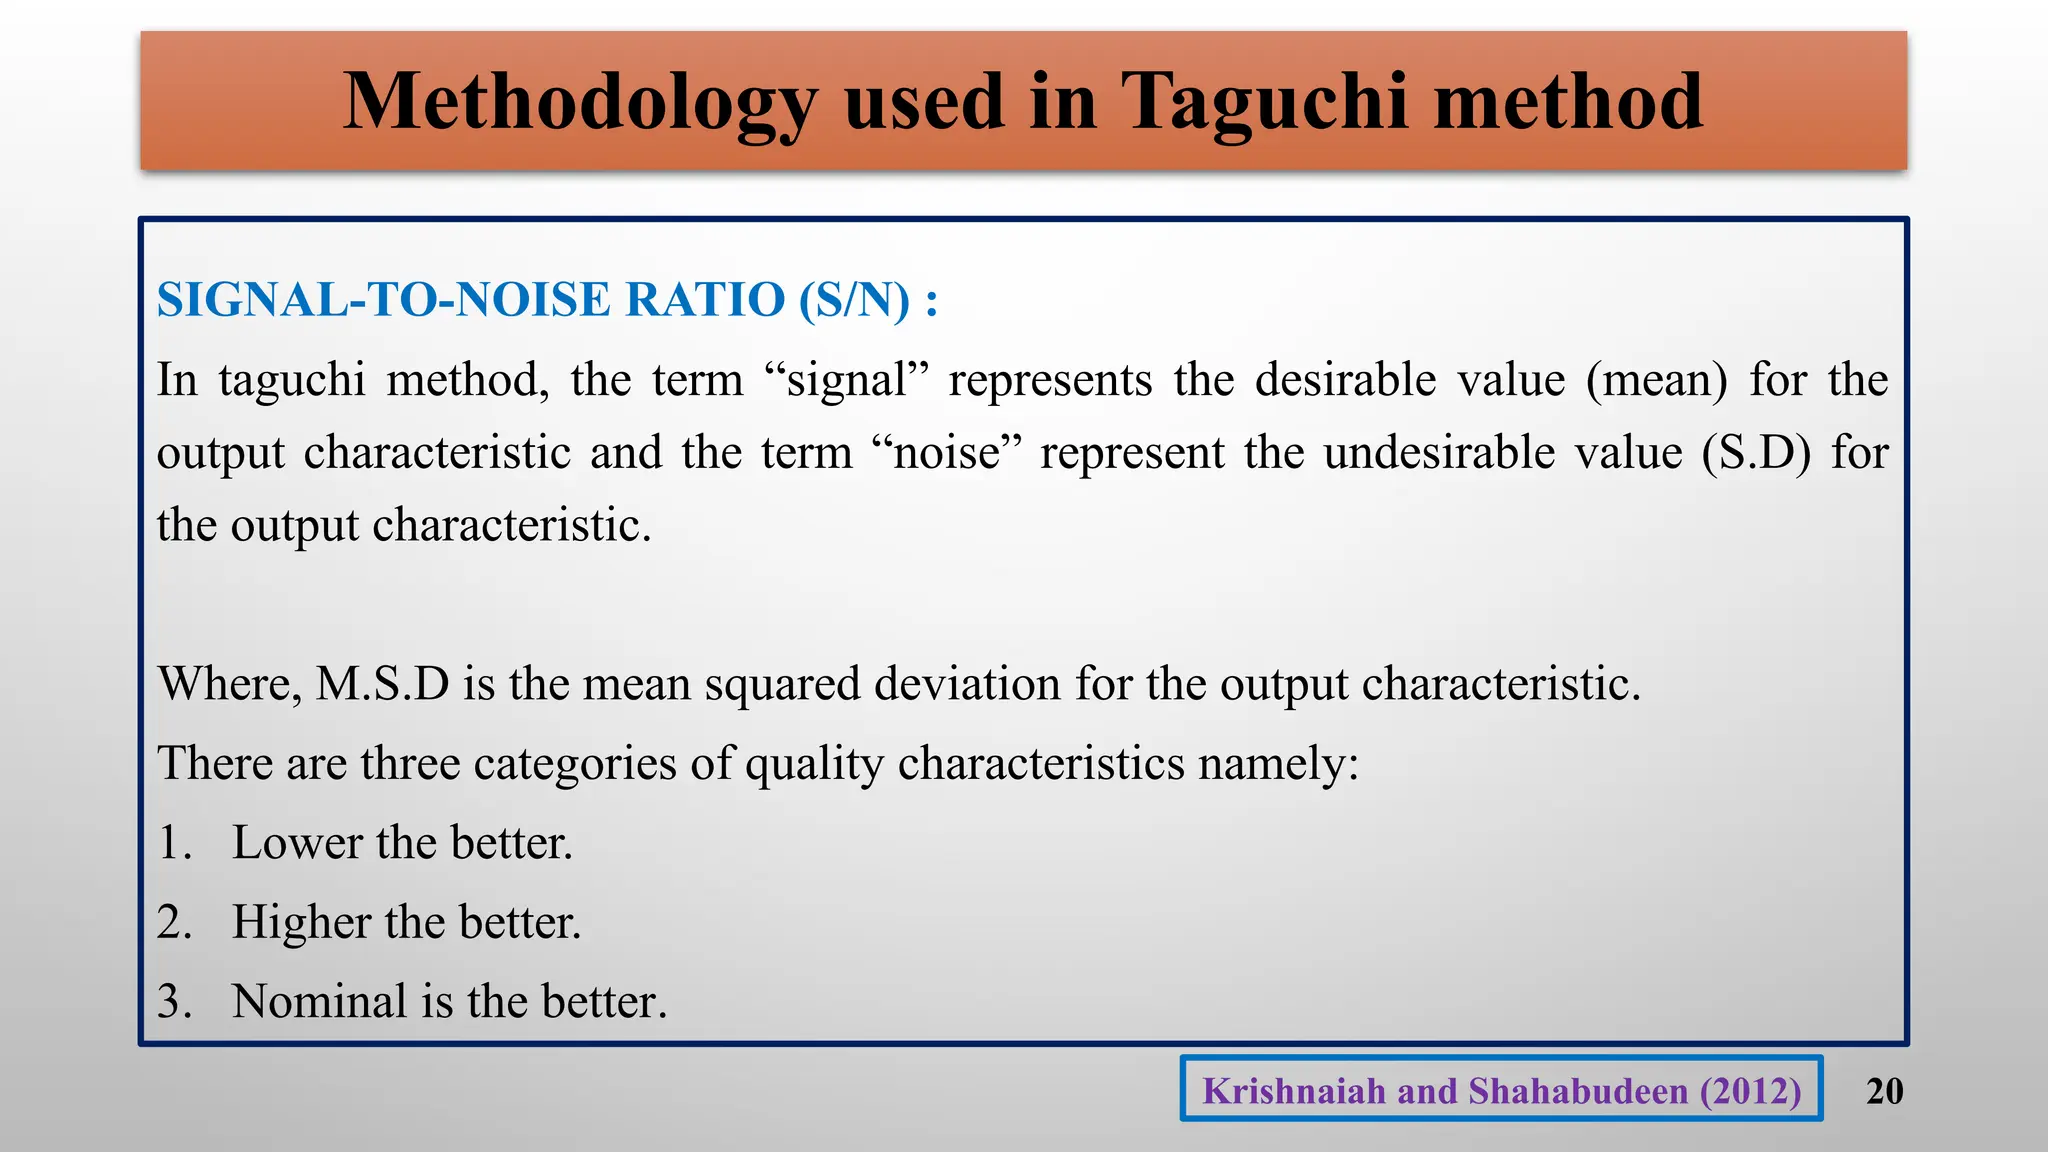
SIGNAL-TO-NOISE RATIO (S/N) :
In taguchi method, the term “signal” represents the desirable value (mean) for the
output characteristic and the term “noise” represent the undesirable value (S.D) for
the output characteristic.
Where, M.S.D is the mean squared deviation for the output characteristic.
There are three categories of quality characteristics namely:
1. Lower the better.
2. Higher the better.
3. Nominal is the better.
20
Krishnaiah and Shahabudeen (2012)
21.
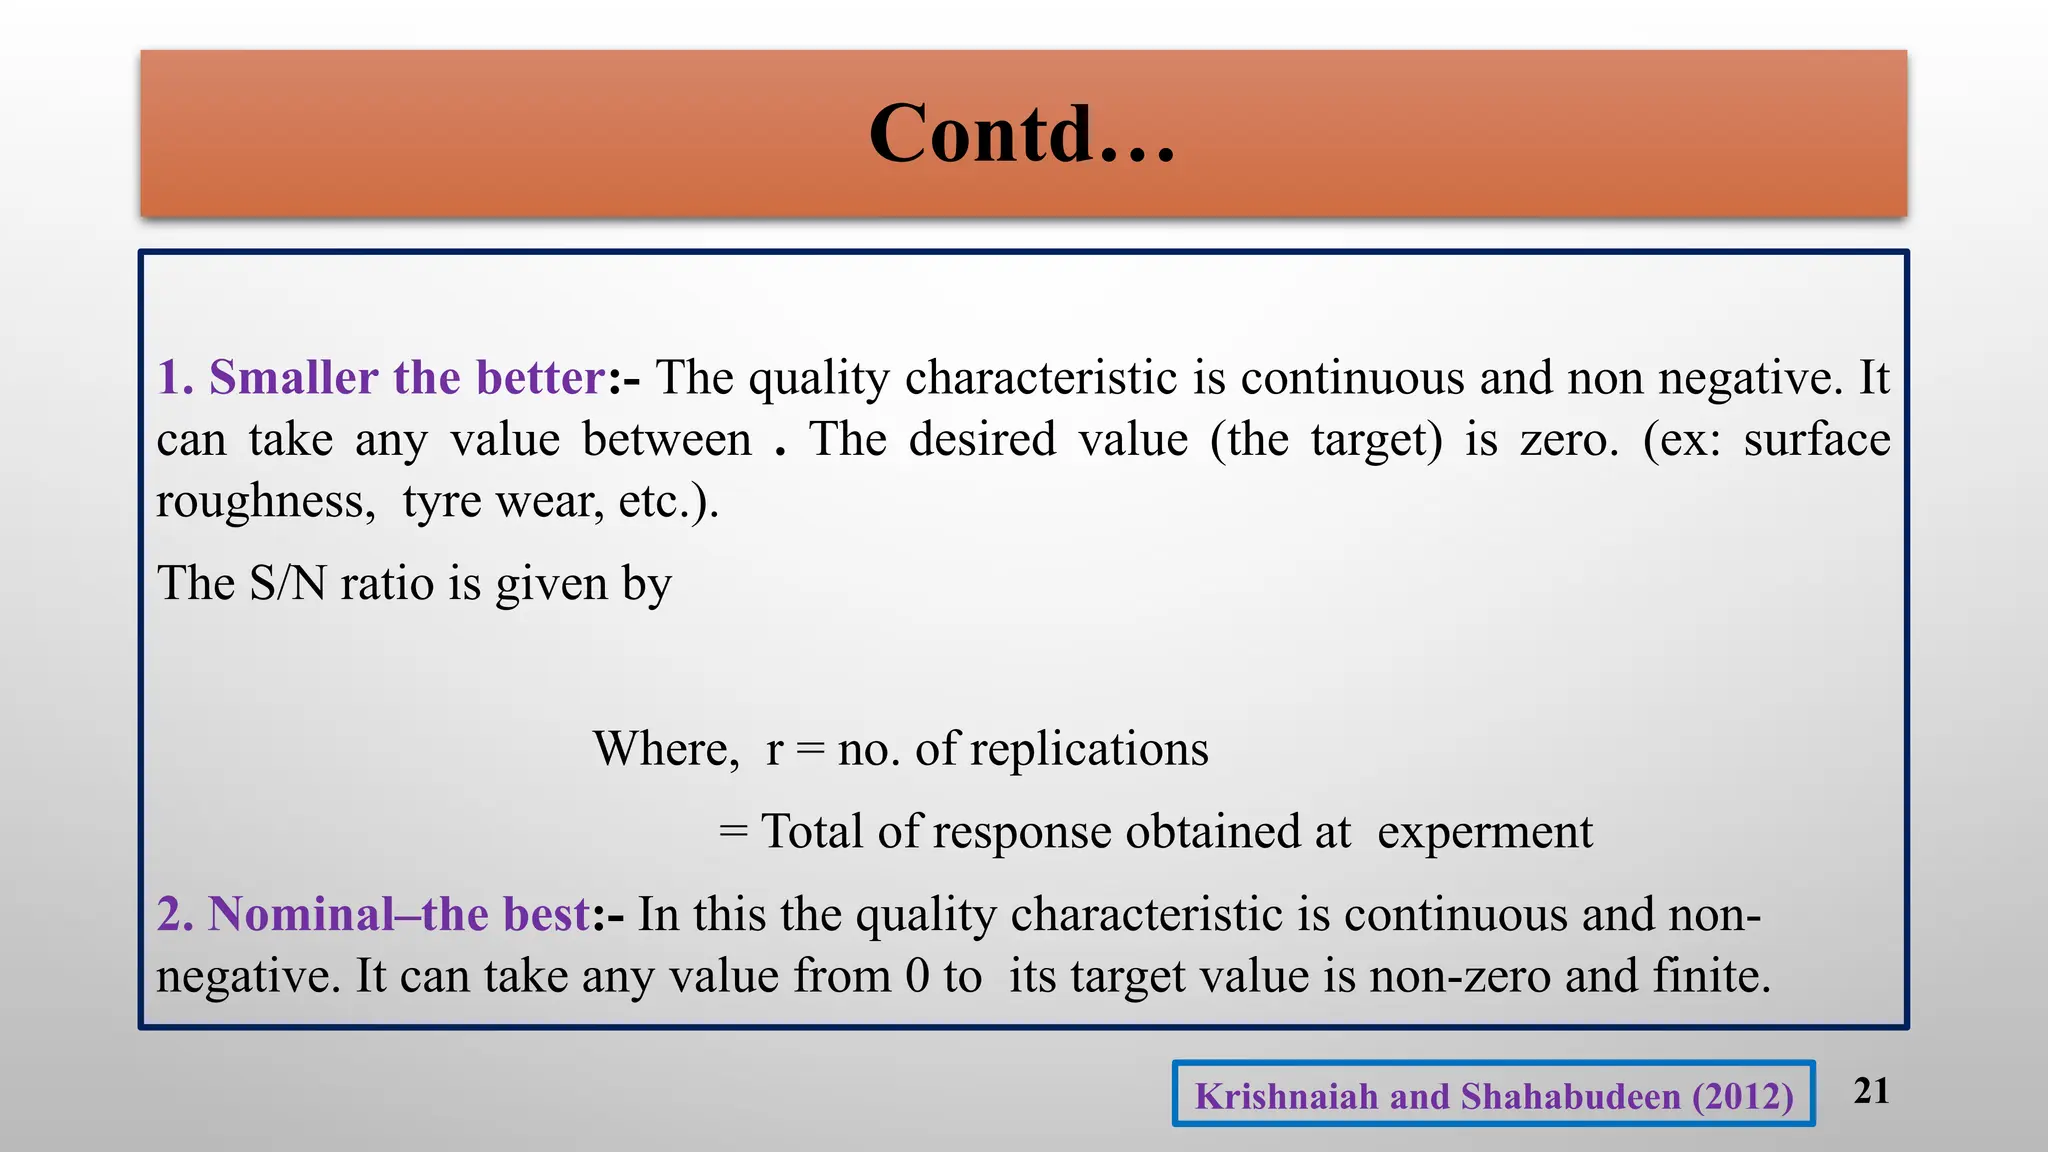
Contd…
1. Smaller thebetter:- The quality characteristic is continuous and non negative. It
can take any value between . The desired value (the target) is zero. (ex: surface
roughness, tyre wear, etc.).
The S/N ratio is given by
Where, r = no. of replications
= Total of response obtained at experment
2. Nominal–the best:- In this the quality characteristic is continuous and non-
negative. It can take any value from 0 to its target value is non-zero and finite.
21
Krishnaiah and Shahabudeen (2012)
22.
Contd…
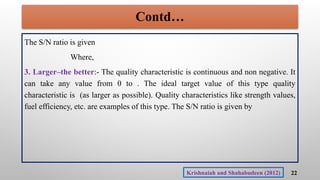
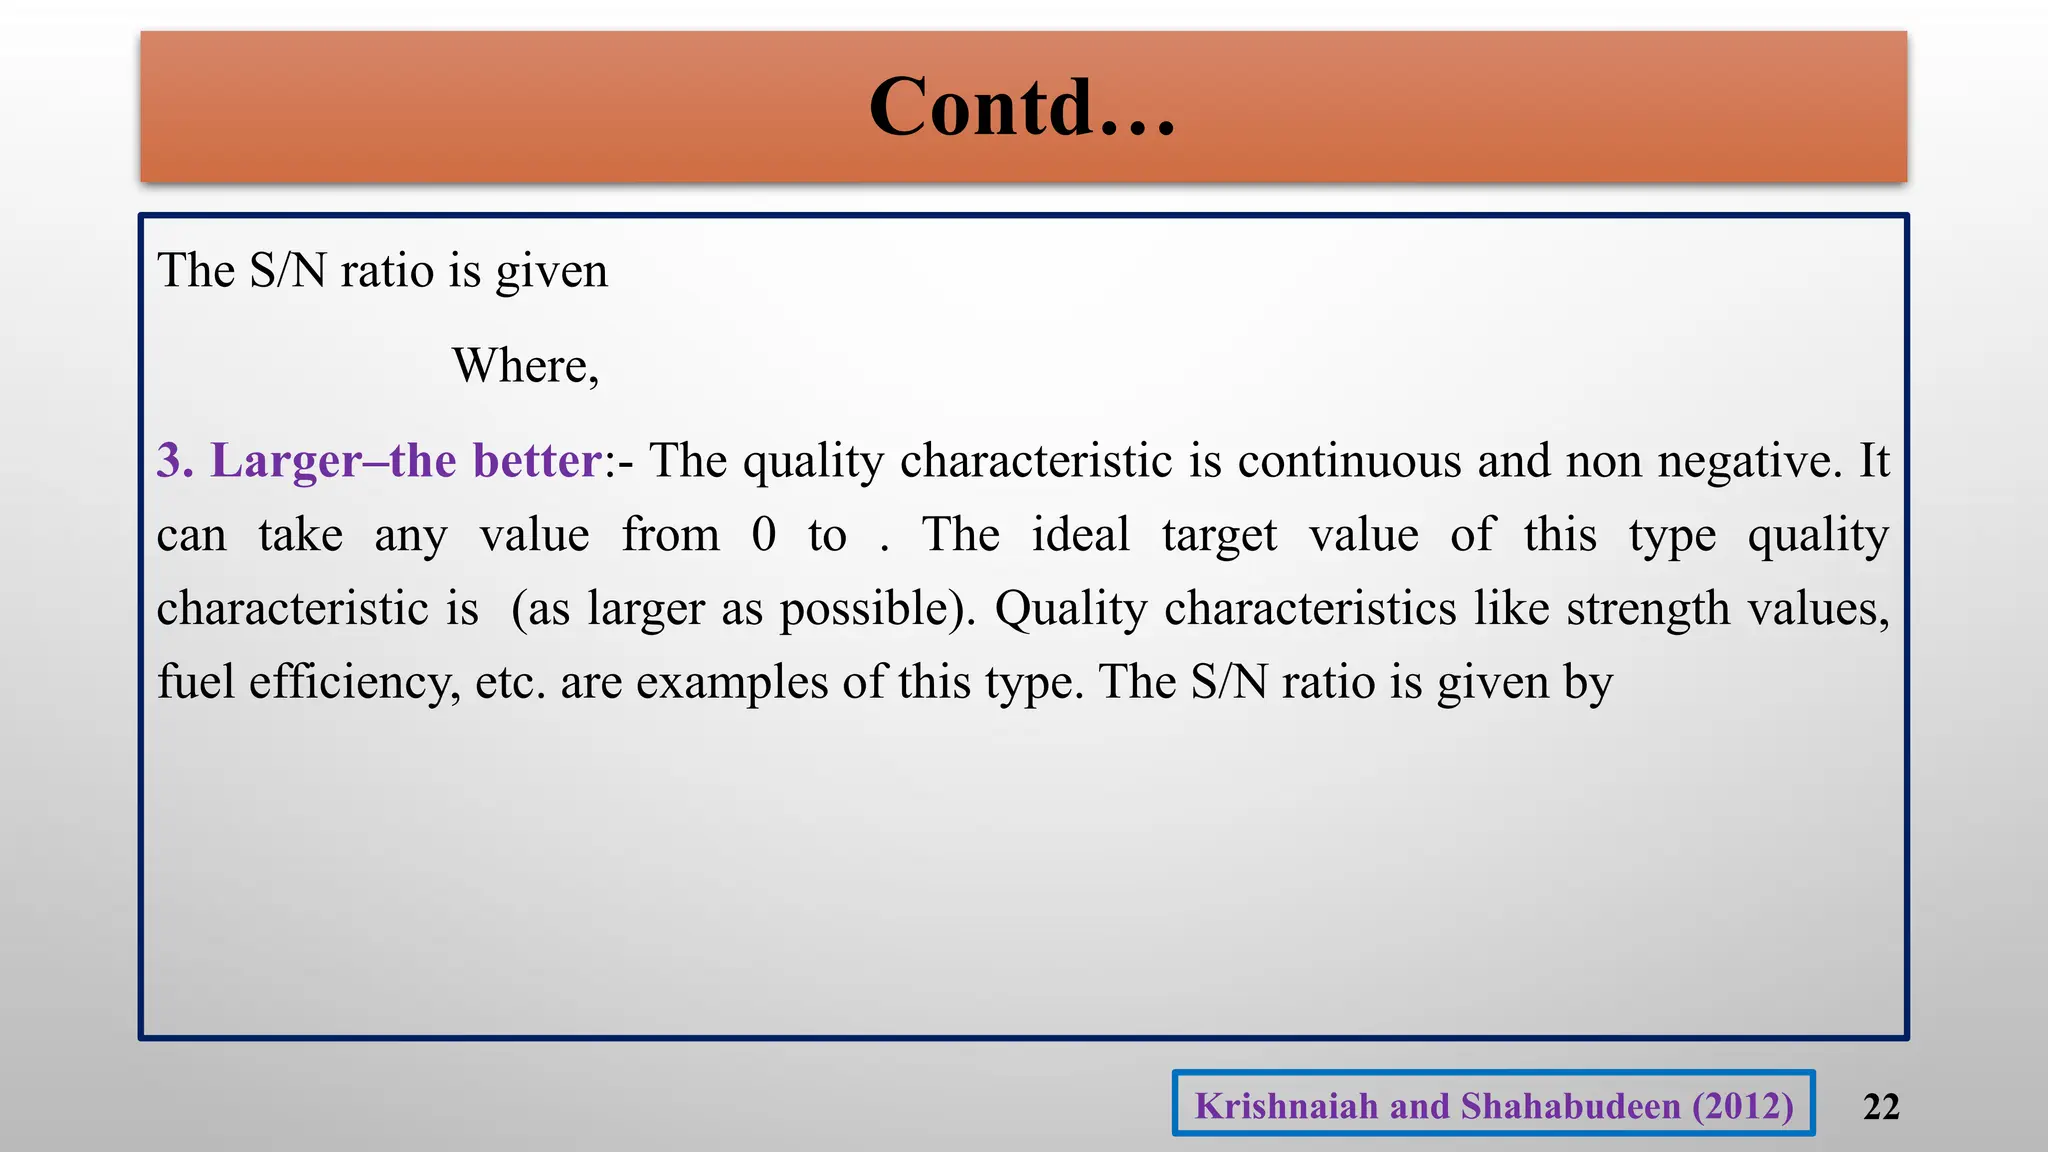
The S/N ratiois given
Where,
3. Larger–the better:- The quality characteristic is continuous and non negative. It
can take any value from 0 to . The ideal target value of this type quality
characteristic is (as larger as possible). Quality characteristics like strength values,
fuel efficiency, etc. are examples of this type. The S/N ratio is given by
22
Krishnaiah and Shahabudeen (2012)
23.
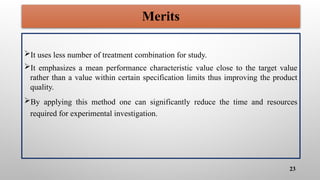
Merits
It uses lessnumber of treatment combination for study.
It emphasizes a mean performance characteristic value close to the target value
rather than a value within certain specification limits thus improving the product
quality.
By applying this method one can significantly reduce the time and resources
required for experimental investigation.
23
24.
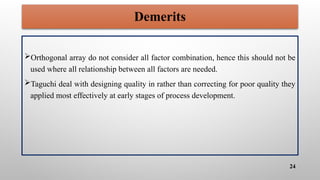
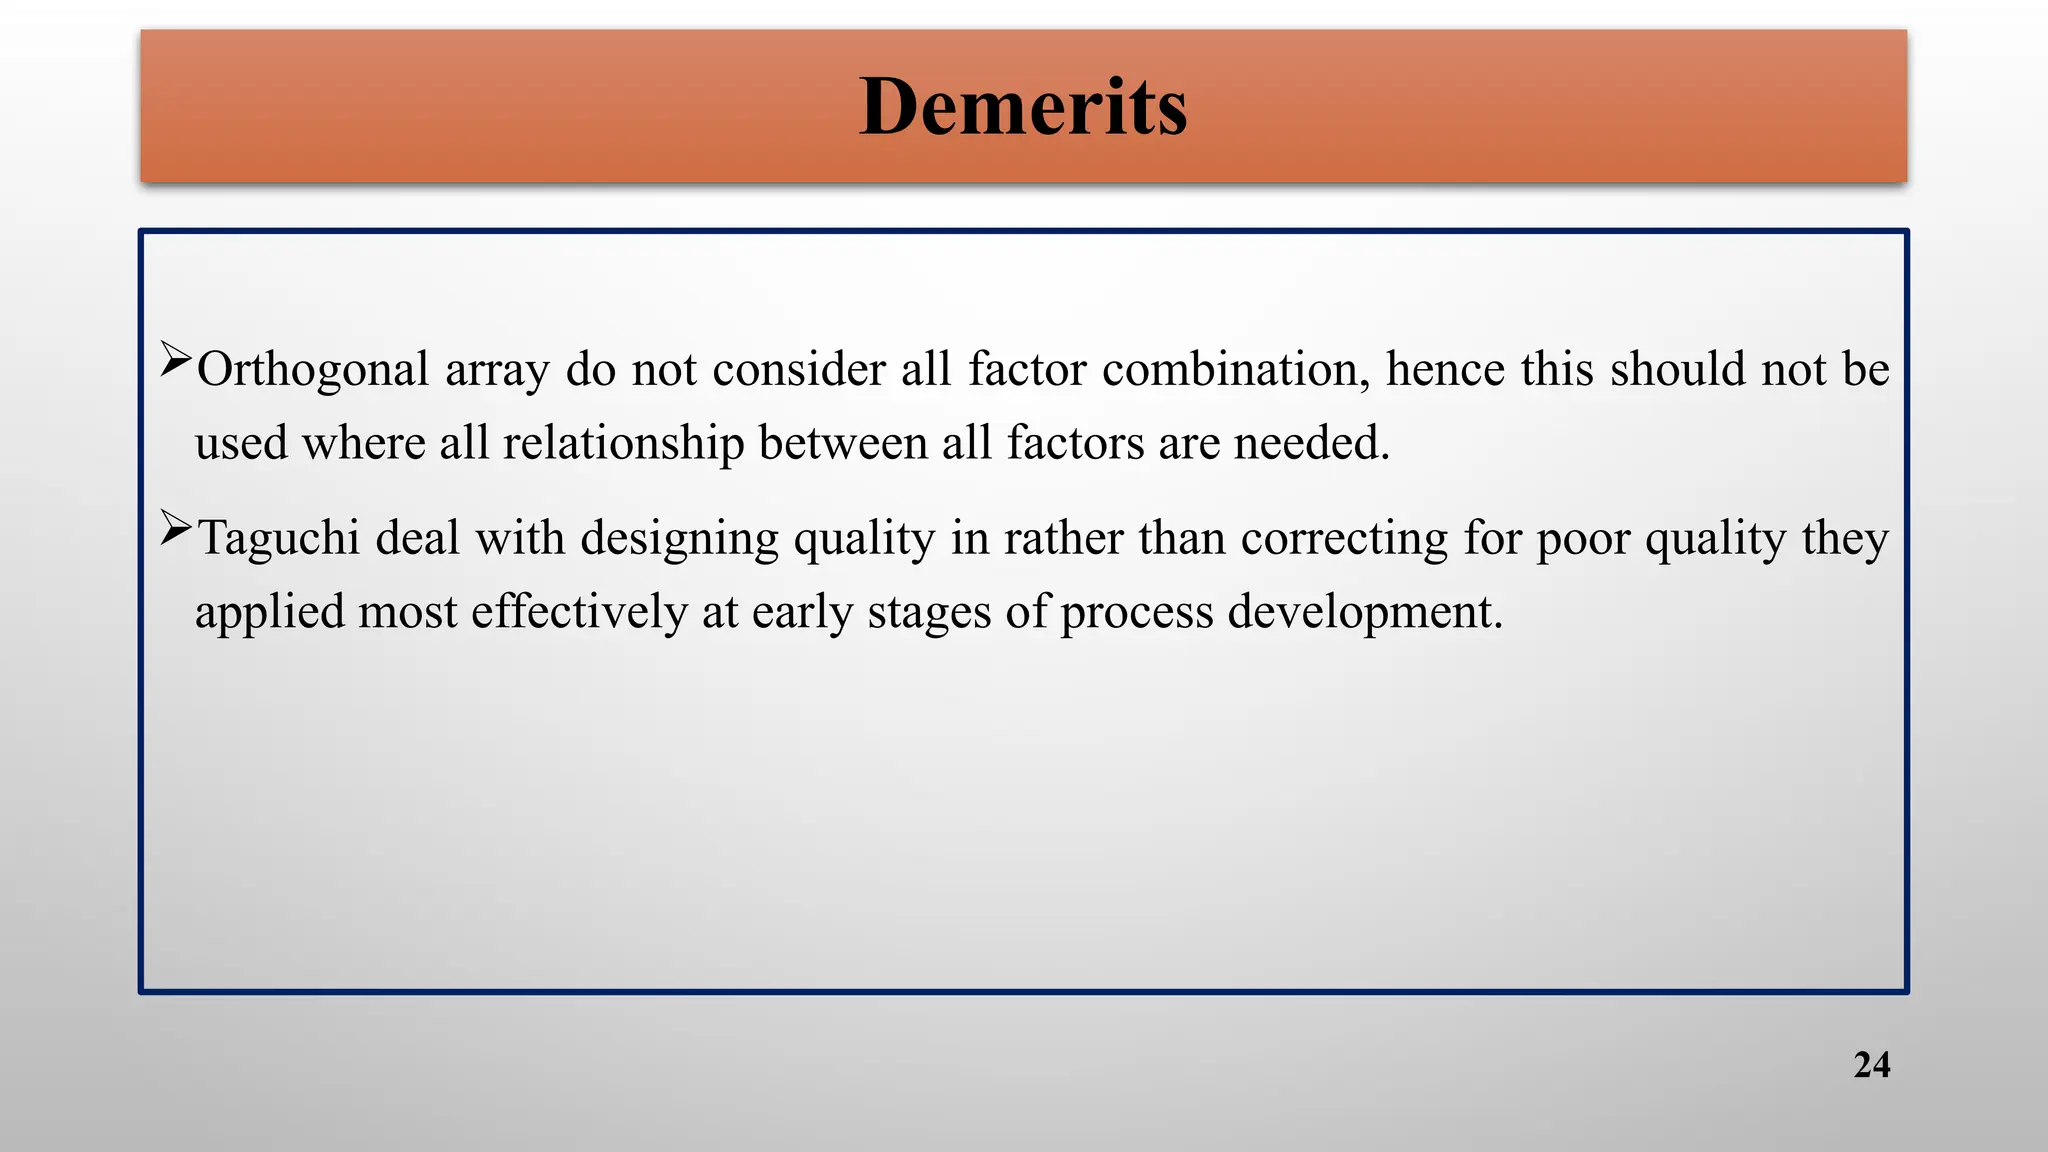
Demerits
Orthogonal array donot consider all factor combination, hence this should not be
used where all relationship between all factors are needed.
Taguchi deal with designing quality in rather than correcting for poor quality they
applied most effectively at early stages of process development.
24
25.
Applications
Manufacturing processes:
Taguchi methodsare widely used in manufacturing industries to optimize
production processes, reduce defects, and improve product quality.
Chemical and pharmaceutical industries:
Taguchi methods are employed in optimizing chemical processes and
pharmaceutical manufacturing to enhance efficiency, reduce waste, and ensure
product quality.
25
26.
Contd…
Agriculture:
Crop yield optimization:Taguchi method used to optimize factors affecting
crop yield, such as planting density, irrigation levels, fertilizer application, and
other environmental conditions. By systematically studying the impact of these
factors, agricultural practices can be adjusted to maximize productivity.
Crop quality improvement: Taguchi methods can be applied to optimize
factors influencing the quality of crops, including nutrient levels, soil
composition, and harvesting techniques. This can lead to improvements in crop
taste, appearance, and nutritional content.
26
27.
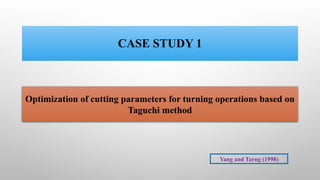
CASE STUDY 1
Optimizationof cutting parameters for turning operations based on
Taguchi method
Yang and Tarng (1998)
28.
28
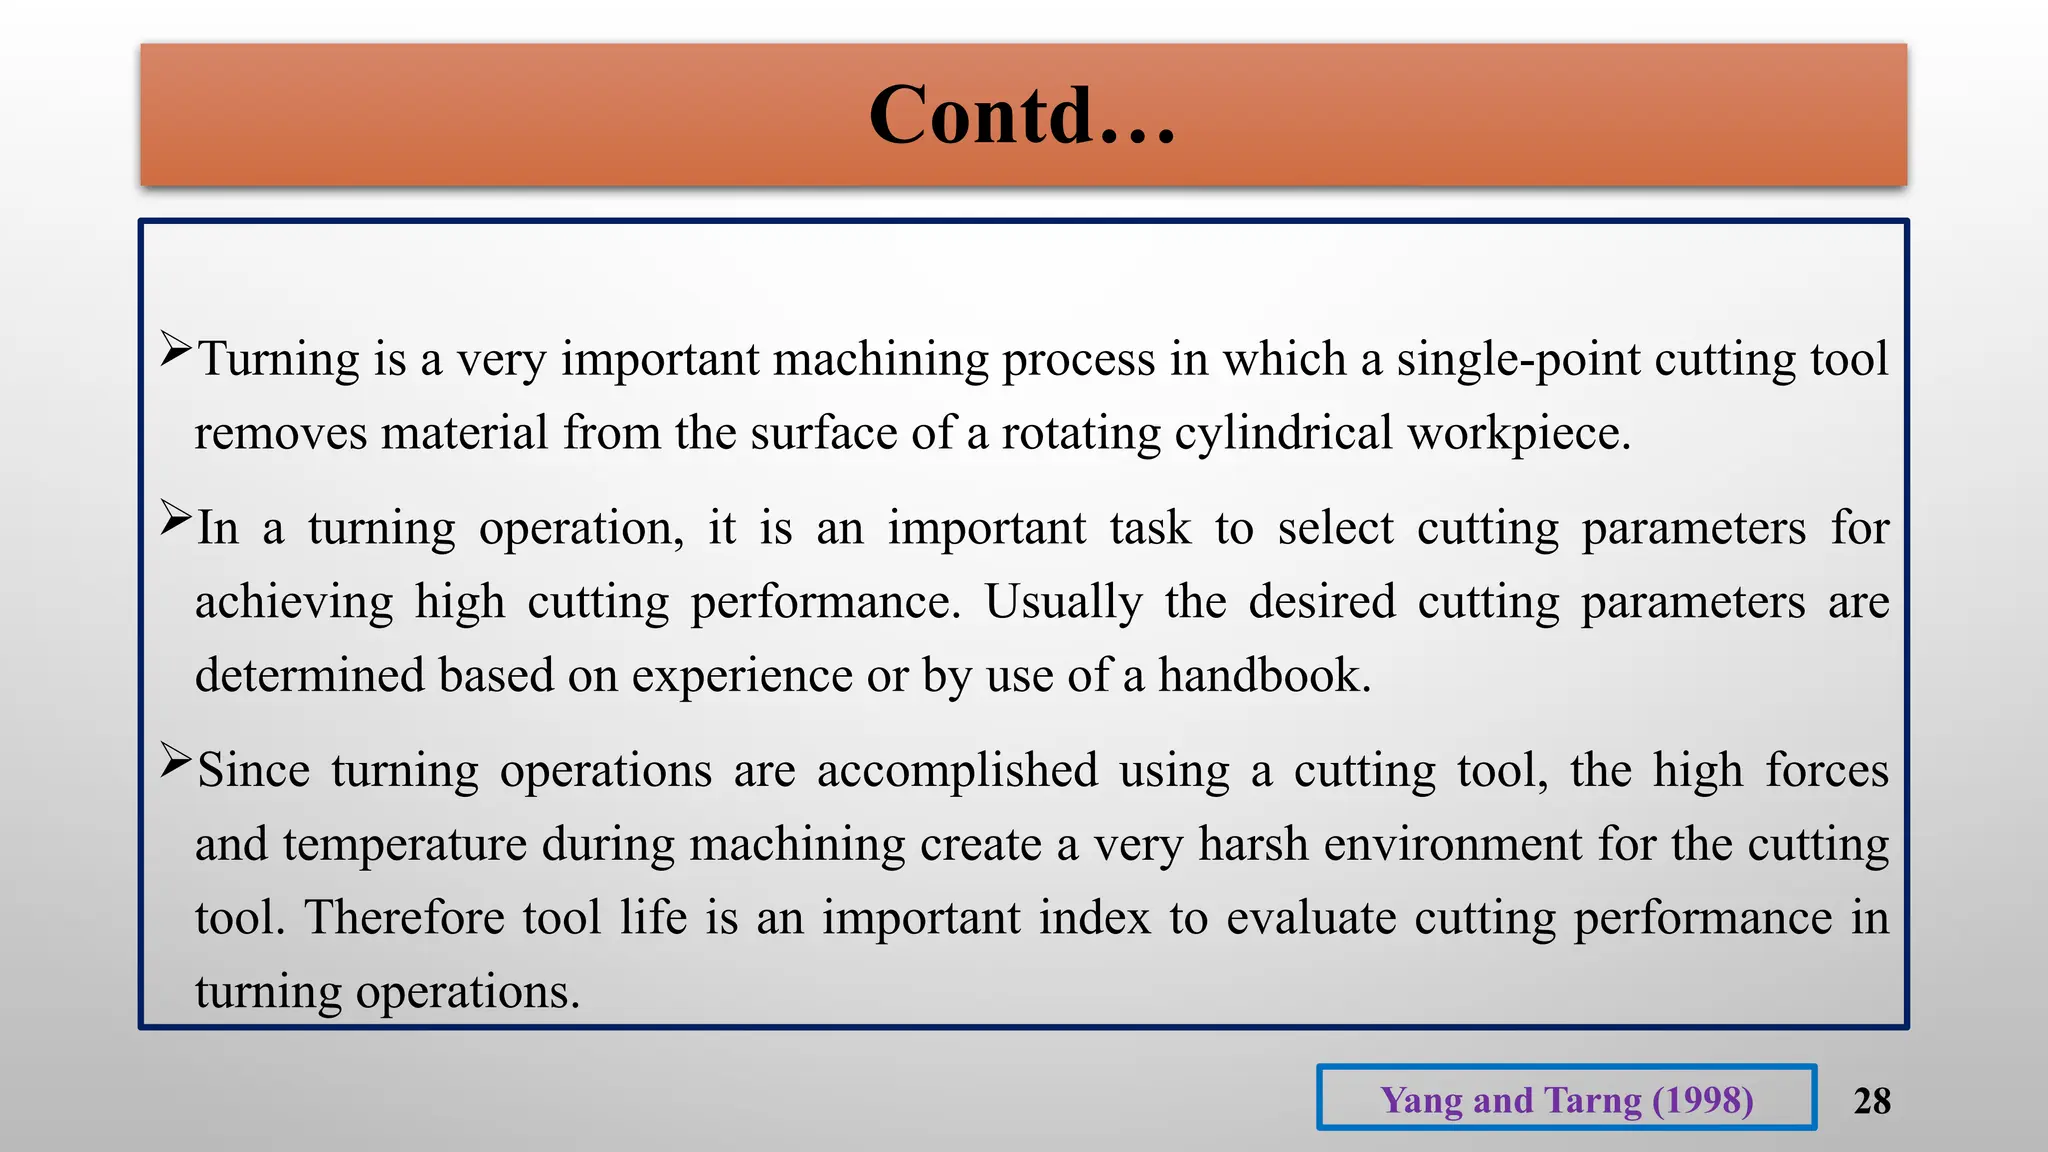
Turning is avery important machining process in which a single-point cutting tool
removes material from the surface of a rotating cylindrical workpiece.
In a turning operation, it is an important task to select cutting parameters for
achieving high cutting performance. Usually the desired cutting parameters are
determined based on experience or by use of a handbook.
Since turning operations are accomplished using a cutting tool, the high forces
and temperature during machining create a very harsh environment for the cutting
tool. Therefore tool life is an important index to evaluate cutting performance in
turning operations.
Yang and Tarng (1998)
Contd…
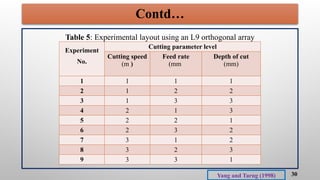
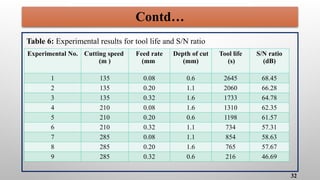
29.
29
Contd…
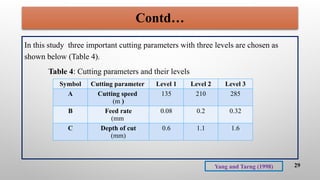
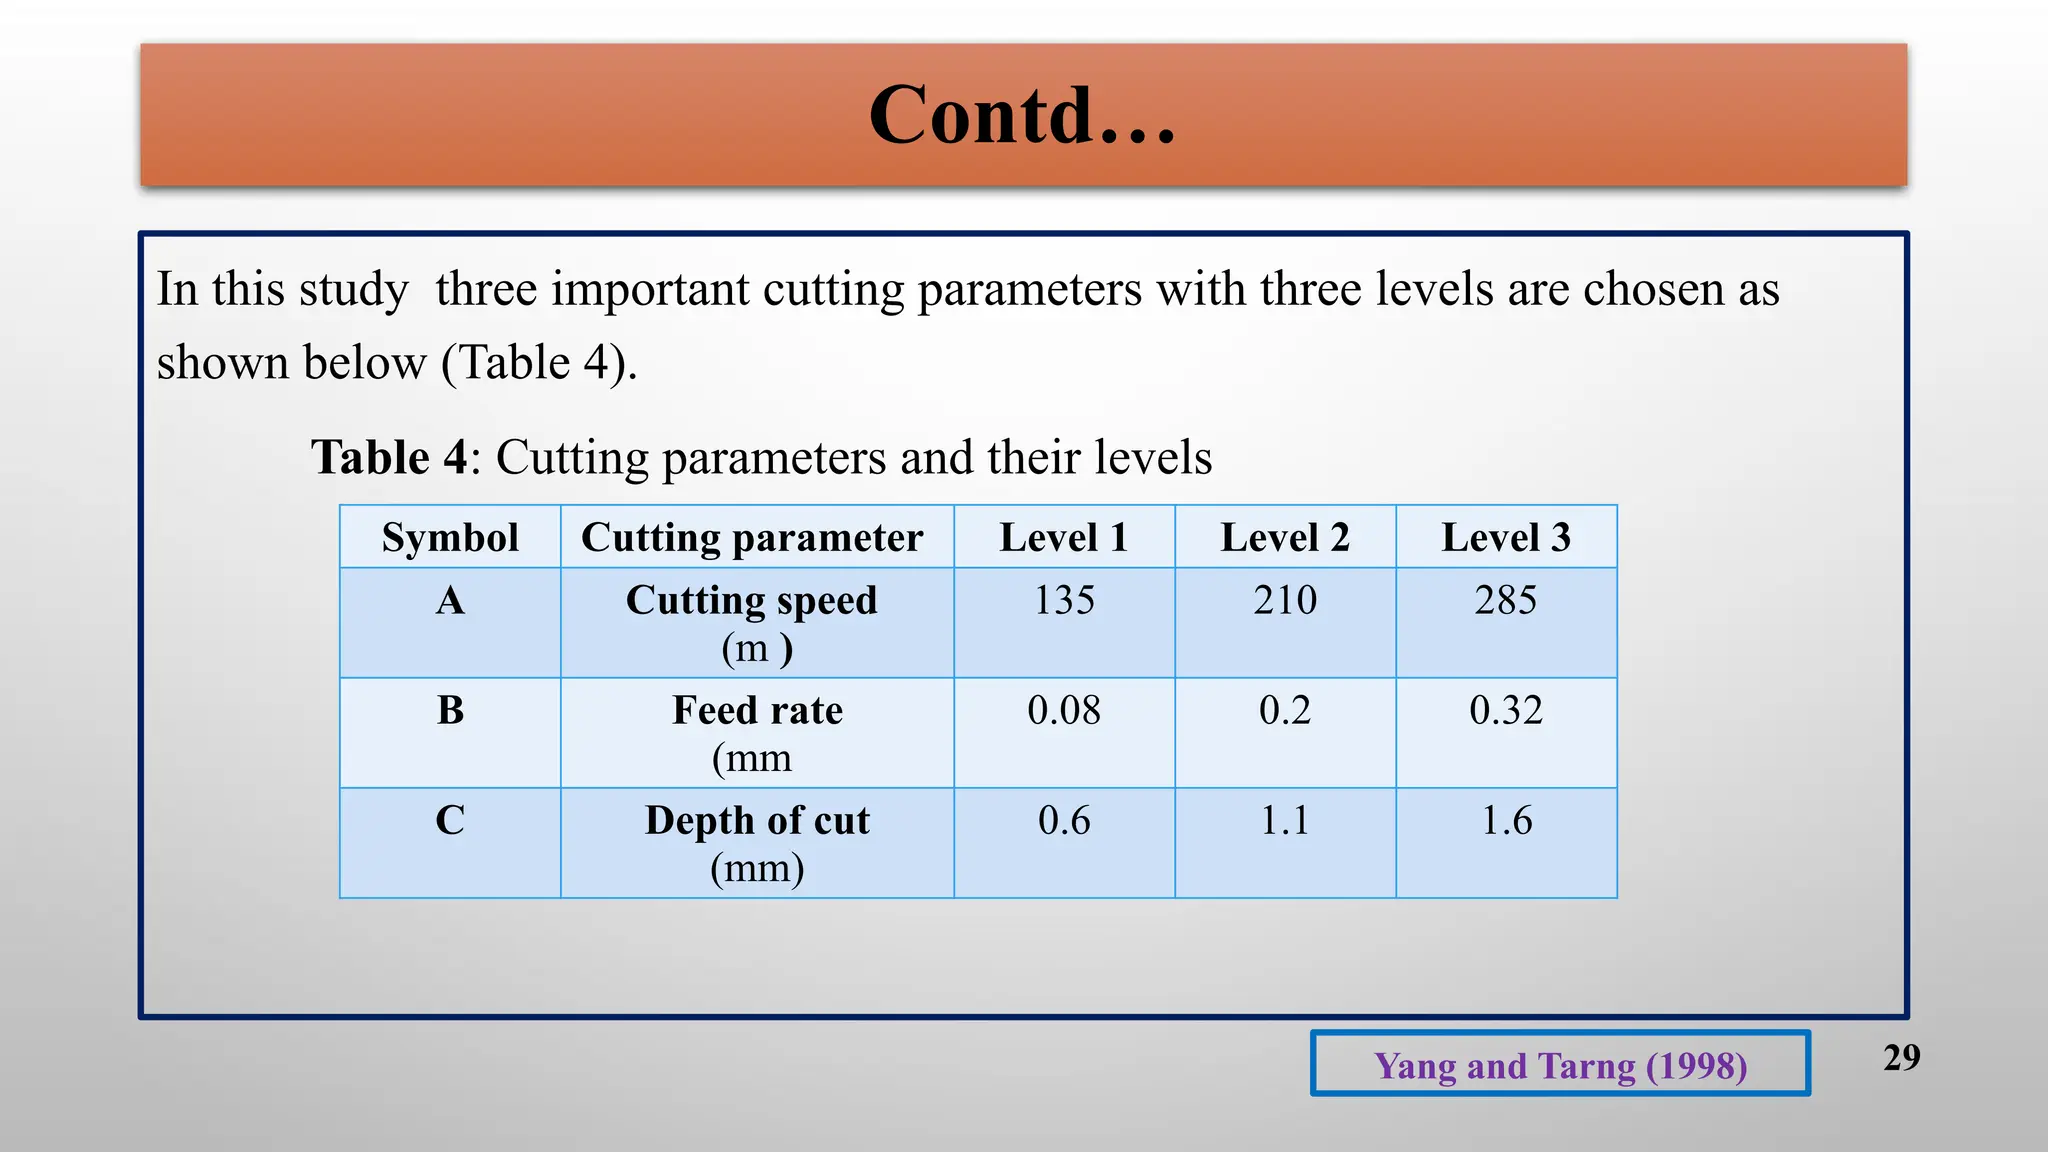
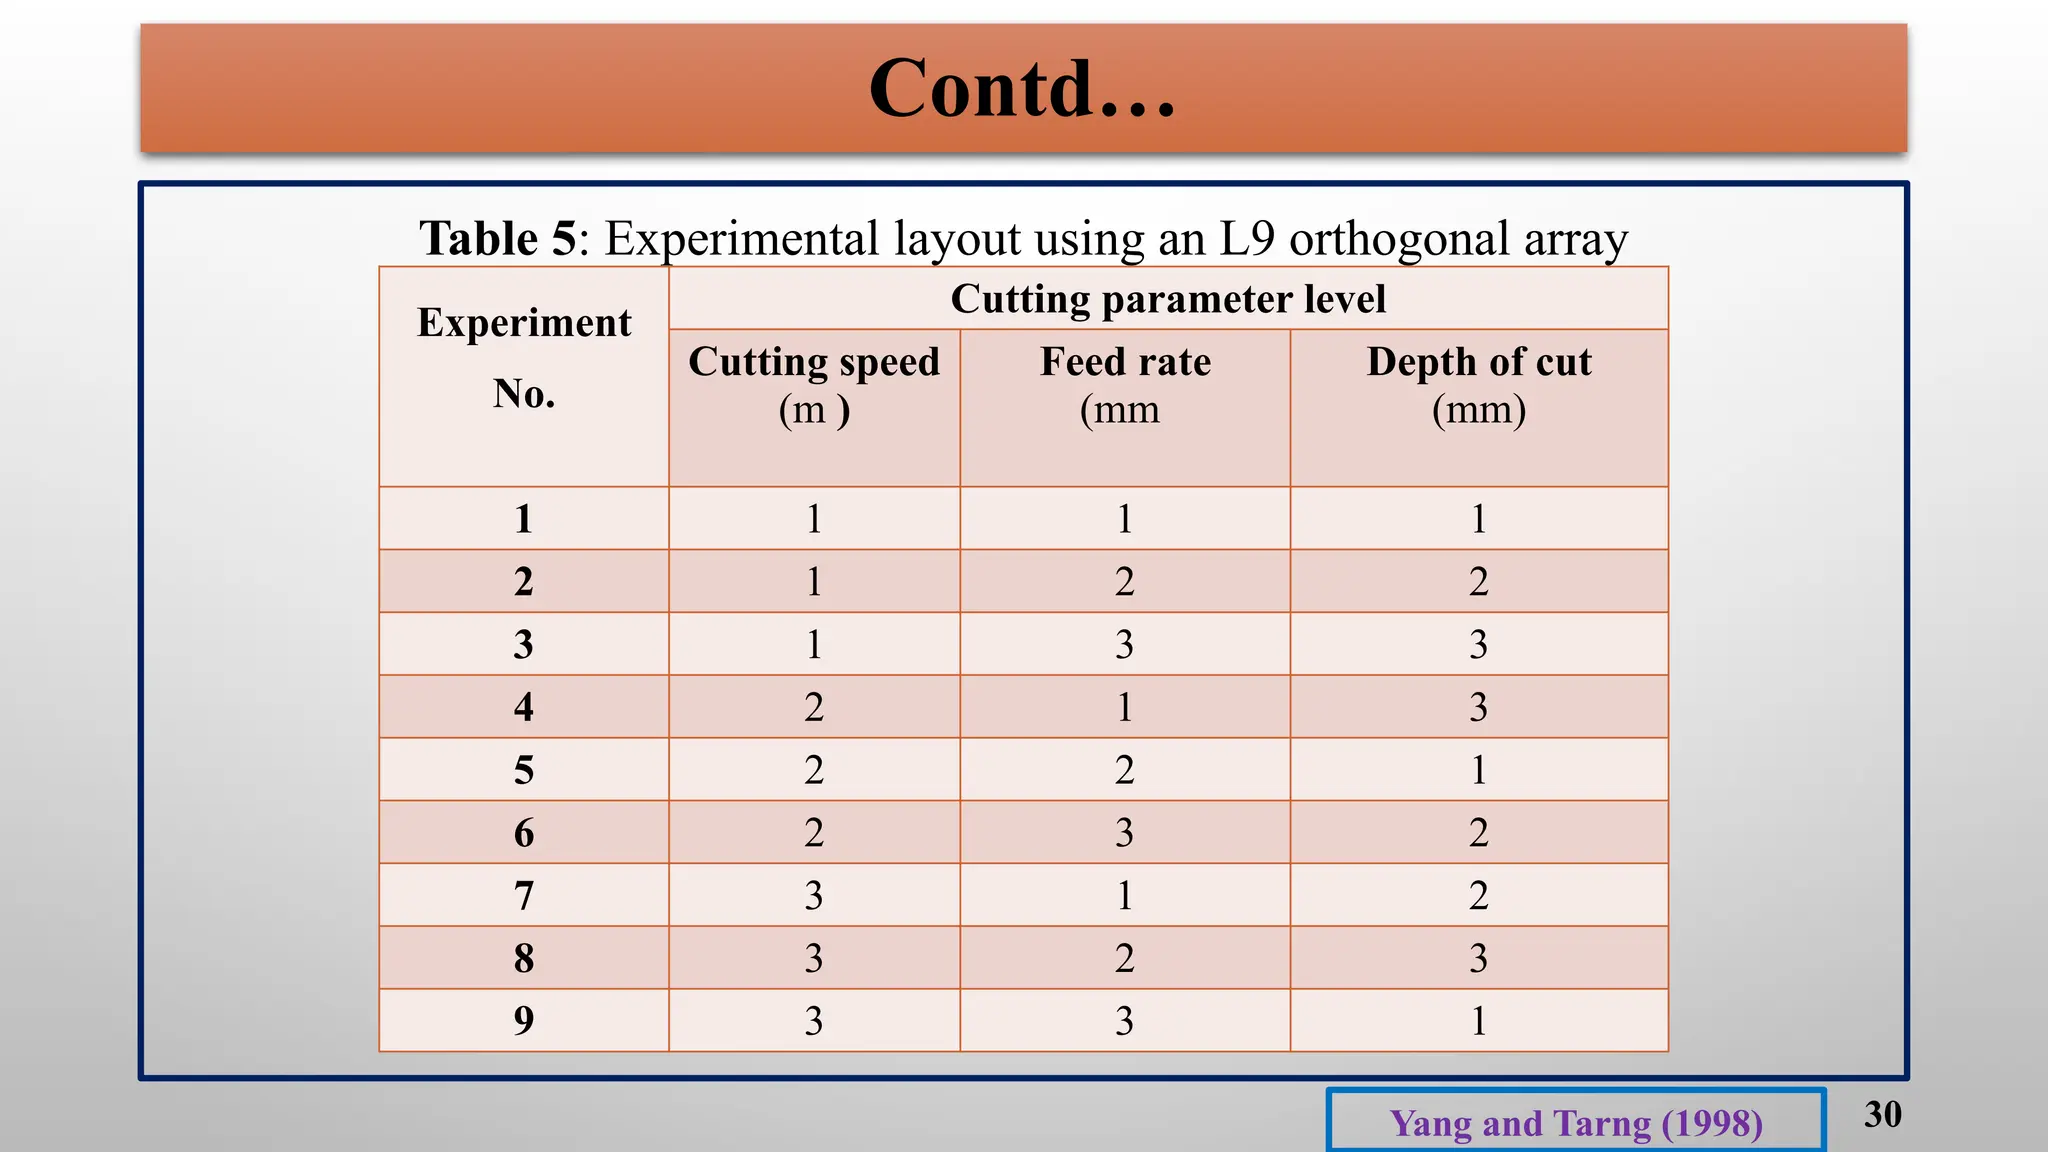
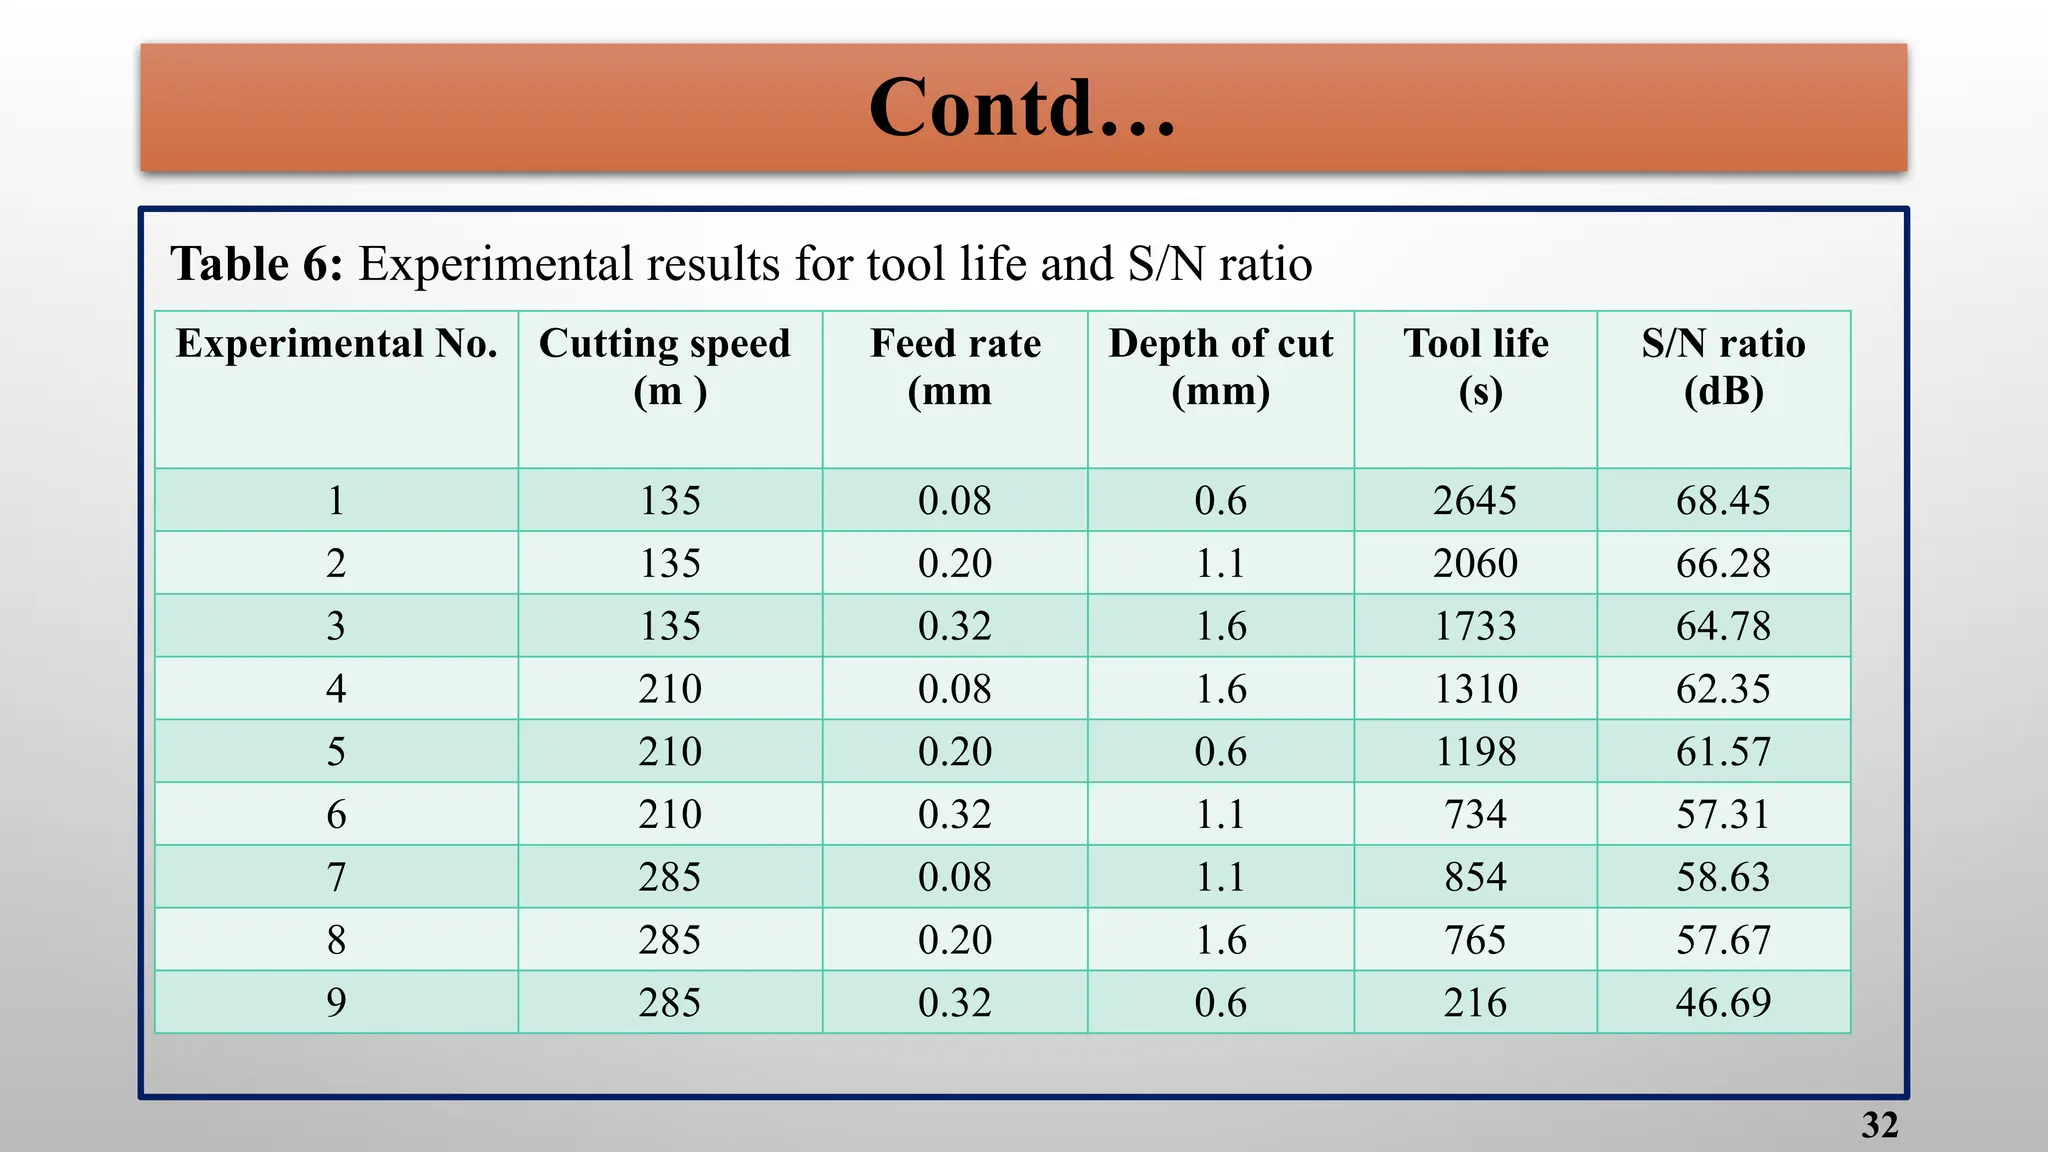
In this studythree important cutting parameters with three levels are chosen as
shown below (Table 4).
Table 4: Cutting parameters and their levels
Symbol Cutting parameter Level 1 Level 2 Level 3
A Cutting speed
(m )
135 210 285
B Feed rate
(mm
0.08 0.2 0.32
C Depth of cut
(mm)
0.6 1.1 1.6
Yang and Tarng (1998)
31
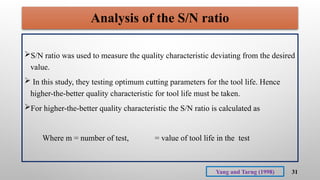
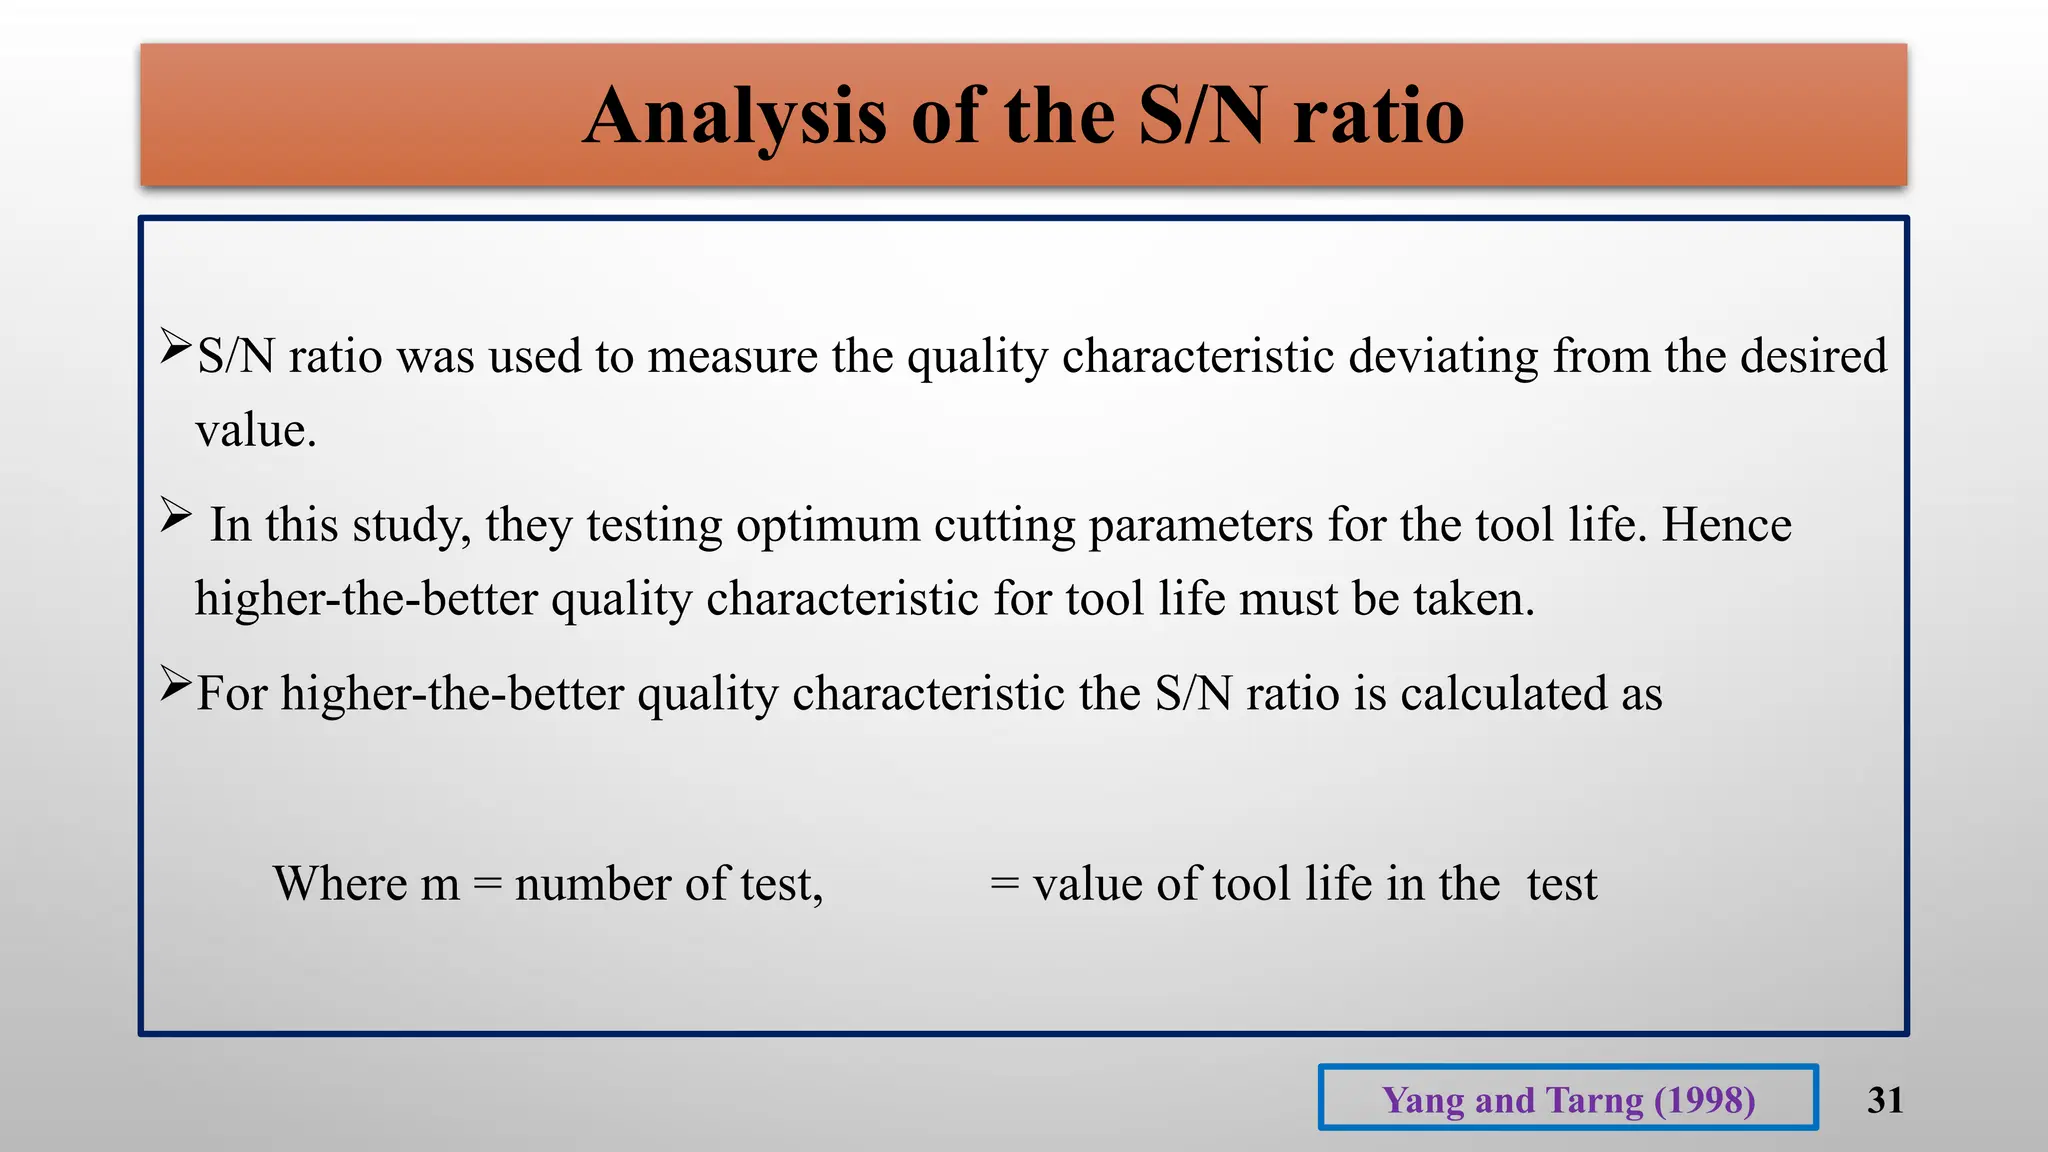
Analysis of theS/N ratio
S/N ratio was used to measure the quality characteristic deviating from the desired
value.
In this study, they testing optimum cutting parameters for the tool life. Hence
higher-the-better quality characteristic for tool life must be taken.
For higher-the-better quality characteristic the S/N ratio is calculated as
Where m = number of test, = value of tool life in the test
Yang and Tarng (1998)
33
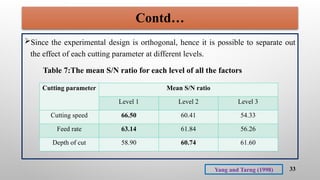
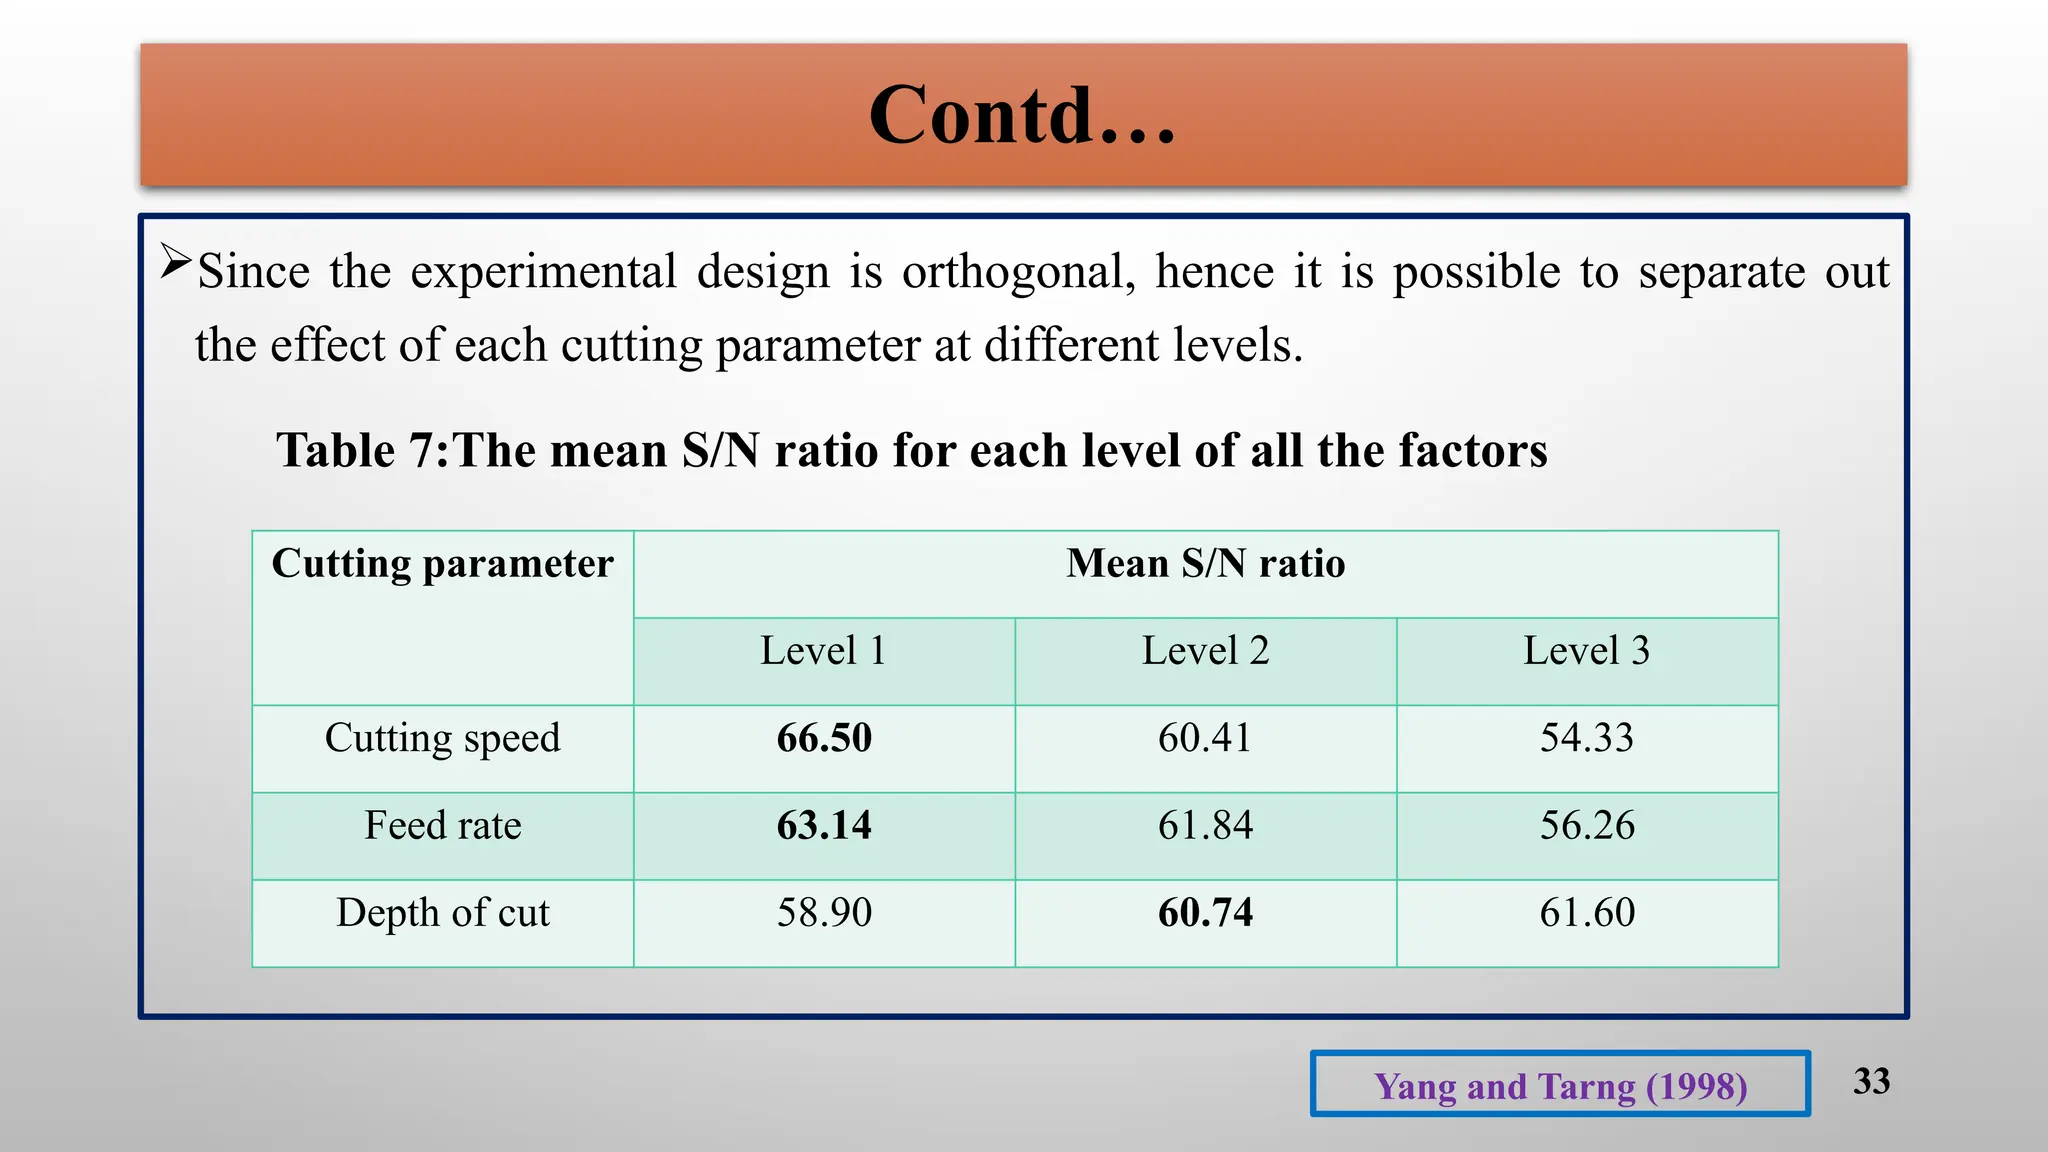
Contd…
Since the experimentaldesign is orthogonal, hence it is possible to separate out
the effect of each cutting parameter at different levels.
Table 7:The mean S/N ratio for each level of all the factors
Cutting parameter Mean S/N ratio
Level 1 Level 2 Level 3
Cutting speed 66.50 60.41 54.33
Feed rate 63.14 61.84 56.26
Depth of cut 58.90 60.74 61.60
Yang and Tarng (1998)
34.
34
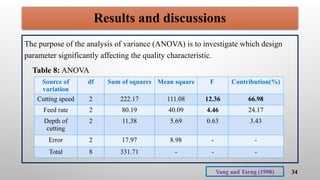
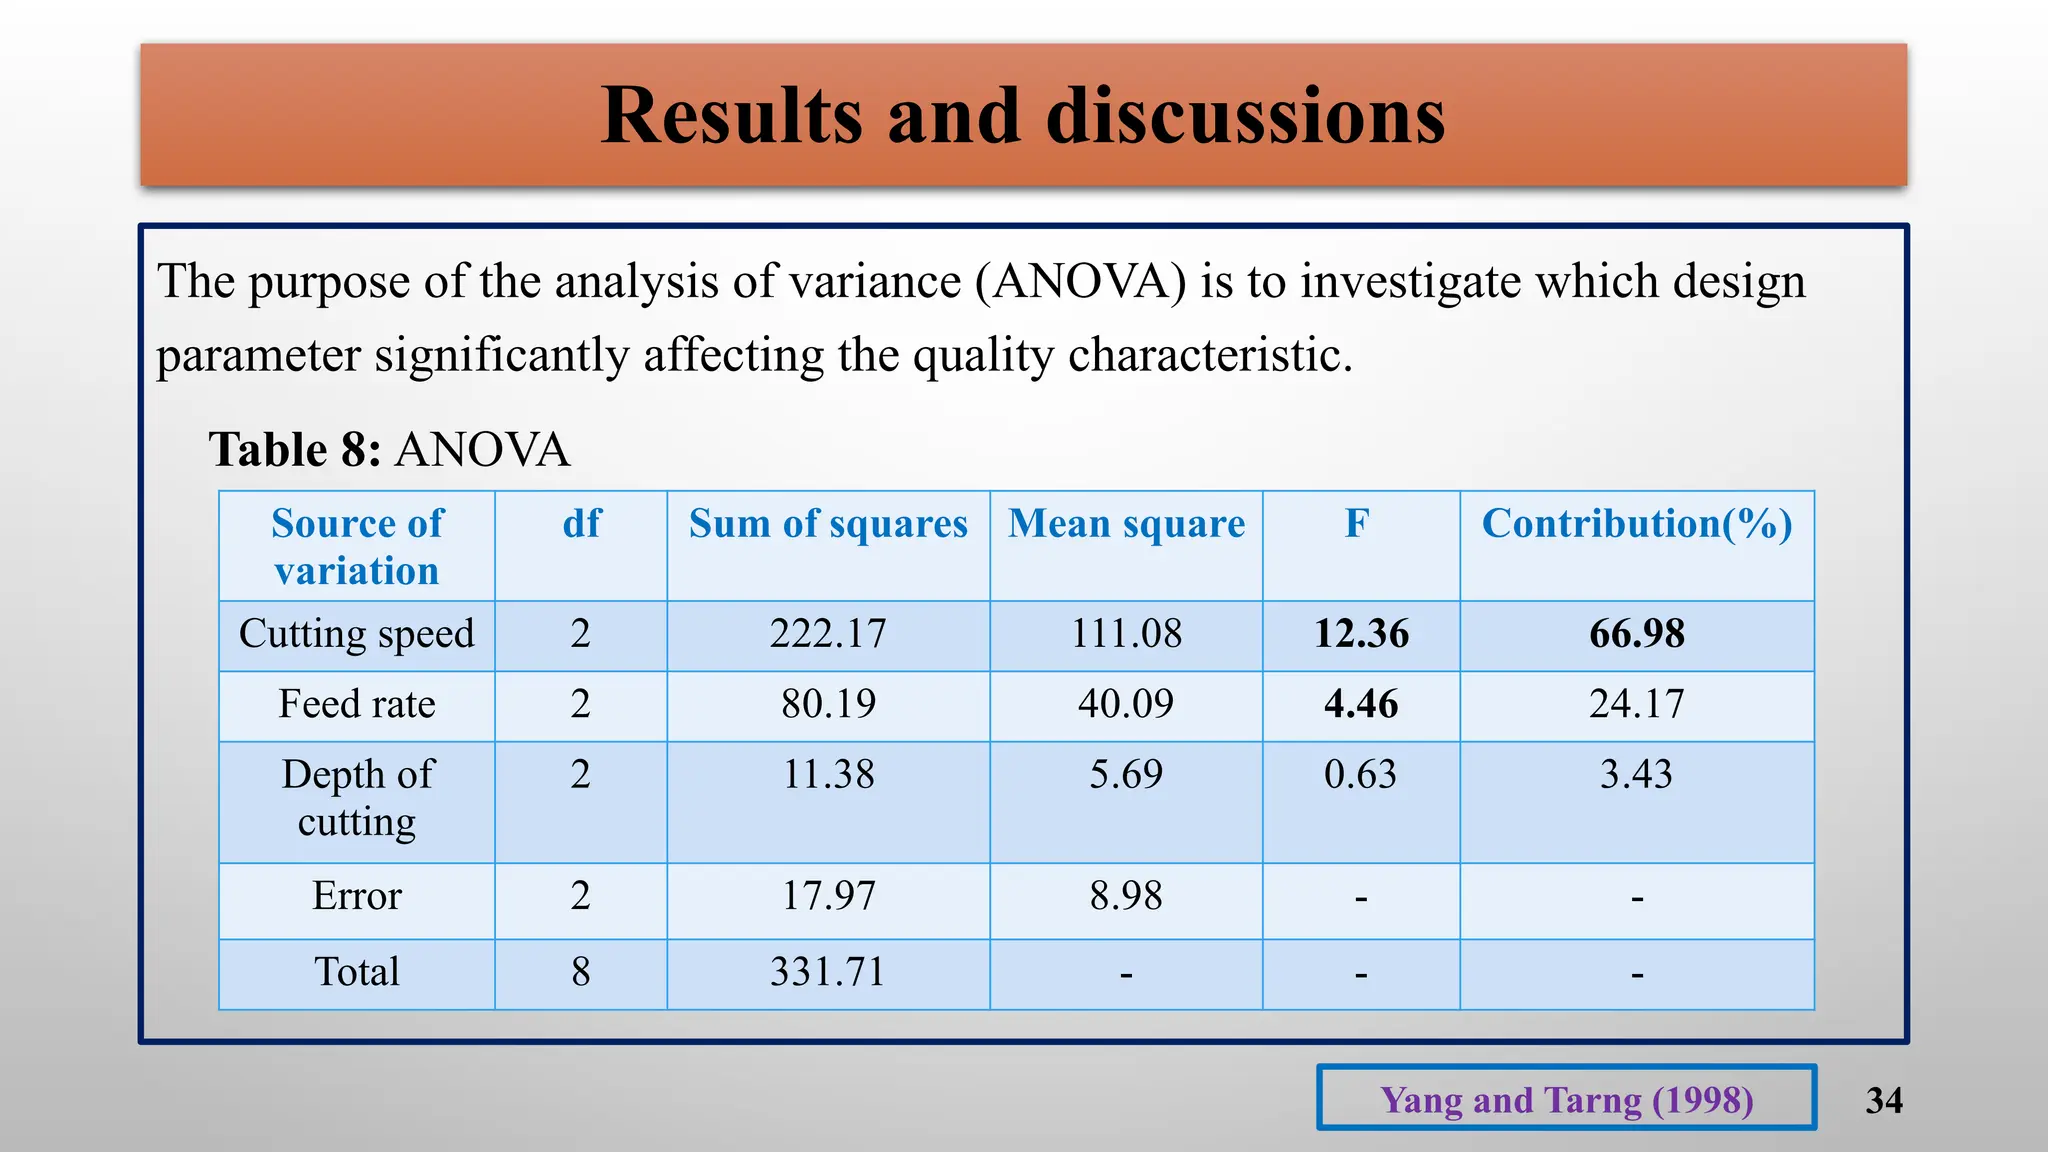
Results and discussions
Thepurpose of the analysis of variance (ANOVA) is to investigate which design
parameter significantly affecting the quality characteristic.
Table 8: ANOVA
Source of
variation
df Sum of squares Mean square F Contribution(%)
Cutting speed 2 222.17 111.08 12.36 66.98
Feed rate 2 80.19 40.09 4.46 24.17
Depth of
cutting
2 11.38 5.69 0.63 3.43
Error 2 17.97 8.98 - -
Total 8 331.71 - - -
Yang and Tarng (1998)
35.
35
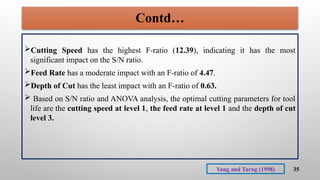
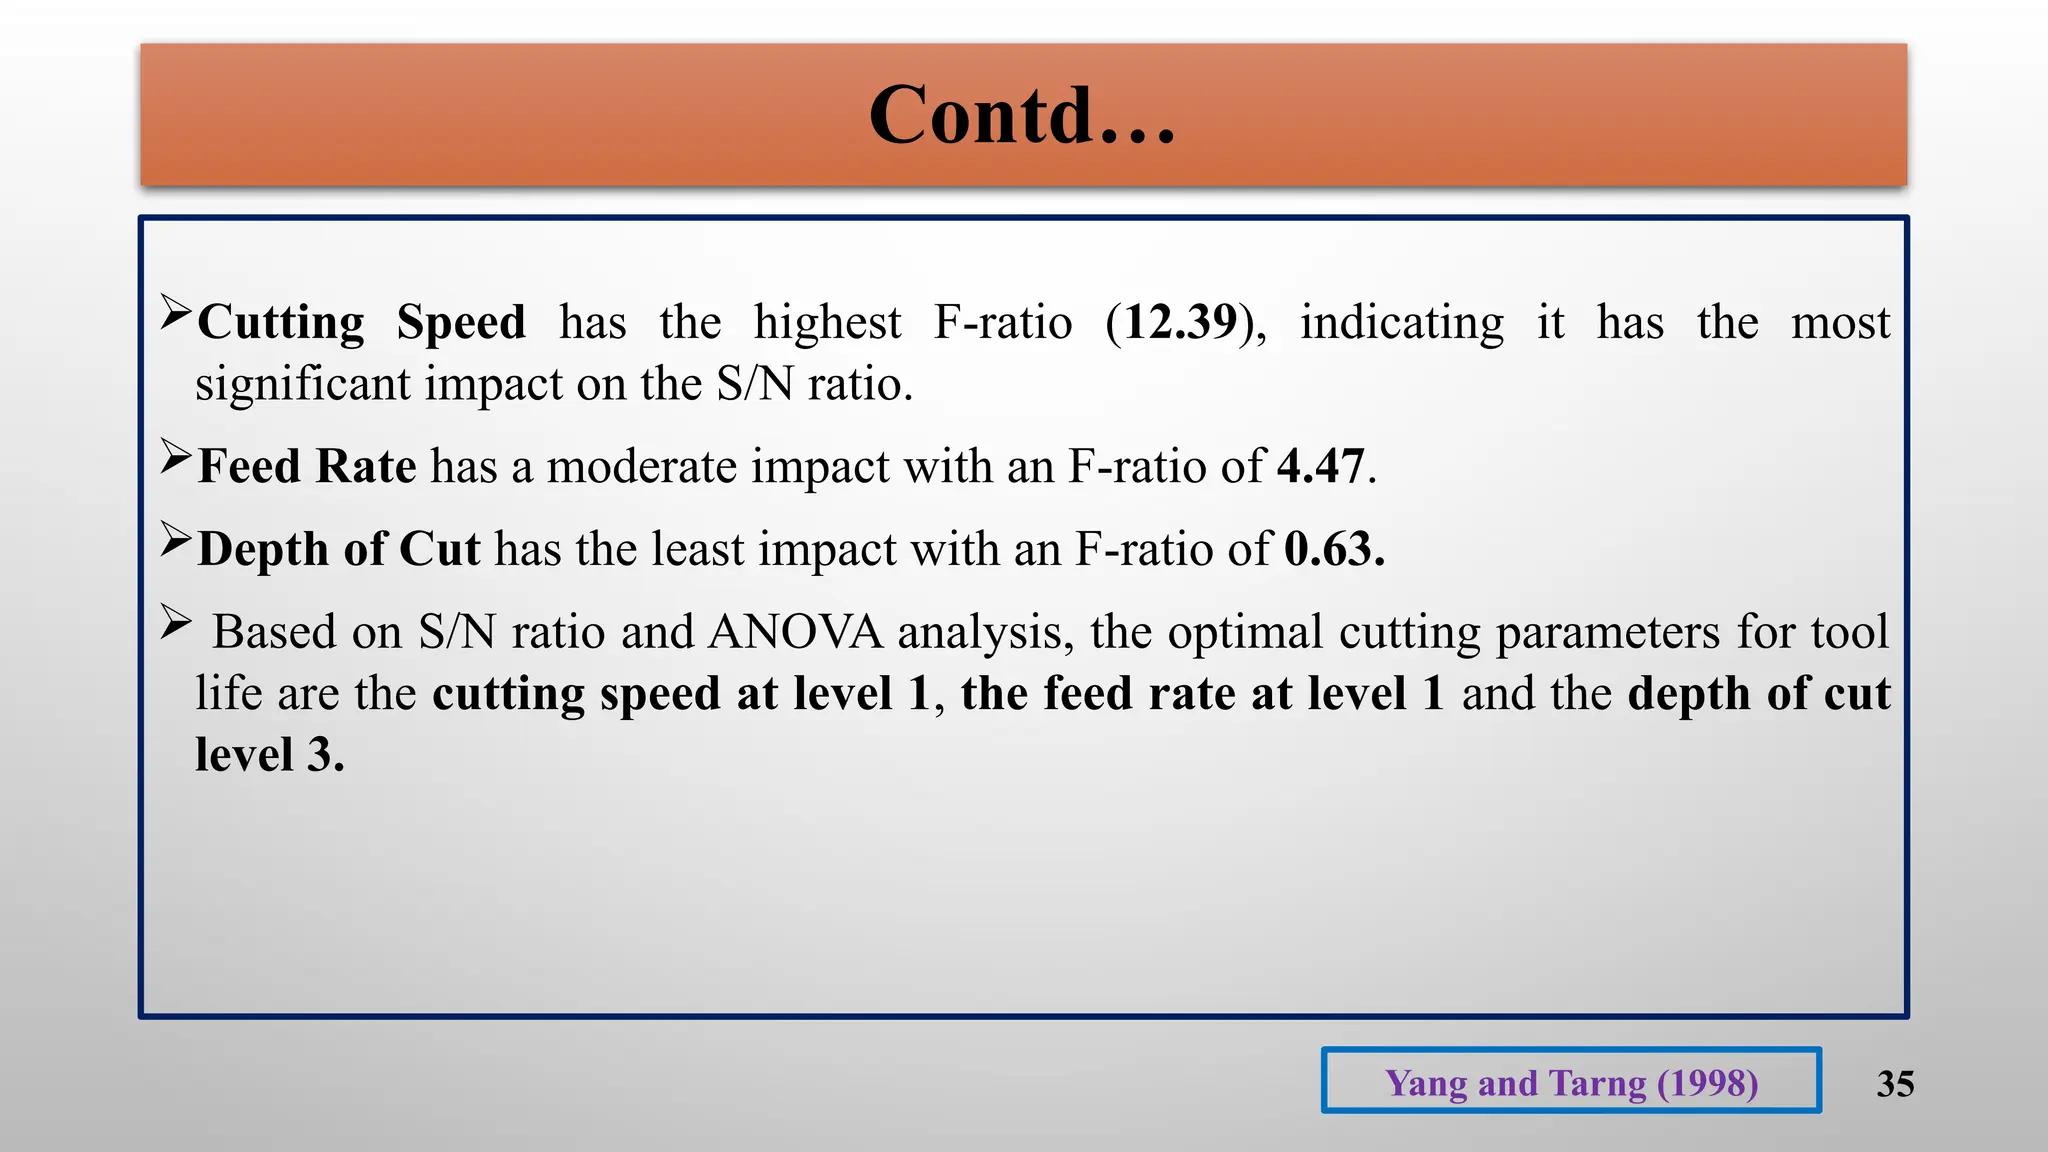
Contd…
Cutting Speed hasthe highest F-ratio (12.39), indicating it has the most
significant impact on the S/N ratio.
Feed Rate has a moderate impact with an F-ratio of 4.47.
Depth of Cut has the least impact with an F-ratio of 0.63.
Based on S/N ratio and ANOVA analysis, the optimal cutting parameters for tool
life are the cutting speed at level 1, the feed rate at level 1 and the depth of cut
level 3.
Yang and Tarng (1998)
36.
36
Contd…
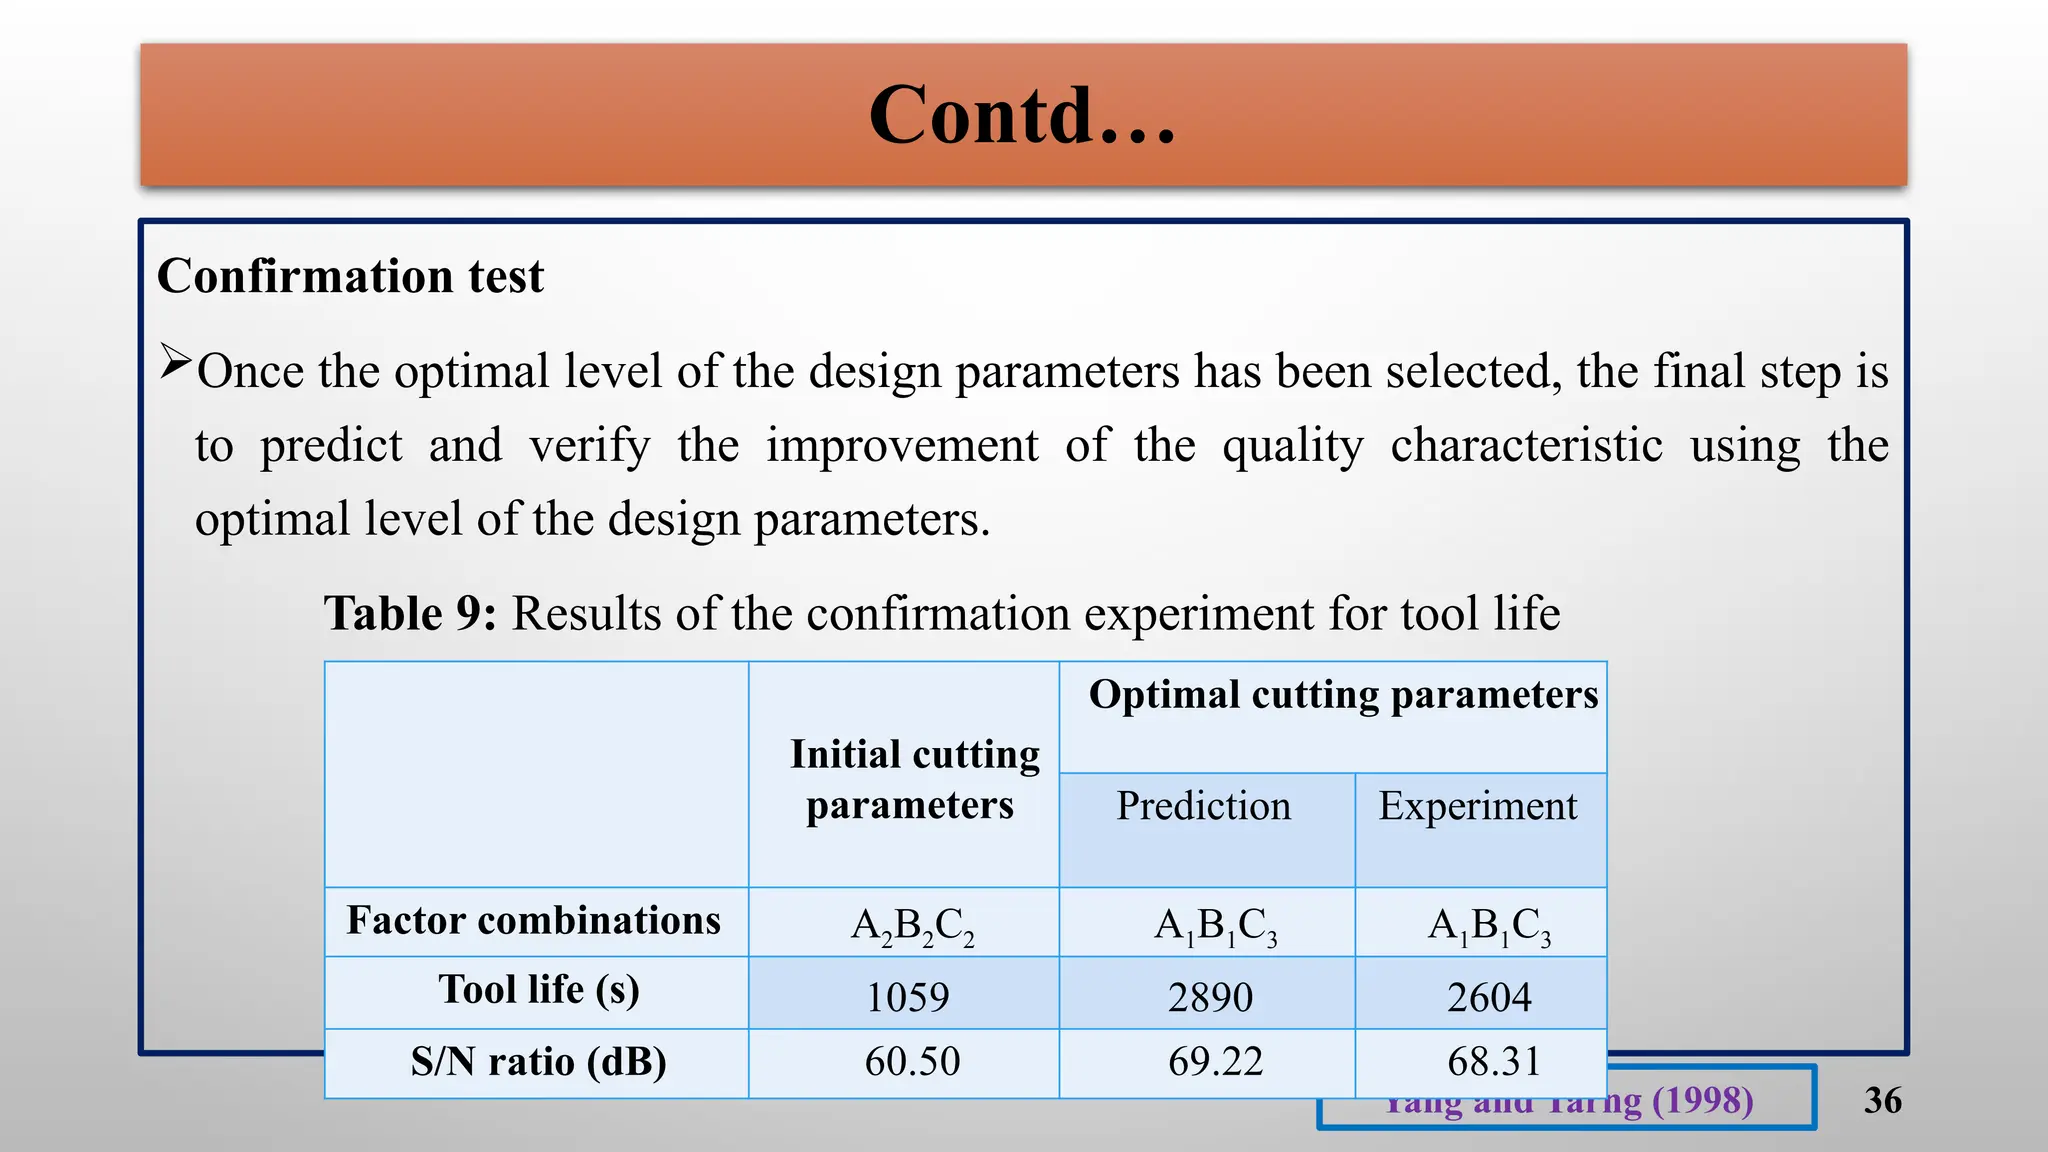
Confirmation test
Once theoptimal level of the design parameters has been selected, the final step is
to predict and verify the improvement of the quality characteristic using the
optimal level of the design parameters.
Table 9: Results of the confirmation experiment for tool life
Yang and Tarng (1998)
Initial cutting
parameters
Optimal cutting parameters
Prediction Experiment
Factor combinations A2B2C2 A1B1C3 A1B1C3
Tool life (s) 1059 2890 2604
S/N ratio (dB) 60.50 69.22 68.31
37.
37
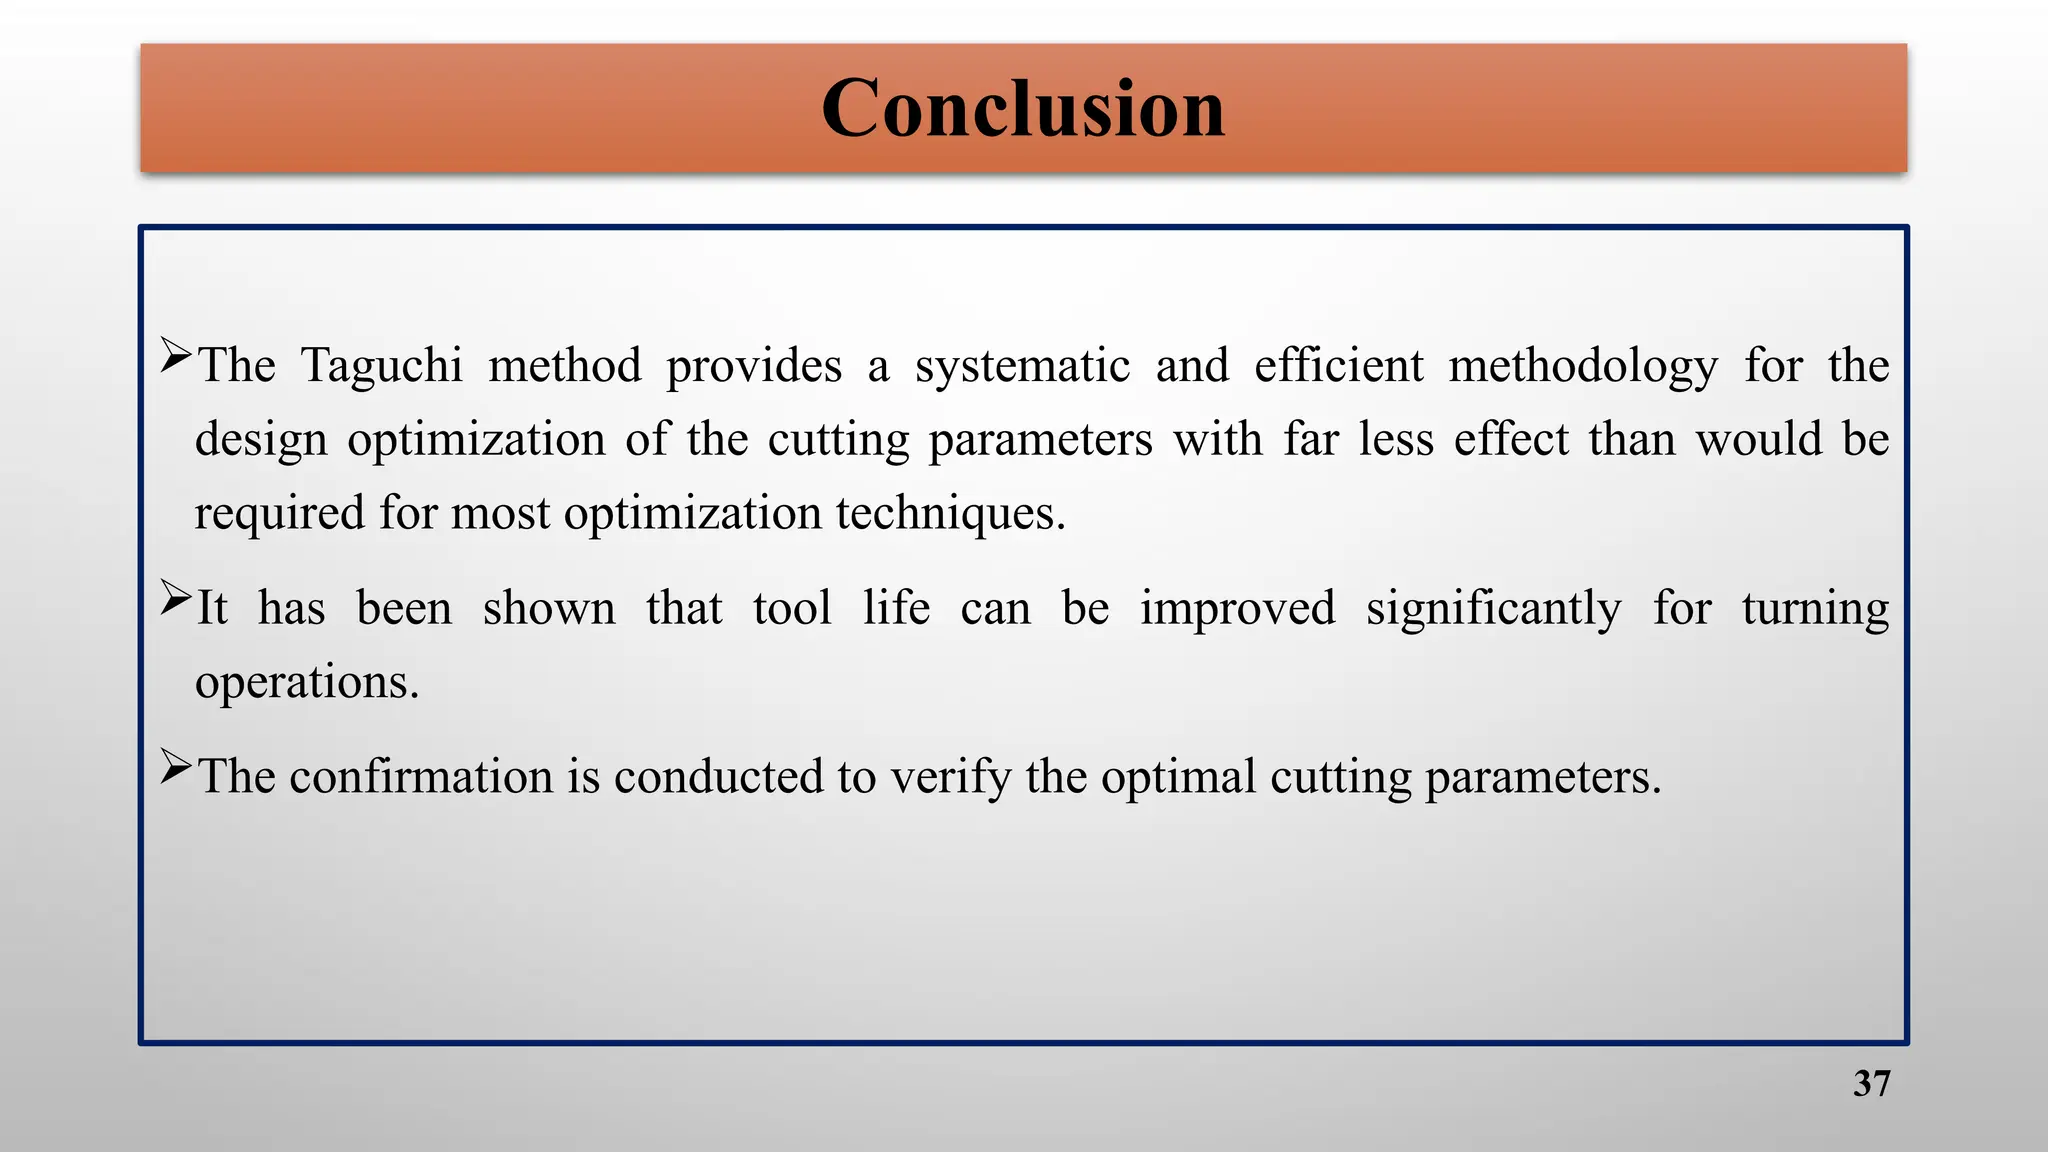
Conclusion
The Taguchi methodprovides a systematic and efficient methodology for the
design optimization of the cutting parameters with far less effect than would be
required for most optimization techniques.
It has been shown that tool life can be improved significantly for turning
operations.
The confirmation is conducted to verify the optimal cutting parameters.
38.
CASE STUDY 2
Taguchidesign optimization of cutting parameters for surface roughness in turning
INCONEL.
Deva Raj et.al. (2016)
39.
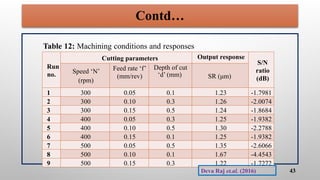
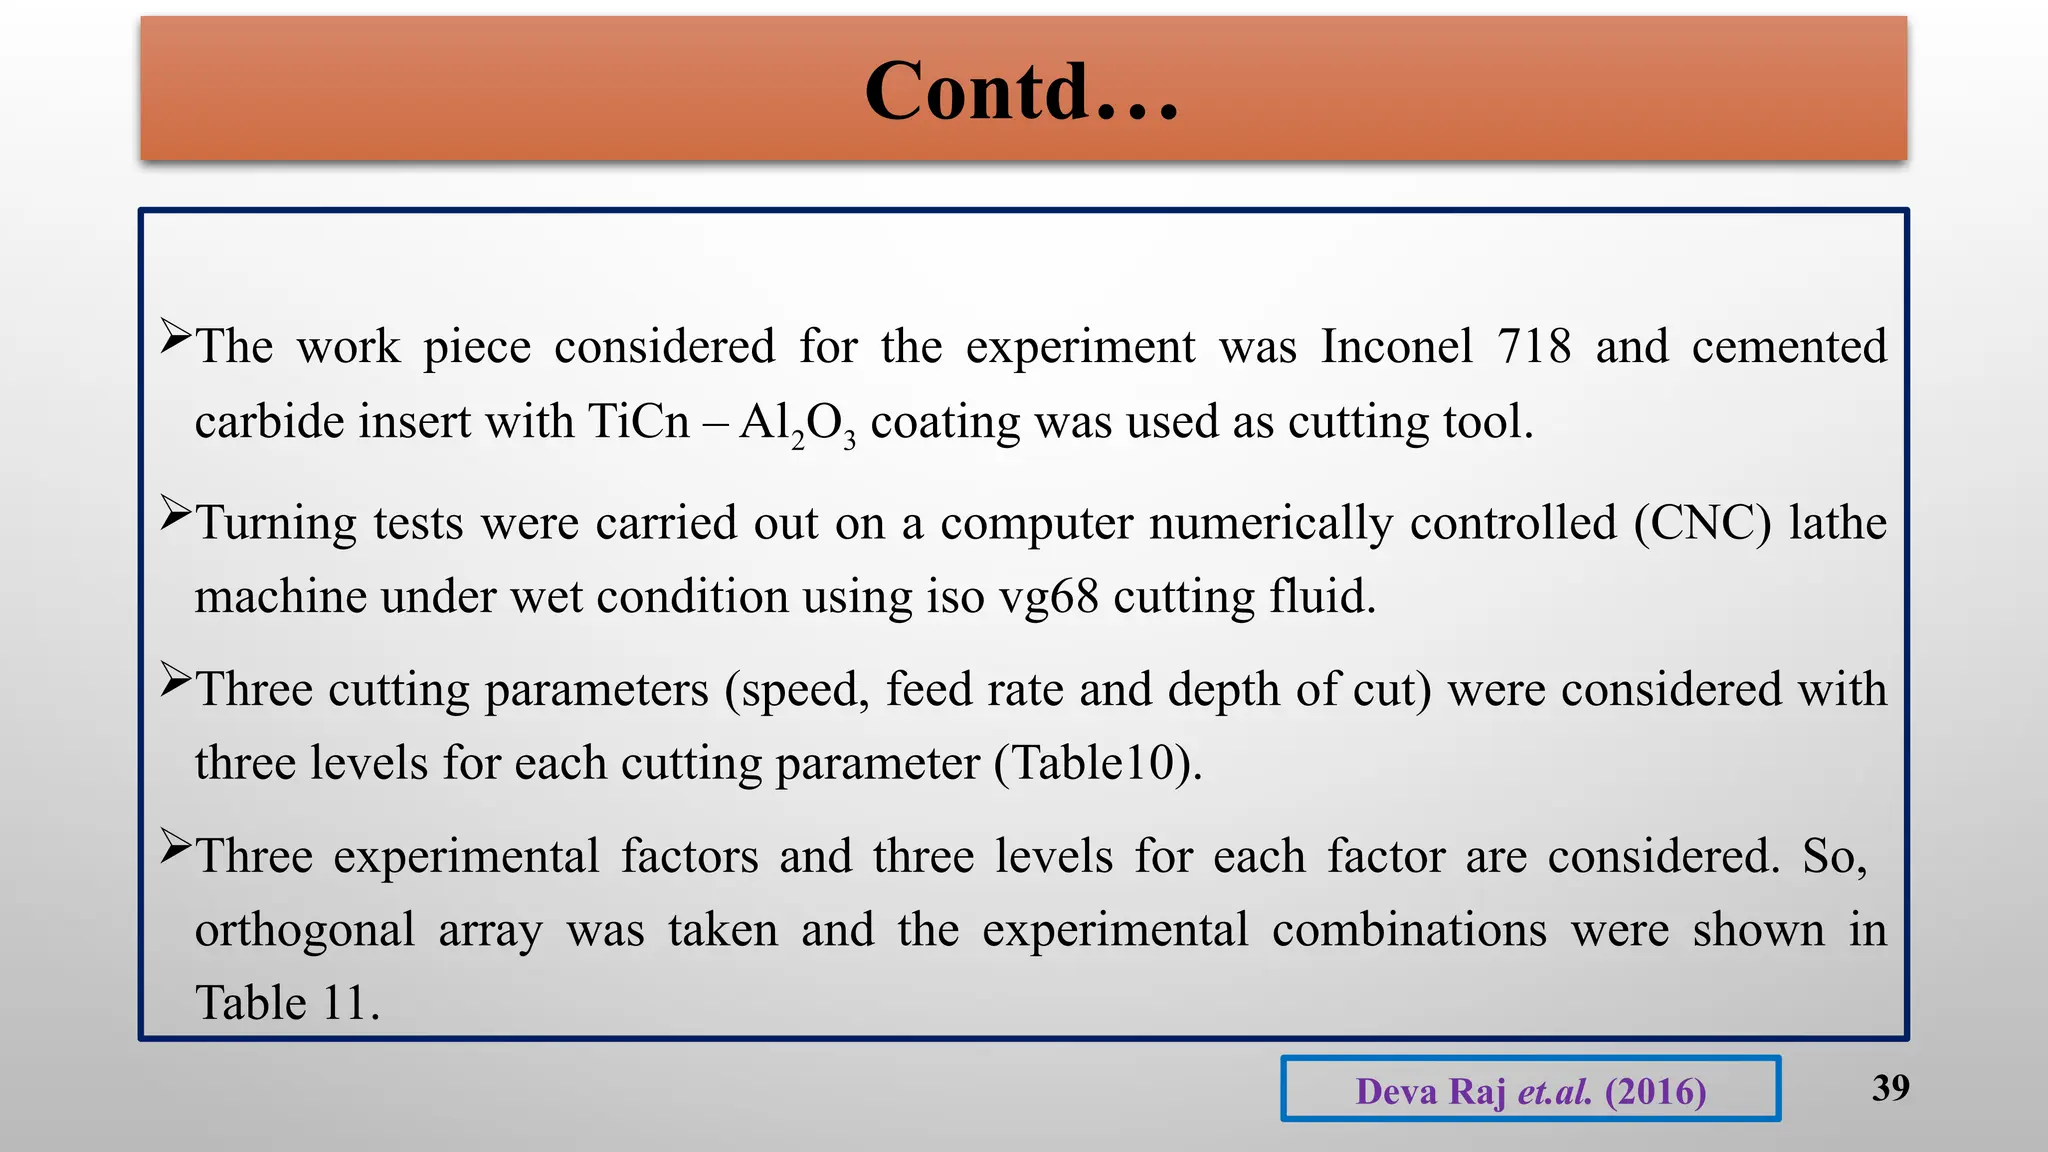
The work piececonsidered for the experiment was Inconel 718 and cemented
carbide insert with TiCn – Al2O3 coating was used as cutting tool.
Turning tests were carried out on a computer numerically controlled (CNC) lathe
machine under wet condition using iso vg68 cutting fluid.
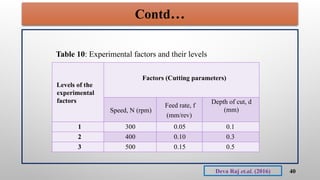
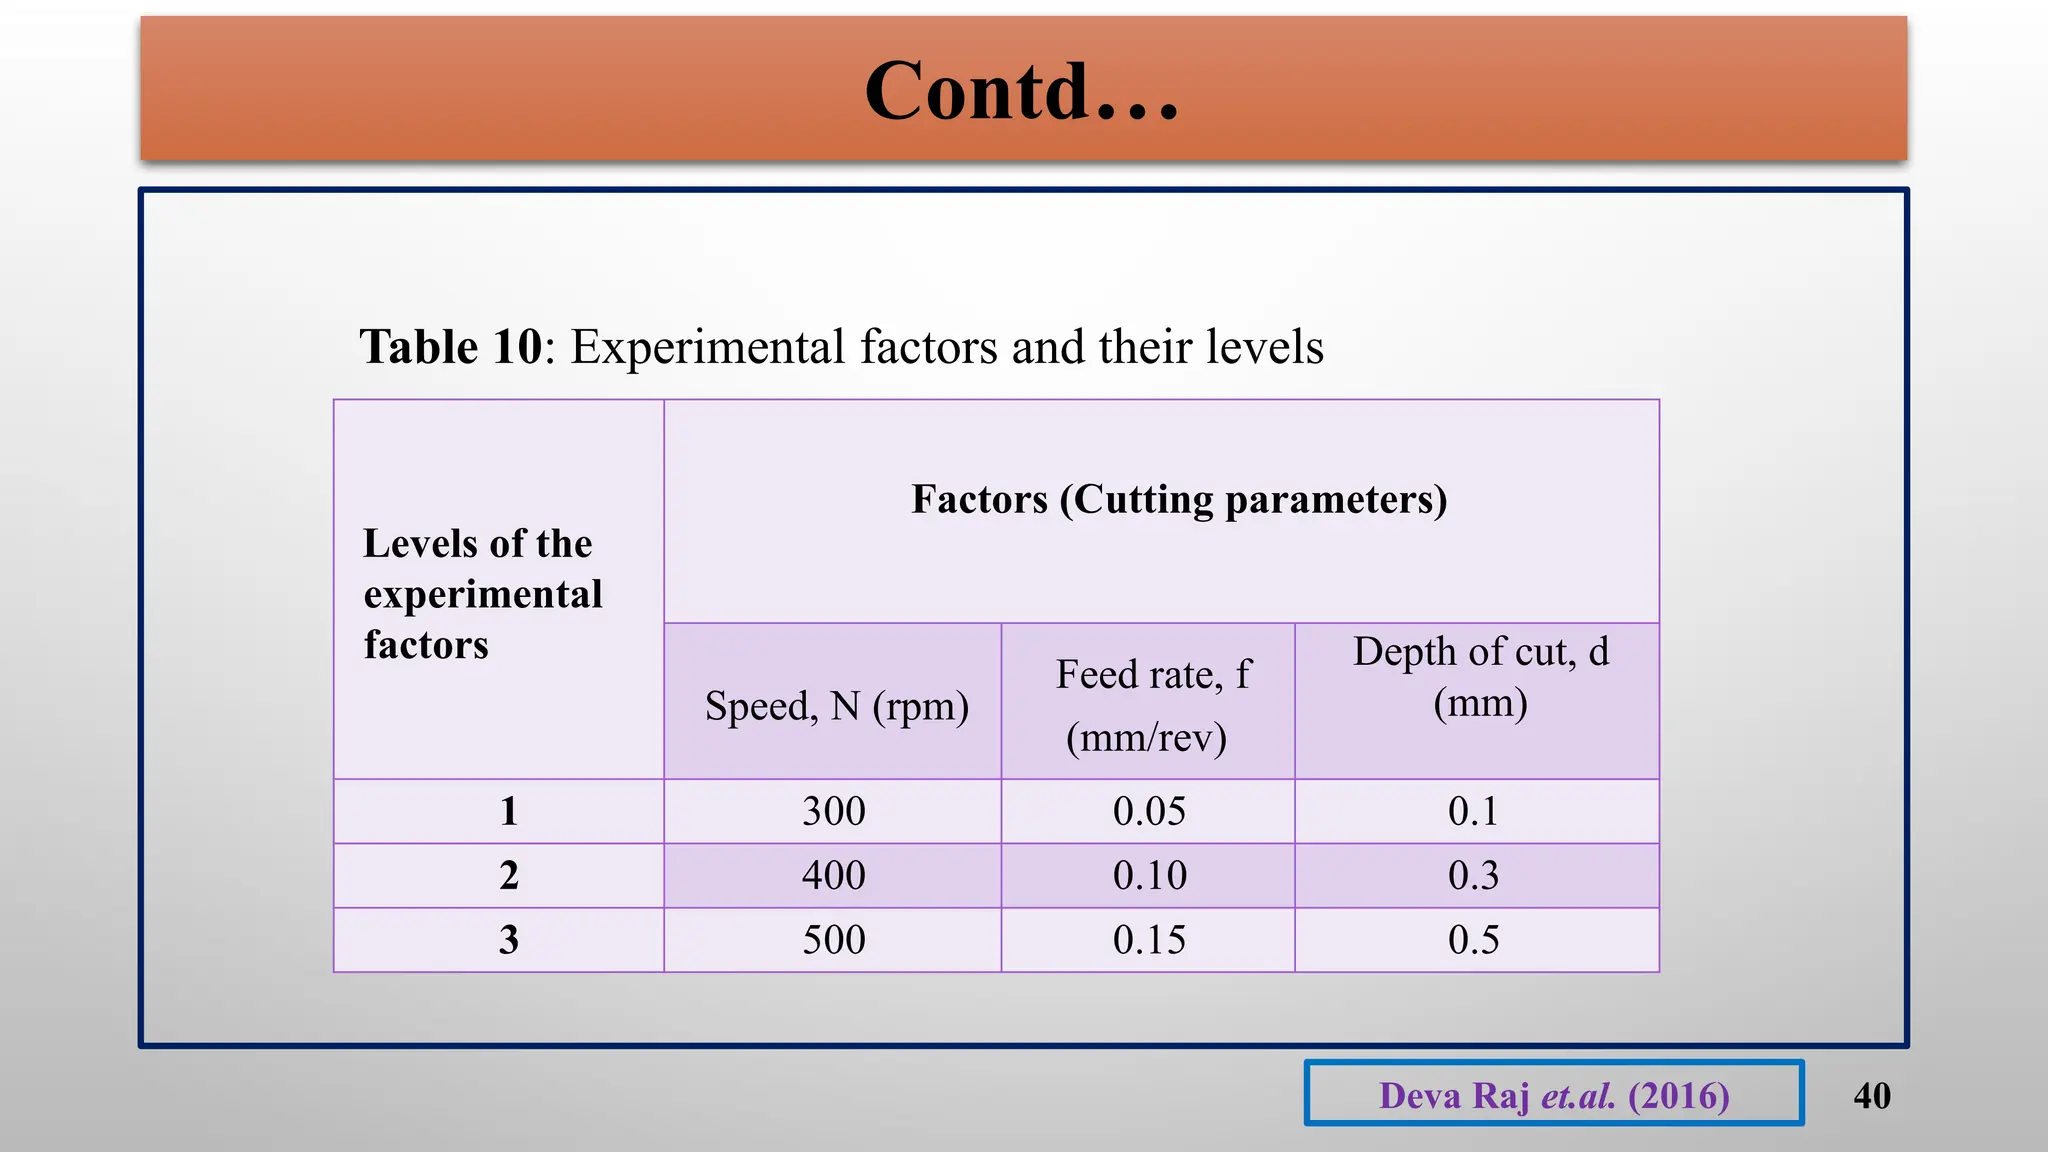
Three cutting parameters (speed, feed rate and depth of cut) were considered with
three levels for each cutting parameter (Table10).
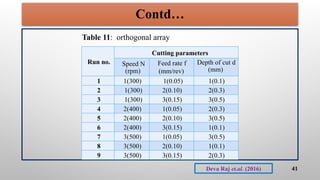
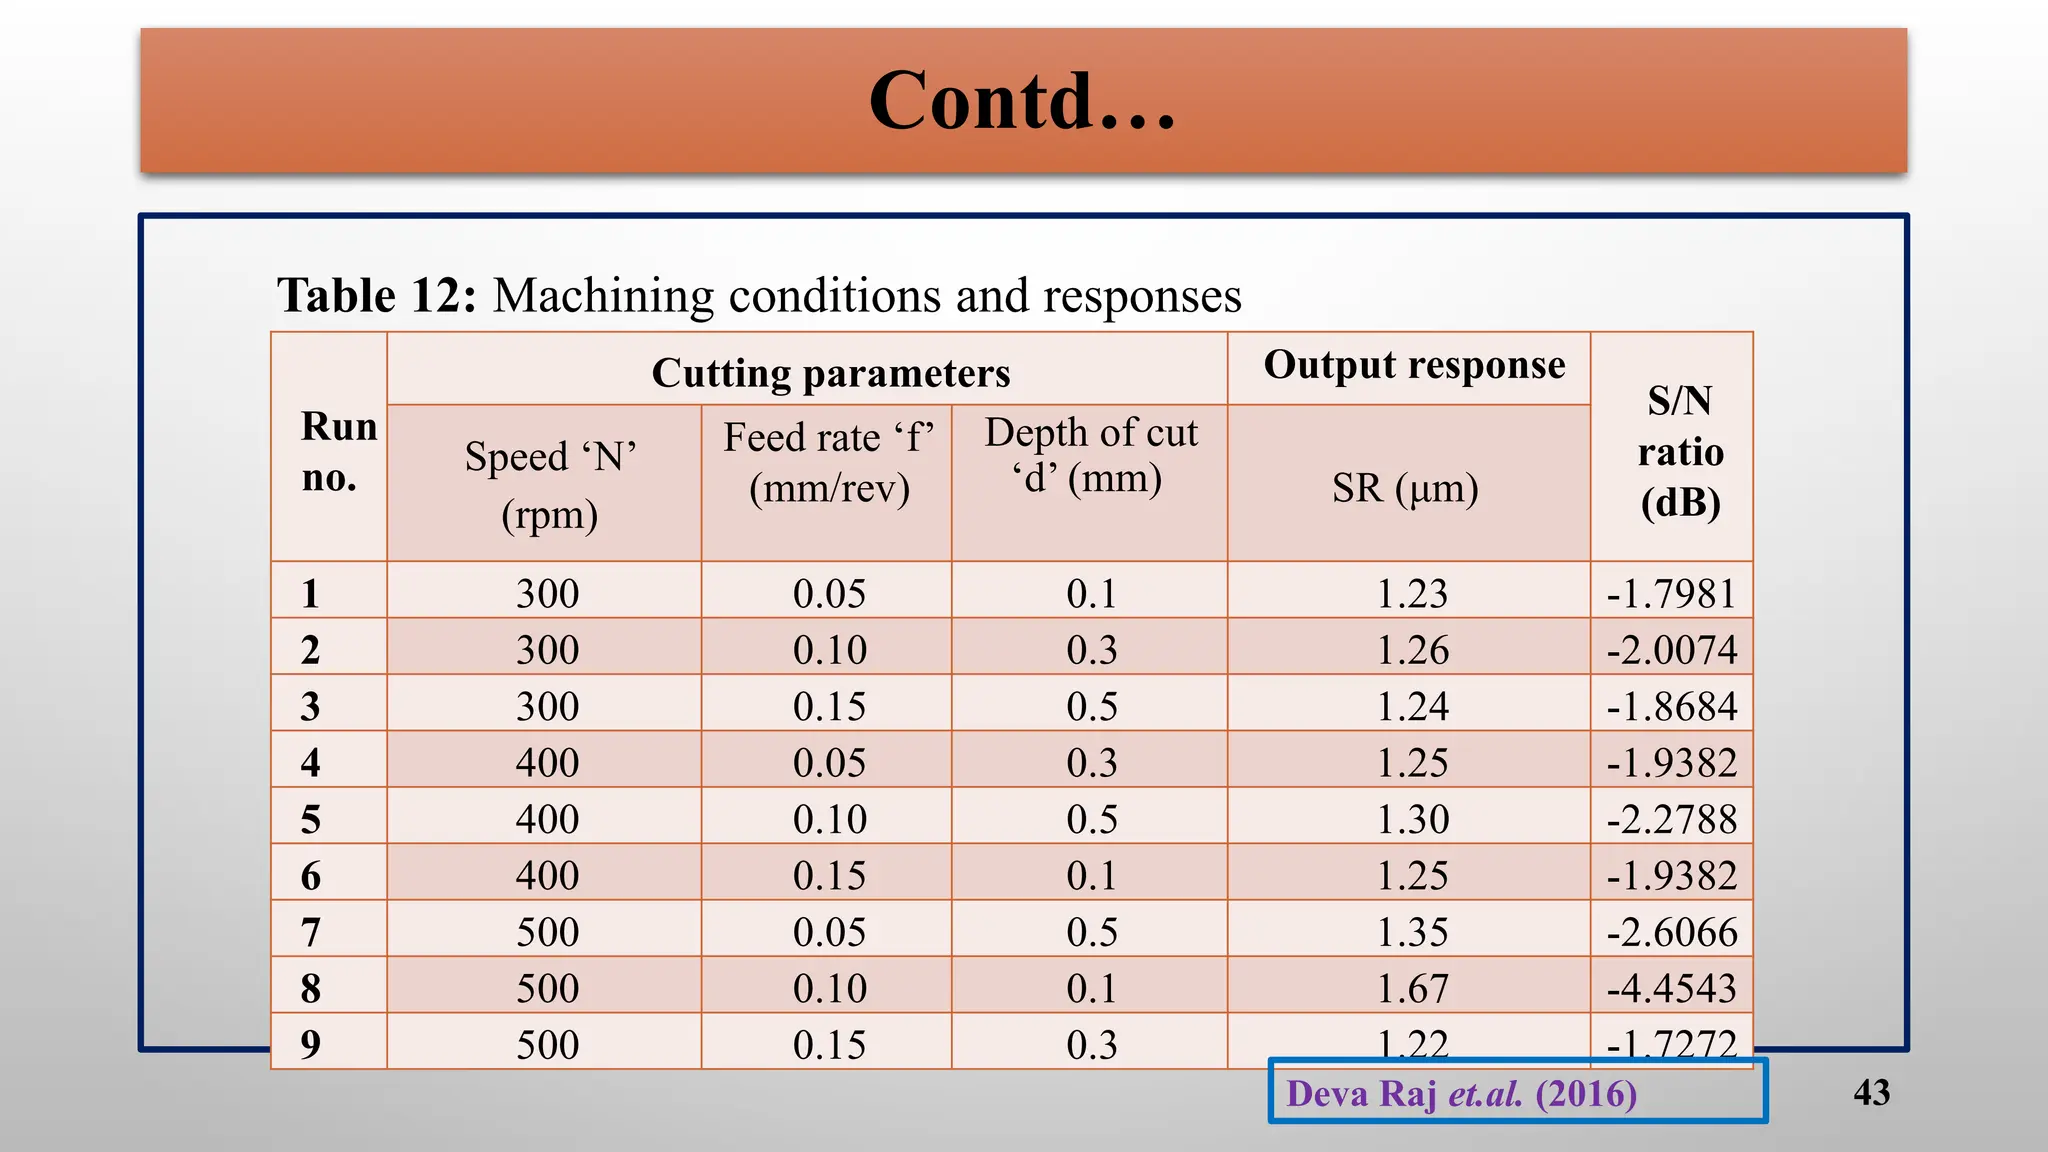
Three experimental factors and three levels for each factor are considered. So,
orthogonal array was taken and the experimental combinations were shown in
Table 11.
39
Deva Raj et.al. (2016)
Contd…
40.
Contd…
40
Levels of the
experimental
factors
Factors(Cutting parameters)
Speed, N (rpm)
Feed rate, f
(mm/rev)
Depth of cut, d
(mm)
1 300 0.05 0.1
2 400 0.10 0.3
3 500 0.15 0.5
Table 10: Experimental factors and their levels
Deva Raj et.al. (2016)
Evaluation of signal-to-noiseratio
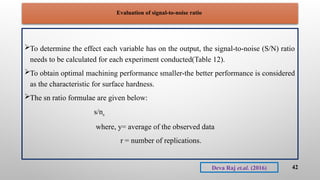
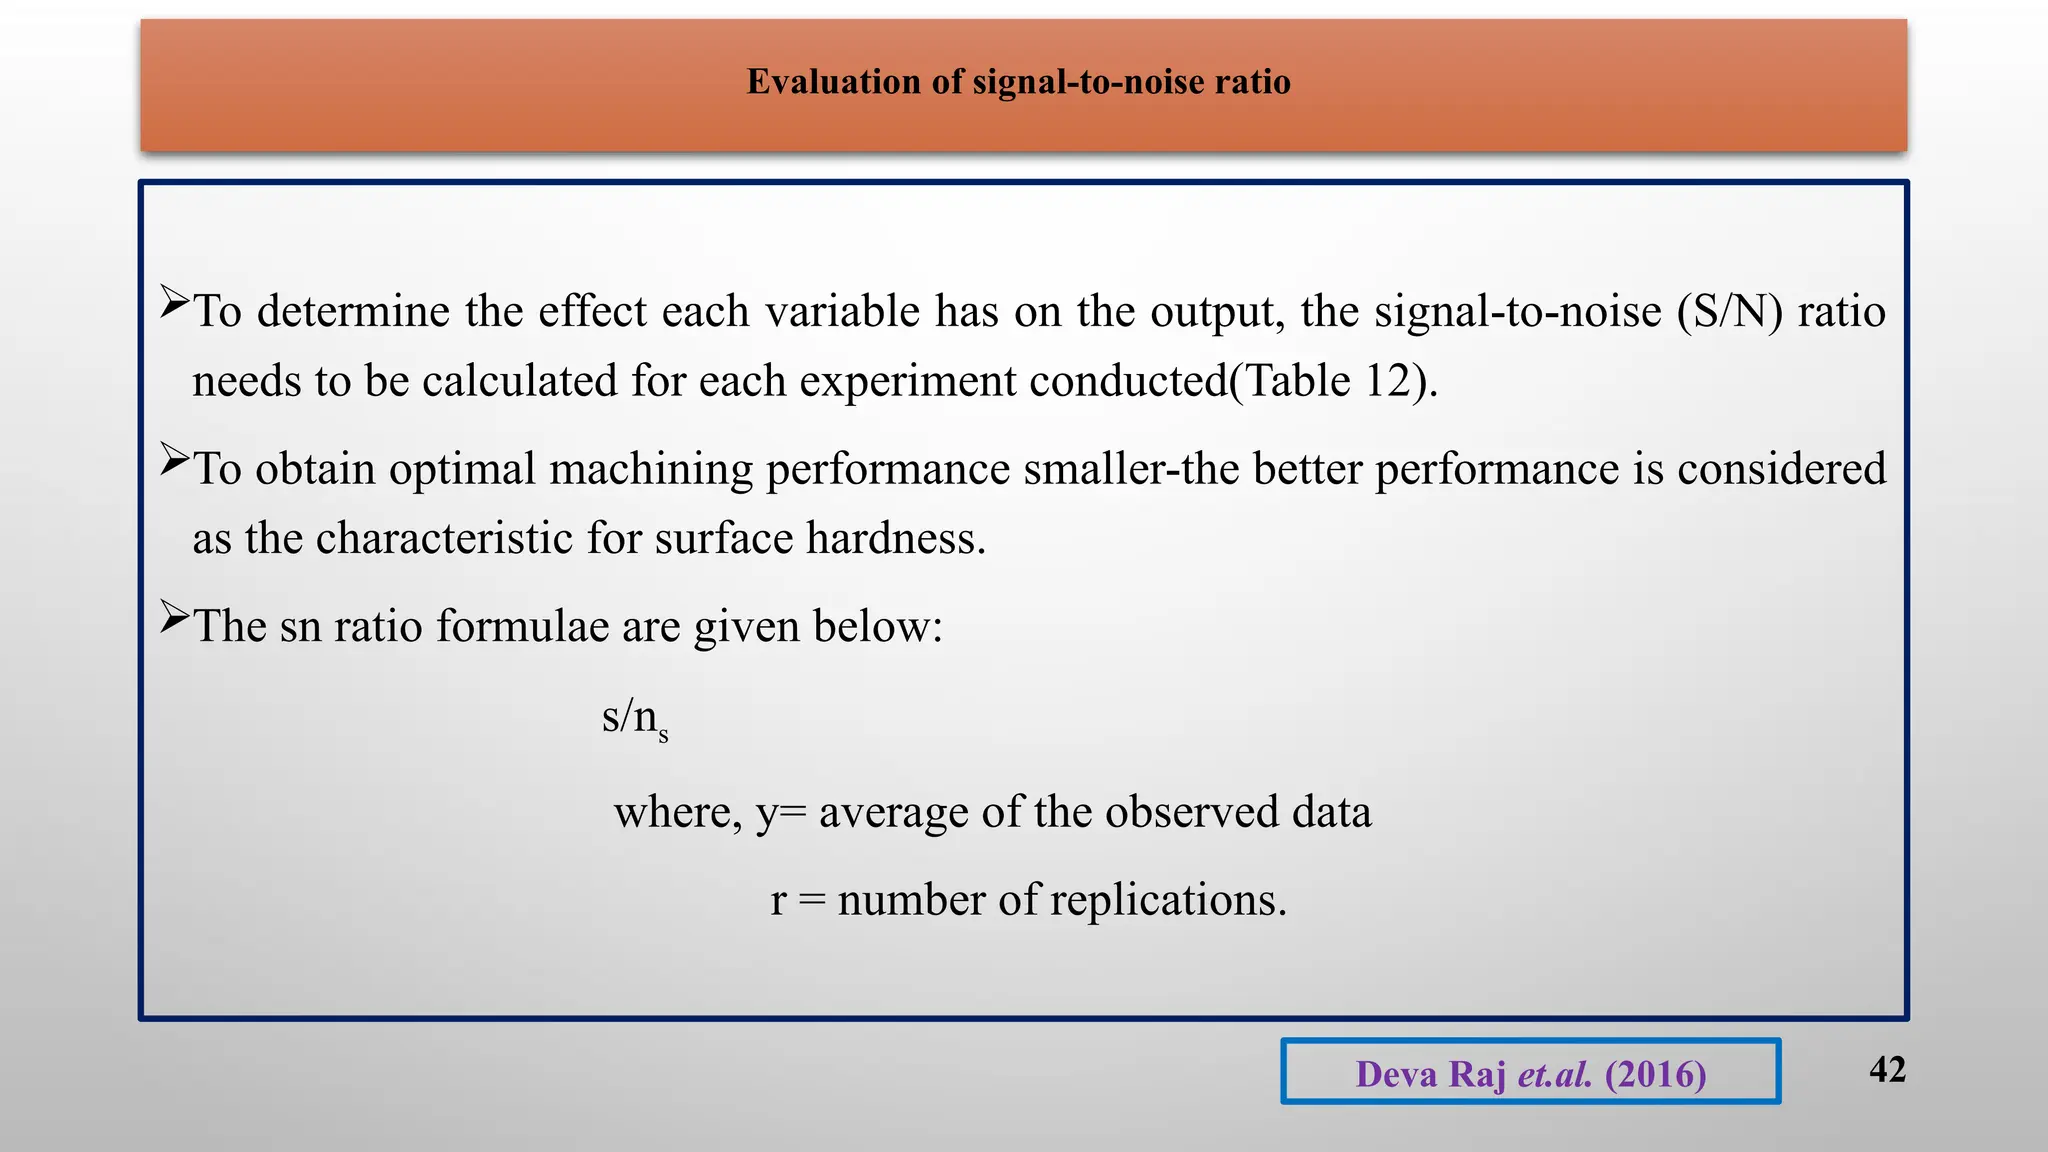
To determine the effect each variable has on the output, the signal-to-noise (S/N) ratio
needs to be calculated for each experiment conducted(Table 12).
To obtain optimal machining performance smaller-the better performance is considered
as the characteristic for surface hardness.
The sn ratio formulae are given below:
s/ns
where, y= average of the observed data
r = number of replications.
42
Deva Raj et.al. (2016)
Contd…
Since the experimentaldesign is orthogonal, it is then possible to separate out the
effect of each cutting parameter at different levels.
44
Levels
Factors
Speed ‘N’
(rpm)
Feed rate ‘f’
(mm/rev)
Depth of cut ‘d’
(mm)
1 -1.8913 -2.1143 -2.7302
2 -2.0517 -2.9135 -1.8909
3 -2.9294 -1.8446 -2.2513
Table 13: Response table for S/N ratios
Deva Raj et.al. (2016)
45.
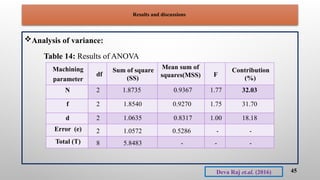
Results and discussions
Analysisof variance:
Table 14: Results of ANOVA
45
Machining
parameter
df
Sum of square
(SS)
Mean sum of
squares(MSS) F
Contribution
(%)
N 2 1.8735 0.9367 1.77 32.03
f 2 1.8540 0.9270 1.75 31.70
d 2 1.0635 0.8317 1.00 18.18
Error (e) 2 1.0572 0.5286 - -
Total (T) 8 5.8483 - - -
Deva Raj et.al. (2016)
46.
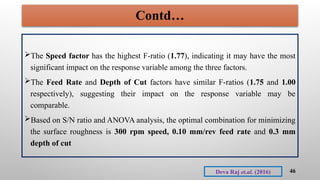
Contd…
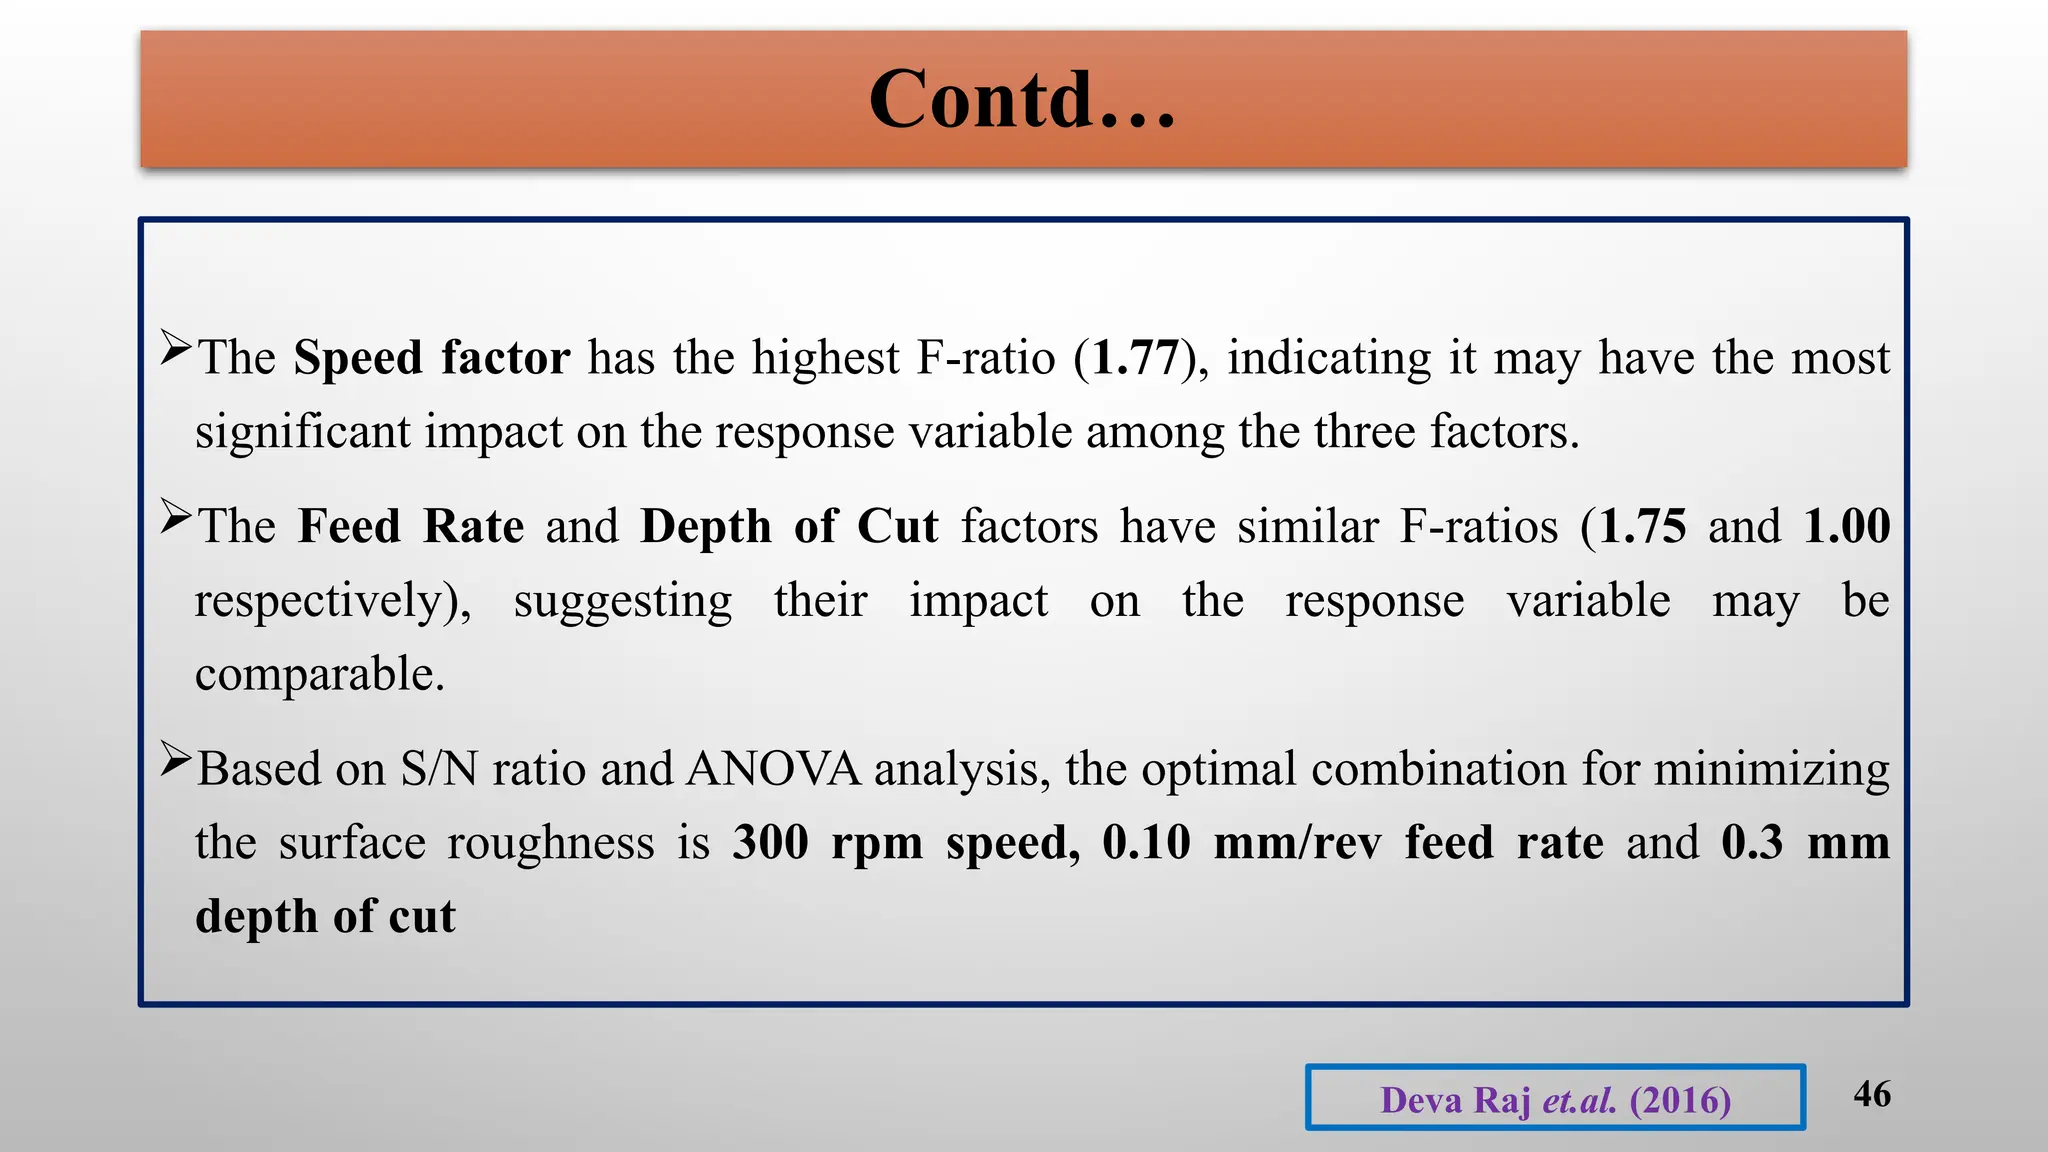
The Speed factorhas the highest F-ratio (1.77), indicating it may have the most
significant impact on the response variable among the three factors.
The Feed Rate and Depth of Cut factors have similar F-ratios (1.75 and 1.00
respectively), suggesting their impact on the response variable may be
comparable.
Based on S/N ratio and ANOVA analysis, the optimal combination for minimizing
the surface roughness is 300 rpm speed, 0.10 mm/rev feed rate and 0.3 mm
depth of cut
46
Deva Raj et.al. (2016)
47.
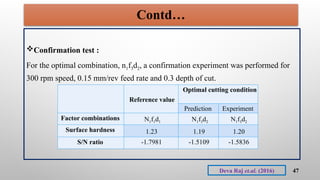
Contd…
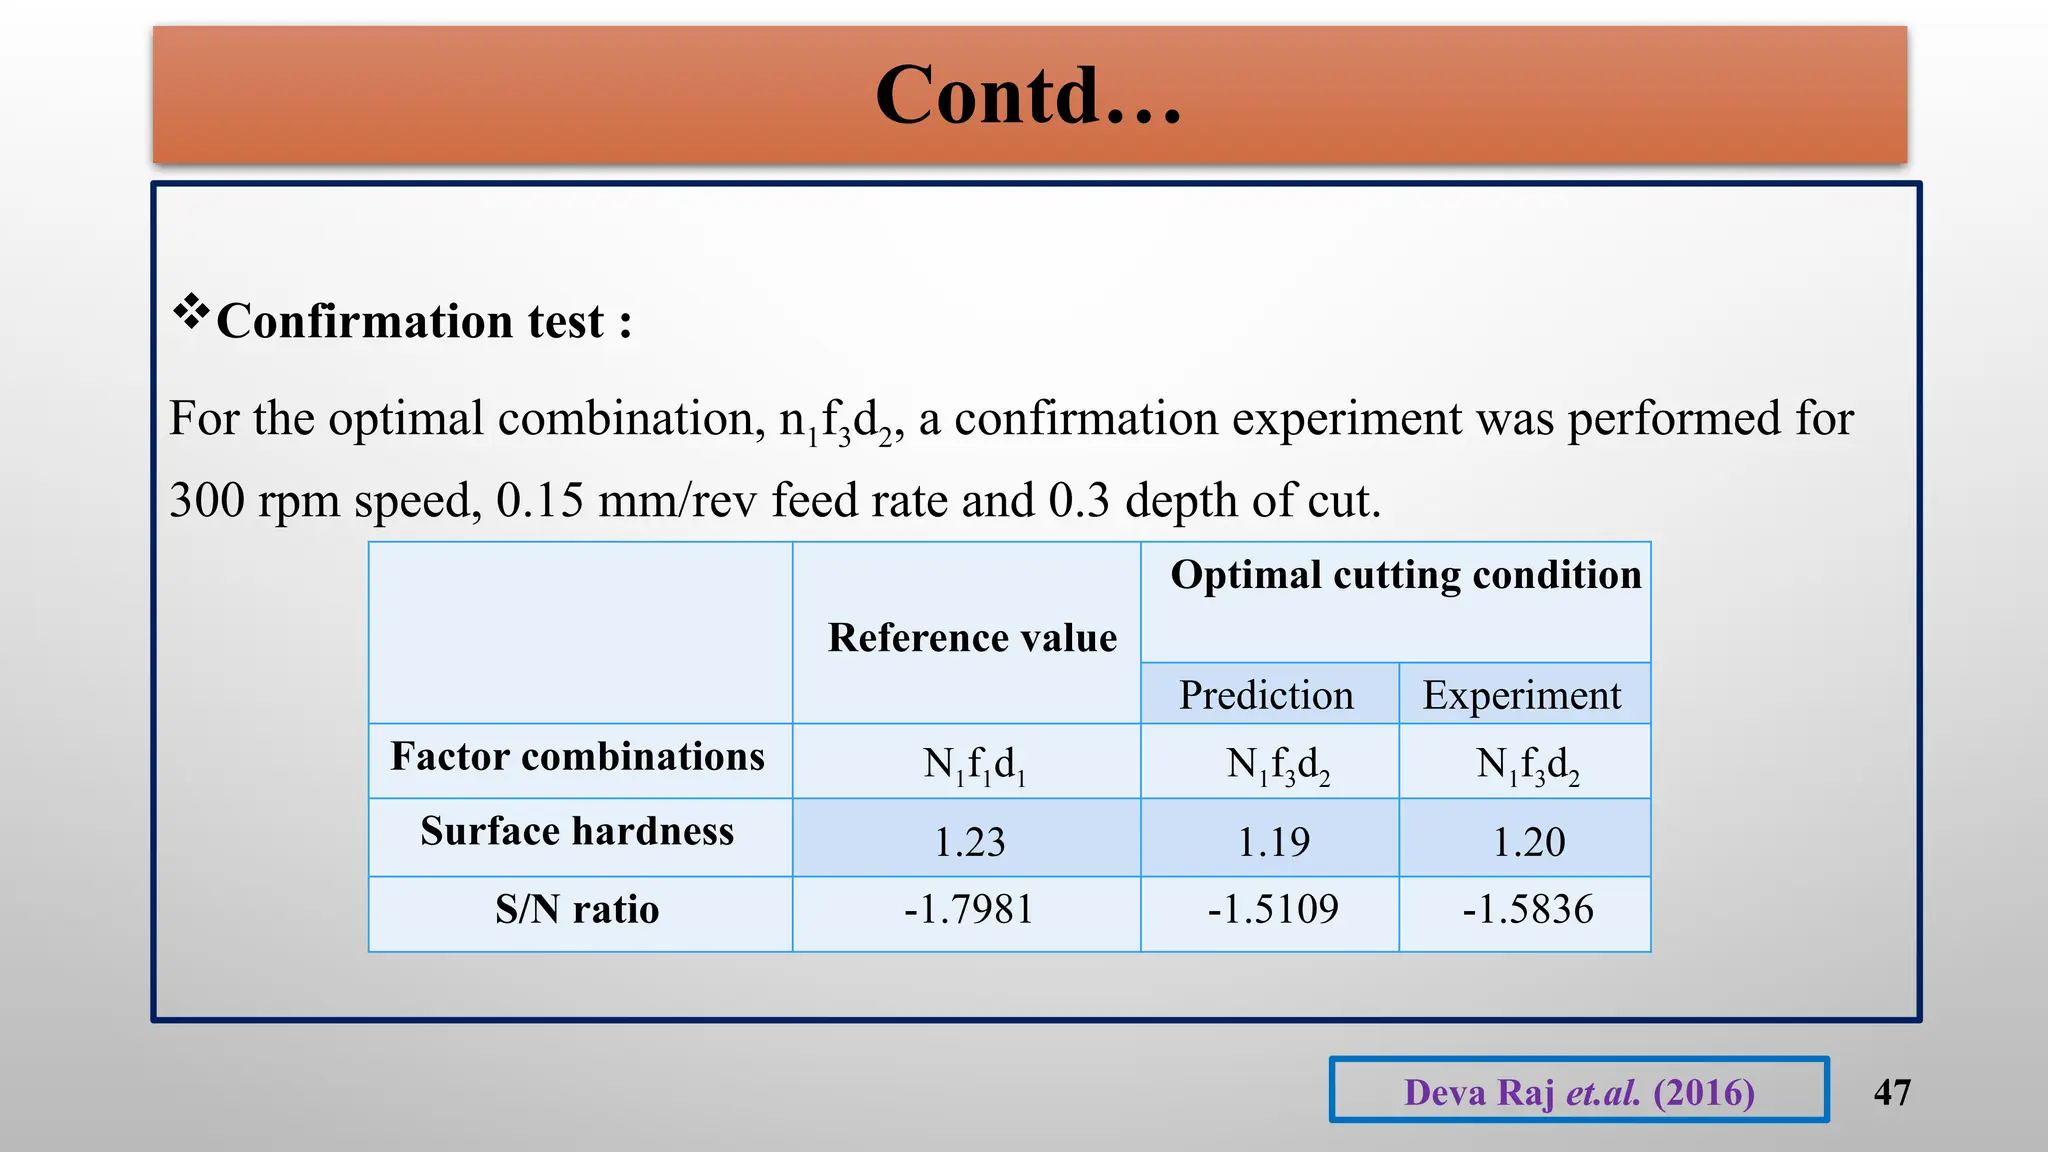
Confirmation test :
Forthe optimal combination, n1f3d2, a confirmation experiment was performed for
300 rpm speed, 0.15 mm/rev feed rate and 0.3 depth of cut.
TABLE 4: RESULTS OF CONFIRMATION TEST
47
Reference value
Optimal cutting condition
Prediction Experiment
Factor combinations N1f1d1 N1f3d2 N1f3d2
Surface hardness 1.23 1.19 1.20
S/N ratio -1.7981 -1.5109 -1.5836
Deva Raj et.al. (2016)
48.
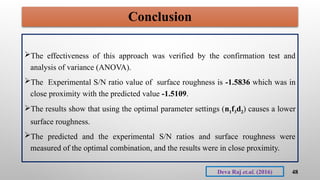
Conclusion
The effectiveness ofthis approach was verified by the confirmation test and
analysis of variance (ANOVA).
The Experimental S/N ratio value of surface roughness is -1.5836 which was in
close proximity with the predicted value -1.5109.
The results show that using the optimal parameter settings (n1f3d2) causes a lower
surface roughness.
The predicted and the experimental S/N ratios and surface roughness were
measured of the optimal combination, and the results were in close proximity.
48
Deva Raj et.al. (2016)
49.
Summary
In the industrialcontext as the number of factor increases, factors combination
increases there by increasing the heterogeneity, this reduces the precision of the
experiment.
By using this method we can considerably reduce the number of factor
combination in the experiment thereby increase the precision.
The Taguchi design is a powerful tool for improving quality and efficiency in
industrial processes.
Its focus on robustness and simplicity makes it particularly useful for practical
applications where consistent performance and cost savings are critical.
49
50.
References
DEVA RAJ, SRINIVAS,C., MASTAN RAO, P. AND SUNEEL, D., 2016, Taguchi
design optimization of cutting parameters for surface roughness in turning
Inconel. Int. Res. J. Eng. Tech., 3(5):2556-2560.
KRISHNAIAH, K. AND SHAHABUDEEN, P., 2012, Applied Design of
Experiments and Taguchi Methods. PHI learning private limited, New Delhi,
pp.:198-233.
SHYAM, K.K. AND RAJESHWAR, S., 2012, An overview on Taguchi method.
Int. J. Eng. Math. Sci., 1:11-18.
50
51.
Contd…
SHRADDHA GAONKAR, NIMISHAKARANJAVKAR AND SHANKAR KADAM,
2016, Taguchi method. Int. J. Sci. Res. Sci. Eng. Technol., 2(2):842-845.
YALDAGARD., MORTAZAVI AND TABATABAIE., 2008, Applications of ultrasonic
waves as a priming techniques for accelerating and enhancing the germination of
barley seed optimization of method by Taguchi approach., J. Inst. Brew., 114(1):14-
21.
YANG, W. H. AND TARNG, Y. S., 1998, Design optimization of cutting parameters
for turning operations based on the Taguchi method. J. Materials processing tech.,
84:122-129.
51