Download to read offline

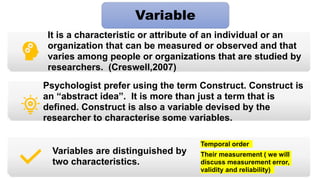

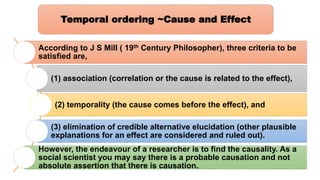
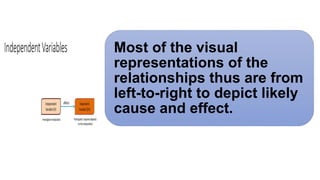

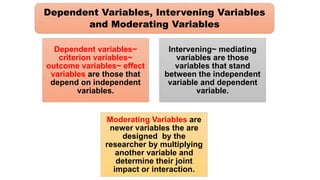
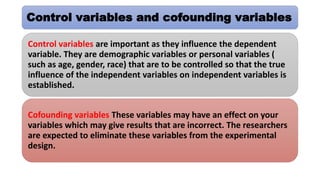
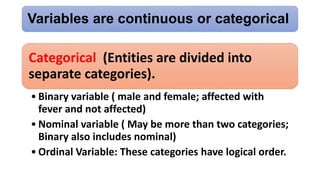
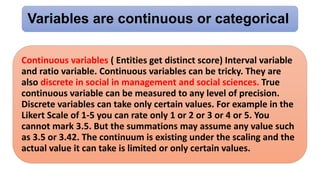
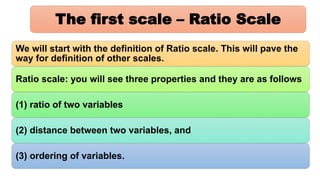


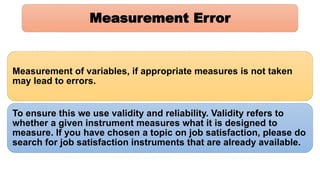


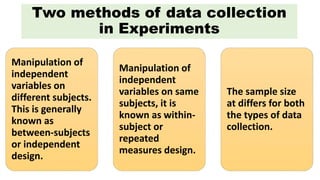

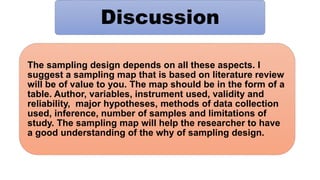
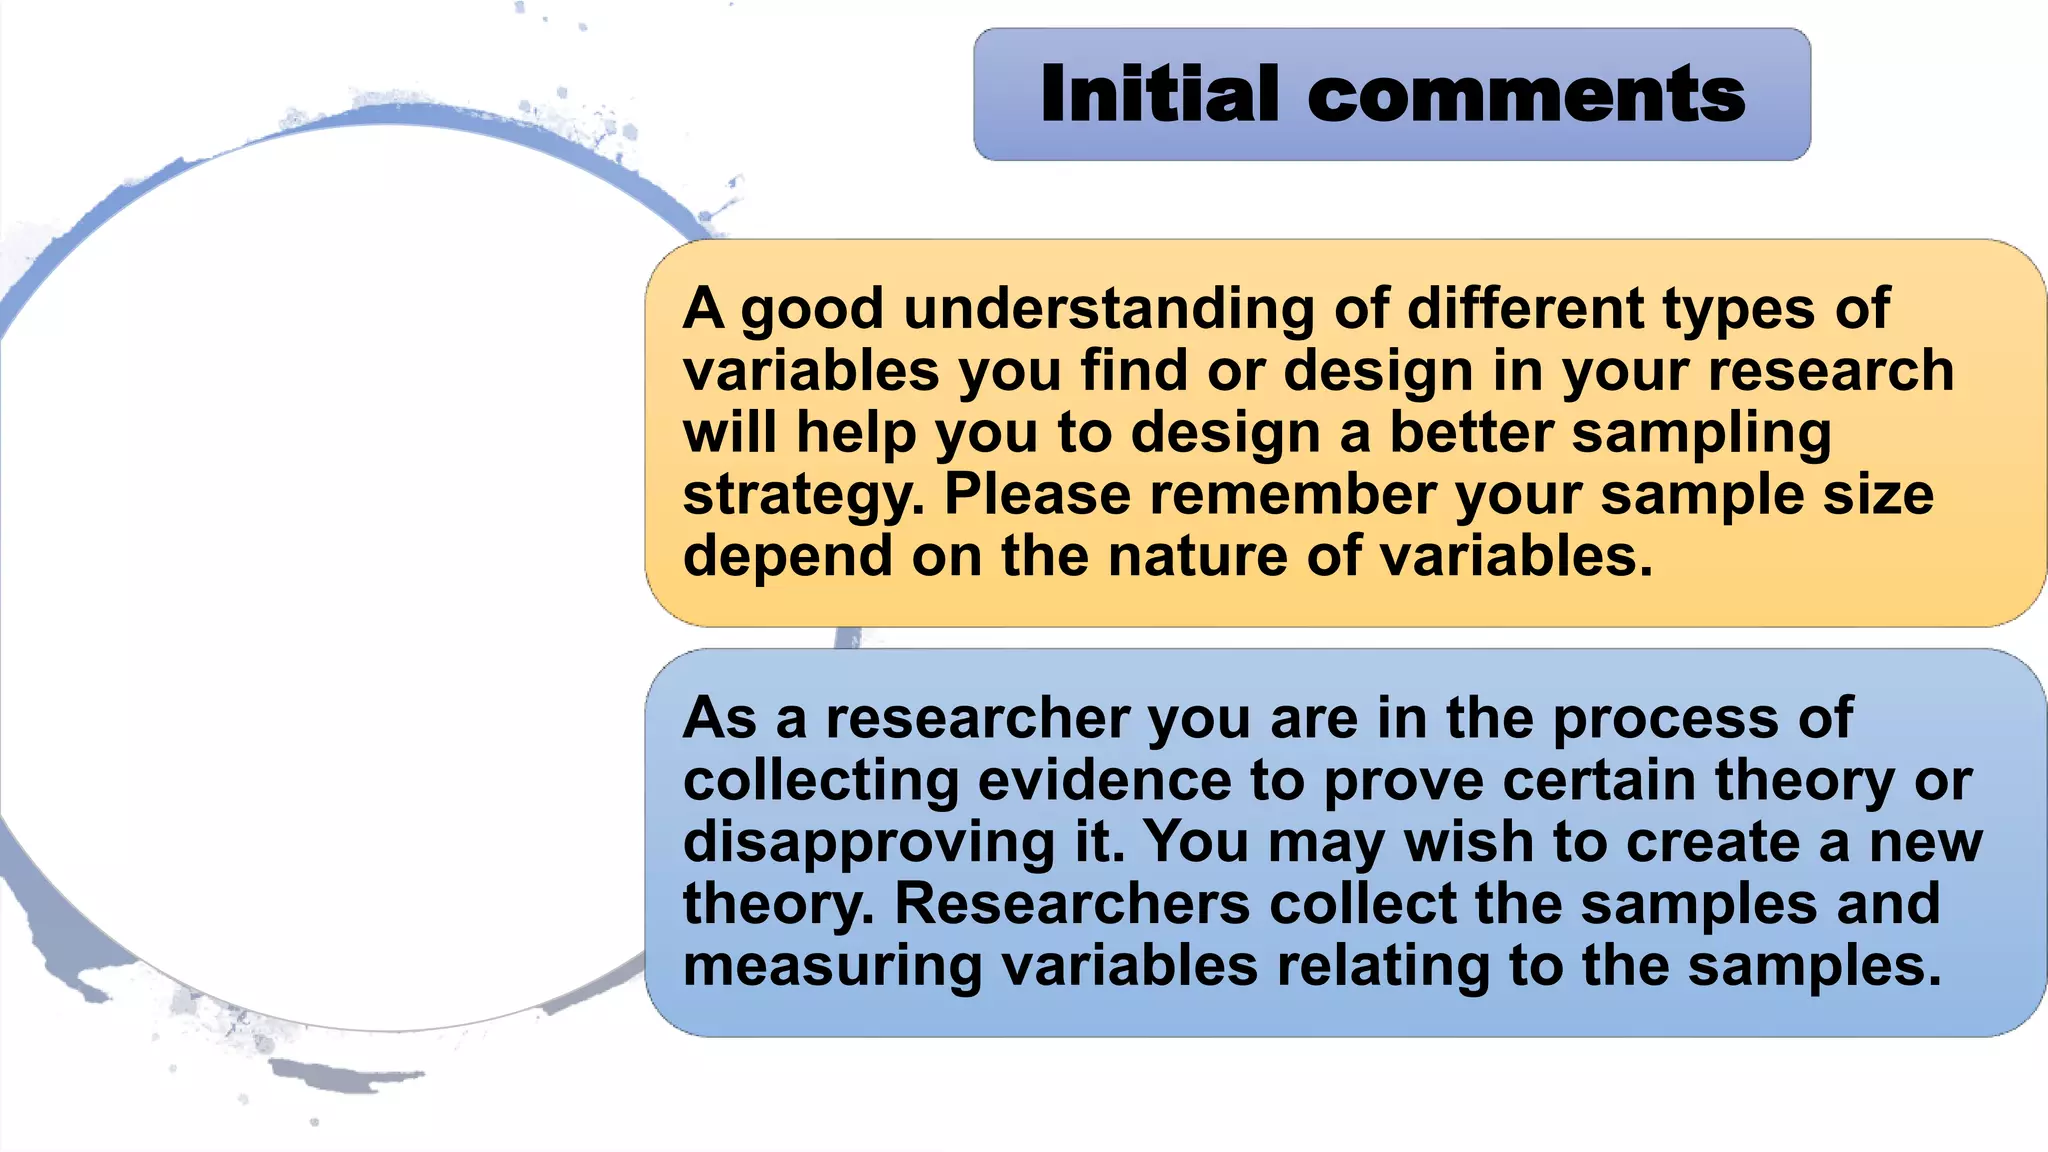
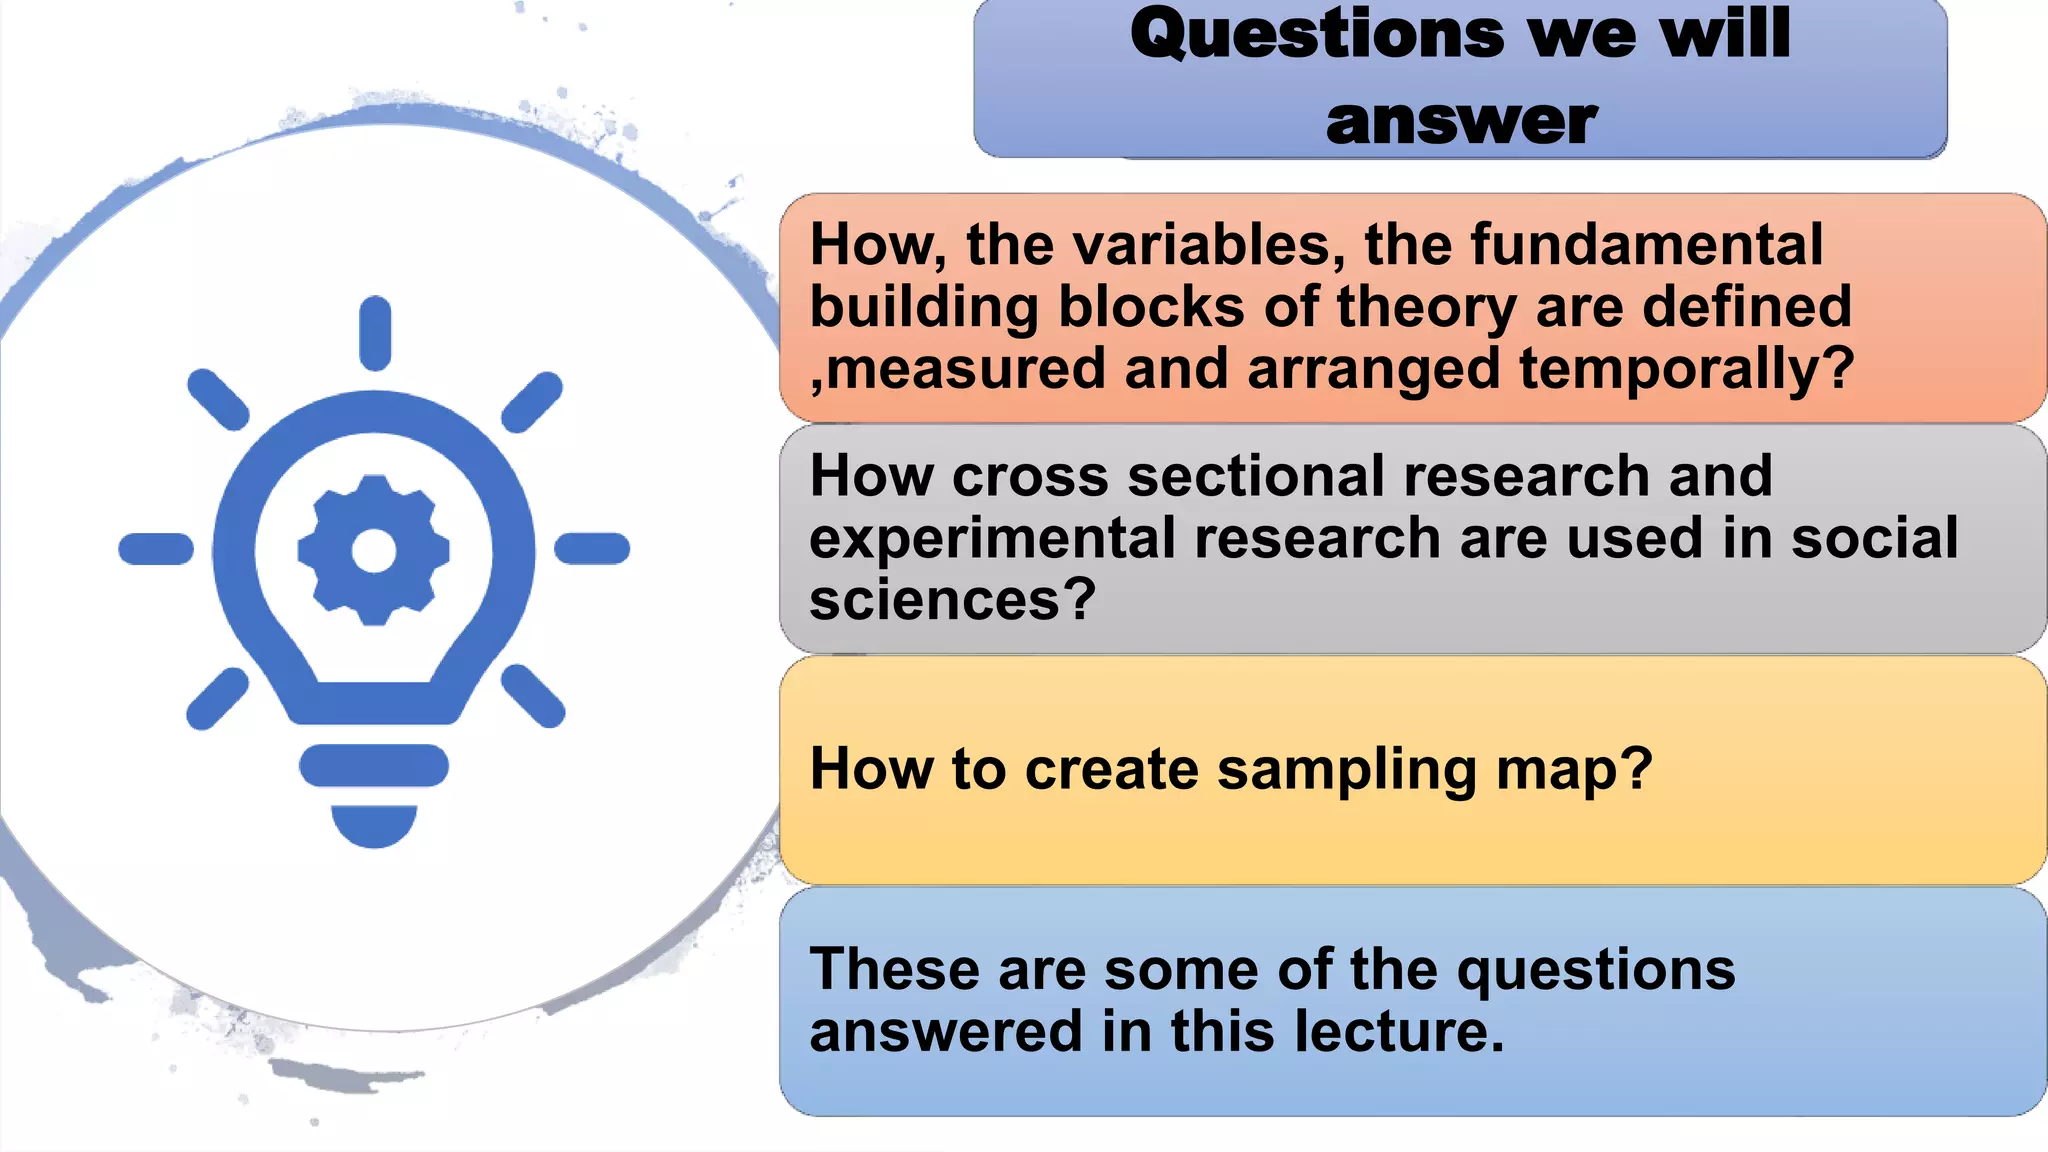
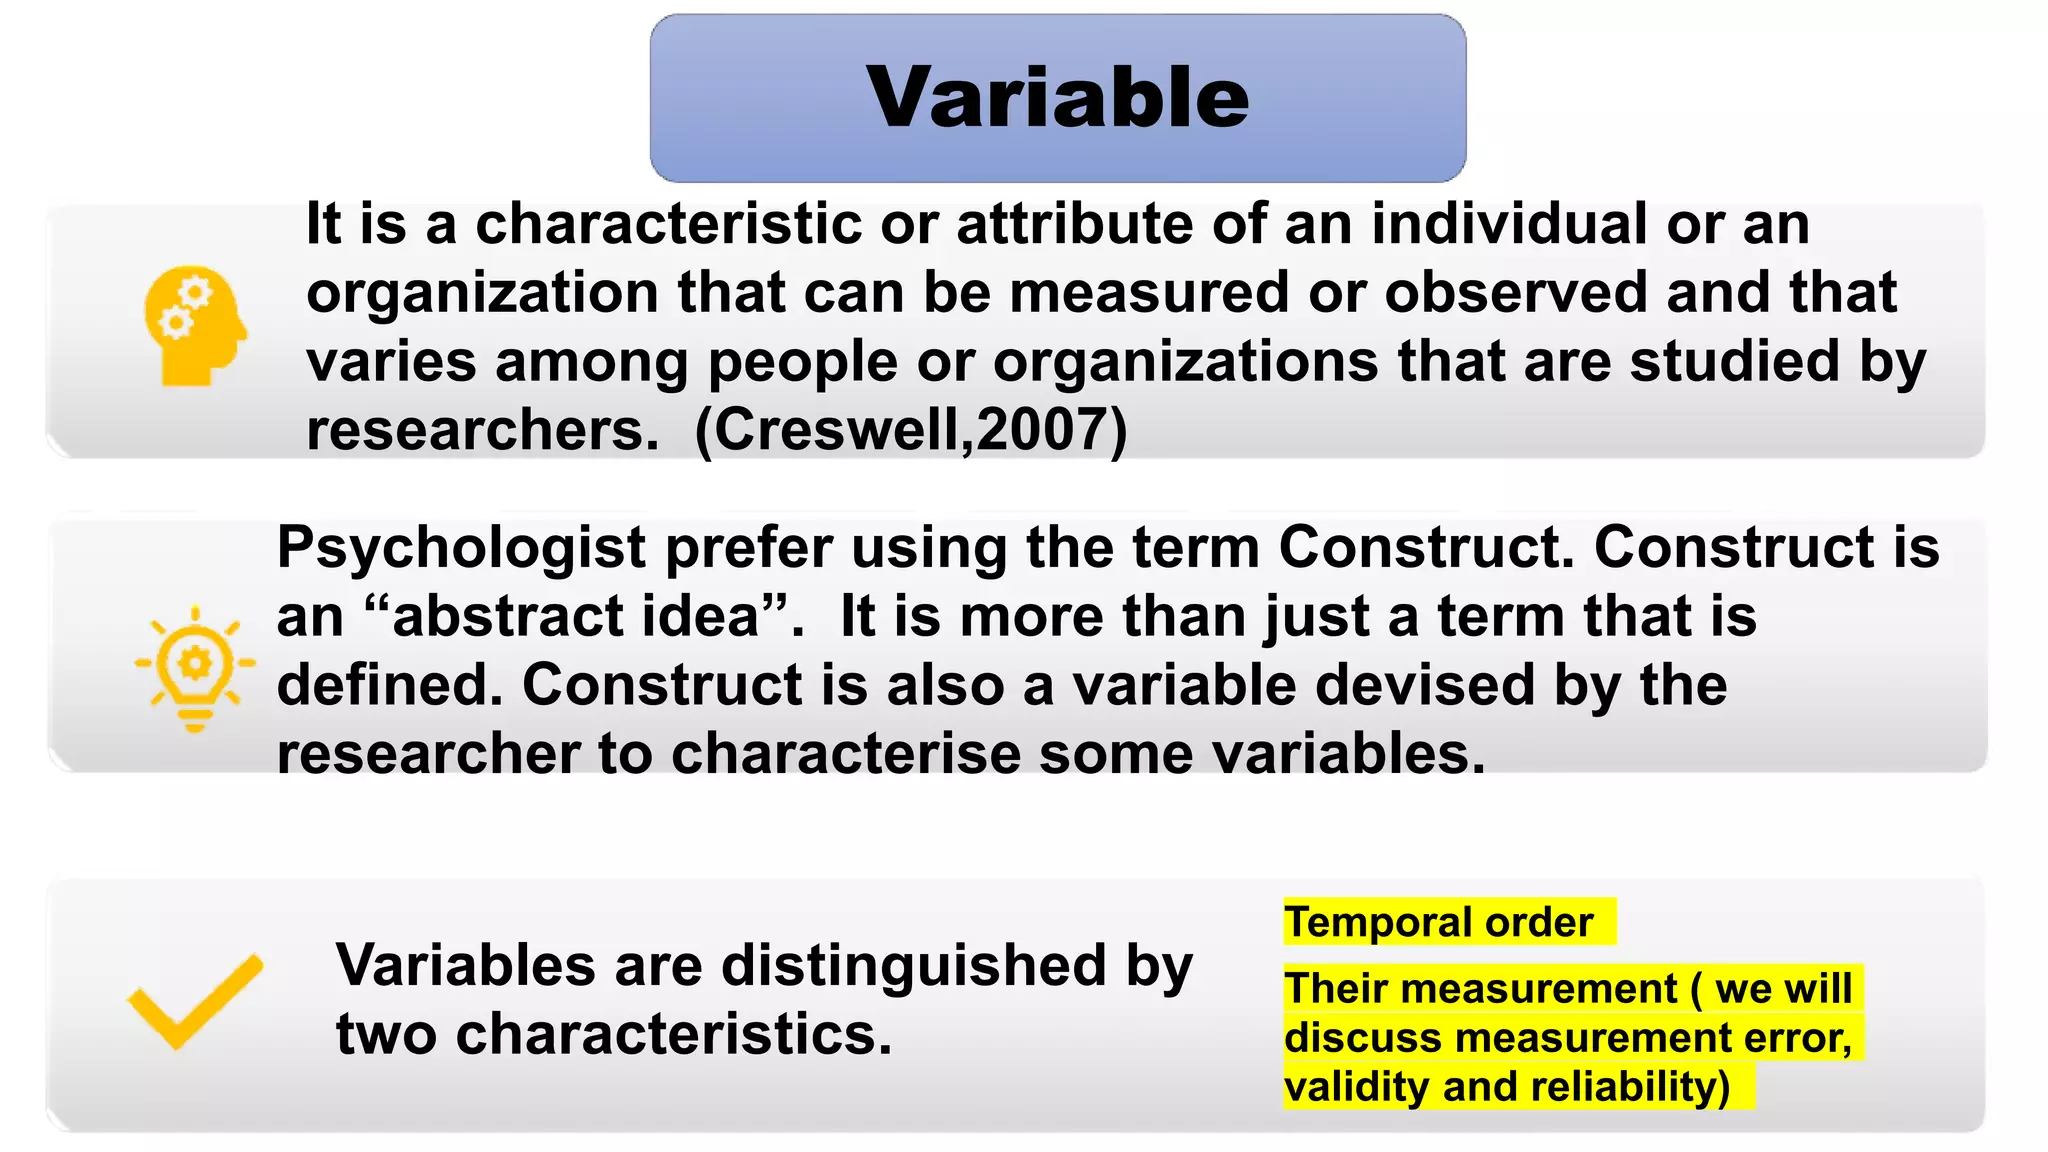
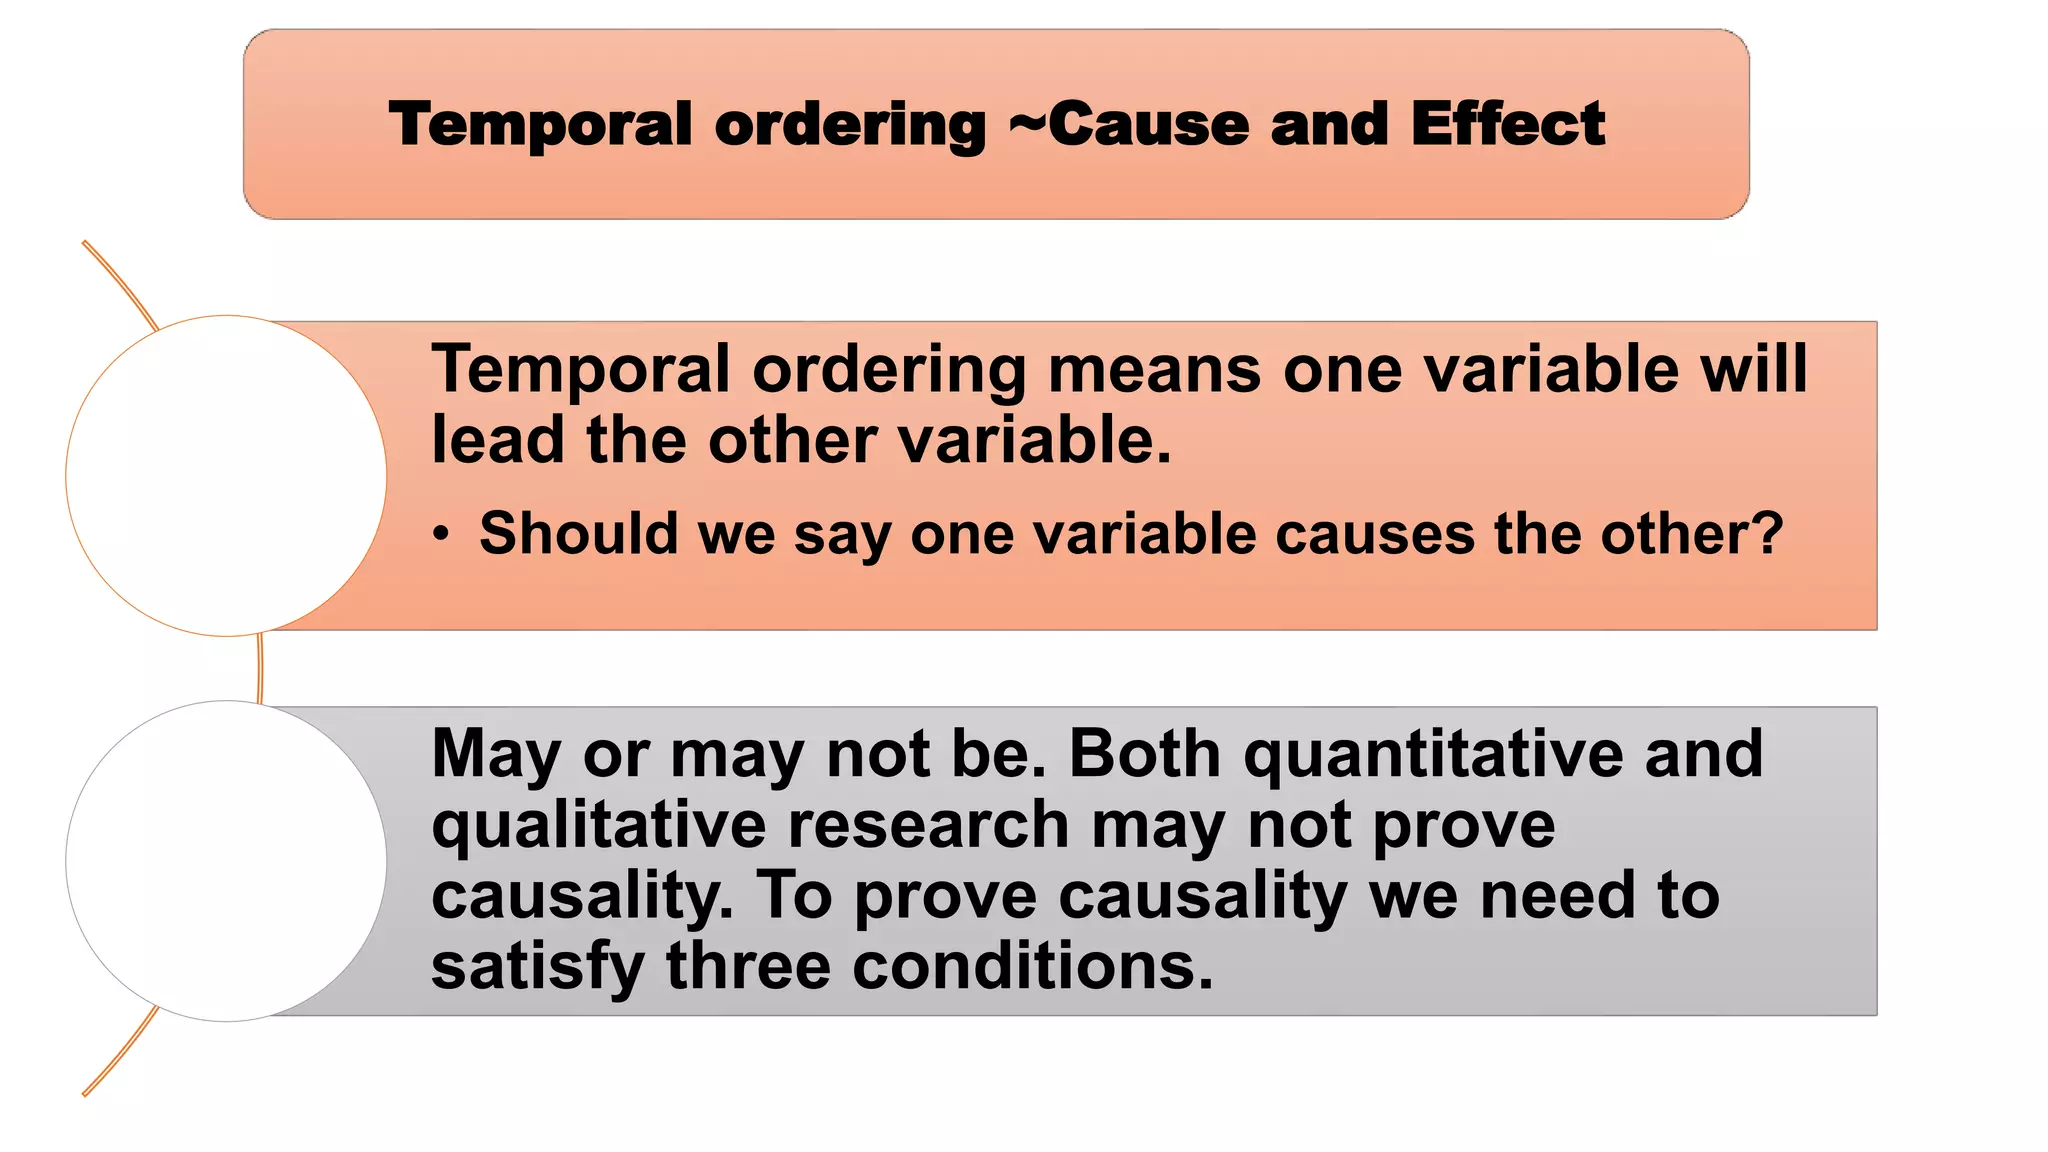


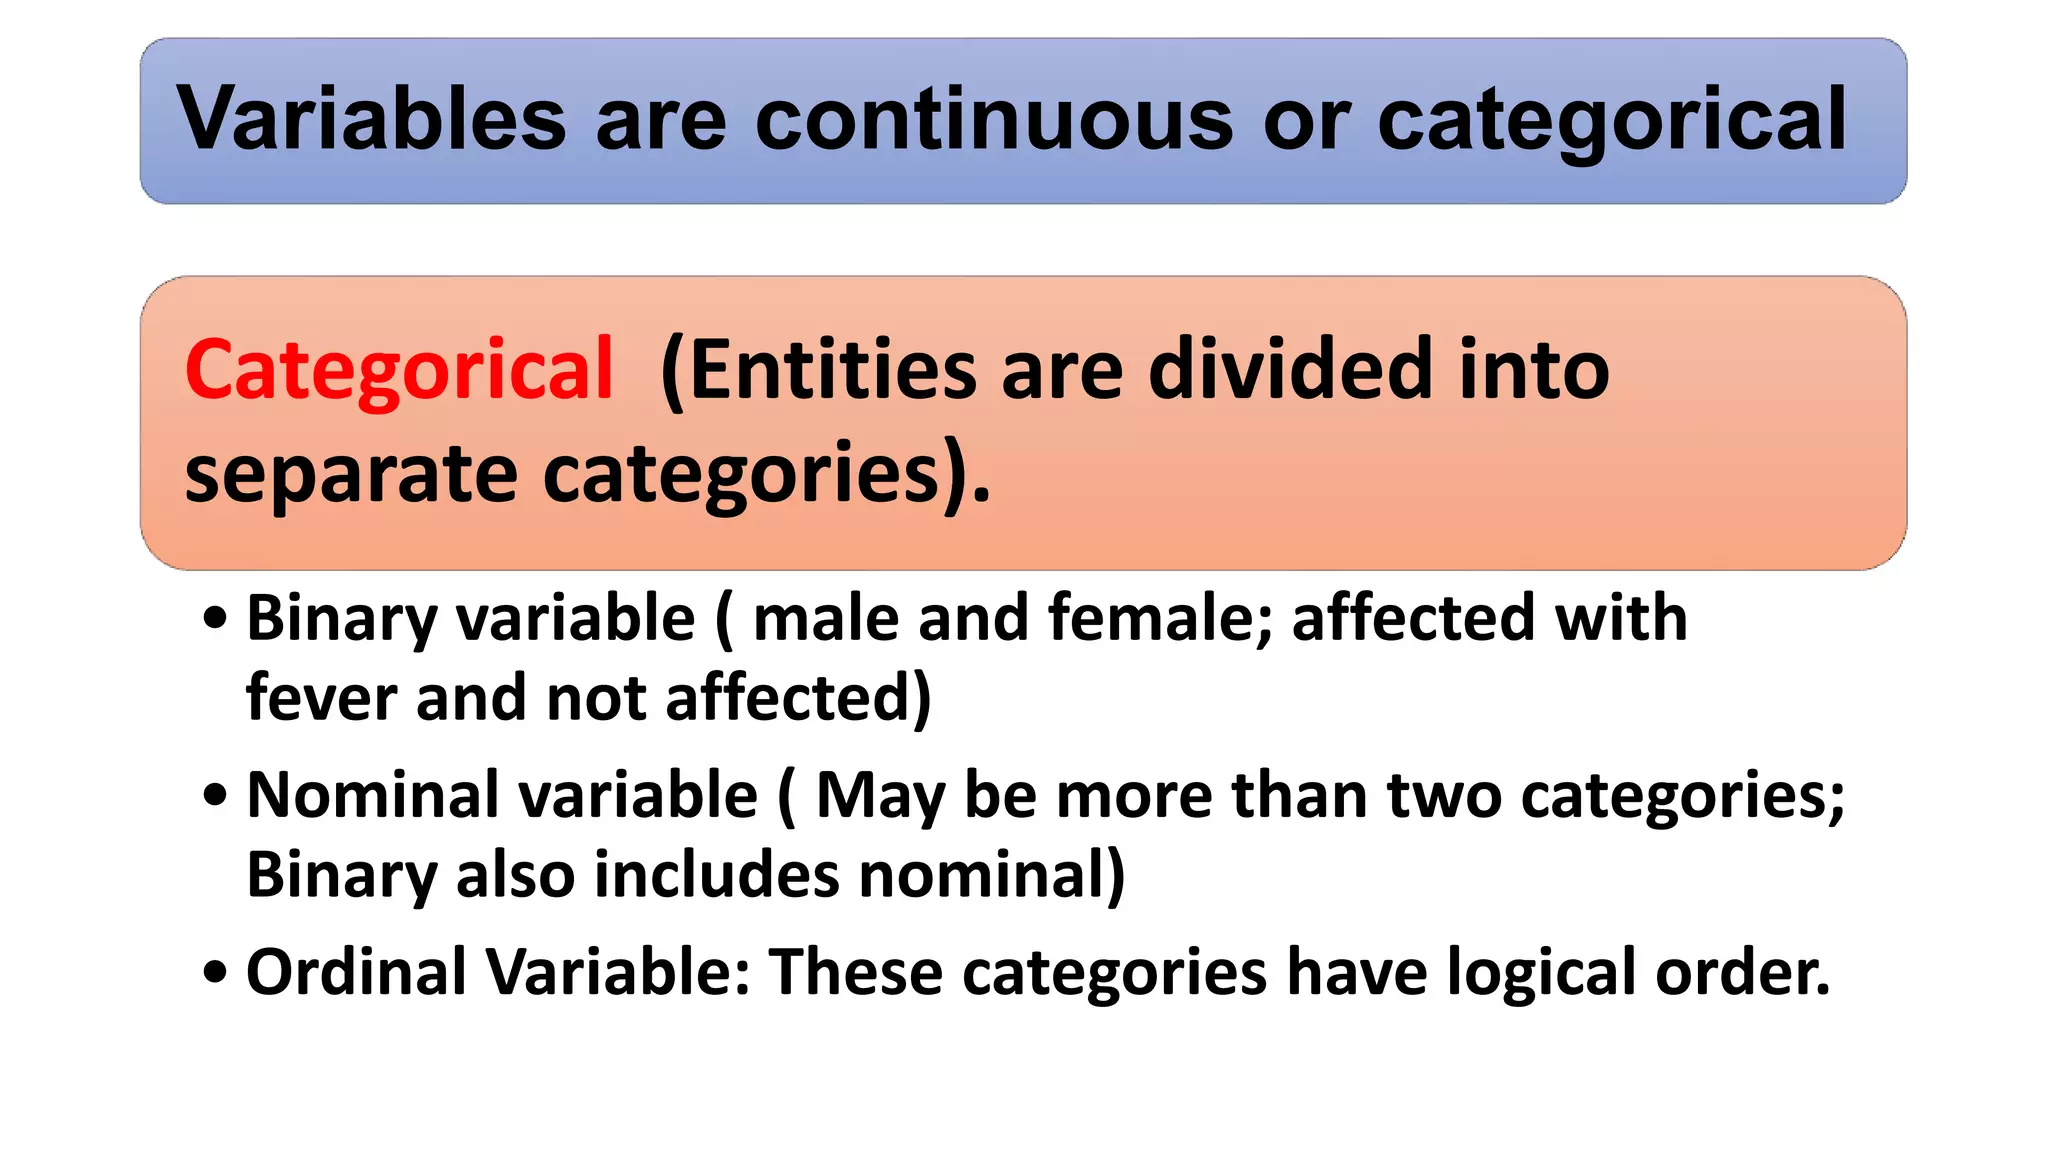
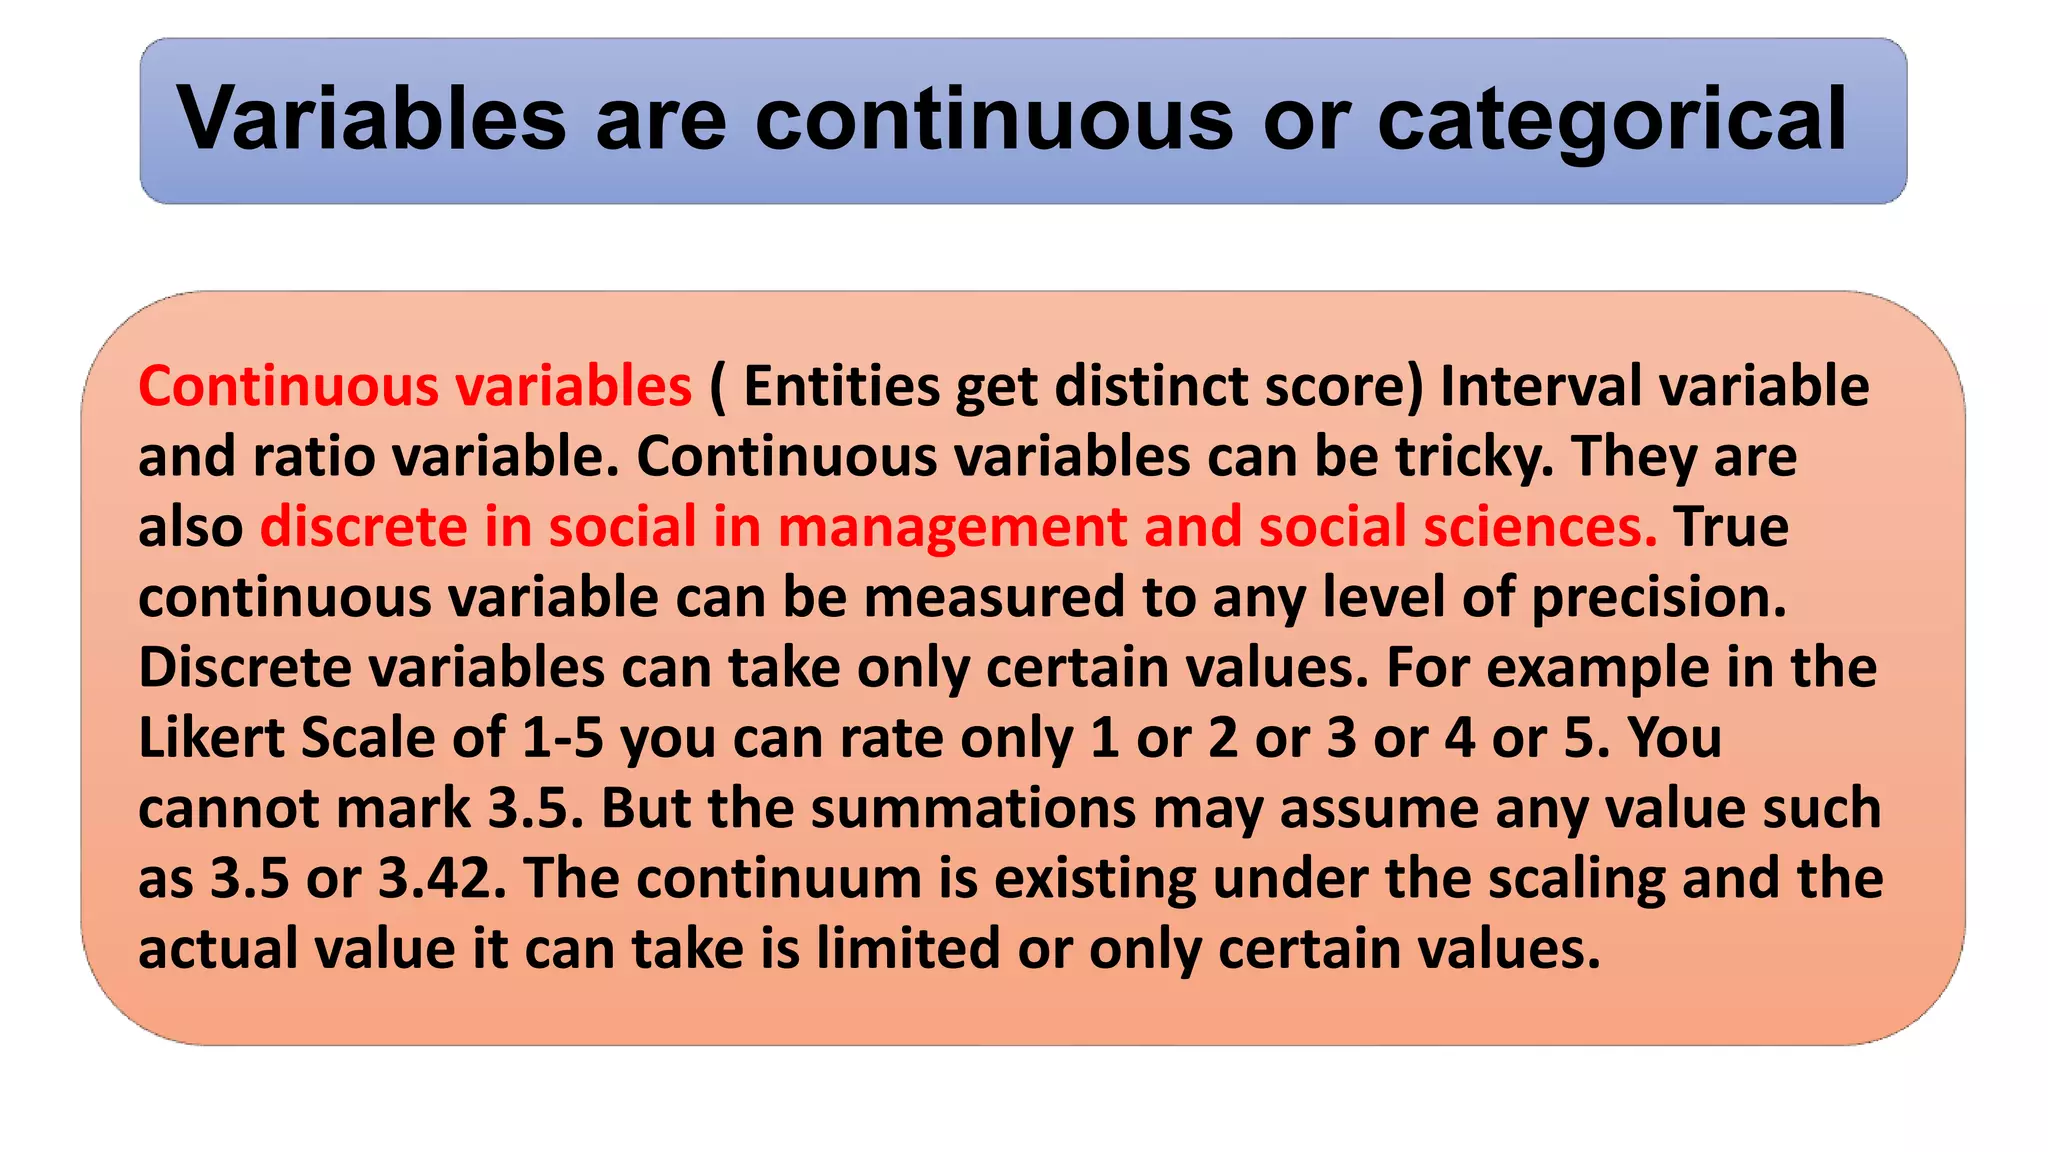
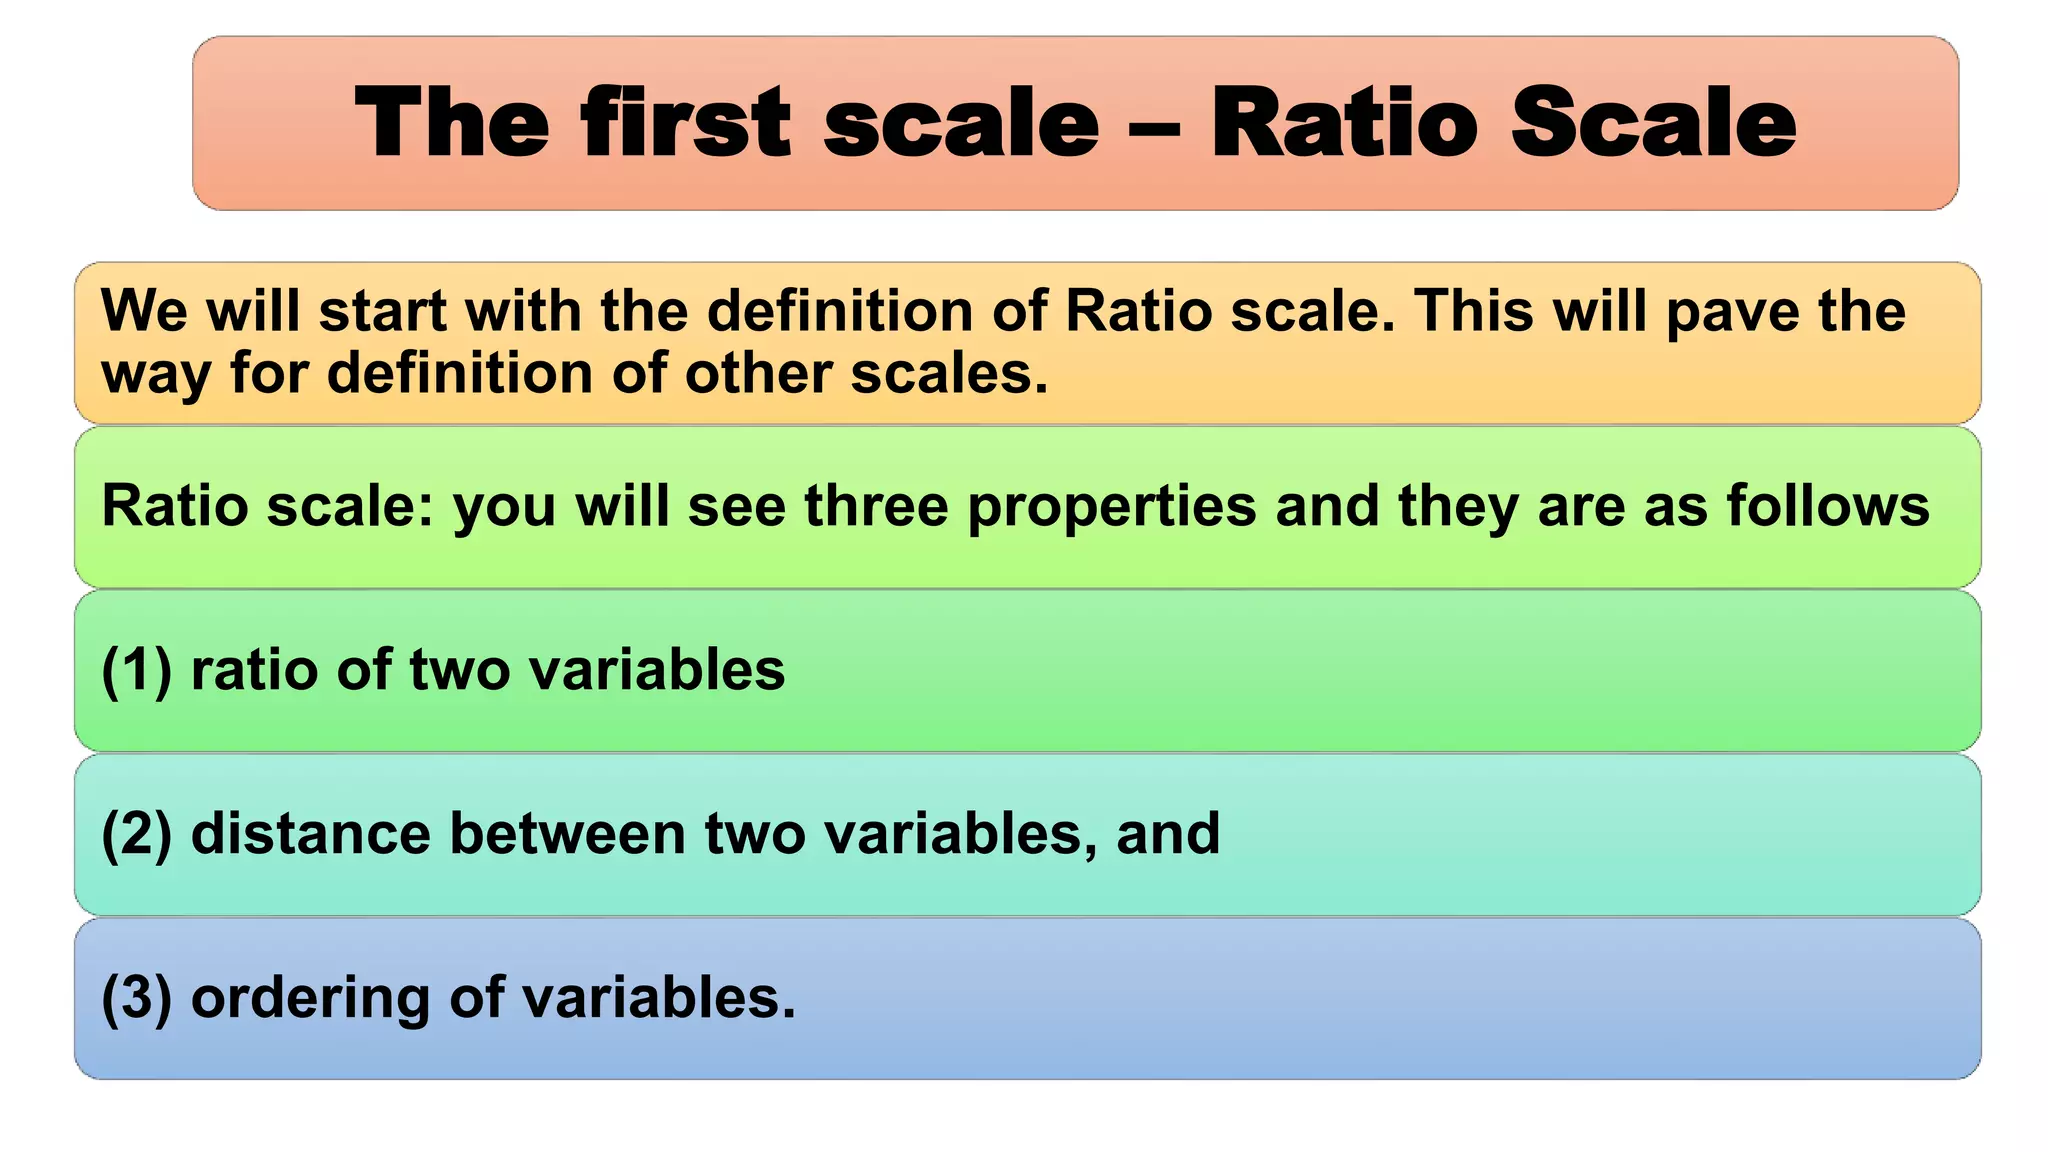
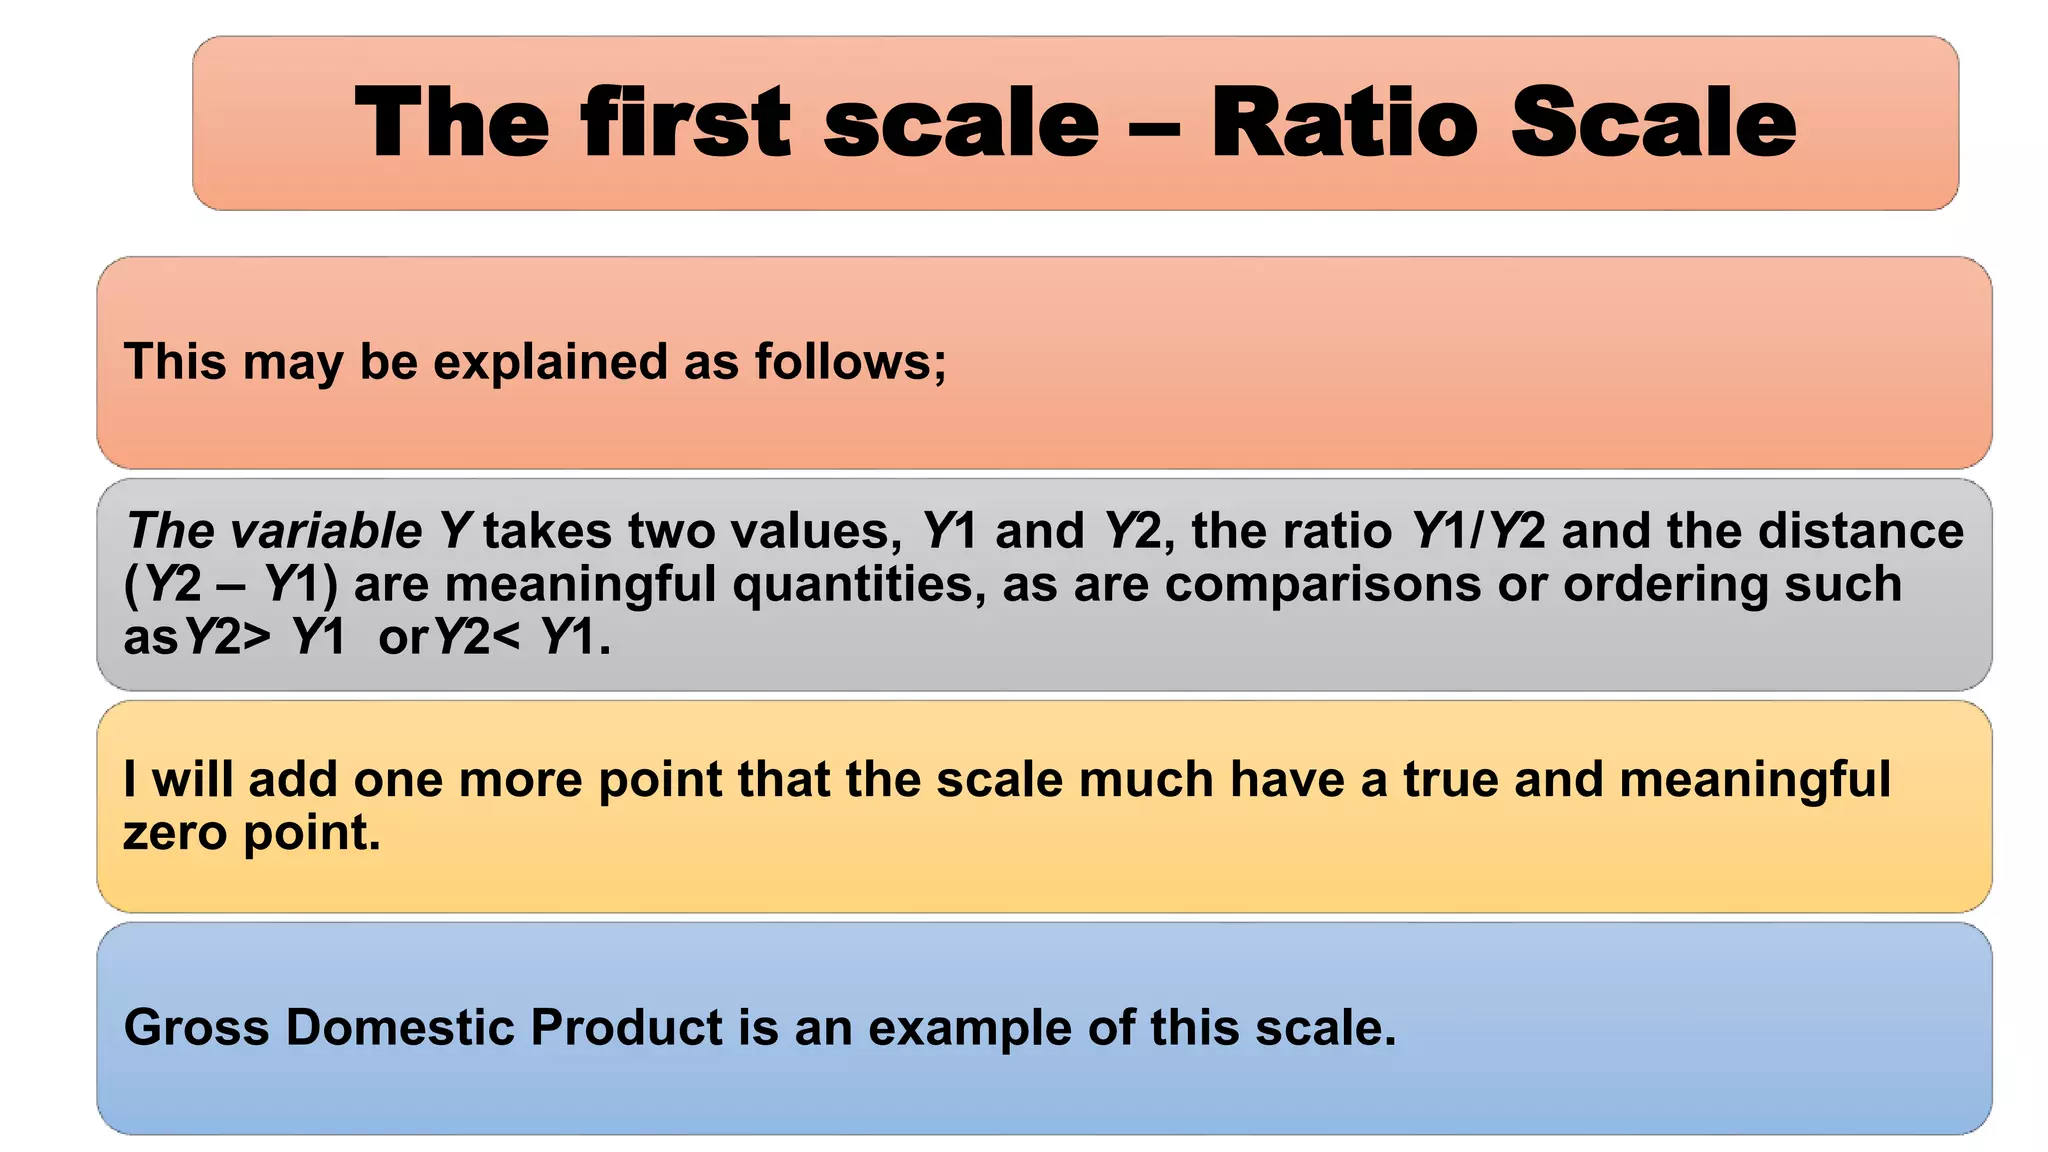
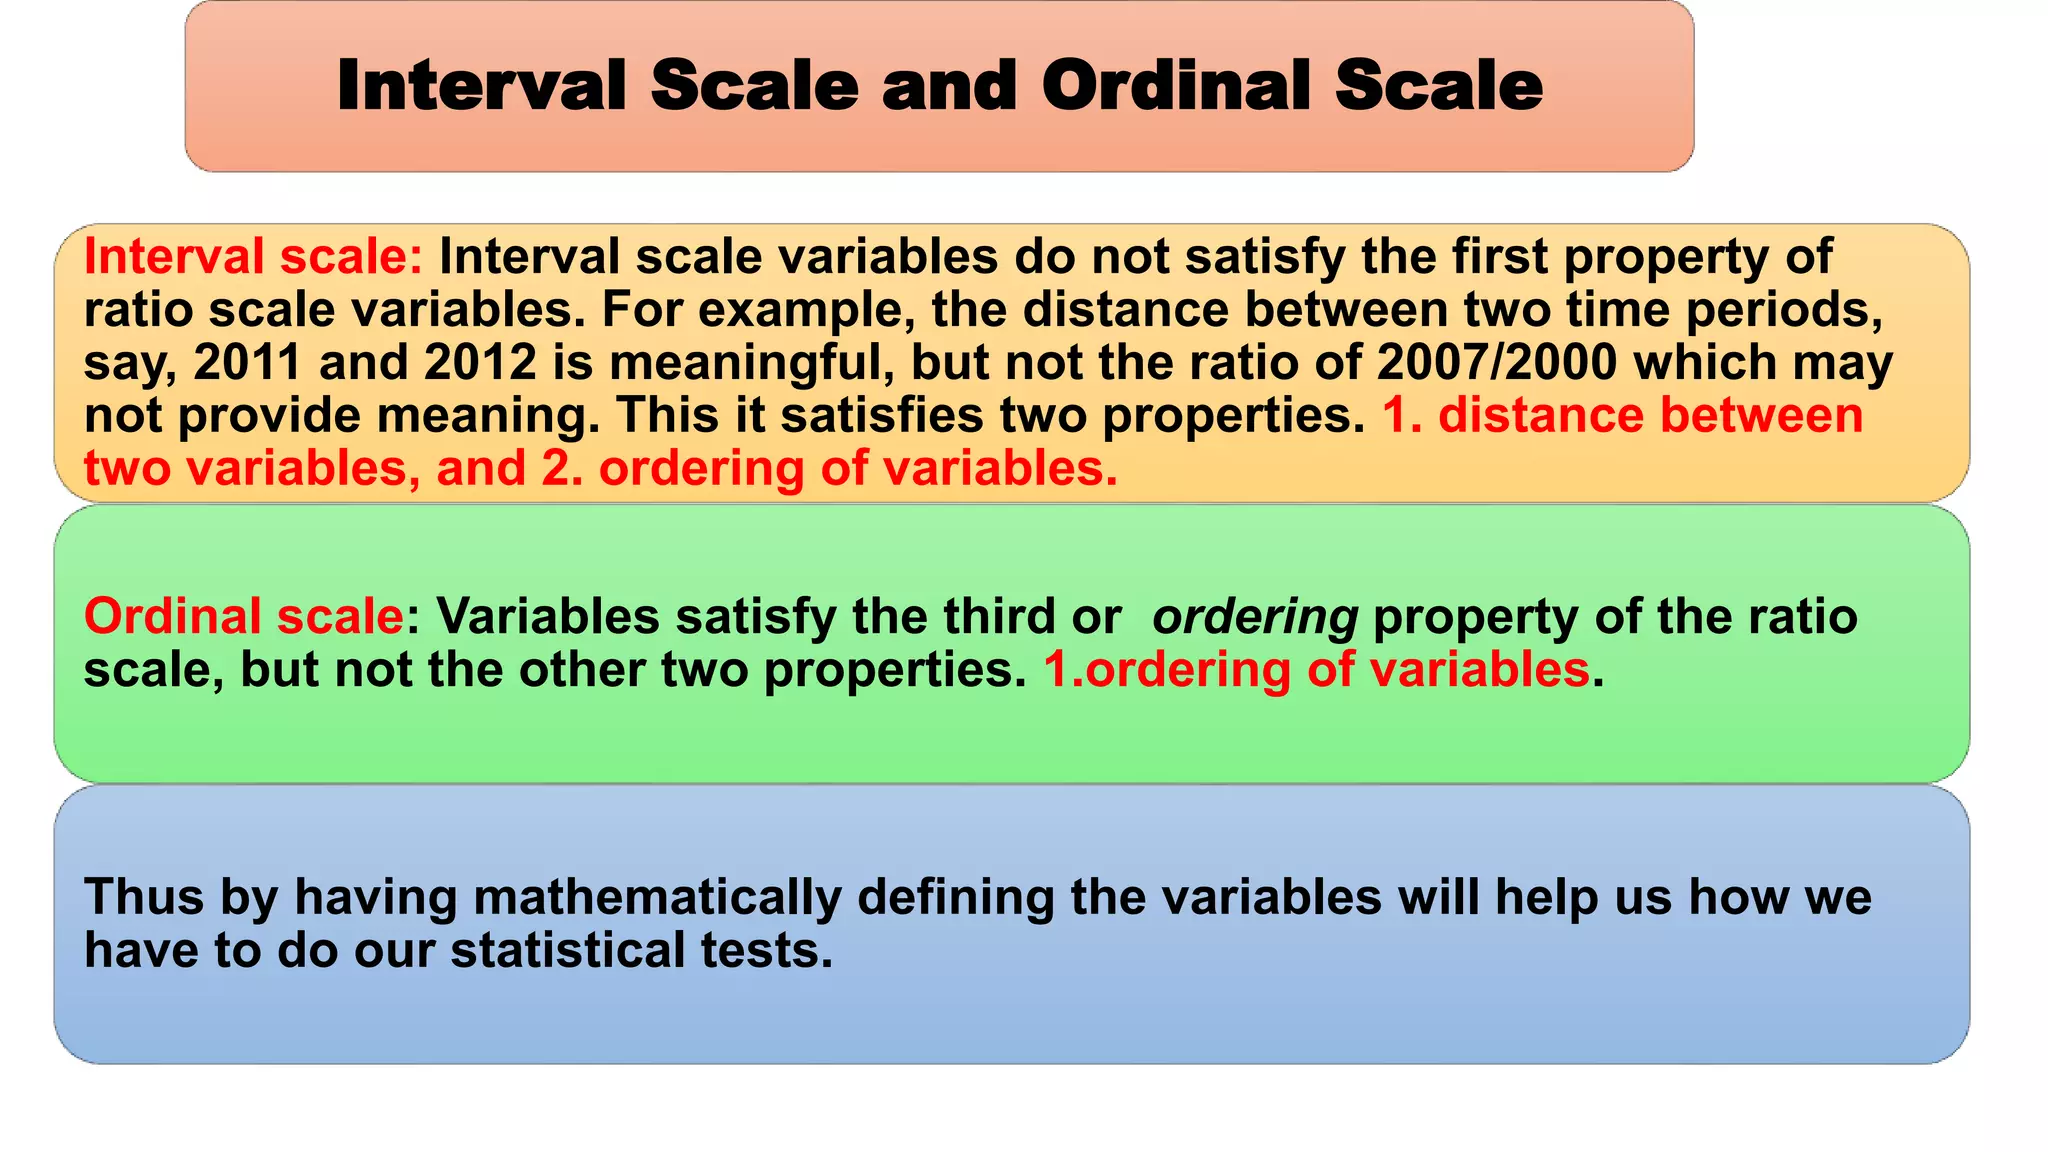
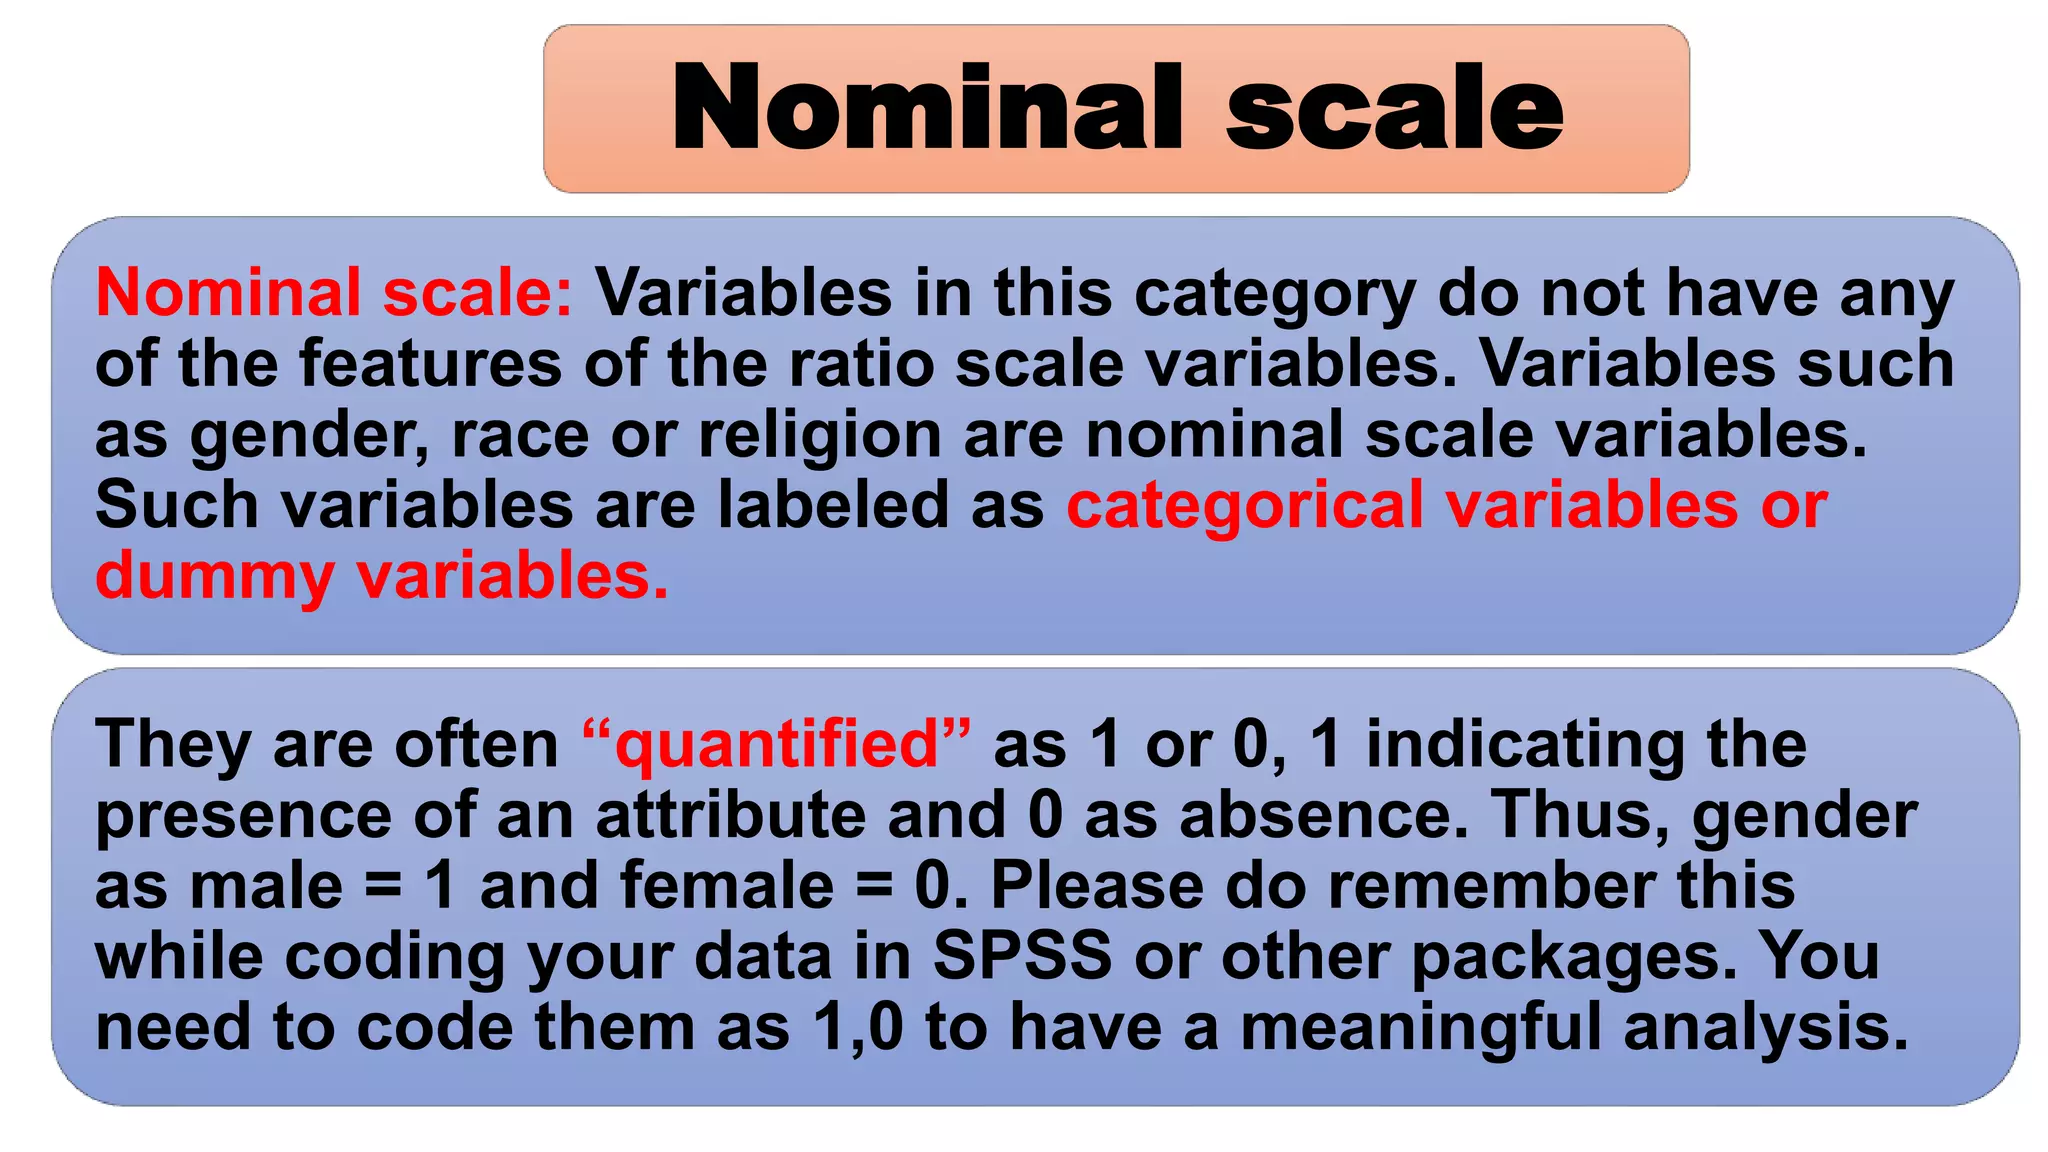

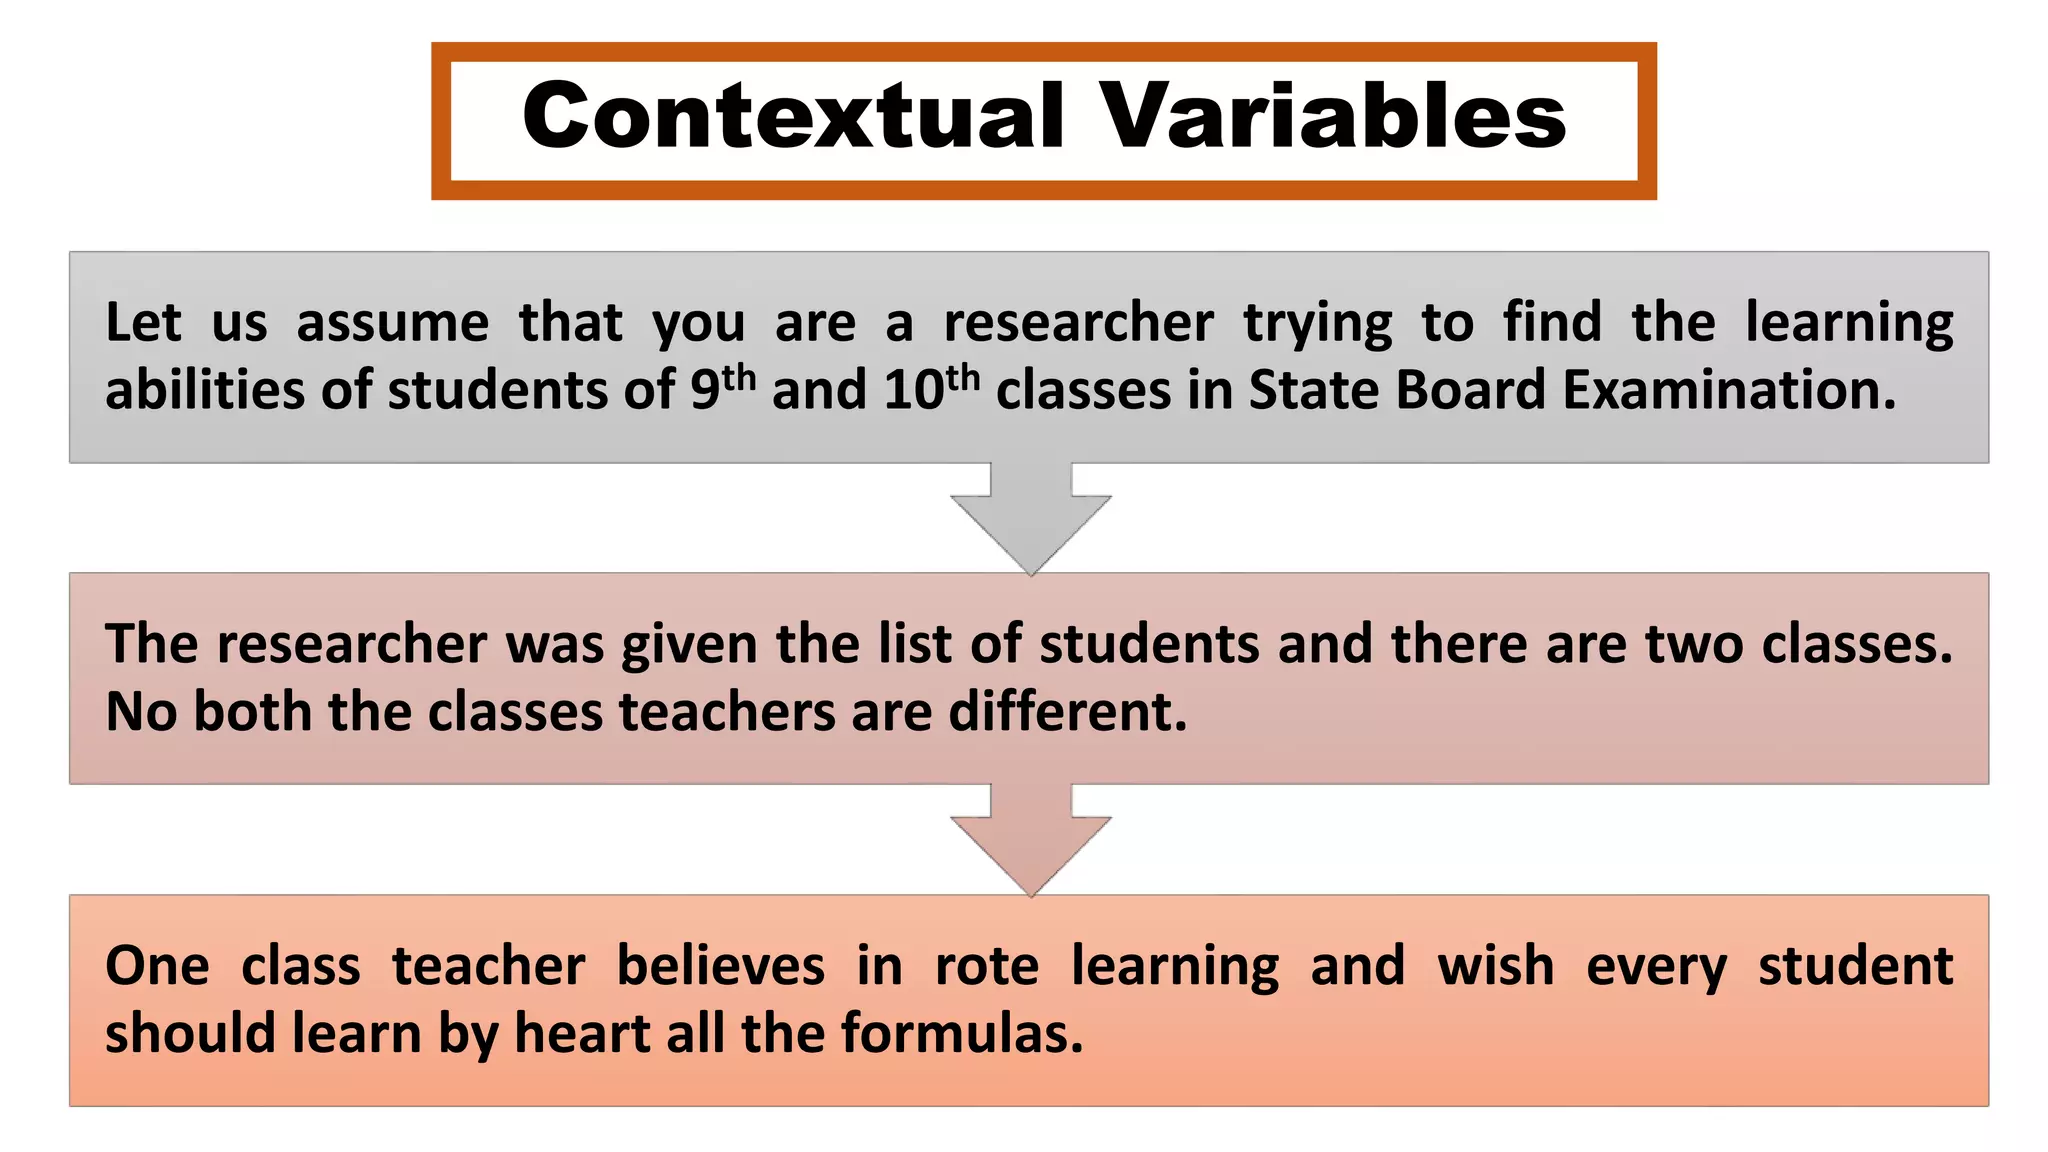
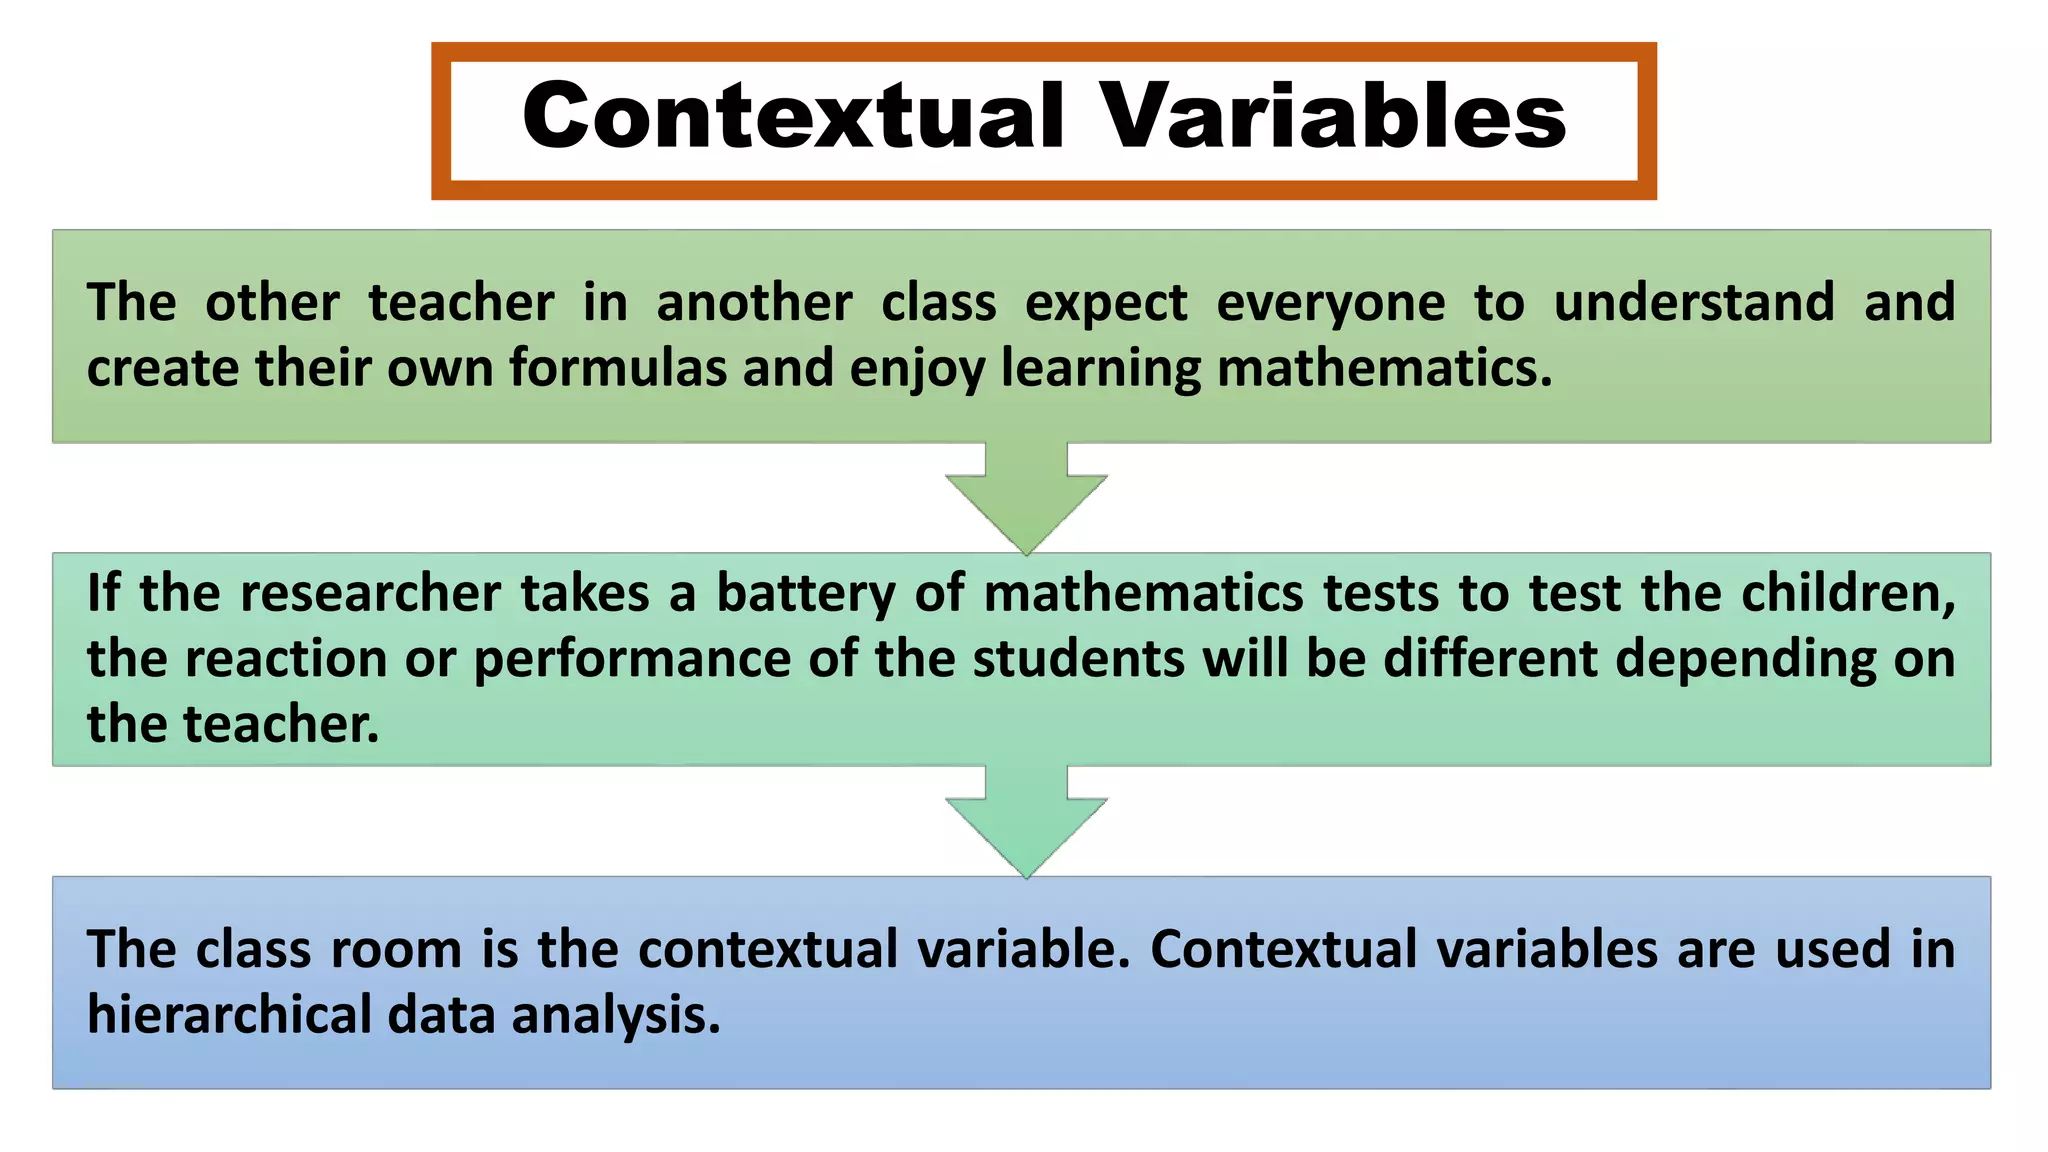
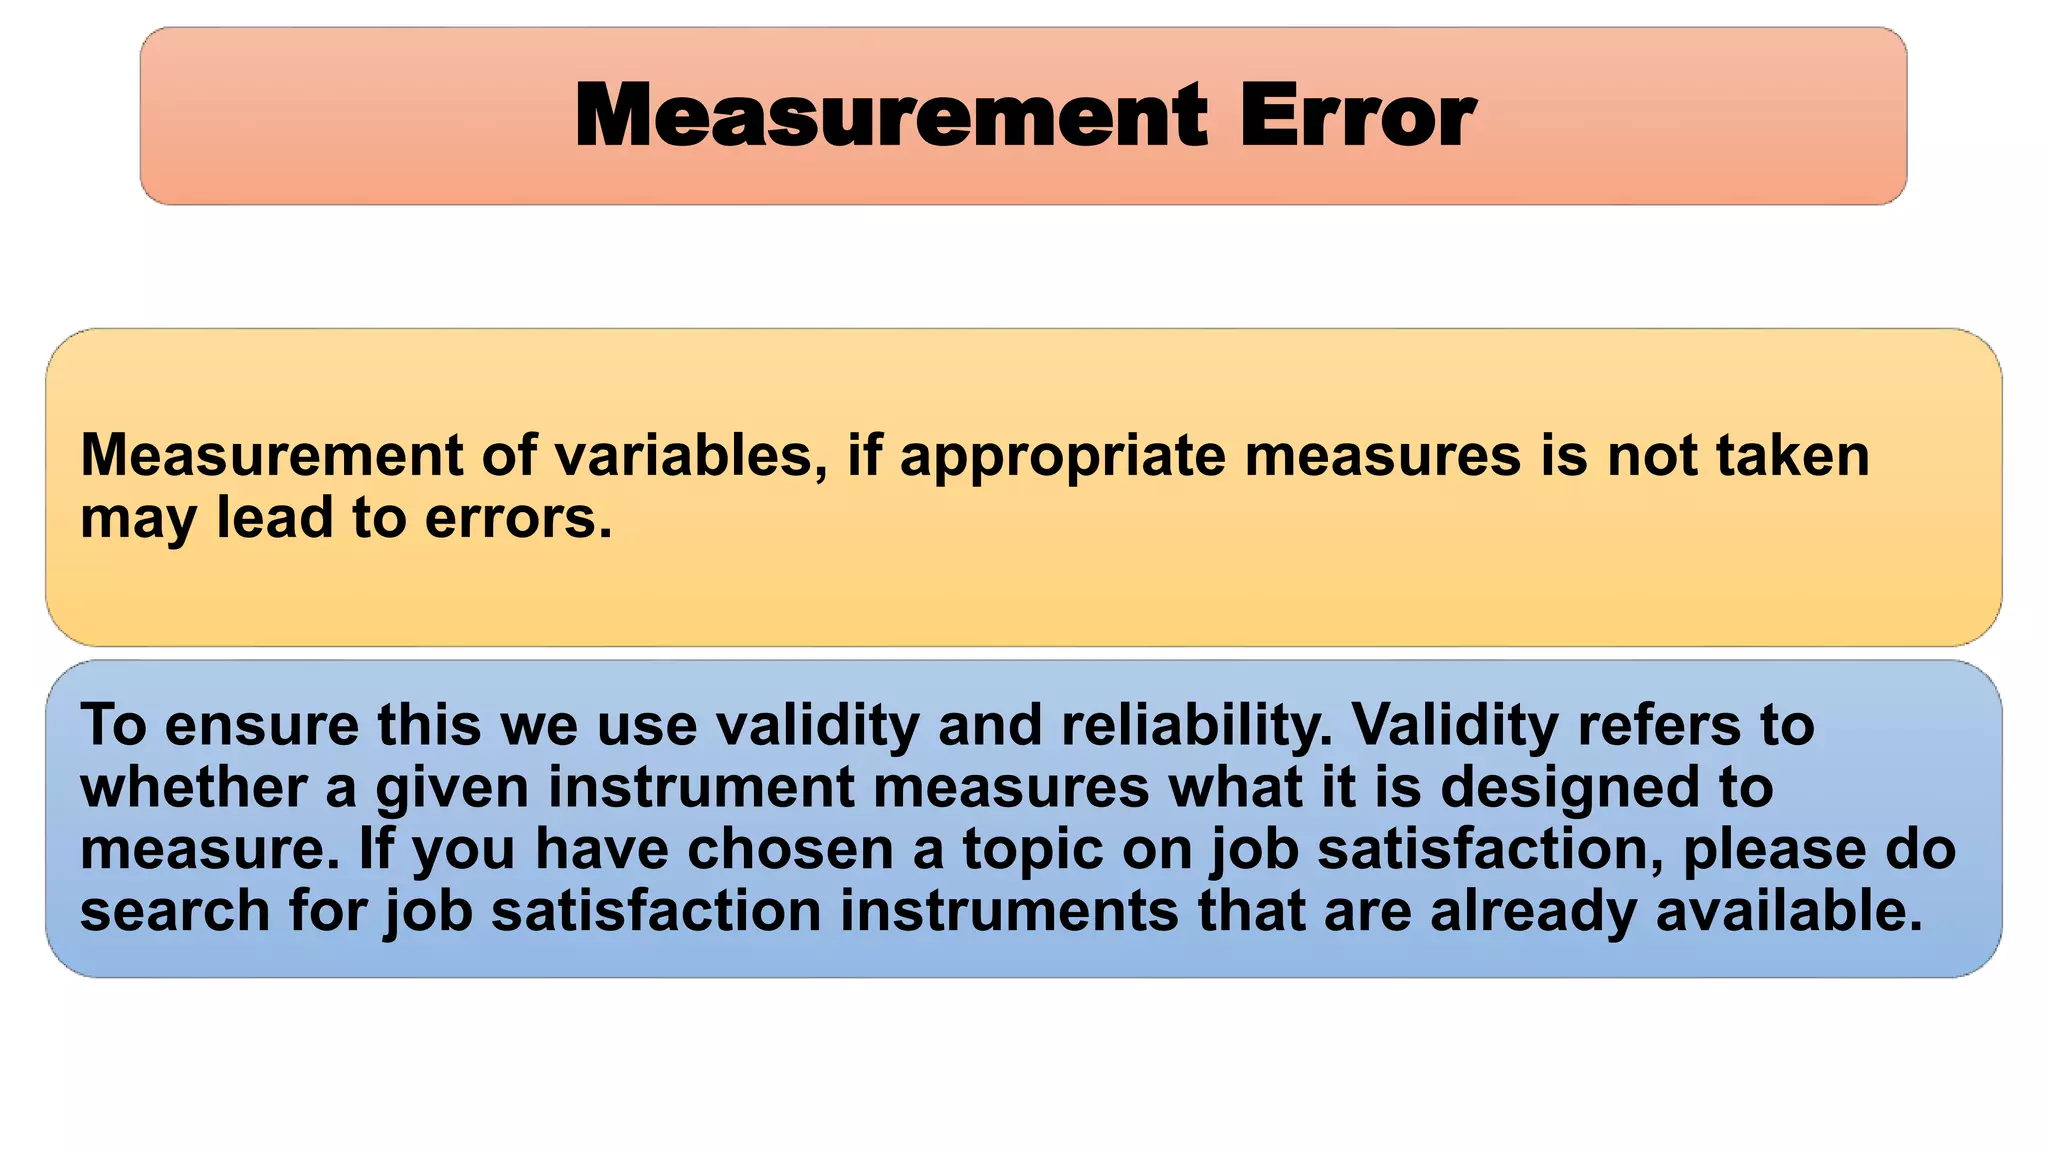
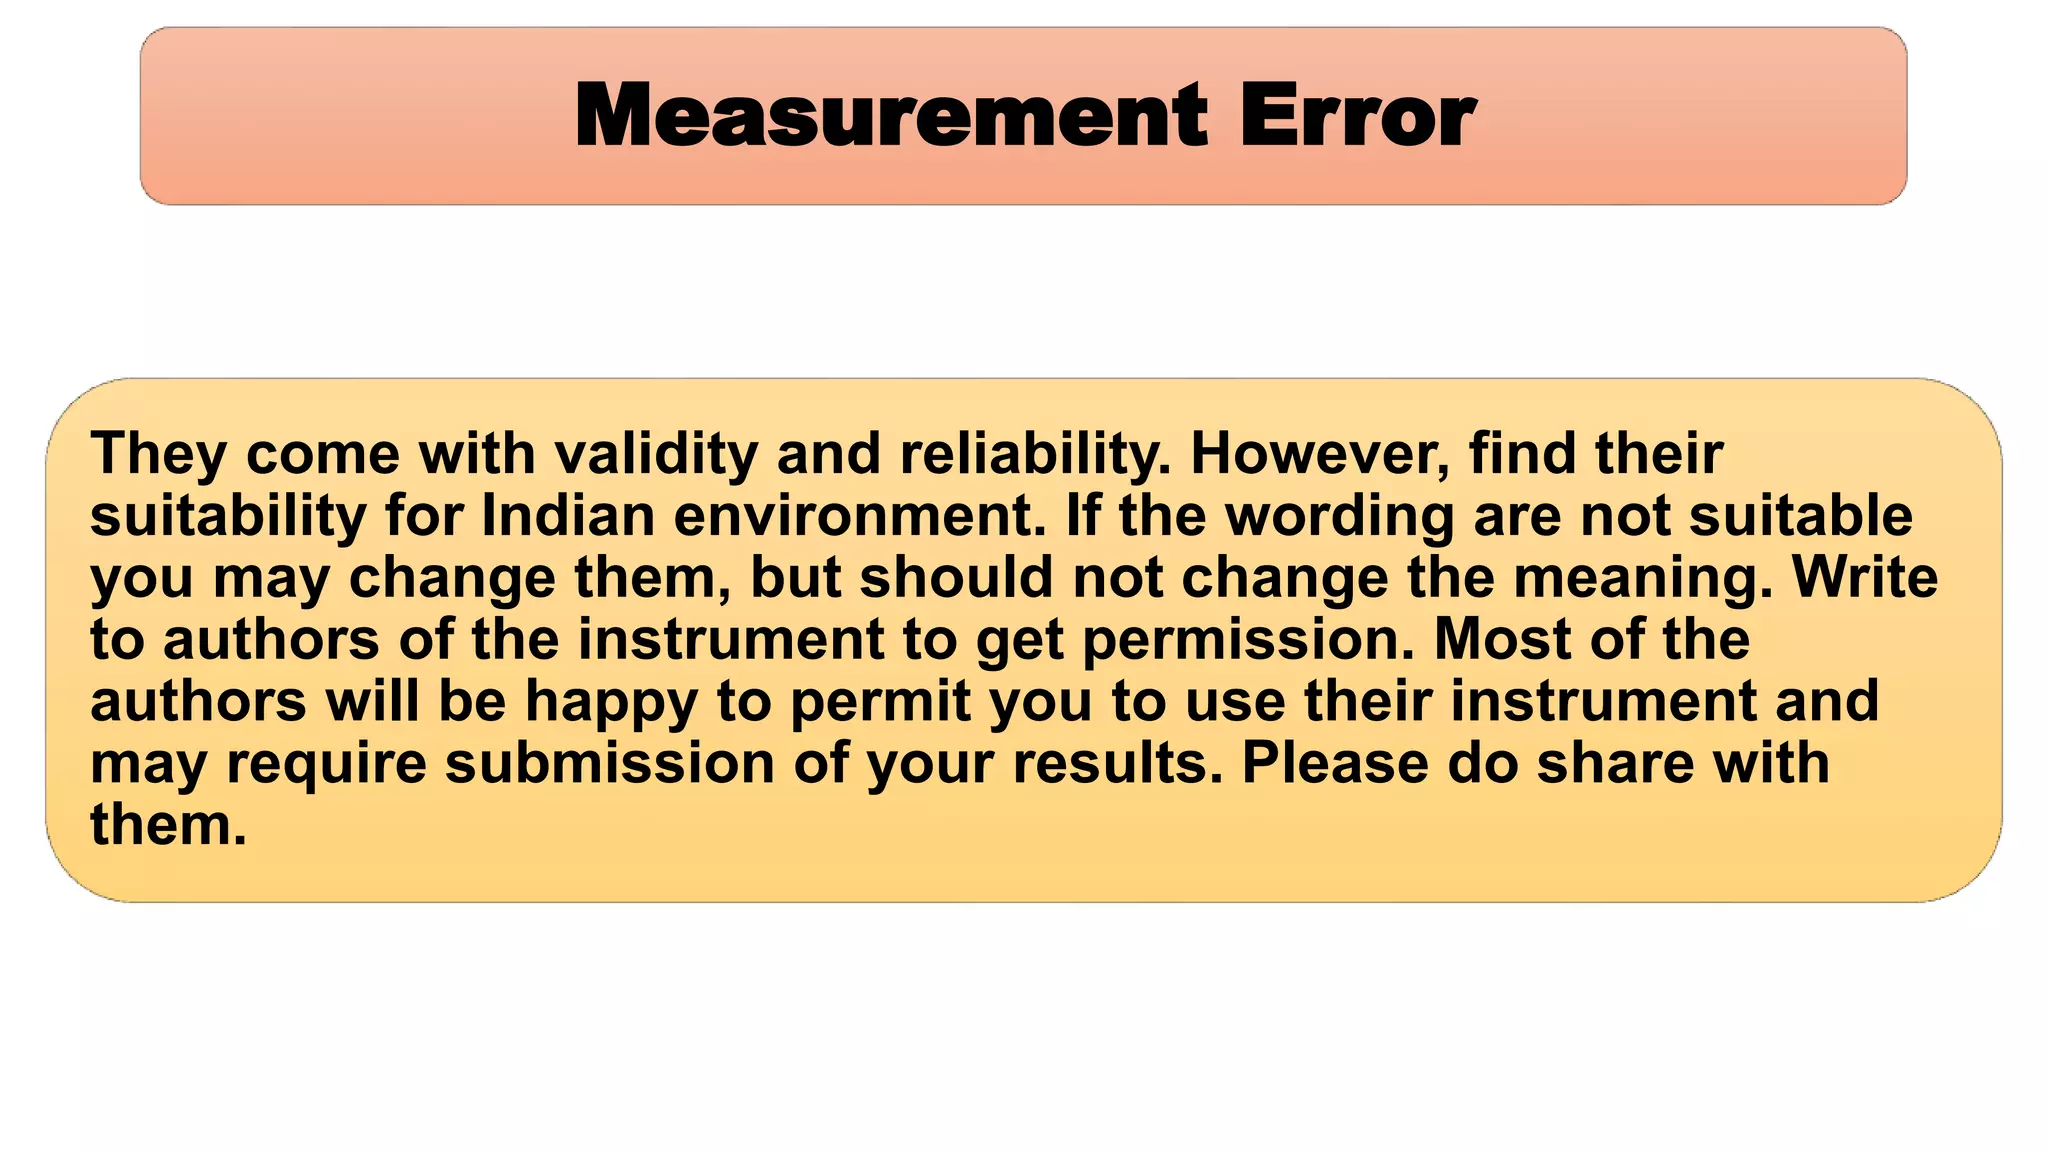
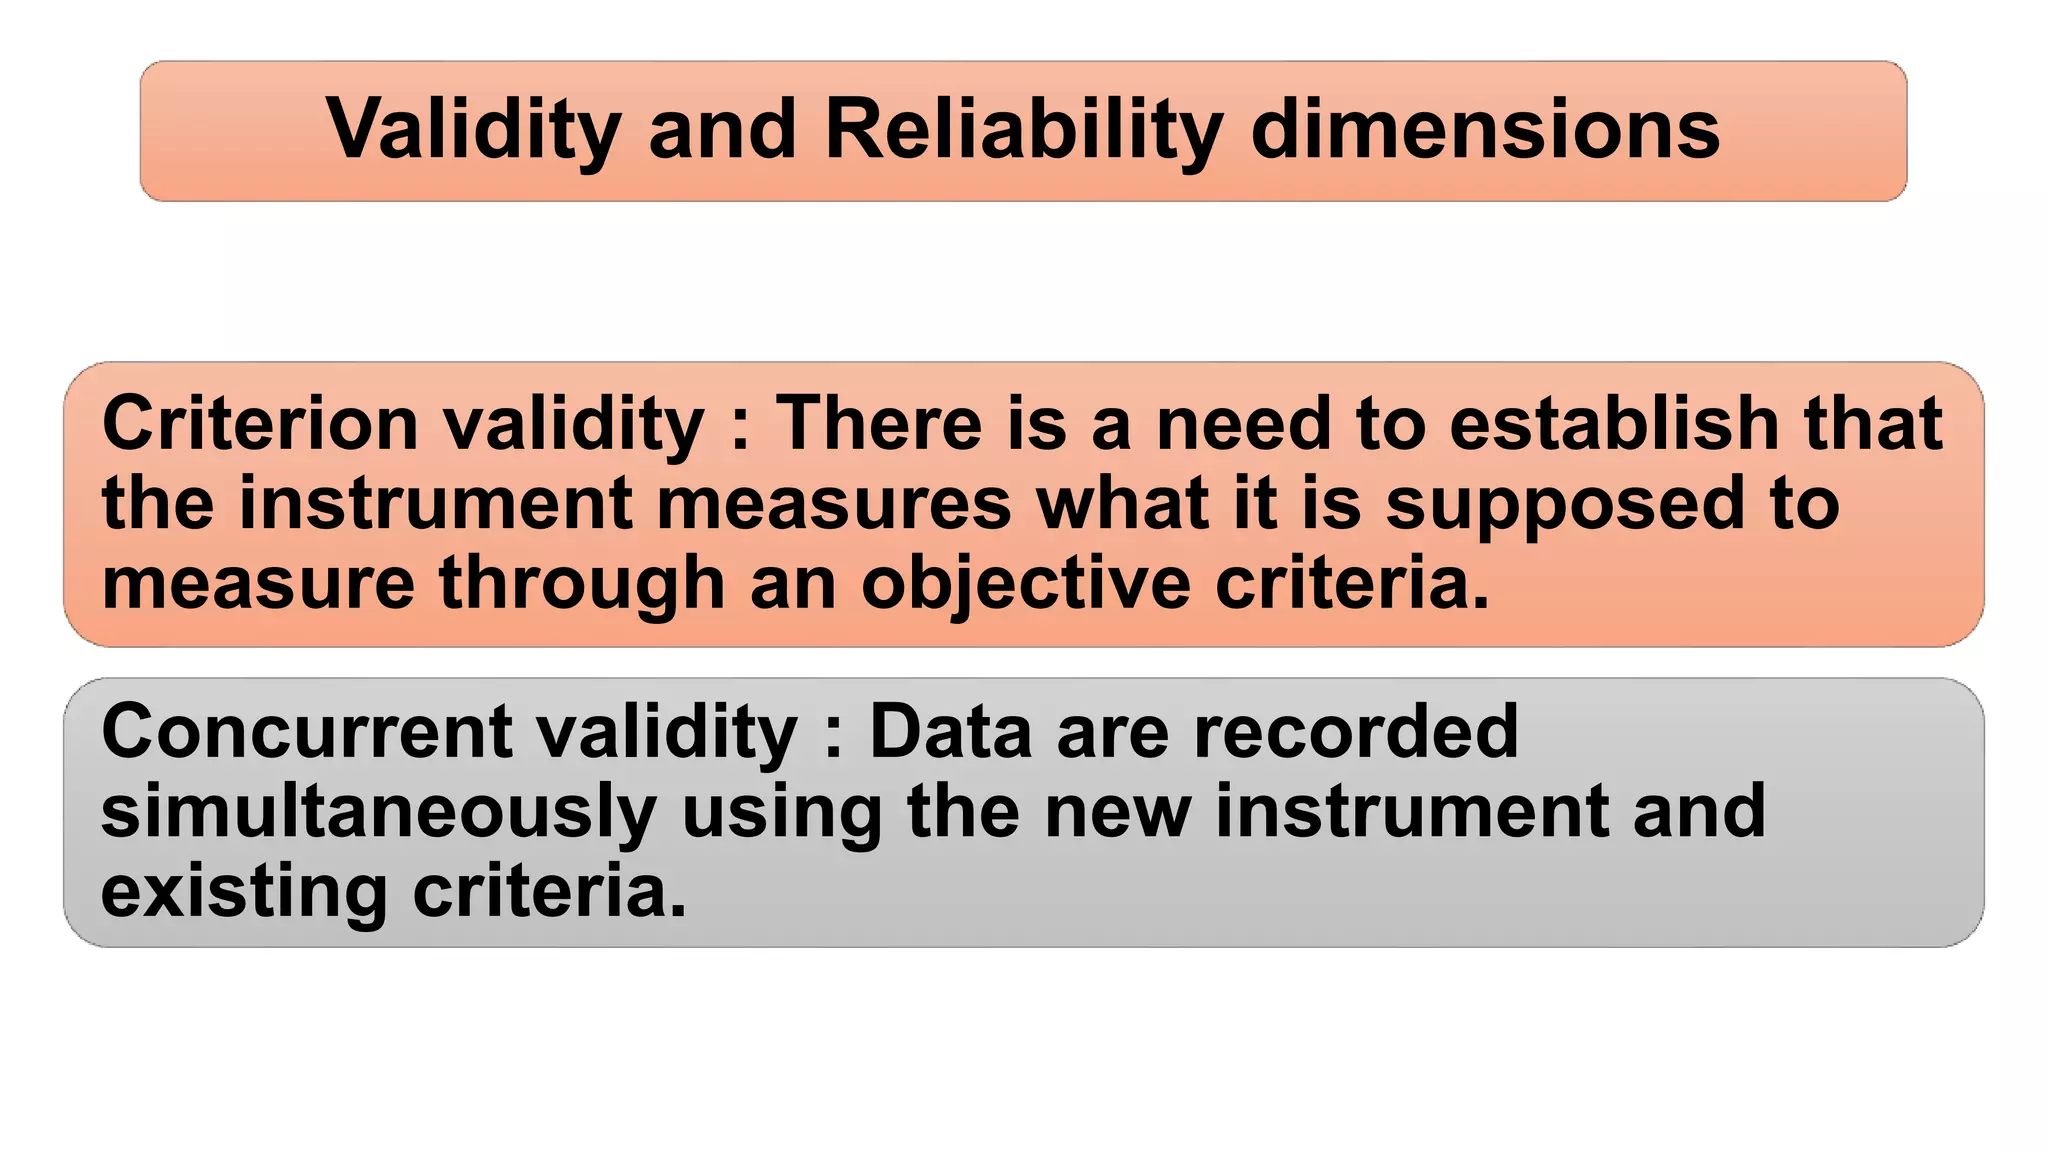
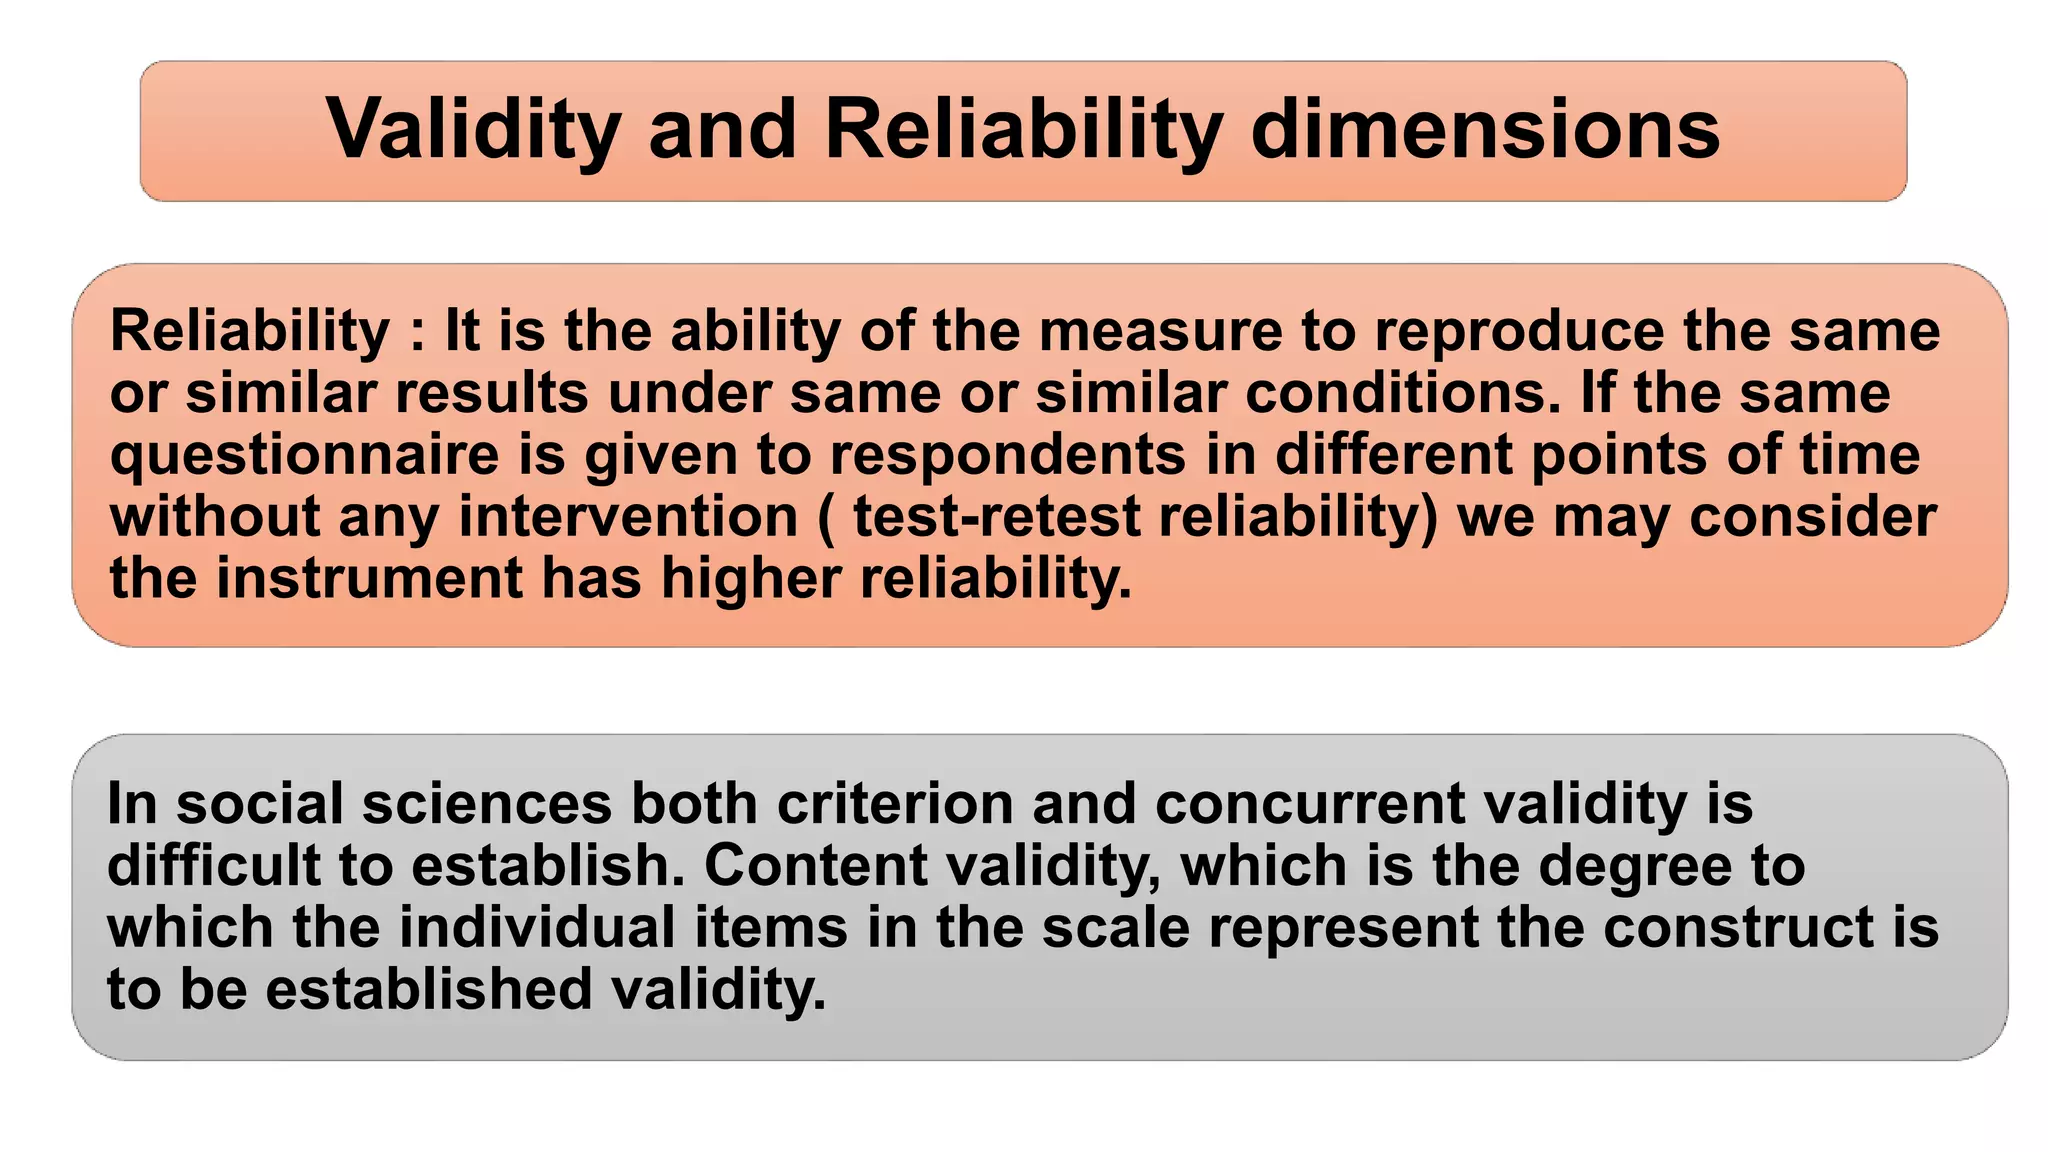

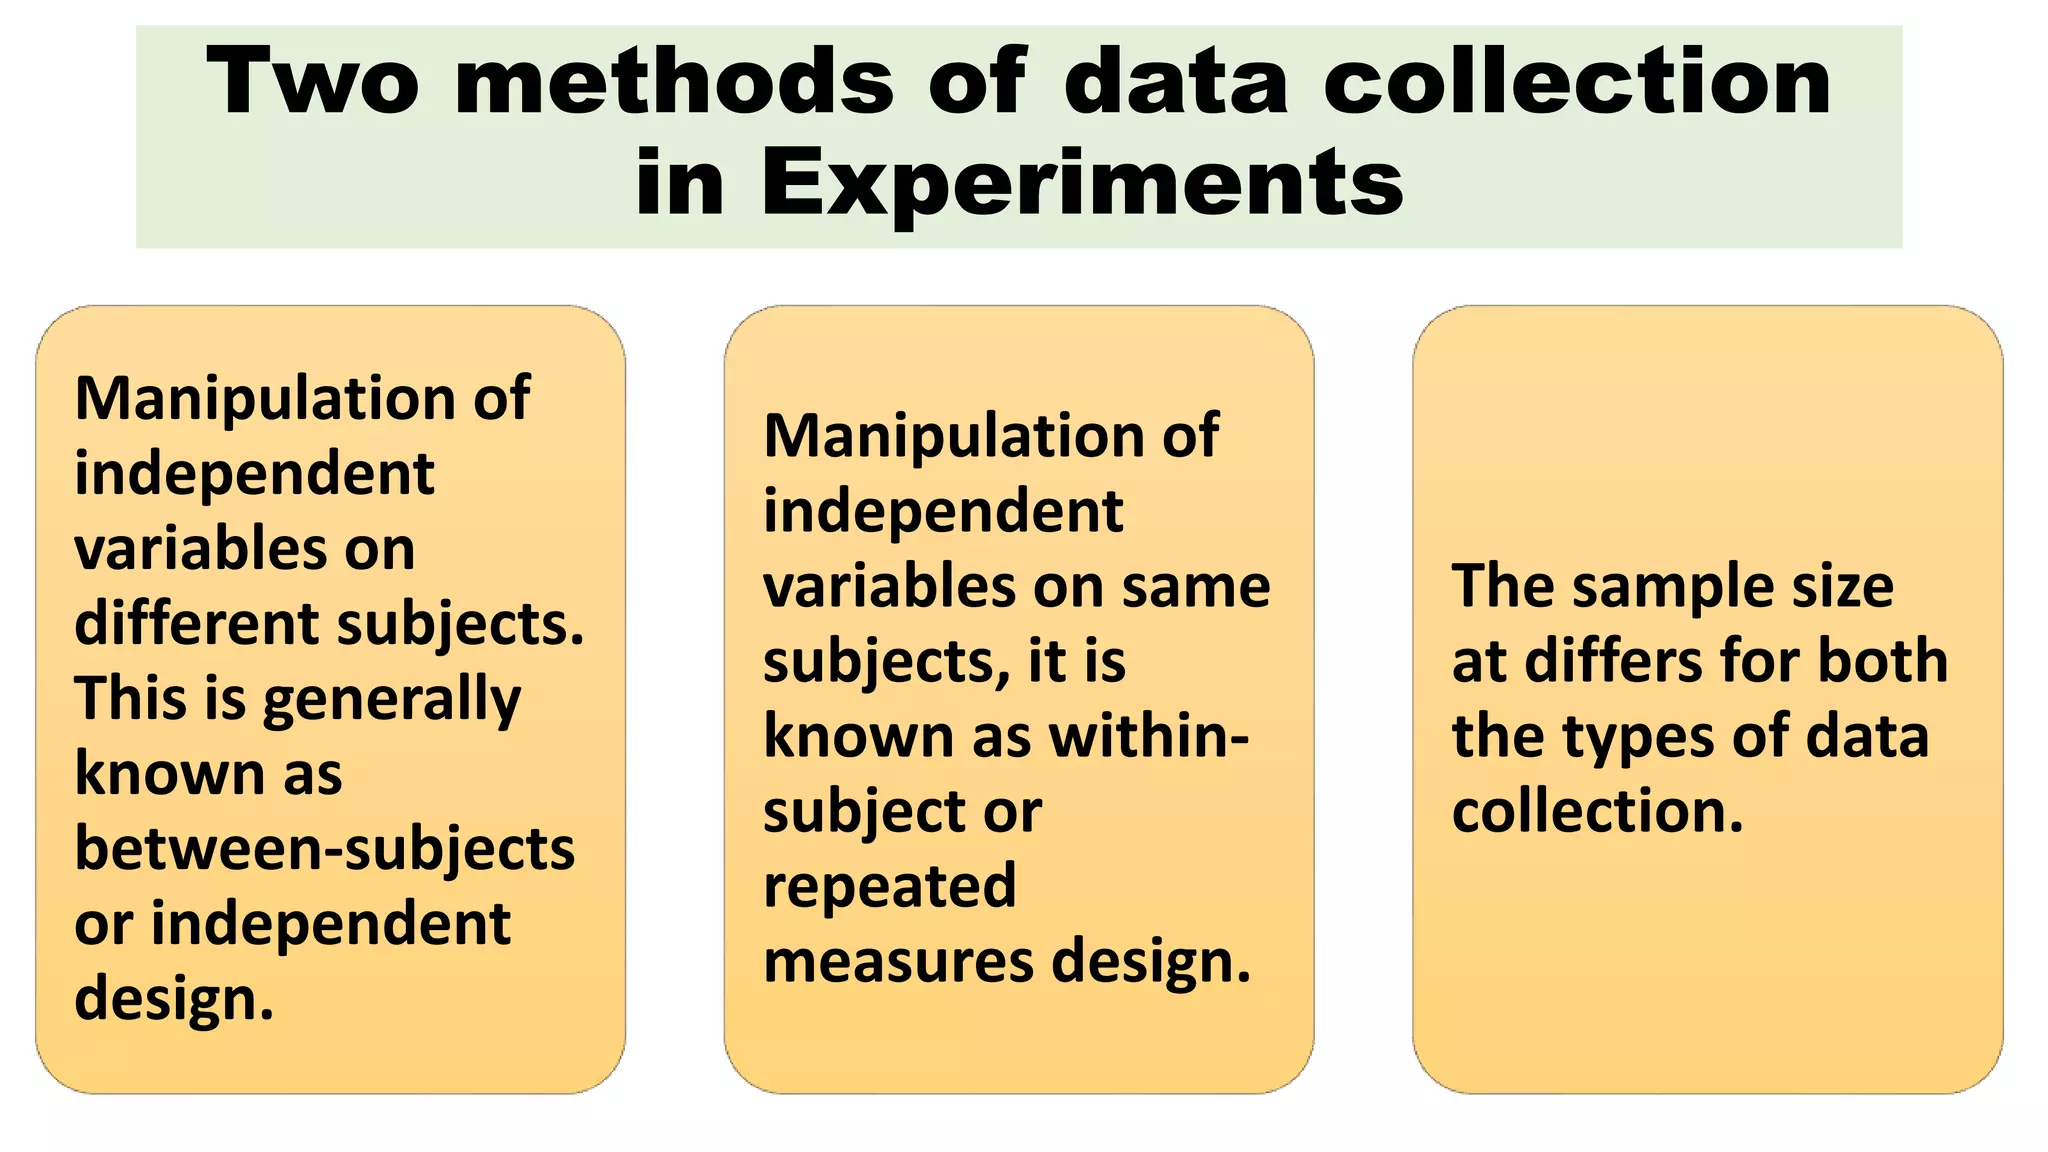
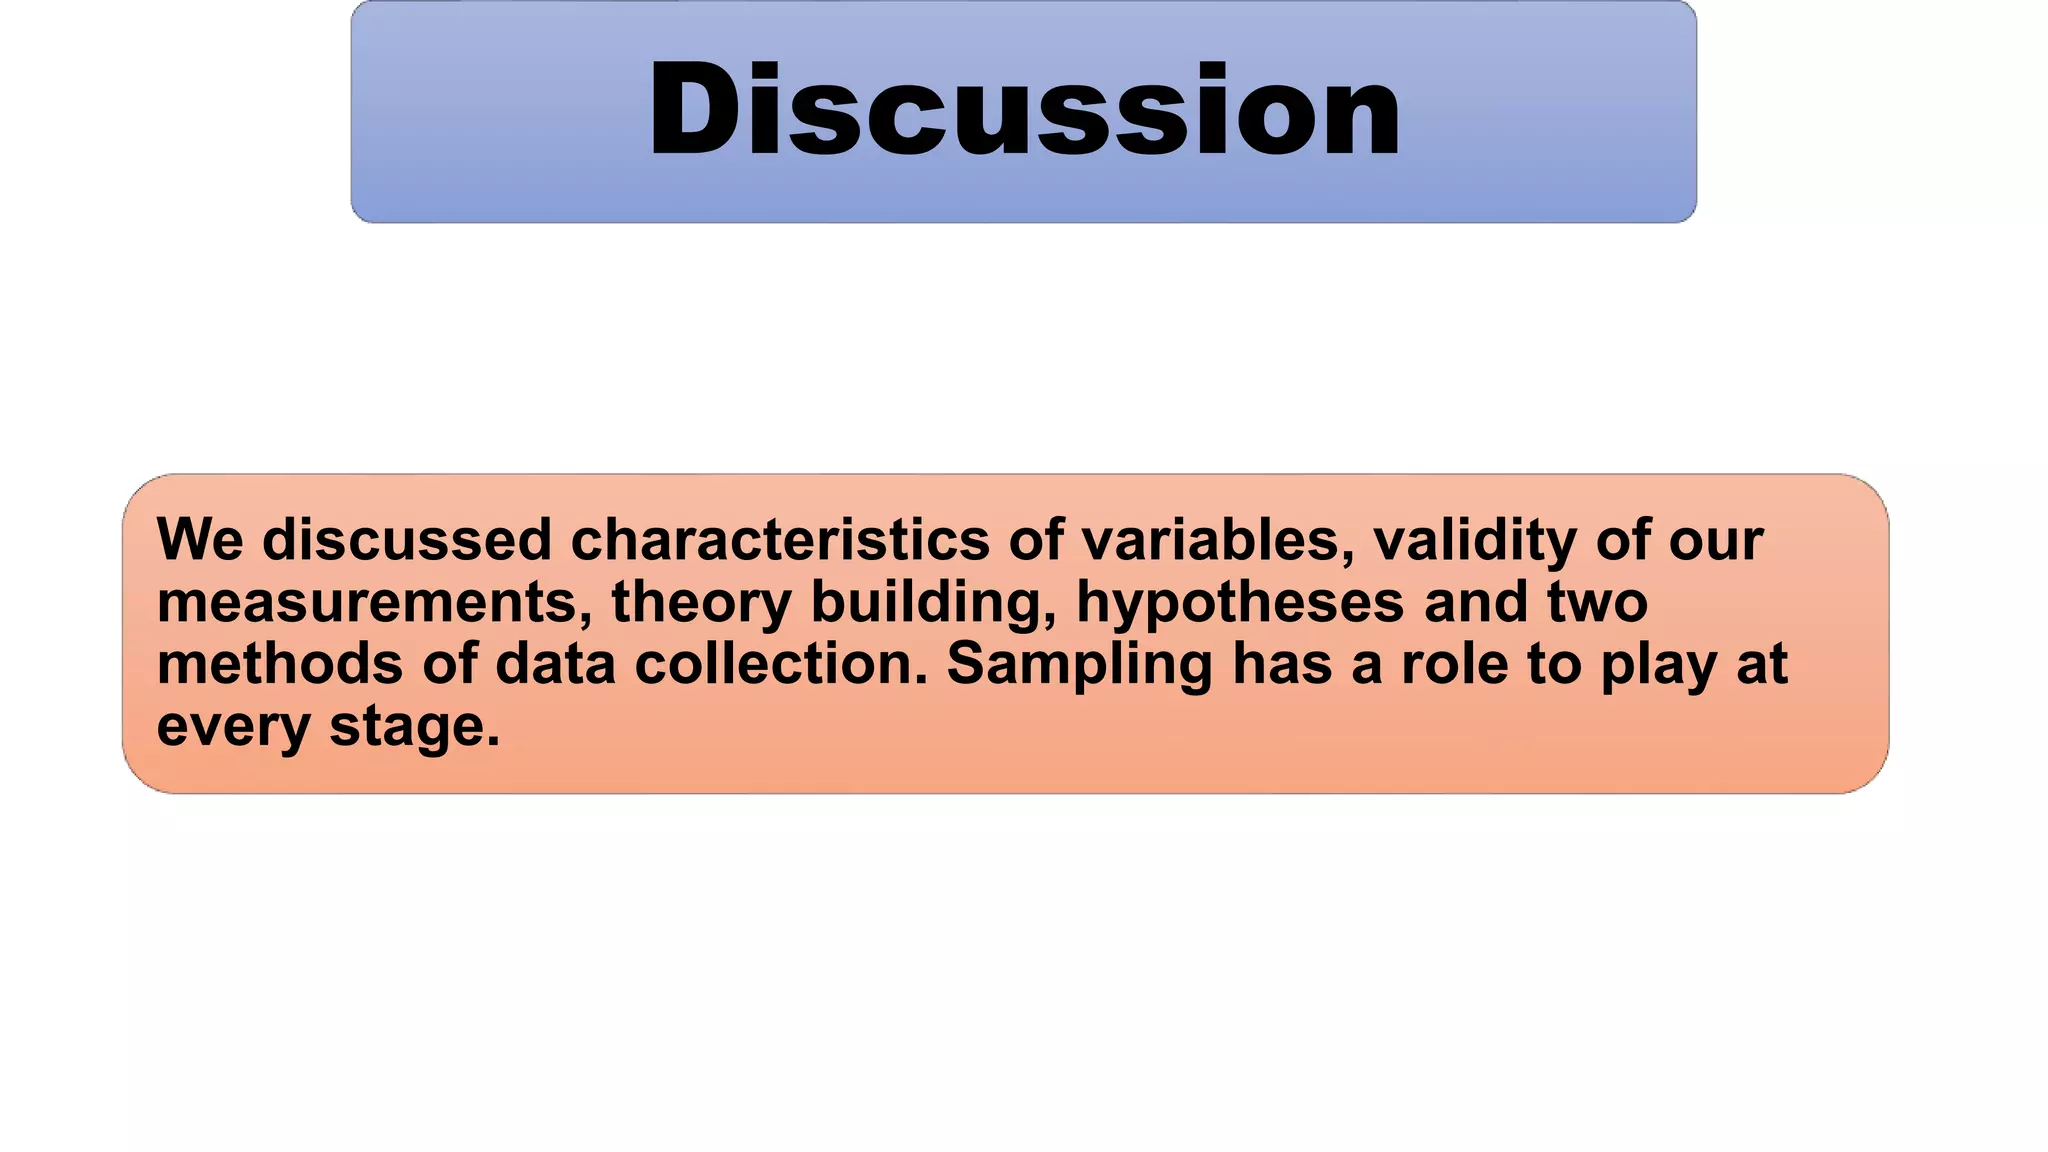
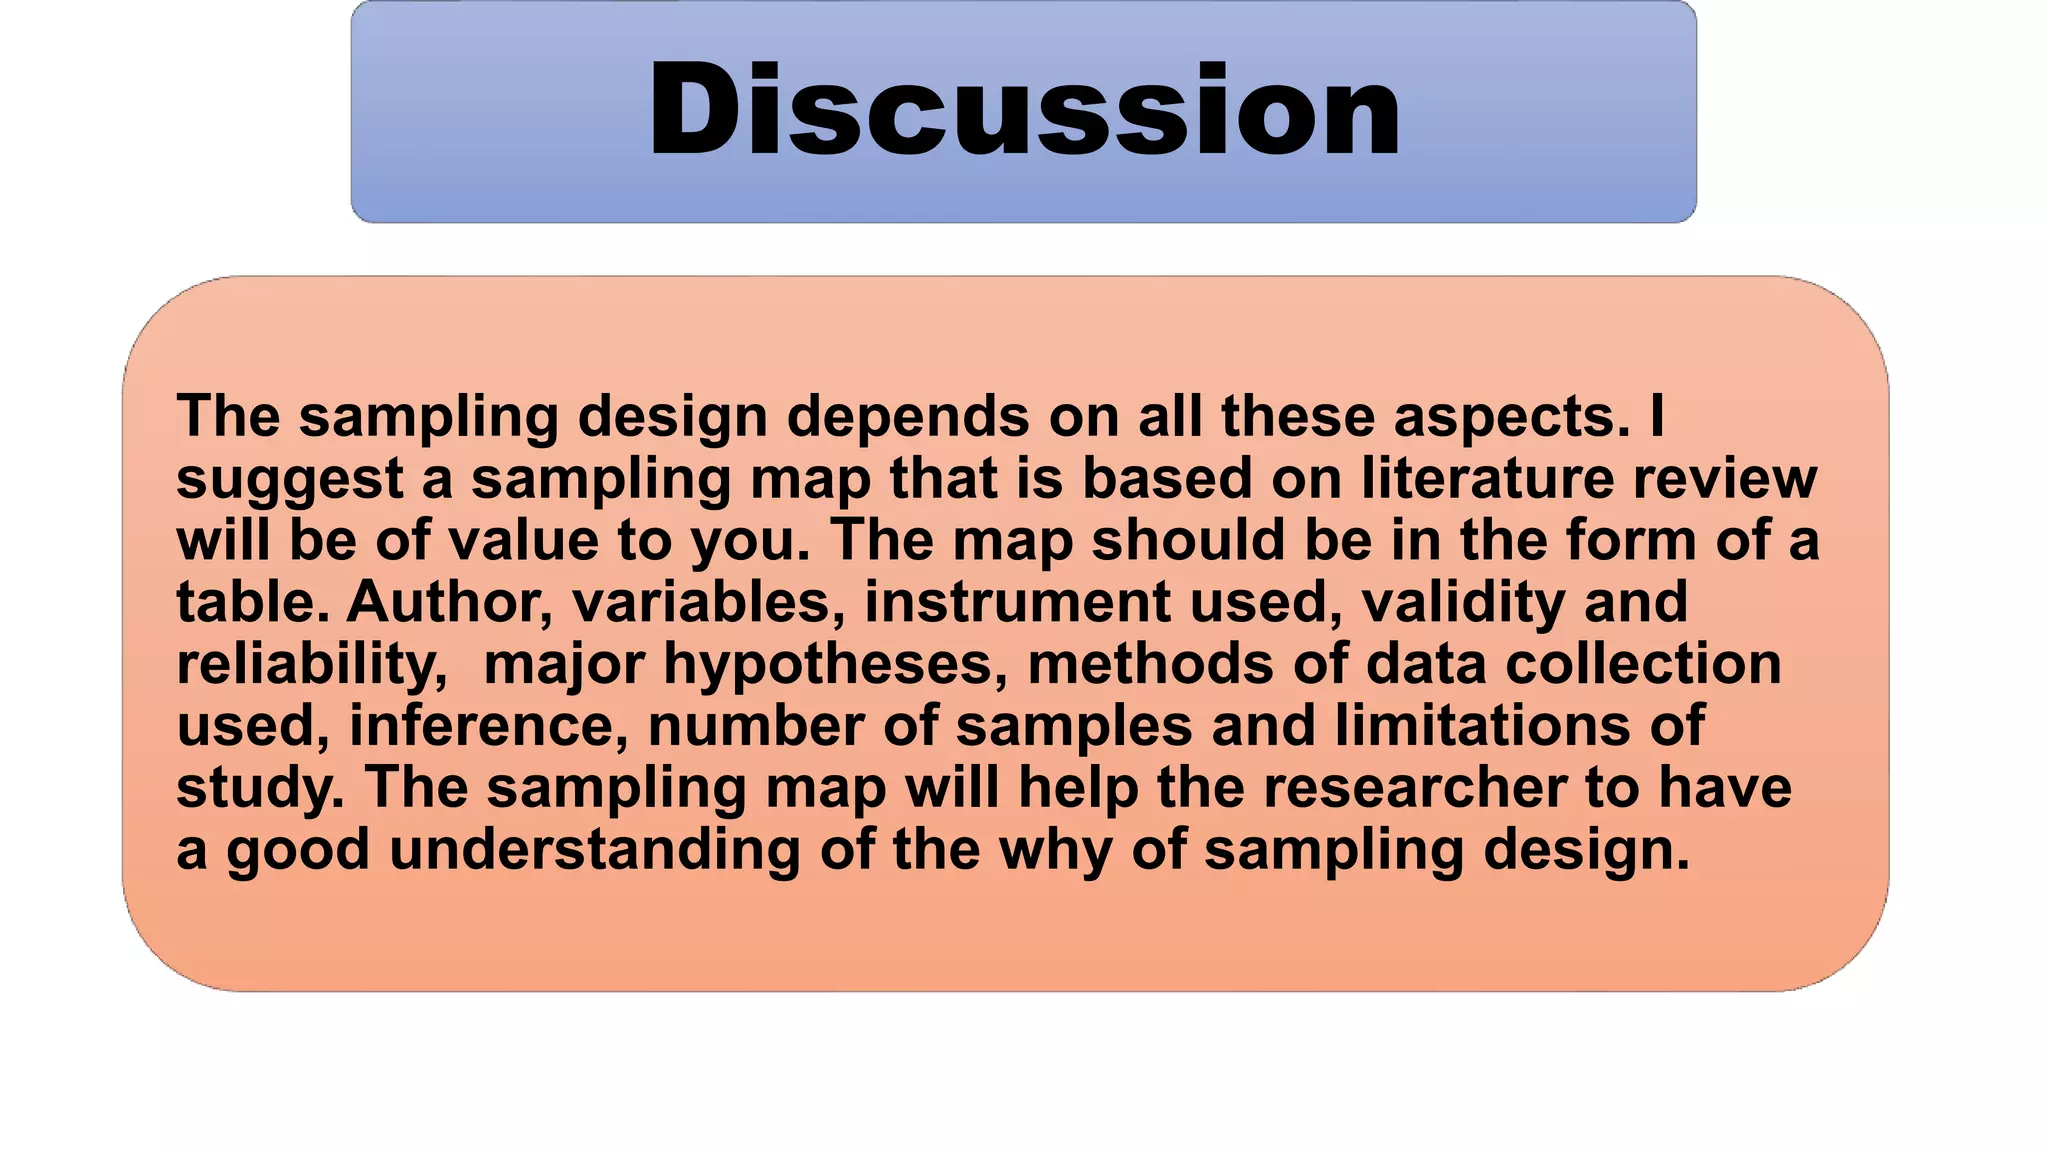

The document discusses the importance of understanding various types of variables in research, highlighting their role in designing effective sampling strategies. It covers the definitions and distinctions between independent, dependent, and moderating variables, as well as the concepts of measurement error, validity, and reliability. Additionally, it outlines different research methods and the creation of a sampling map to aid researchers in organizing and analyzing their findings.


![The Crooked Timber of New India [Autosaved].pptx](https://cdn.slidesharecdn.com/ss_thumbnails/thecrookedtimberofnewindiaautosaved-240302045121-e57b6550-thumbnail.jpg?width=600ounds&width=560&fit=bounds)


![RTP_AR_Basic_Learners' Workbook_KS2 [FOR REPRODUCTION] (1).pdf](https://cdn.slidesharecdn.com/ss_thumbnails/rtparbasiclearnersworkbookks2forreproduction1-251016024943-e51a16ac-thumbnail.jpg?width=600ounds&width=560&fit=bounds)


![Matrix and determinant URT [Autosaved].pptx](https://cdn.slidesharecdn.com/ss_thumbnails/matrixanddeterminanturtautosaved-251018190340-9e6a6deb-thumbnail.jpg?width=600ounds&width=560&fit=bounds)


![Agentic Systems and Compliance - A brief intro [1.2]](https://cdn.slidesharecdn.com/ss_thumbnails/agenticsystemsandcompliace-1-251018025303-958a42ec-thumbnail.jpg?width=600ounds&width=560&fit=bounds)


