Download to read offline

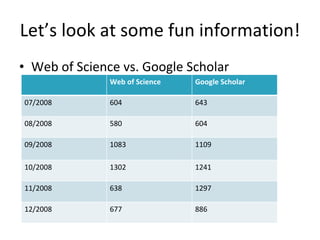

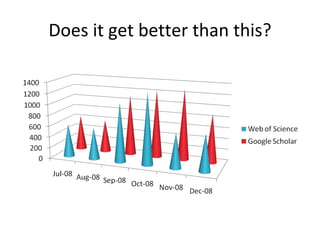
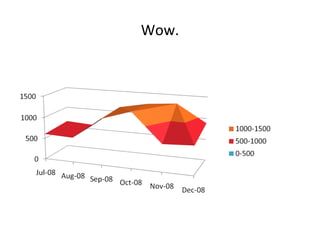

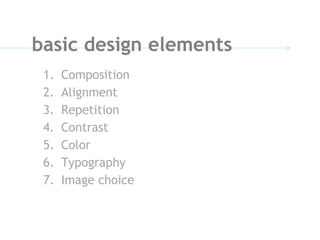


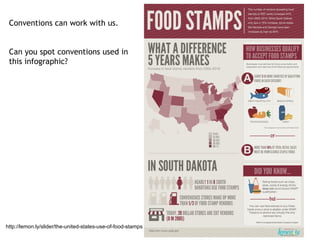
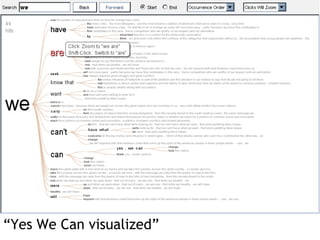
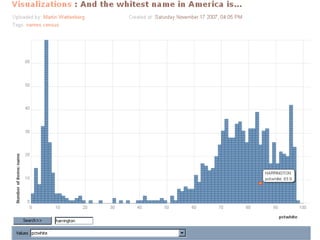


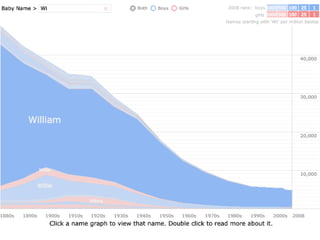

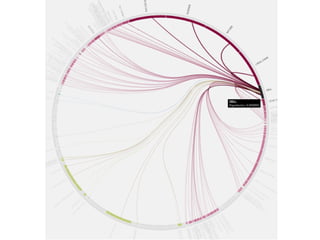

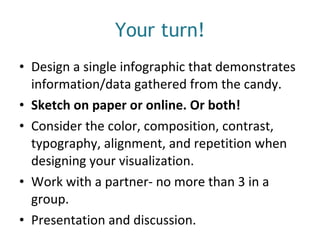
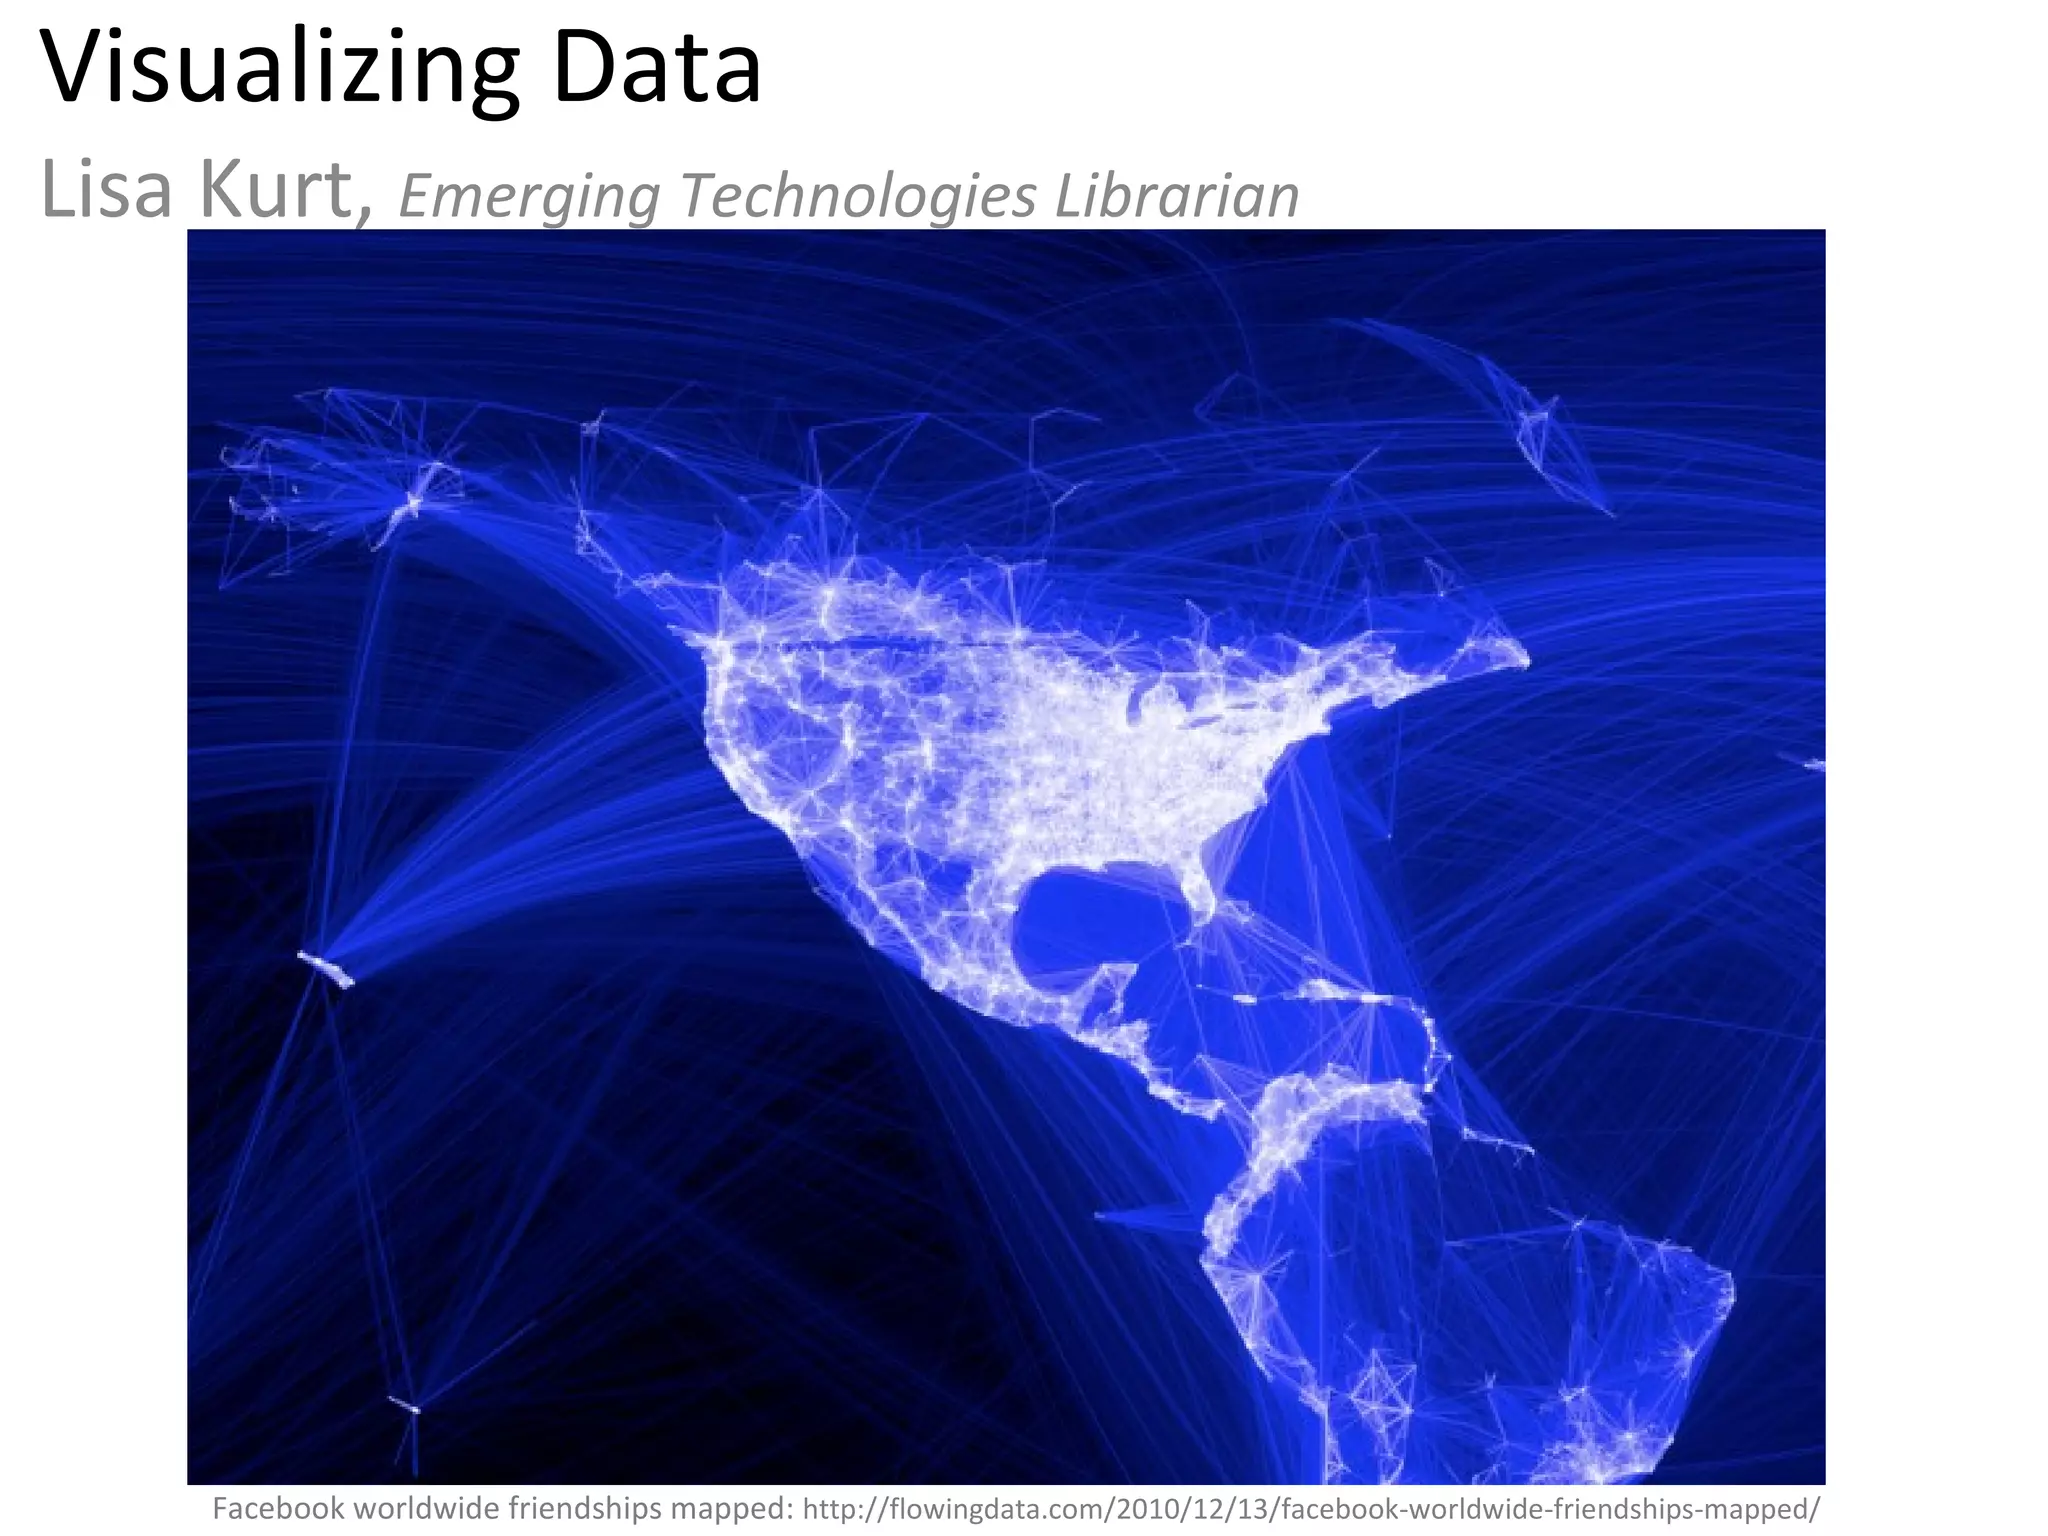
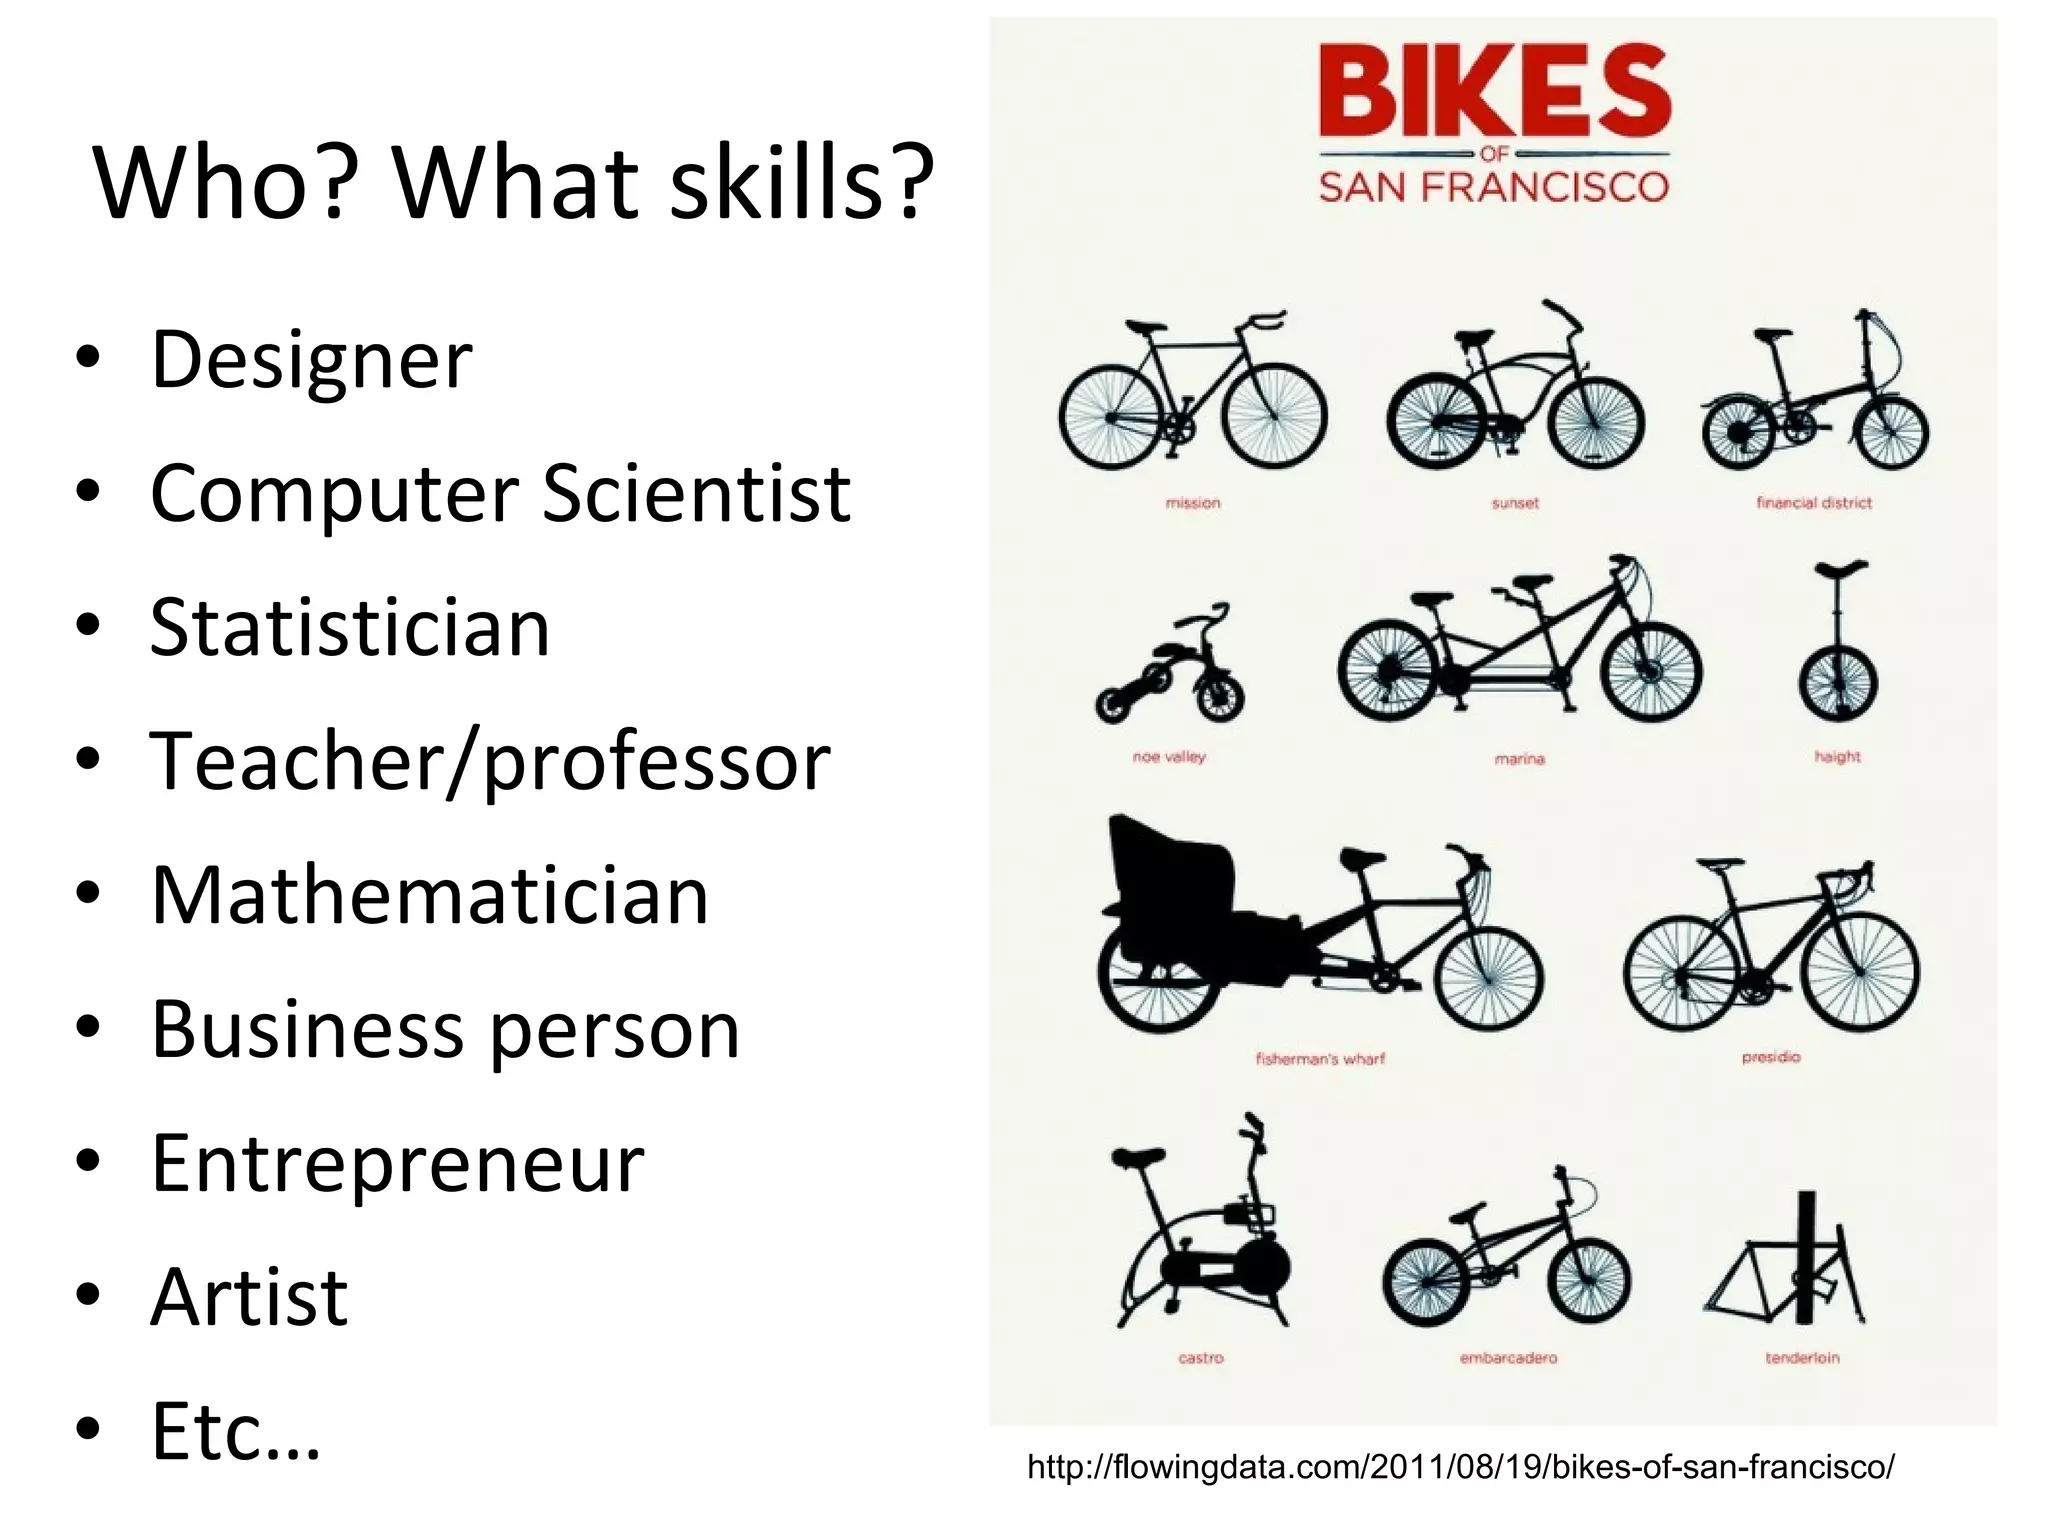


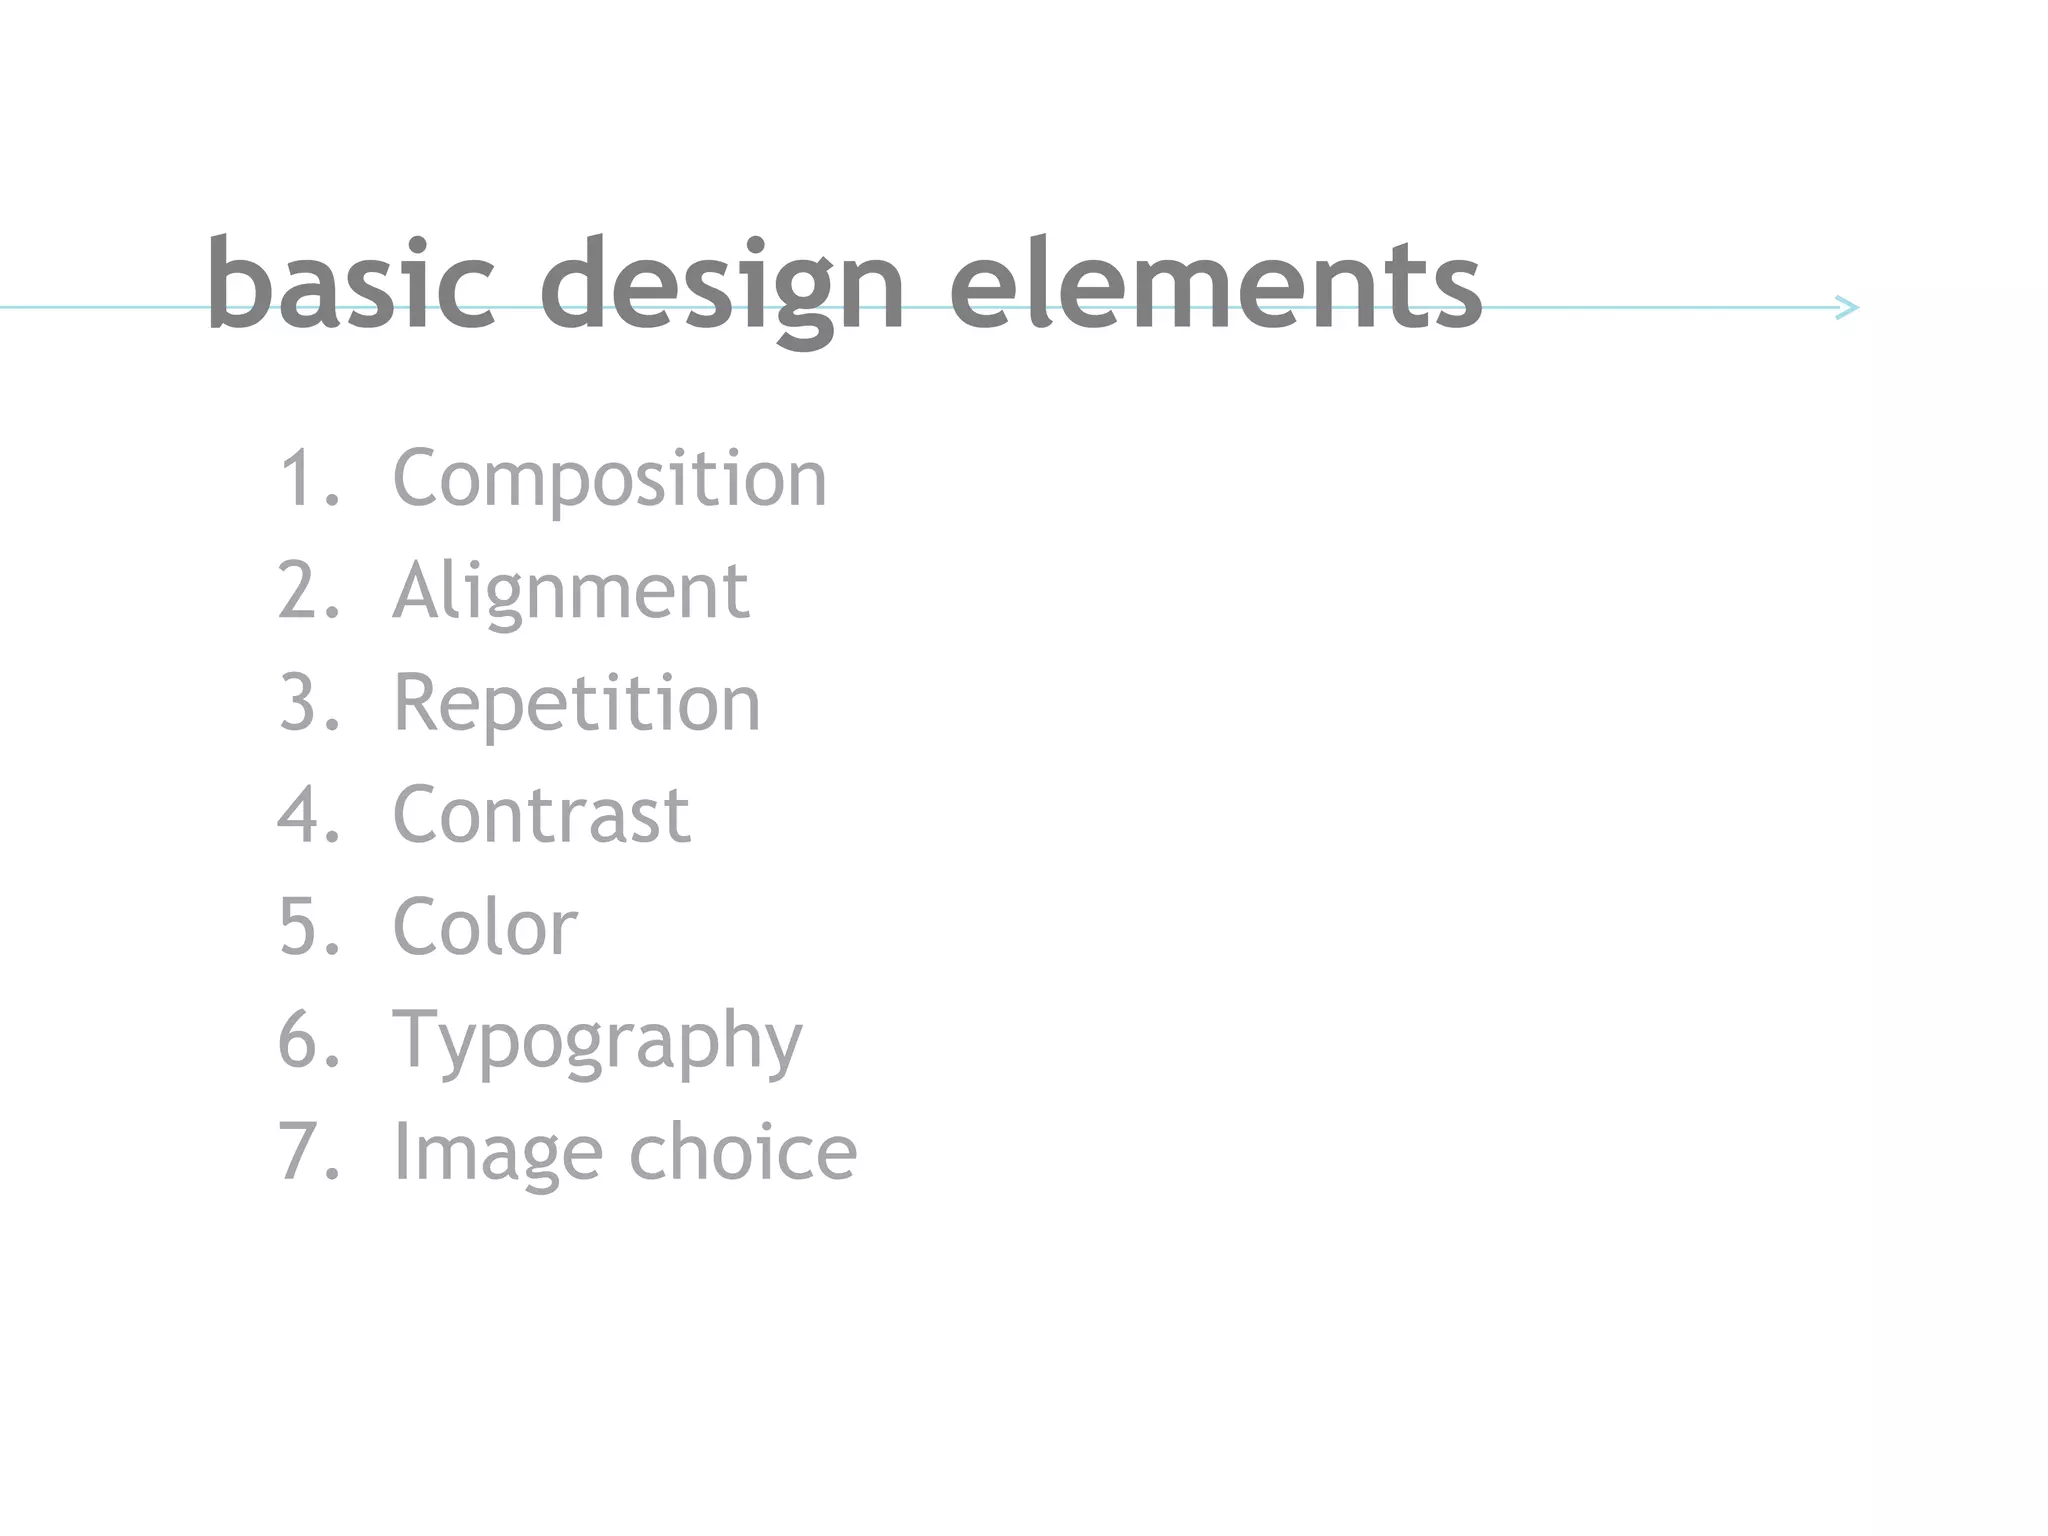
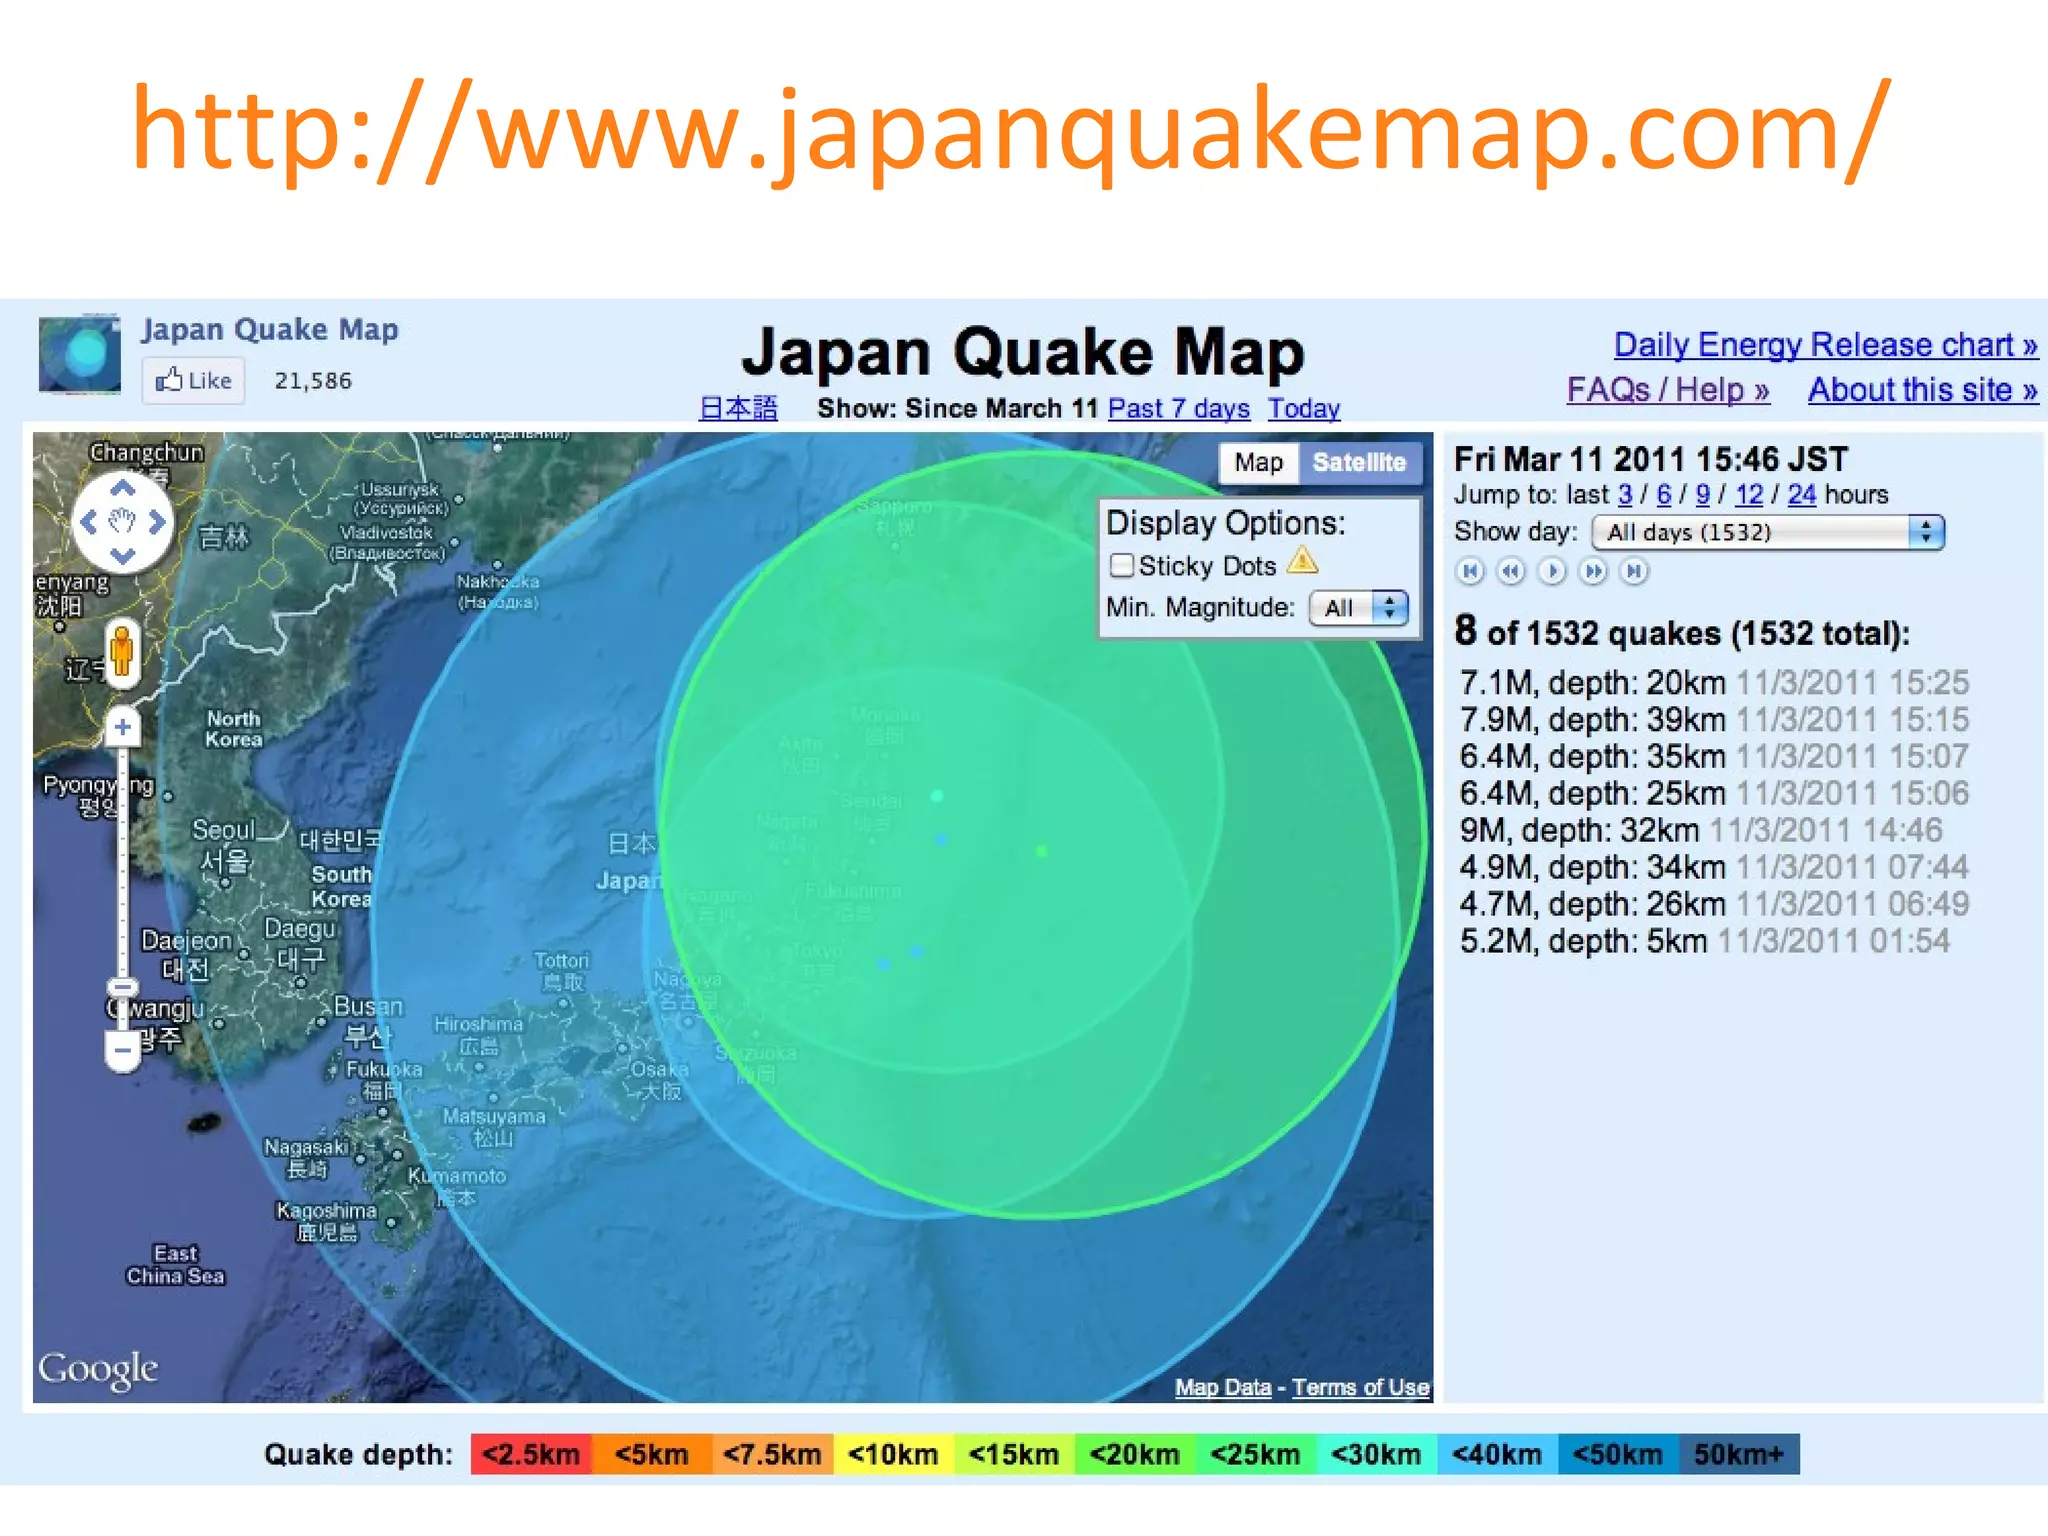
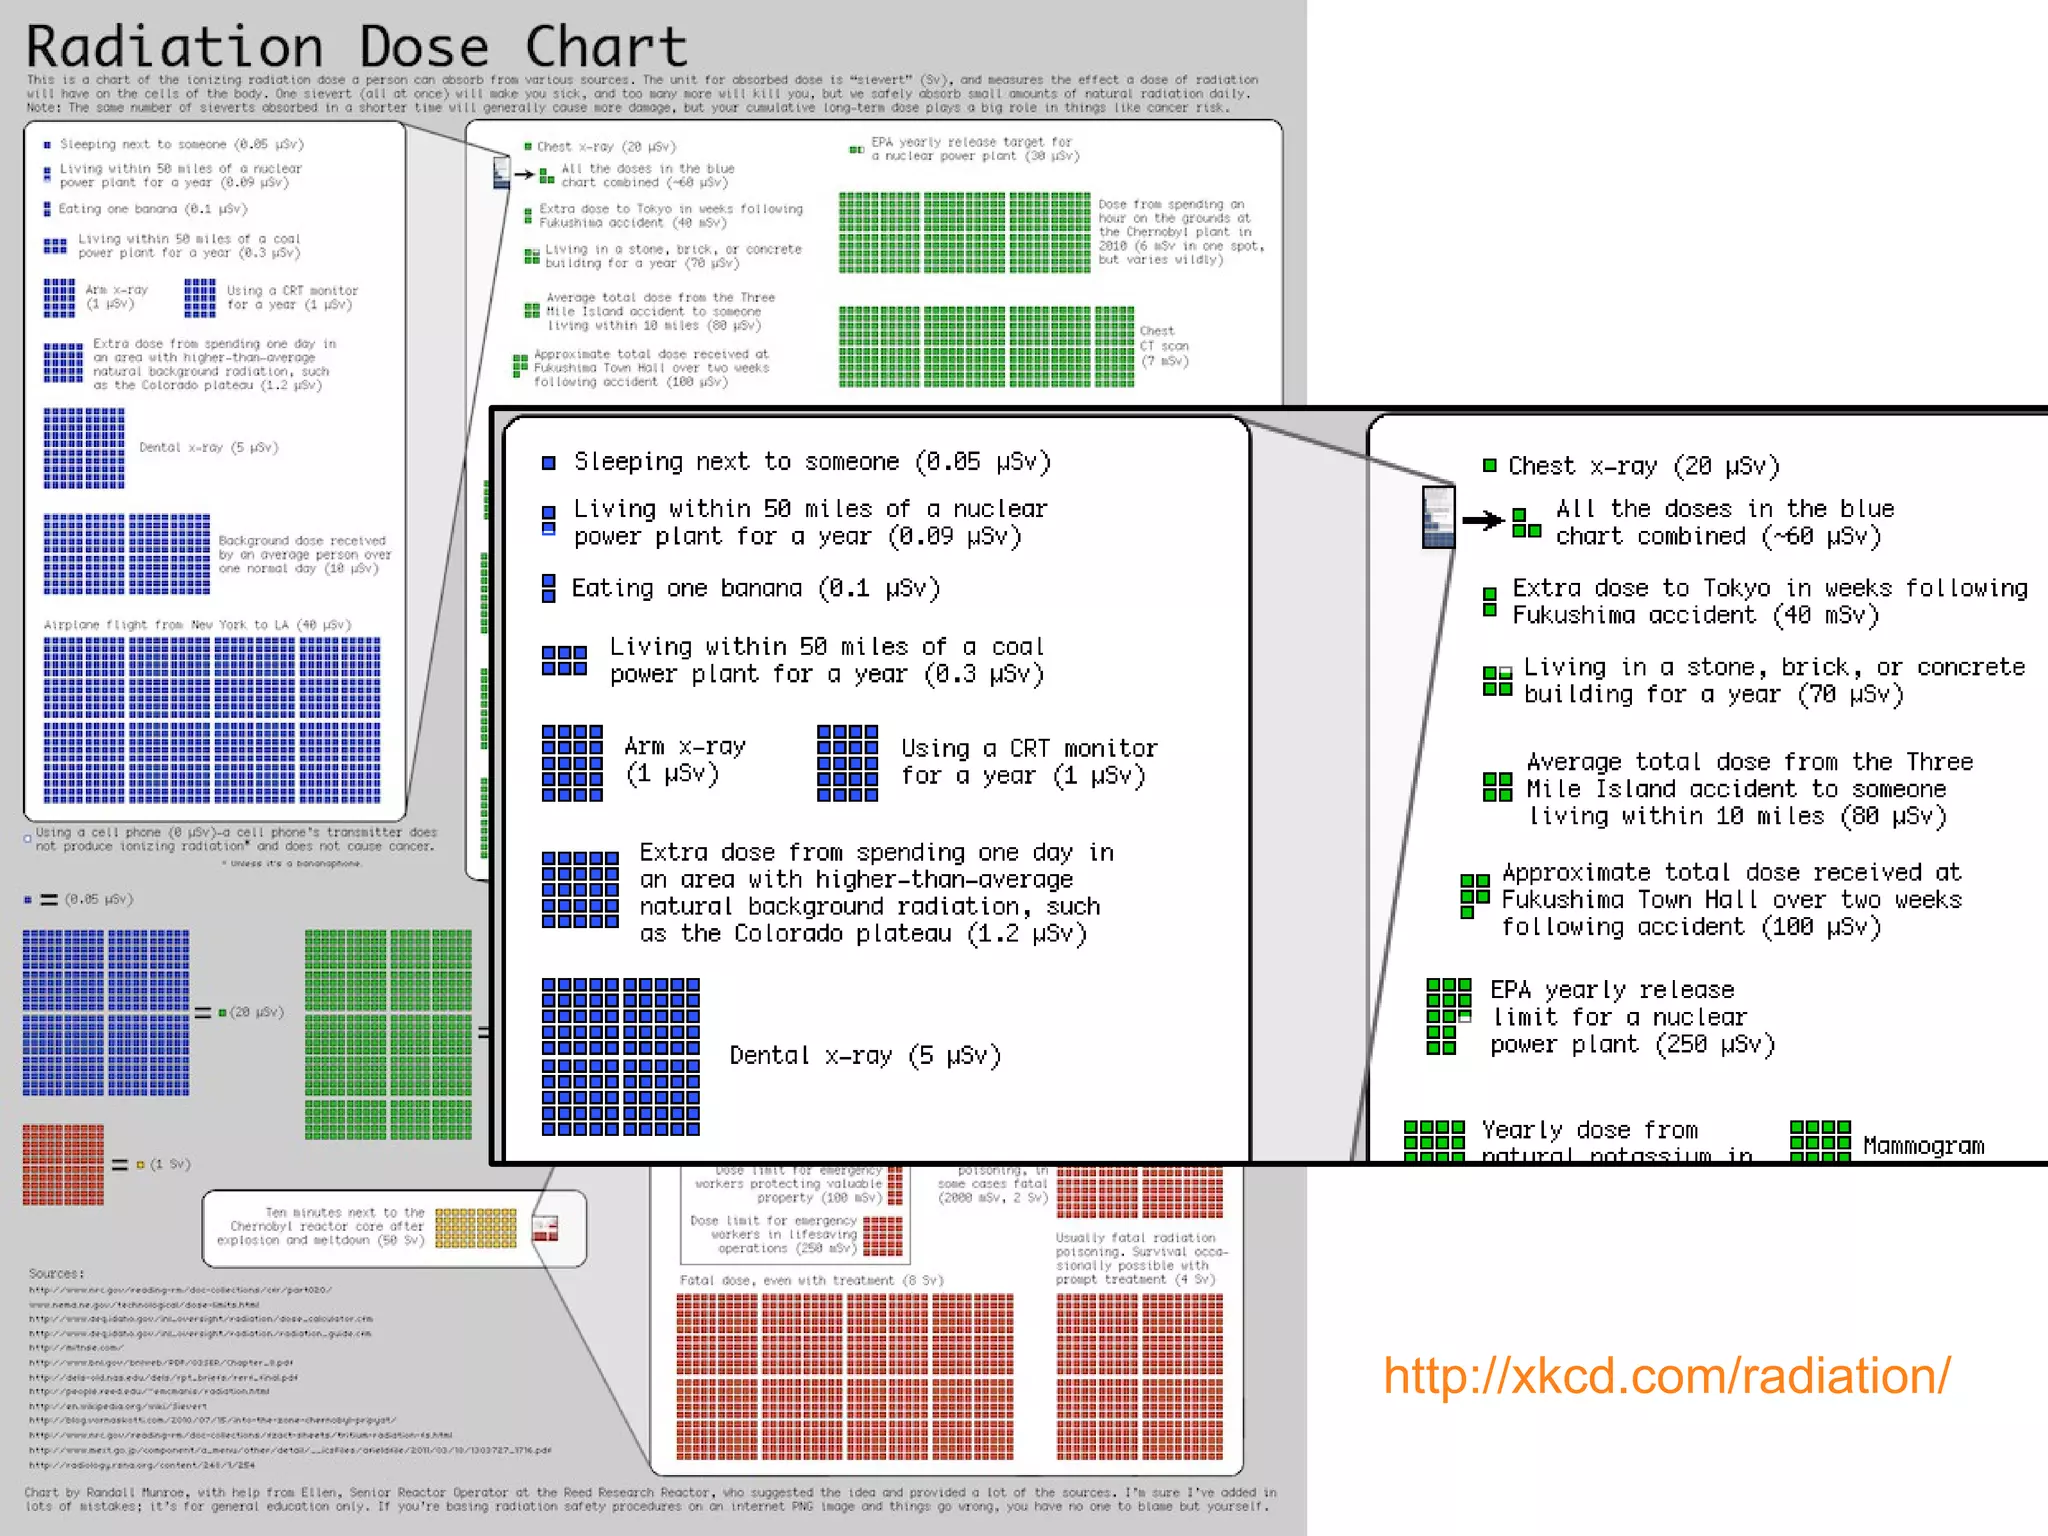
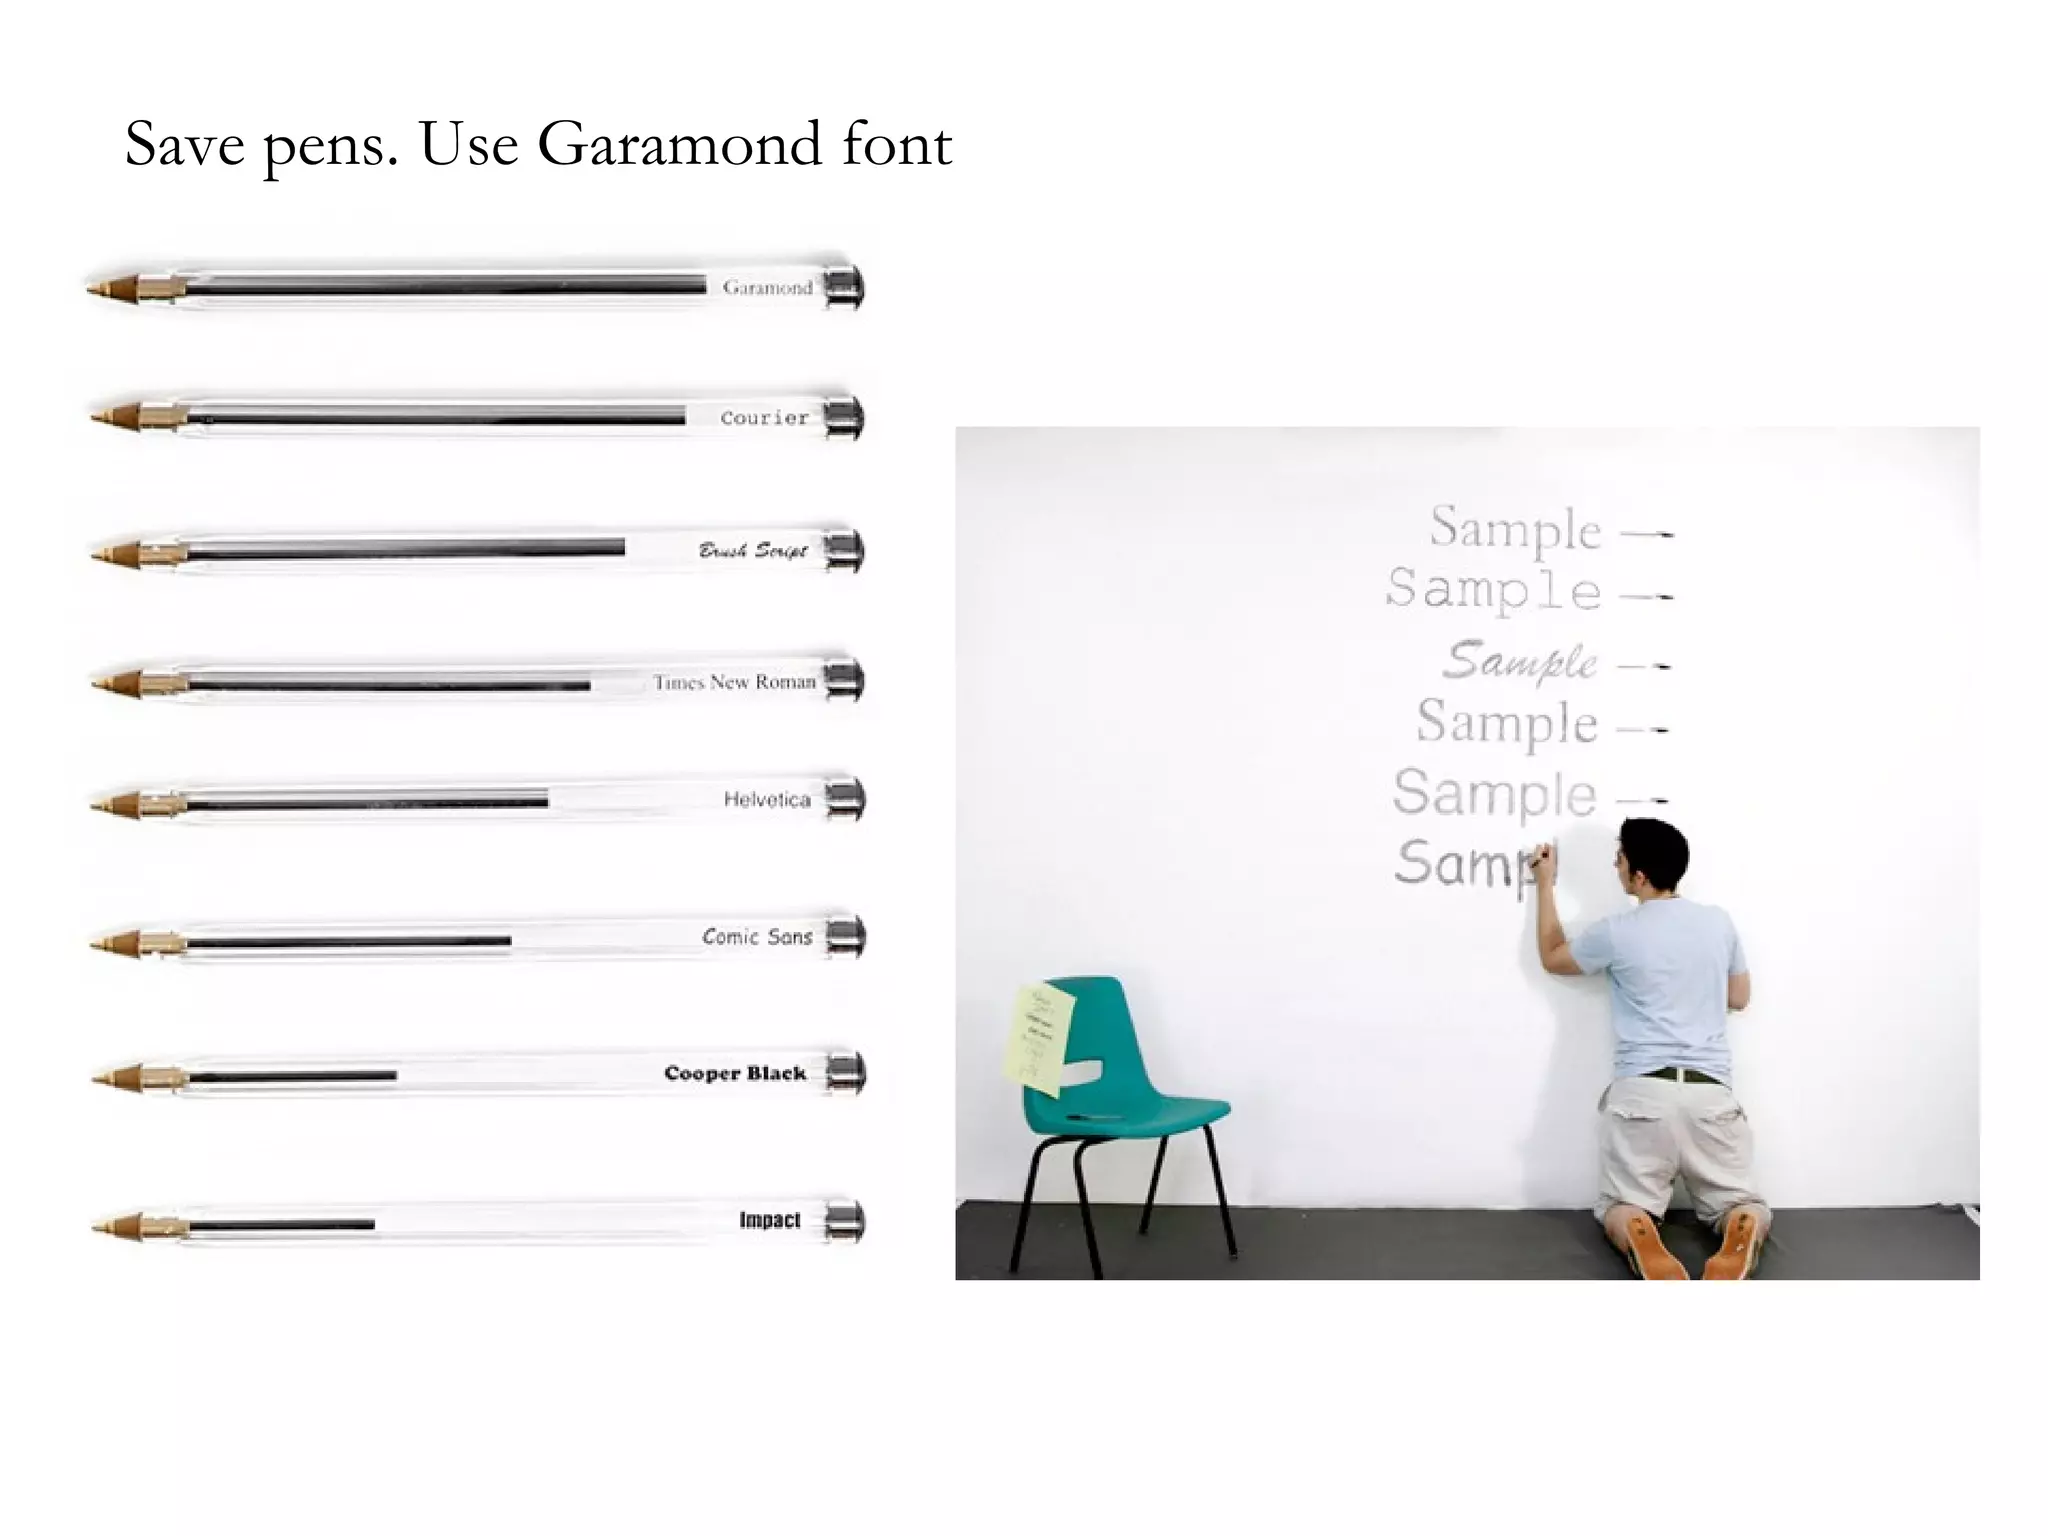
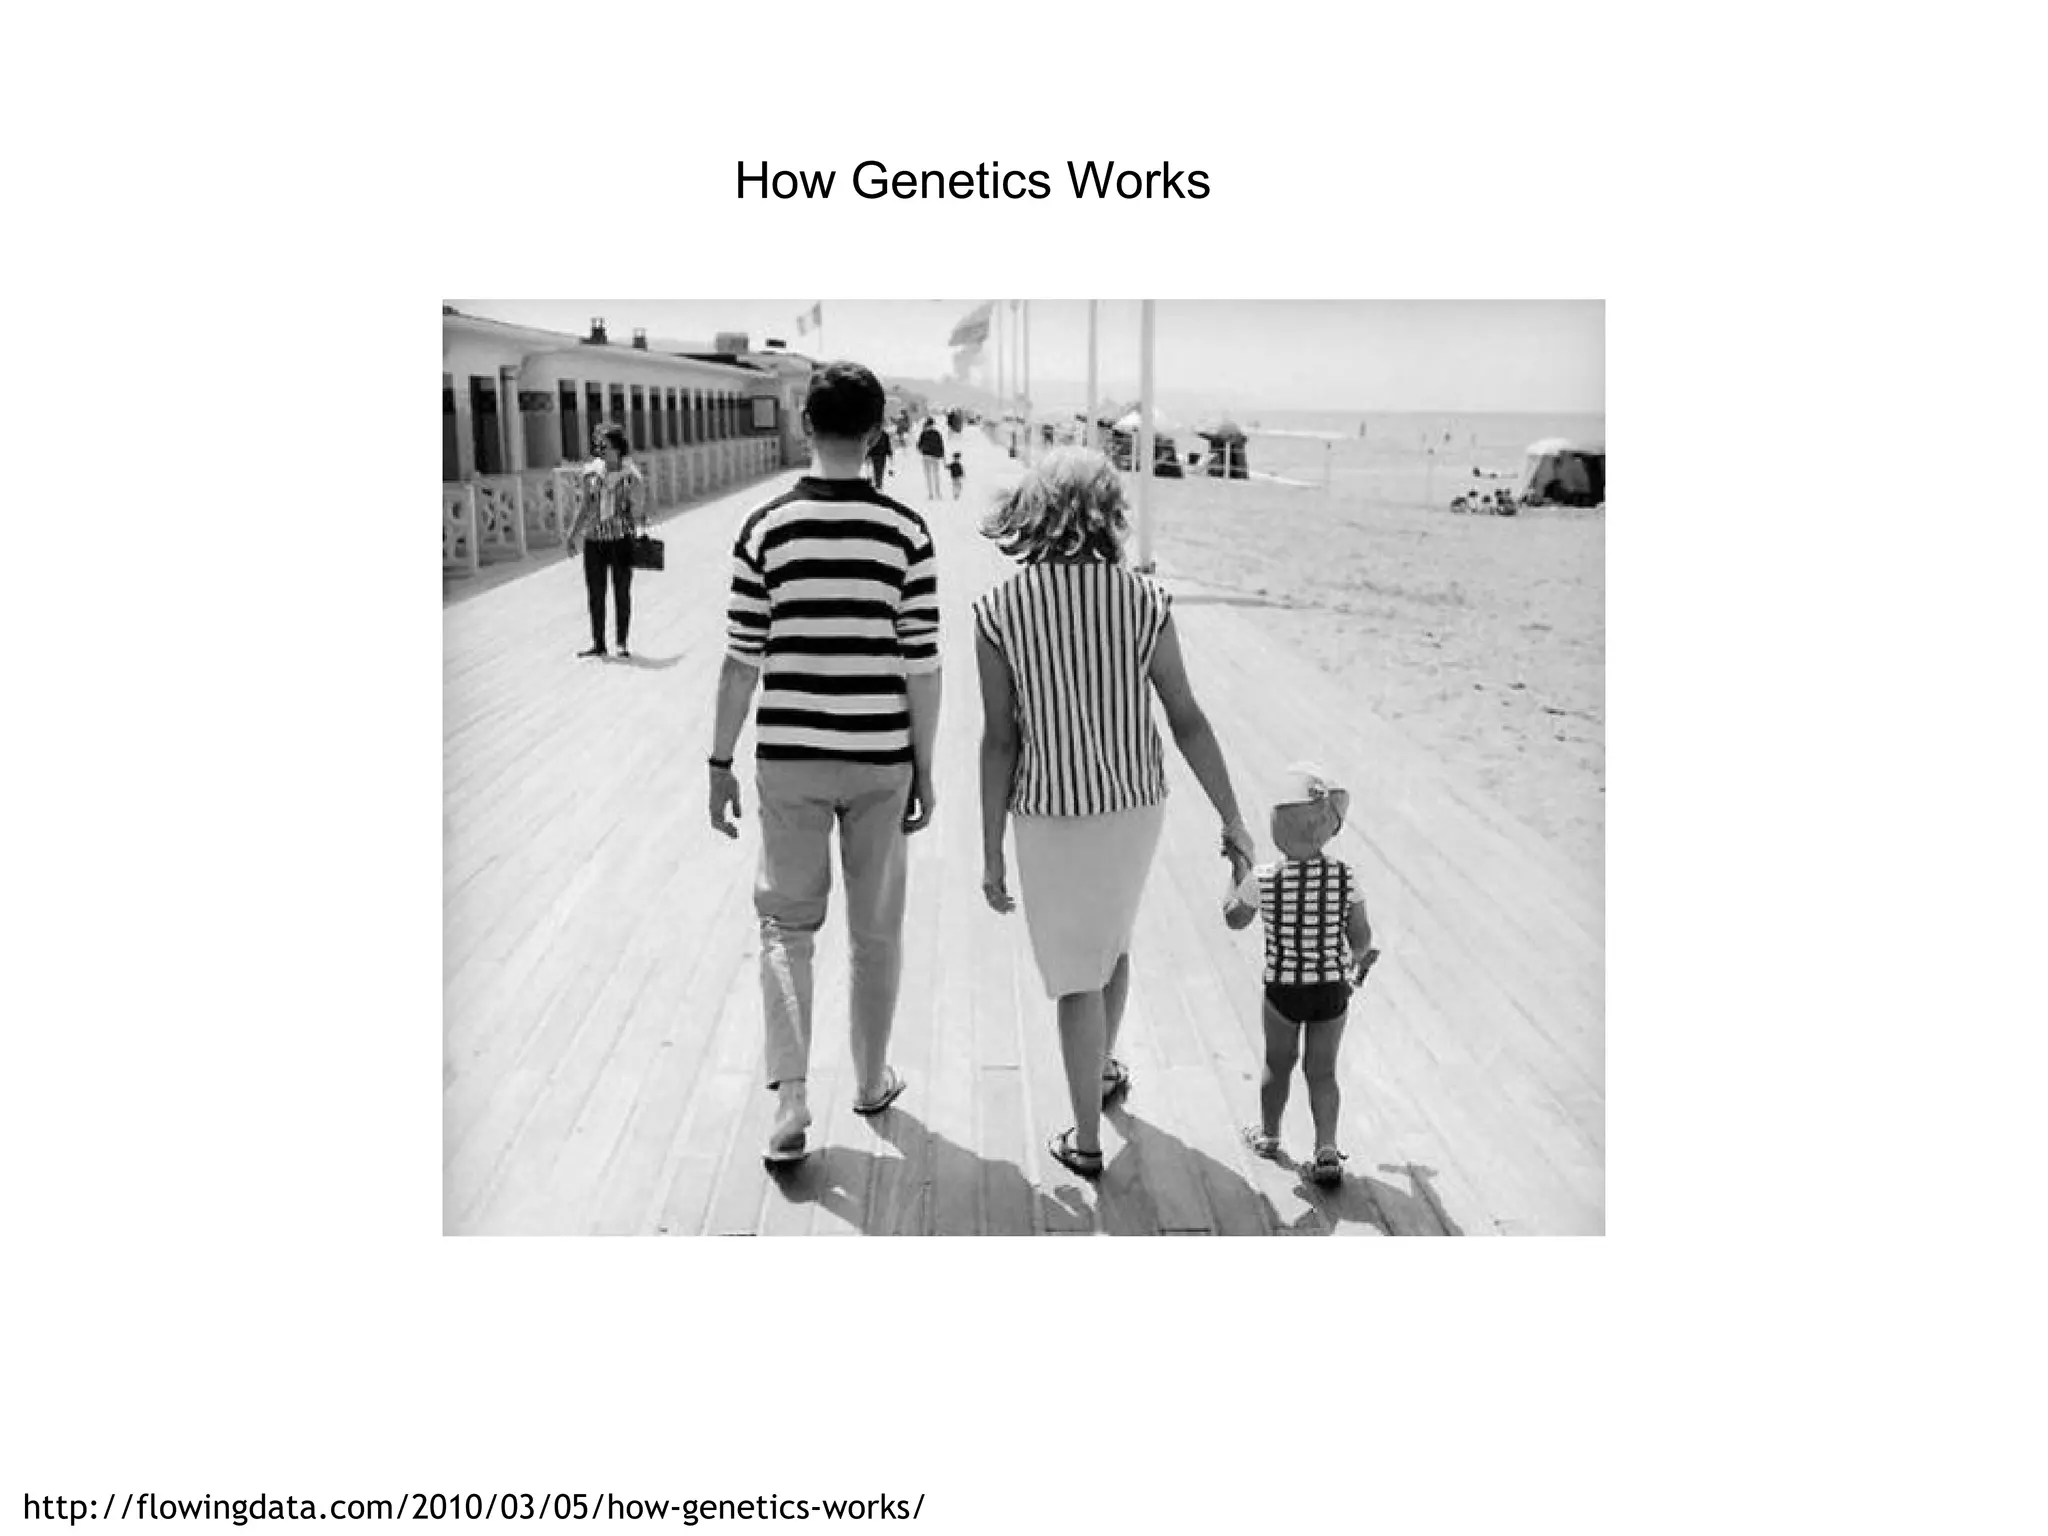
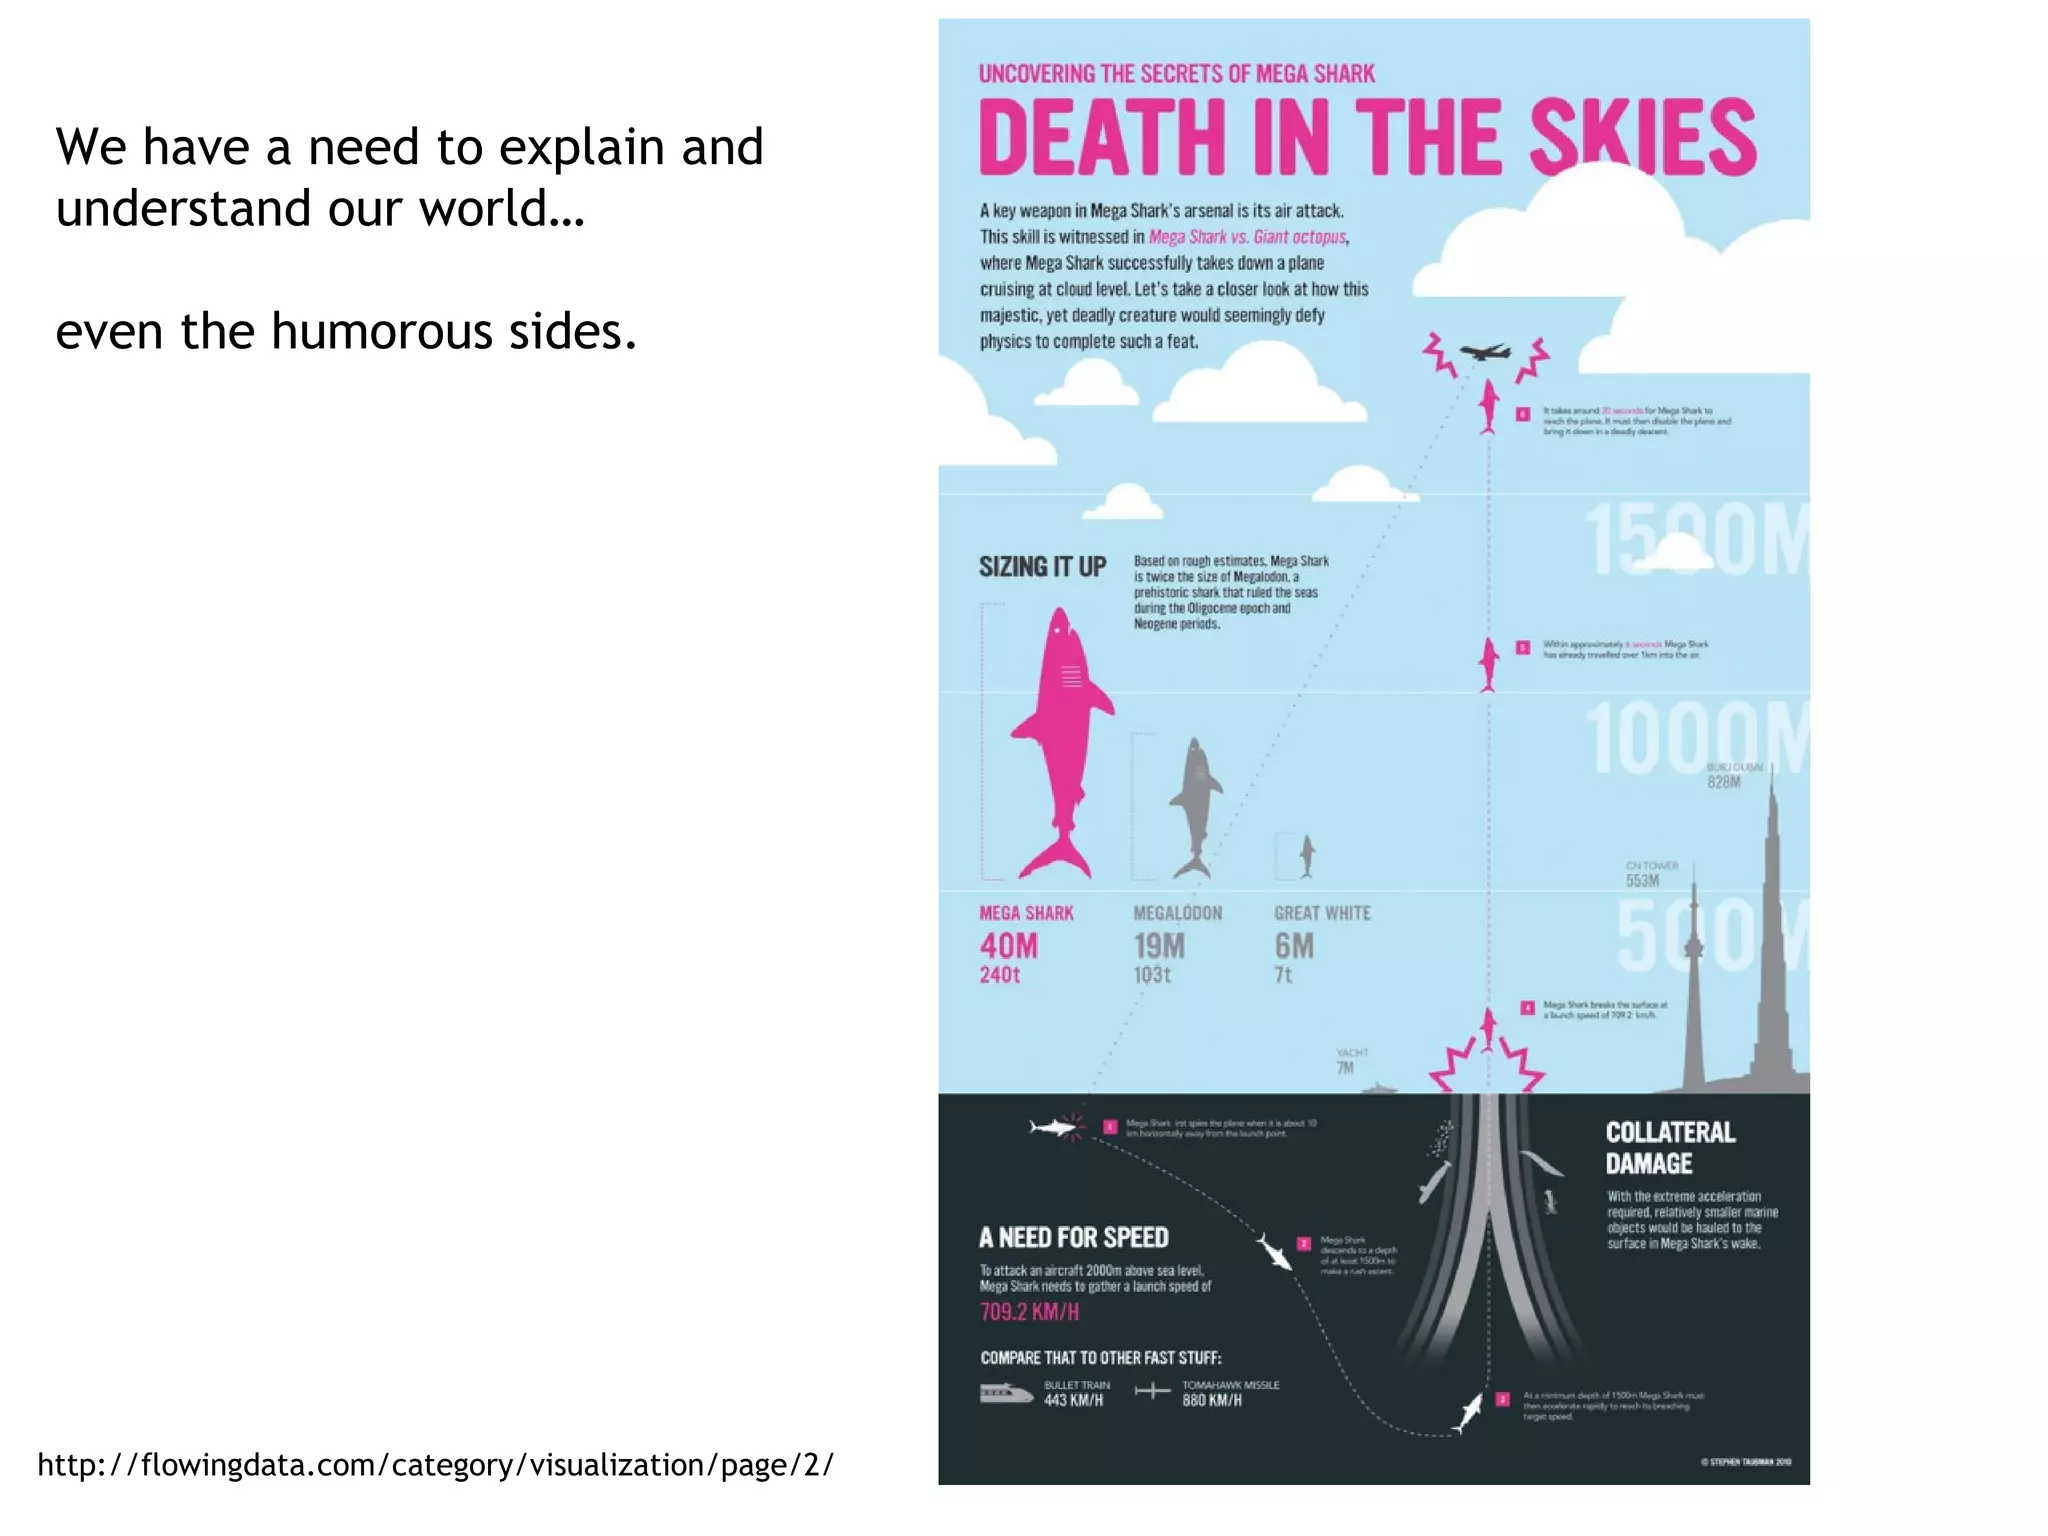
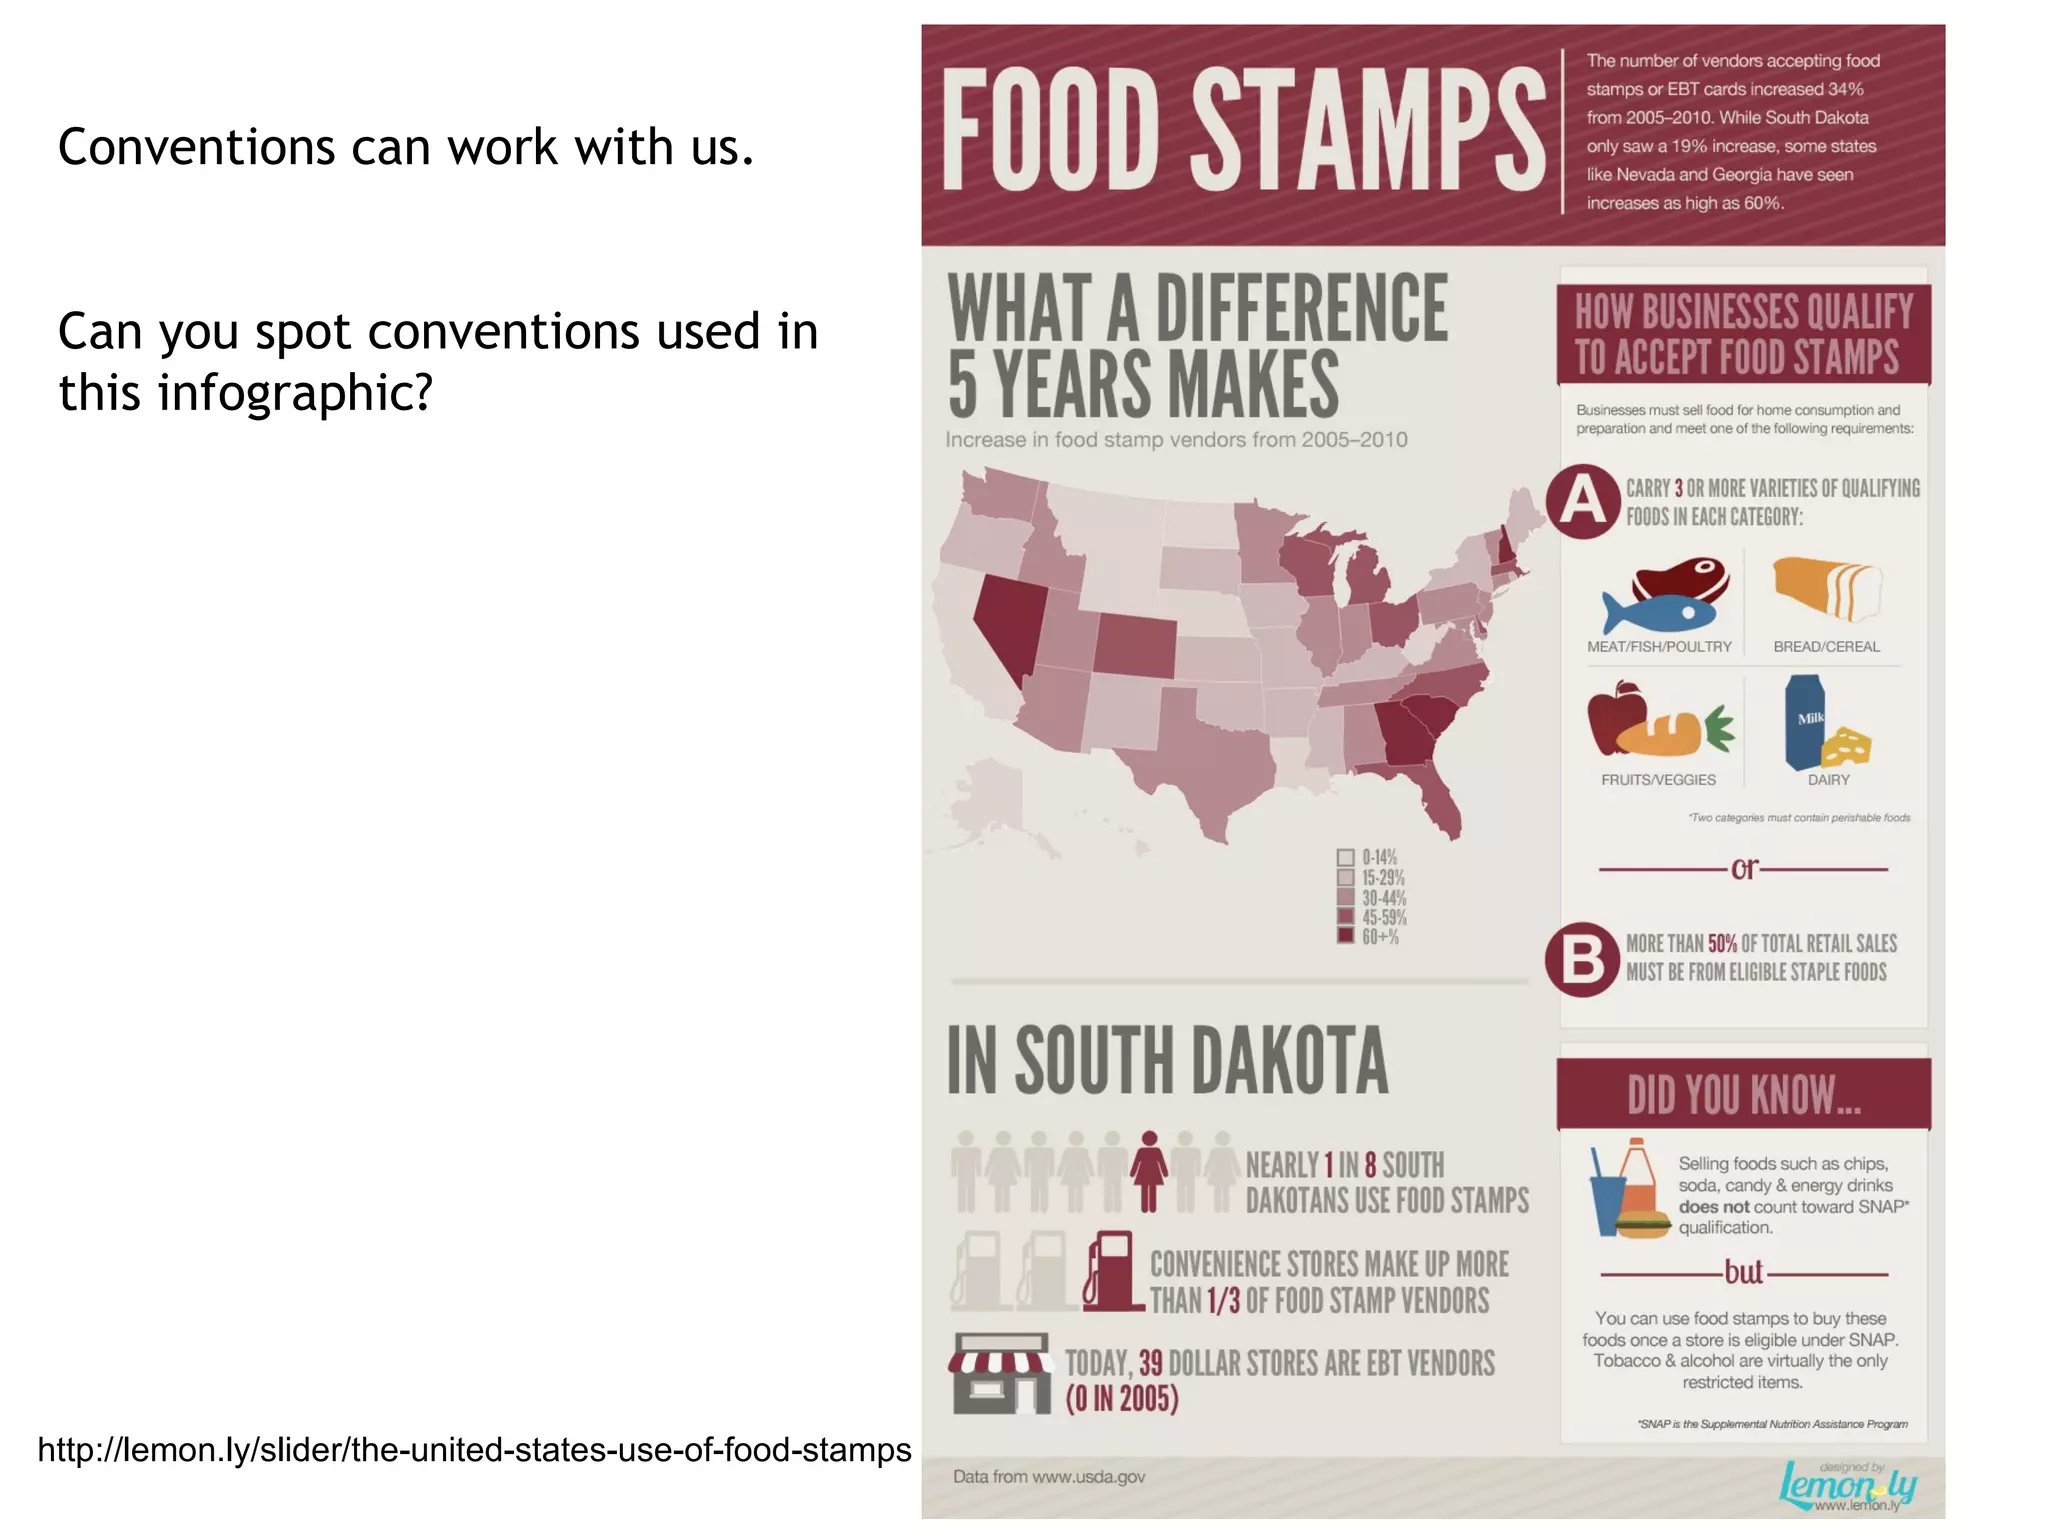


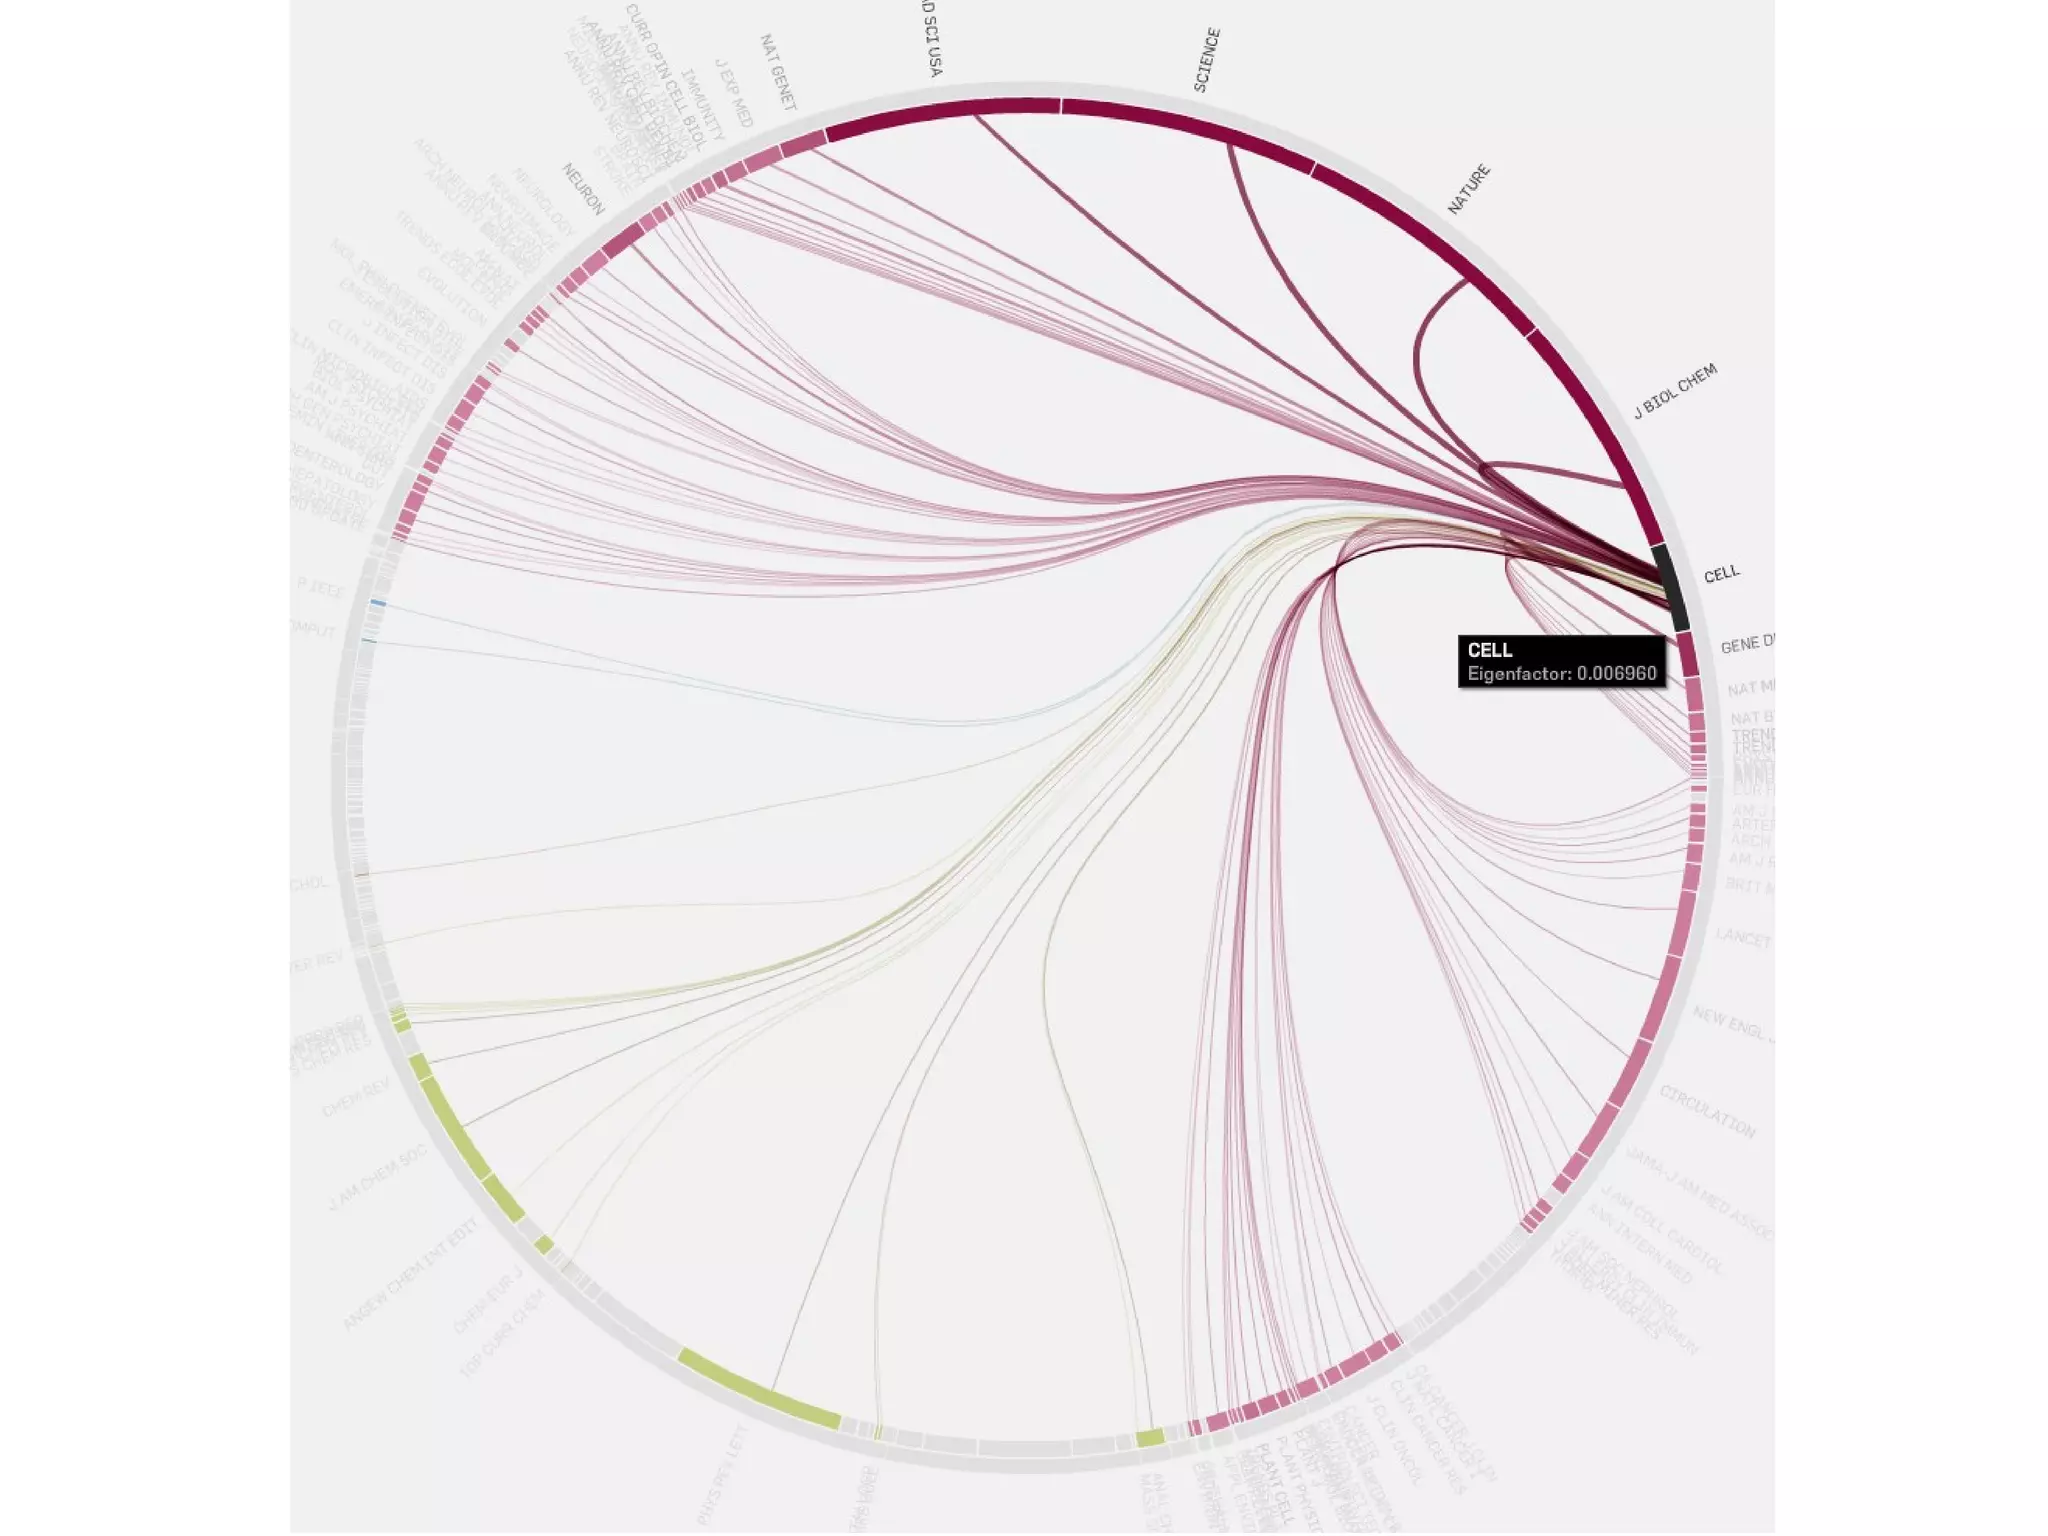
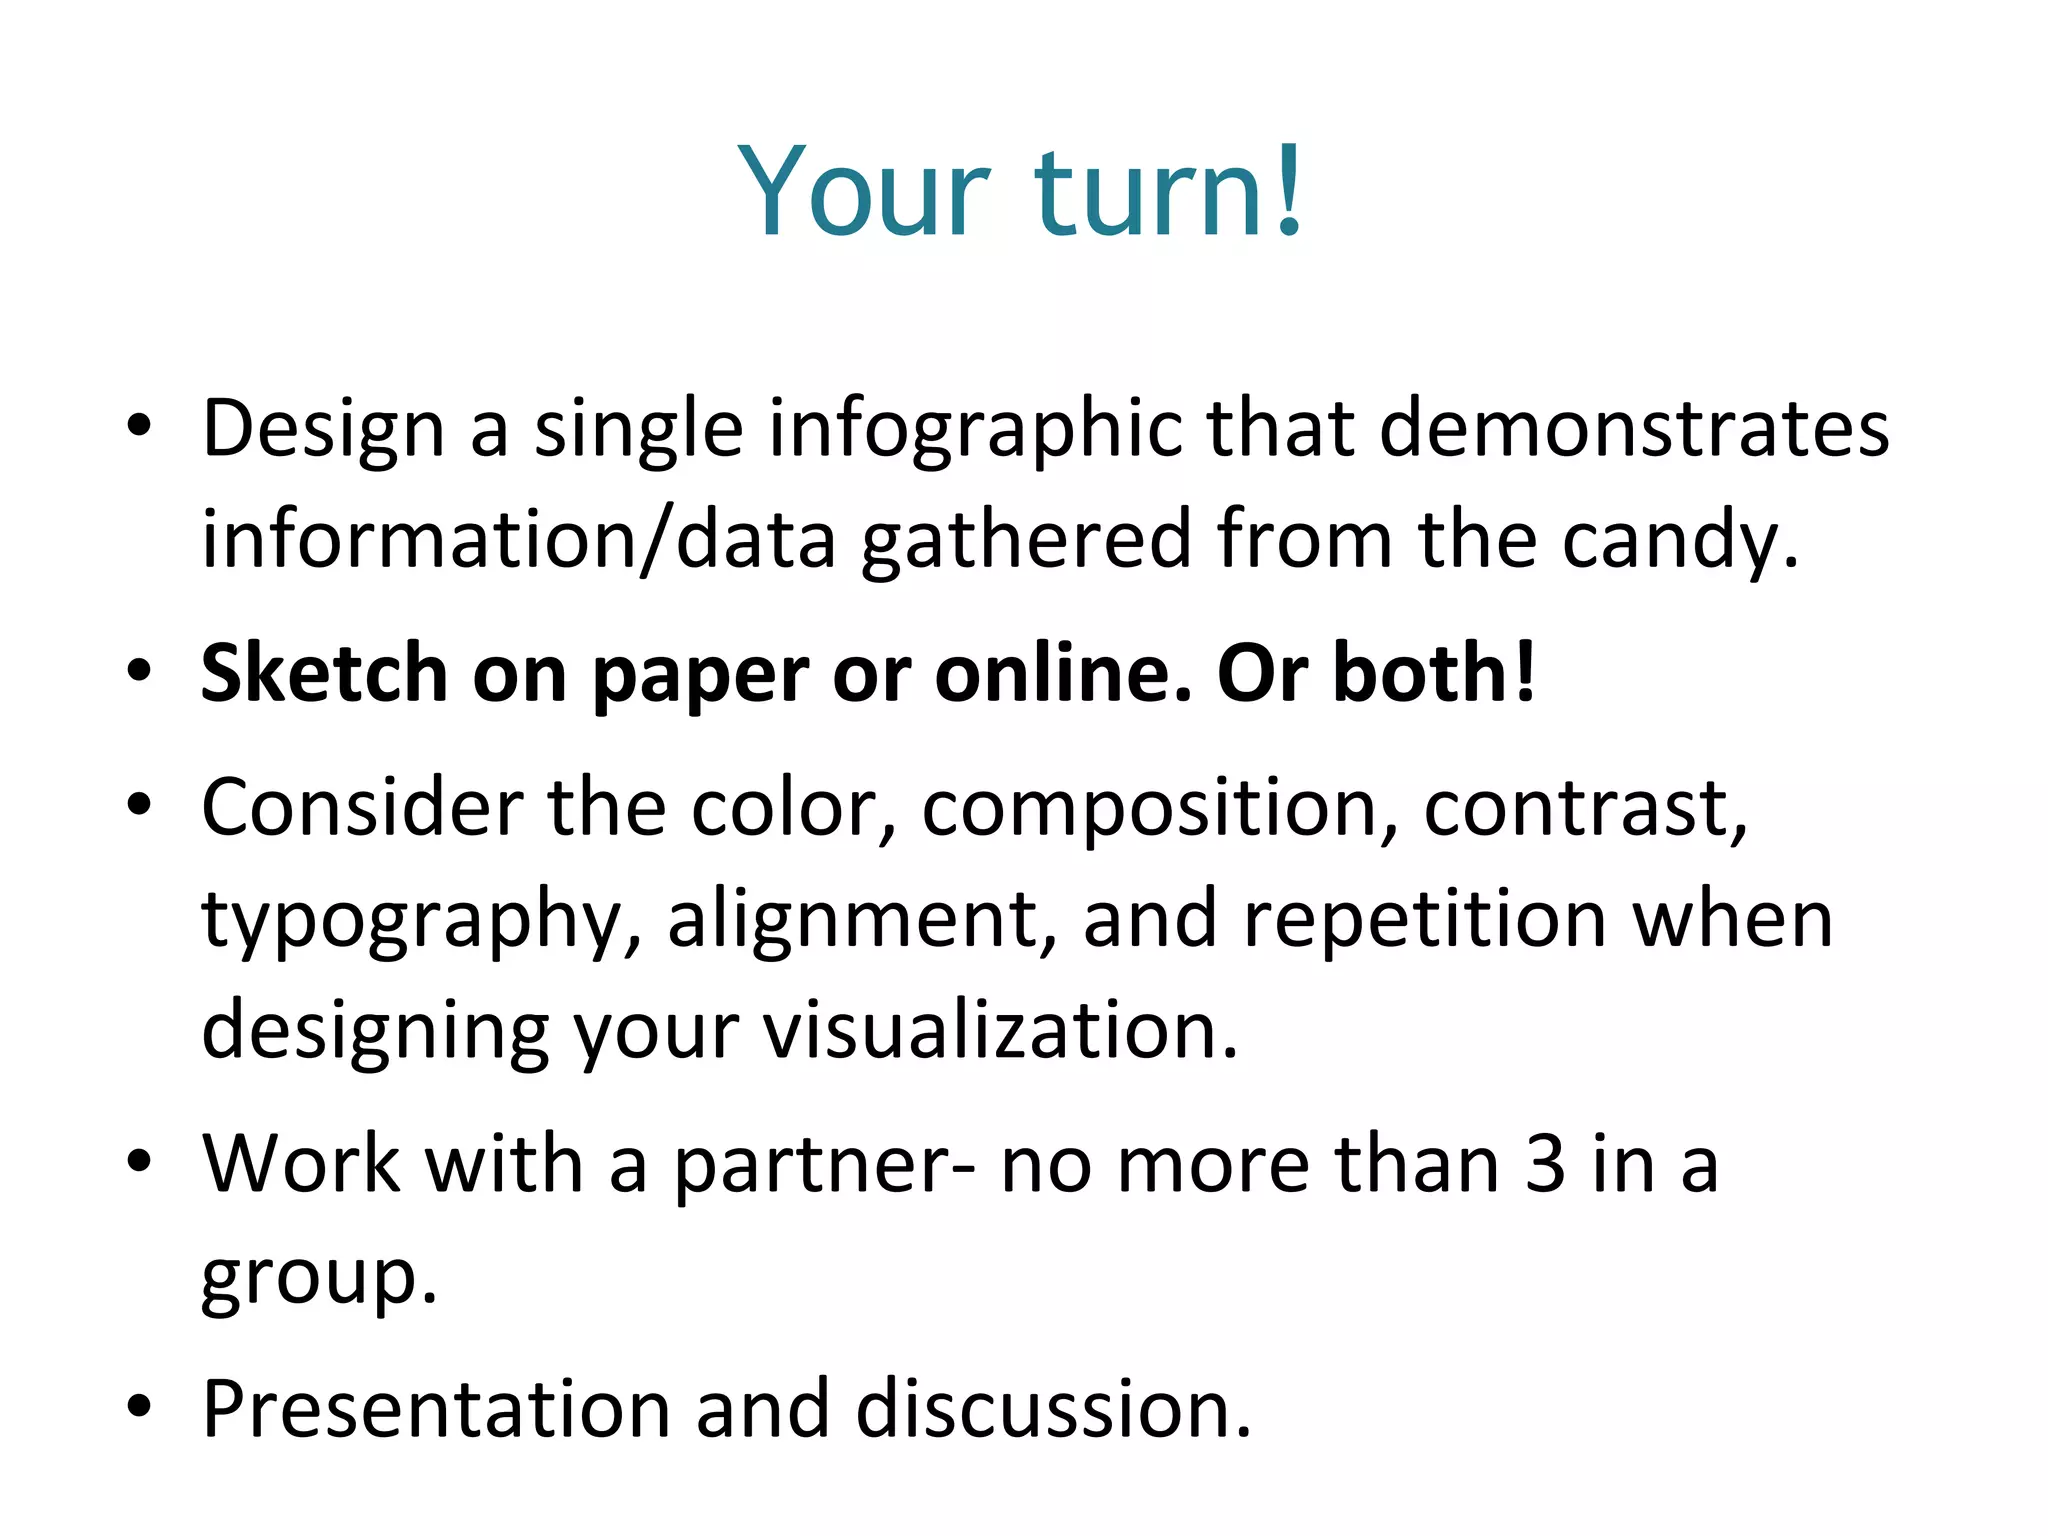

This document provides a collection of links to various data visualization websites and resources, including examples of maps, charts, and infographics related to topics like Facebook friendships, bike usage in San Francisco, comparisons of scholarly databases, radiation levels, food stamp usage, and more. Basic design principles for data visualization like color, composition, alignment and repetition are discussed. The document encourages exploring these resources and designing an infographic on candy related data to present to the group.


