Download to read offline

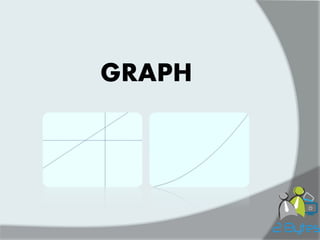


![How to paint a Normal function:
1) The function : Y= f(x) ex: (y=2x) .
2) X domain: ex: x in [ x0=-100, xn=100] .
4) Painting step dx : dx=(xn-x0)/n .
3) N number of points.
5) The Algorithm :
x1=x0; y1=F(x0);
For(i:=1) to (N) do
begin
x2 = x0+i*dx;
y2 = F(x2);
line(x1,y1,x2,y2);
x1:=x2; y1:=y2
end;](https://image.slidesharecdn.com/2bytesprog2course2014c9graph-141203173139-conversion-gate01/85/2Bytesprog2-course_2014_c9_graph-8-320.jpg)
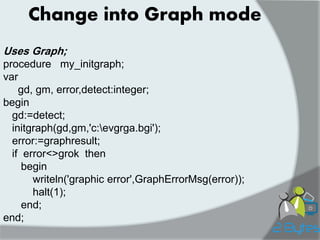
![Example :
paint ( Y=f(x) = x ) :
1- (f(x) = x ) 2- let x in [0,50] 3- n=100
4-dx=(50-0)/100 = 0.5 ;
5- Algorithm:
x1=x0; y1=x0;
For(i:=1) to (n) do
begin
x2 = x0+i*dx;
y2 = x2;
line(x1,y1,x2,y2);
x1:=x2; y1:=y2
end;
x1
y1
x2
y2
x2
y2](https://image.slidesharecdn.com/2bytesprog2course2014c9graph-141203173139-conversion-gate01/85/2Bytesprog2-course_2014_c9_graph-9-320.jpg)
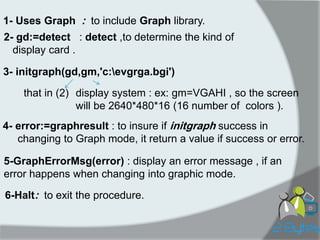
![How to paint a Polar function:
1) The function :R= F(u) ex: (y=cos(x) ) .
2) U domain: ex: U in [ u0=-100, un=100] .
4) Painting step du : du=(Un-U0)/n .
3) N number of points.
5) The Algorithm :
x1=F(u0)*cos(u0); y1=F(u0)*sin(u0);
For(i:=1) to (N) do
begin
U= u0+ i*du;
x2=F(u)*cos(u);
y2=F(u)*sin(u);
line(x1,y1,x2,y2);
x1:=x2; y1:=y2
end;
x
y
U](https://image.slidesharecdn.com/2bytesprog2course2014c9graph-141203173139-conversion-gate01/85/2Bytesprog2-course_2014_c9_graph-10-320.jpg)
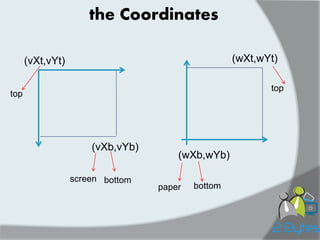
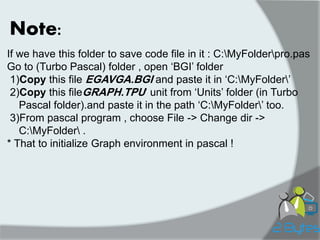
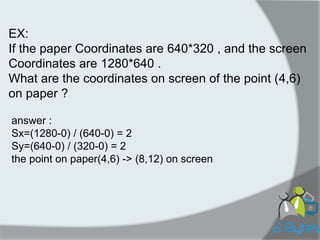
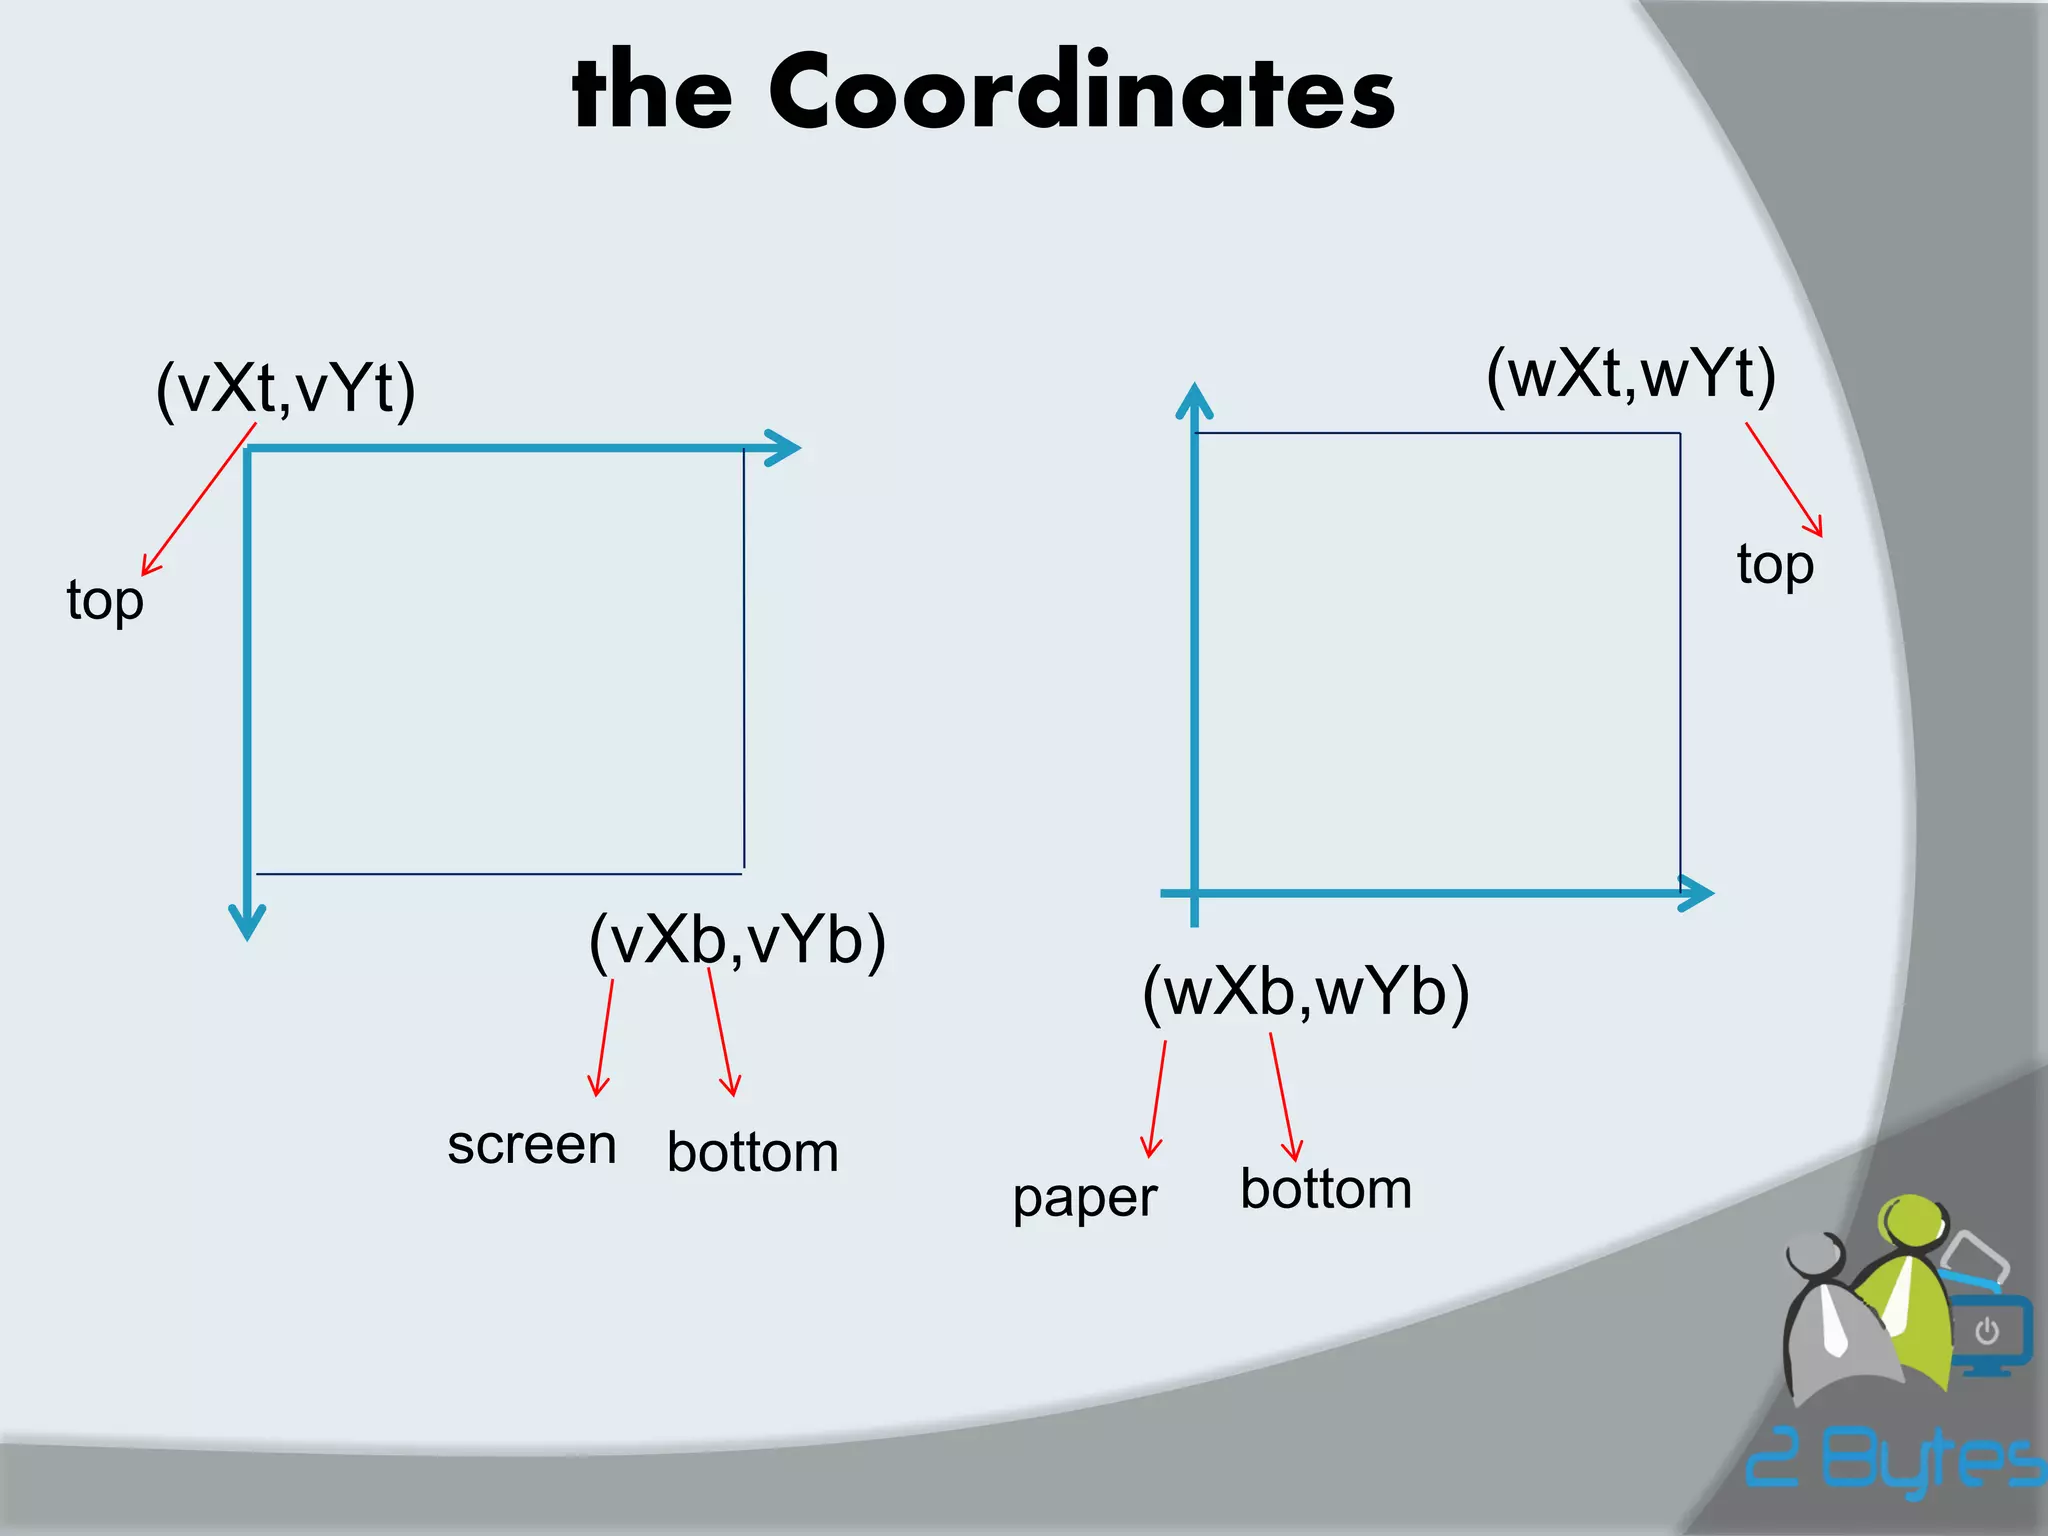
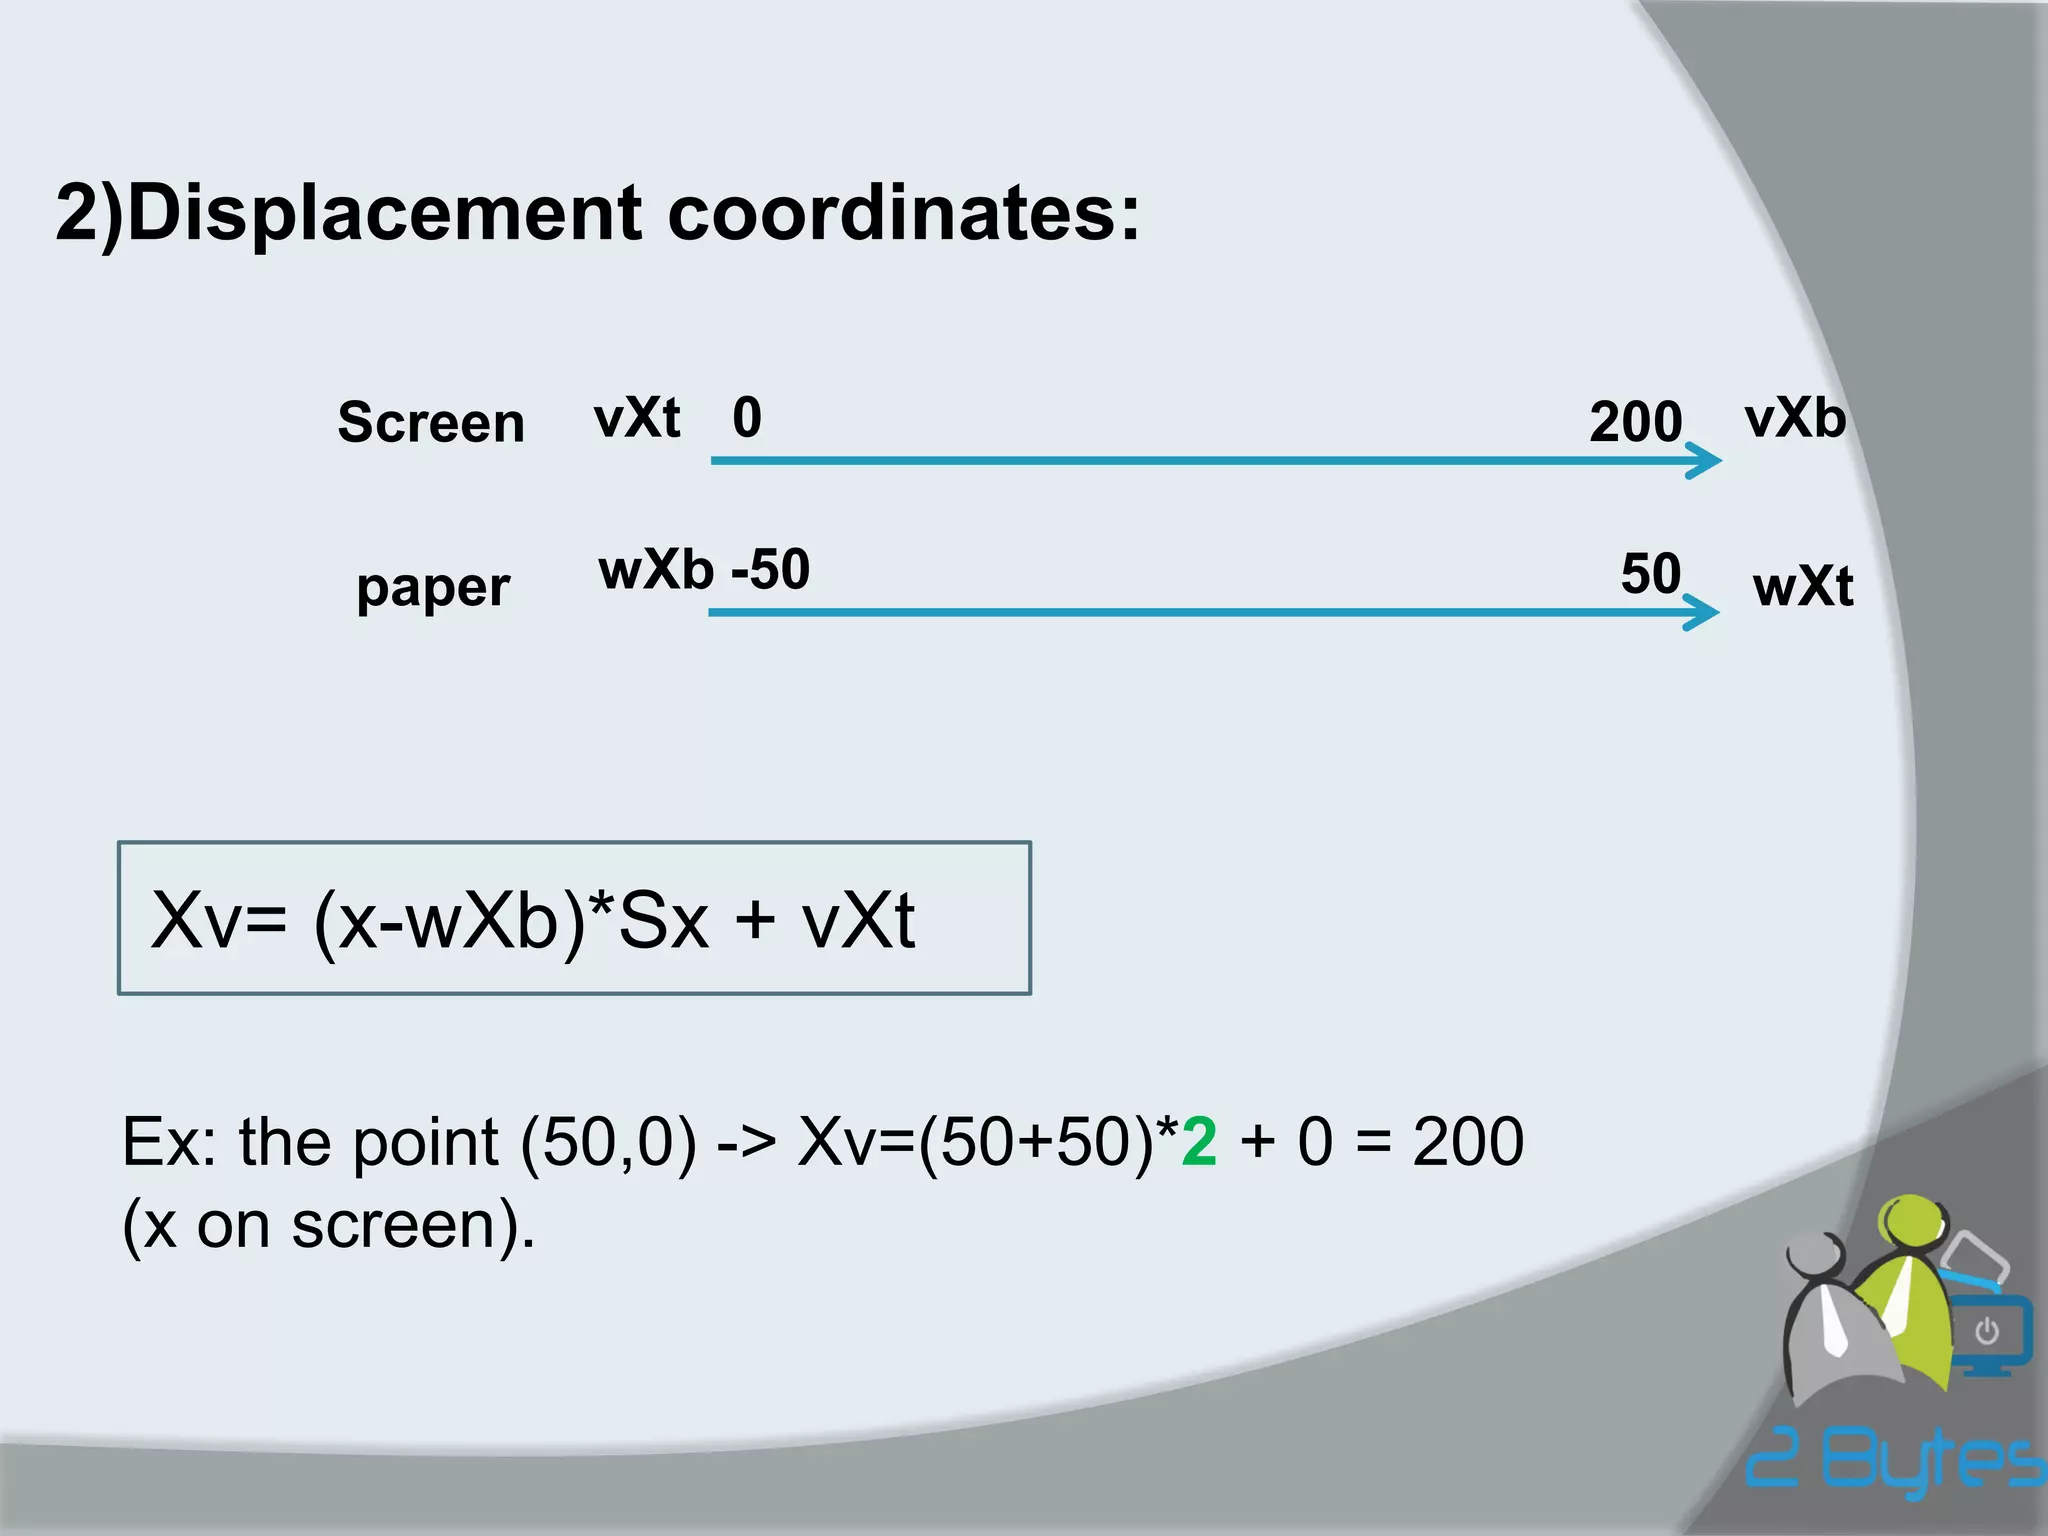
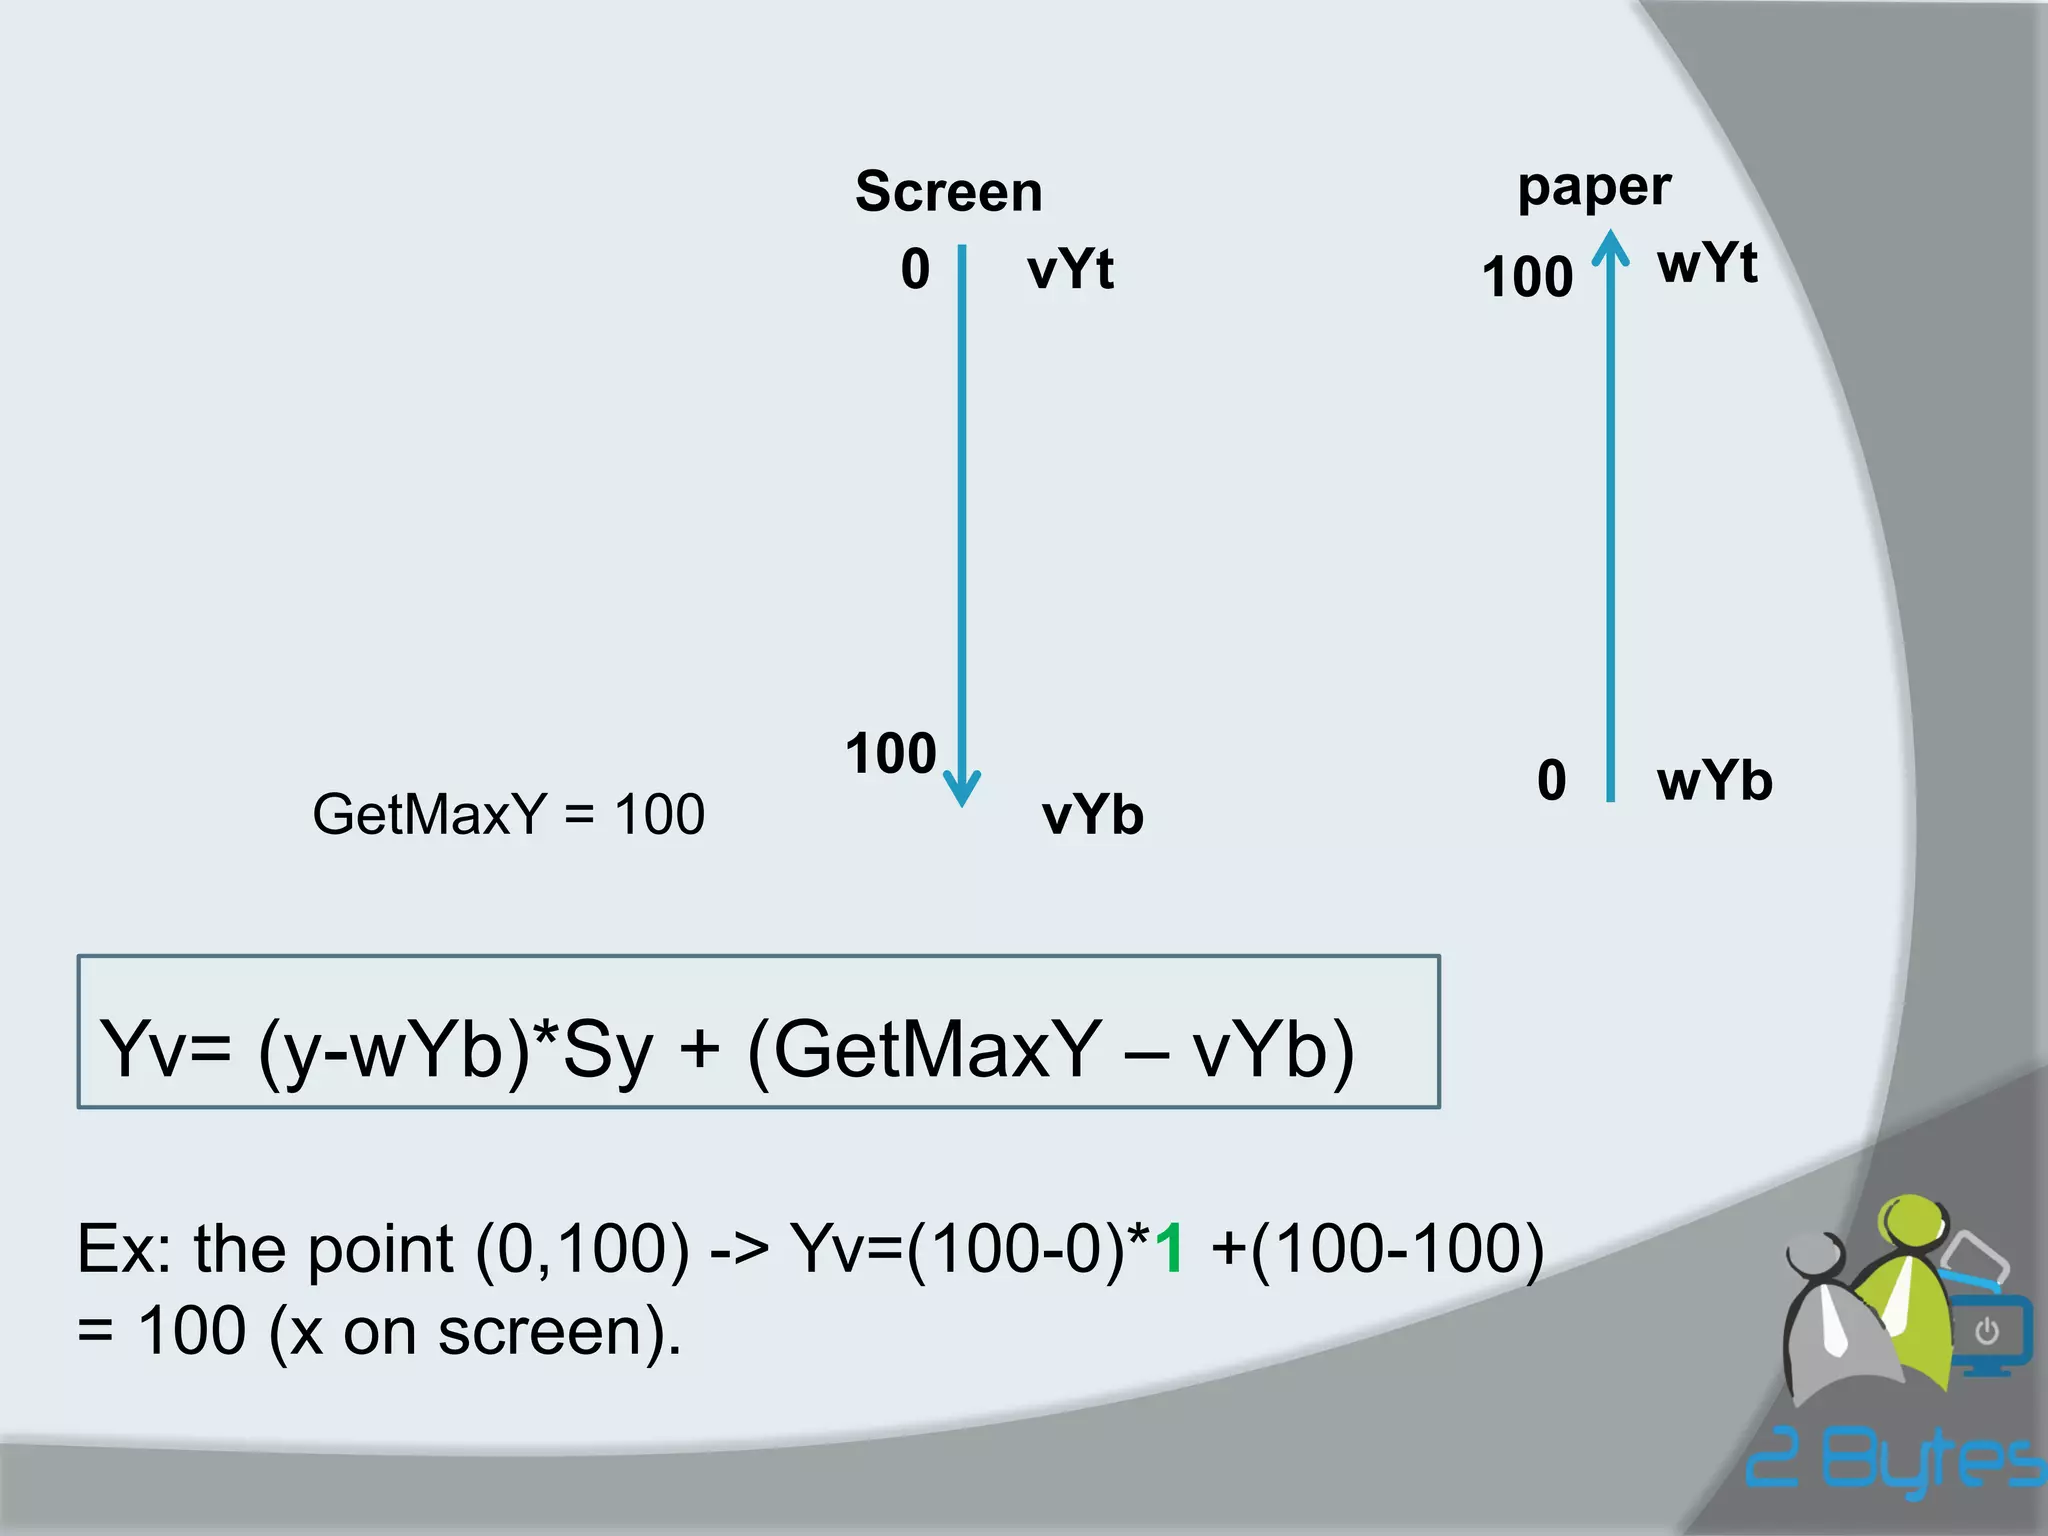
![Coordinates appropriate
- If you have On paper x in [0..460]
..it would be On Screen x in [0..230]
- So each two points on screen , one point on paper .
(6,0) paper -> (3,0) screen
- So the Ratio:
Sx = | vXb – vXt | / | wXt – wXb |
Sy = | vYb – vYt | / | wYt – wYb |
0
460
230
0
vXt
vXb
wXb
wXt
3
6
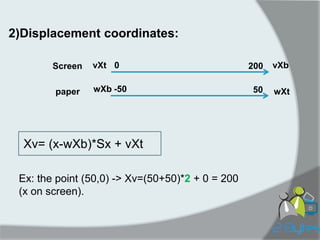
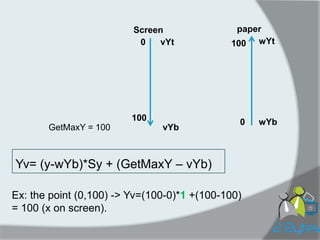
1)Increasing and decreasing coordinates:](https://image.slidesharecdn.com/2bytesprog2course2014c9graph-141203173139-conversion-gate01/85/2Bytesprog2-course_2014_c9_graph-12-320.jpg)
![Some important functions and procedures :
Line(x1,y1,x2,y2) : draw a line between the two points.
Circle(x,y,radius) : draw a circle .
Rectangle(x1,y1,x2,y2): draw a rectangle between the two points .
Setcolor(color): change the color where the color is a number from [0..15] and each number is a color.
Setviewport(x1,y1,x2,y2,clipOn/clipOff): determine a specific display window
clipOn: inside it we can see, clipOff: outside it we can see.
TXTout(“Hello world”) or TXToutXY(50,20,“Hello world”) : print a text on screen with Graphicmode (at specific coordinate),
whereas at TXTmode we use writeln,write .](https://image.slidesharecdn.com/2bytesprog2course2014c9graph-141203173139-conversion-gate01/85/2Bytesprog2-course_2014_c9_graph-16-320.jpg)

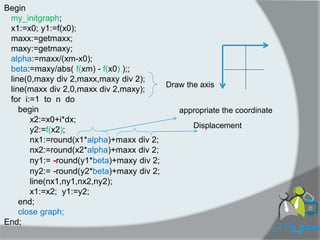
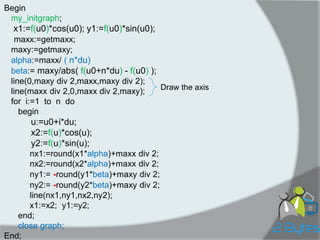
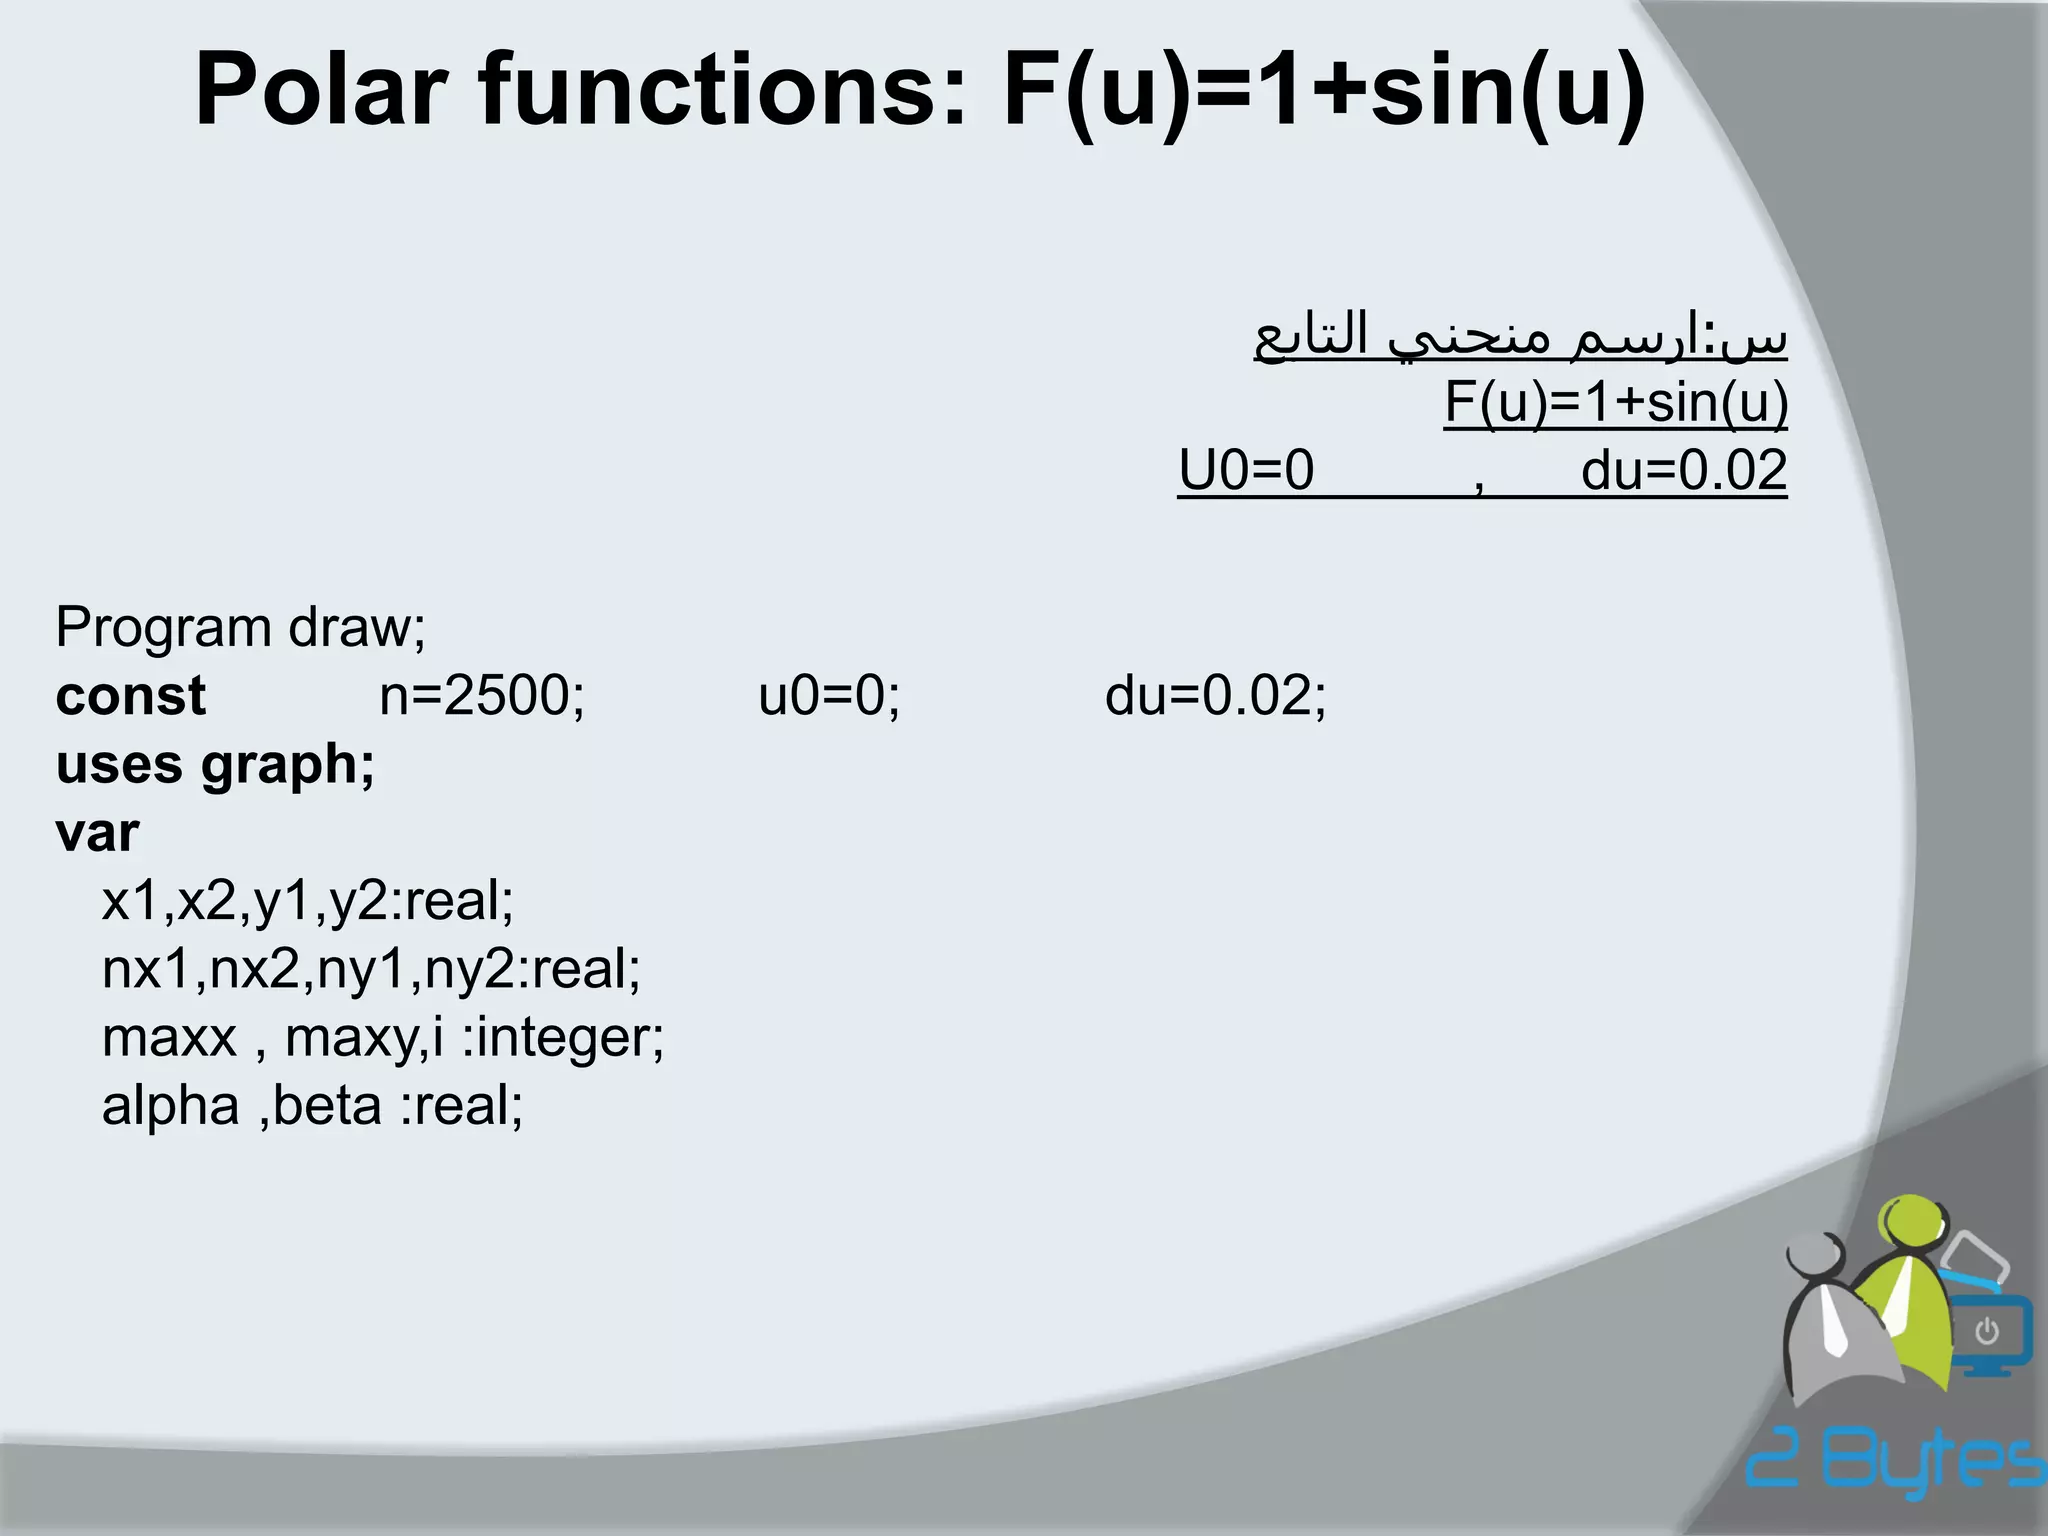
![Normal functions: F(x)=1+x2
س:ارسم الخط البياني للتابع:
2+x1
F(x)=
حيث x ضمن المجال ]100,+100-[
2000
N=
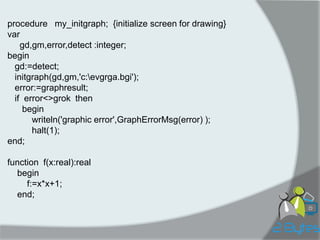
Program draw;
const n=2000; x0=-100; xm=100; dx=0.1 ; { (xm-x0)/n= [100-(-100)]/2000=0.1} uses graph; var x1,x2,y1,y2:real; nx1,nx2,ny1,ny2:real; maxx , maxy , i : integer; alpha , beta :real;](https://image.slidesharecdn.com/2bytesprog2course2014c9graph-141203173139-conversion-gate01/85/2Bytesprog2-course_2014_c9_graph-18-320.jpg)
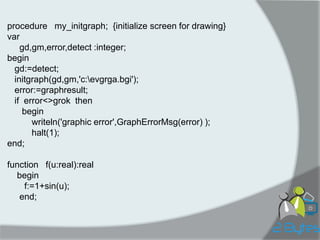


![How to paint a Normal function:
1) The function : Y= f(x) ex: (y=2x) .
2) X domain: ex: x in [ x0=-100, xn=100] .
4) Painting step dx : dx=(xn-x0)/n .
3) N number of points.
5) The Algorithm :
x1=x0; y1=F(x0);
For(i:=1) to (N) do
begin
x2 = x0+i*dx;
y2 = F(x2);
line(x1,y1,x2,y2);
x1:=x2; y1:=y2
end;](https://image.slidesharecdn.com/2bytesprog2course2014c9graph-141203173139-conversion-gate01/75/2Bytesprog2-course_2014_c9_graph-8-2048.jpg)
![Example :
paint ( Y=f(x) = x ) :
1- (f(x) = x ) 2- let x in [0,50] 3- n=100
4-dx=(50-0)/100 = 0.5 ;
5- Algorithm:
x1=x0; y1=x0;
For(i:=1) to (n) do
begin
x2 = x0+i*dx;
y2 = x2;
line(x1,y1,x2,y2);
x1:=x2; y1:=y2
end;
x1
y1
x2
y2
x2
y2](https://image.slidesharecdn.com/2bytesprog2course2014c9graph-141203173139-conversion-gate01/75/2Bytesprog2-course_2014_c9_graph-9-2048.jpg)
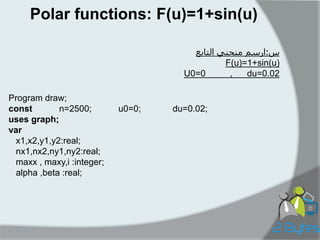
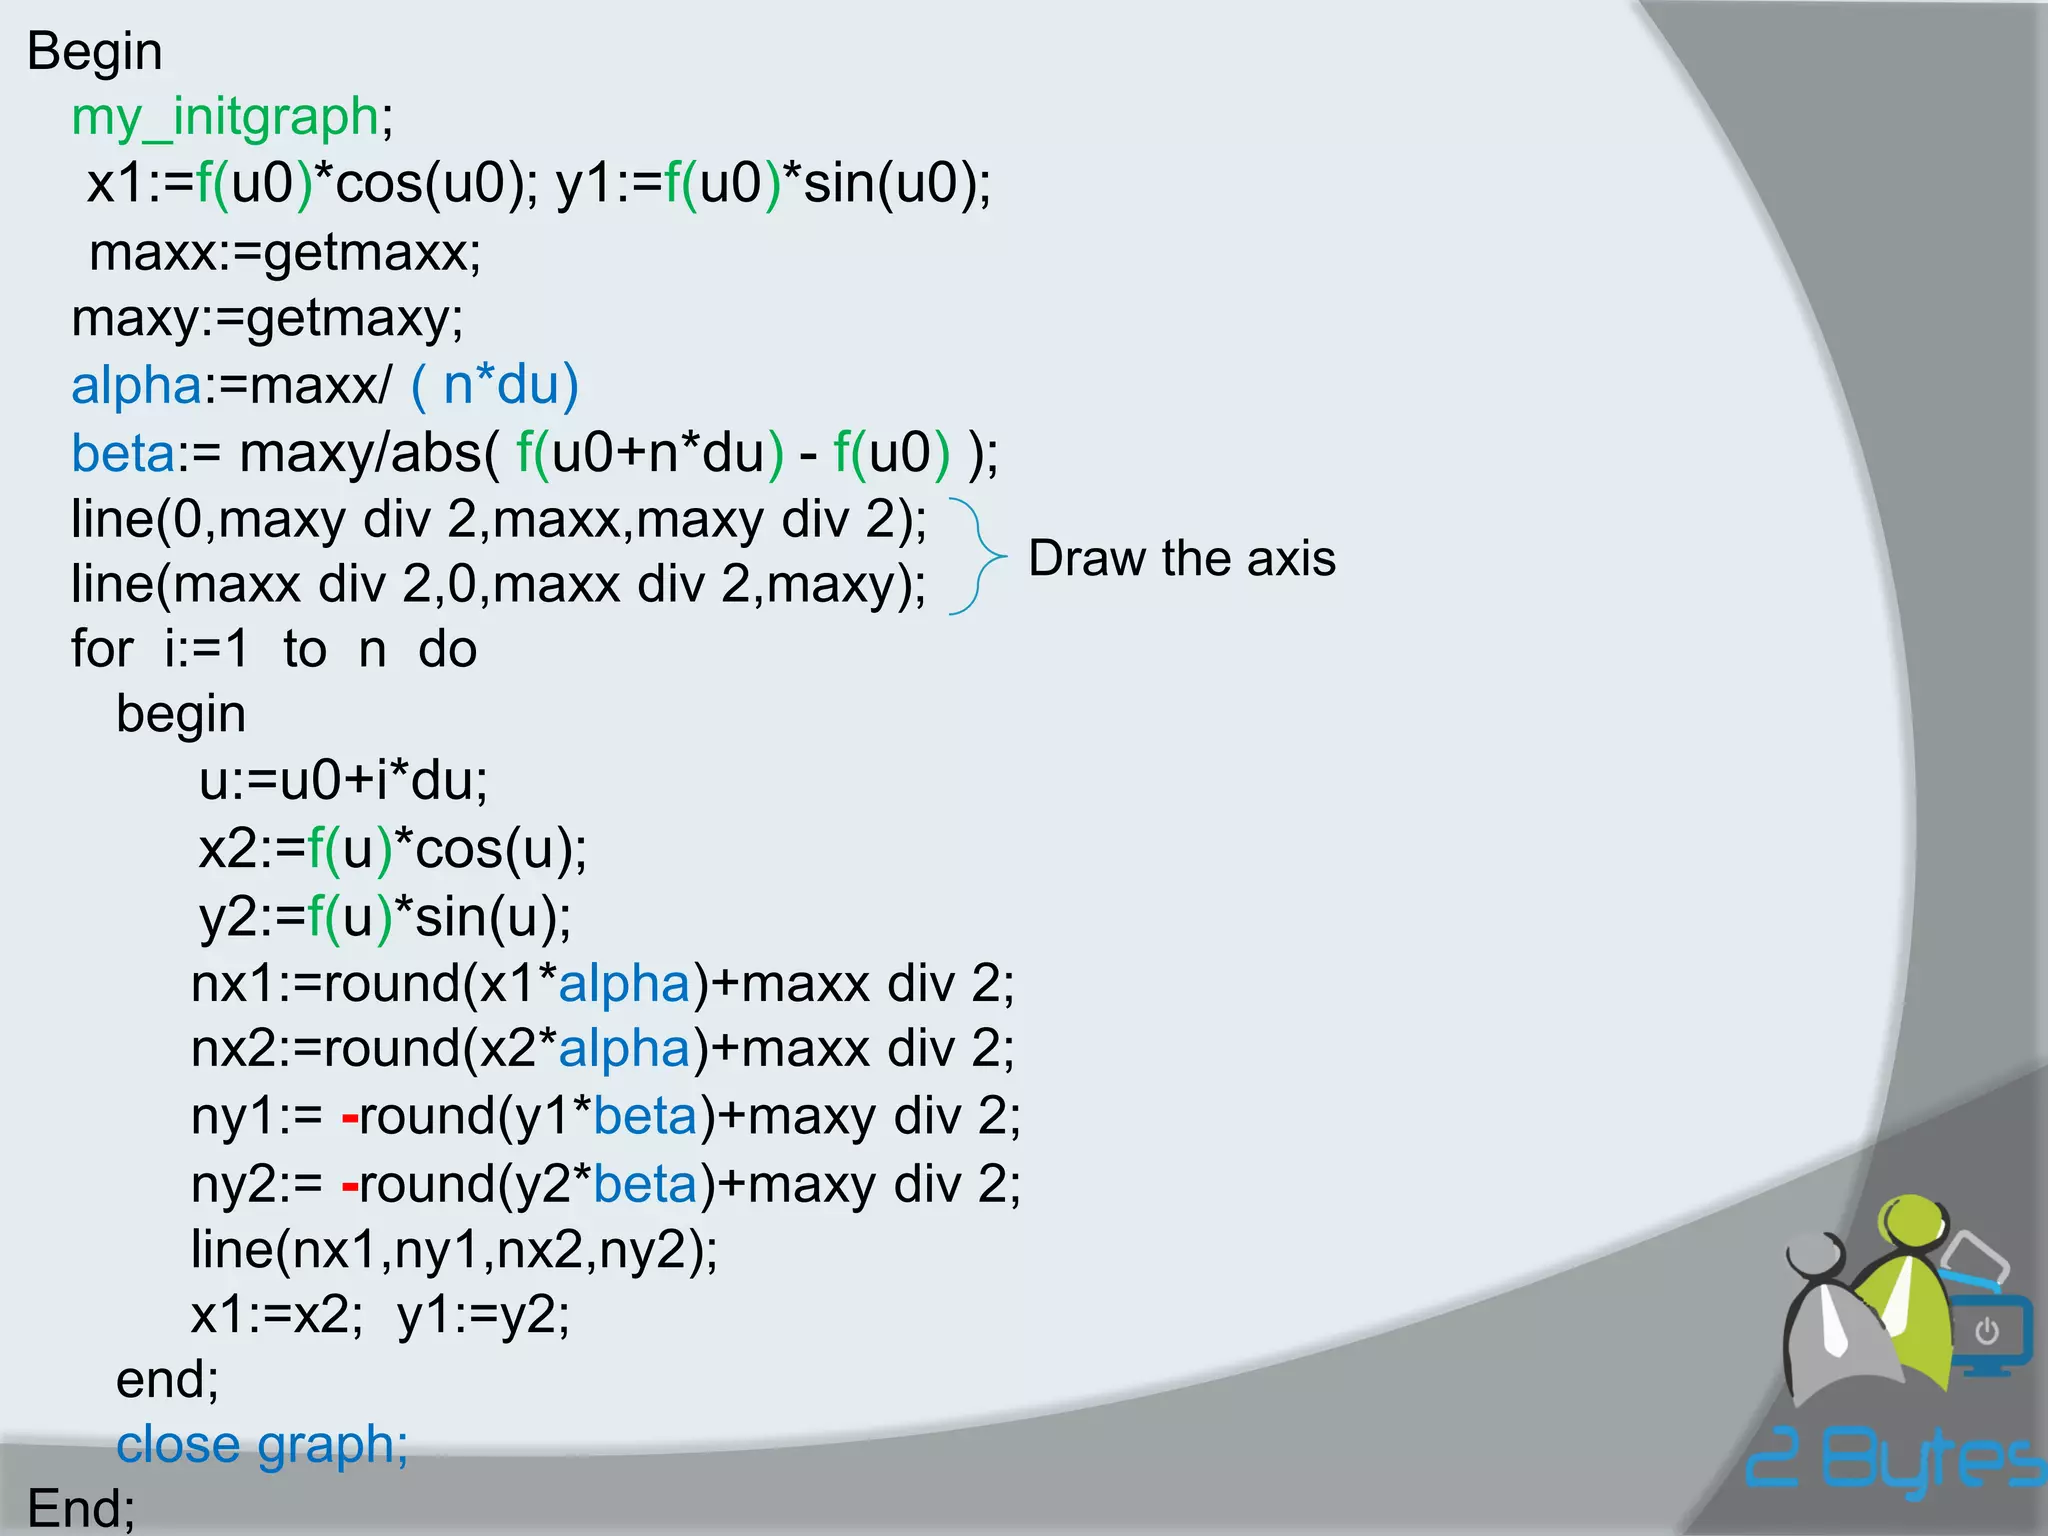
![How to paint a Polar function:
1) The function :R= F(u) ex: (y=cos(x) ) .
2) U domain: ex: U in [ u0=-100, un=100] .
4) Painting step du : du=(Un-U0)/n .
3) N number of points.
5) The Algorithm :
x1=F(u0)*cos(u0); y1=F(u0)*sin(u0);
For(i:=1) to (N) do
begin
U= u0+ i*du;
x2=F(u)*cos(u);
y2=F(u)*sin(u);
line(x1,y1,x2,y2);
x1:=x2; y1:=y2
end;
x
y
U](https://image.slidesharecdn.com/2bytesprog2course2014c9graph-141203173139-conversion-gate01/75/2Bytesprog2-course_2014_c9_graph-10-2048.jpg)
![Coordinates appropriate
- If you have On paper x in [0..460]
..it would be On Screen x in [0..230]
- So each two points on screen , one point on paper .
(6,0) paper -> (3,0) screen
- So the Ratio:
Sx = | vXb – vXt | / | wXt – wXb |
Sy = | vYb – vYt | / | wYt – wYb |
0
460
230
0
vXt
vXb
wXb
wXt
3
6
1)Increasing and decreasing coordinates:](https://image.slidesharecdn.com/2bytesprog2course2014c9graph-141203173139-conversion-gate01/75/2Bytesprog2-course_2014_c9_graph-12-2048.jpg)
![Some important functions and procedures :
Line(x1,y1,x2,y2) : draw a line between the two points.
Circle(x,y,radius) : draw a circle .
Rectangle(x1,y1,x2,y2): draw a rectangle between the two points .
Setcolor(color): change the color where the color is a number from [0..15] and each number is a color.
Setviewport(x1,y1,x2,y2,clipOn/clipOff): determine a specific display window
clipOn: inside it we can see, clipOff: outside it we can see.
TXTout(“Hello world”) or TXToutXY(50,20,“Hello world”) : print a text on screen with Graphicmode (at specific coordinate),
whereas at TXTmode we use writeln,write .](https://image.slidesharecdn.com/2bytesprog2course2014c9graph-141203173139-conversion-gate01/75/2Bytesprog2-course_2014_c9_graph-16-2048.jpg)

![Normal functions: F(x)=1+x2
س:ارسم الخط البياني للتابع:
2+x1
F(x)=
حيث x ضمن المجال ]100,+100-[
2000
N=
Program draw;
const n=2000; x0=-100; xm=100; dx=0.1 ; { (xm-x0)/n= [100-(-100)]/2000=0.1} uses graph; var x1,x2,y1,y2:real; nx1,nx2,ny1,ny2:real; maxx , maxy , i : integer; alpha , beta :real;](https://image.slidesharecdn.com/2bytesprog2course2014c9graph-141203173139-conversion-gate01/75/2Bytesprog2-course_2014_c9_graph-18-2048.jpg)


This document provides instructions for drawing graphs in Pascal using the Graph unit. It discusses initializing graphics mode, calculating appropriate coordinates for the screen, and algorithms for drawing normal and polar functions. Examples are given to illustrate drawing the linear function f(x)=x and polar function f(u)=1+sin(u). The document concludes with reminding students what they need to do in exams and providing contact information for the programming group.


![Chapter 3 - Part 1 [Autosaved].pptx](https://cdn.slidesharecdn.com/ss_thumbnails/chapter3-part1autosaved-230109040832-9344385c-thumbnail.jpg?width=600ounds&width=560&fit=bounds)


