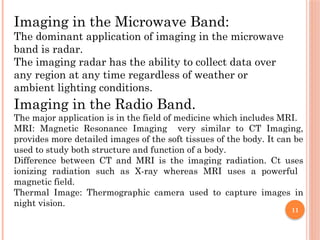
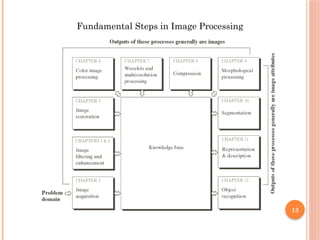
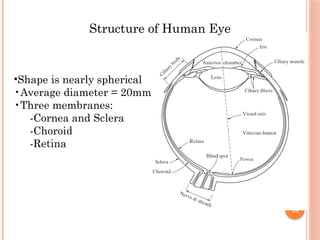
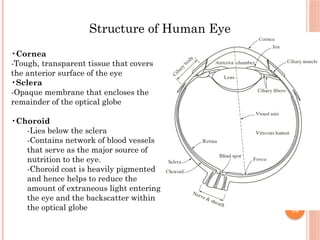
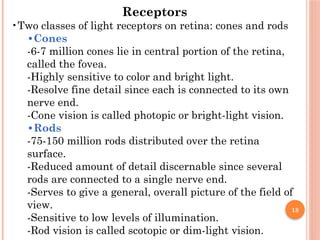
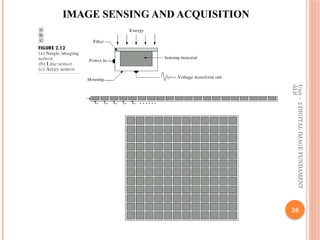
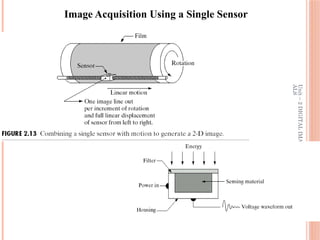
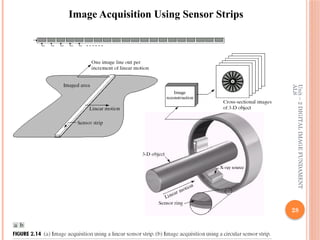
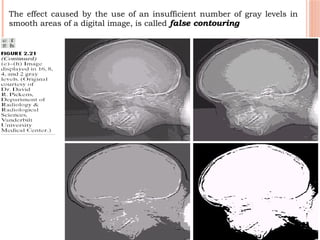
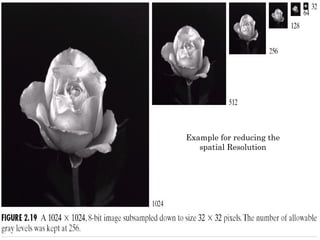
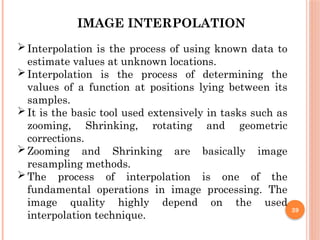
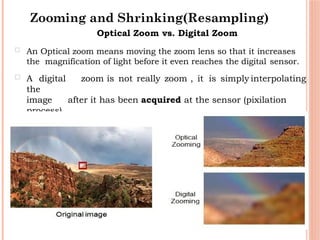
The document outlines the fundamentals of digital image processing, which focuses on enhancing image quality for human perception and computer interpretation. It discusses various imaging technologies like gamma-ray, X-ray, and MRI, while explaining key concepts such as image acquisition, resolution, and interpolation techniques. Additionally, it covers the anatomy of the human eye and how it relates to image processing principles.


![• 33
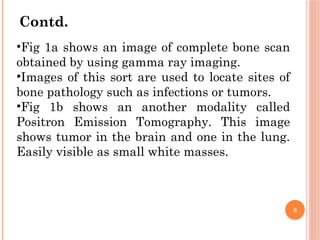
Contd…
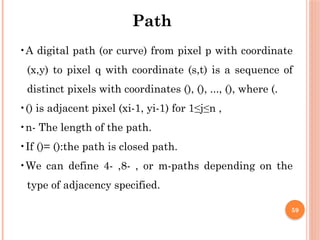
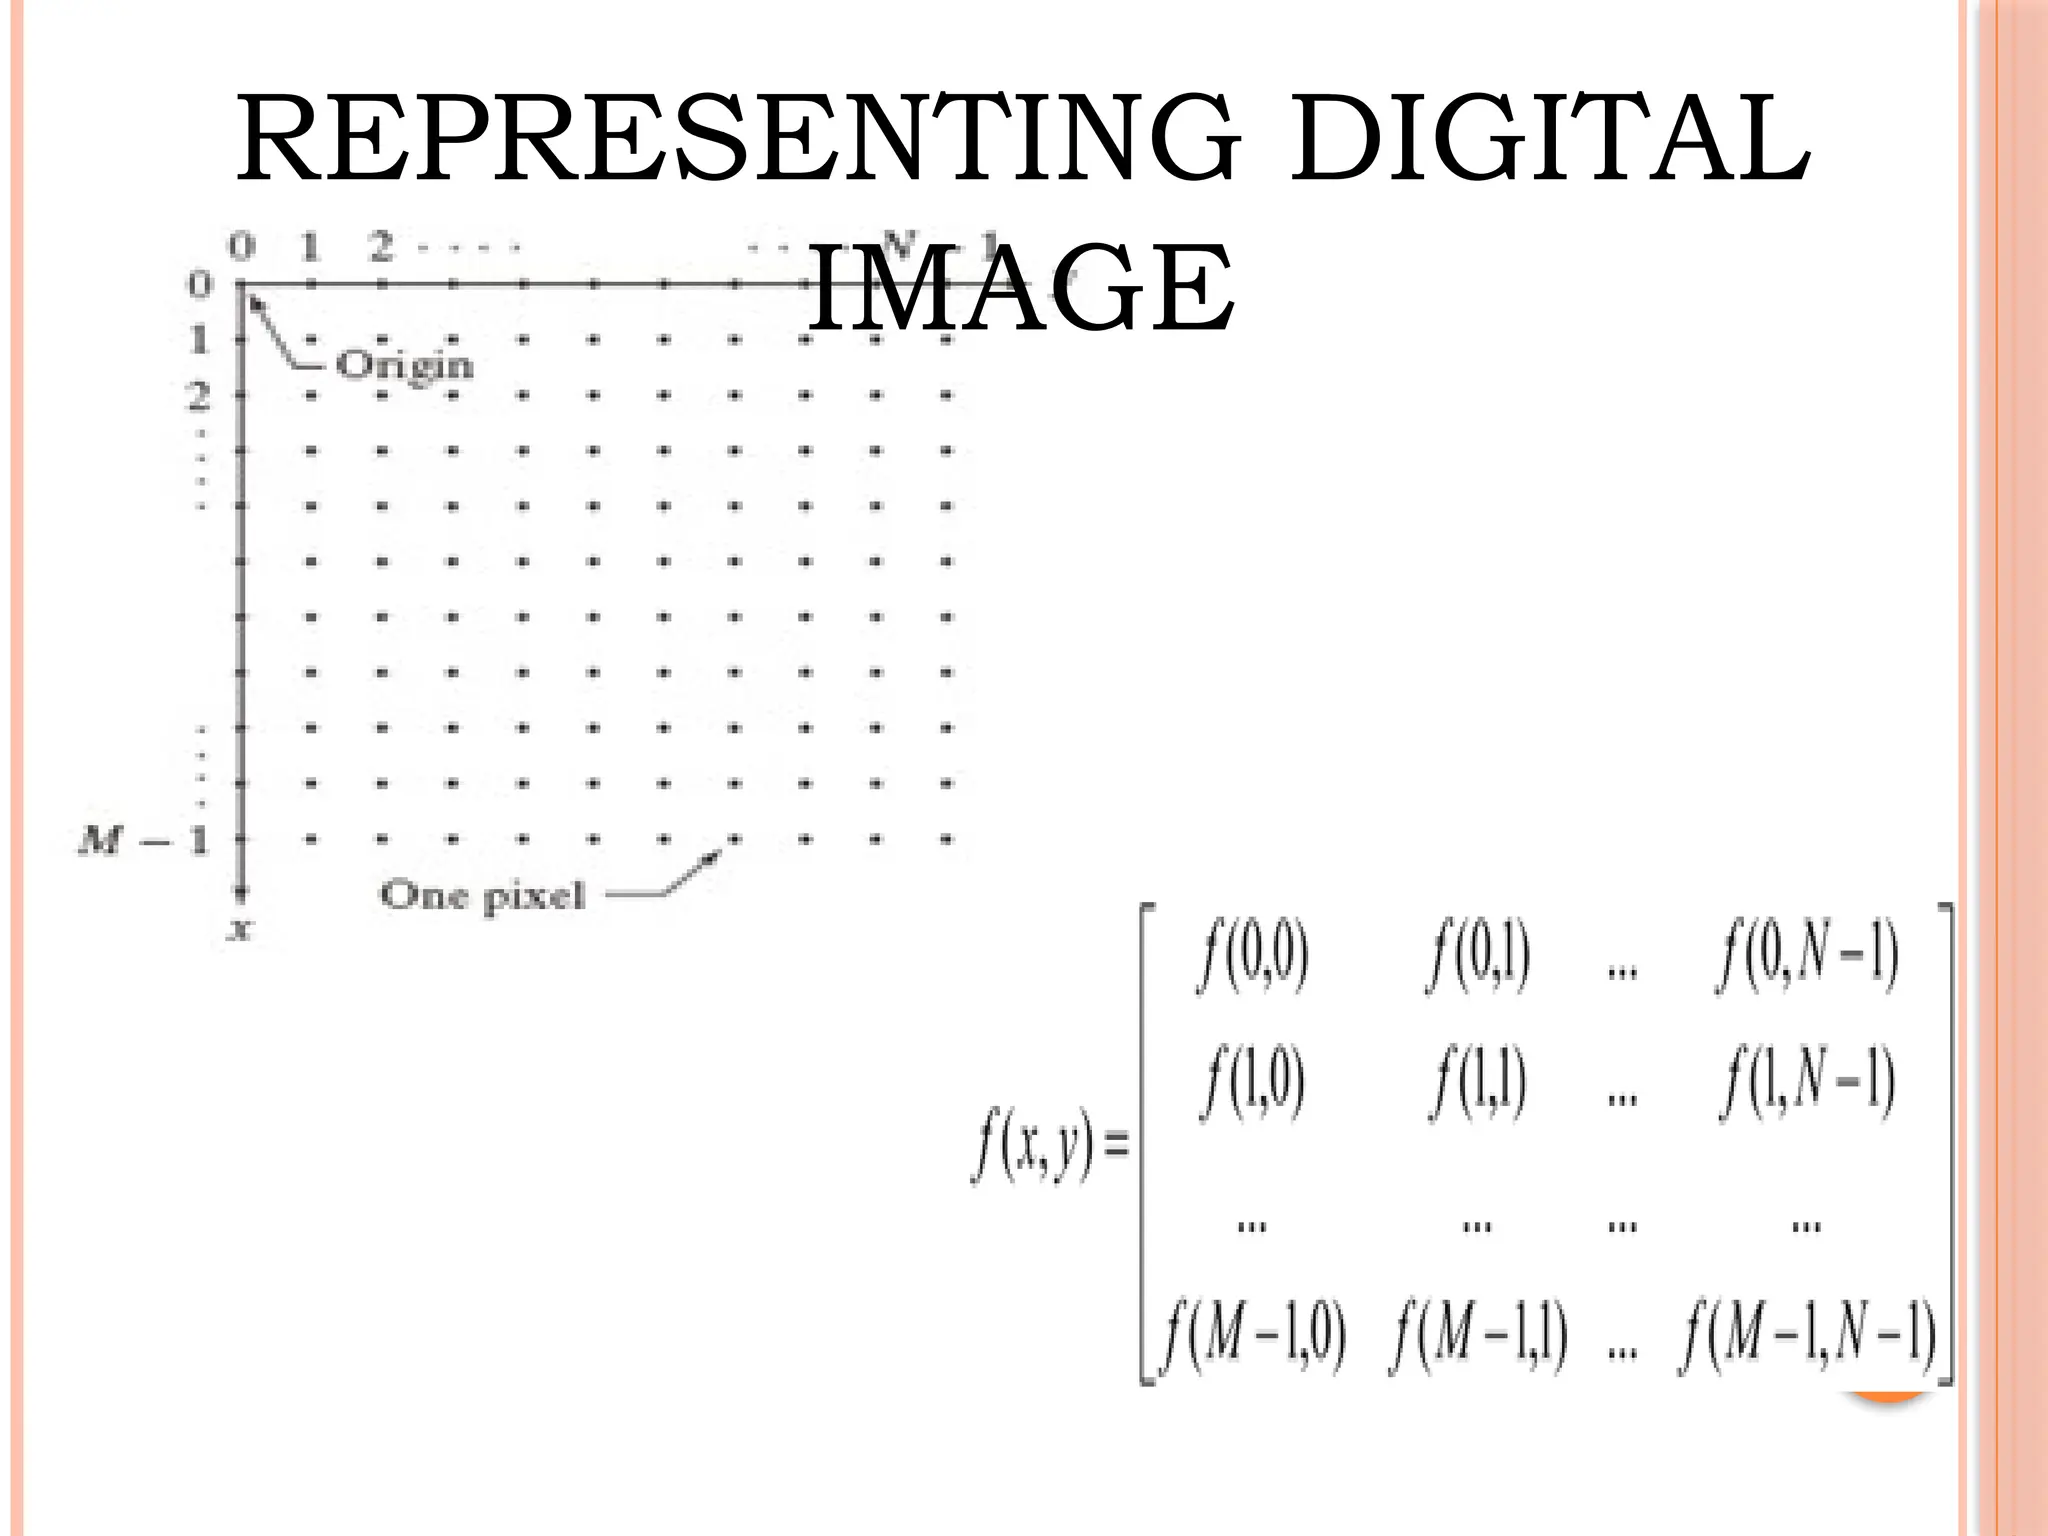
Let A be a digital Image
• The pixel intensity levels (gray scale levels) are in
the interval of [0, L-1].
0 ai,j L-1 , W h e r e L =
• b is the no. of bits required to store digitized image
of size M by N, then b is given as
b = M x N x k](https://image.slidesharecdn.com/471112728-digital-image-processing-notes-vtu-240916150423-77652920/85/471112728-DIGITAL-IMAGE-PROCESSING-NOTES-VTU-pptx-33-320.jpg)


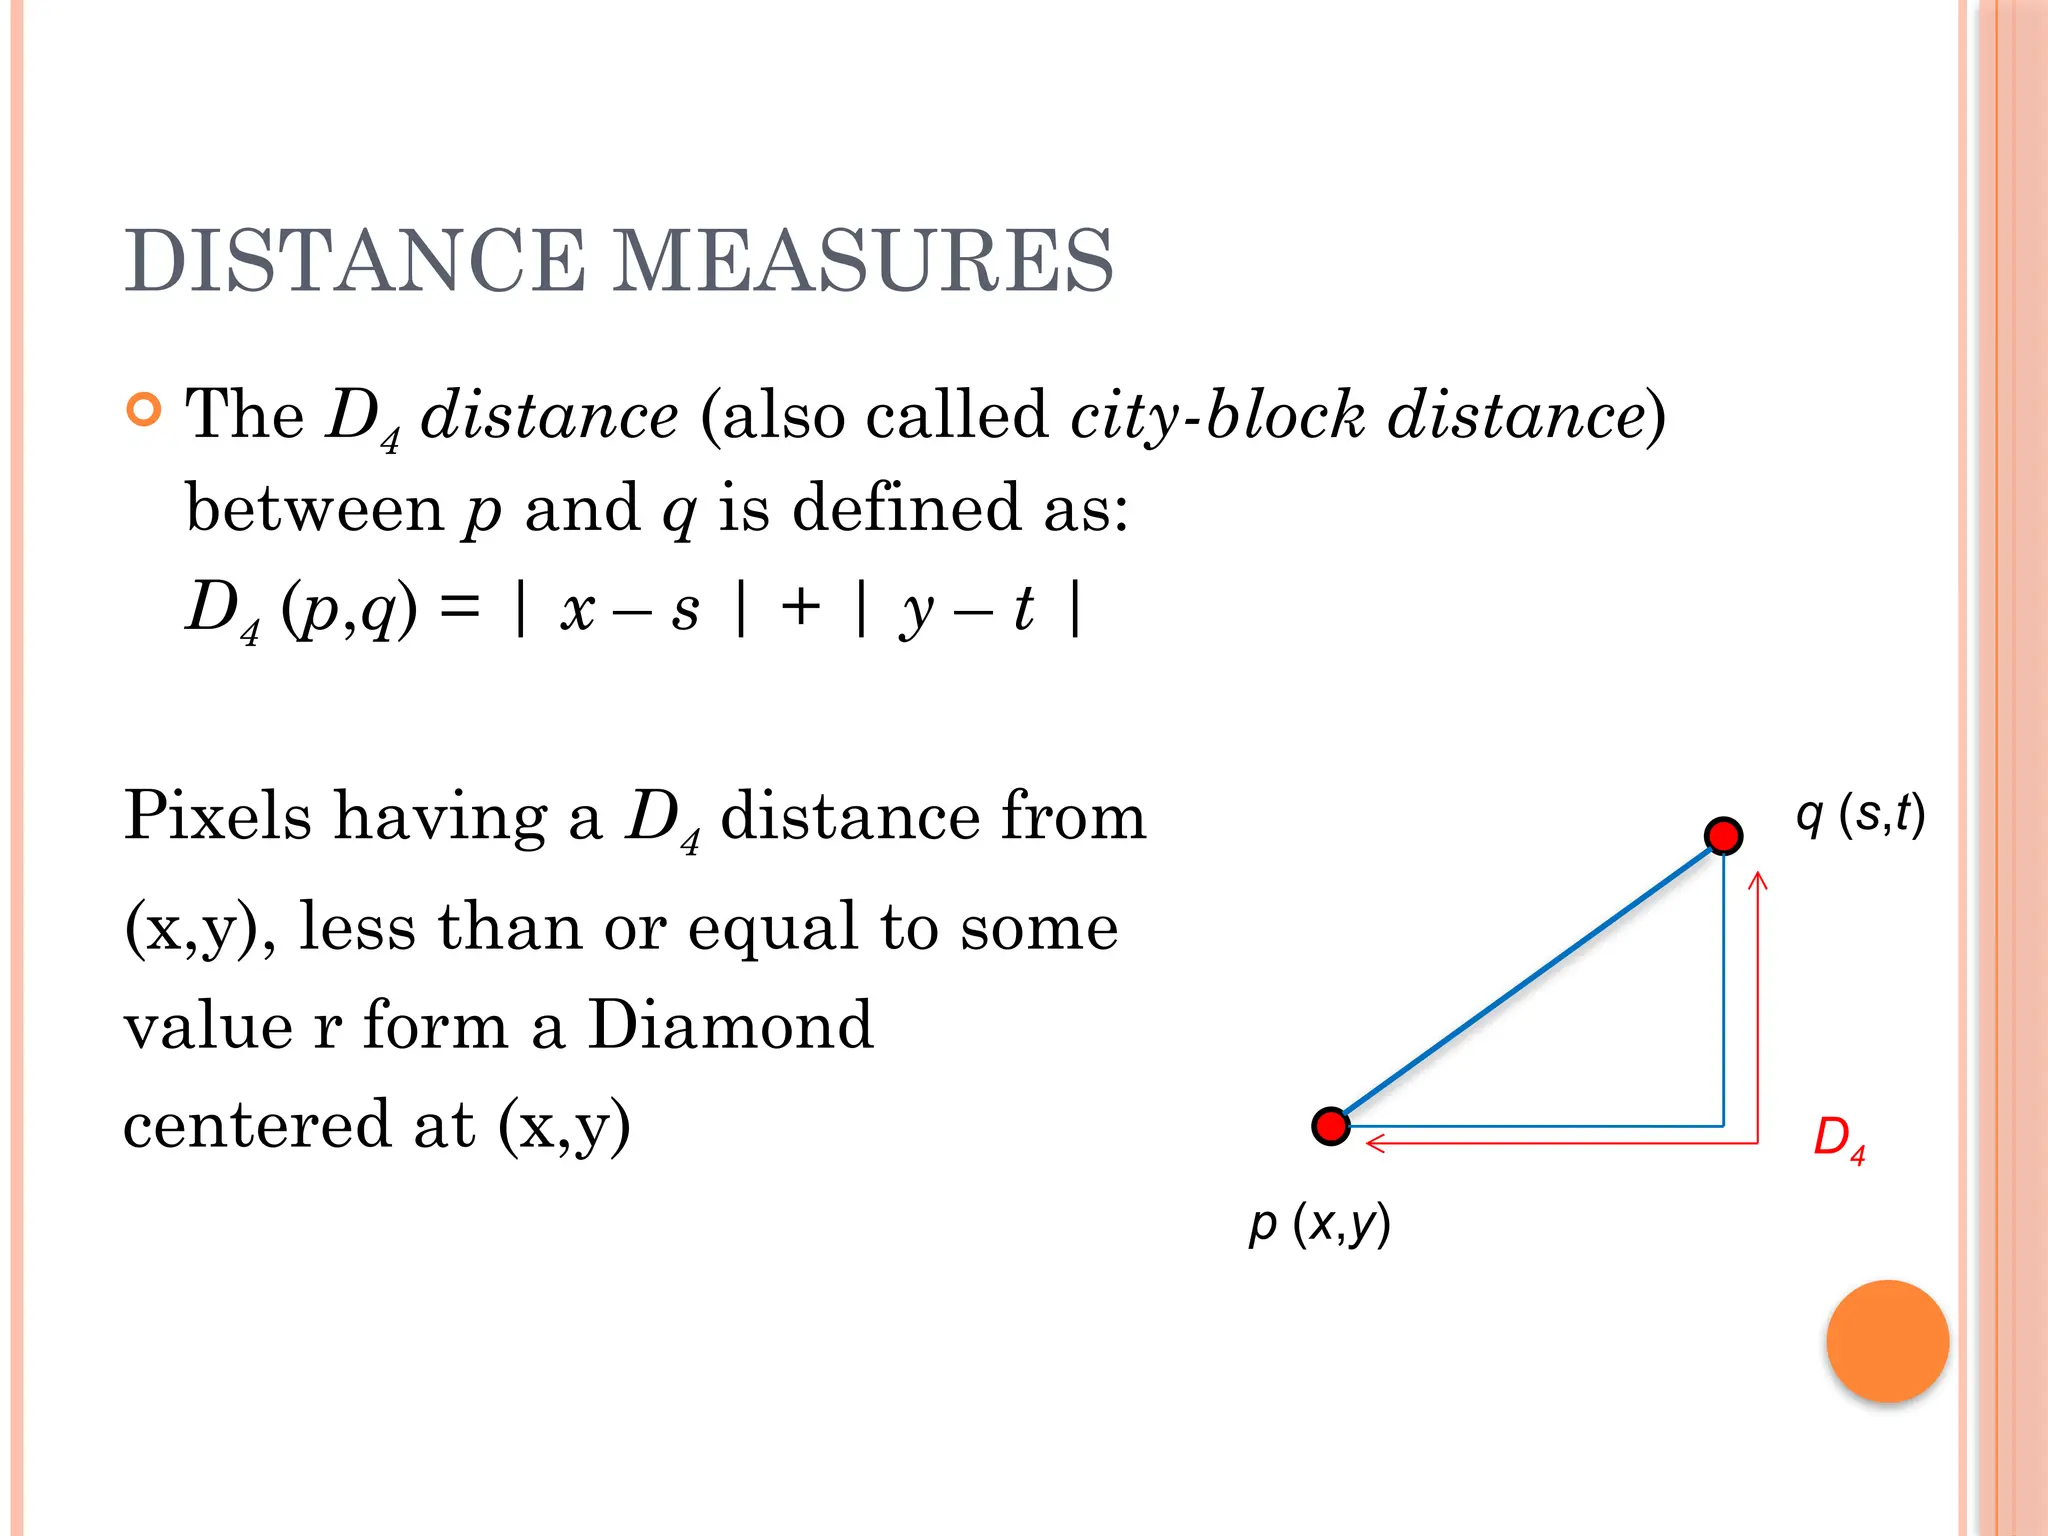
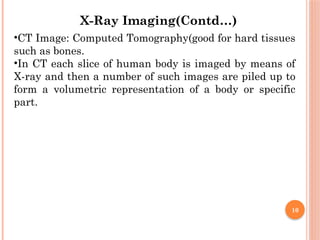
![DISTANCE MEASURES
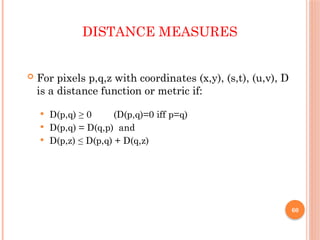
The Euclidean Distance between p and q is defined as:
De (p,q) = [(x – s)2
+ (y - t)2
]1/2
Pixels having a distance less than or equal
to some value r from (x,y) are the points
contained in a disk of
radius r centered at (x,y)
De
(p,q)
p (x,y)
q (s,t)](https://image.slidesharecdn.com/471112728-digital-image-processing-notes-vtu-240916150423-77652920/85/471112728-DIGITAL-IMAGE-PROCESSING-NOTES-VTU-pptx-61-320.jpg)


![• 33
Contd…
Let A be a digital Image
• The pixel intensity levels (gray scale levels) are in
the interval of [0, L-1].
0 ai,j L-1 , W h e r e L =
• b is the no. of bits required to store digitized image
of size M by N, then b is given as
b = M x N x k](https://image.slidesharecdn.com/471112728-digital-image-processing-notes-vtu-240916150423-77652920/75/471112728-DIGITAL-IMAGE-PROCESSING-NOTES-VTU-pptx-33-2048.jpg)


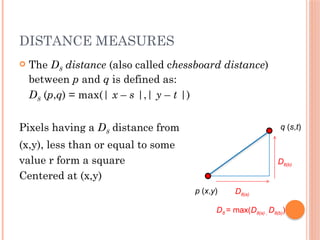
![DISTANCE MEASURES
The Euclidean Distance between p and q is defined as:
De (p,q) = [(x – s)2
+ (y - t)2
]1/2
Pixels having a distance less than or equal
to some value r from (x,y) are the points
contained in a disk of
radius r centered at (x,y)
De
(p,q)
p (x,y)
q (s,t)](https://image.slidesharecdn.com/471112728-digital-image-processing-notes-vtu-240916150423-77652920/75/471112728-DIGITAL-IMAGE-PROCESSING-NOTES-VTU-pptx-61-2048.jpg)