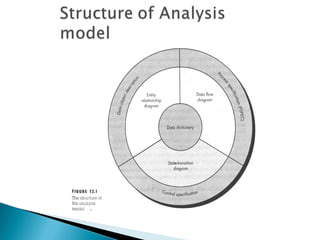
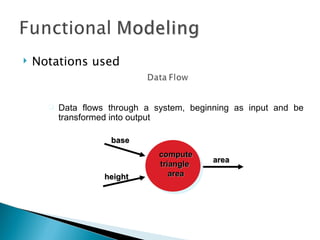
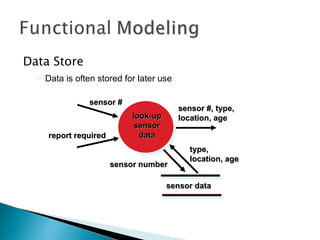
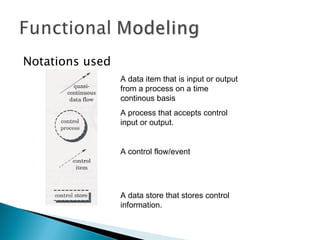
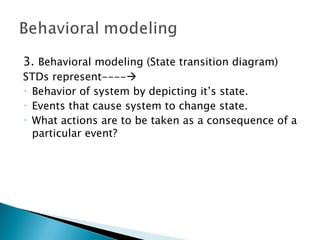
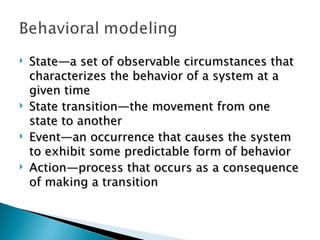
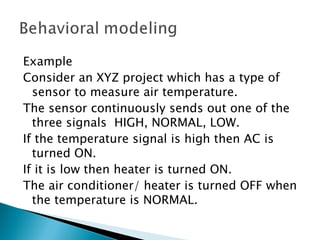
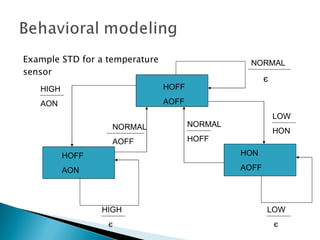
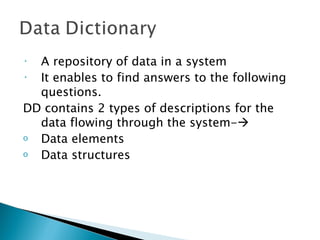
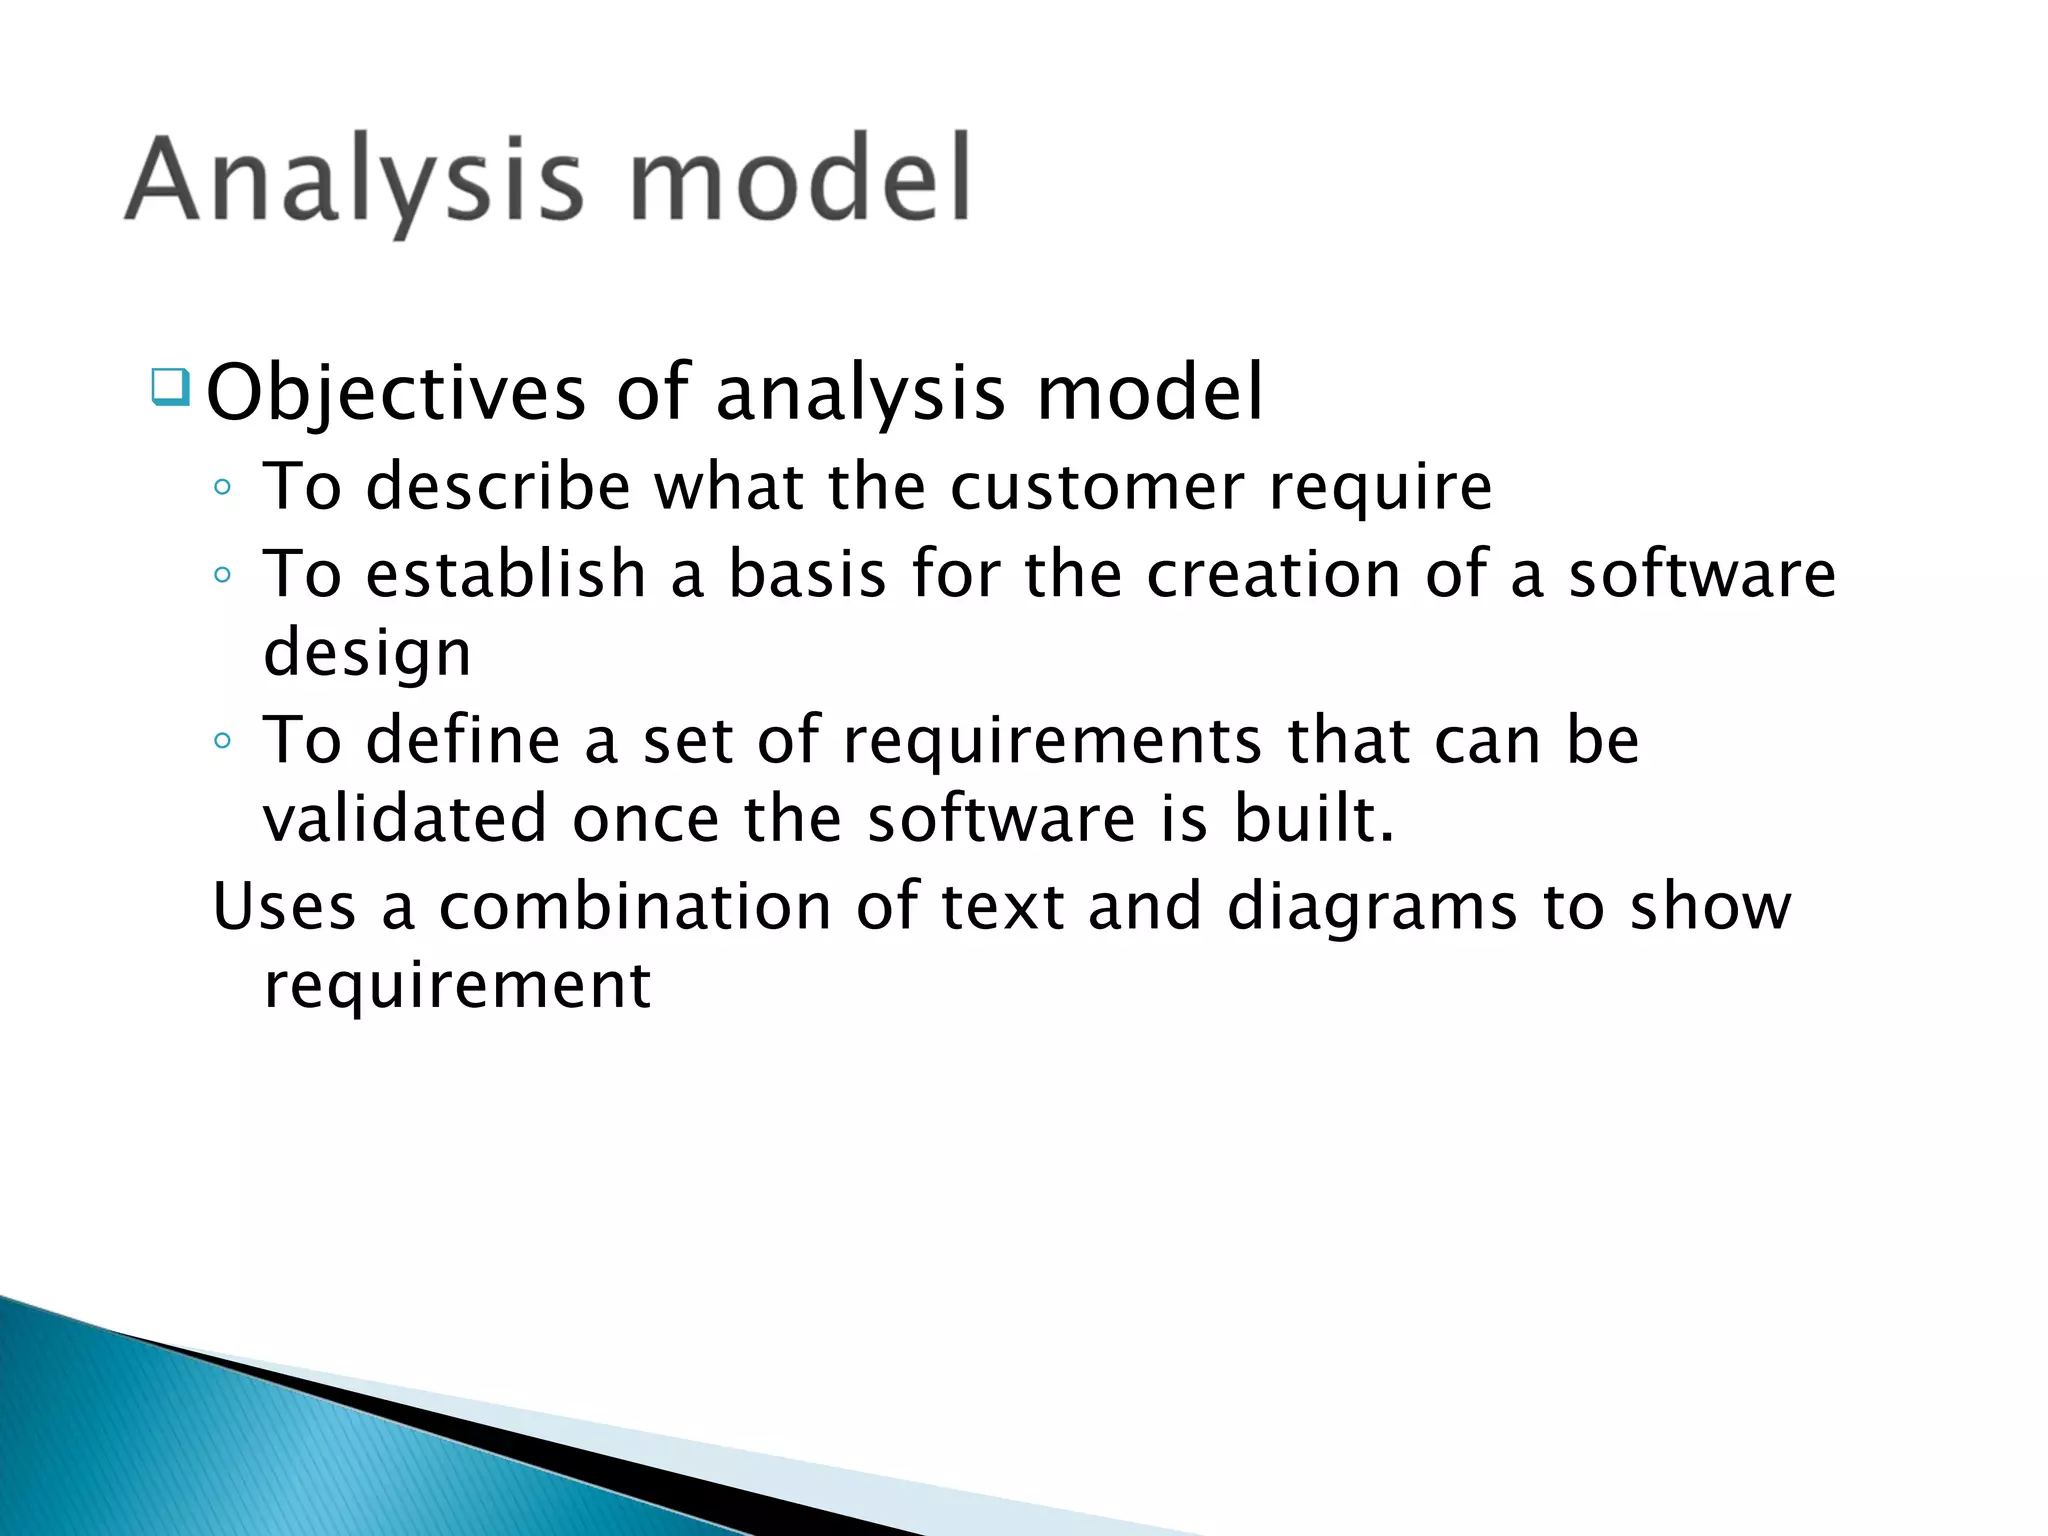
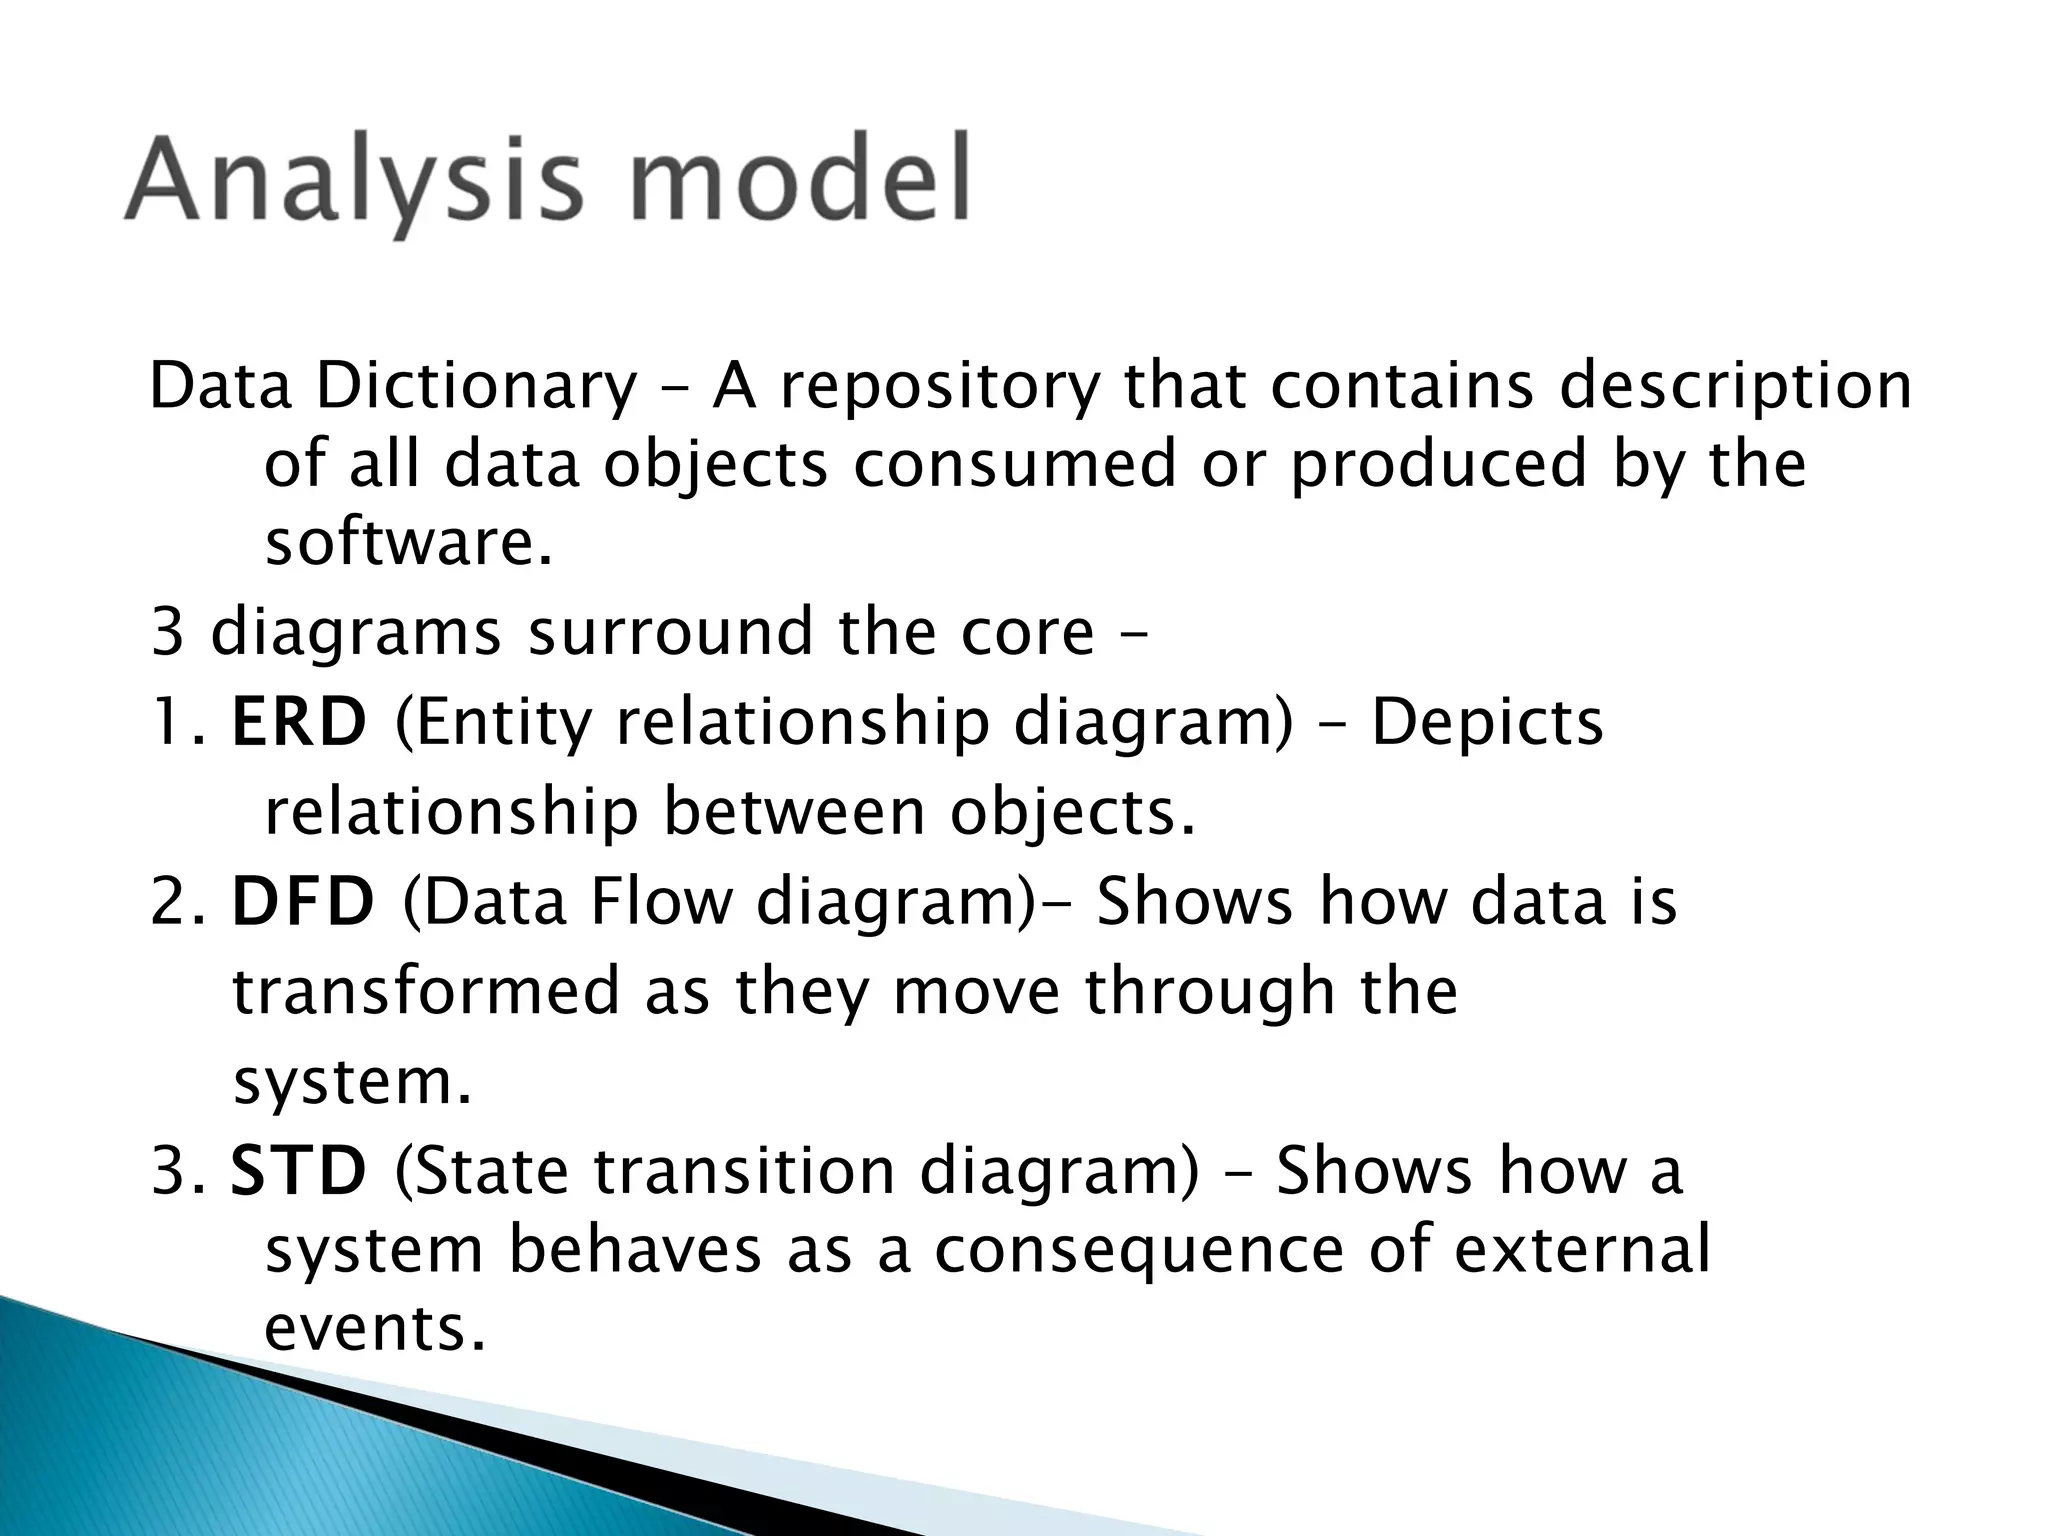
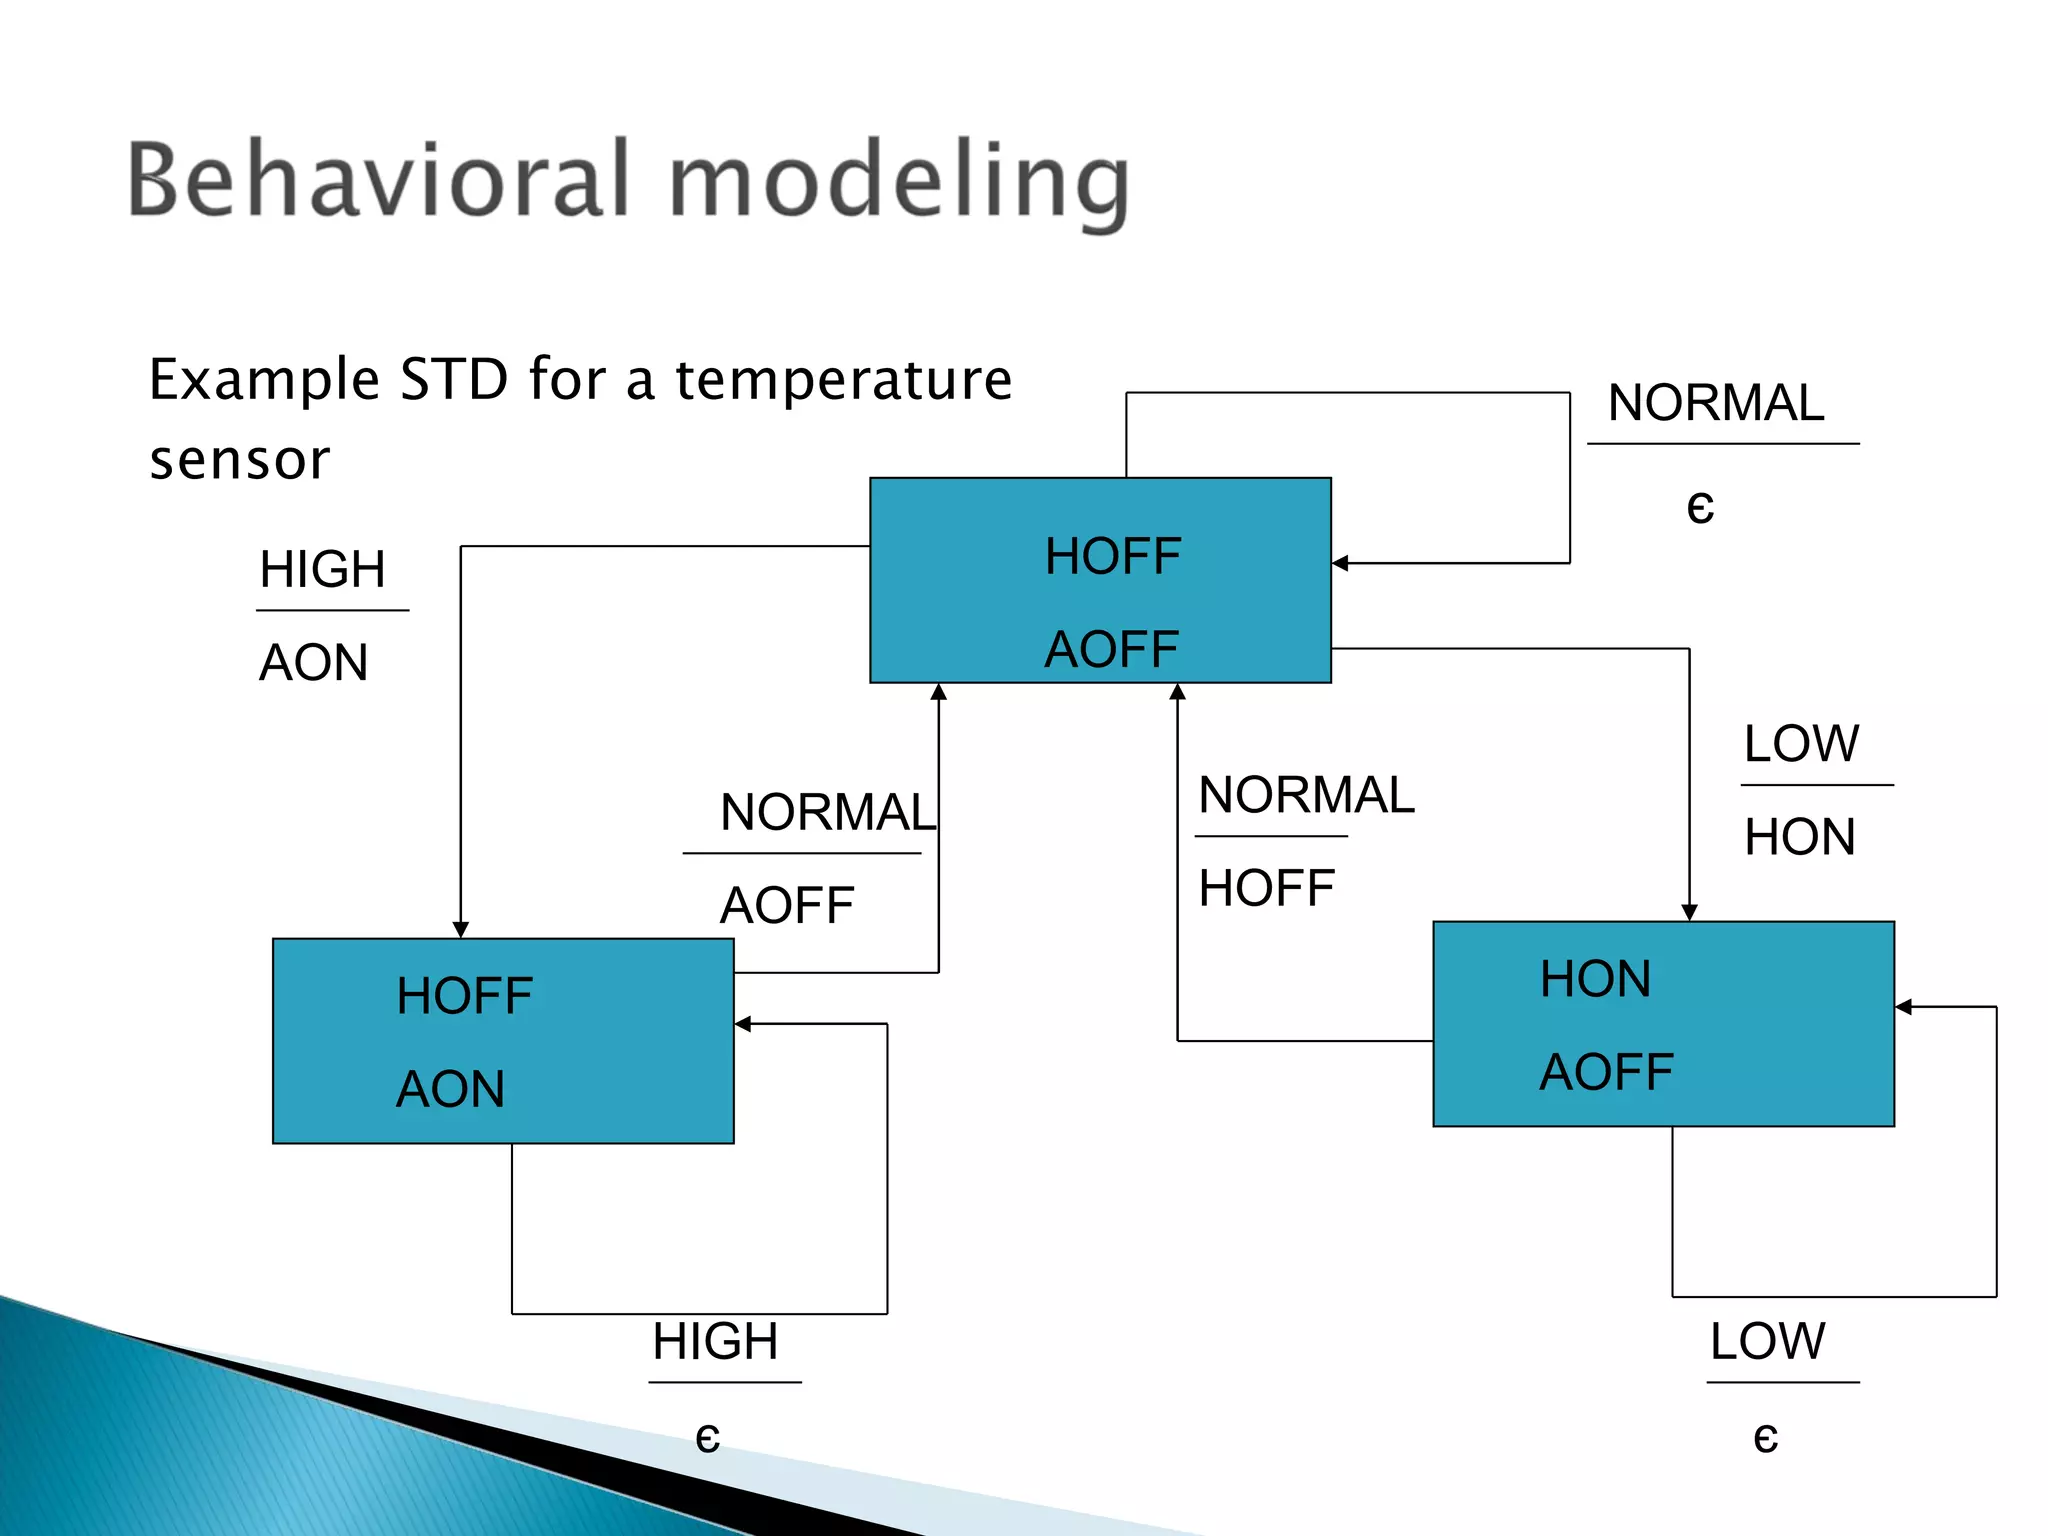
The document discusses different modeling techniques used in software engineering. It describes data modeling, functional modeling, and behavioral modeling. Data modeling involves creating entity relationship diagrams and data dictionaries. Functional modeling uses data flow diagrams to show how data moves through processes. Behavioral modeling uses state transition diagrams to represent a system's states and transitions between states. The modeling techniques help describe requirements, design software, and validate systems.


![2. Selection relationship
Represents either/or relationship.
i.e a choice of one item must be made from a set of 2/more
items.
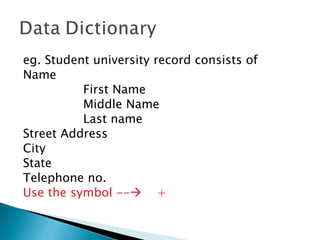
Eg. Student data structure
eg. Student data structure
Name
Street Address
City
State
Telephone no.
and one of the following
Student No.
Social Security no.
Write options in [ ] , each option separated by I (vertical line)](https://image.slidesharecdn.com/analysismodelling-120305101252-phpapp02/85/Analysis-modelling-34-320.jpg)

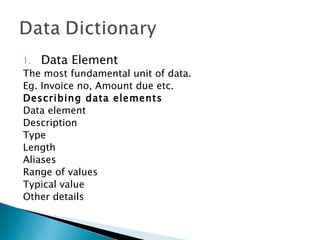
![Eg :
Student data = Name + street address +city
+state +postal code + [Student No. I SS no]
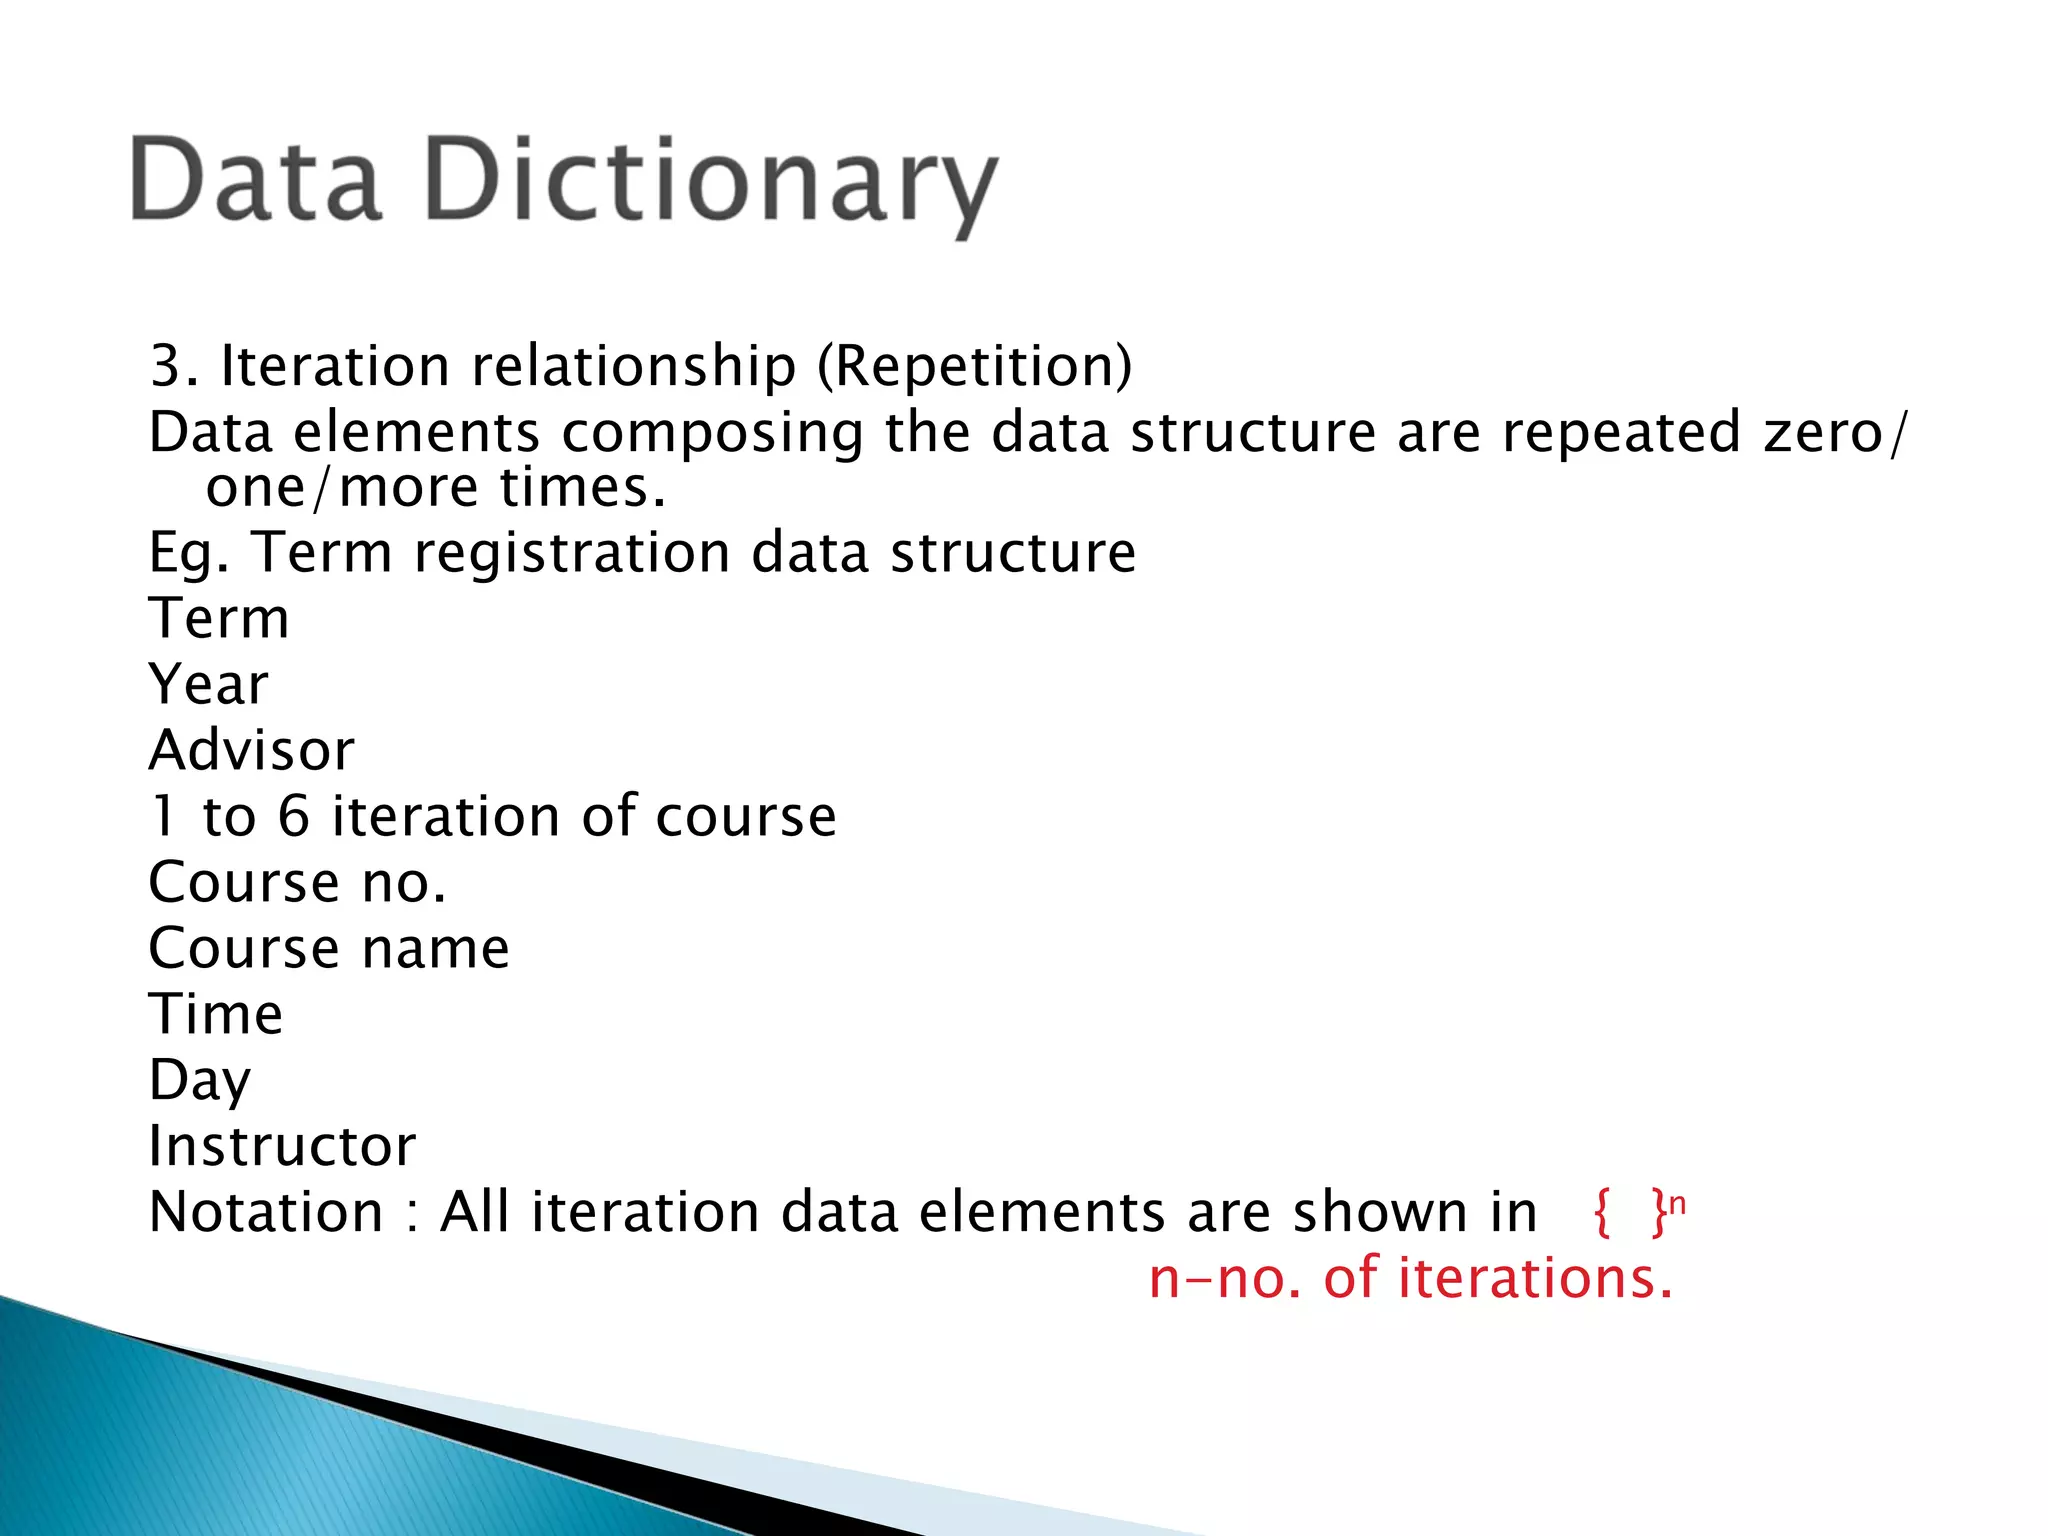
+{Course no + Course name + time + day +
Instructor} + Term + year + advisor
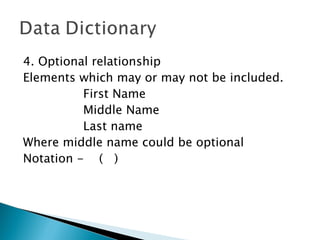
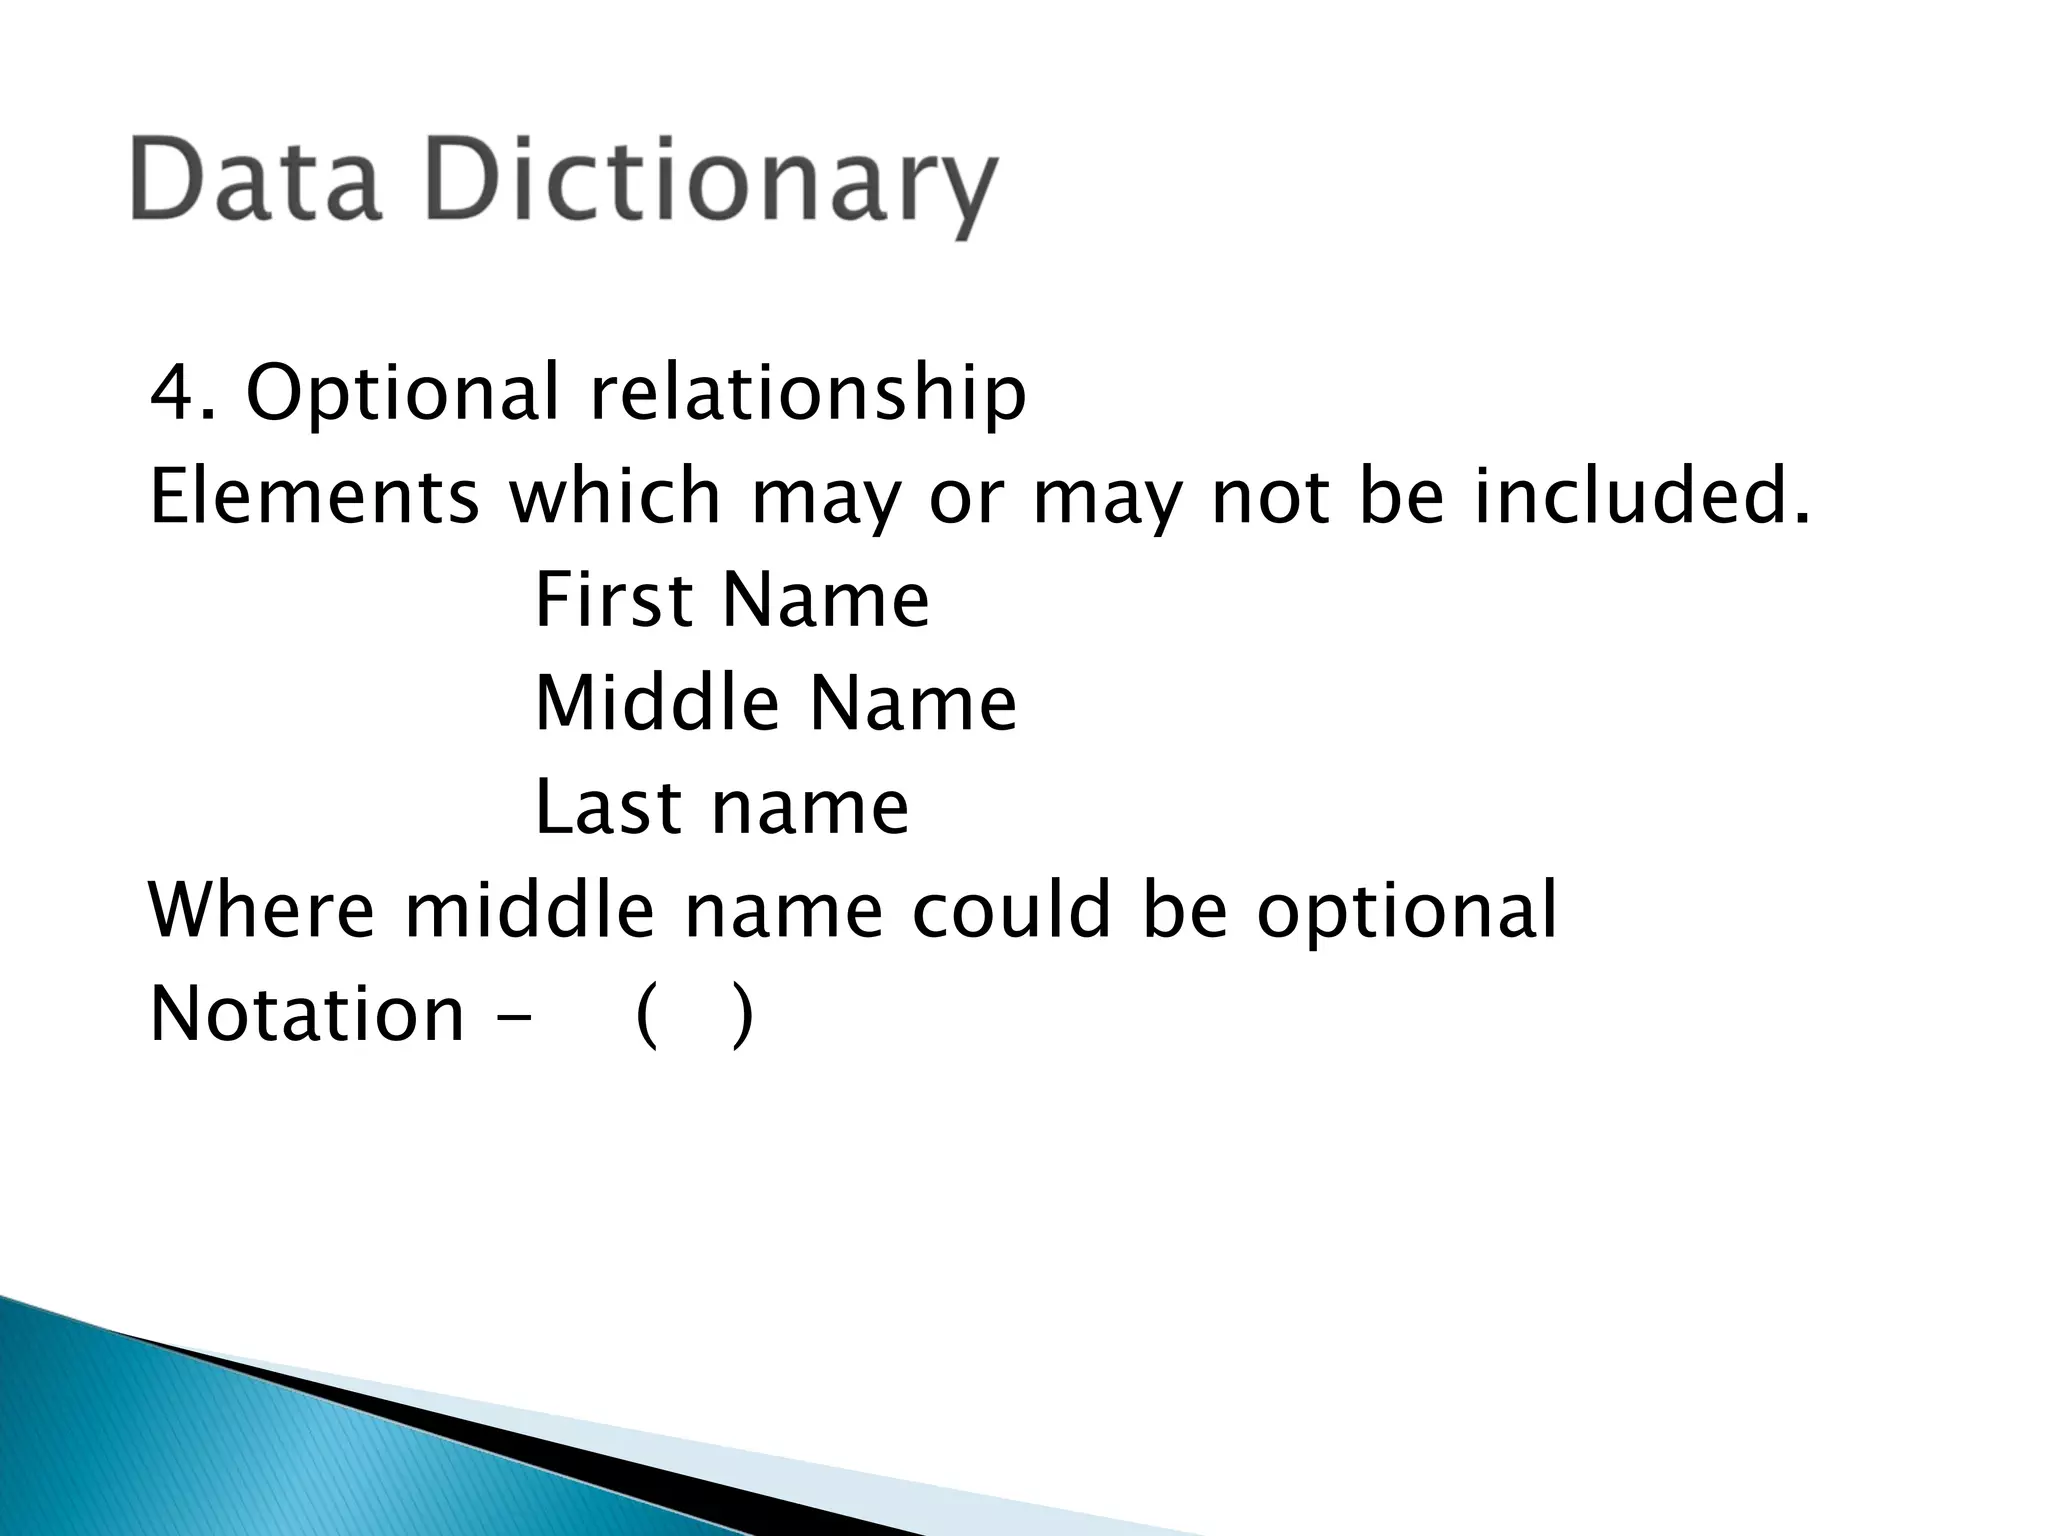
Name =First Name + (Middle Name) + Last
name](https://image.slidesharecdn.com/analysismodelling-120305101252-phpapp02/85/Analysis-modelling-37-320.jpg)


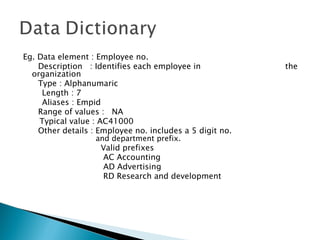
![2. Selection relationship
Represents either/or relationship.
i.e a choice of one item must be made from a set of 2/more
items.
Eg. Student data structure
eg. Student data structure
Name
Street Address
City
State
Telephone no.
and one of the following
Student No.
Social Security no.
Write options in [ ] , each option separated by I (vertical line)](https://image.slidesharecdn.com/analysismodelling-120305101252-phpapp02/75/Analysis-modelling-34-2048.jpg)
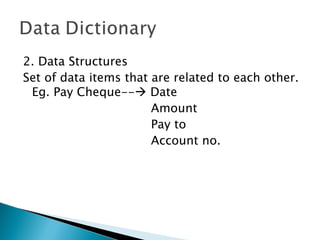
![Eg :
Student data = Name + street address +city
+state +postal code + [Student No. I SS no]
+{Course no + Course name + time + day +
Instructor} + Term + year + advisor
Name =First Name + (Middle Name) + Last
name](https://image.slidesharecdn.com/analysismodelling-120305101252-phpapp02/75/Analysis-modelling-37-2048.jpg)


