Download to read offline
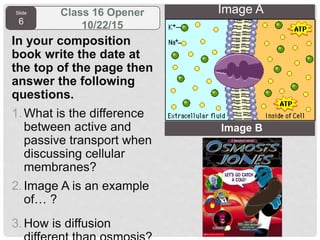
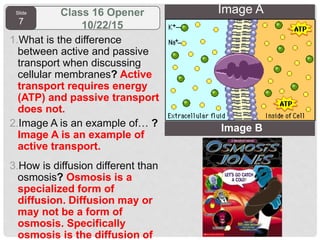
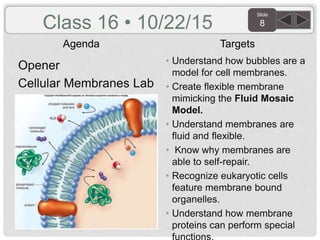

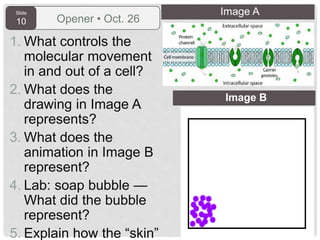
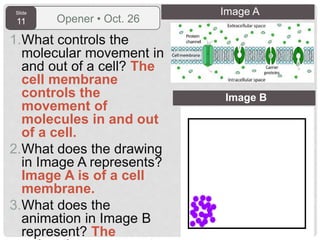
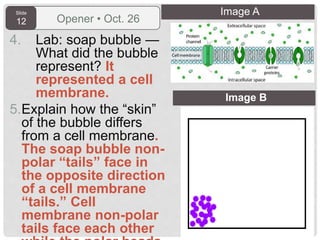


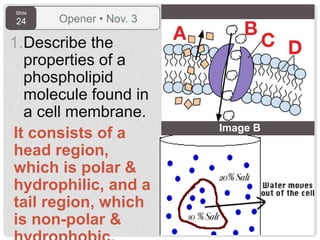


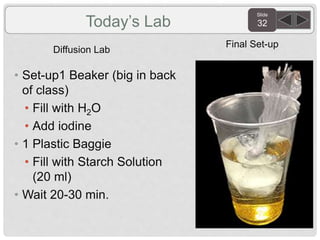


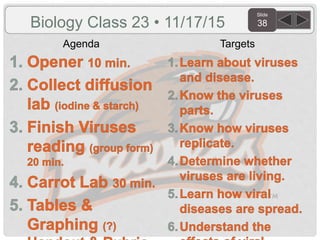
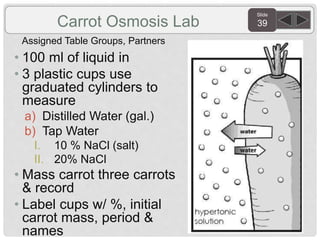
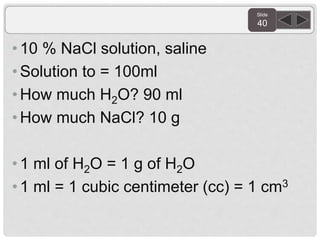


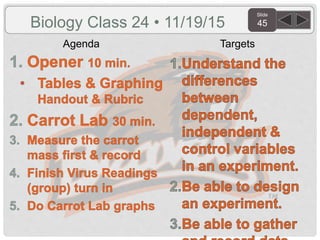

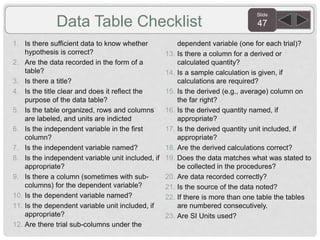
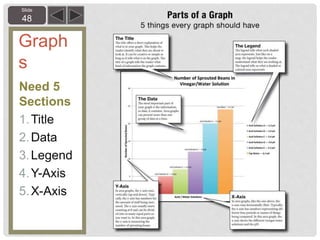


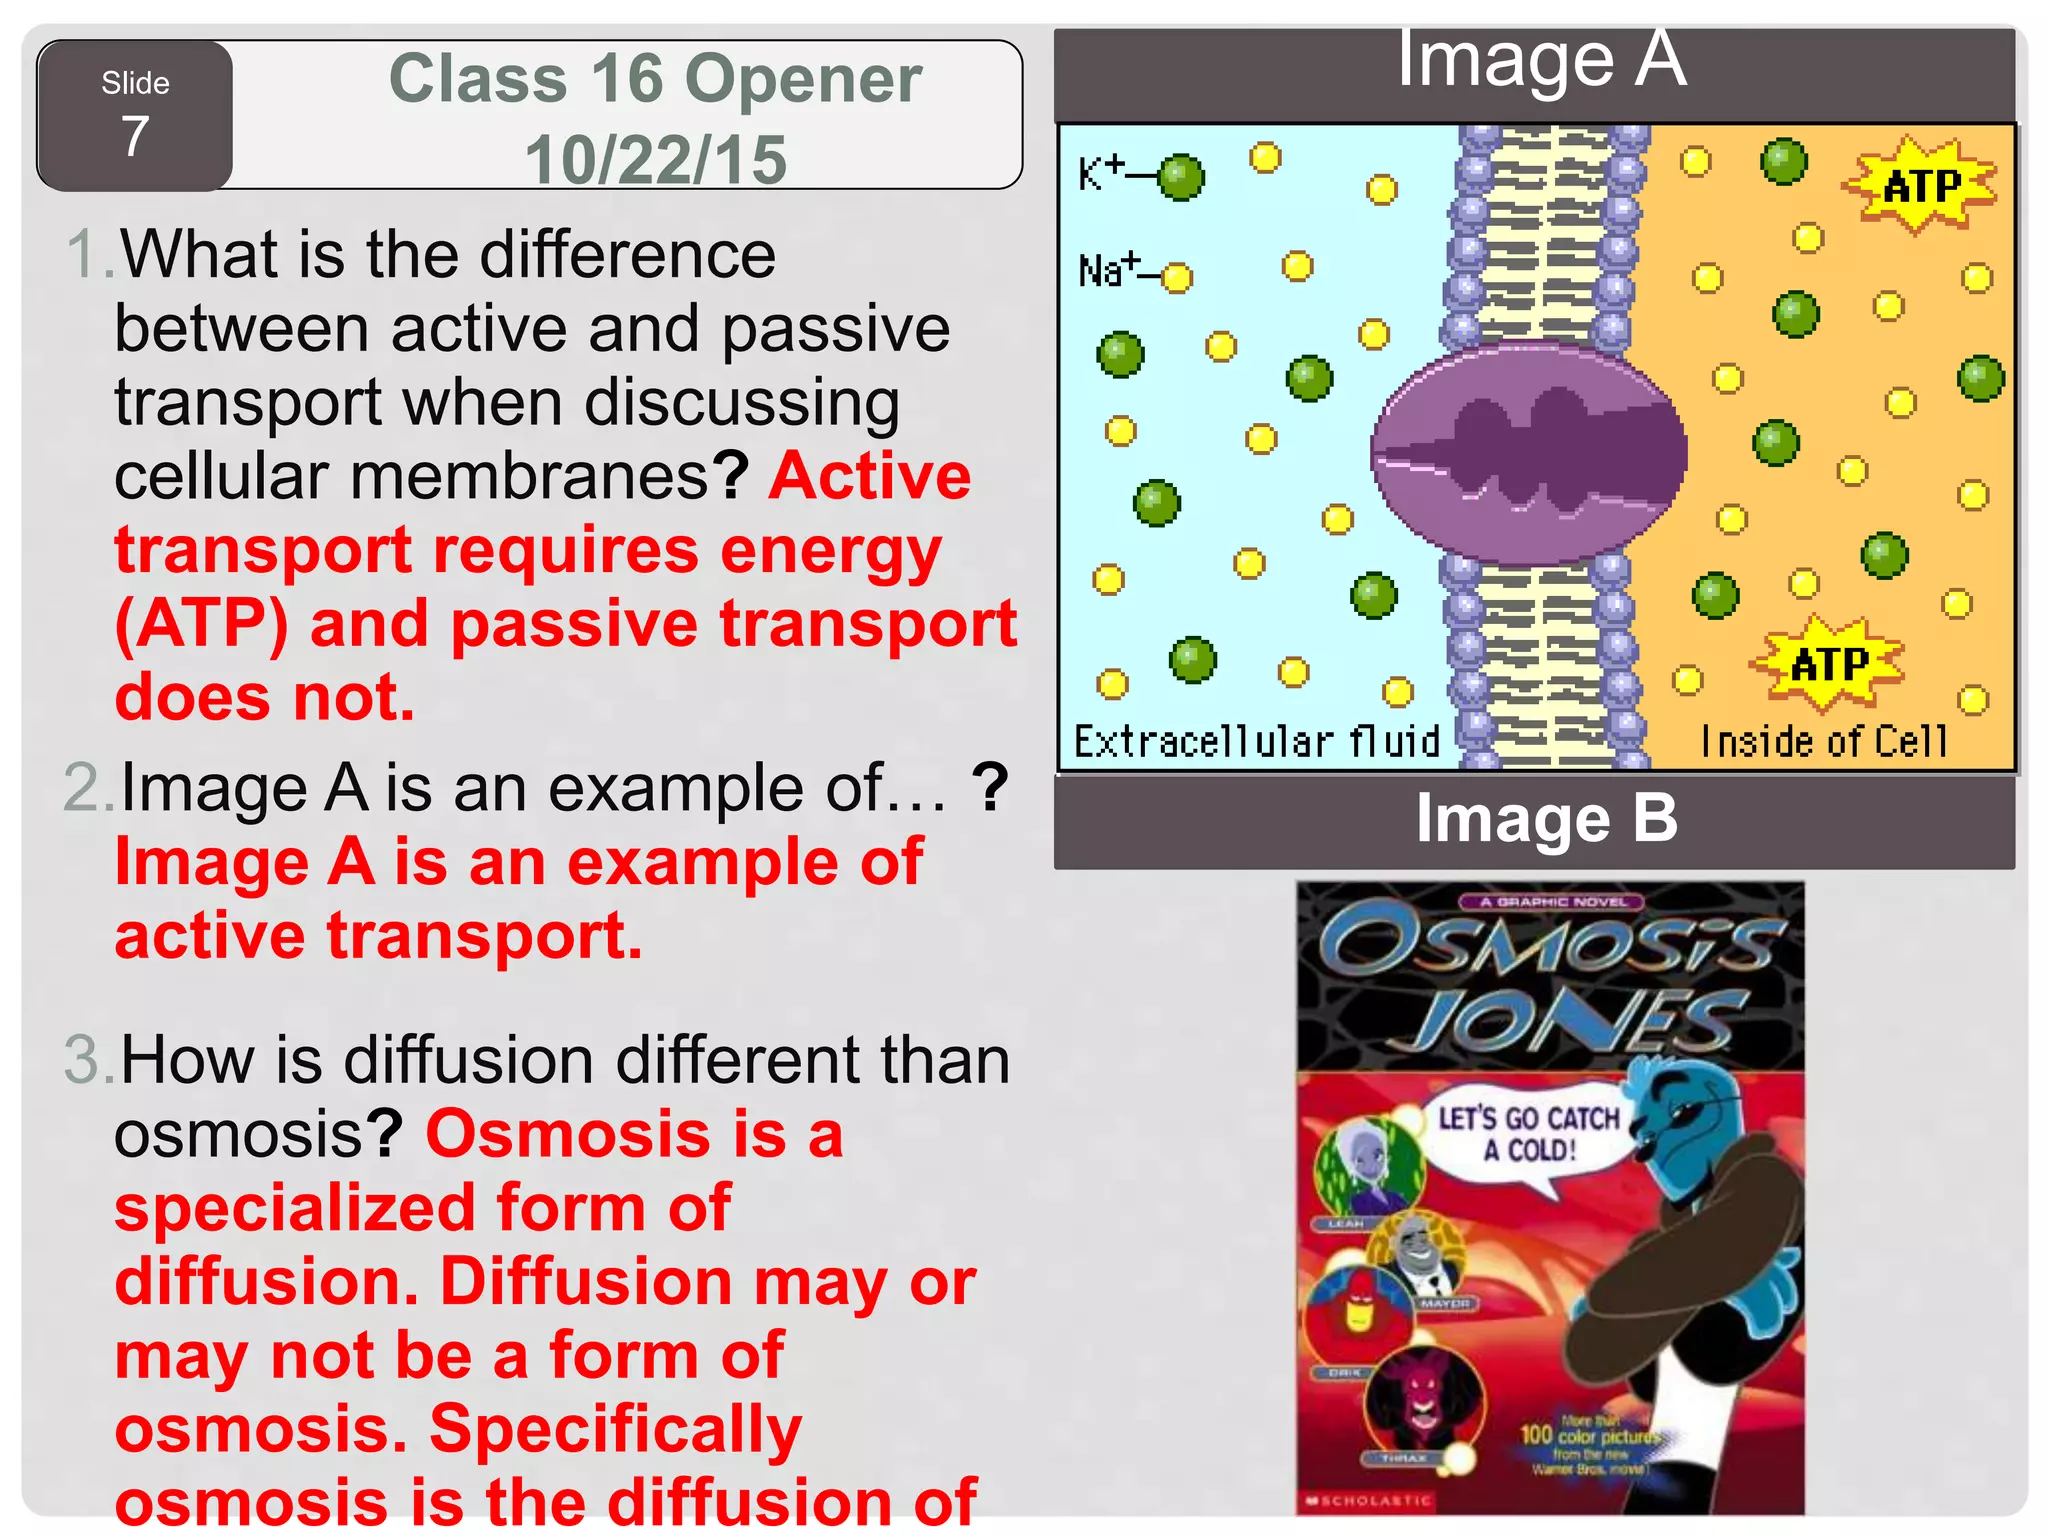


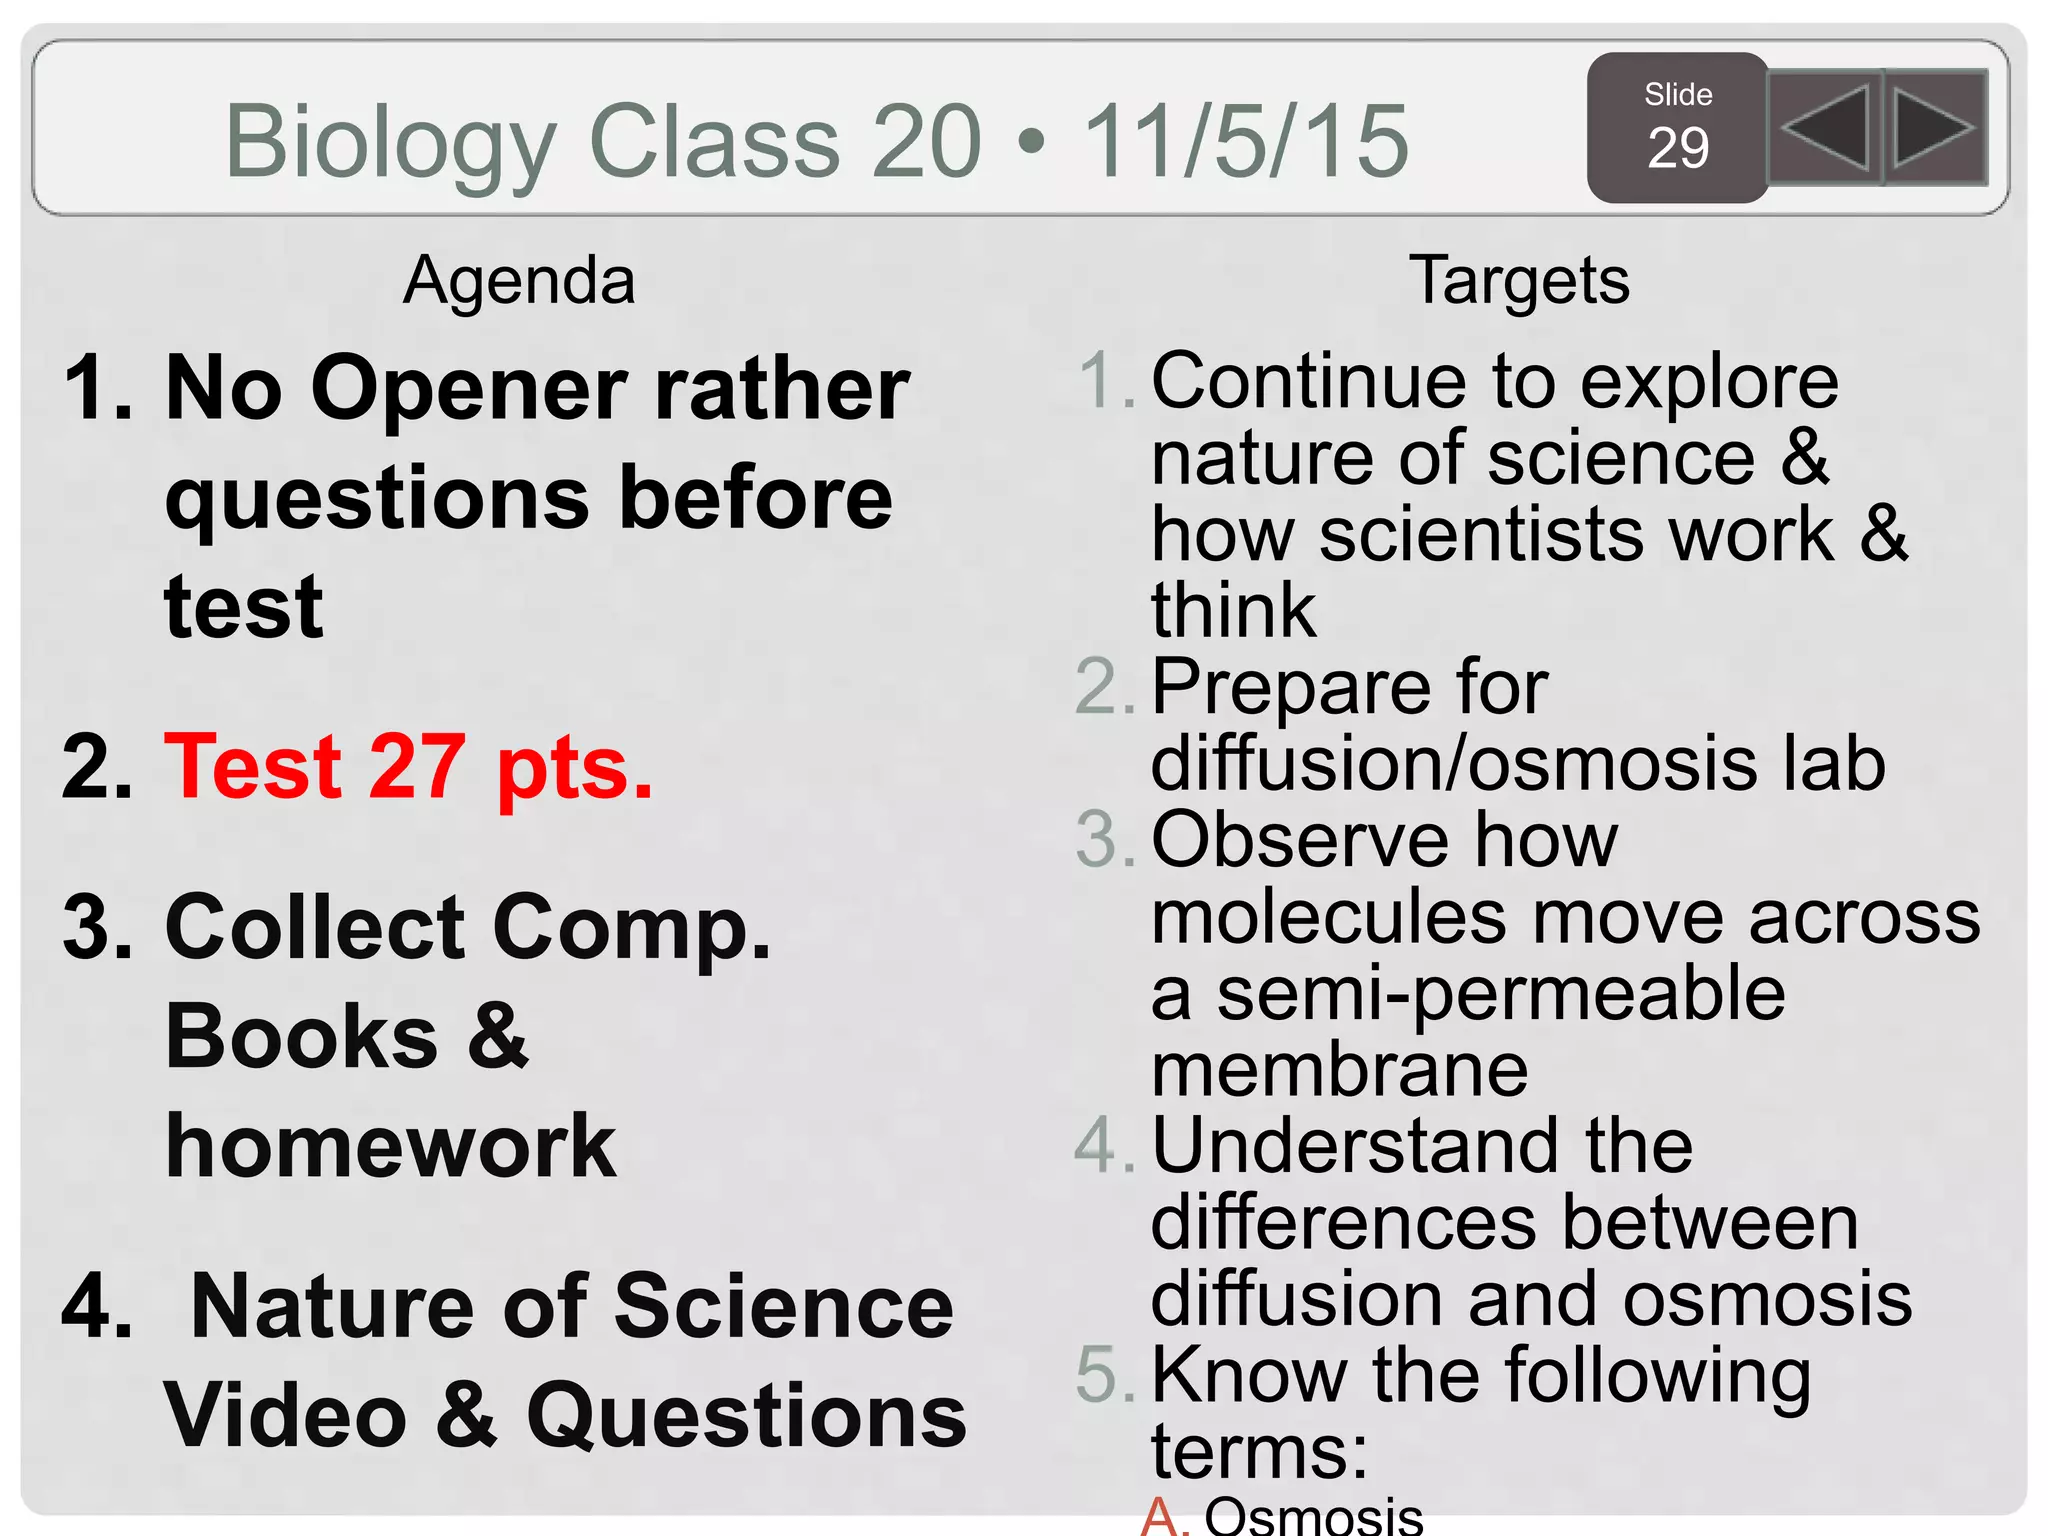


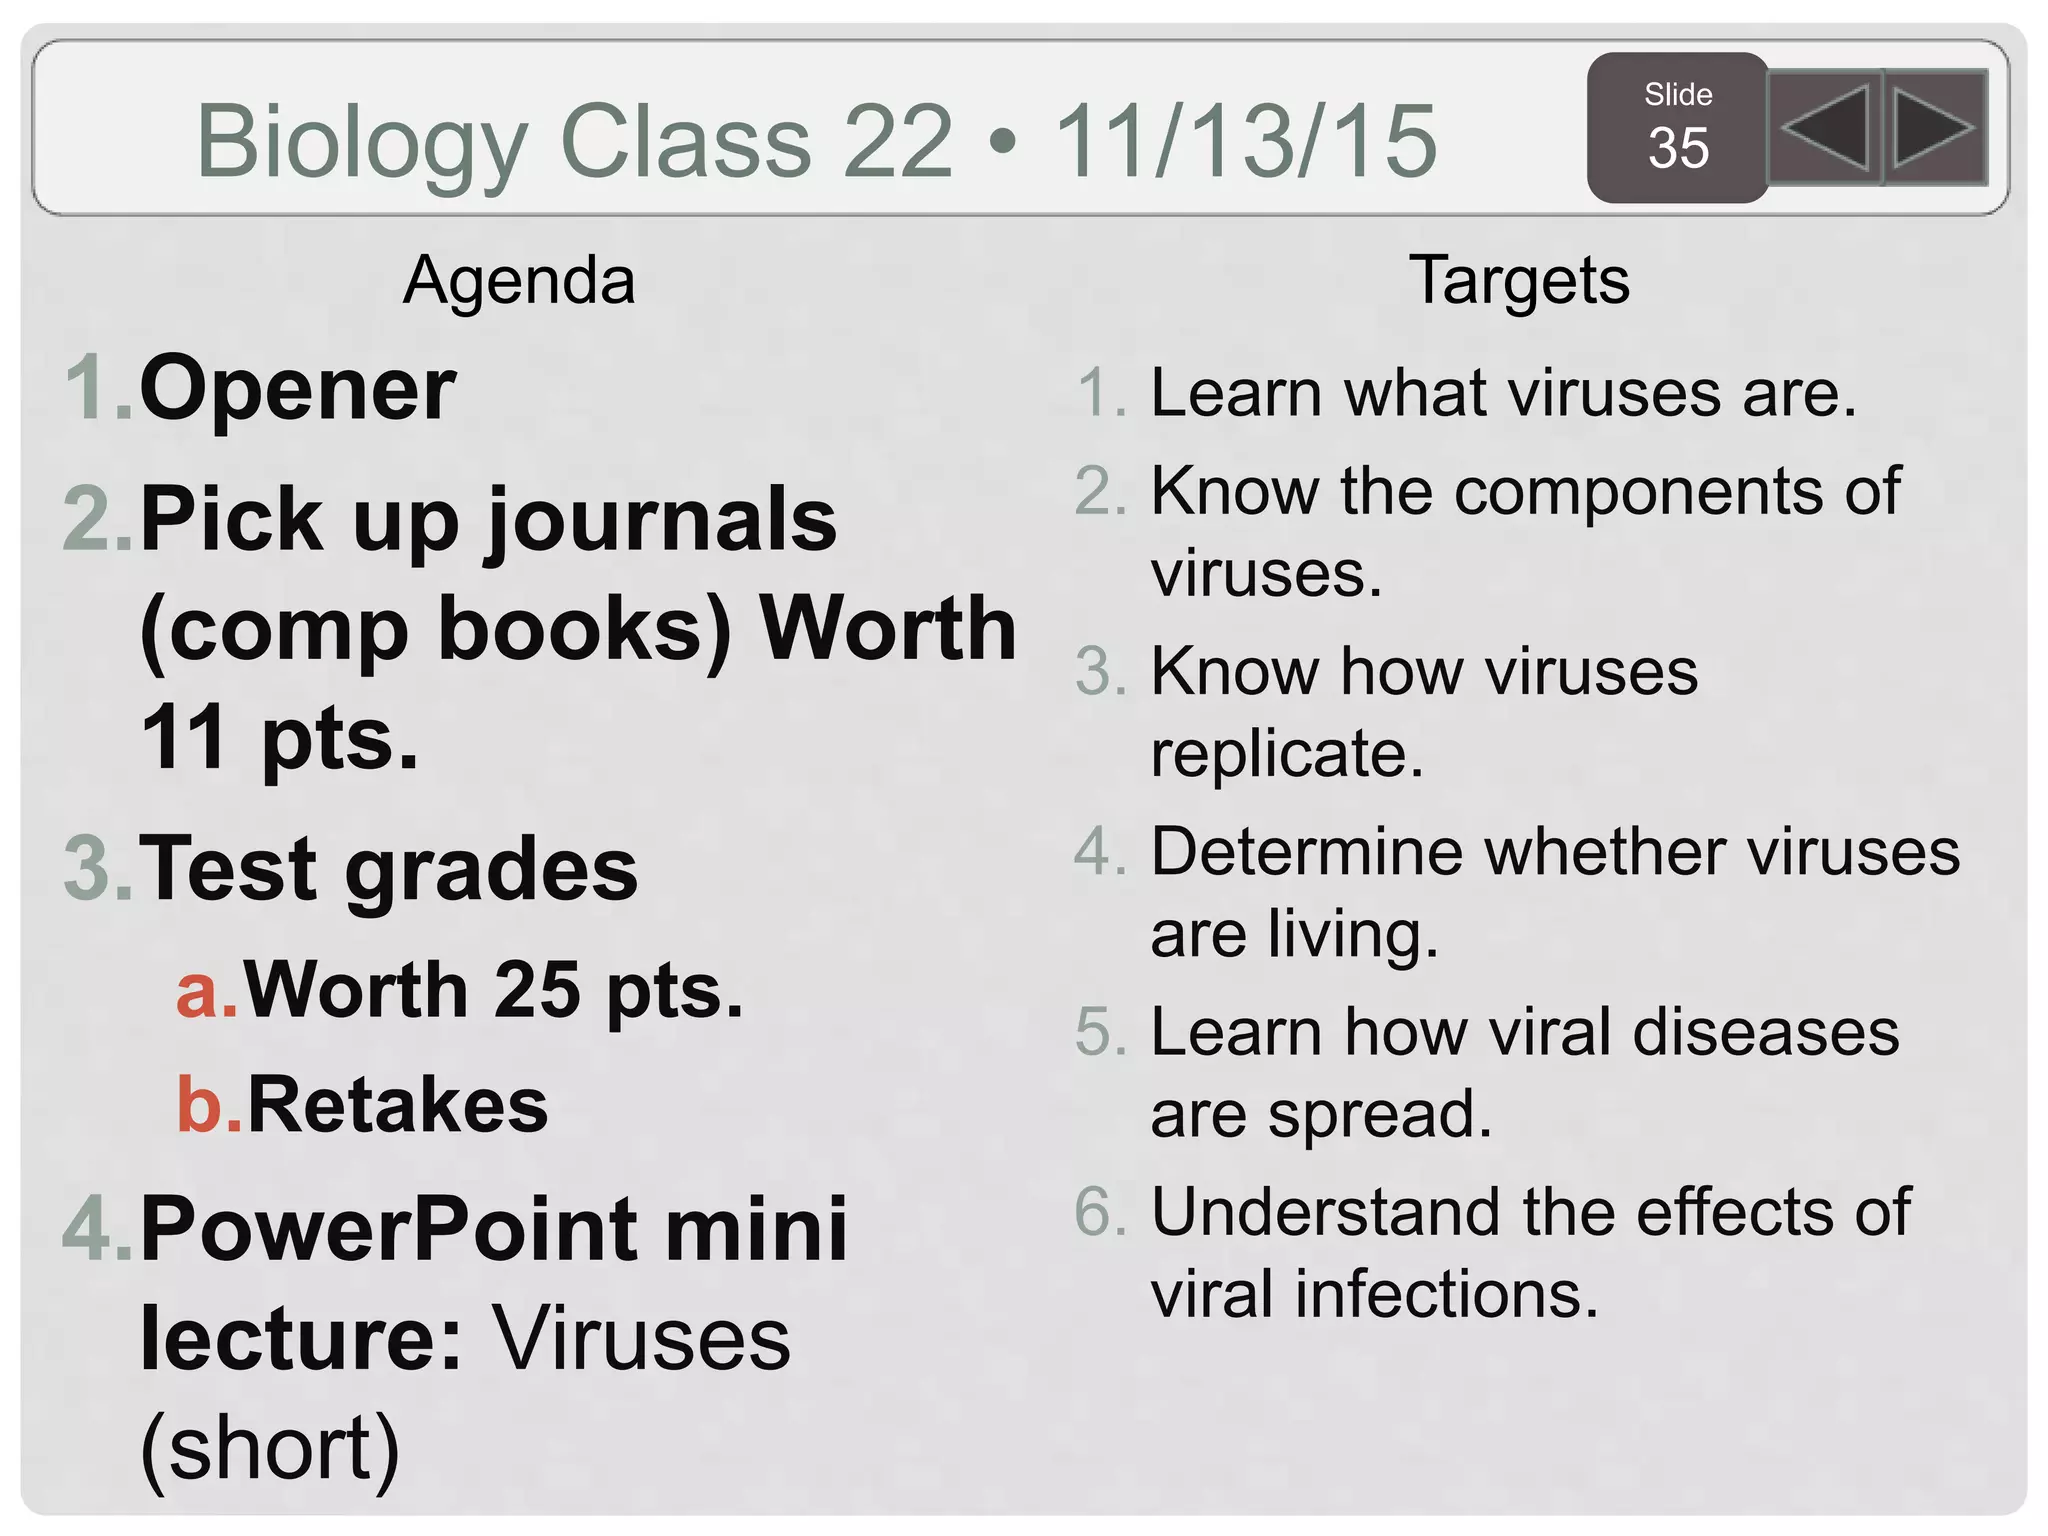


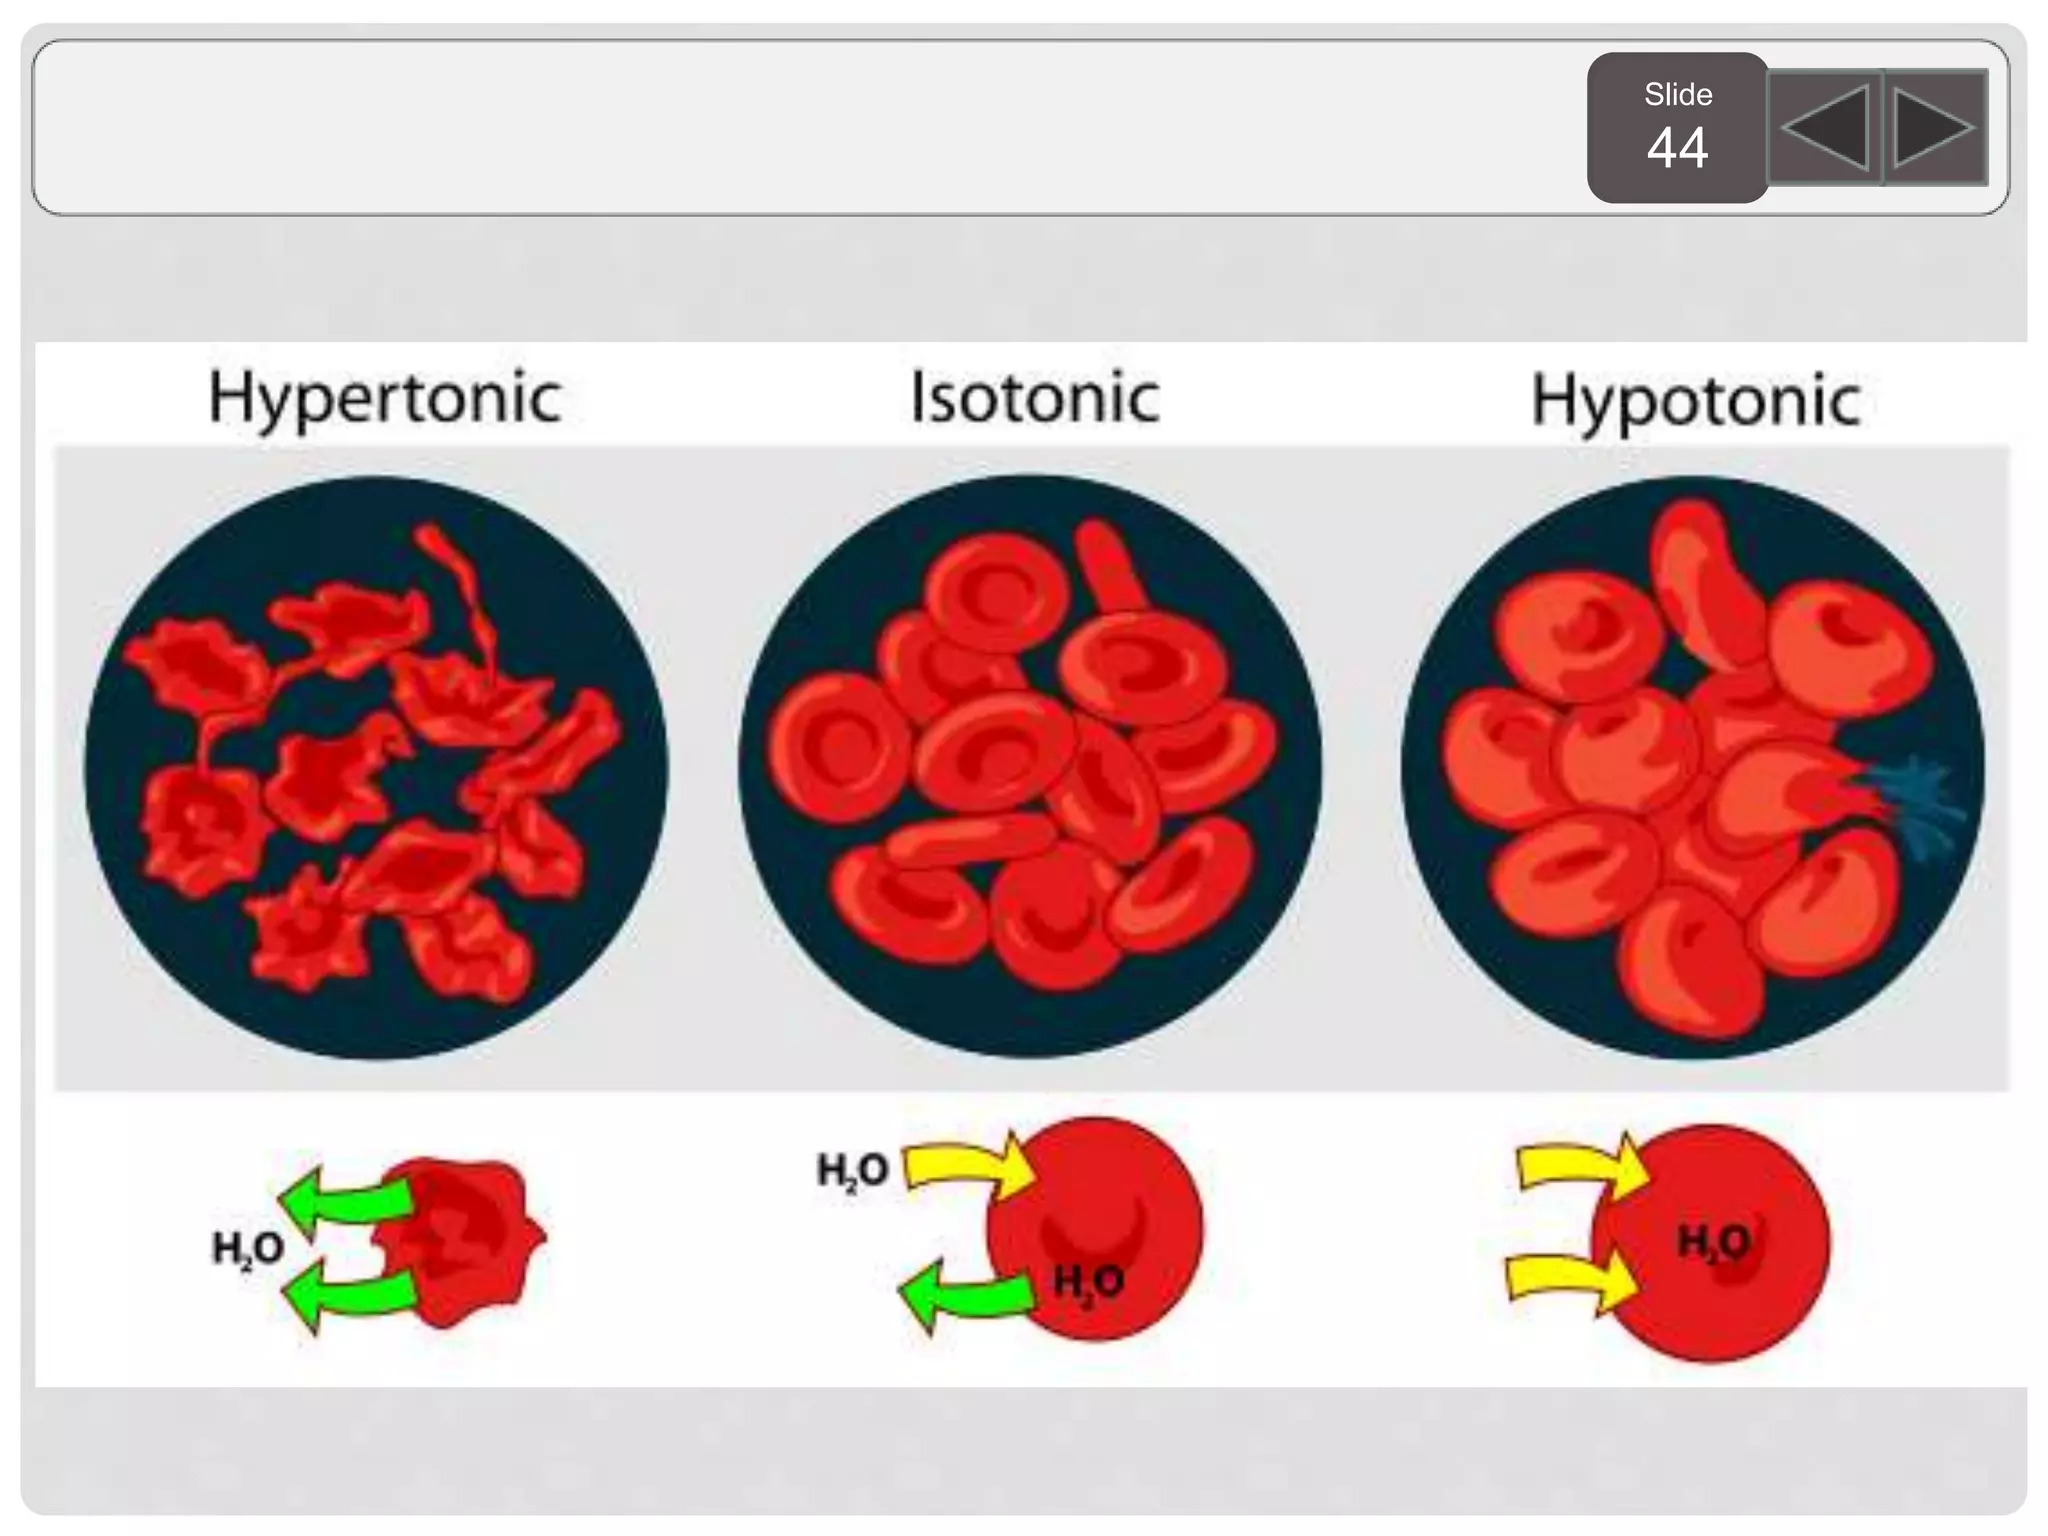

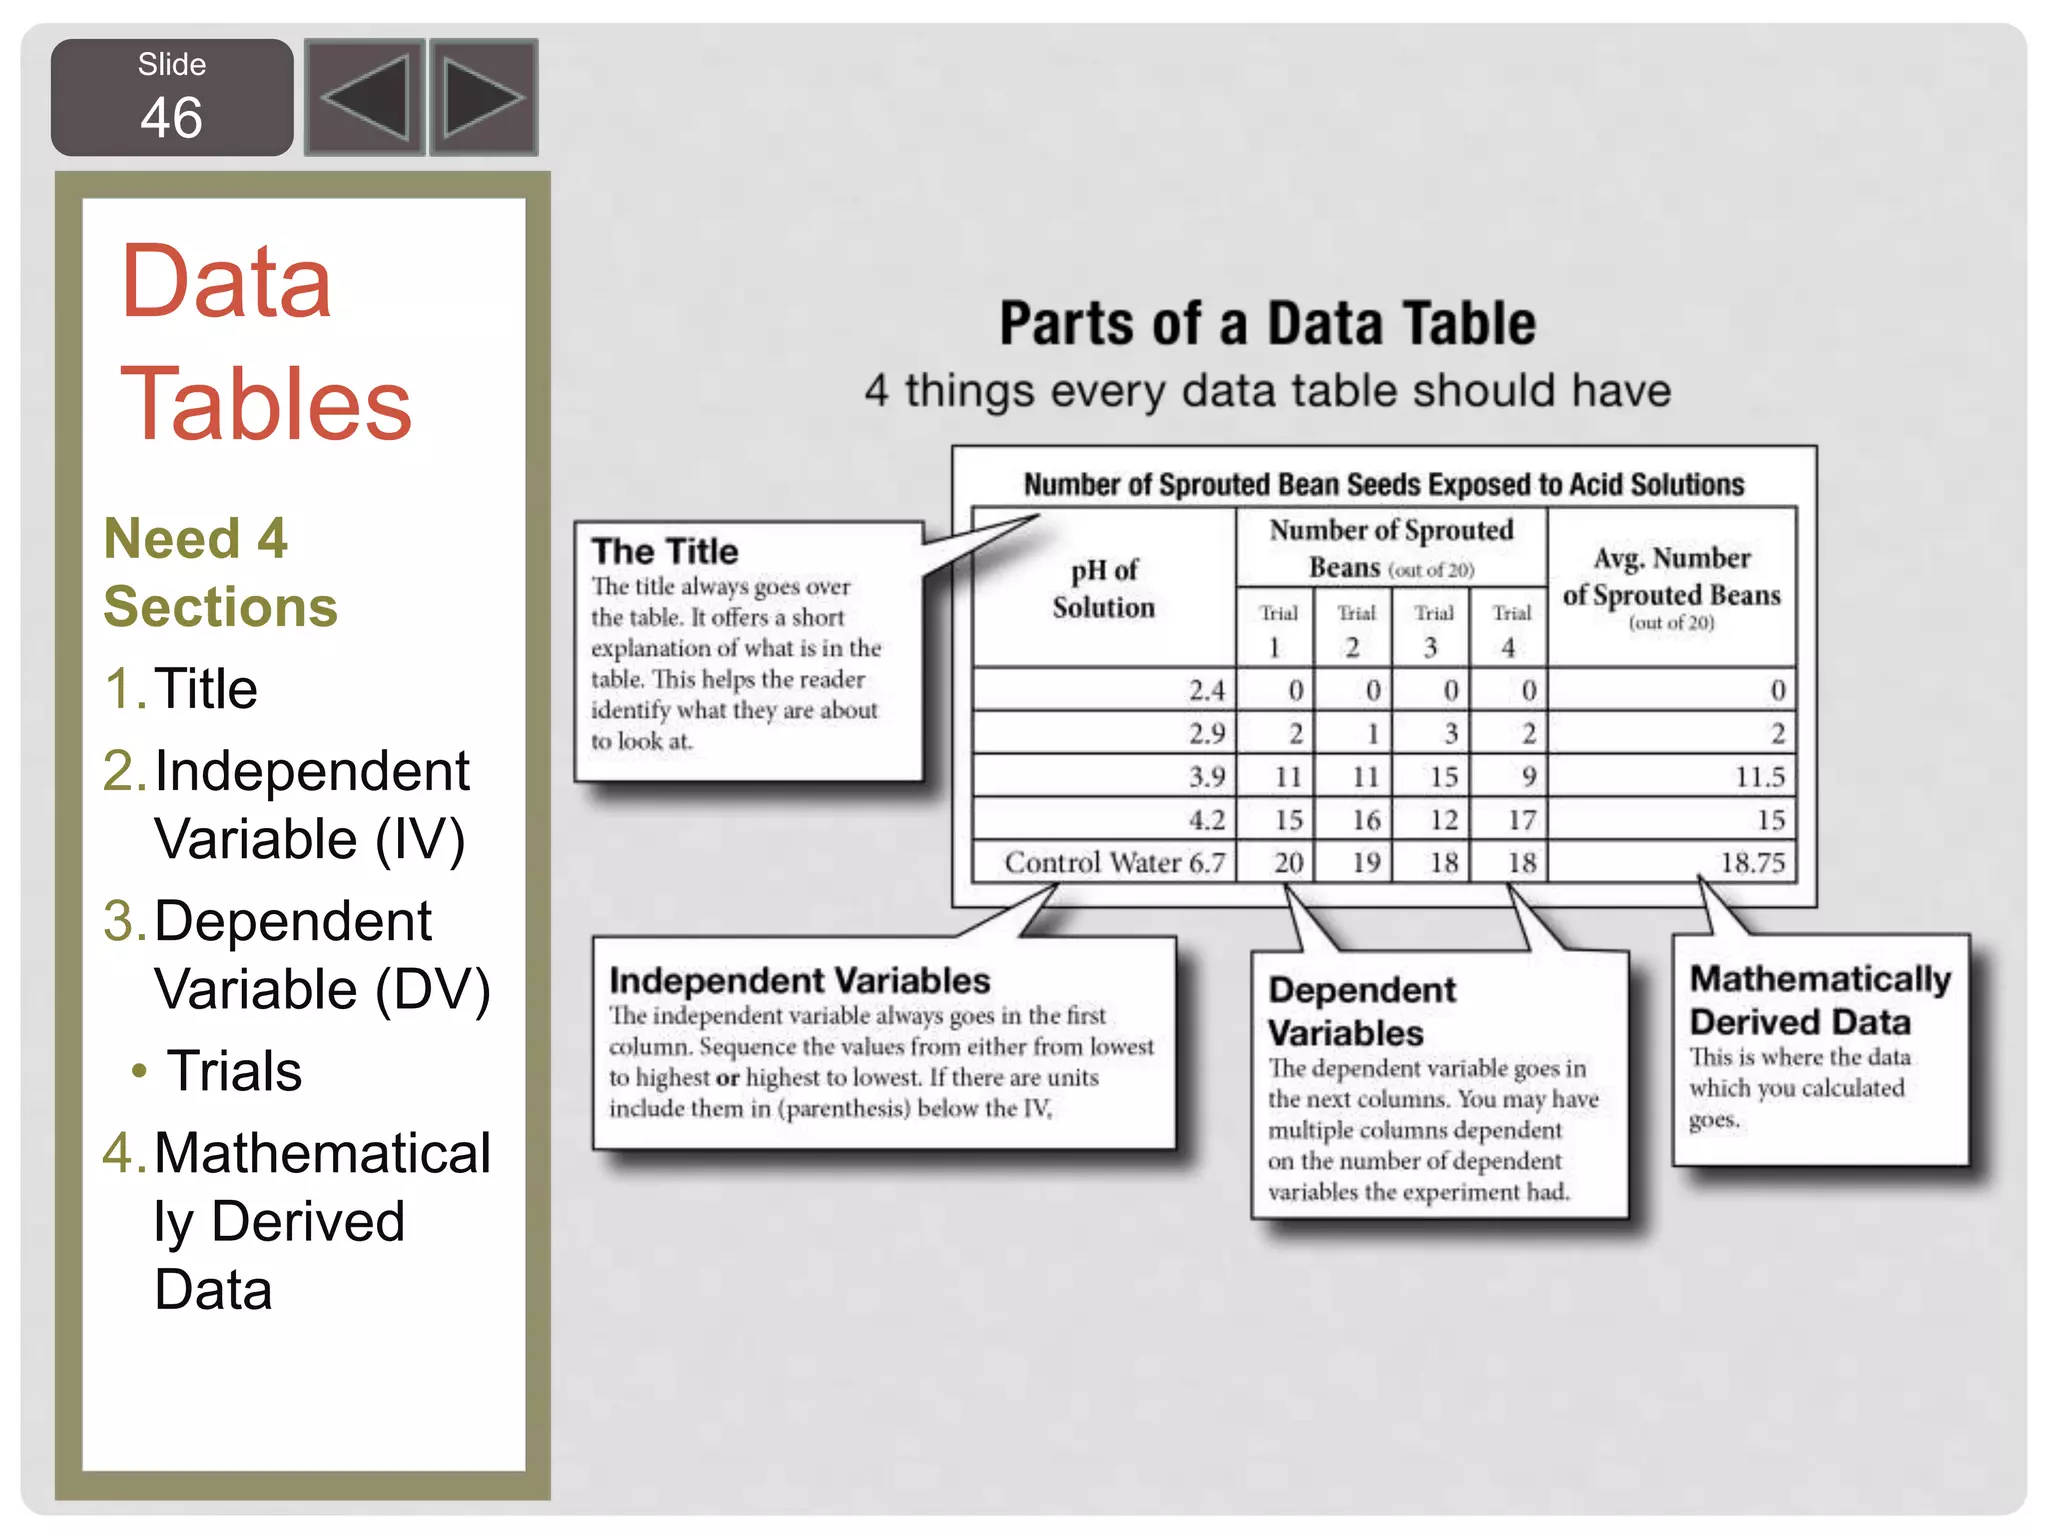


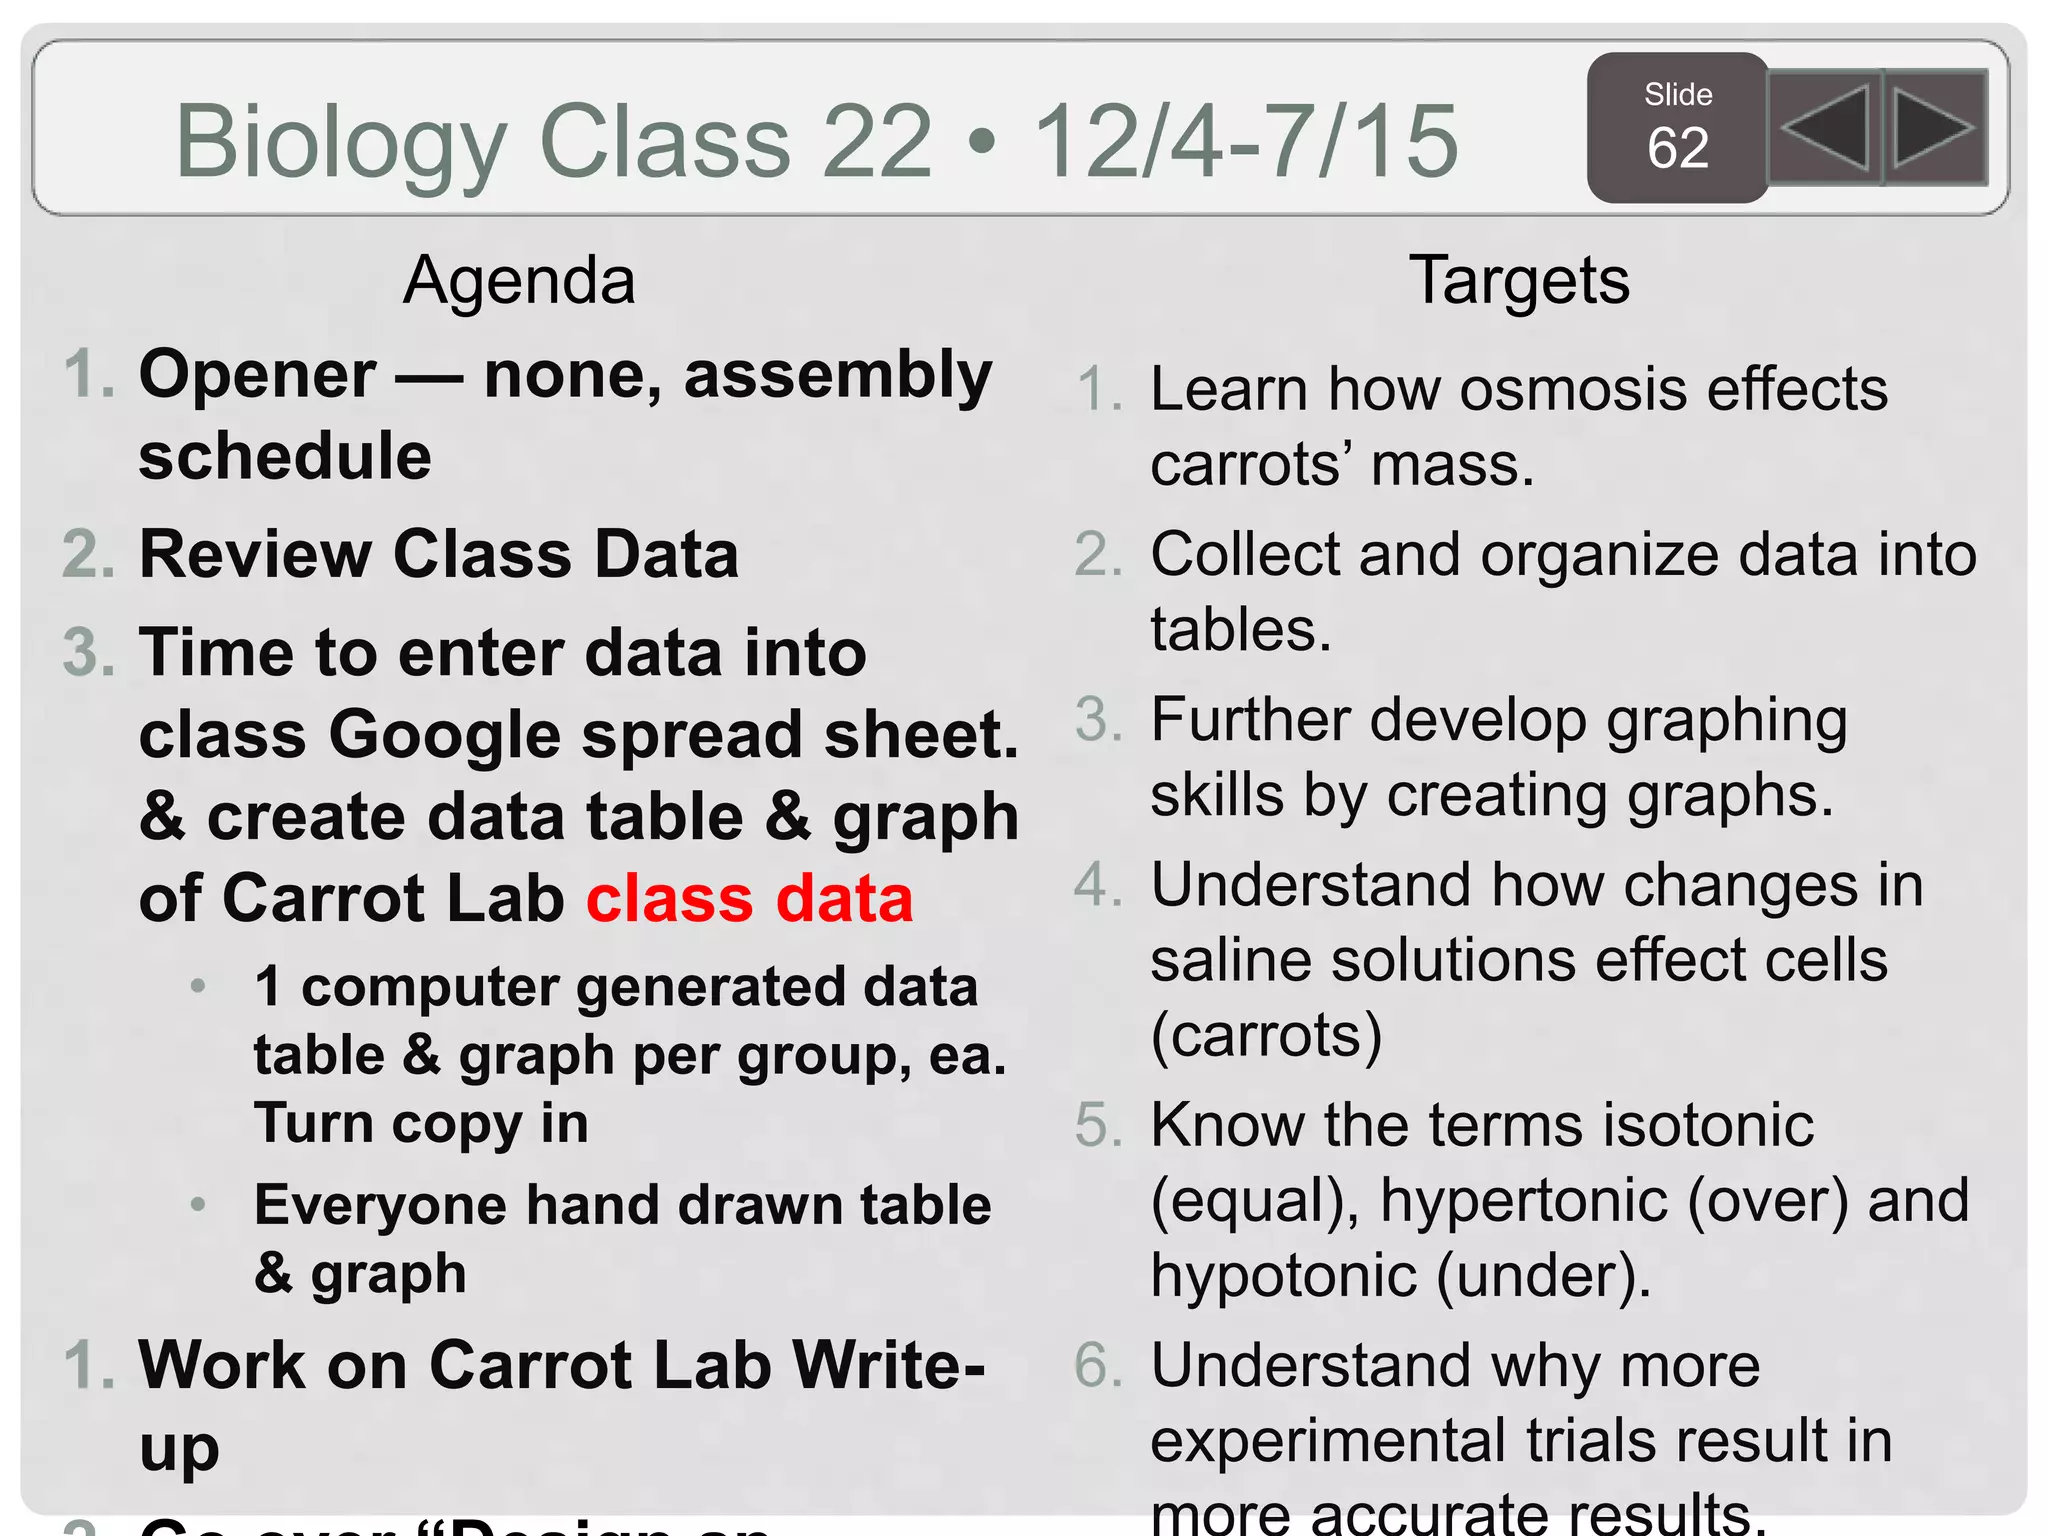
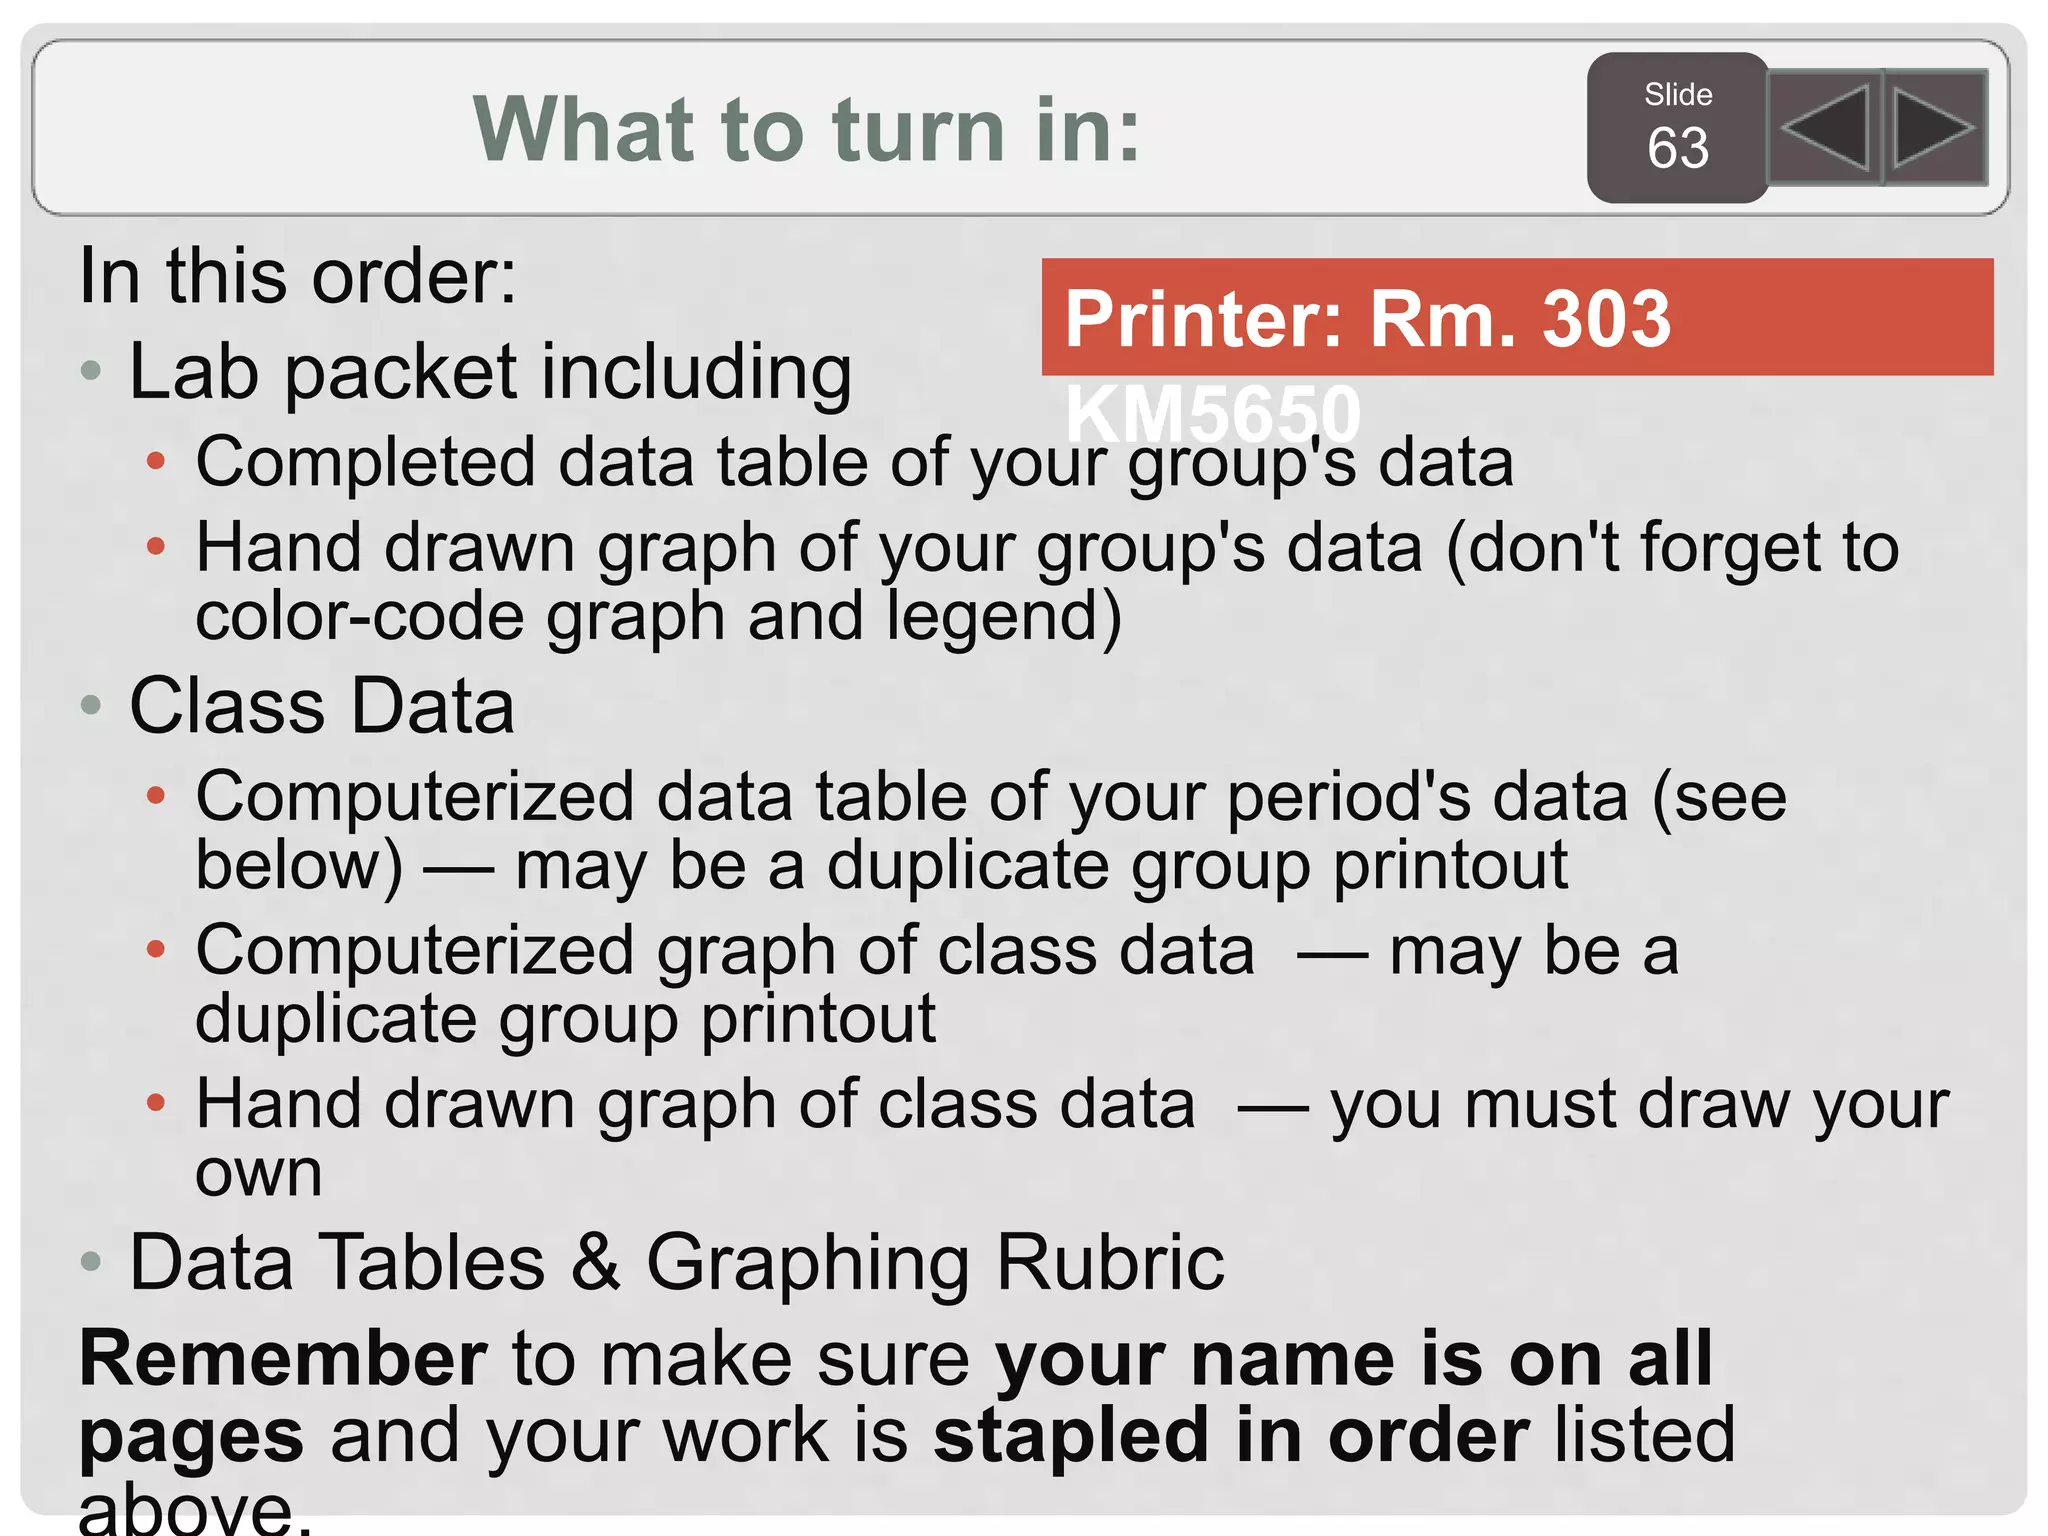


This document appears to be a series of slides from a biology class covering topics related to cell processes and cellular membranes. The slides include openers with questions to start each class, agendas listing the day's targets and activities, and images/diagrams to support the material. One class includes a lab on diffusion where students observe iodine moving through a permeable membrane into a starch solution. Another class has students set up an osmosis lab using carrots in solutions of varying salt concentrations to observe effects of osmosis.


