
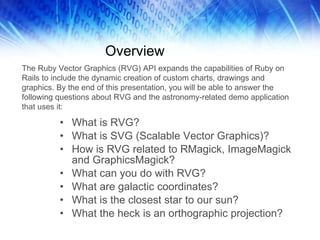

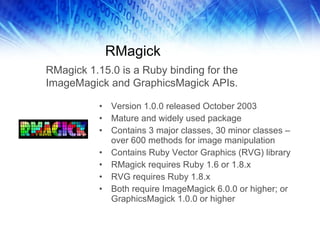
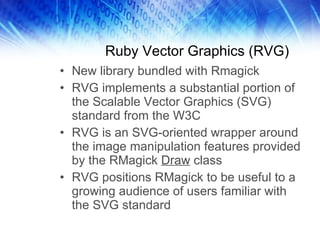


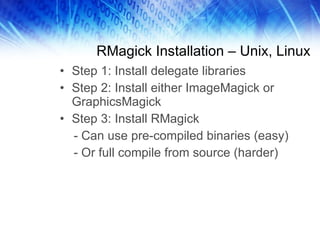
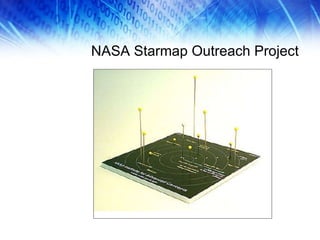


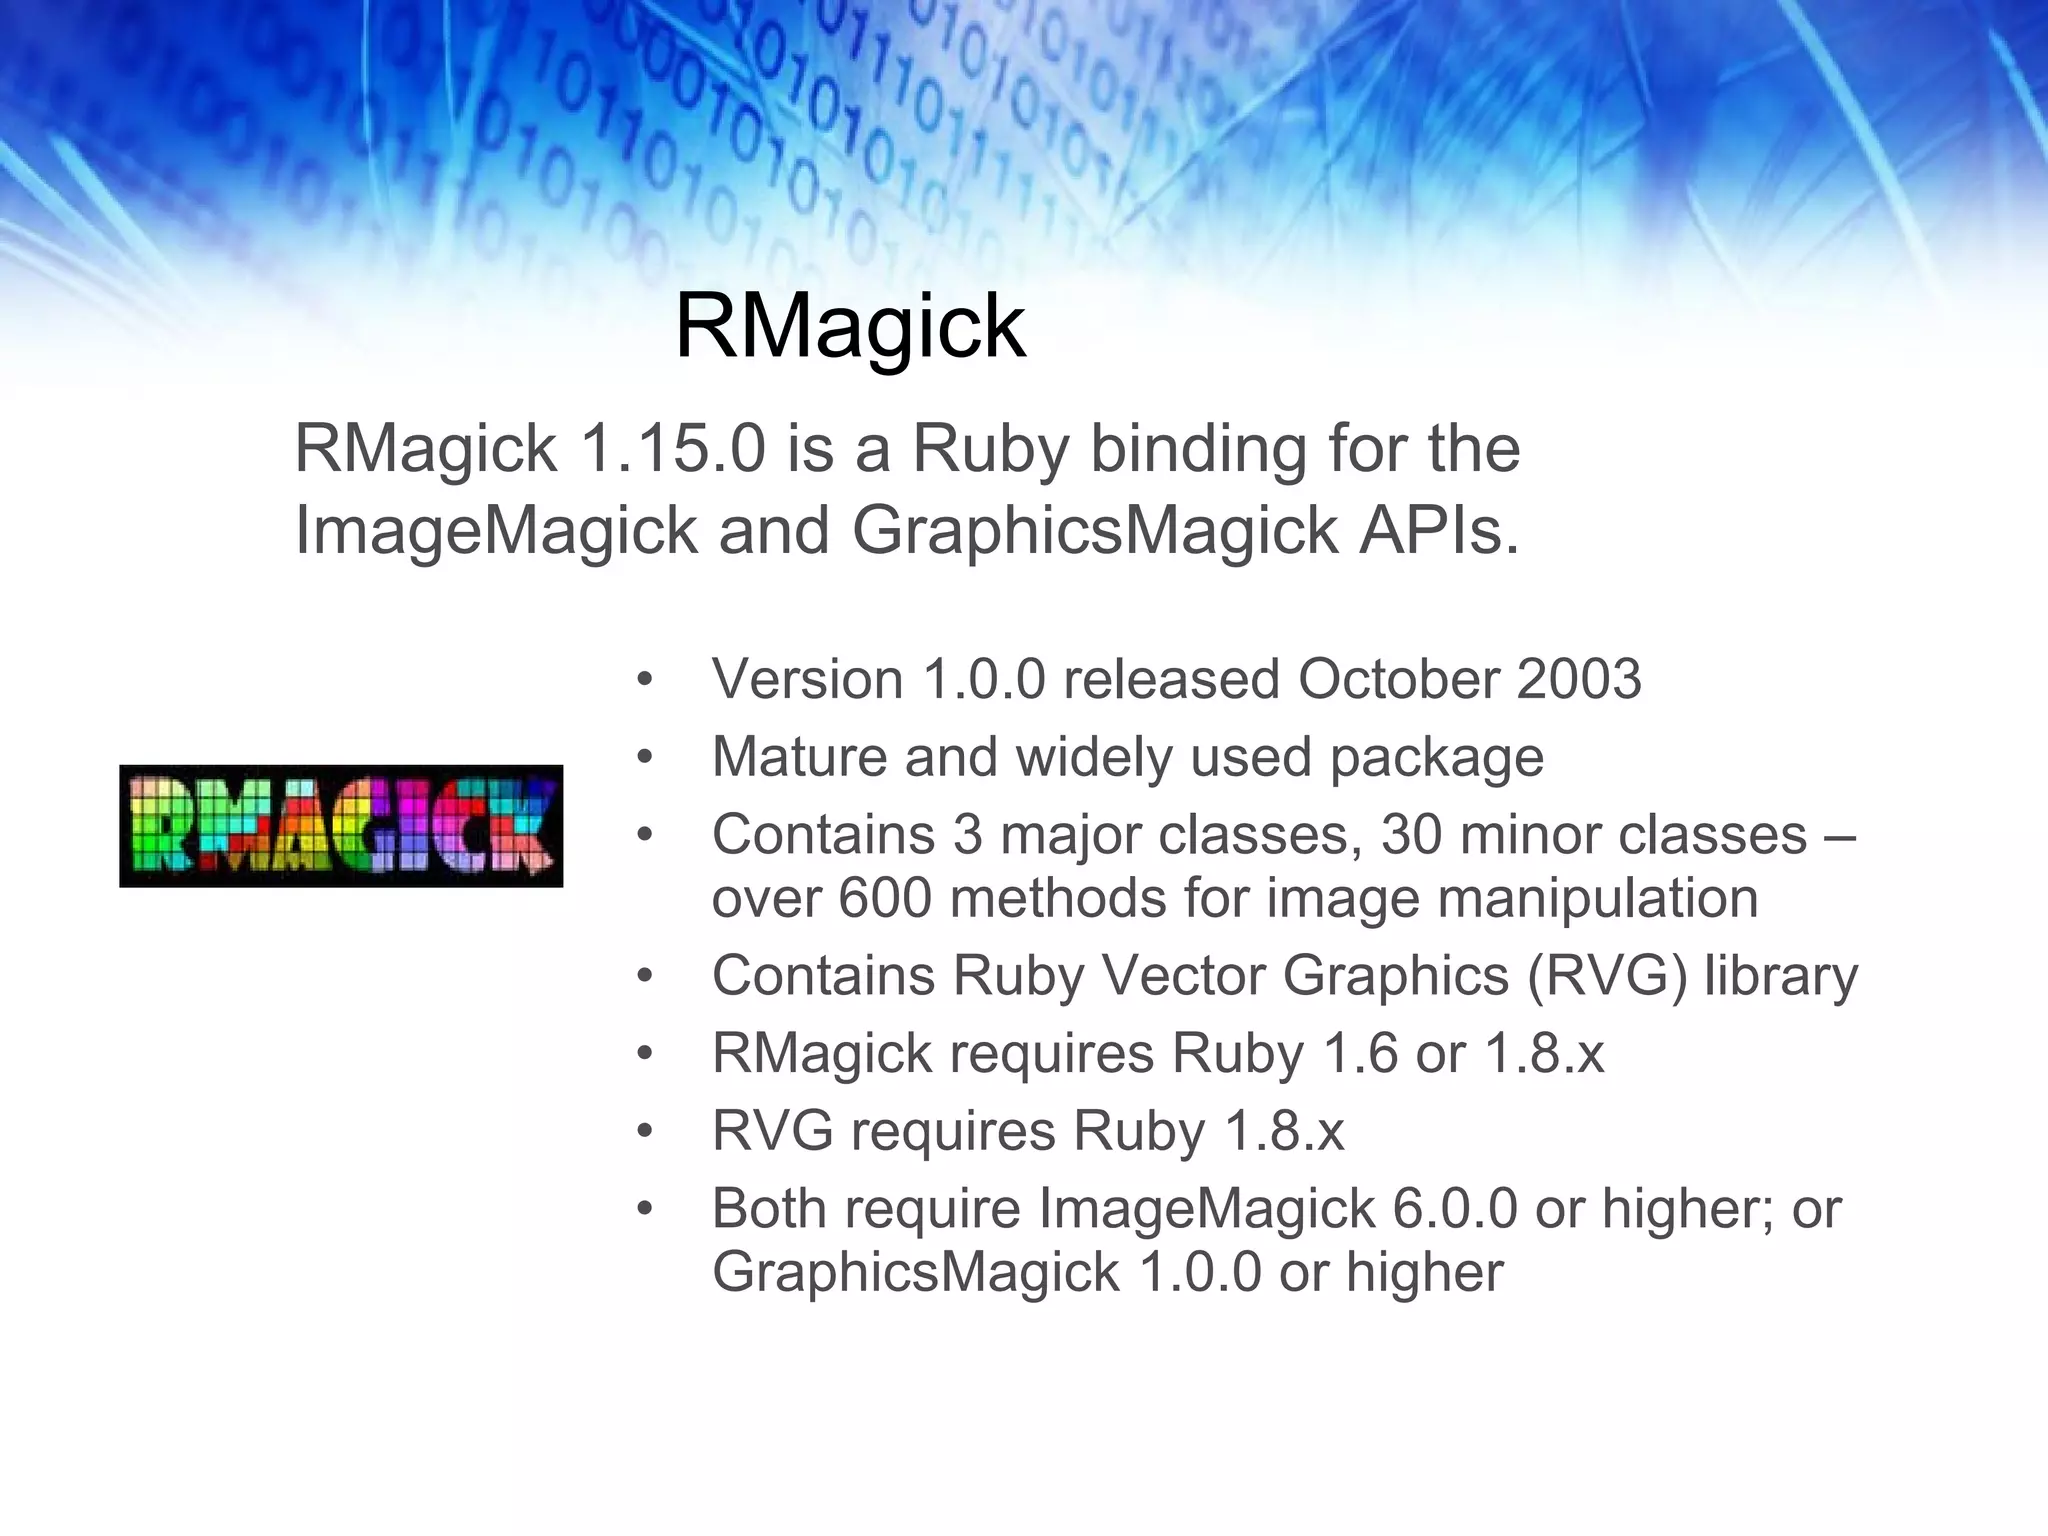
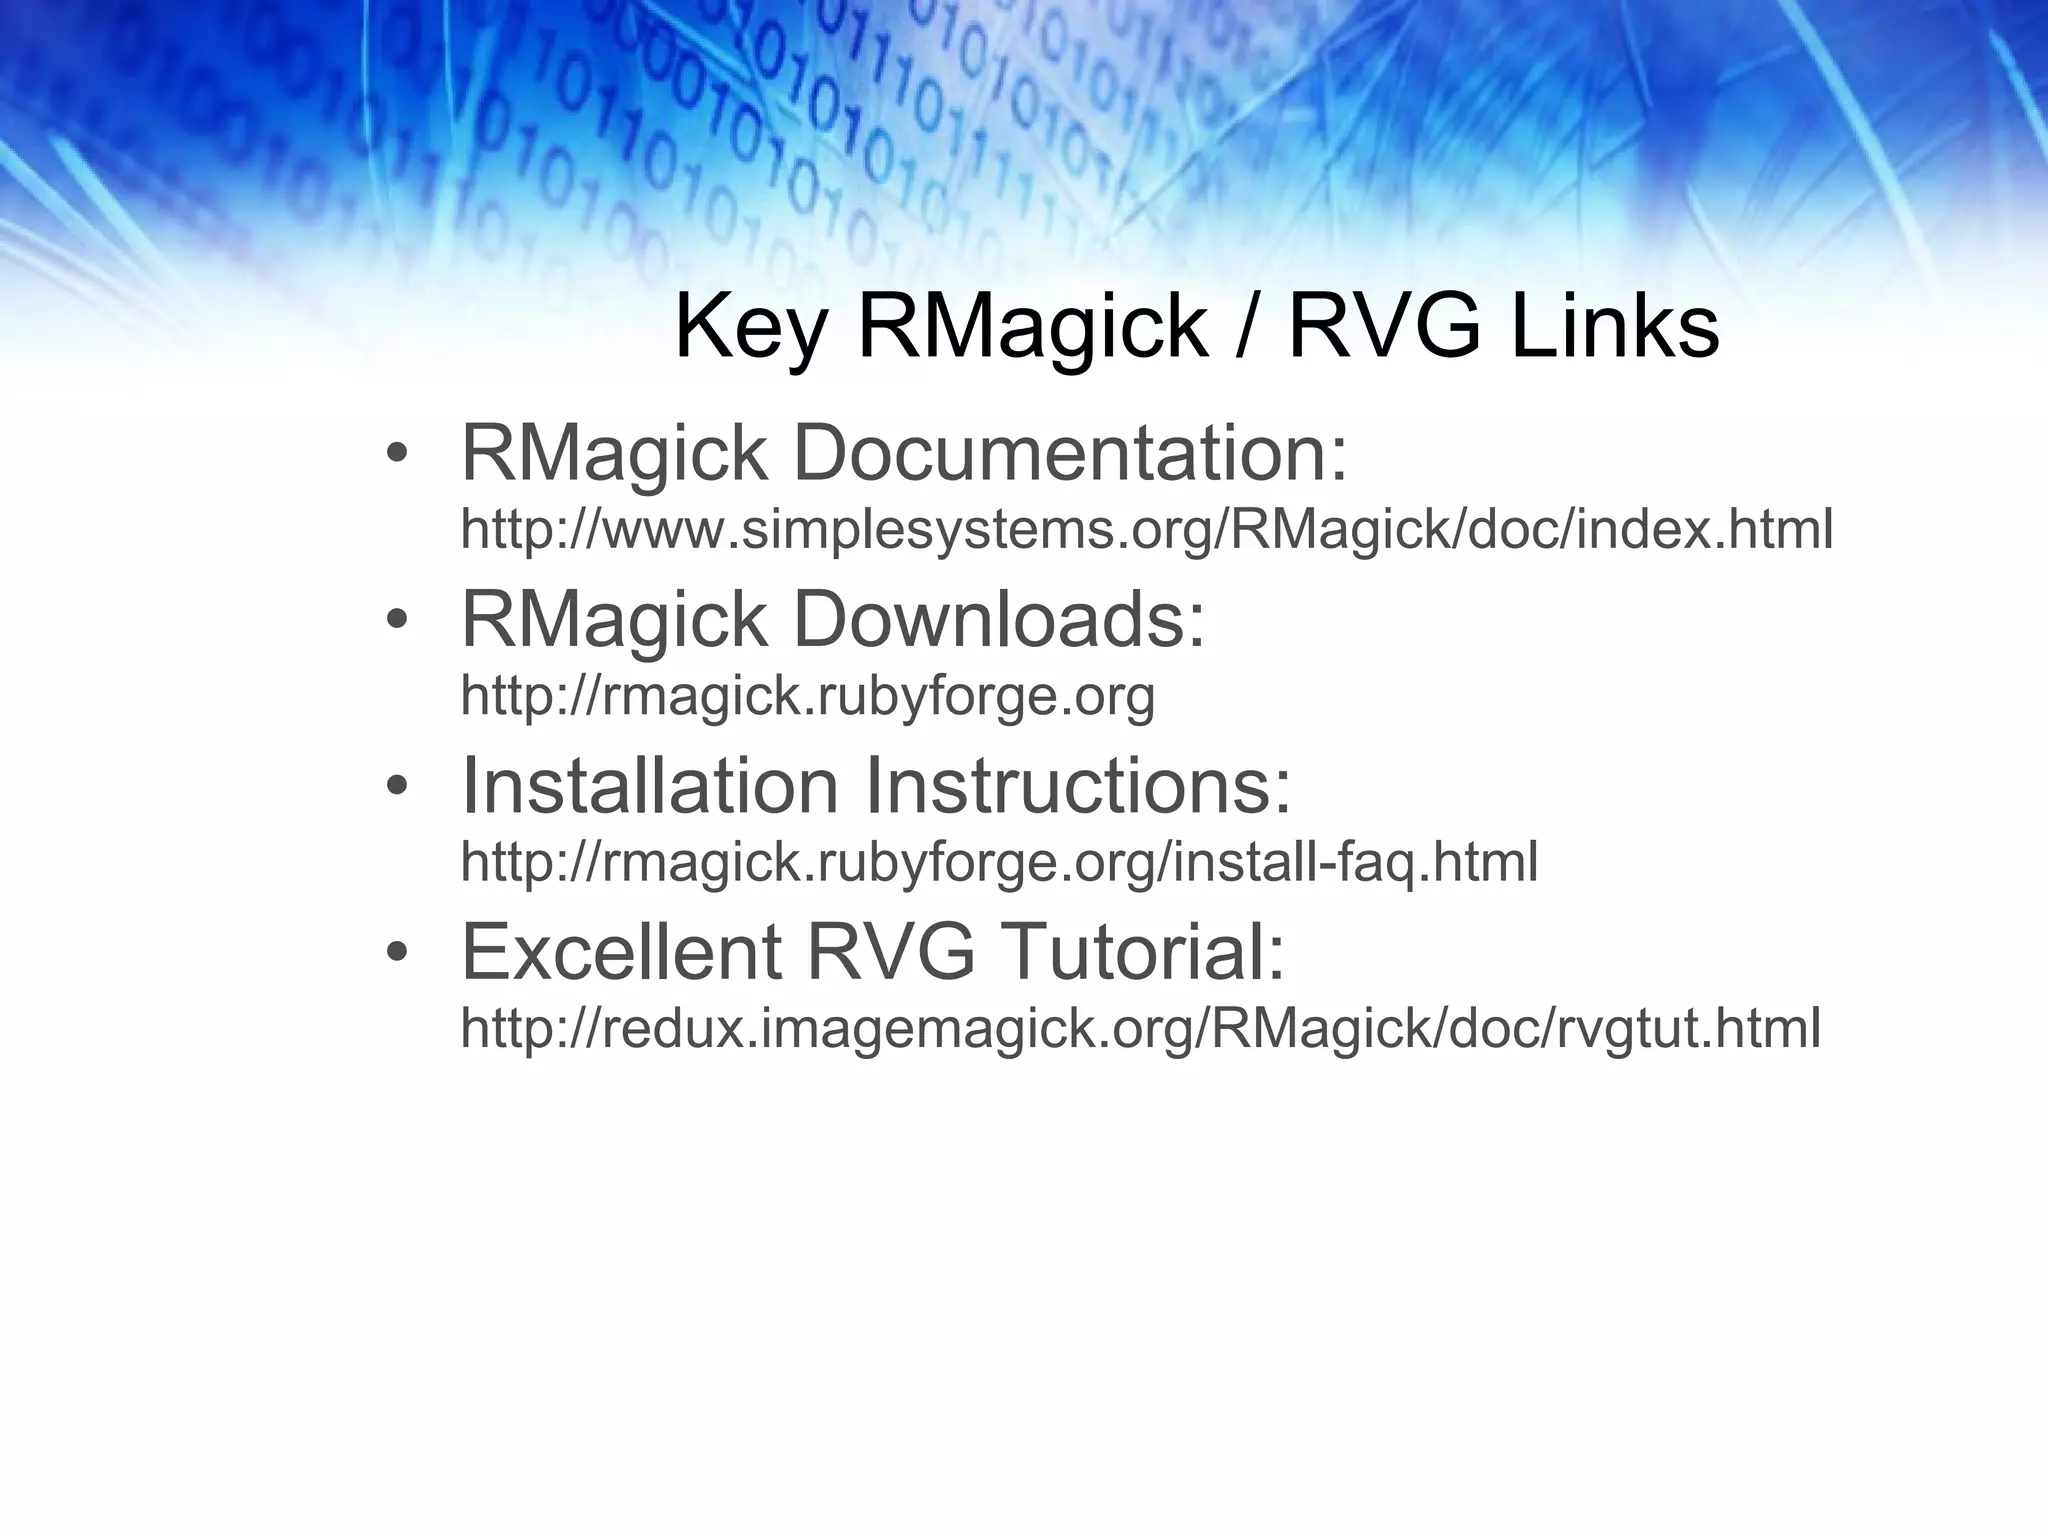
![Basic Drawing With RVG require 'rvg/rvg' include Magick class Demo def self.create_demo # Demonstrates how to draw the floor in perspective RVG::dpi = 72 ptc = { :x => 50, :y => 50, :z => -100 } # Reference Point pt1 = { :x => 0, :y => 0, :z => 0 } # Corner 1 pt2 = { :x => 100, :y => 0, :z => 0 } # Corner 2 pt3 = { :x => 100, :y => 0, :z => 100 } # Corner 3 pt4 = { :x => 0, :y => 0, :z => 100 } # Corner 4 rvg = RVG.new(7.in, 7.in).viewbox(0,0,500,500) do |canvas| canvas.background_fill = 'white‘ canvas.g.translate(450, 450).rotate(0) do |floor| floor.styles(:fill=>'lightgray', :stroke=>'silver', :stroke_width=>1) xs1 = self.transform(pt1, ptc) # Perform perspective transformations here xs2 = self.transform(pt2, ptc) xs3 = self.transform(pt3, ptc) xs4 = self.transform(pt4, ptc) floor.polygon(xs1[:x], xs1[:y], xs2[:x], xs2[:y], xs3[:x], xs3[:y], xs4[:x], xs4[:y]) end # Floor # Do more operations on the canvas… end # Canvas end rvg end](https://image.slidesharecdn.com/railsrvgintro-091225092337-phpapp02/85/Creating-Custom-Charts-With-Ruby-Vector-Graphics-25-320.jpg)
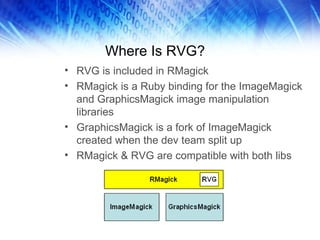
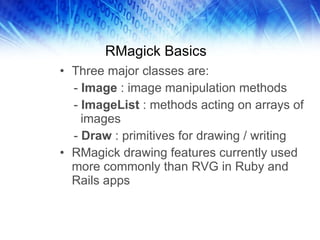
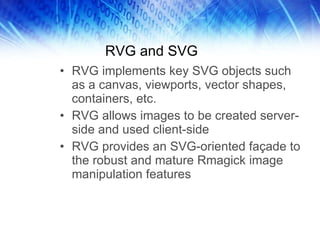
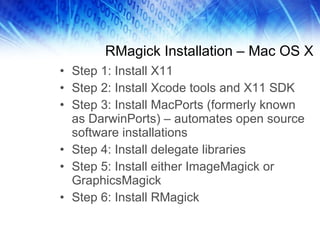
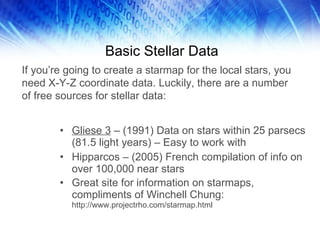
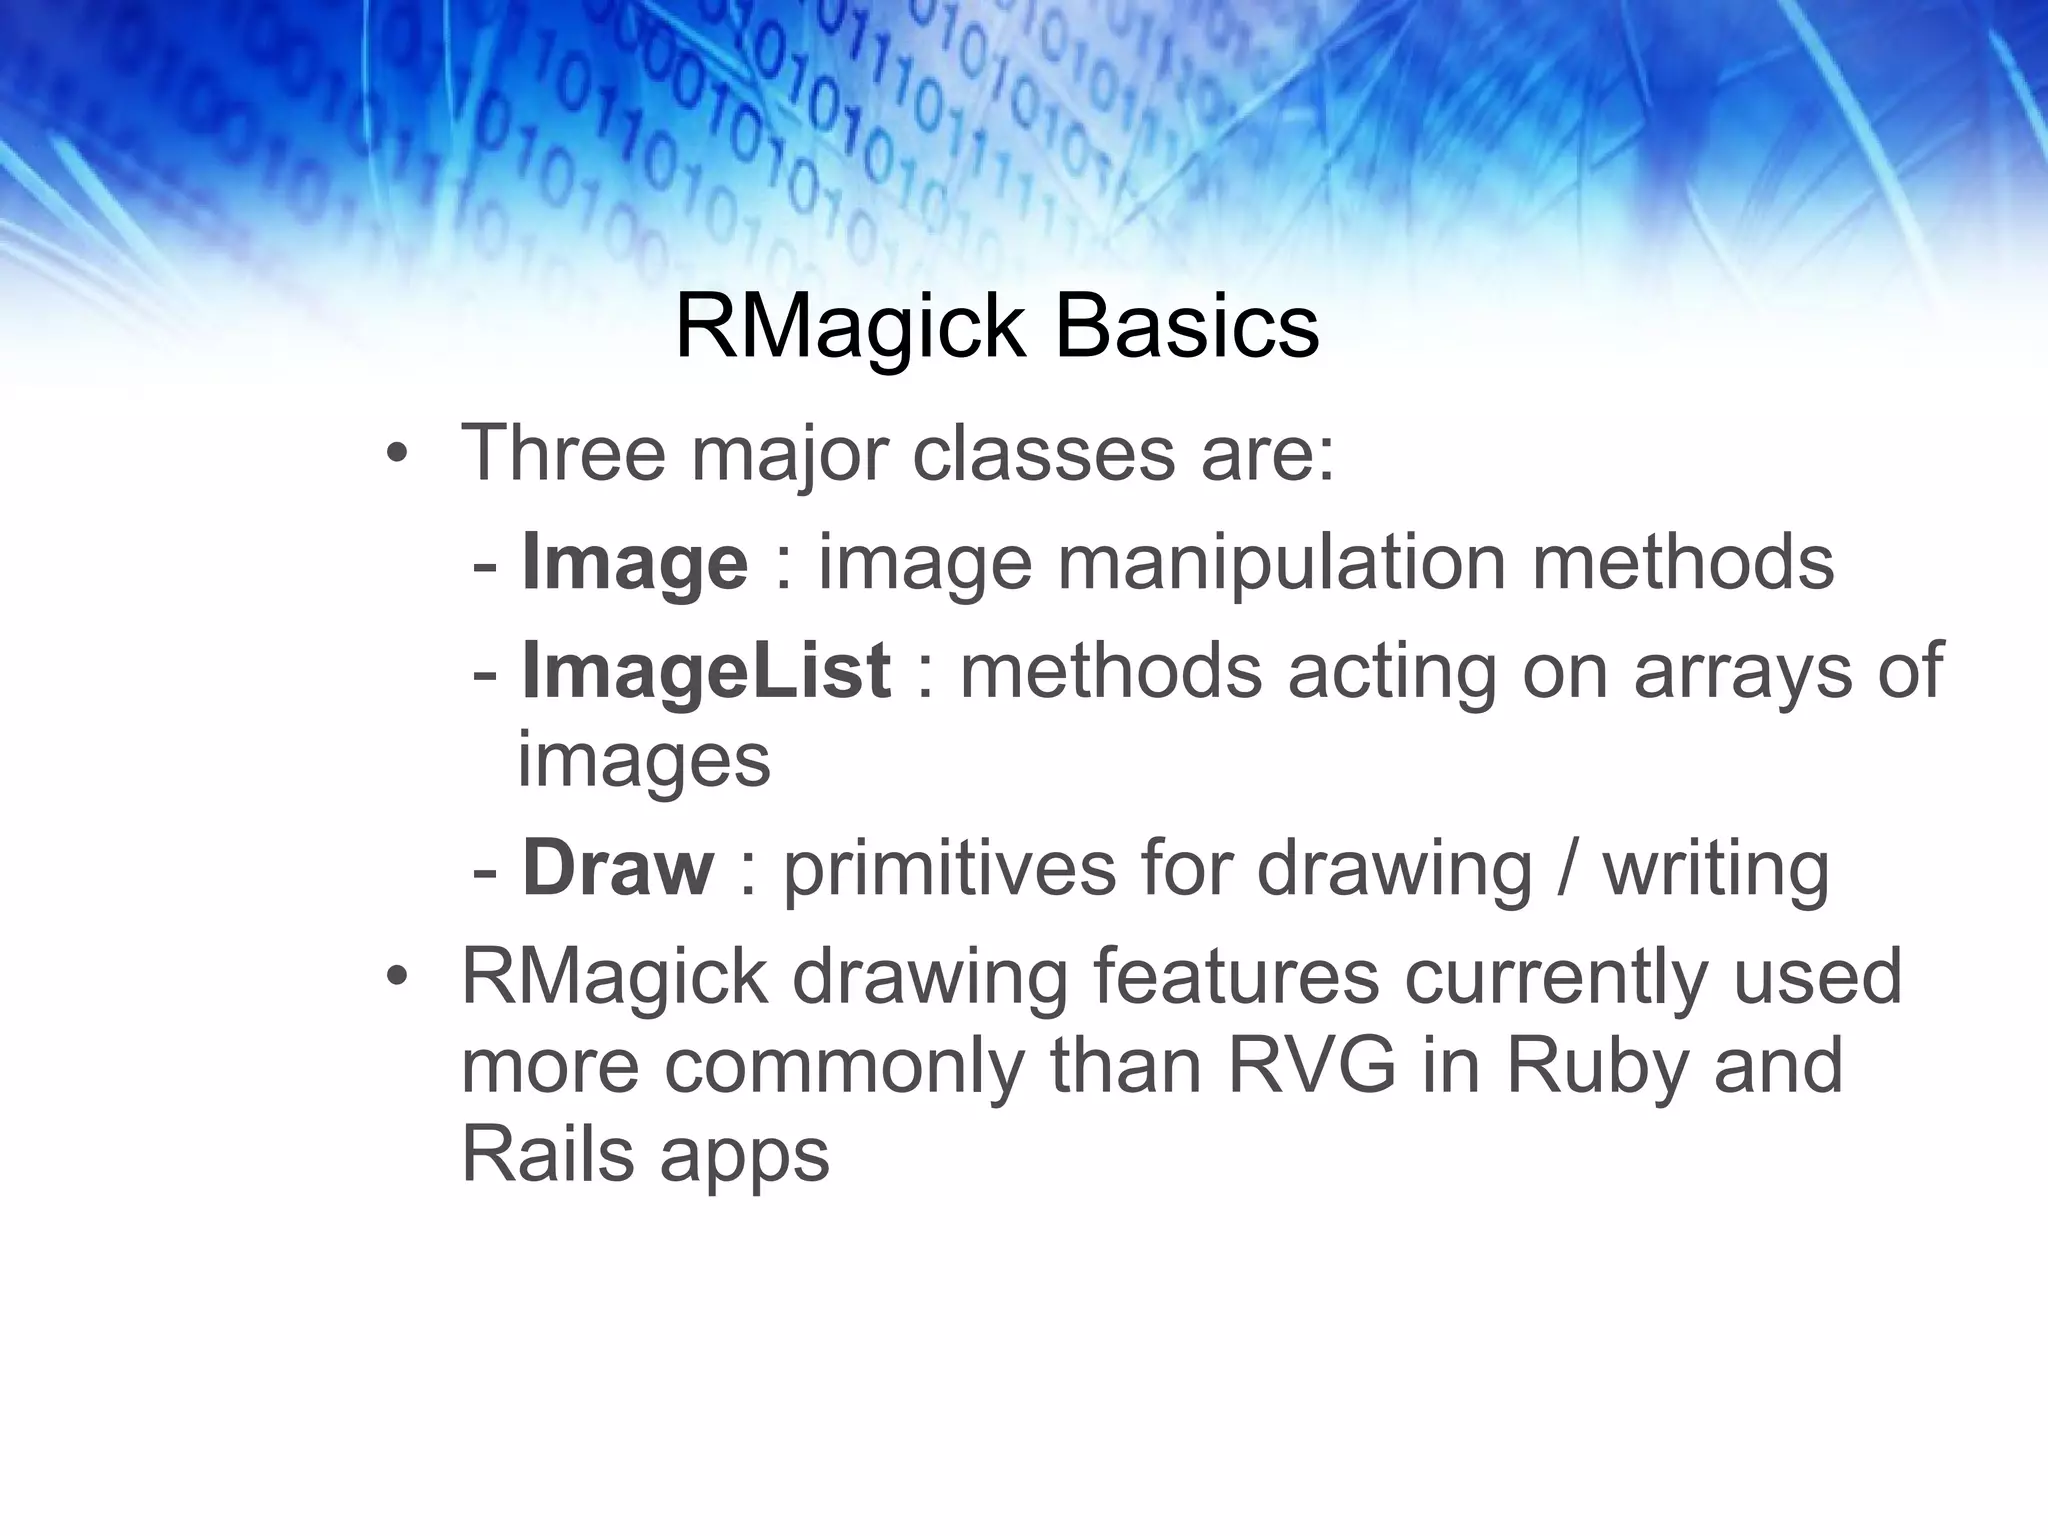
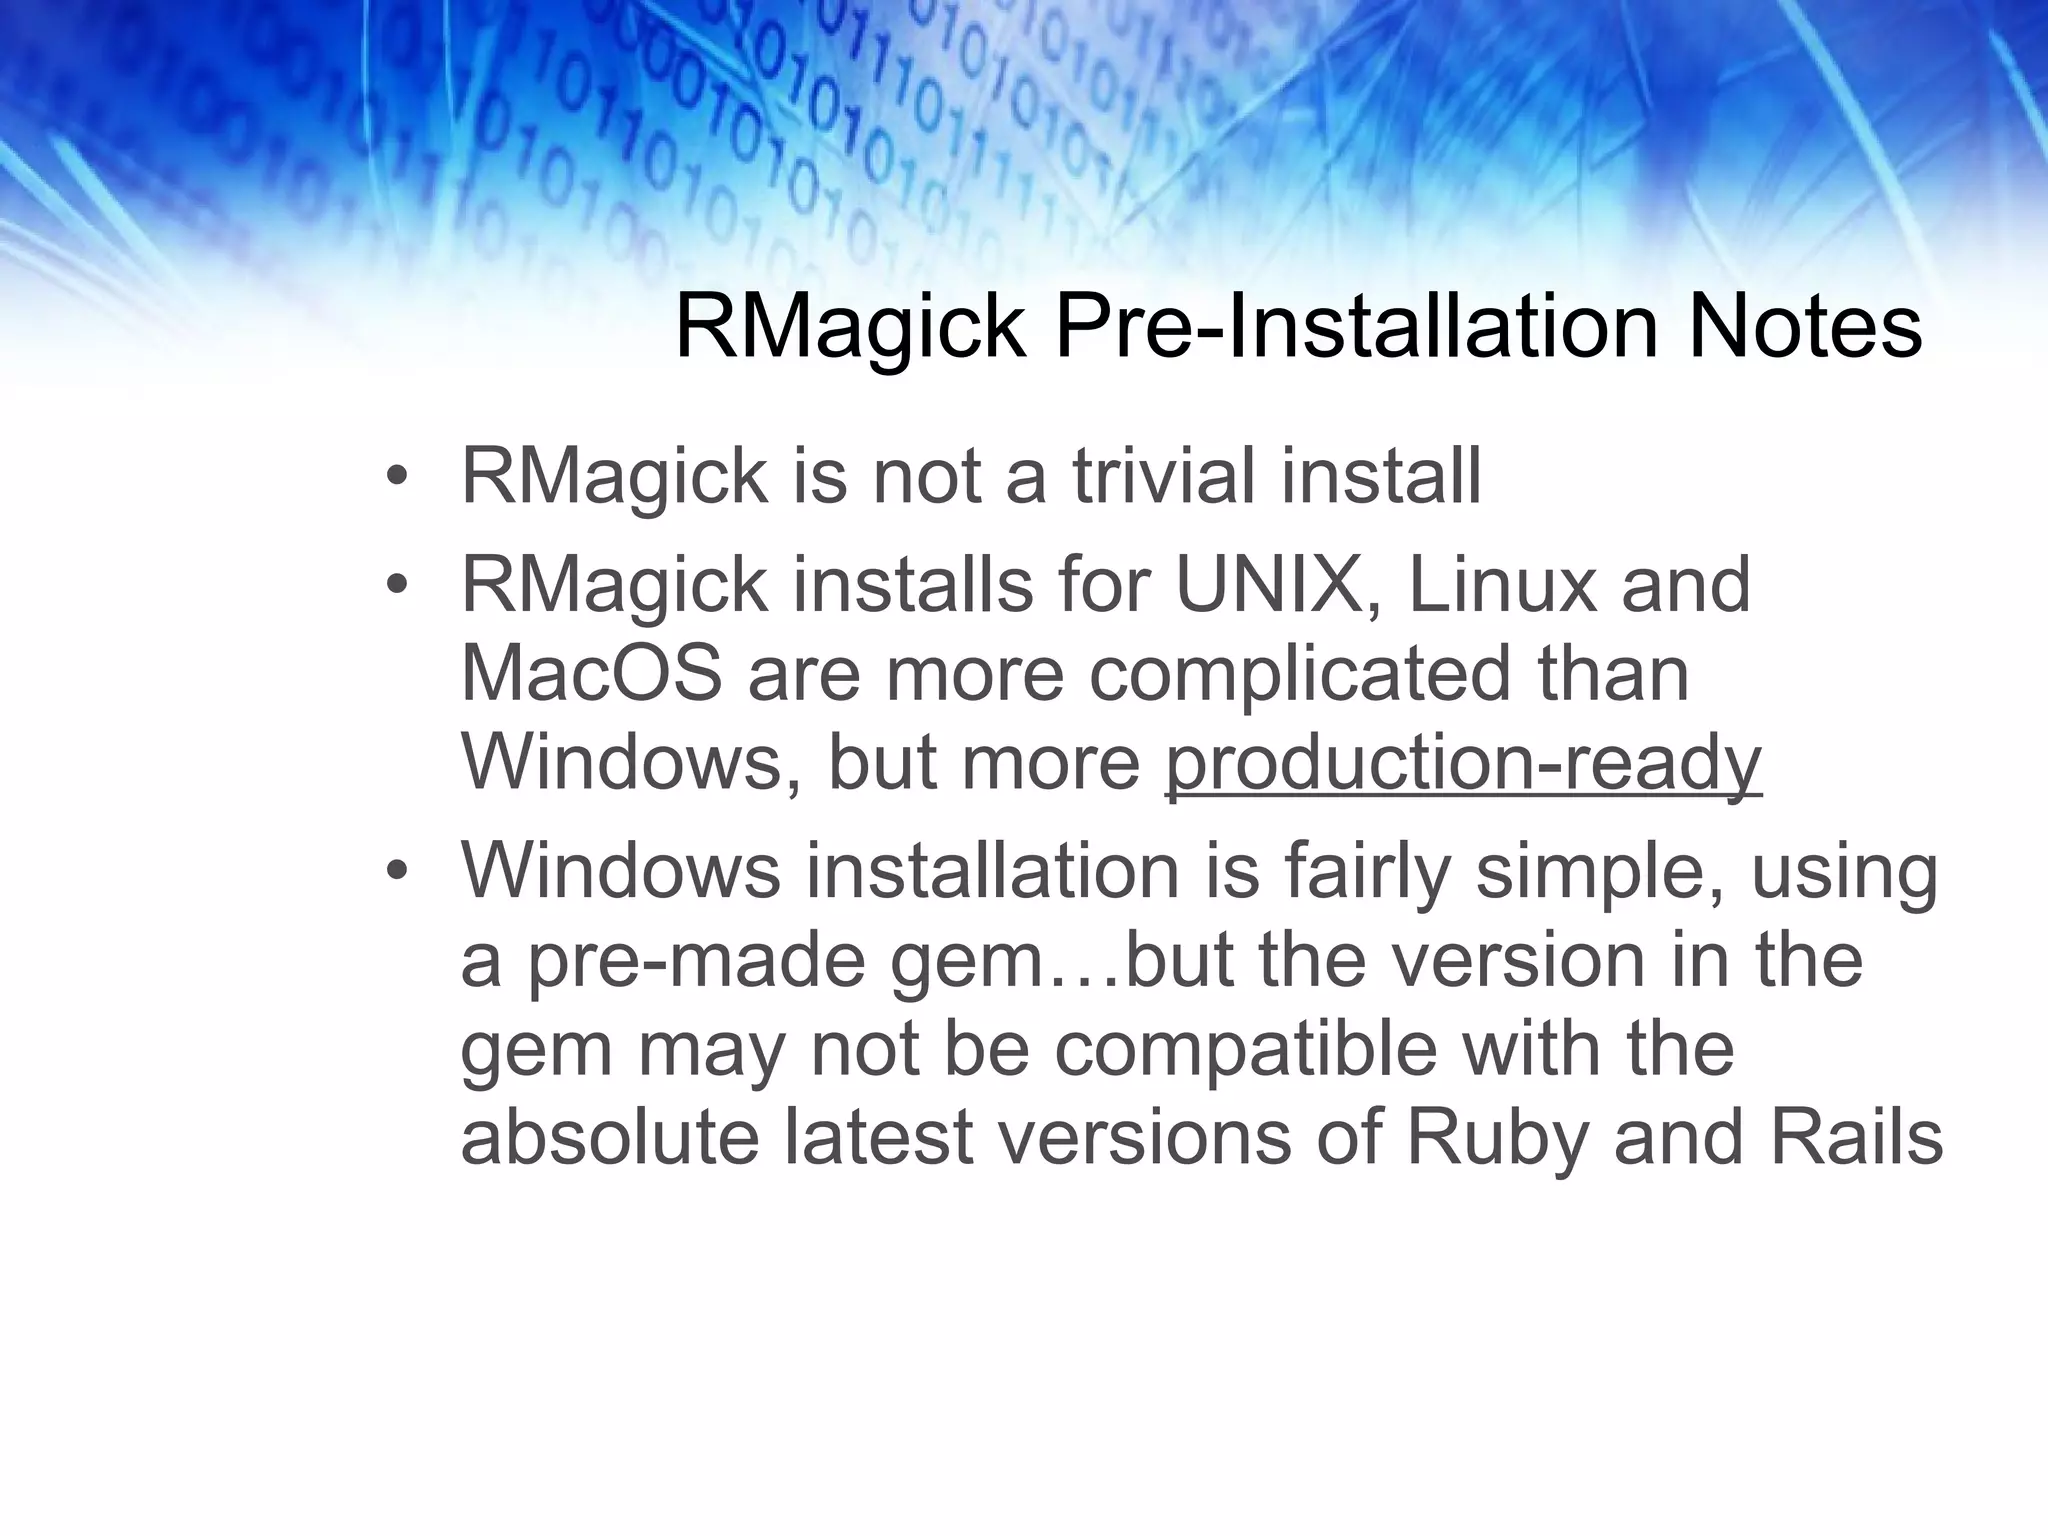
![Transformation Algorithm def self.transform(pt, ptc) npt = { :x => 0 . 0 , :y => 0 . 0 , :z => 0 . 0 } vdist = 4 . 0 d = ptc[ :z ] - pt[ :z ] if d < 0 . 0 d = 0 . 0 - d end if d < 1 npt[ :x ] = (pt[ :x ].to_f - ptc[ :x ].to_f) * 1000000 . 0 npt[ :y ] = (pt[ :y ].to_f - ptc[ :y ].to_f) * 1000000 . 0 npt[ :z ] = 1000000 . 0 else npt[ :x ] = (vdist * ((pt[ :x ].to_f * ptc[ :z ].to_f) - (ptc[ :x ].to_f * pt[ :z ].to_f))) / d npt[ :y ] = (vdist * ((pt[ :y ].to_f * ptc[ :z ].to_f) - (ptc[ :y ].to_f * pt[ :z ].to_f))) / d npt[ :z ] = pt[ :z ].to_f / d end npt # Return a hash containing X-Y-Z coordinates for the transformed point end The transform method from the StarMap Model: pt - A hash containing X-Y-Z coordinates for the point to be transformed ptc - X-Y-Z coordinates for the reference point, sometimes referred to as the center of the projection](https://image.slidesharecdn.com/railsrvgintro-091225092337-phpapp02/85/Creating-Custom-Charts-With-Ruby-Vector-Graphics-27-320.jpg)


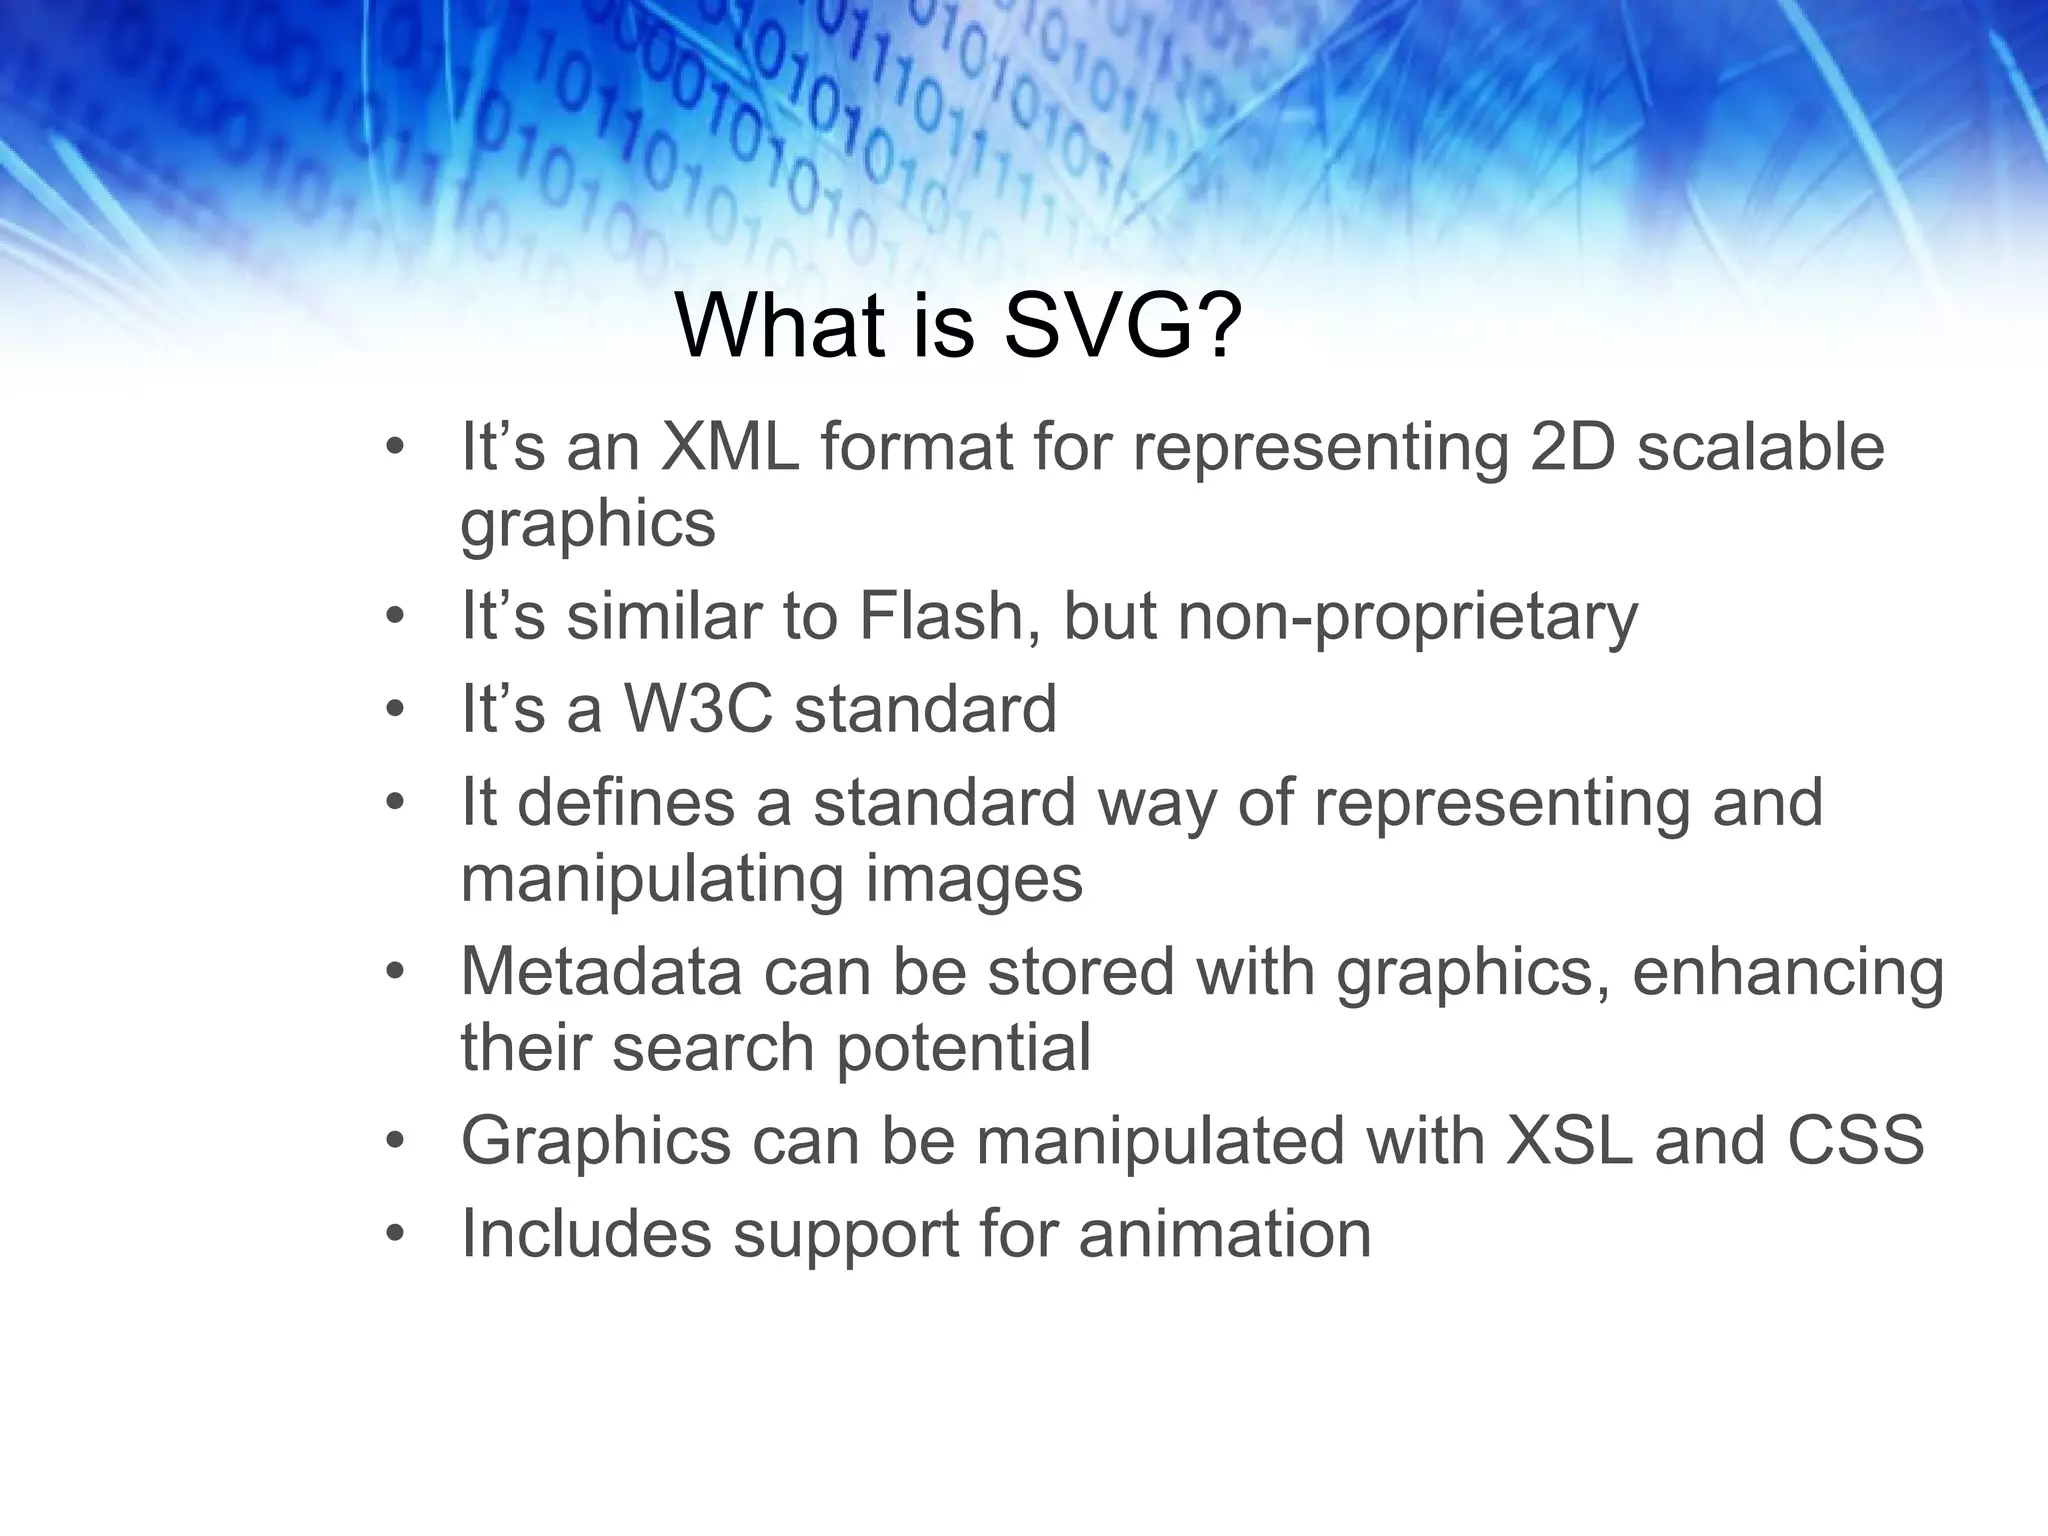

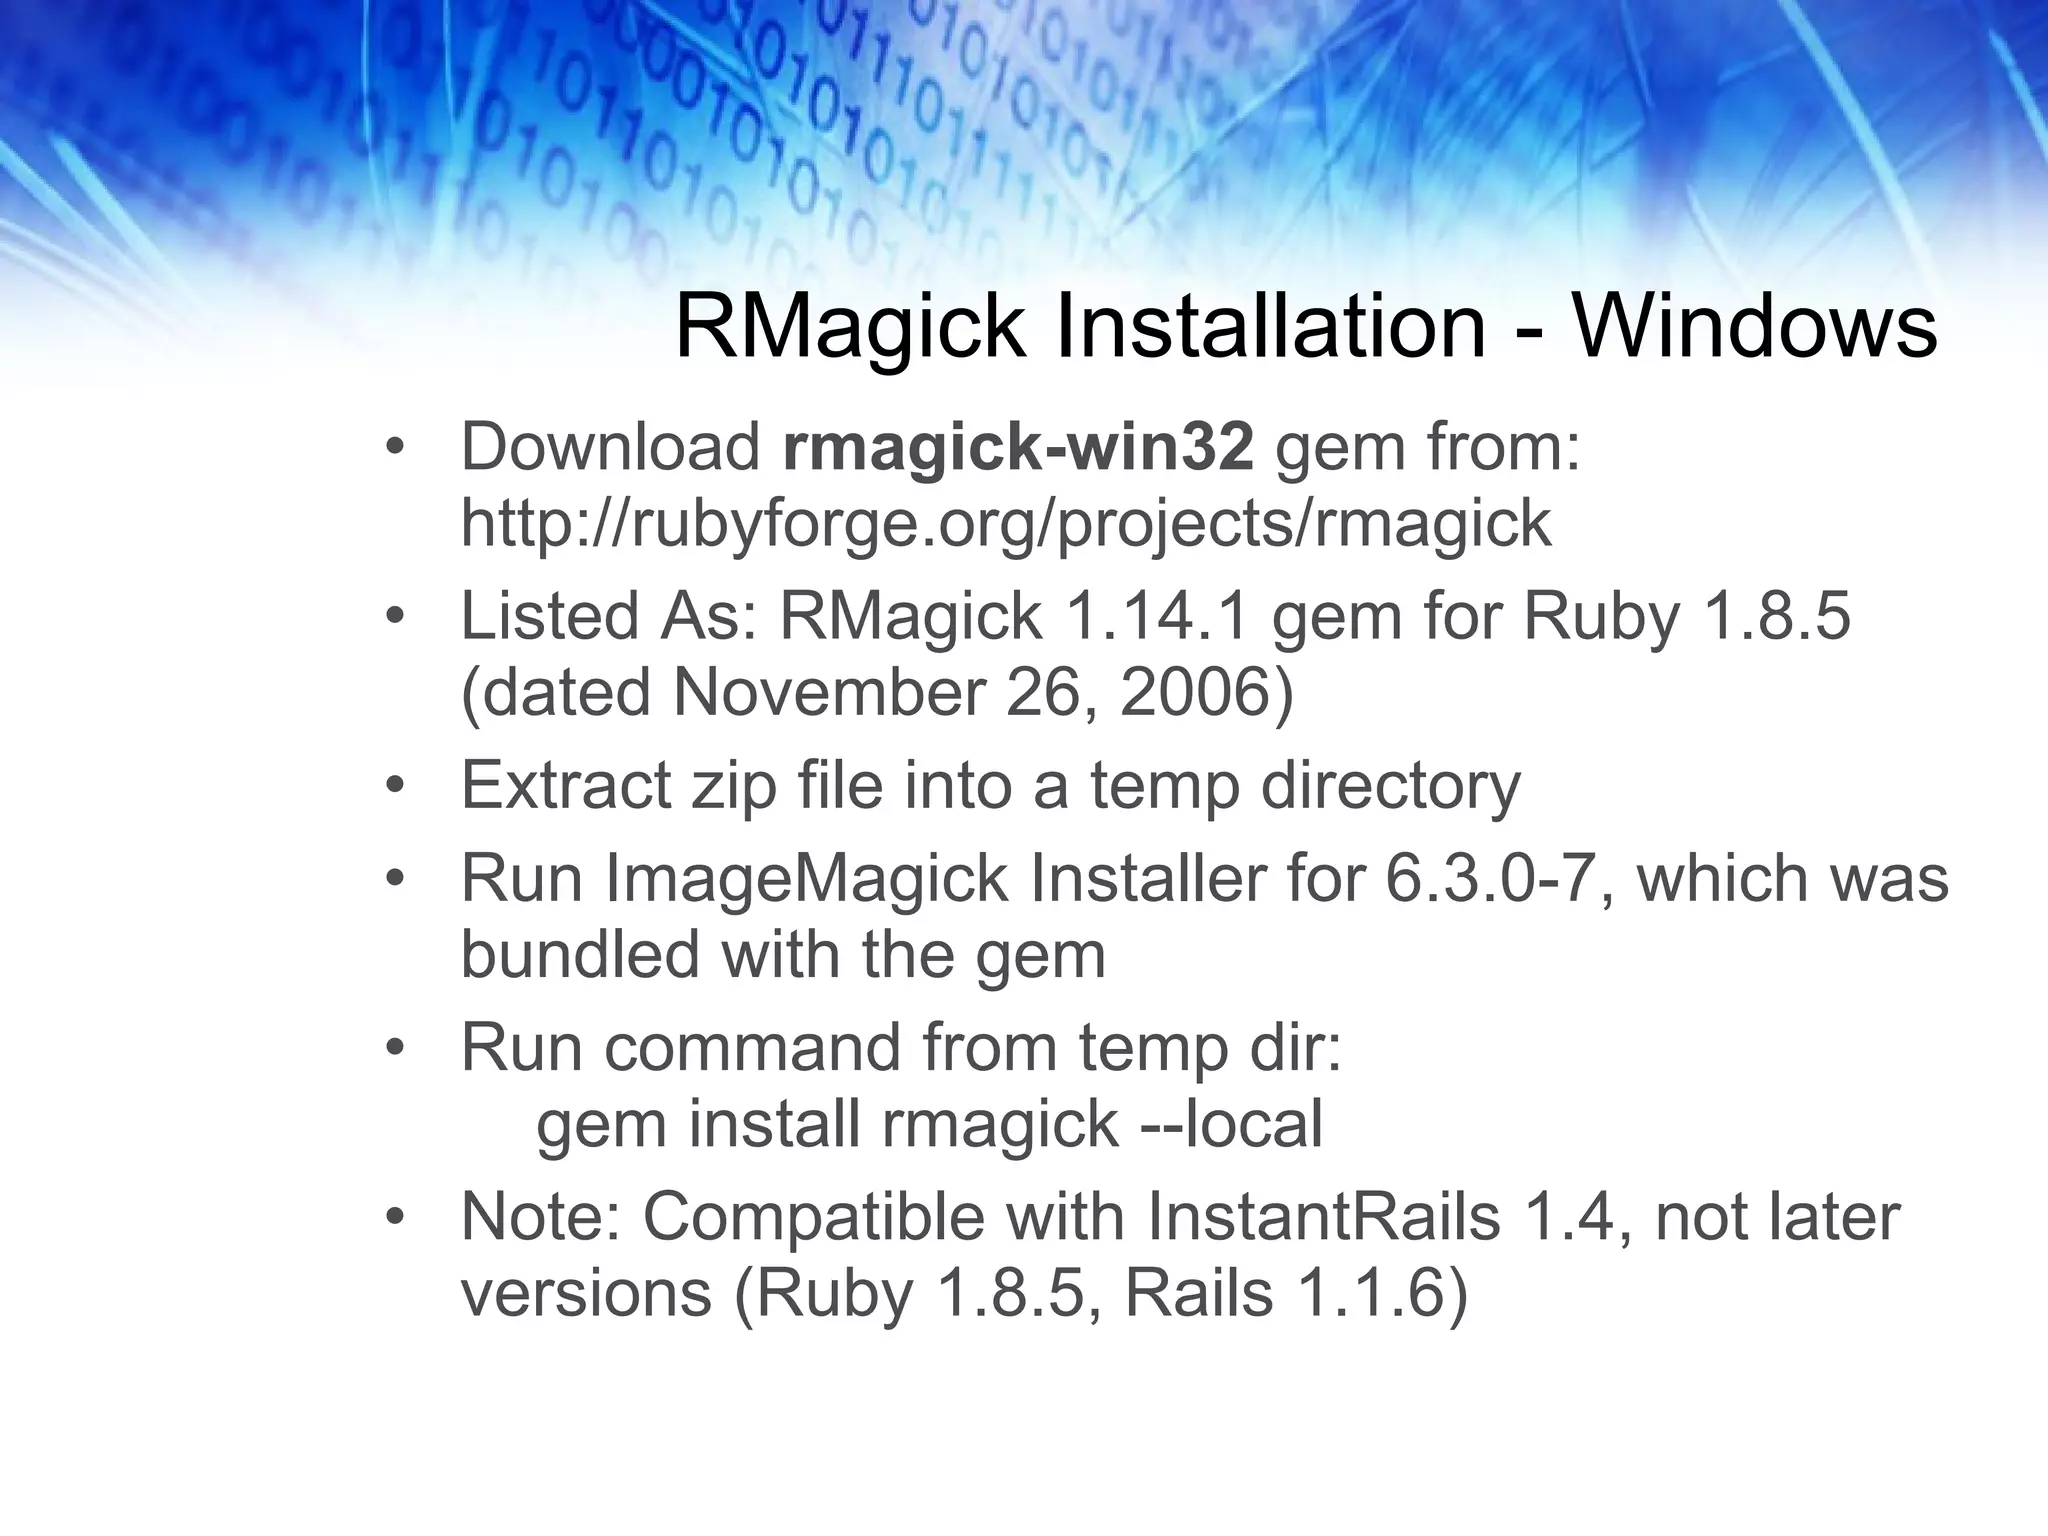


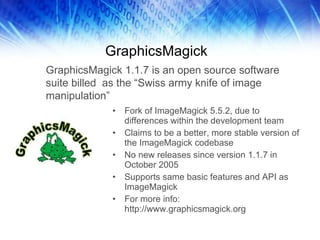
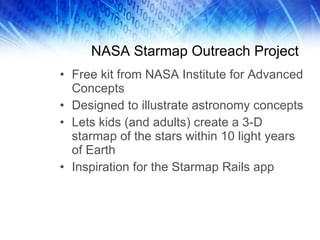
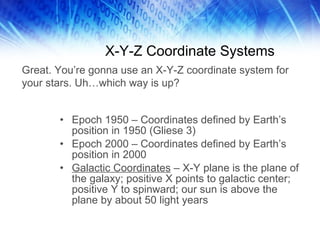
![Basic Drawing With RVG require 'rvg/rvg' include Magick class Demo def self.create_demo # Demonstrates how to draw the floor in perspective RVG::dpi = 72 ptc = { :x => 50, :y => 50, :z => -100 } # Reference Point pt1 = { :x => 0, :y => 0, :z => 0 } # Corner 1 pt2 = { :x => 100, :y => 0, :z => 0 } # Corner 2 pt3 = { :x => 100, :y => 0, :z => 100 } # Corner 3 pt4 = { :x => 0, :y => 0, :z => 100 } # Corner 4 rvg = RVG.new(7.in, 7.in).viewbox(0,0,500,500) do |canvas| canvas.background_fill = 'white‘ canvas.g.translate(450, 450).rotate(0) do |floor| floor.styles(:fill=>'lightgray', :stroke=>'silver', :stroke_width=>1) xs1 = self.transform(pt1, ptc) # Perform perspective transformations here xs2 = self.transform(pt2, ptc) xs3 = self.transform(pt3, ptc) xs4 = self.transform(pt4, ptc) floor.polygon(xs1[:x], xs1[:y], xs2[:x], xs2[:y], xs3[:x], xs3[:y], xs4[:x], xs4[:y]) end # Floor # Do more operations on the canvas… end # Canvas end rvg end](https://image.slidesharecdn.com/railsrvgintro-091225092337-phpapp02/75/Creating-Custom-Charts-With-Ruby-Vector-Graphics-25-2048.jpg)
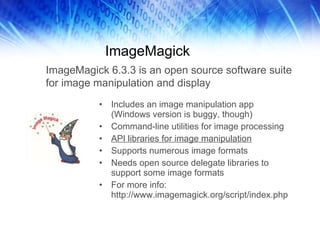
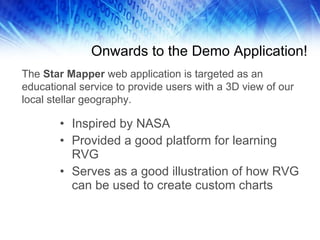
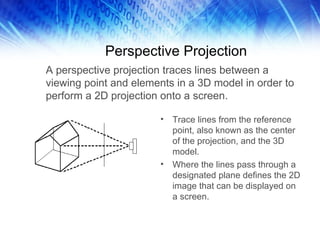
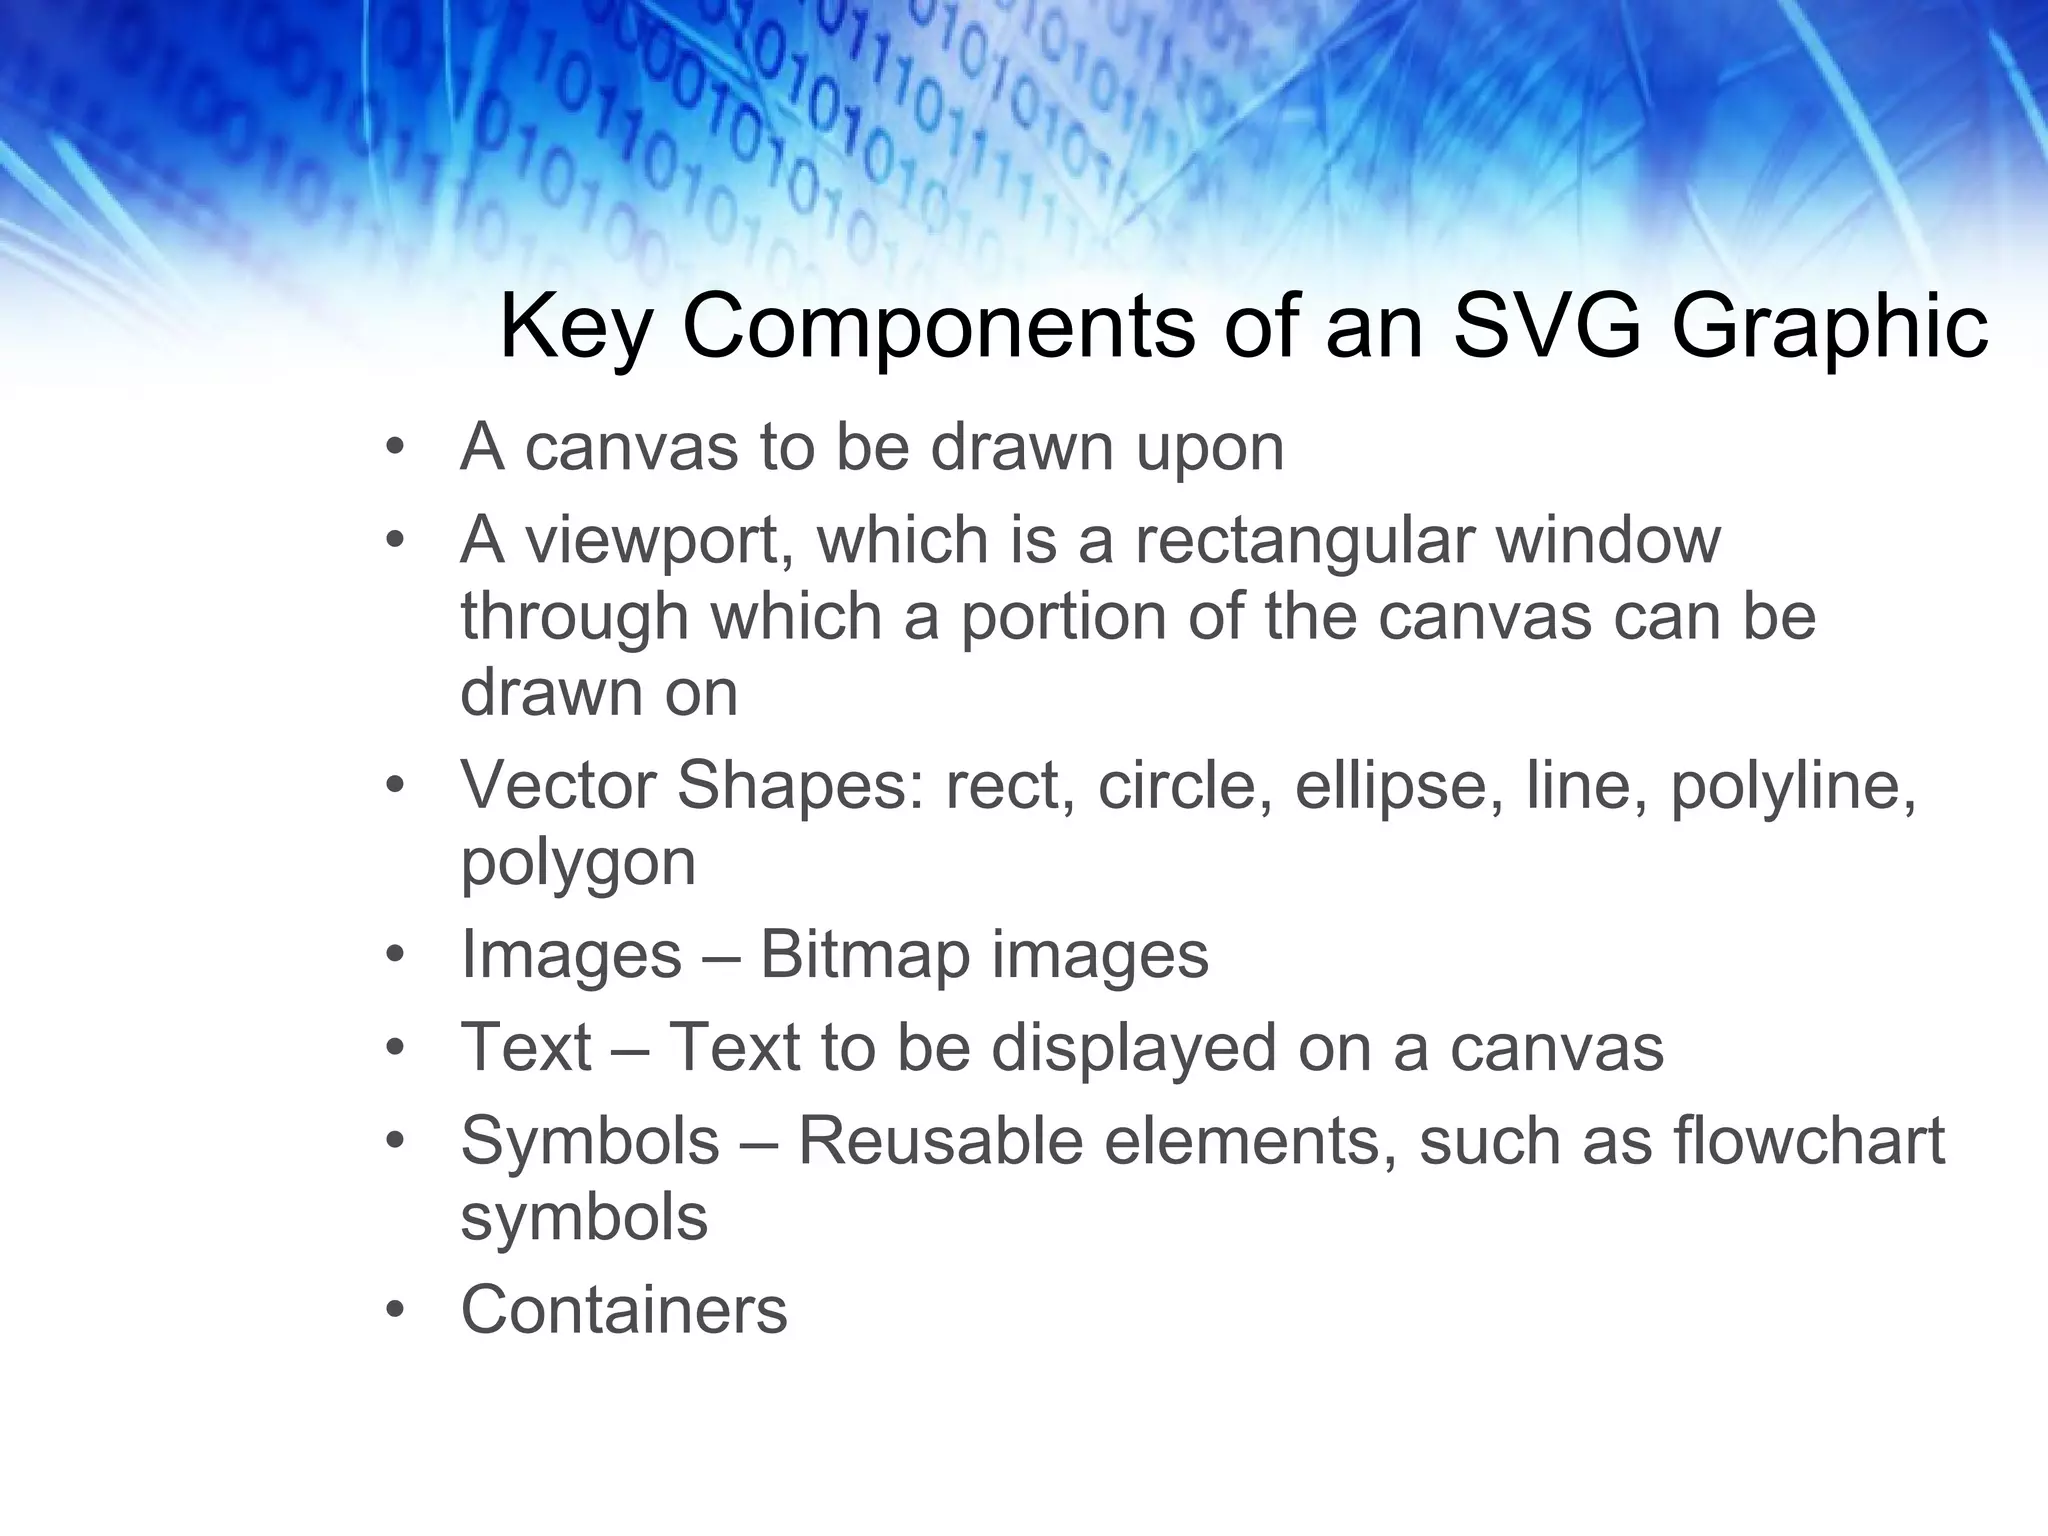
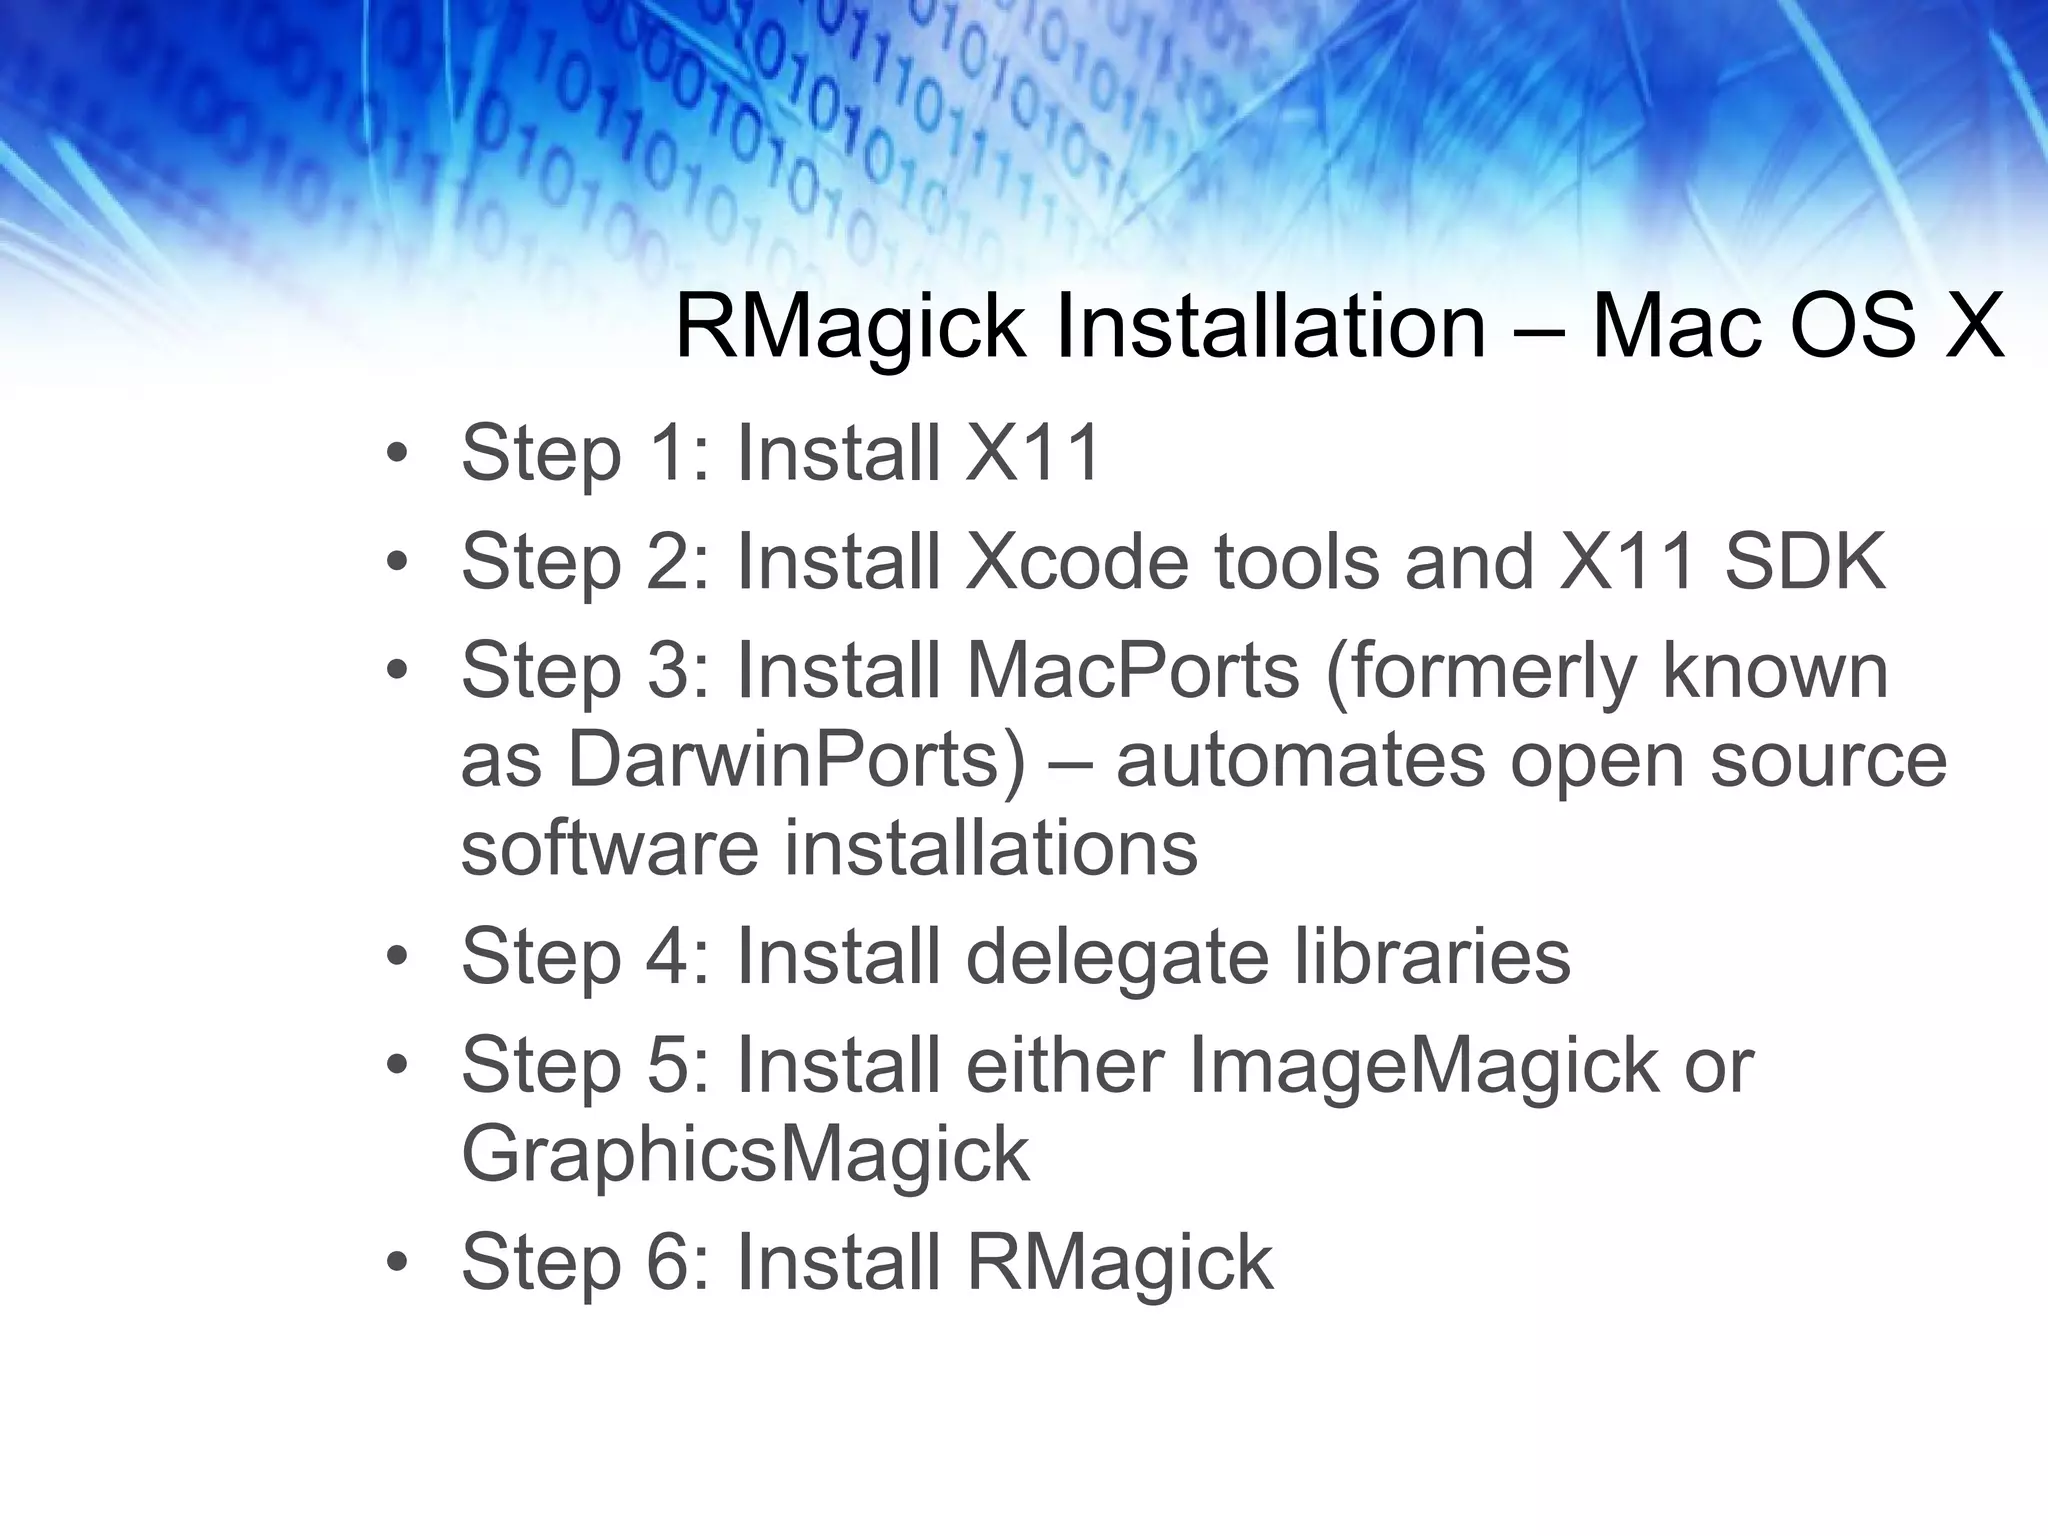
![Transformation Algorithm def self.transform(pt, ptc) npt = { :x => 0 . 0 , :y => 0 . 0 , :z => 0 . 0 } vdist = 4 . 0 d = ptc[ :z ] - pt[ :z ] if d < 0 . 0 d = 0 . 0 - d end if d < 1 npt[ :x ] = (pt[ :x ].to_f - ptc[ :x ].to_f) * 1000000 . 0 npt[ :y ] = (pt[ :y ].to_f - ptc[ :y ].to_f) * 1000000 . 0 npt[ :z ] = 1000000 . 0 else npt[ :x ] = (vdist * ((pt[ :x ].to_f * ptc[ :z ].to_f) - (ptc[ :x ].to_f * pt[ :z ].to_f))) / d npt[ :y ] = (vdist * ((pt[ :y ].to_f * ptc[ :z ].to_f) - (ptc[ :y ].to_f * pt[ :z ].to_f))) / d npt[ :z ] = pt[ :z ].to_f / d end npt # Return a hash containing X-Y-Z coordinates for the transformed point end The transform method from the StarMap Model: pt - A hash containing X-Y-Z coordinates for the point to be transformed ptc - X-Y-Z coordinates for the reference point, sometimes referred to as the center of the projection](https://image.slidesharecdn.com/railsrvgintro-091225092337-phpapp02/75/Creating-Custom-Charts-With-Ruby-Vector-Graphics-27-2048.jpg)

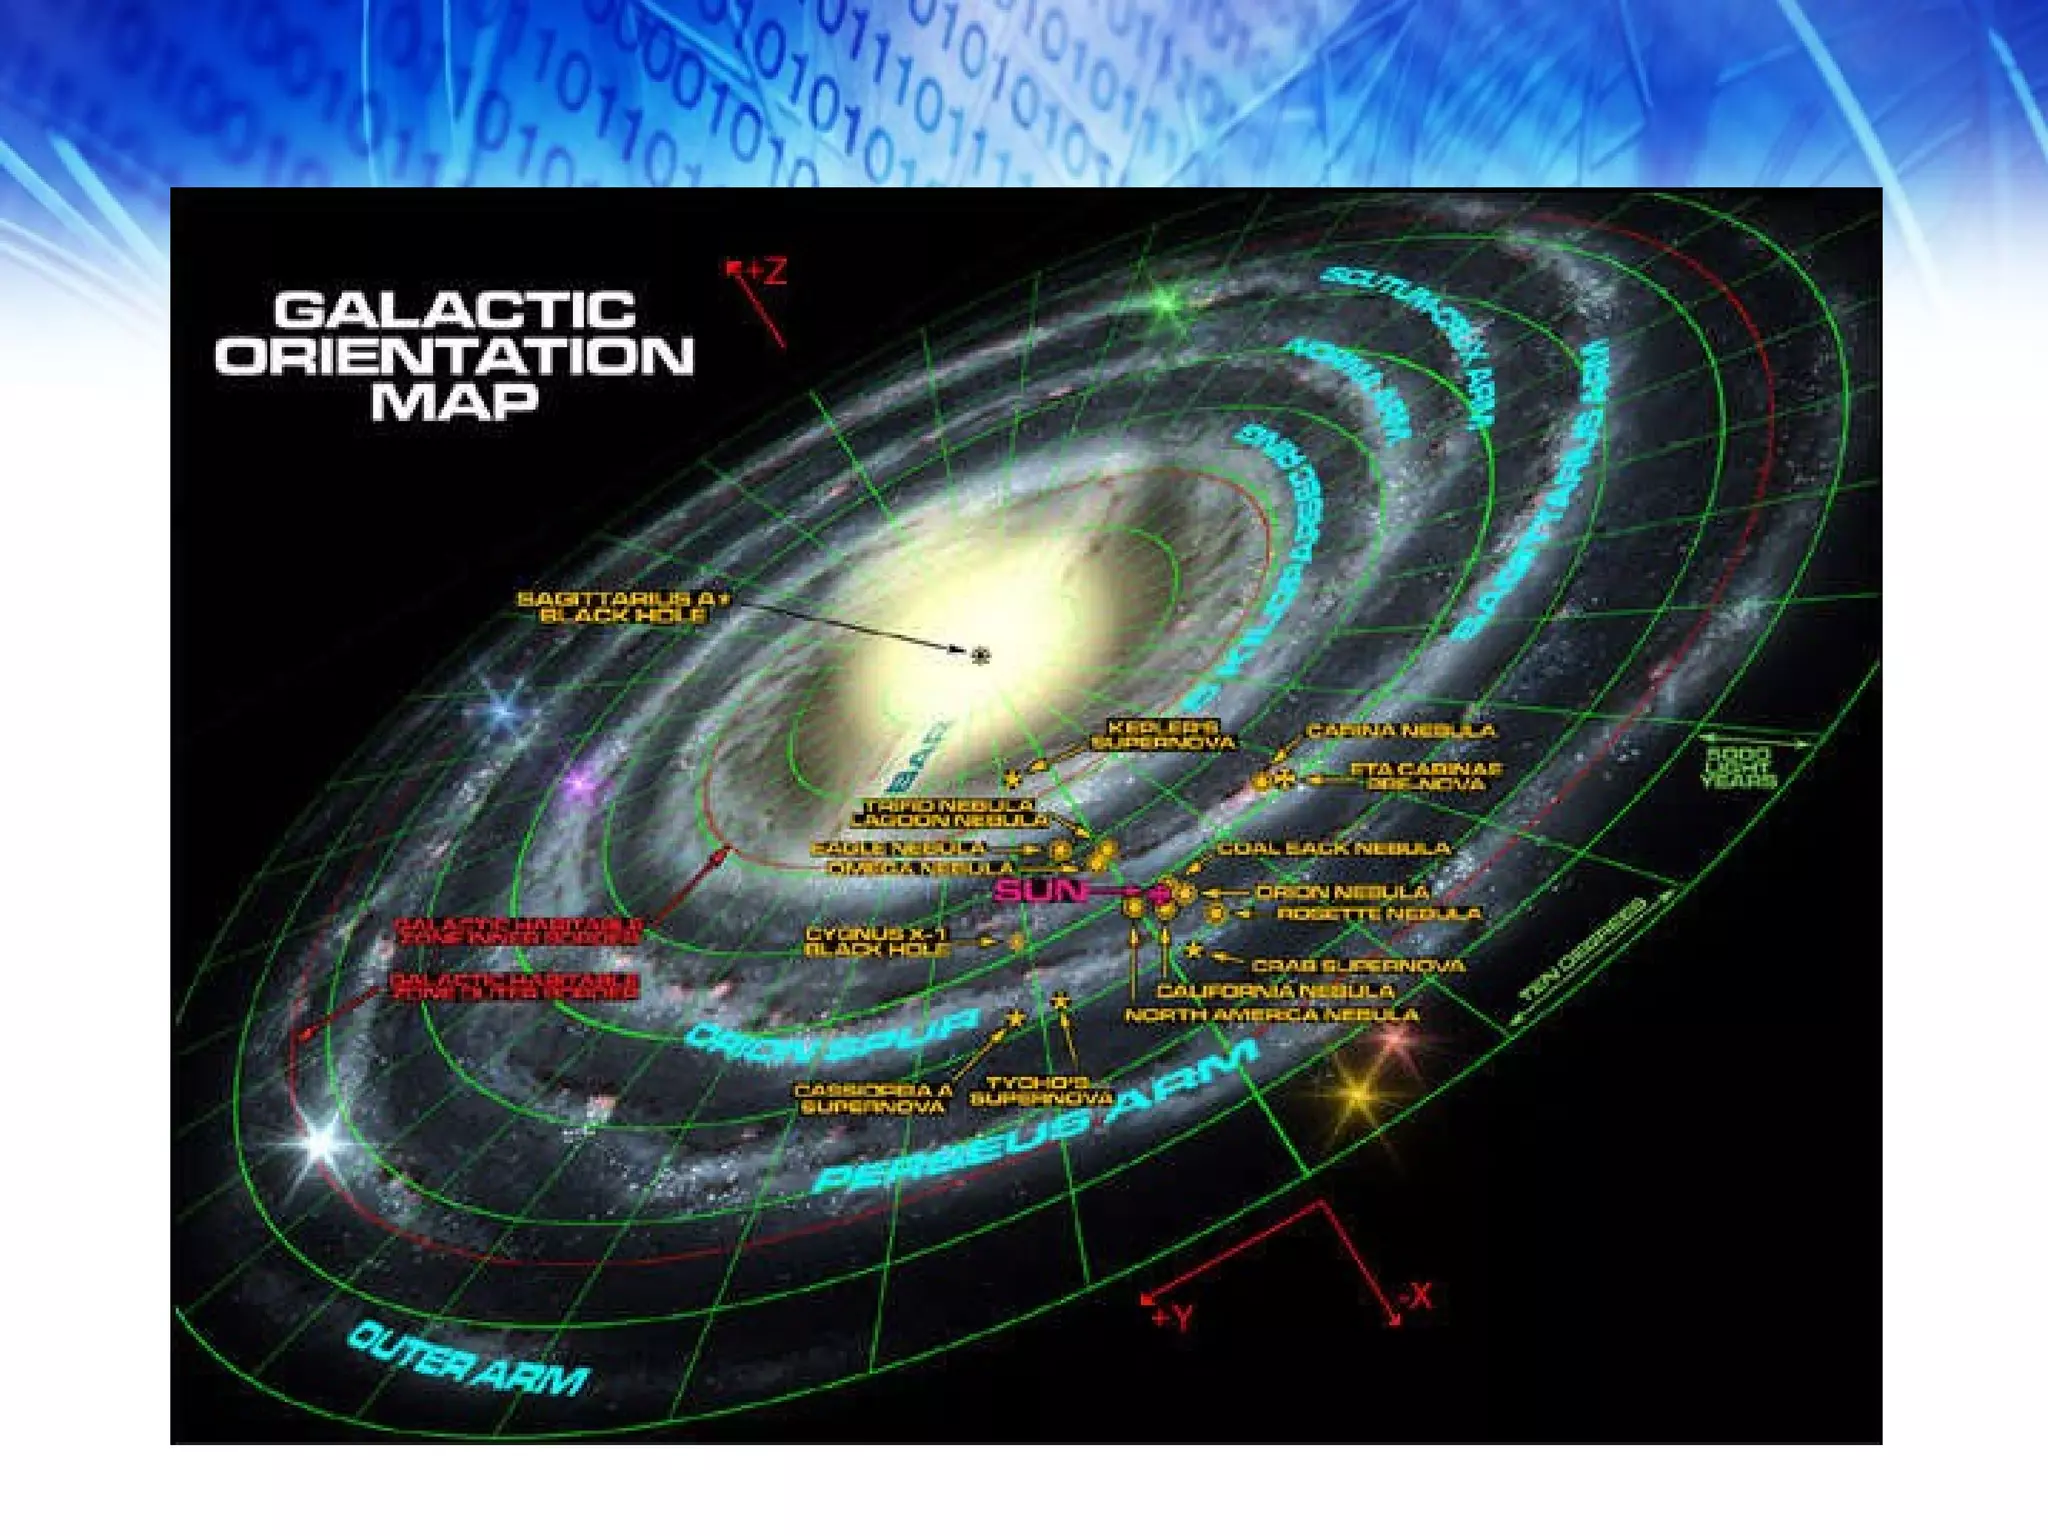
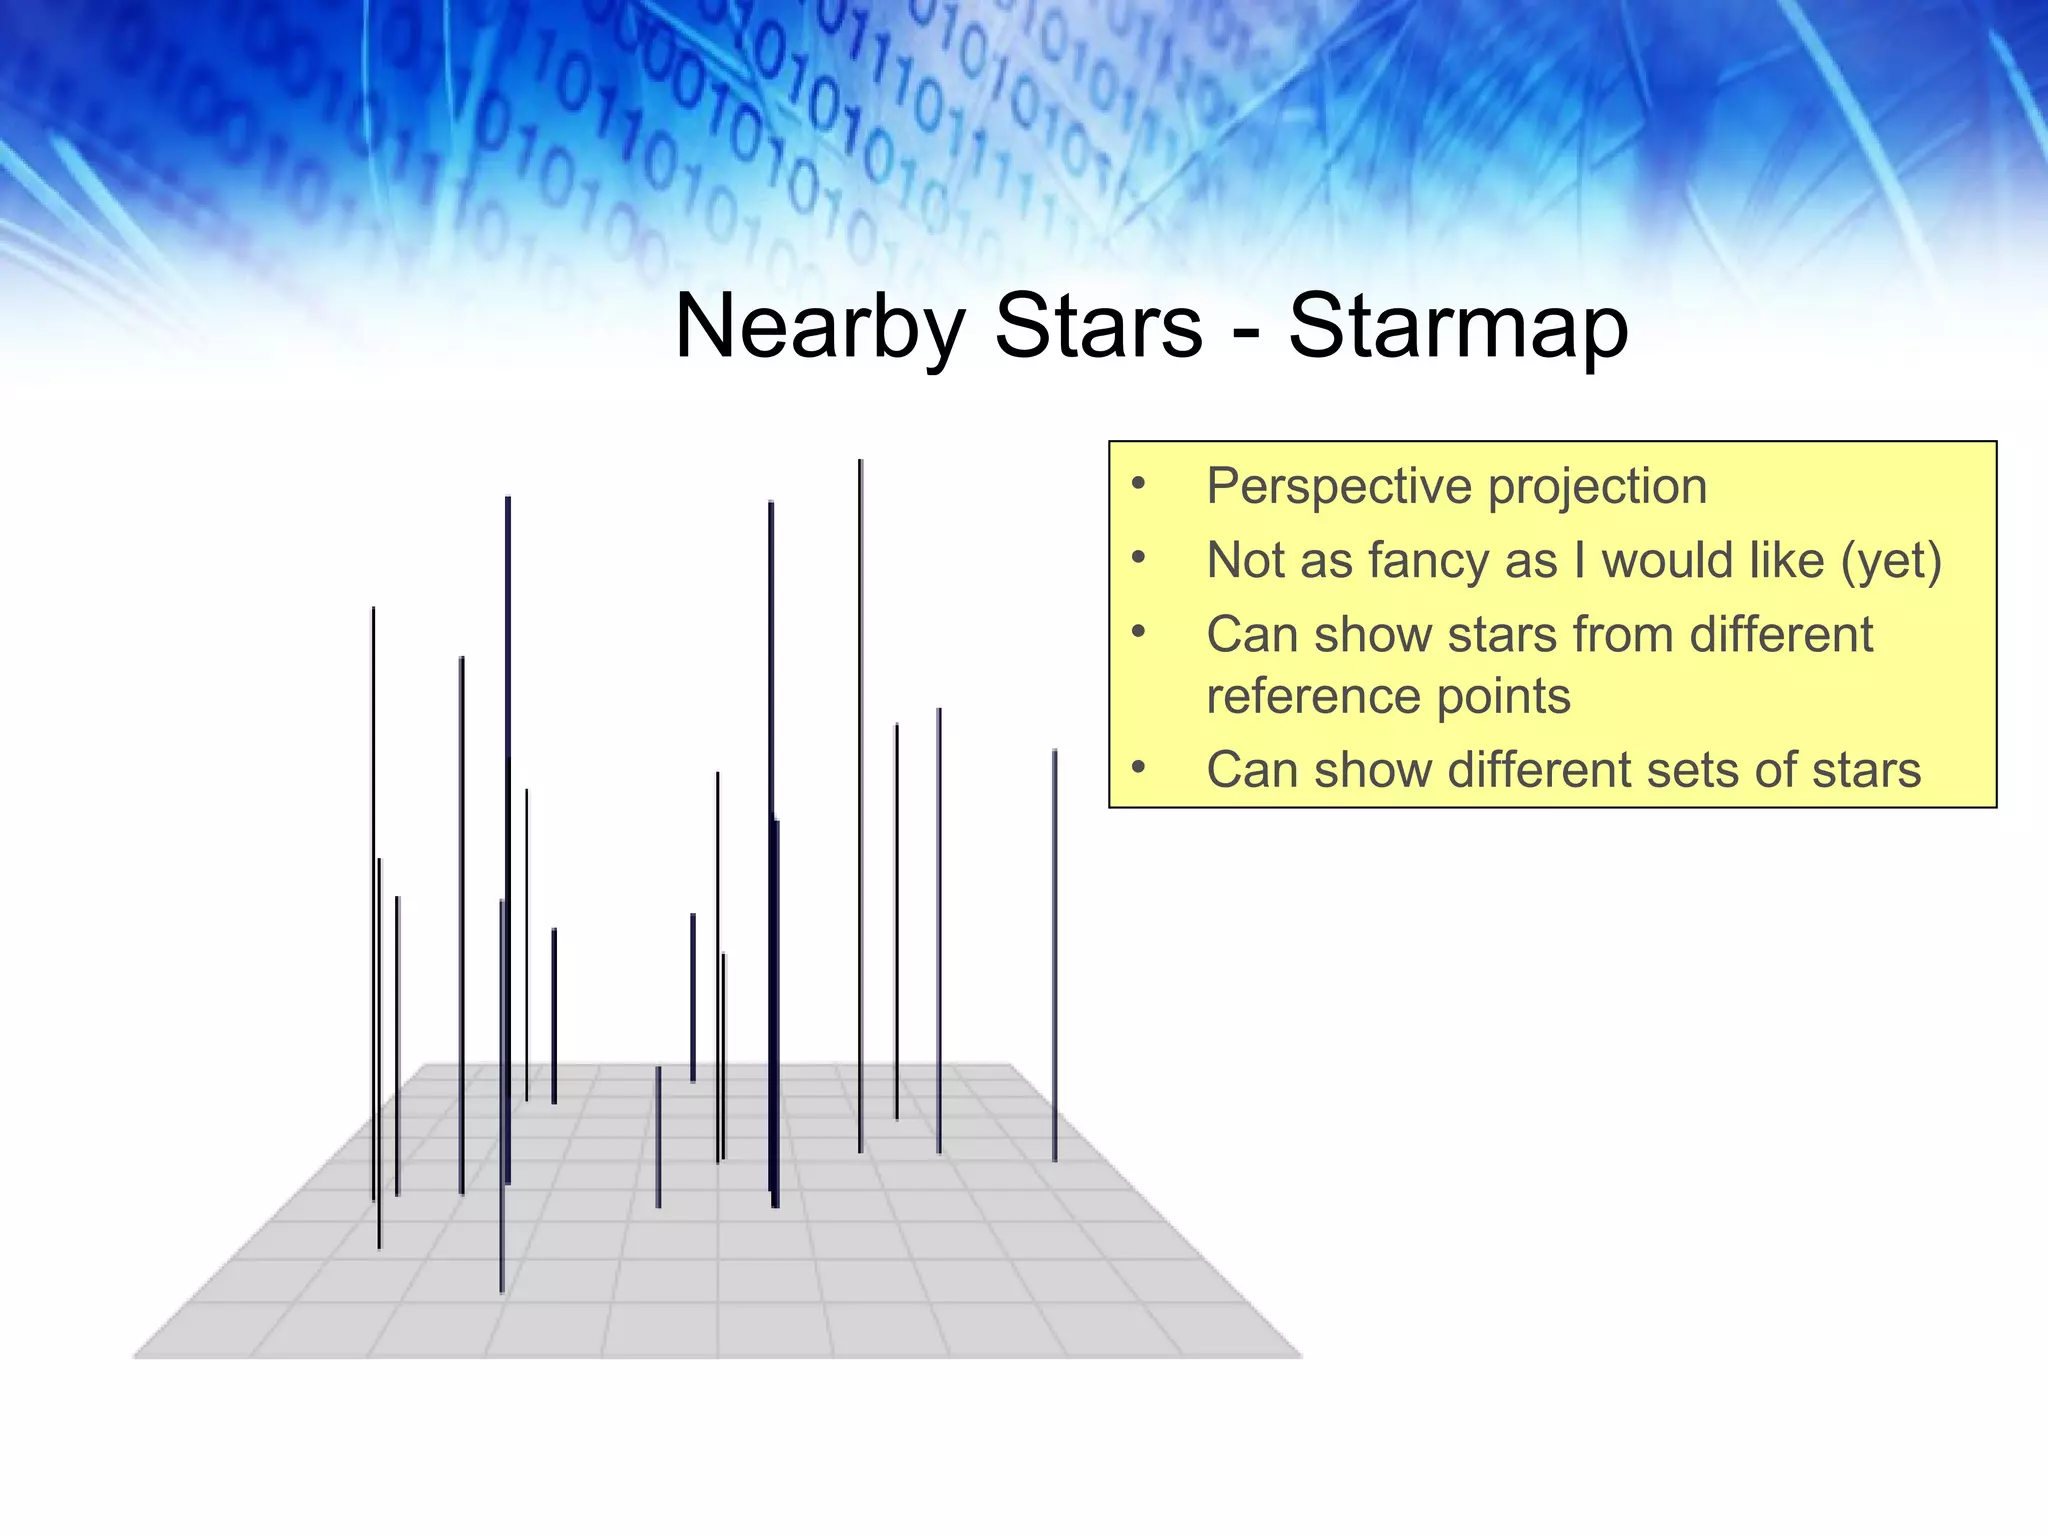
The document discusses the Ruby Vector Graphics (RVG) API, which allows the creation of custom charts and graphics in Ruby on Rails applications. It covers the relationship between RVG, RMagick, and image processing libraries like ImageMagick and GraphicsMagick, as well as the capabilities of SVG (Scalable Vector Graphics). Additionally, it introduces a demo application inspired by NASA that uses RVG for mapping stars in a 3D view to illustrate astronomy concepts.


