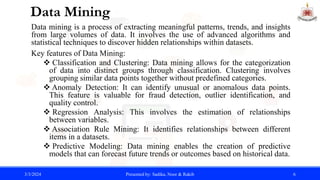
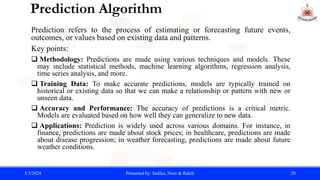
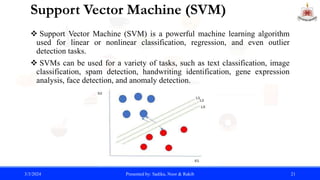
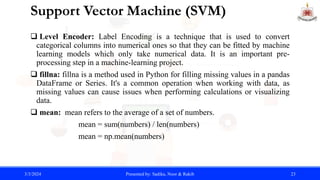
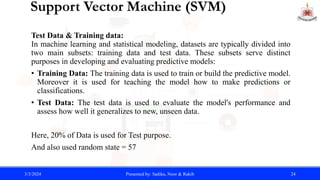
The document summarizes a student project analyzing restaurant data using Python. It includes an introduction to the project goals, dataset, data mining techniques, and machine learning algorithms used. Specifically, the project aims to collect a restaurant dataset from Kaggle, apply knowledge in data mining and machine learning using Python, and perform classification, regression, and prediction tasks. Key algorithms discussed include linear regression, covariance, standard deviation, and prediction using support vector machines.


![Binarization
• A simple technique to binarize a categorical attribute is the following: If
there are m categorical values, then uniquely assign each original value
to an integer in the interval (0, m-1)
• Here, if we split (Weight) from data set by applying some condition then
the code is:
condition1 = data['weight'] < 30
condition2 = (data['weight']>=30)&(data['weight’]<=60)
condition3 = data['weight'] > 60
data['Below_30'] = condition1.astype(int)
data['Between_30_and_60'] = condition2.astype(int)
data['Above_60'] = condition3.astype(int)
print(data)
3/3/2024 Presented by: Sadika, Noor & Rakib 9](https://image.slidesharecdn.com/project-240303015703-76af40a3/85/Data-Mining-Theory-and-Python-Project-pptx-9-320.jpg)

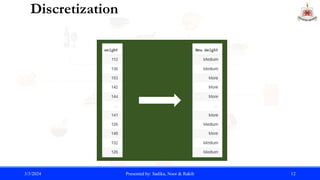
![Discretization
Discretization is typically applied to attributes that are used in classification or
association analysis. Transformation of a continuous attribute to a categorical attribute
involves two subtasks: deciding how many categories, n, to have and determining how
to map the values of the continuous attribute to these categories.
Here for, threshold = 3 We can split our (Weight) dataset into 3 specific categories.
num_bins = 3
bin_labels = ['Less', 'Medium', 'More']
data['New Weight'] = pd.cut(data['weight'],
bins=num_bins, labels=bin_labels)
print(data)
3/3/2024 Presented by: Sadika, Noor & Rakib 11](https://image.slidesharecdn.com/project-240303015703-76af40a3/85/Data-Mining-Theory-and-Python-Project-pptx-11-320.jpg)
![Euclidean Distance
The Euclidean distance is a measure of the straight-line distance between two
points in Euclidean space. It is the most commonly used distance metric in
geometry and machine learning.
Properties:
1. It is always non-negative (d≥0).
2. It is symmetric, meaning the distance from point A to point B is the same as from point B
to point A.
3. It satisfies the triangle inequality, which means the shortest distance between two points
is a straight line.
Euclidean distance, d = 𝑖=1
𝑛
(𝑥𝑖 − 𝑦𝑖 )2
point1 = data['weight']
point2 = data['height']
distance = np.linalg.norm(point1 - point2)
Euclidean distance: 2698.051
3/3/2024 Presented by: Sadika, Noor & Rakib 13](https://image.slidesharecdn.com/project-240303015703-76af40a3/85/Data-Mining-Theory-and-Python-Project-pptx-13-320.jpg)
![Minkowski Distance
The Minkowski distance is a metric used to measure the distance between two points in
a multidimensional space. It is a generalization of other distance metrics like Euclidean
distance and Manhattan distance.
Minkowski Distance, d = 𝑖=1
𝑛
|𝑥𝑖 − 𝑦𝑖 |𝑝
1
𝑝
Some properties of the Minkowski distance:
1. When p=1, it is called the Manhattan distance or L1 norm.
2. When p=2, it is called the Euclidean distance or L2 norm.
3. If p approaches infinity, the Minkowski distance approaches the Chebyshev
distance
point1 = data['weight']
point2 = data['height’]
p = 2
Distance = np.power(np.sum(np.abs(point1 - point2) ** p), 1/p)
Minkowski distance (p=2): 2698.0517
3/3/2024 Presented by: Sadika, Noor & Rakib 14](https://image.slidesharecdn.com/project-240303015703-76af40a3/85/Data-Mining-Theory-and-Python-Project-pptx-14-320.jpg)

![Linear Regression
• model = LinearRegression()
• model.fit(X, Y)
• slope = model.coef_[0]
• intercept = model.intercept_
Slope (Coefficient): 2.889
Intercept: -68.252
3/3/2024 Presented by: Sadika, Noor & Rakib 17](https://image.slidesharecdn.com/project-240303015703-76af40a3/85/Data-Mining-Theory-and-Python-Project-pptx-17-320.jpg)
![Covariance
Covariance is a measure of the relationship between two random variables
and to what extent, they change together. It defines the changes between
the two variables, such that change in one variable is equal to change in
another variable.
X = data['weight']
Y = data['height’]
mean_X = np.mean(X)
mean_Y = np.mean(Y)
covariance = np.sum((X - mean_X) * (Y - mean_Y)) / (len(X) - 1)
Covariance of Height and Weight: 11.17
3/3/2024 Presented by: Sadika, Noor & Rakib 18
Sample covariance Formula:
Cov(x,y) =](https://image.slidesharecdn.com/project-240303015703-76af40a3/85/Data-Mining-Theory-and-Python-Project-pptx-18-320.jpg)
![Standard Deviation
Standard deviation is a statistical measure that quantifies the amount
of variation or dispersion in a set of data points. It provides a way to
understand how spread out the values in a dataset are around the
mean.
Standard Deviation, σ = 𝑖=1
𝑛 𝑥𝑖−𝑥 2
2
X = data['height’]
Y = data[‘Weight’]
mean_X = np.mean(X)
std_dev_X = np.sqrt(np.mean((X - mean_X)**2))
Standard Deviation of Height: 1.97
Standard Deviation of Weight: 11.50
3/3/2024 Presented by: Sadika, Noor & Rakib 19](https://image.slidesharecdn.com/project-240303015703-76af40a3/85/Data-Mining-Theory-and-Python-Project-pptx-19-320.jpg)


![Binarization
• A simple technique to binarize a categorical attribute is the following: If
there are m categorical values, then uniquely assign each original value
to an integer in the interval (0, m-1)
• Here, if we split (Weight) from data set by applying some condition then
the code is:
condition1 = data['weight'] < 30
condition2 = (data['weight']>=30)&(data['weight’]<=60)
condition3 = data['weight'] > 60
data['Below_30'] = condition1.astype(int)
data['Between_30_and_60'] = condition2.astype(int)
data['Above_60'] = condition3.astype(int)
print(data)
3/3/2024 Presented by: Sadika, Noor & Rakib 9](https://image.slidesharecdn.com/project-240303015703-76af40a3/75/Data-Mining-Theory-and-Python-Project-pptx-9-2048.jpg)

![Discretization
Discretization is typically applied to attributes that are used in classification or
association analysis. Transformation of a continuous attribute to a categorical attribute
involves two subtasks: deciding how many categories, n, to have and determining how
to map the values of the continuous attribute to these categories.
Here for, threshold = 3 We can split our (Weight) dataset into 3 specific categories.
num_bins = 3
bin_labels = ['Less', 'Medium', 'More']
data['New Weight'] = pd.cut(data['weight'],
bins=num_bins, labels=bin_labels)
print(data)
3/3/2024 Presented by: Sadika, Noor & Rakib 11](https://image.slidesharecdn.com/project-240303015703-76af40a3/75/Data-Mining-Theory-and-Python-Project-pptx-11-2048.jpg)

![Euclidean Distance
The Euclidean distance is a measure of the straight-line distance between two
points in Euclidean space. It is the most commonly used distance metric in
geometry and machine learning.
Properties:
1. It is always non-negative (d≥0).
2. It is symmetric, meaning the distance from point A to point B is the same as from point B
to point A.
3. It satisfies the triangle inequality, which means the shortest distance between two points
is a straight line.
Euclidean distance, d = 𝑖=1
𝑛
(𝑥𝑖 − 𝑦𝑖 )2
point1 = data['weight']
point2 = data['height']
distance = np.linalg.norm(point1 - point2)
Euclidean distance: 2698.051
3/3/2024 Presented by: Sadika, Noor & Rakib 13](https://image.slidesharecdn.com/project-240303015703-76af40a3/75/Data-Mining-Theory-and-Python-Project-pptx-13-2048.jpg)
![Minkowski Distance
The Minkowski distance is a metric used to measure the distance between two points in
a multidimensional space. It is a generalization of other distance metrics like Euclidean
distance and Manhattan distance.
Minkowski Distance, d = 𝑖=1
𝑛
|𝑥𝑖 − 𝑦𝑖 |𝑝
1
𝑝
Some properties of the Minkowski distance:
1. When p=1, it is called the Manhattan distance or L1 norm.
2. When p=2, it is called the Euclidean distance or L2 norm.
3. If p approaches infinity, the Minkowski distance approaches the Chebyshev
distance
point1 = data['weight']
point2 = data['height’]
p = 2
Distance = np.power(np.sum(np.abs(point1 - point2) ** p), 1/p)
Minkowski distance (p=2): 2698.0517
3/3/2024 Presented by: Sadika, Noor & Rakib 14](https://image.slidesharecdn.com/project-240303015703-76af40a3/75/Data-Mining-Theory-and-Python-Project-pptx-14-2048.jpg)
![Linear Regression
• model = LinearRegression()
• model.fit(X, Y)
• slope = model.coef_[0]
• intercept = model.intercept_
Slope (Coefficient): 2.889
Intercept: -68.252
3/3/2024 Presented by: Sadika, Noor & Rakib 17](https://image.slidesharecdn.com/project-240303015703-76af40a3/75/Data-Mining-Theory-and-Python-Project-pptx-17-2048.jpg)
![Covariance
Covariance is a measure of the relationship between two random variables
and to what extent, they change together. It defines the changes between
the two variables, such that change in one variable is equal to change in
another variable.
X = data['weight']
Y = data['height’]
mean_X = np.mean(X)
mean_Y = np.mean(Y)
covariance = np.sum((X - mean_X) * (Y - mean_Y)) / (len(X) - 1)
Covariance of Height and Weight: 11.17
3/3/2024 Presented by: Sadika, Noor & Rakib 18
Sample covariance Formula:
Cov(x,y) =](https://image.slidesharecdn.com/project-240303015703-76af40a3/75/Data-Mining-Theory-and-Python-Project-pptx-18-2048.jpg)
![Standard Deviation
Standard deviation is a statistical measure that quantifies the amount
of variation or dispersion in a set of data points. It provides a way to
understand how spread out the values in a dataset are around the
mean.
Standard Deviation, σ = 𝑖=1
𝑛 𝑥𝑖−𝑥 2
2
X = data['height’]
Y = data[‘Weight’]
mean_X = np.mean(X)
std_dev_X = np.sqrt(np.mean((X - mean_X)**2))
Standard Deviation of Height: 1.97
Standard Deviation of Weight: 11.50
3/3/2024 Presented by: Sadika, Noor & Rakib 19](https://image.slidesharecdn.com/project-240303015703-76af40a3/75/Data-Mining-Theory-and-Python-Project-pptx-19-2048.jpg)