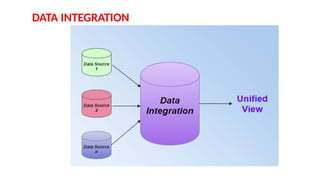
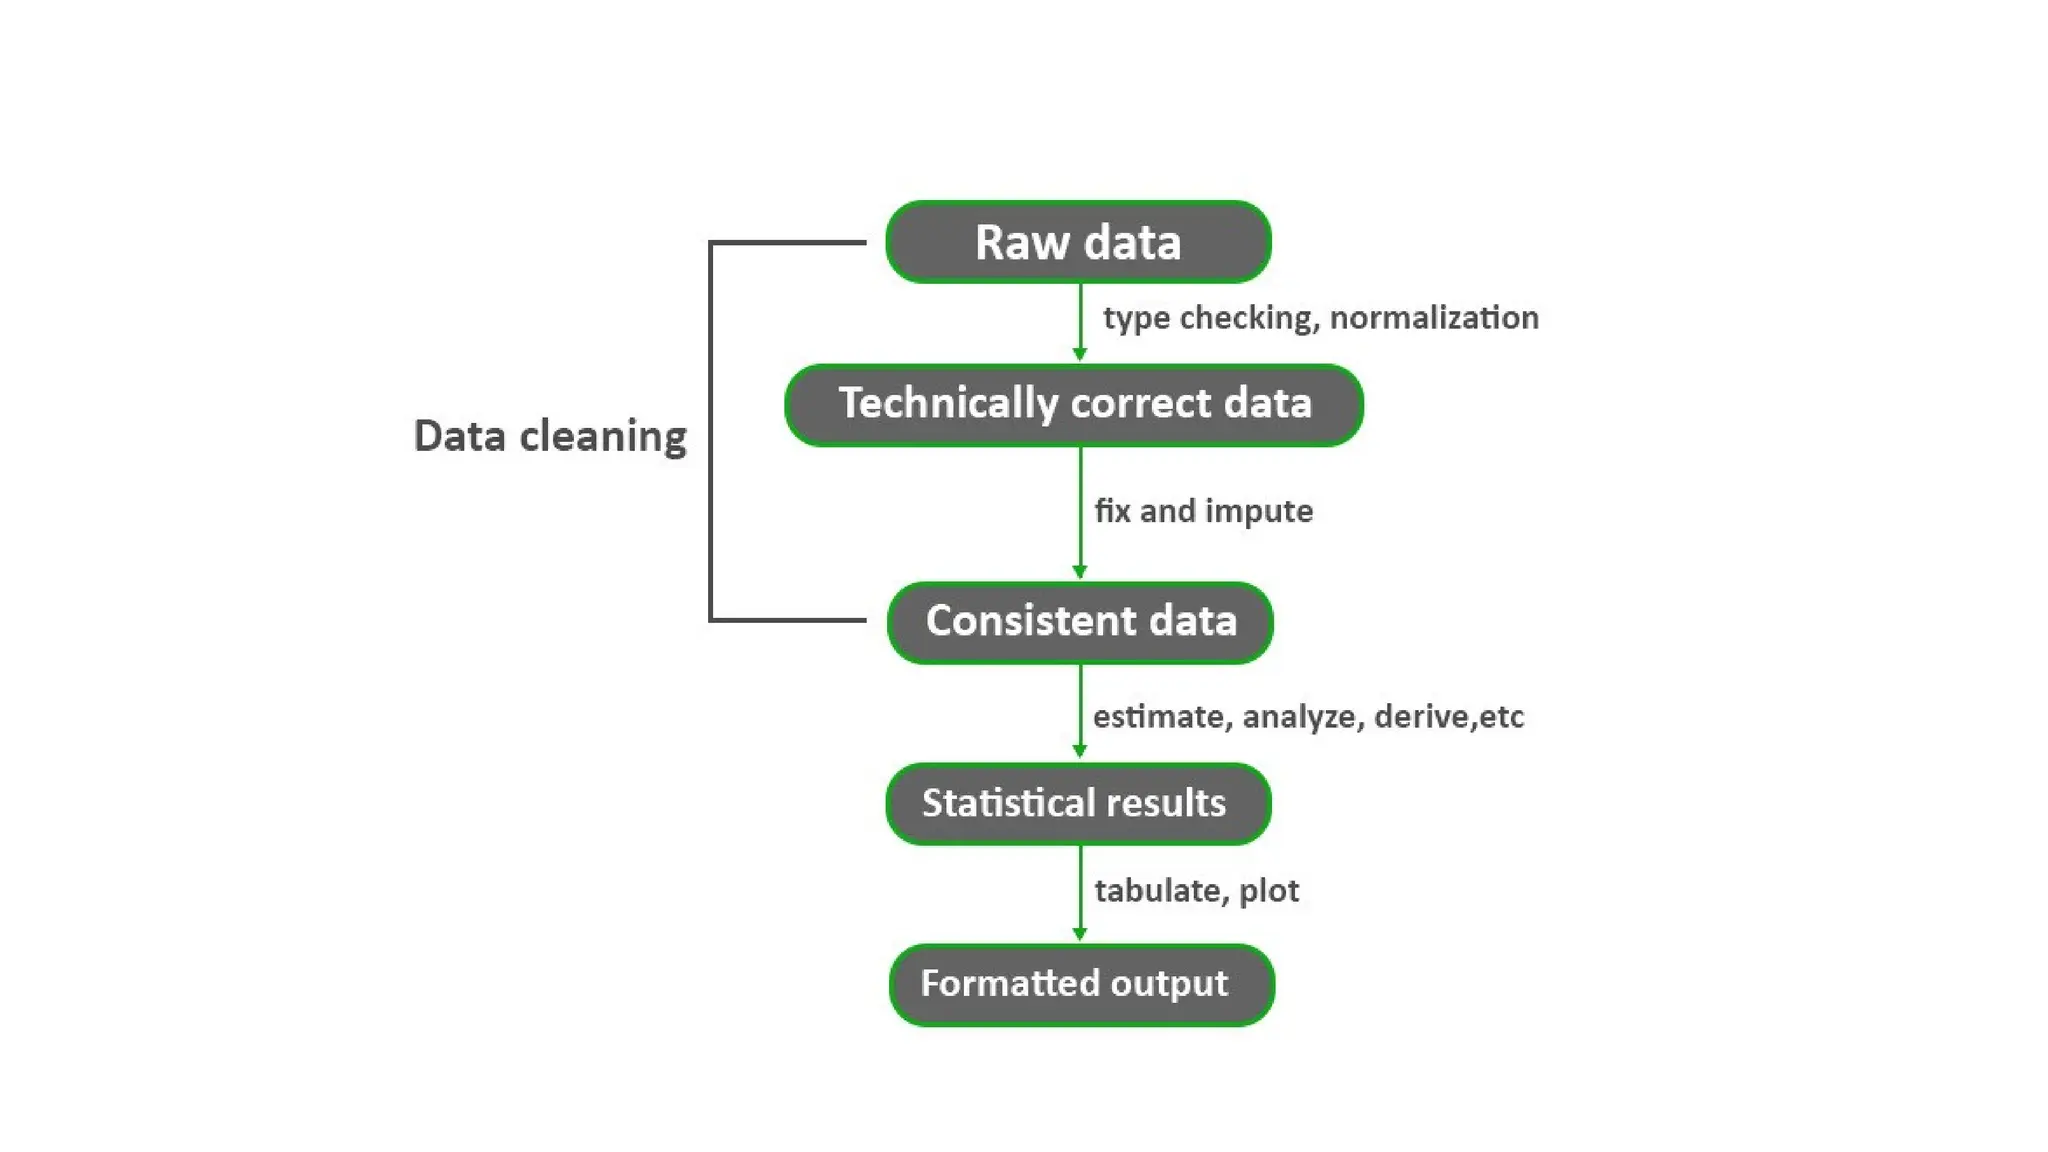
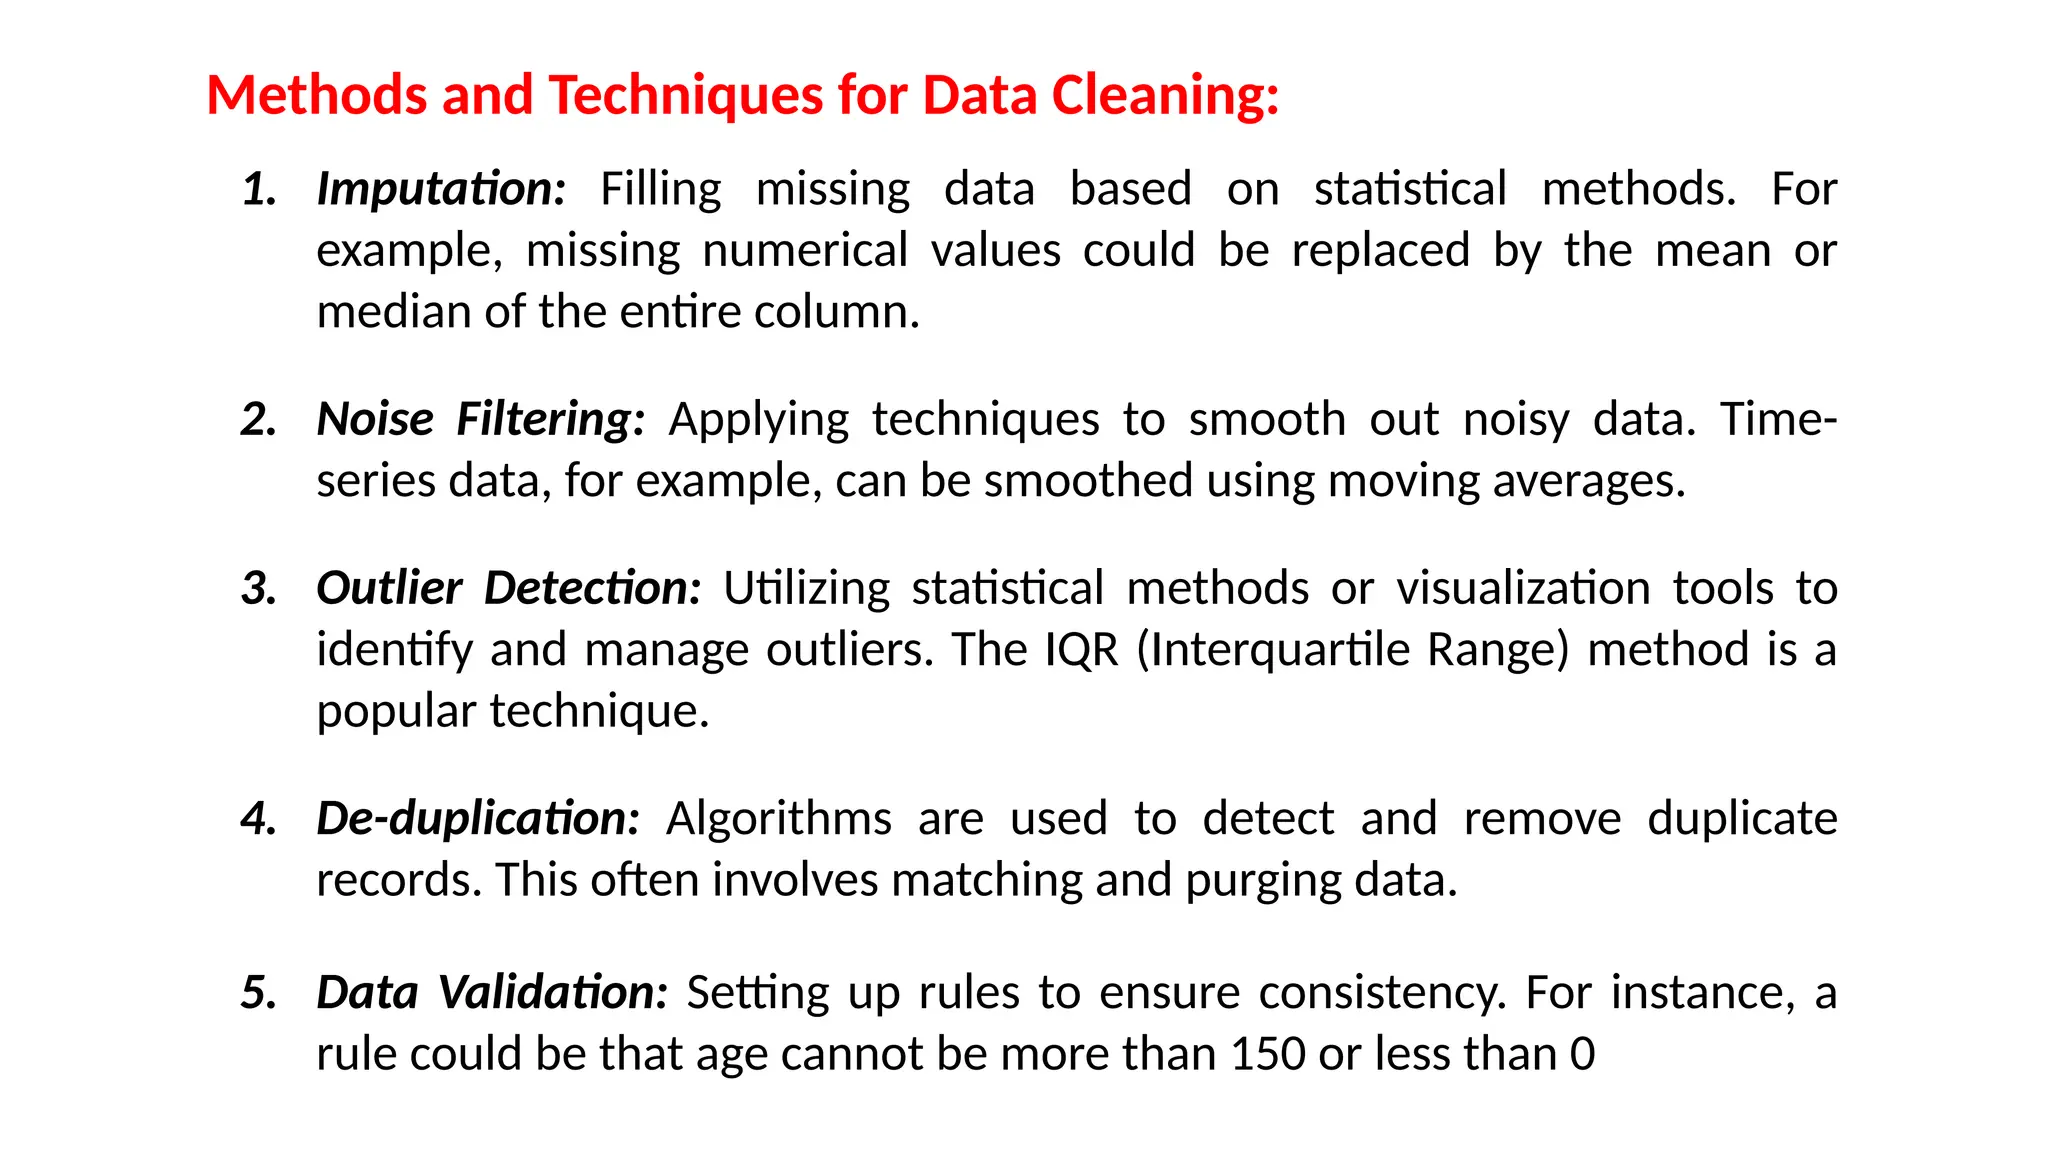
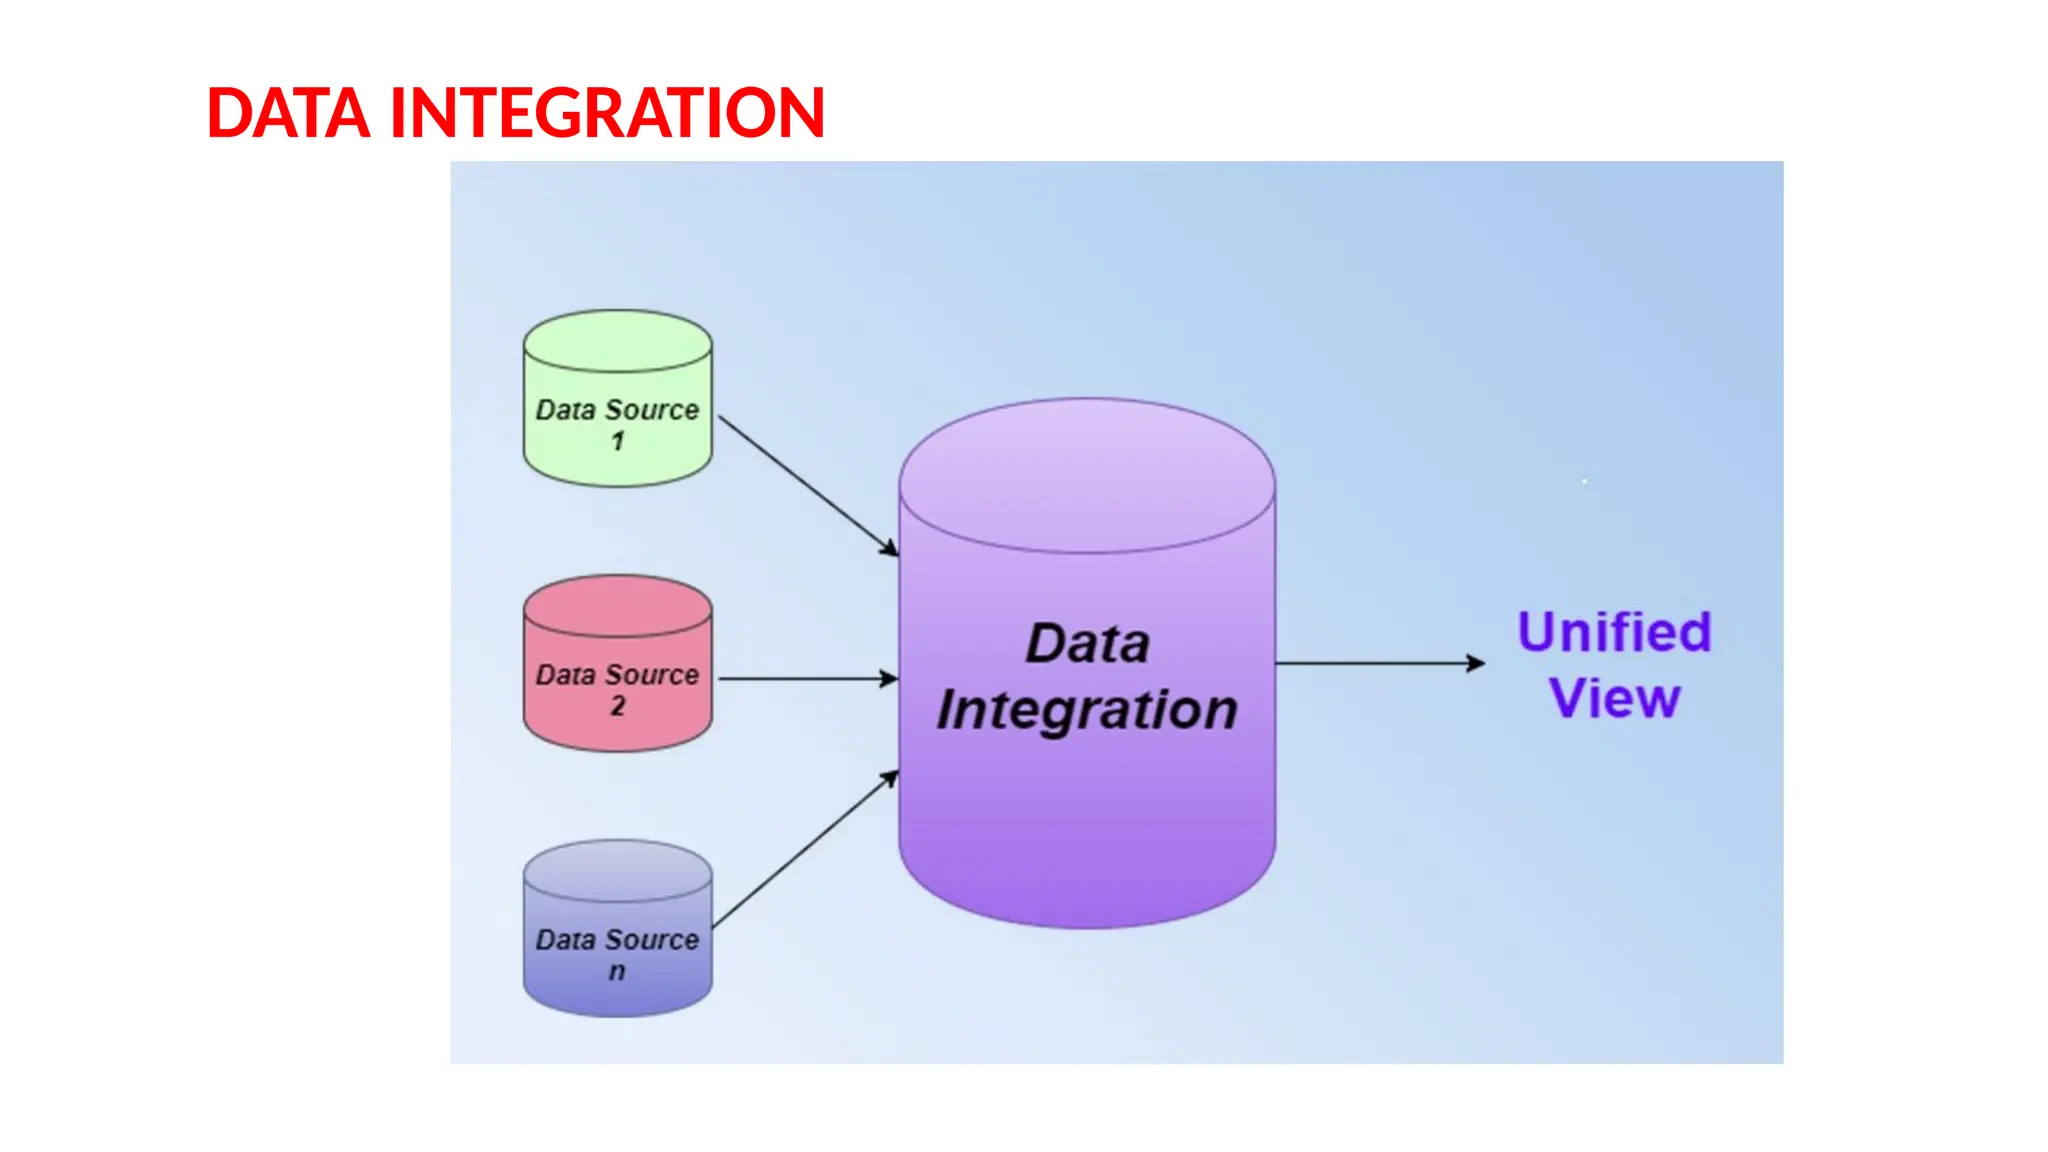
KEMBAR78
Data Preprocessing techniques for applications | PPTX
A series of steps to be made suitable for mining. This transformation
phase is known as data preprocessing,
an essential and often time-consuming stage in the data mining
pipeline.
• Data preprocessing is the method of cleaning and transforming
raw data into a structured and usable format, ready for
subsequent analysis.
• The real-world data we gather is riddled with imperfections. There
may be missing values, redundant information, or inconsistencies
that can adversely impact the outcome of data analysis. The
methodologies employed to turn raw data into a rich, structured,
and actionable asset.
DATA PREPROCESSING
Data Cleaning: An Overview
Data cleaning, sometimes referred to as data cleansing,
involves detecting and correcting (or removing) errors
and inconsistencies in data to improve its quality.
The objective is to ensure data integrity and enhance
the accuracy of subsequent data analysis
Common Issues Addressed in Data Cleaning:
Missing Values: Data can often have gaps. For instance, a dataset of
patient records might lack age details for some individuals. Such
missing data can skew analysis and lead to incomplete results.
Noisy Data: This refers to random error or variance in a dataset. An
example would be a faulty sensor logging erratic temperature
readings amidst accurate ones
Contd…
Outliers: Data points that deviate significantly from other
observations can distort results. For example, in a dataset of
house prices, an unusually high price due to an erroneous entry
can skew the average.
Duplicate Entries: Redundancies can creep in, especially when
data is collated from various sources. Duplicate rows or records
need to be identified and removed
Inconsistent Data: This could be due to various reasons like
different data entry personnel or multiple sources. A date might
be entered as "January 15, 2020" in one record and "15/01/2020"
in another
Methods and Techniques for Data Cleaning:
1. Imputation: Filling missing data based on statistical methods. For
example, missing numerical values could be replaced by the mean or
median of the entire column.
2. Noise Filtering: Applying techniques to smooth out noisy data. Time-
series data, for example, can be smoothed using moving averages.
3. Outlier Detection: Utilizing statistical methods or visualization tools to
identify and manage outliers. The IQR (Interquartile Range) method is a
popular technique.
4. De-duplication: Algorithms are used to detect and remove duplicate
records. This often involves matching and purging data.
5. Data Validation: Setting up rules to ensure consistency. For instance, a
rule could be that age cannot be more than 150 or less than 0
Data Integration:
• Merging data from multiple sources
• Data integration is the process of combining data from
various sources into a unified format that can be used for
analytical, operational, and decision-making purposes.
There are several ways to integrate data
• Data virtualization
• Presents data from multiple sources in a single data set in real-time without
replicating, transforming, or loading the data. Instead, it creates a virtual view
that integrates all the data sources and populates a dashboard with data from
multiple sources after receiving a query.
• Extract, load, transform (ELT)
• A modern twist on ETL that loads data into a flexible repository, like a data lake,
before transformation. This allows for greater flexibility and handling of
unstructured data.
• Application integration
• Allows separate applications to work together by moving and syncing data
between them. This can support operational needs, such as ensuring that an HR
system has the same data as a finance system.
• Here are some examples of data integration:
• Facebook Ads and Google Ads to acquire new users
• Google Analytics to track events on a website and in a mobile app
• MySQL database to store user information and image metadata
• Marketo to send marketing email and nurture leads
DATA INTEGRATION
Data integration is the process of combining data from
multiple sources into a cohesive and consistent view.
This process involves identifying and accessing the different
data sources, mapping the data to a common format, and
reconciling any inconsistencies or discrepancies between the
sources.
The goal of data integration is to make it easier to access and
analyze data that is spread across multiple systems or
platforms, in order to gain a more complete and accurate
understanding of the data.
Contd..
Data integration can be challenging due to the variety of
data formats, structures, and semantics used by different
data sources. Different data sources may use different data
types, naming conventions, and schemas, making it difficult
to combine the data into a single view.
Data integration typically involves a combination of manual
and automated processes, including data profiling, data
mapping, data transformation, and data reconciliation.
Contd..
There are mainly 2 major approaches for data integration –
one is the “tight coupling approach” and another is the
“loose coupling approach”.
Tight Coupling:
This approach involves creating a centralized repository or
data warehouse to store the integrated data. The data is
extracted from various sources, transformed and loaded into
a data warehouse. Data is integrated in a tightly coupled
manner, meaning that the data is integrated at a high level,
such as at the level of the entire dataset or schema.
Contd..
This approach is also known as data warehousing, and it
enables data consistency and integrity, but it can be
inflexible and difficult to change or update.
• Here, a data warehouse is treated as an information
retrieval component.
• In this coupling, data is combined from different sources
into a single physical location through the process of ETL –
Extraction, Transformation, and Loading.
Contd..
Loose Coupling:
This approach involves integrating data at the lowest level,
such as at the level of individual data elements or records.
Data is integrated in a loosely coupled manner, meaning that
the data is integrated at a low level, and it allows data to be
integrated without having to create a central repository or
data warehouse.
This approach is also known as data federation, and it
enables data flexibility and easy updates, but it can be
difficult to maintain consistency and integrity across multiple
data sources.
Contd..
Data Reduction
• Data Reduction refers to the process of reducing the volume
of data while maintaining its informational quality.
• Data reduction is the process in which an organization sets
out to limit the amount of data it's storing.
• Data reduction techniques seek to lessen the redundancy
found in the original data set so that large amounts of
originally sourced data can be more efficiently stored as
reduced data.
Data Transformation:
While data cleaning focuses on rectifying errors,
data transformation is about converting data into
a suitable format or structure for analysis. It’s
about making the data compatible and ready for
the next steps in the data mining process.
Common Data Transformation Techniques:
1. Normalization: Scaling numeric data to fall within a small, specified
range. For example, adjusting variables so they range between 0 and 1
2. Standardization: Shifting data to have a mean of zero and a standard
deviation of one. This is often done so different variables can be
compared on common grounds.
3. Binning: Transforming continuous variables into discrete 'bins'. For
instance, age can be categorized into bins like 0-18, 19-35, and so on.
4. One-hot encoding: Converting categorical data into a binary (0 or 1)
format. For example, the color variable with values 'Red', 'Green', 'Blue'
can be transformed into three binary columns—one for each color.
5. Log Transformation: Applied to handle skewed data or when dealing
with exponential patterns
Benefits of Data Cleaning and Transformation:
Enhanced Analysis Accuracy: With cleaner data, algorithms work
more effectively, leading to more accurate insights.
Reduced Complexity: Removing redundant and irrelevant data
reduces dataset size and complexity, making subsequent analysis
faster.
Improved Decision Making: Accurate data leads to better
insights, which in turn facilitates informed decision-making.
Enhanced Data Integrity: Consistency in data ensures integrity,
which is crucial for analytics and reporting.
Common Data Transformation Techniques:
1. Normalization: Scaling numeric data to fall within a small, specified
range. For example, adjusting variables so they range between 0 and 1
2. Standardization: Shifting data to have a mean of zero and a standard
deviation of one. This is often done so different variables can be
compared on common grounds.
3. Binning: Transforming continuous variables into discrete 'bins'. For
instance, age can be categorized into bins like 0-18, 19-35, and so on.
4. One-hot encoding: Converting categorical data into a binary (0 or 1)
format. For example, the color variable with values 'Red', 'Green', 'Blue'
can be transformed into three binary columns—one for each color.
5. Log Transformation: Applied to handle skewed data or when dealing
with exponential patterns
Data Normalization and Standardization
1. Data Normalization:Normalization scales all numeric variables in the
range between 0 and 1. The goal is to change the values of numeric
columns in the dataset to a common scale, without distorting differences
in the range of values
2. Benefits of Normalization:
1. Predictability: Ensures that gradient descent (used in many modeling
techniques) converges more quickly.
2. Uniformity: Brings data to a uniform scale, making it easier to
compare different features.
Normalization has its drawbacks. It can be influenced heavily by outliers.
Data Normalization and Standardization
Data Standardization
While normalization adjusts features to a specific range, standardization
adjusts them to have a mean of 0 and a standard deviation of 1. It's also
commonly known as the z-score normalization
Benefits of Standardization:
Centering the Data: It centers the data around 0, which can be useful in
algorithms that assume zero centric data, like Principal Component
Analysis (PCA).
Handling Outliers: Standardization is less sensitive to outliers compared
to normalization.
Common Scale: Like normalization, it brings features to a common scale
Discretization:
• In statistics and machine learning, discretization refers to the
process of converting continuous features or variables to
discretized or nominal features.
• Discretization in data mining refers to converting a range of
continuous values into discrete categories.
• For example:
• Suppose we have an attribute of Age with the given values
• Discretized Data
Data Preprocessing techniques for applications

Data Preprocessing techniques for applications

  • 1.
    A series ofsteps to be made suitable for mining. This transformation phase is known as data preprocessing, an essential and often time-consuming stage in the data mining pipeline. • Data preprocessing is the method of cleaning and transforming raw data into a structured and usable format, ready for subsequent analysis. • The real-world data we gather is riddled with imperfections. There may be missing values, redundant information, or inconsistencies that can adversely impact the outcome of data analysis. The methodologies employed to turn raw data into a rich, structured, and actionable asset. DATA PREPROCESSING
  • 3.
    Data Cleaning: AnOverview Data cleaning, sometimes referred to as data cleansing, involves detecting and correcting (or removing) errors and inconsistencies in data to improve its quality. The objective is to ensure data integrity and enhance the accuracy of subsequent data analysis
  • 4.
    Common Issues Addressedin Data Cleaning: Missing Values: Data can often have gaps. For instance, a dataset of patient records might lack age details for some individuals. Such missing data can skew analysis and lead to incomplete results. Noisy Data: This refers to random error or variance in a dataset. An example would be a faulty sensor logging erratic temperature readings amidst accurate ones
  • 5.
    Contd… Outliers: Data pointsthat deviate significantly from other observations can distort results. For example, in a dataset of house prices, an unusually high price due to an erroneous entry can skew the average. Duplicate Entries: Redundancies can creep in, especially when data is collated from various sources. Duplicate rows or records need to be identified and removed Inconsistent Data: This could be due to various reasons like different data entry personnel or multiple sources. A date might be entered as "January 15, 2020" in one record and "15/01/2020" in another
  • 6.
    Methods and Techniquesfor Data Cleaning: 1. Imputation: Filling missing data based on statistical methods. For example, missing numerical values could be replaced by the mean or median of the entire column. 2. Noise Filtering: Applying techniques to smooth out noisy data. Time- series data, for example, can be smoothed using moving averages. 3. Outlier Detection: Utilizing statistical methods or visualization tools to identify and manage outliers. The IQR (Interquartile Range) method is a popular technique. 4. De-duplication: Algorithms are used to detect and remove duplicate records. This often involves matching and purging data. 5. Data Validation: Setting up rules to ensure consistency. For instance, a rule could be that age cannot be more than 150 or less than 0
  • 7.
    Data Integration: • Mergingdata from multiple sources • Data integration is the process of combining data from various sources into a unified format that can be used for analytical, operational, and decision-making purposes.
  • 8.
    There are severalways to integrate data • Data virtualization • Presents data from multiple sources in a single data set in real-time without replicating, transforming, or loading the data. Instead, it creates a virtual view that integrates all the data sources and populates a dashboard with data from multiple sources after receiving a query. • Extract, load, transform (ELT) • A modern twist on ETL that loads data into a flexible repository, like a data lake, before transformation. This allows for greater flexibility and handling of unstructured data. • Application integration • Allows separate applications to work together by moving and syncing data between them. This can support operational needs, such as ensuring that an HR system has the same data as a finance system.
  • 9.
    • Here aresome examples of data integration: • Facebook Ads and Google Ads to acquire new users • Google Analytics to track events on a website and in a mobile app • MySQL database to store user information and image metadata • Marketo to send marketing email and nurture leads
  • 10.
  • 11.
    Data integration isthe process of combining data from multiple sources into a cohesive and consistent view. This process involves identifying and accessing the different data sources, mapping the data to a common format, and reconciling any inconsistencies or discrepancies between the sources. The goal of data integration is to make it easier to access and analyze data that is spread across multiple systems or platforms, in order to gain a more complete and accurate understanding of the data. Contd..
  • 12.
    Data integration canbe challenging due to the variety of data formats, structures, and semantics used by different data sources. Different data sources may use different data types, naming conventions, and schemas, making it difficult to combine the data into a single view. Data integration typically involves a combination of manual and automated processes, including data profiling, data mapping, data transformation, and data reconciliation. Contd..
  • 13.
    There are mainly2 major approaches for data integration – one is the “tight coupling approach” and another is the “loose coupling approach”. Tight Coupling: This approach involves creating a centralized repository or data warehouse to store the integrated data. The data is extracted from various sources, transformed and loaded into a data warehouse. Data is integrated in a tightly coupled manner, meaning that the data is integrated at a high level, such as at the level of the entire dataset or schema. Contd..
  • 14.
    This approach isalso known as data warehousing, and it enables data consistency and integrity, but it can be inflexible and difficult to change or update. • Here, a data warehouse is treated as an information retrieval component. • In this coupling, data is combined from different sources into a single physical location through the process of ETL – Extraction, Transformation, and Loading. Contd..
  • 15.
    Loose Coupling: This approachinvolves integrating data at the lowest level, such as at the level of individual data elements or records. Data is integrated in a loosely coupled manner, meaning that the data is integrated at a low level, and it allows data to be integrated without having to create a central repository or data warehouse. This approach is also known as data federation, and it enables data flexibility and easy updates, but it can be difficult to maintain consistency and integrity across multiple data sources. Contd..
  • 16.
    Data Reduction • DataReduction refers to the process of reducing the volume of data while maintaining its informational quality. • Data reduction is the process in which an organization sets out to limit the amount of data it's storing. • Data reduction techniques seek to lessen the redundancy found in the original data set so that large amounts of originally sourced data can be more efficiently stored as reduced data.
  • 18.
    Data Transformation: While datacleaning focuses on rectifying errors, data transformation is about converting data into a suitable format or structure for analysis. It’s about making the data compatible and ready for the next steps in the data mining process.
  • 19.
    Common Data TransformationTechniques: 1. Normalization: Scaling numeric data to fall within a small, specified range. For example, adjusting variables so they range between 0 and 1 2. Standardization: Shifting data to have a mean of zero and a standard deviation of one. This is often done so different variables can be compared on common grounds. 3. Binning: Transforming continuous variables into discrete 'bins'. For instance, age can be categorized into bins like 0-18, 19-35, and so on. 4. One-hot encoding: Converting categorical data into a binary (0 or 1) format. For example, the color variable with values 'Red', 'Green', 'Blue' can be transformed into three binary columns—one for each color. 5. Log Transformation: Applied to handle skewed data or when dealing with exponential patterns
  • 20.
    Benefits of DataCleaning and Transformation: Enhanced Analysis Accuracy: With cleaner data, algorithms work more effectively, leading to more accurate insights. Reduced Complexity: Removing redundant and irrelevant data reduces dataset size and complexity, making subsequent analysis faster. Improved Decision Making: Accurate data leads to better insights, which in turn facilitates informed decision-making. Enhanced Data Integrity: Consistency in data ensures integrity, which is crucial for analytics and reporting.
  • 21.
    Common Data TransformationTechniques: 1. Normalization: Scaling numeric data to fall within a small, specified range. For example, adjusting variables so they range between 0 and 1 2. Standardization: Shifting data to have a mean of zero and a standard deviation of one. This is often done so different variables can be compared on common grounds. 3. Binning: Transforming continuous variables into discrete 'bins'. For instance, age can be categorized into bins like 0-18, 19-35, and so on. 4. One-hot encoding: Converting categorical data into a binary (0 or 1) format. For example, the color variable with values 'Red', 'Green', 'Blue' can be transformed into three binary columns—one for each color. 5. Log Transformation: Applied to handle skewed data or when dealing with exponential patterns
  • 22.
    Data Normalization andStandardization 1. Data Normalization:Normalization scales all numeric variables in the range between 0 and 1. The goal is to change the values of numeric columns in the dataset to a common scale, without distorting differences in the range of values 2. Benefits of Normalization: 1. Predictability: Ensures that gradient descent (used in many modeling techniques) converges more quickly. 2. Uniformity: Brings data to a uniform scale, making it easier to compare different features. Normalization has its drawbacks. It can be influenced heavily by outliers.
  • 23.
    Data Normalization andStandardization Data Standardization While normalization adjusts features to a specific range, standardization adjusts them to have a mean of 0 and a standard deviation of 1. It's also commonly known as the z-score normalization Benefits of Standardization: Centering the Data: It centers the data around 0, which can be useful in algorithms that assume zero centric data, like Principal Component Analysis (PCA). Handling Outliers: Standardization is less sensitive to outliers compared to normalization. Common Scale: Like normalization, it brings features to a common scale
  • 24.
    Discretization: • In statisticsand machine learning, discretization refers to the process of converting continuous features or variables to discretized or nominal features.
  • 25.
    • Discretization indata mining refers to converting a range of continuous values into discrete categories. • For example: • Suppose we have an attribute of Age with the given values • Discretized Data