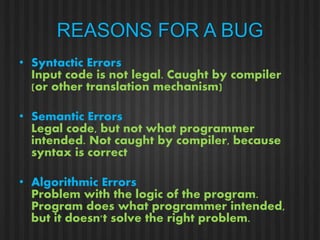
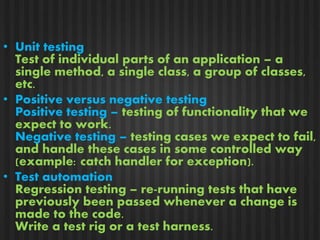
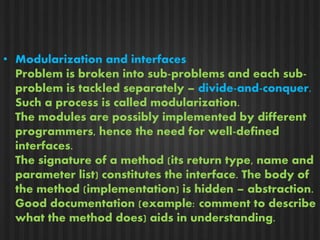
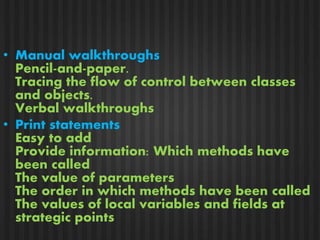
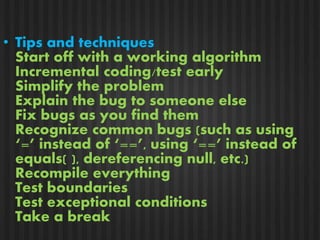
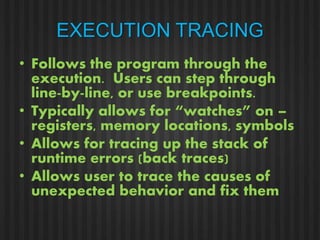
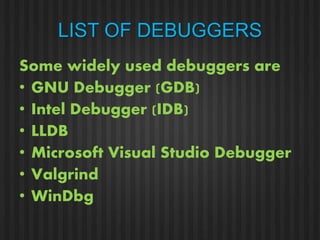
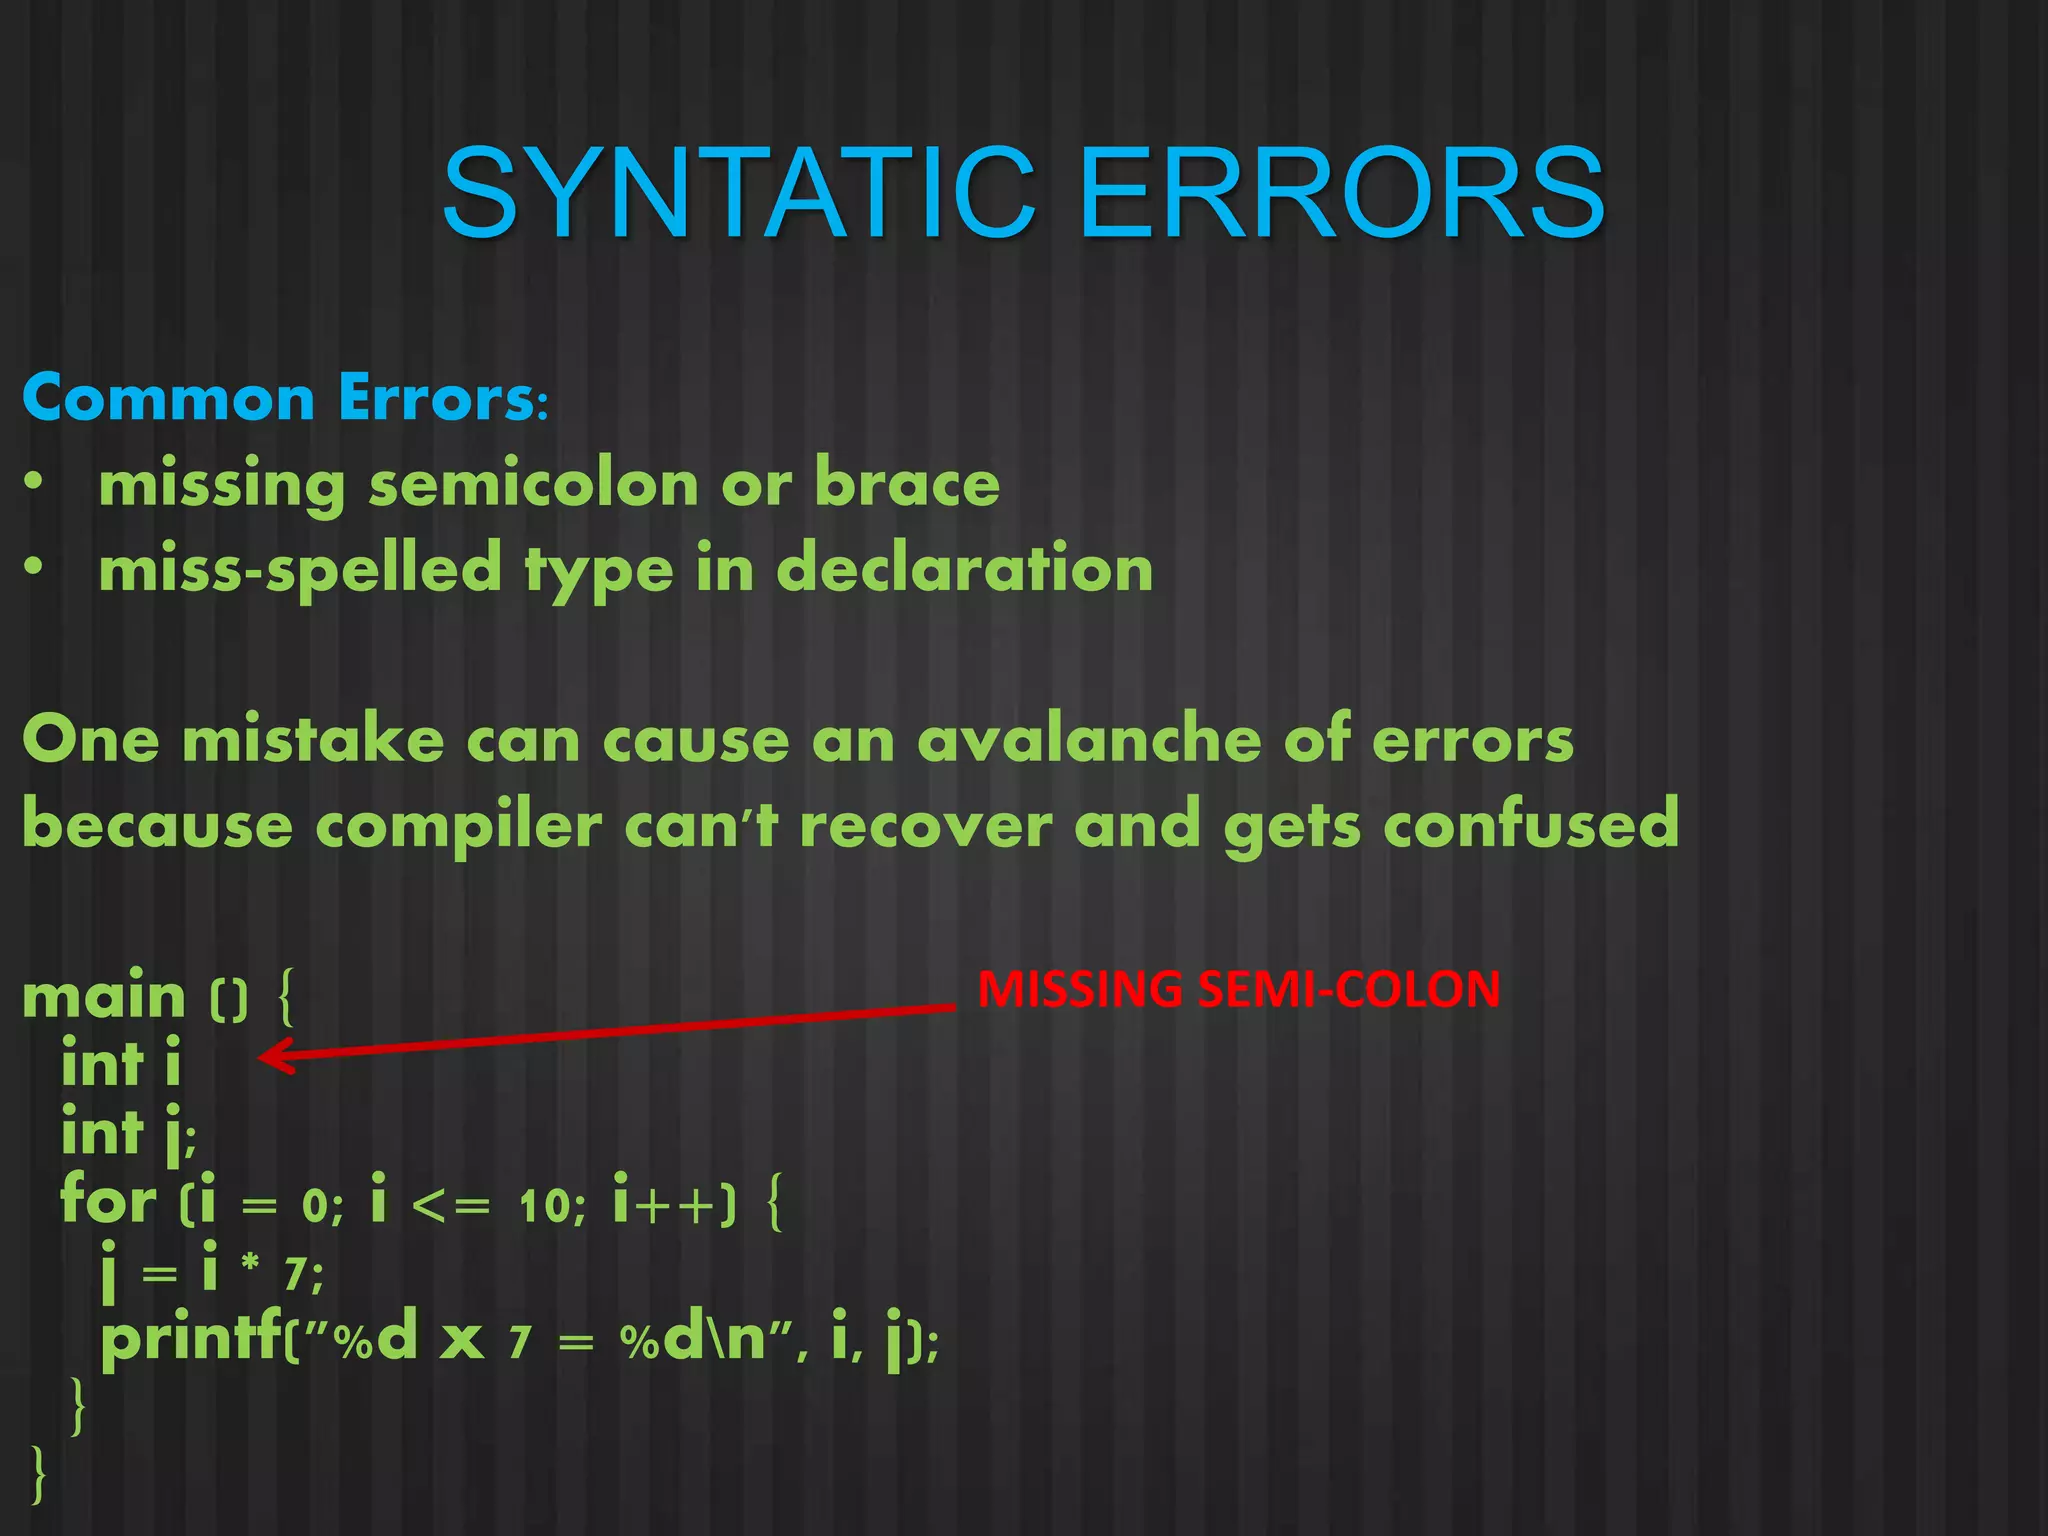
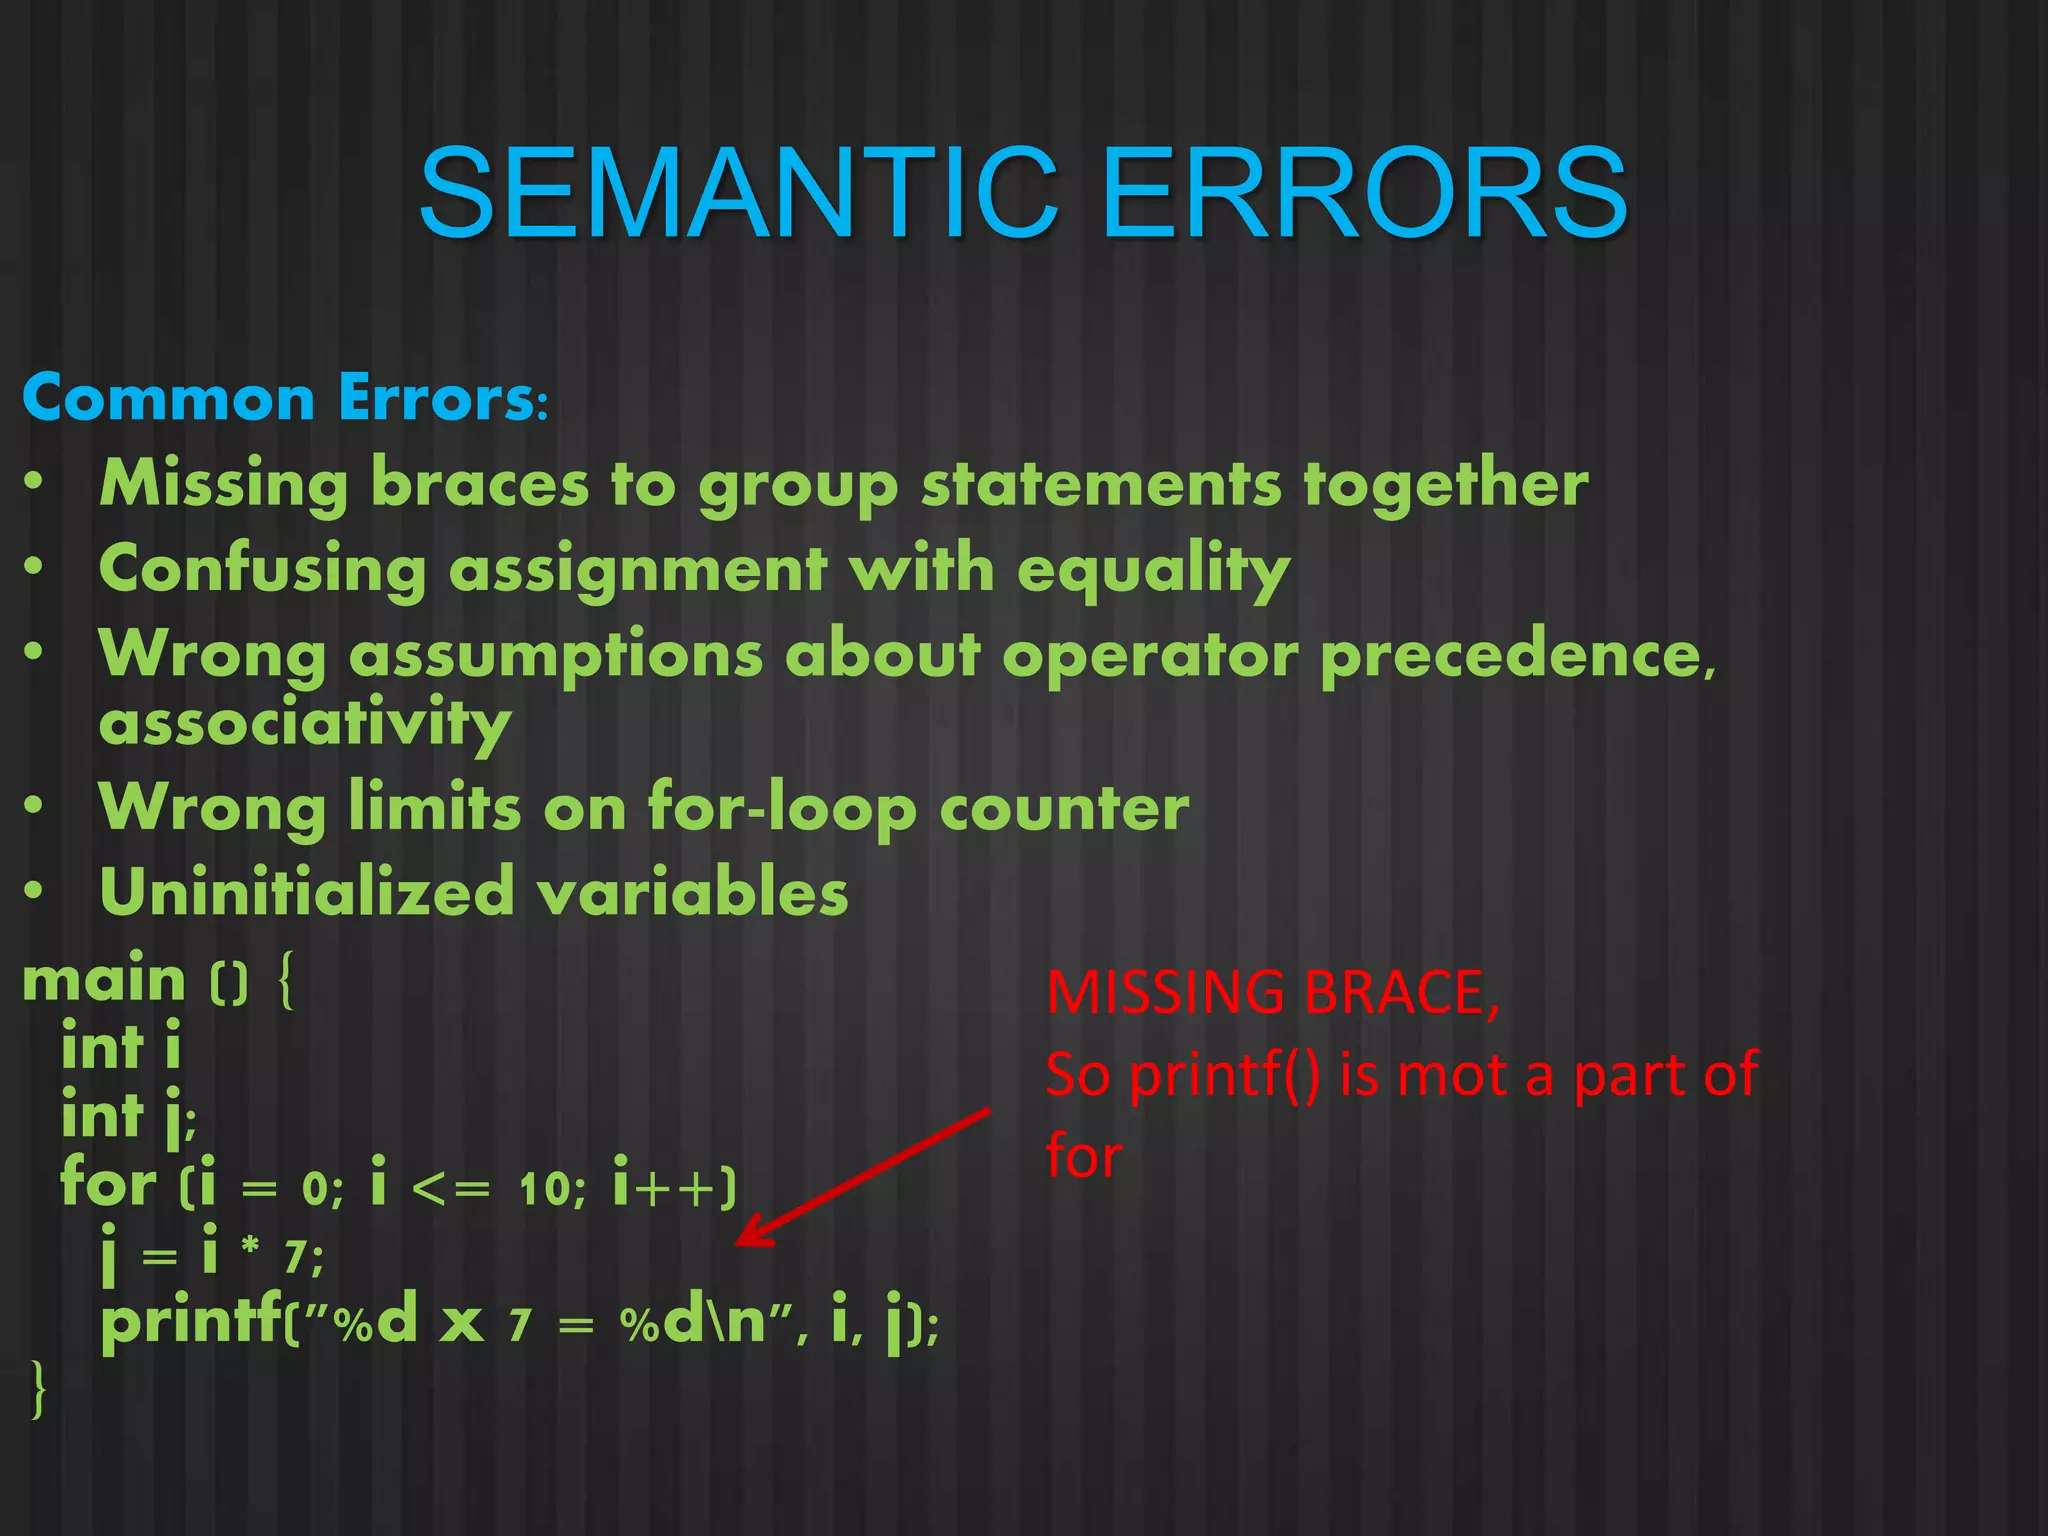
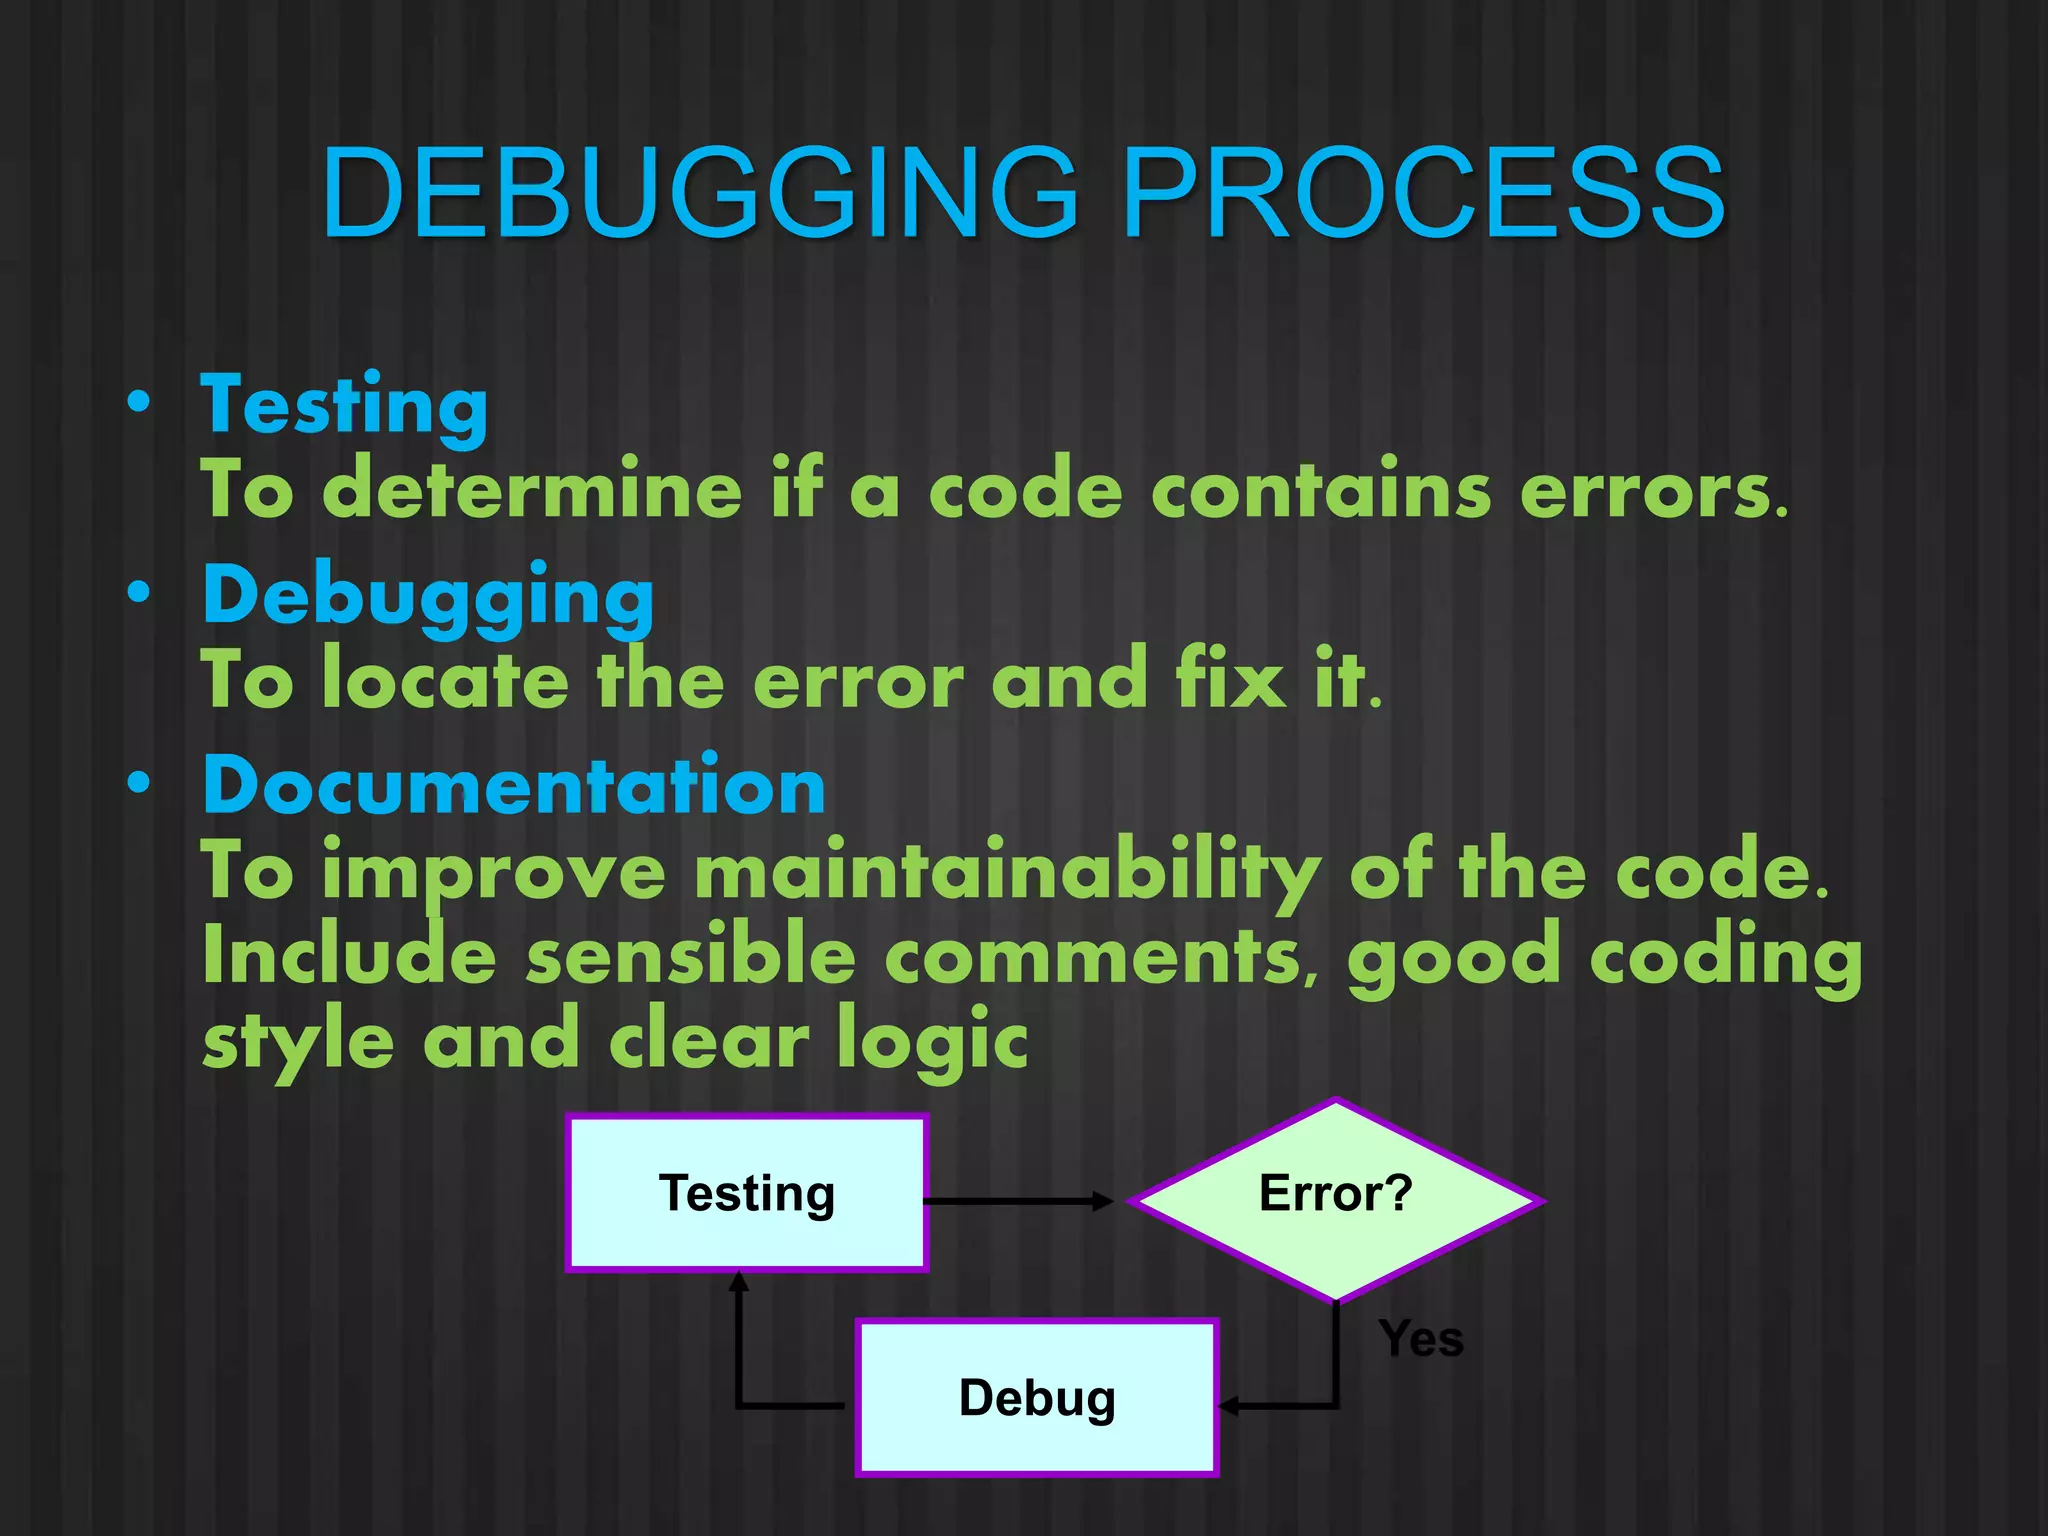
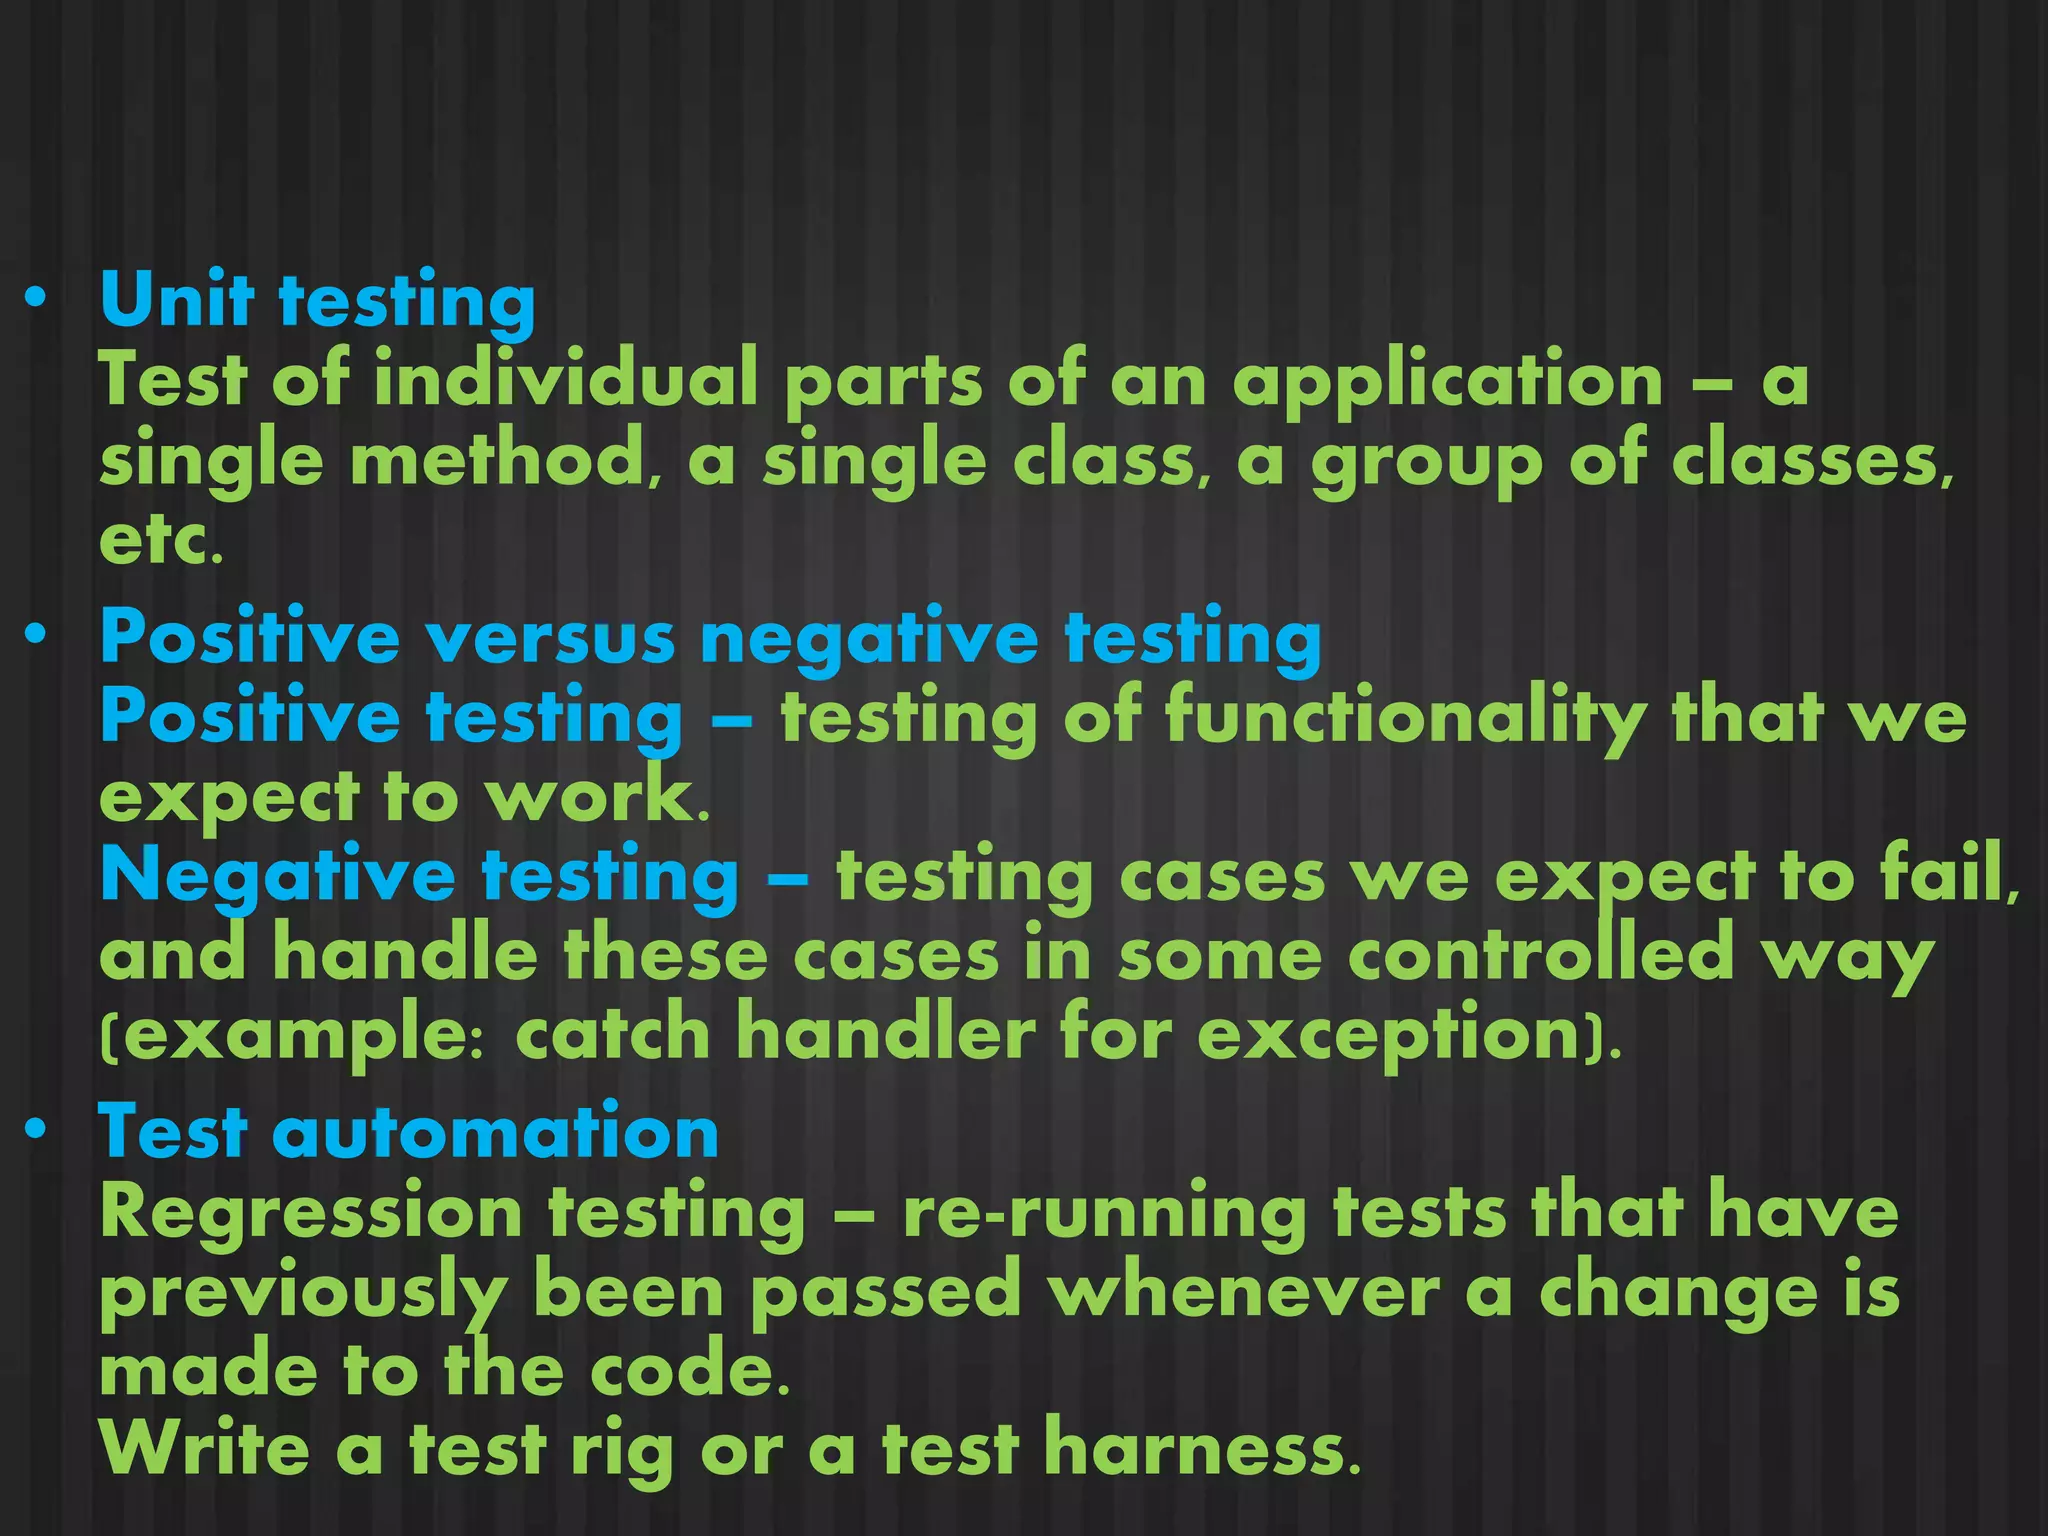
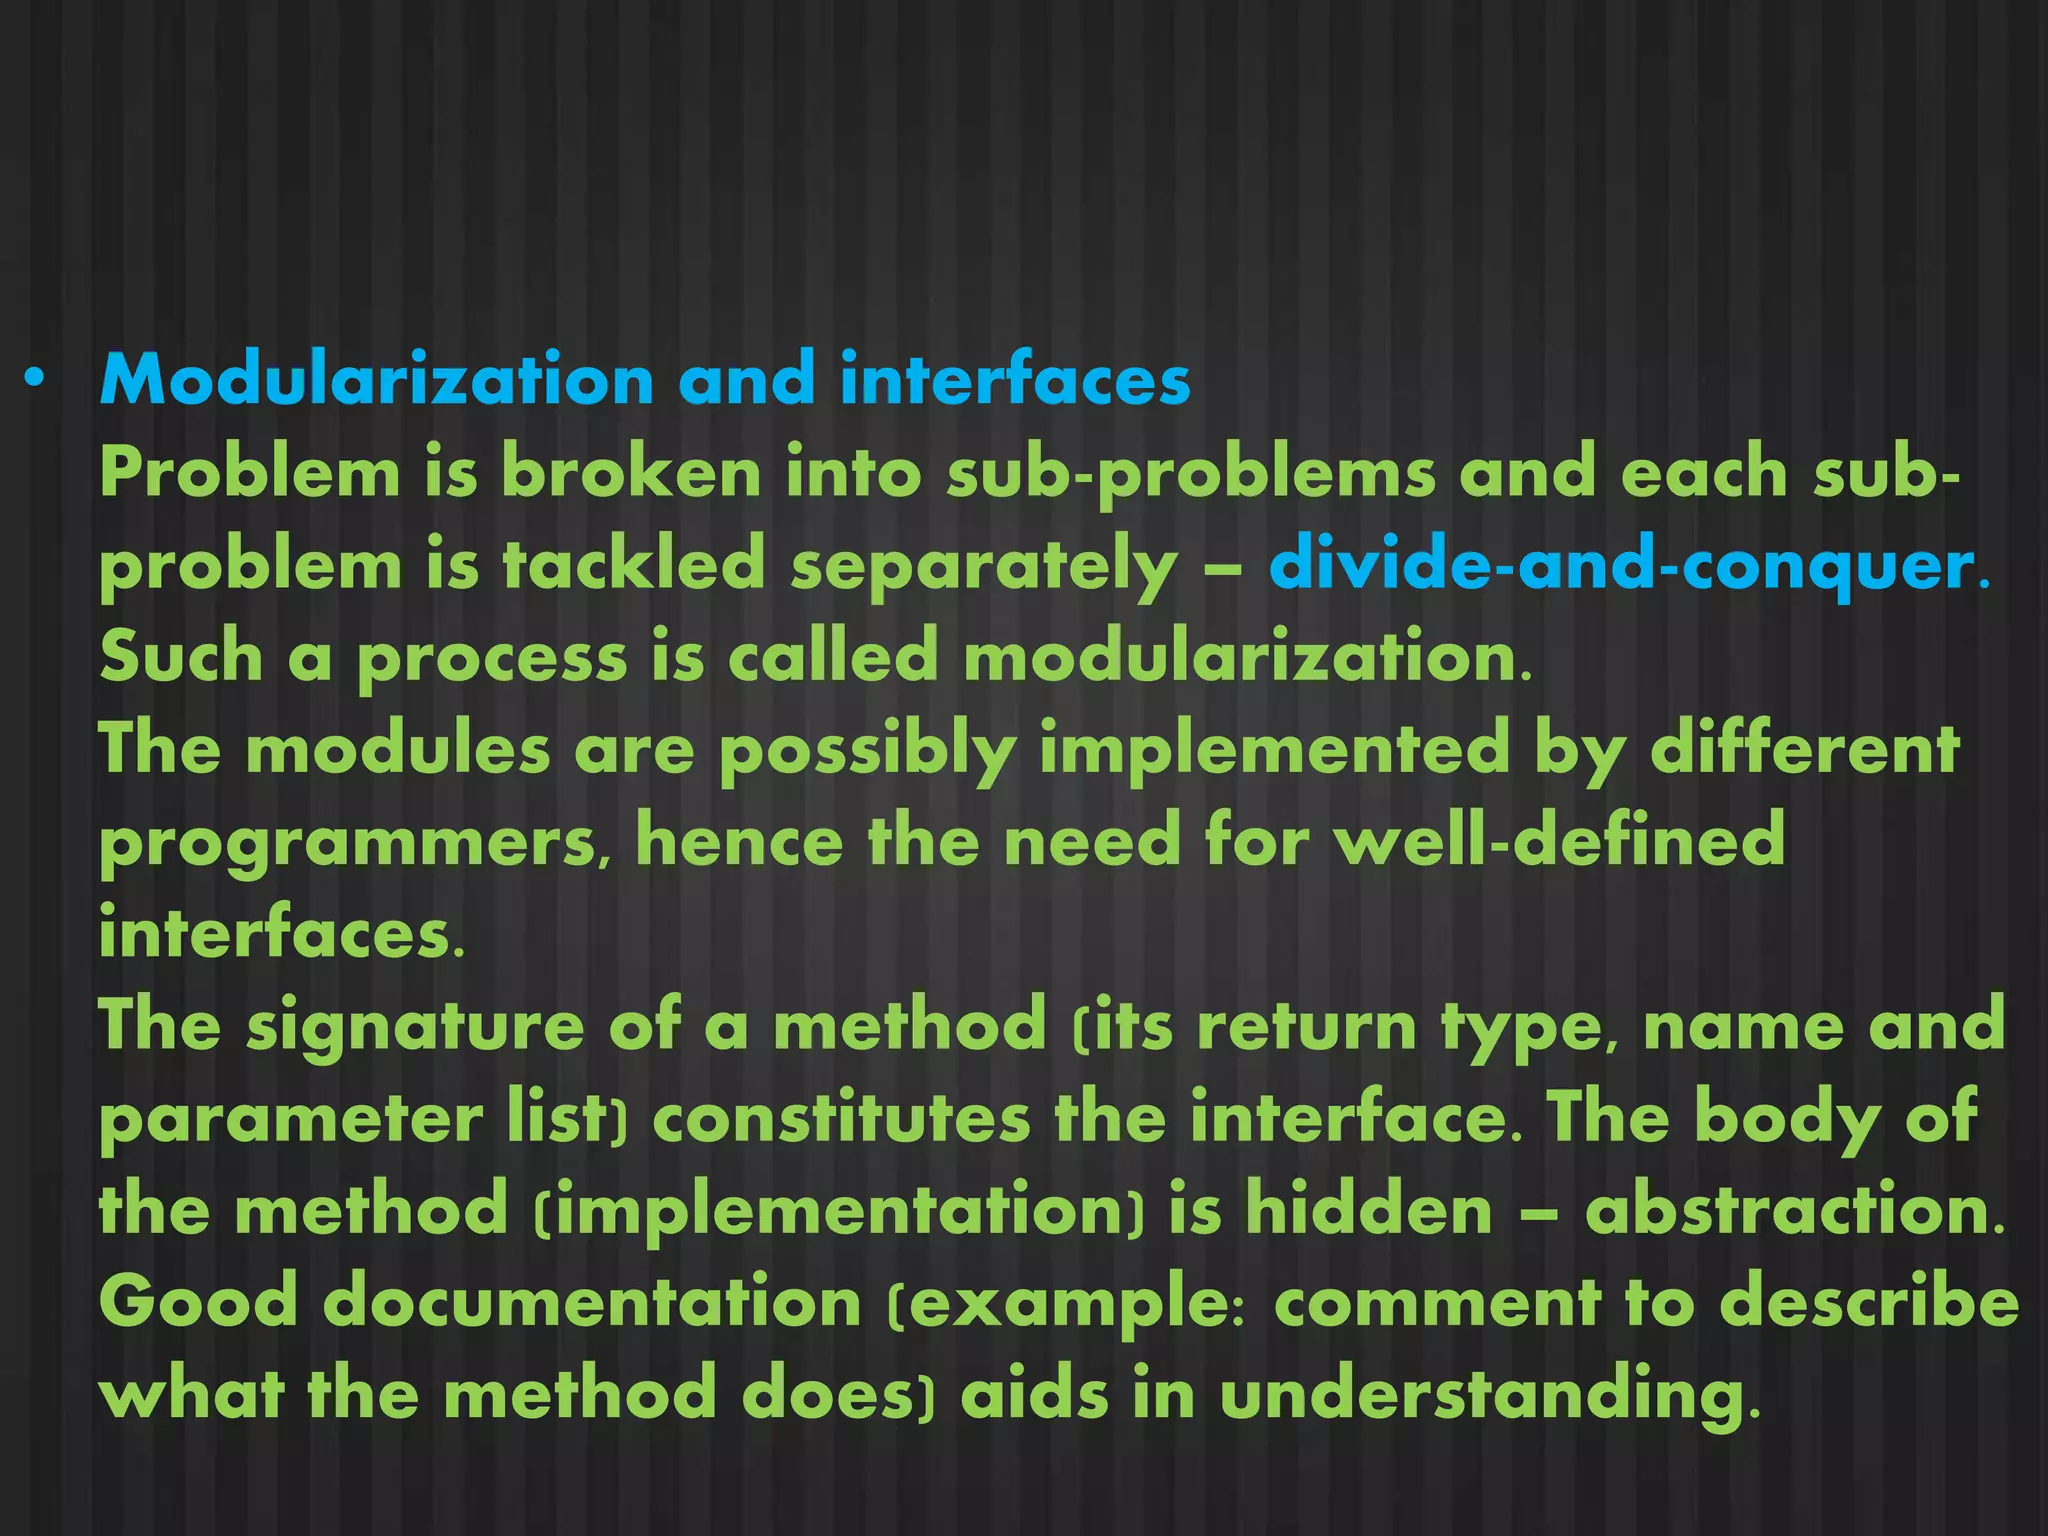
KEMBAR78
Debbuging | PPTX
DEFINITION 
Debugging is a methodical process 
of finding and reducing the number 
of bugs, or defects, in a 
computer program or a 
piece of electronic 
hardware, thus 
making it behave as 
expected.
BUG 
A software bug is an error, flaw, 
failure, or fault in a computer 
program or system that causes it 
to produce an incorrect or 
unexpected result, or to behave 
in unintended ways.
REASONS FOR A BUG 
• Syntactic Errors 
Input code is not legal. Caught by compiler 
(or other translation mechanism) 
• Semantic Errors 
Legal code, but not what programmer 
intended. Not caught by compiler, because 
syntax is correct 
• Algorithmic Errors 
Problem with the logic of the program. 
Program does what programmer intended, 
but it doesn't solve the right problem.
SYNTATIC ERRORS 
Common Errors: 
• missing semicolon or brace 
• miss-spelled type in declaration 
One mistake can cause an avalanche of errors 
because compiler can't recover and gets confused 
main () { 
int i 
int j; 
for (i = 0; i <= 10; i++) { 
j = i * 7; 
printf("%d x 7 = %dn", i, j); 
} 
} 
MISSING SEMI-COLON
SEMANTIC ERRORS 
Common Errors: 
• Missing braces to group statements together 
• Confusing assignment with equality 
• Wrong assumptions about operator precedence, 
associativity 
• Wrong limits on for-loop counter 
• Uninitialized variables 
main () { 
int i 
int j; 
for (i = 0; i <= 10; i++) 
j = i * 7; 
printf("%d x 7 = %dn", i, j); 
} 
MISSING BRACE, 
So printf() is mot a part of 
for
Algorithmic Errors 
Design is wrong, so program does not 
solve the correct problem 
Difficult to find 
• Program does what we intended 
• Problem might not show up until many 
runs of program 
• Maybe difficult to fix 
• Have to redesign, may have large impact 
on program code
DEBUGGING PROCESS 
• Testing 
To determine if a code contains errors. 
• Debugging 
To locate the error and fix it. 
• Documentation 
To improve maintainability of the code. 
Include sensible comments, good coding 
style and clear logic 
Testing 
Error? 
Yes 
Debug
• Unit testing 
Test of individual parts of an application – a 
single method, a single class, a group of classes, 
etc. 
• Positive versus negative testing 
Positive testing – testing of functionality that we 
expect to work. 
Negative testing – testing cases we expect to fail, 
and handle these cases in some controlled way 
(example: catch handler for exception). 
• Test automation 
Regression testing – re-running tests that have 
previously been passed whenever a change is 
made to the code. 
Write a test rig or a test harness.
• Modularization and interfaces 
Problem is broken into sub-problems and each sub-problem 
is tackled separately – divide-and-conquer. 
Such a process is called modularization. 
The modules are possibly implemented by different 
programmers, hence the need for well-defined 
interfaces. 
The signature of a method (its return type, name and 
parameter list) constitutes the interface. The body of 
the method (implementation) is hidden – abstraction. 
Good documentation (example: comment to describe 
what the method does) aids in understanding.
• Manual walkthroughs 
Pencil-and-paper. 
Tracing the flow of control between classes 
and objects. 
Verbal walkthroughs 
• Print statements 
Easy to add 
Provide information: Which methods have 
been called 
The value of parameters 
The order in which methods have been called 
The values of local variables and fields at 
strategic points
• Tips and techniques 
Start off with a working algorithm 
Incremental coding/test early 
Simplify the problem 
Explain the bug to someone else 
Fix bugs as you find them 
Recognize common bugs (such as using 
‘=’ instead of ‘==’, using ‘==’ instead of 
equals( ), dereferencing null, etc.) 
Recompile everything 
Test boundaries 
Test exceptional conditions 
Take a break
DEBUGGER 
A debugger or debugging tool is a 
computer program that is used to 
test and debug other programs (the 
"target" program). 
Typically, debuggers offer a query 
processor, symbol resolver, 
expression interpreter, and debug 
support interface at its top level.
DEBUGGING TECHNIQUES 
• Execution tracing 
-running the program 
-print 
-trace utilities 
-single stepping in debugger 
-hand simulation
• Interface checking 
-check procedure parameter 
number/type (if not enforced by 
compiler) and value 
-defensive programming: check 
inputs/results from other modules 
-documents assumptions about 
caller/callee relationships in modules, 
communication protocols, etc.
• Assertions: include range 
constraints or other information 
with data. 
• Skipping code: comment out 
suspect code, then check if error 
remains.
• Other Techniques:- 
-Disassembly (in context and 
with live data!) 
-Execution Tracing/Stack tracing 
-Symbol watches
DISASSEMBLY 
• Most basic form of debugging 
• Translating machine code into 
assembly instructions that are more 
easily understood by the user. 
• Typically implementable as a simple 
lookup table 
• No higher-level information (variable 
names, etc.) 
• Relatively easy to implement.
EXECUTION TRACING 
• Follows the program through the 
execution. Users can step through 
line-by-line, or use breakpoints. 
• Typically allows for “watches” on – 
registers, memory locations, symbols 
• Allows for tracing up the stack of 
runtime errors (back traces) 
• Allows user to trace the causes of 
unexpected behavior and fix them
LIST OF DEBUGGERS 
Some widely used debuggers are 
• GNU Debugger (GDB) 
• Intel Debugger (IDB) 
• LLDB 
• Microsoft Visual Studio Debugger 
• Valgrind 
• WinDbg
. 
.
. 
.
. 
.

Debbuging

  • 2.
    DEFINITION Debugging isa methodical process of finding and reducing the number of bugs, or defects, in a computer program or a piece of electronic hardware, thus making it behave as expected.
  • 3.
    BUG A softwarebug is an error, flaw, failure, or fault in a computer program or system that causes it to produce an incorrect or unexpected result, or to behave in unintended ways.
  • 4.
    REASONS FOR ABUG • Syntactic Errors Input code is not legal. Caught by compiler (or other translation mechanism) • Semantic Errors Legal code, but not what programmer intended. Not caught by compiler, because syntax is correct • Algorithmic Errors Problem with the logic of the program. Program does what programmer intended, but it doesn't solve the right problem.
  • 5.
    SYNTATIC ERRORS CommonErrors: • missing semicolon or brace • miss-spelled type in declaration One mistake can cause an avalanche of errors because compiler can't recover and gets confused main () { int i int j; for (i = 0; i <= 10; i++) { j = i * 7; printf("%d x 7 = %dn", i, j); } } MISSING SEMI-COLON
  • 6.
    SEMANTIC ERRORS CommonErrors: • Missing braces to group statements together • Confusing assignment with equality • Wrong assumptions about operator precedence, associativity • Wrong limits on for-loop counter • Uninitialized variables main () { int i int j; for (i = 0; i <= 10; i++) j = i * 7; printf("%d x 7 = %dn", i, j); } MISSING BRACE, So printf() is mot a part of for
  • 7.
    Algorithmic Errors Designis wrong, so program does not solve the correct problem Difficult to find • Program does what we intended • Problem might not show up until many runs of program • Maybe difficult to fix • Have to redesign, may have large impact on program code
  • 8.
    DEBUGGING PROCESS •Testing To determine if a code contains errors. • Debugging To locate the error and fix it. • Documentation To improve maintainability of the code. Include sensible comments, good coding style and clear logic Testing Error? Yes Debug
  • 9.
    • Unit testing Test of individual parts of an application – a single method, a single class, a group of classes, etc. • Positive versus negative testing Positive testing – testing of functionality that we expect to work. Negative testing – testing cases we expect to fail, and handle these cases in some controlled way (example: catch handler for exception). • Test automation Regression testing – re-running tests that have previously been passed whenever a change is made to the code. Write a test rig or a test harness.
  • 10.
    • Modularization andinterfaces Problem is broken into sub-problems and each sub-problem is tackled separately – divide-and-conquer. Such a process is called modularization. The modules are possibly implemented by different programmers, hence the need for well-defined interfaces. The signature of a method (its return type, name and parameter list) constitutes the interface. The body of the method (implementation) is hidden – abstraction. Good documentation (example: comment to describe what the method does) aids in understanding.
  • 11.
    • Manual walkthroughs Pencil-and-paper. Tracing the flow of control between classes and objects. Verbal walkthroughs • Print statements Easy to add Provide information: Which methods have been called The value of parameters The order in which methods have been called The values of local variables and fields at strategic points
  • 12.
    • Tips andtechniques Start off with a working algorithm Incremental coding/test early Simplify the problem Explain the bug to someone else Fix bugs as you find them Recognize common bugs (such as using ‘=’ instead of ‘==’, using ‘==’ instead of equals( ), dereferencing null, etc.) Recompile everything Test boundaries Test exceptional conditions Take a break
  • 13.
    DEBUGGER A debuggeror debugging tool is a computer program that is used to test and debug other programs (the "target" program). Typically, debuggers offer a query processor, symbol resolver, expression interpreter, and debug support interface at its top level.
  • 14.
    DEBUGGING TECHNIQUES •Execution tracing -running the program -print -trace utilities -single stepping in debugger -hand simulation
  • 15.
    • Interface checking -check procedure parameter number/type (if not enforced by compiler) and value -defensive programming: check inputs/results from other modules -documents assumptions about caller/callee relationships in modules, communication protocols, etc.
  • 16.
    • Assertions: includerange constraints or other information with data. • Skipping code: comment out suspect code, then check if error remains.
  • 17.
    • Other Techniques:- -Disassembly (in context and with live data!) -Execution Tracing/Stack tracing -Symbol watches
  • 18.
    DISASSEMBLY • Mostbasic form of debugging • Translating machine code into assembly instructions that are more easily understood by the user. • Typically implementable as a simple lookup table • No higher-level information (variable names, etc.) • Relatively easy to implement.
  • 19.
    EXECUTION TRACING •Follows the program through the execution. Users can step through line-by-line, or use breakpoints. • Typically allows for “watches” on – registers, memory locations, symbols • Allows for tracing up the stack of runtime errors (back traces) • Allows user to trace the causes of unexpected behavior and fix them
  • 20.
    LIST OF DEBUGGERS Some widely used debuggers are • GNU Debugger (GDB) • Intel Debugger (IDB) • LLDB • Microsoft Visual Studio Debugger • Valgrind • WinDbg
  • 21.
  • 22.
  • 23.