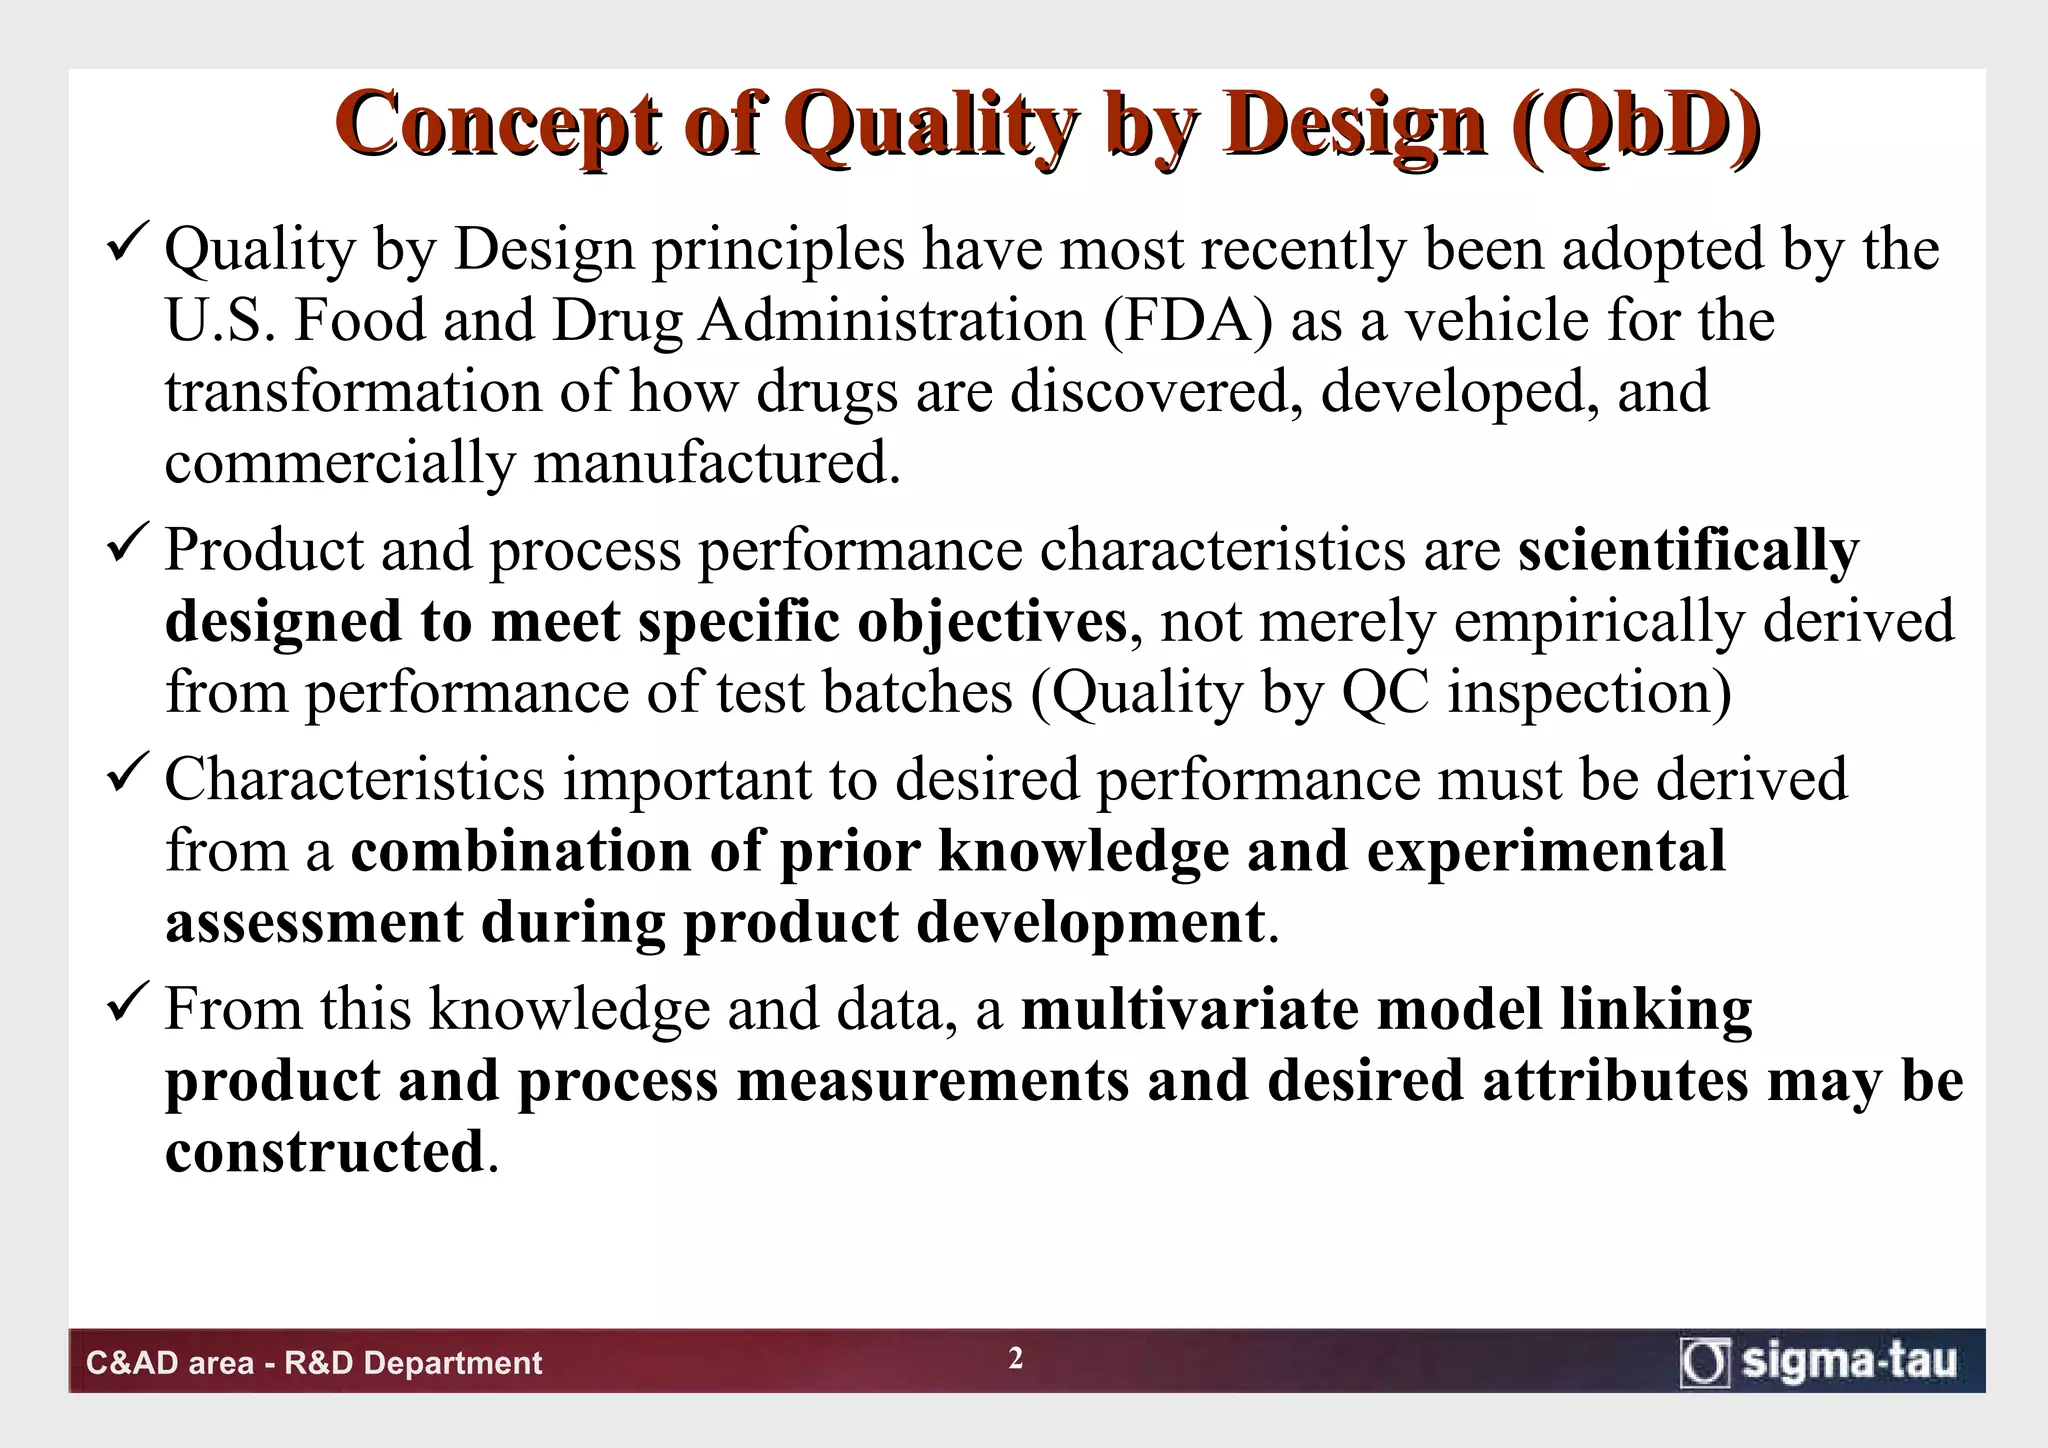
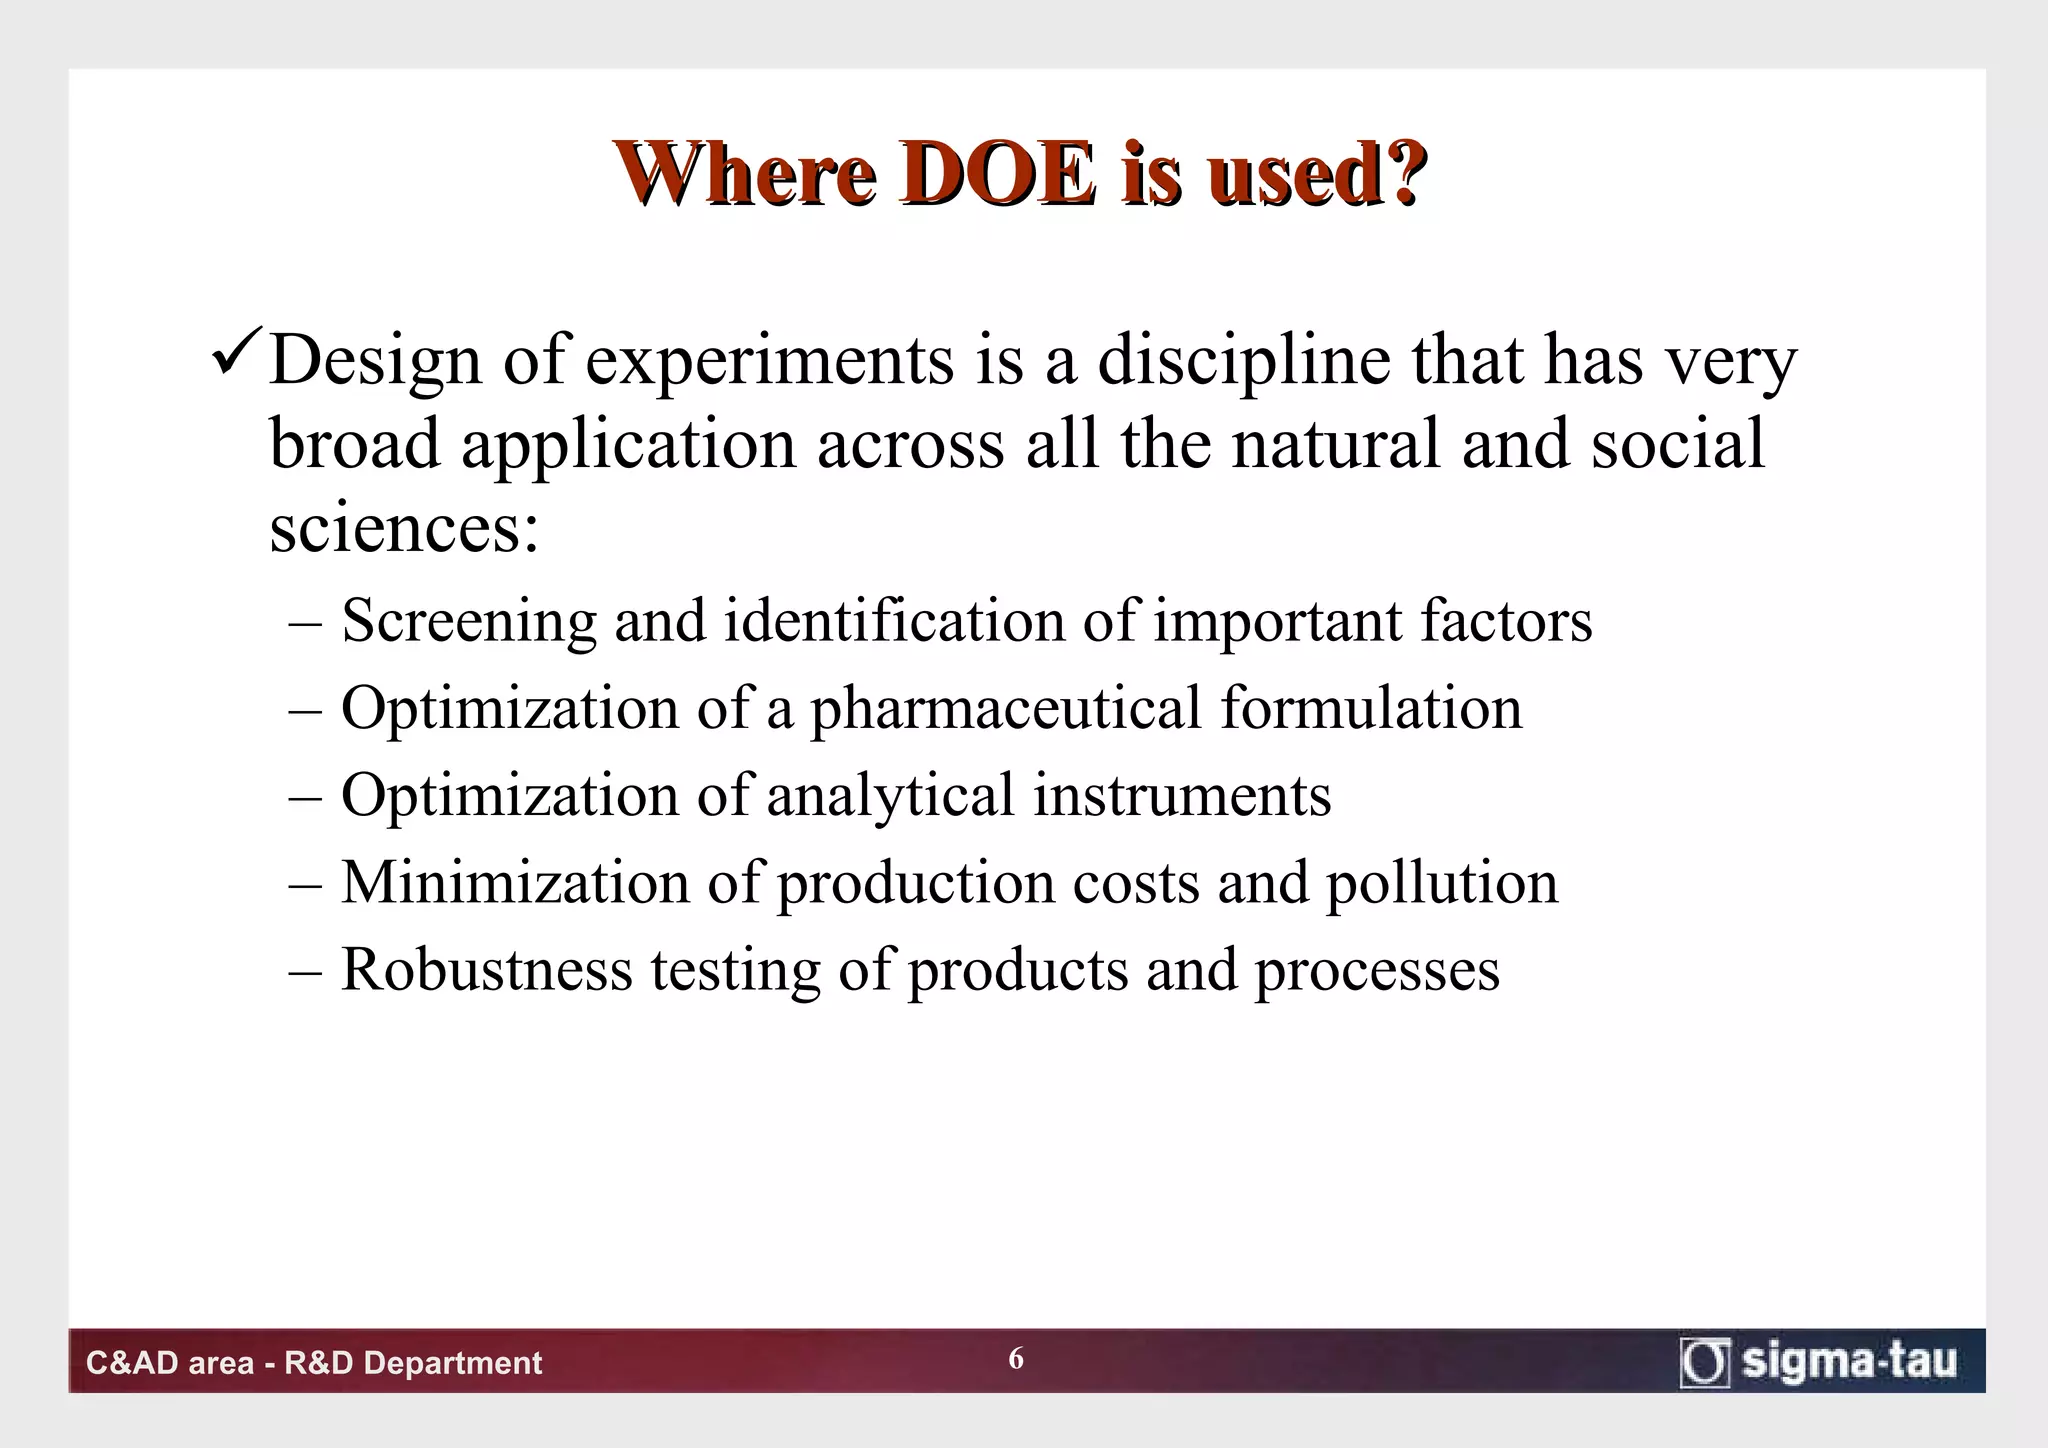
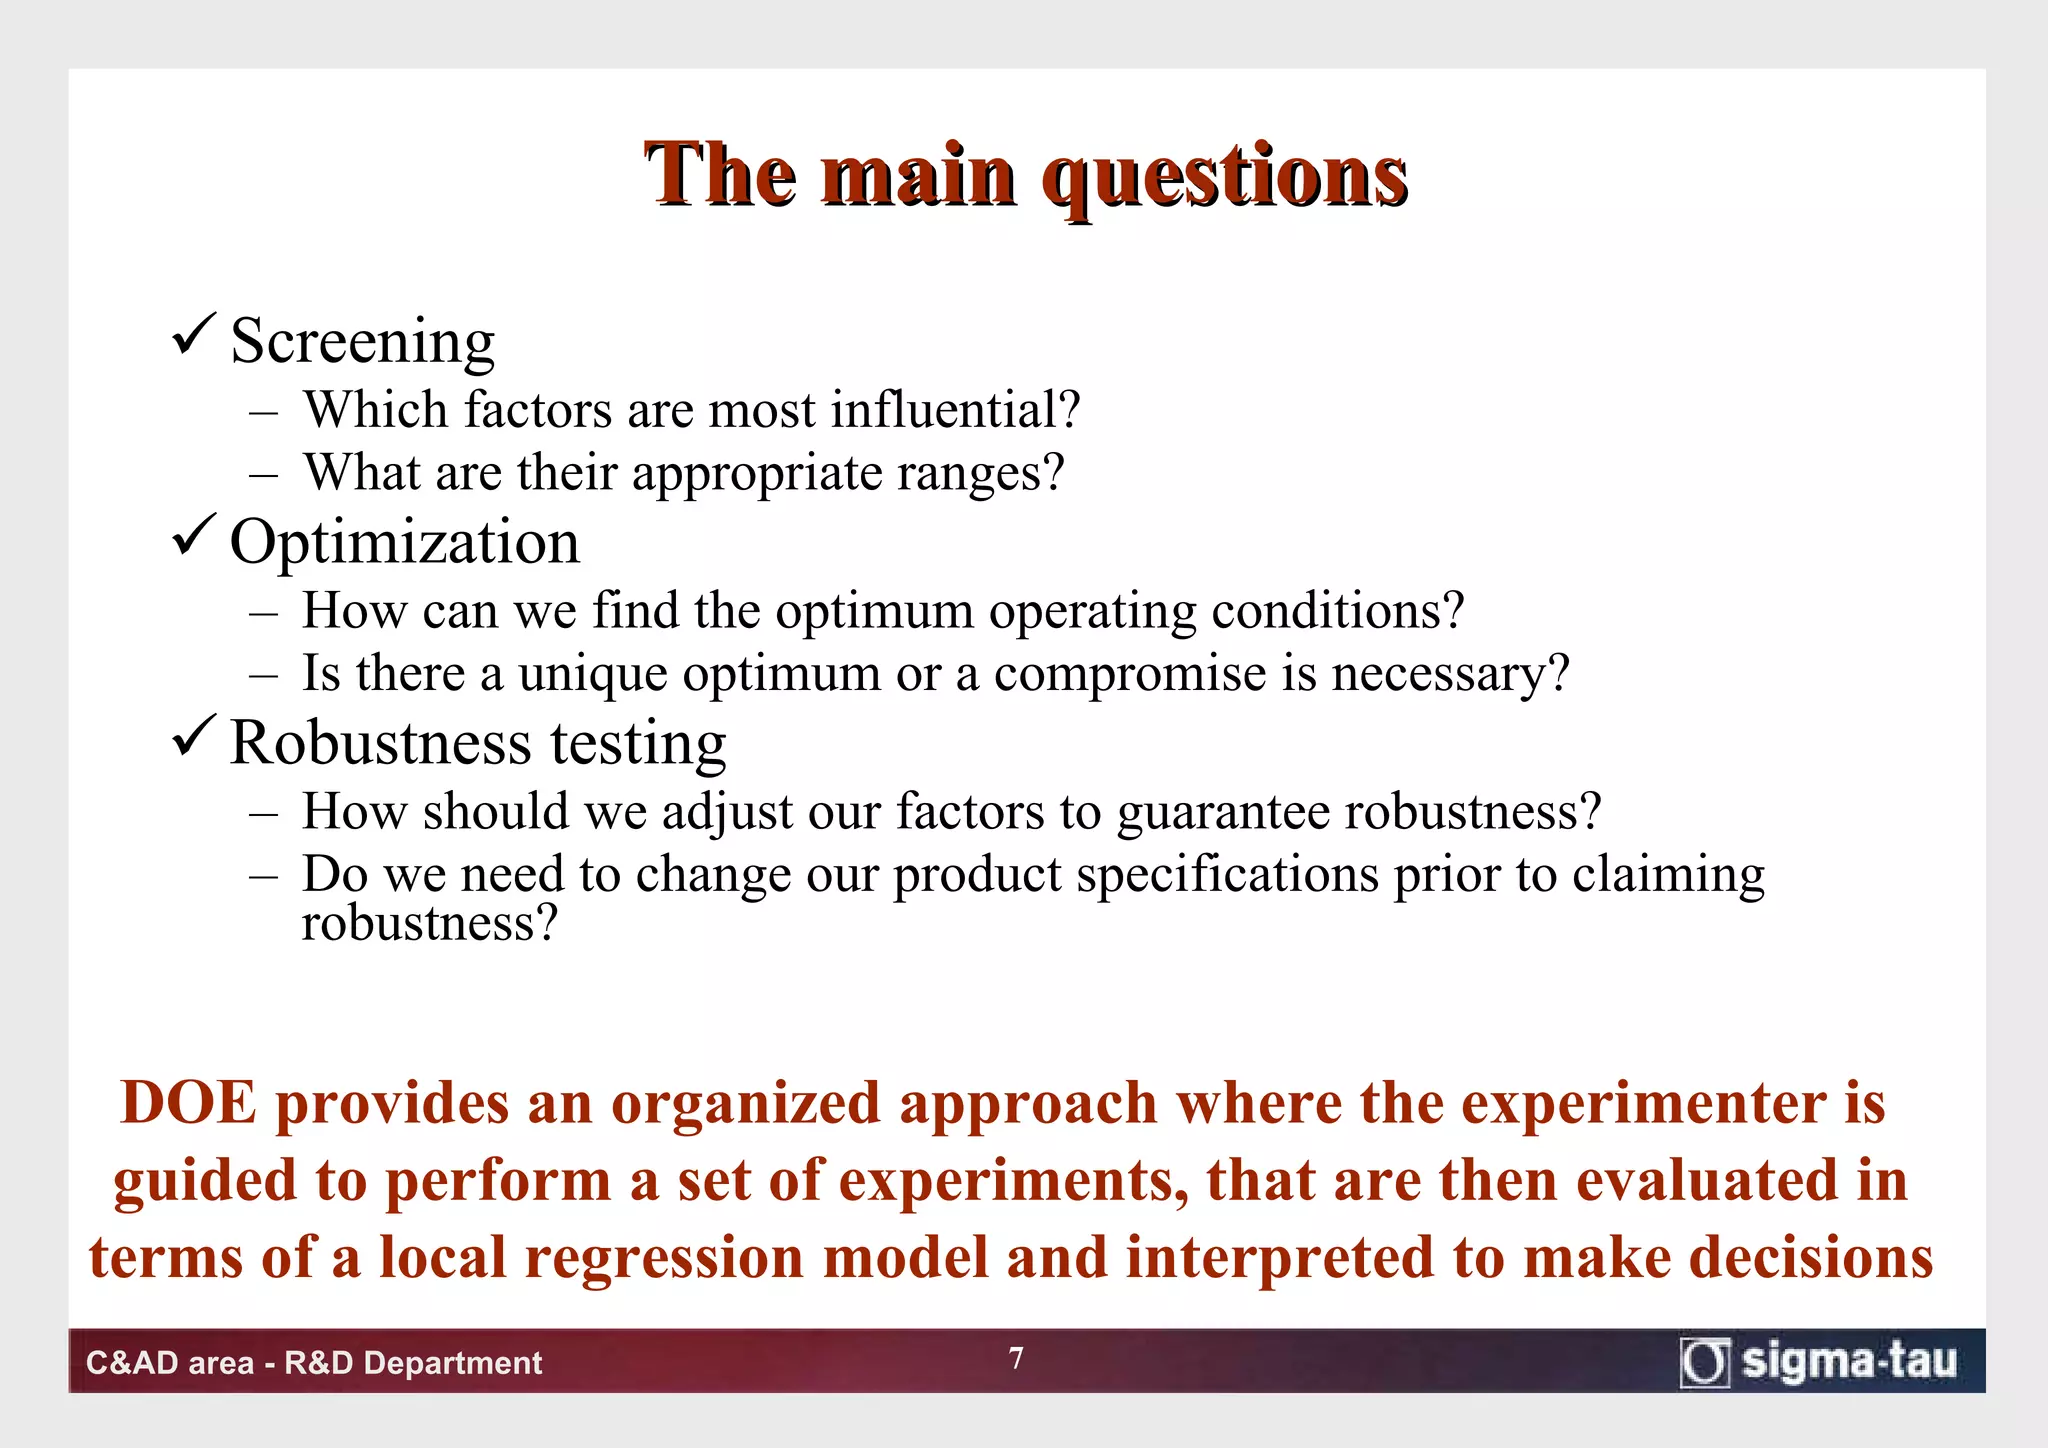
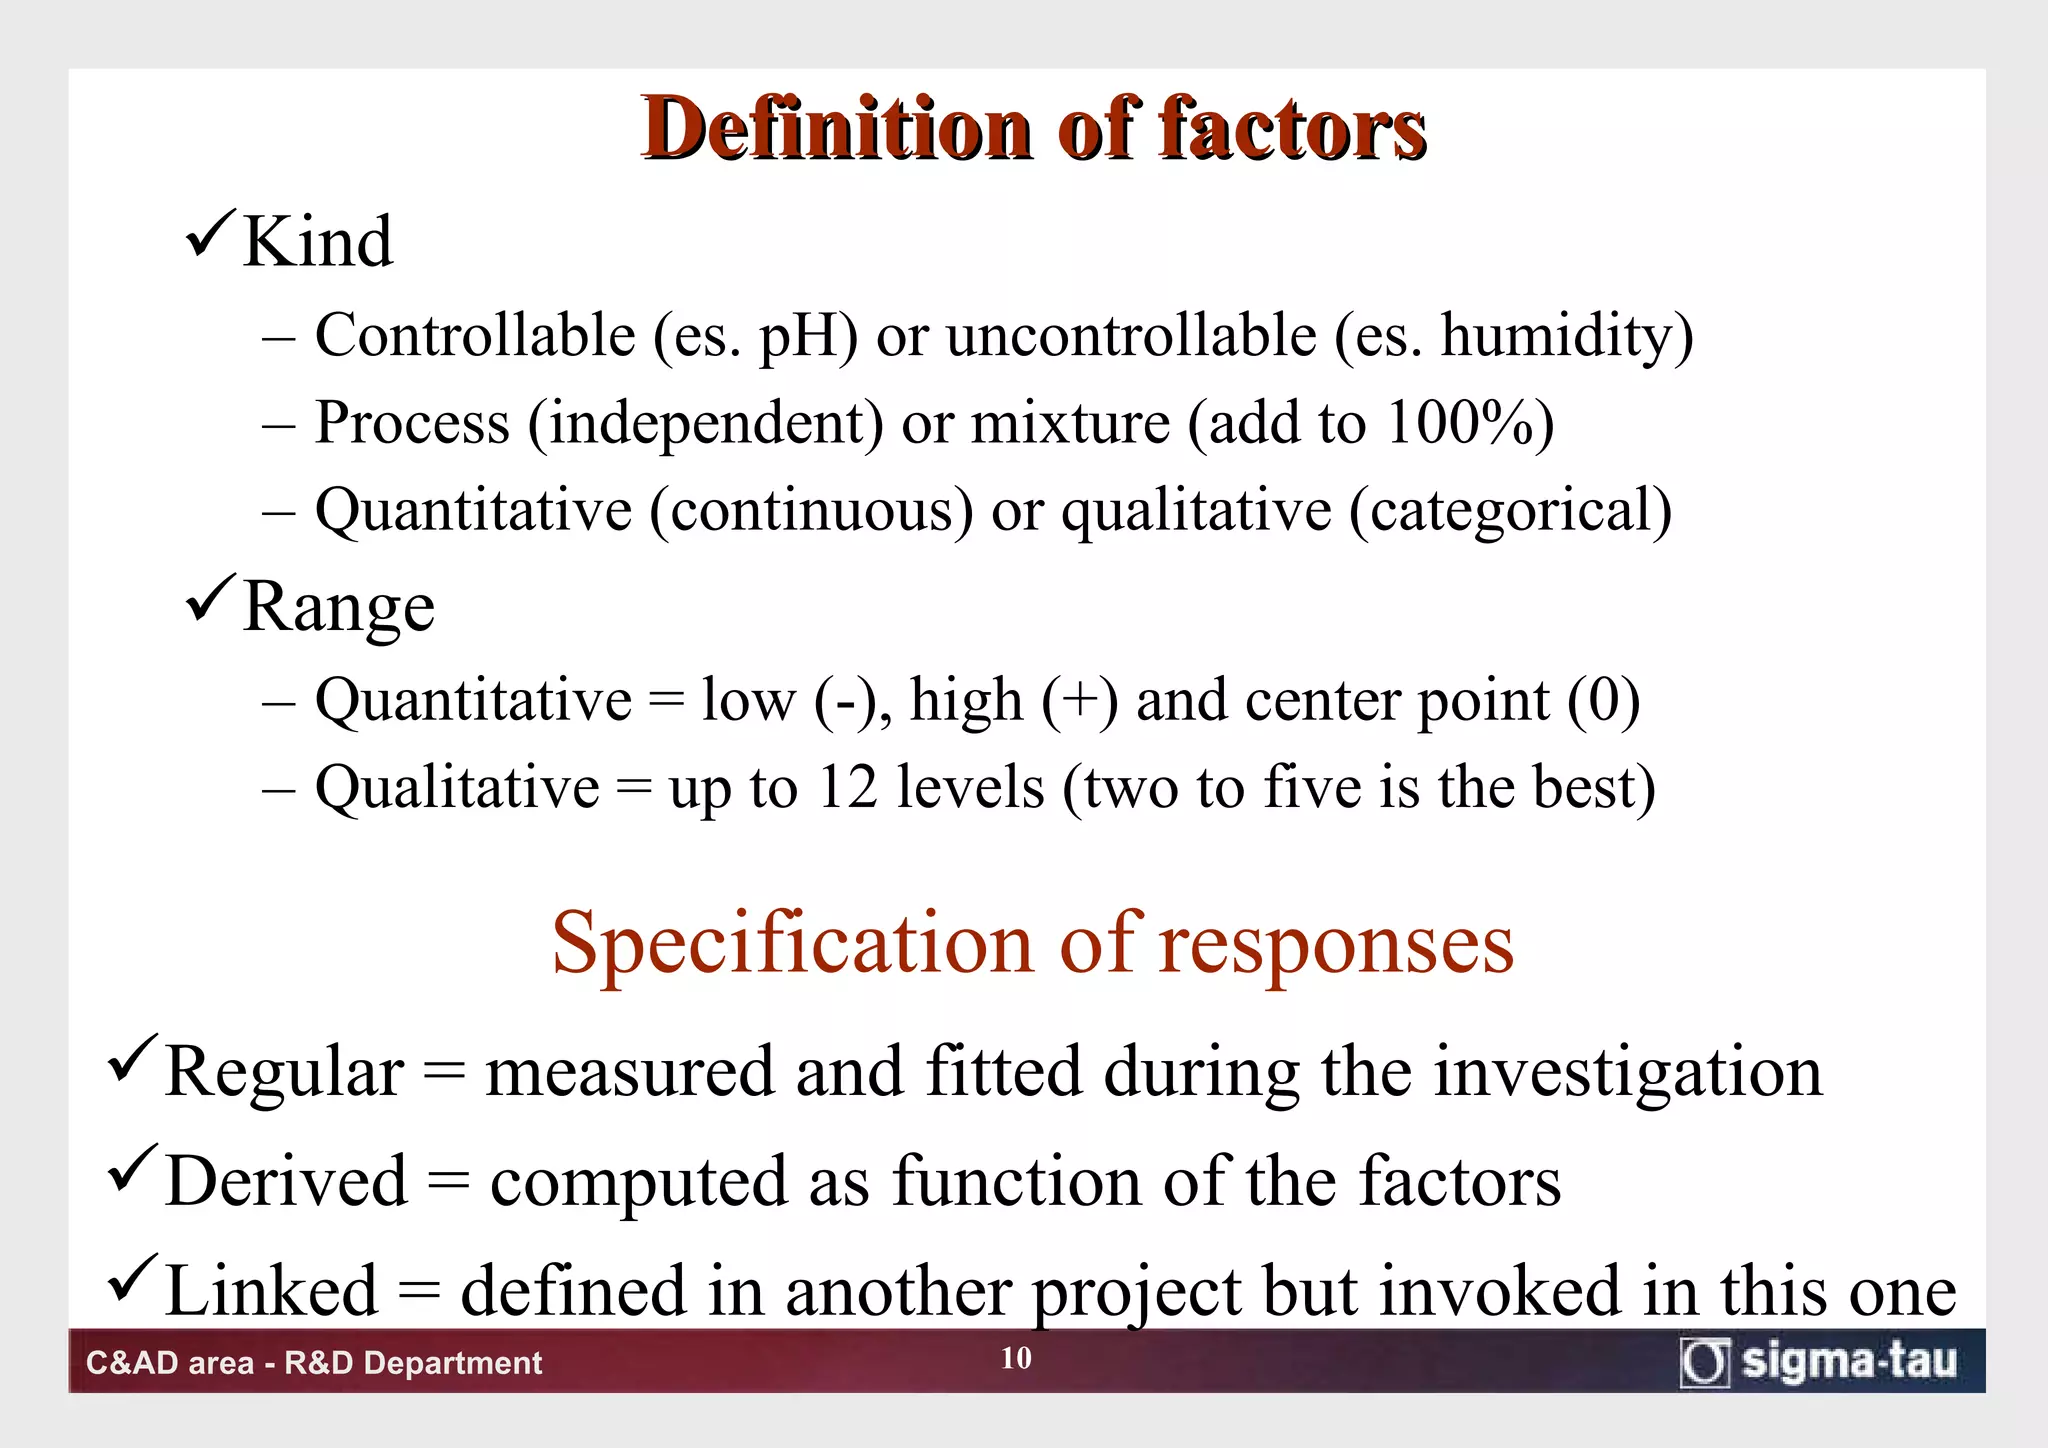
KEMBAR78
design of experiments | PPT
Design of Experiments (DOE) G.Gallo 11 marzo 2009
Concept of Quality by Design (QbD) Quality by Design principles have most recently been adopted by the U.S. Food and Drug Administration (FDA) as a vehicle for the transformation of how drugs are discovered, developed, and commercially manufactured.  Product and process performance characteristics are  scientifically designed to meet specific objectives , not merely empirically derived from performance of test batches (Quality by QC inspection) Characteristics important to desired performance must be derived from a  combination of prior knowledge and experimental assessment during product development . From this knowledge and data, a  multivariate model linking product and process measurements and desired attributes may be constructed .
Process analytical technology ( PAT ) PAT has been defined by the United States Food and Drug Administration (FDA) as a mechanism to design, analyze, and control pharmaceutical manufacturing processes through the measurement of  critical process parameters (CPP) which affect Critical Quality Attributes  The goal of PAT is to understand and control the manufacturing process, which is consistent with our current drug quality system: “ quality can not be tested into products; it has to be built in by design ”(ICH Q8, Step 2 Document) In 2006, Merck & Co.’s Januvia became the first product approved based upon such an application
Different methods COST approach: to change the value of one factor at a time until there no further improvement. DOE approach: to construct a carefully selected set of experiments in which all relevant factors are varied simultaneously. Changing a single factor a time doesn’t necessarily provide information about the optimum conditions in particular when there are interactions between factors. BUT
DOE The first statistician to consider a formal mathematical methodology for designing experiments was Sir Ronald A. Fisher, in his landmark  The Design of Experiments . (1935) As an example, he described how to test the hypothesis that a  certain lady could distinguish by flavour alone whether the milk or the tea was first placed in the cup.  While this sounds like a frivolous application, it allowed him to illustrate the most important means of experimental design. In 1950, Gertrude Mary Cox and William Gemmell Cochran published the book  Experimental Designs  which became the major reference work on the design of experiments for statisticians for years afterwards.
Where DOE is used? Design of experiments is a discipline that has very broad application across all the natural and social sciences:  Screening and identification of important factors Optimization of a pharmaceutical formulation Optimization of analytical instruments Minimization of production costs and pollution Robustness testing of products and processes
The main questions Screening Which factors are most influential? What are their appropriate ranges? Optimization How can we find the optimum operating conditions? Is there a unique optimum or a compromise is necessary? Robustness testing How should we adjust our factors to guarantee robustness? Do we need to change our product specifications prior to claiming robustness? DOE provides an organized approach where the experimenter is  guided to perform a set of experiments, that are then evaluated in terms of a local regression model and interpreted to make decisions
Common steps in DOE
Screening  You are able to extract a yes or no answer with regard to the influence of a particular factor.  Pareto principle: 80% of effects are caused by 20% of factors Information is gained about how to modify the settings of the important factors to possibly further enhance the results.  It needs few experiments in relation to the number of factors.
Definition of factors Kind Controllable (es. pH) or uncontrollable (es. humidity) Process (independent) or mixture (add to 100%) Quantitative (continuous) or qualitative (categorical) Range Quantitative = low (-), high (+) and center point (0) Qualitative = up to 12 levels (two to five is the best) Specification of responses Regular = measured and fitted during the investigation Derived = computed as function of the factors Linked = defined in another project but invoked in this one
N°Experiments X1 X2 X3 1 - - - 2 2  full factorial design   2 + - -   replicate experiments   3 - + - 2 3  full factorial design   4 + + - 2 3-1  fractional factorial design 5 - - + 6 + - + 7 - + + 8 + + + 9 0  0 0   10 0 0 0   11 0 0 0
Example 1: Reduction of enamines to saturated amines by formic acid Two factors varied Three responses measured Yield of side product Unreacted starting material Yield of desired product The response Y3 should be maximized A 2 2  full factorial design was applied
Example 1: (continued) Main and interaction effects were considered: Yield raises with temperature and decreases with the increase of molar ratio  Molar ratio effect depends on temperature (mild interaction)
Computation of effects - Least square analysis Seeking the model that minimizes the sum of the squares of the residuals Multiple linear regression applied to the modelling of several factors Y3= aX1+bX2+c  Regression coefficients are scaled and centered. Low confidence interval depends on the quality of the design. Parameters : R 2  (green) is a measure of goodness of fit  Q 2  (blue)   is a measure of goodness of prediction ( >0.5) difference R 2-  Q 2  <0.2-0.3 Model validity (yellow) ( >0.25) Reproducibility (cyan)( >0.5)
Causes of poor models Curvature Quadratic terms to be optimized Skew response distribution Logaritmic transformation or NegLog  Bad replicates Control of experimental set-up Deviating experiments Outliers outsite  ±  4 standard deviations
Optimization You are able to extract detailed information regarding how the factors combine to influence the responses. Positive or negative relation between factor and response Linear or quadratic relation  It requires additional experiments in relation to the number of investigated factors. Central composite design (CCC) or face-centered design (CCF) A response surface modelling  (RSM) allows: Prediction of response values for any factor setting in the experimental region  Identification of the factor setting corresponding to the optimal point
Response contour plot Allows the use of model to make decisions Can compare simultaneously more than one response Can visualize a conflict in the choice of factor variation Allows the choise of further validating experiments Gradient techniques  Optimizer
Robustness testing It is possible to: Identify those factors that might have an effect on the results Regulate these factors to maintain the results within the specifications  Determine the sensitivity of the responses to small changes in the factors
Example 2: Quality documentation of a HPLC system Five factors varied Four quantitative One qualitative Three responses measured The resolution  is constantly maintained = 1.5 or greater  A linear model is applied  2 5-2  fractional factorial design Eight experiments Four repicates, two for each column
Example 2: (continued) To evaluate data distribution of the responses To verify an extremely weak relationship between factors and resolution To predict the response values of most extreme experiments To reformulate the factor settings so that robustness can be obtained
Selection of the model and generation of design Screening Linear and interaction models Full or fractional factorial design Optimization Quadratic model  Composite design Robustness testing Linear models Full or fractional factorial design
Bibliography MODDE software – Umetrics  www.umetrics.com   Eriksson L. et al.  Design of experiments  –Umetrics Carlson R.&Carlson J.  Design and optimization in organic synthesis . Vol 24 Elsevier 2005 Andersson M. et al  Multivariate methods in tablet formulation  suitable for early drug discovery: Predictive models from a screening design of several linked responses, Chemometrics and Intelligent Laboratory System , 87, 2007, 151-156

design of experiments

  • 1.
    Design of Experiments(DOE) G.Gallo 11 marzo 2009
  • 2.
    Concept of Qualityby Design (QbD) Quality by Design principles have most recently been adopted by the U.S. Food and Drug Administration (FDA) as a vehicle for the transformation of how drugs are discovered, developed, and commercially manufactured. Product and process performance characteristics are scientifically designed to meet specific objectives , not merely empirically derived from performance of test batches (Quality by QC inspection) Characteristics important to desired performance must be derived from a combination of prior knowledge and experimental assessment during product development . From this knowledge and data, a multivariate model linking product and process measurements and desired attributes may be constructed .
  • 3.
    Process analytical technology( PAT ) PAT has been defined by the United States Food and Drug Administration (FDA) as a mechanism to design, analyze, and control pharmaceutical manufacturing processes through the measurement of critical process parameters (CPP) which affect Critical Quality Attributes The goal of PAT is to understand and control the manufacturing process, which is consistent with our current drug quality system: “ quality can not be tested into products; it has to be built in by design ”(ICH Q8, Step 2 Document) In 2006, Merck & Co.’s Januvia became the first product approved based upon such an application
  • 4.
    Different methods COSTapproach: to change the value of one factor at a time until there no further improvement. DOE approach: to construct a carefully selected set of experiments in which all relevant factors are varied simultaneously. Changing a single factor a time doesn’t necessarily provide information about the optimum conditions in particular when there are interactions between factors. BUT
  • 5.
    DOE The firststatistician to consider a formal mathematical methodology for designing experiments was Sir Ronald A. Fisher, in his landmark The Design of Experiments . (1935) As an example, he described how to test the hypothesis that a certain lady could distinguish by flavour alone whether the milk or the tea was first placed in the cup. While this sounds like a frivolous application, it allowed him to illustrate the most important means of experimental design. In 1950, Gertrude Mary Cox and William Gemmell Cochran published the book Experimental Designs which became the major reference work on the design of experiments for statisticians for years afterwards.
  • 6.
    Where DOE isused? Design of experiments is a discipline that has very broad application across all the natural and social sciences: Screening and identification of important factors Optimization of a pharmaceutical formulation Optimization of analytical instruments Minimization of production costs and pollution Robustness testing of products and processes
  • 7.
    The main questionsScreening Which factors are most influential? What are their appropriate ranges? Optimization How can we find the optimum operating conditions? Is there a unique optimum or a compromise is necessary? Robustness testing How should we adjust our factors to guarantee robustness? Do we need to change our product specifications prior to claiming robustness? DOE provides an organized approach where the experimenter is guided to perform a set of experiments, that are then evaluated in terms of a local regression model and interpreted to make decisions
  • 8.
  • 9.
    Screening Youare able to extract a yes or no answer with regard to the influence of a particular factor. Pareto principle: 80% of effects are caused by 20% of factors Information is gained about how to modify the settings of the important factors to possibly further enhance the results. It needs few experiments in relation to the number of factors.
  • 10.
    Definition of factorsKind Controllable (es. pH) or uncontrollable (es. humidity) Process (independent) or mixture (add to 100%) Quantitative (continuous) or qualitative (categorical) Range Quantitative = low (-), high (+) and center point (0) Qualitative = up to 12 levels (two to five is the best) Specification of responses Regular = measured and fitted during the investigation Derived = computed as function of the factors Linked = defined in another project but invoked in this one
  • 11.
    N°Experiments X1 X2X3 1 - - - 2 2 full factorial design 2 + - - replicate experiments 3 - + - 2 3 full factorial design 4 + + - 2 3-1 fractional factorial design 5 - - + 6 + - + 7 - + + 8 + + + 9 0 0 0 10 0 0 0 11 0 0 0
  • 12.
    Example 1: Reductionof enamines to saturated amines by formic acid Two factors varied Three responses measured Yield of side product Unreacted starting material Yield of desired product The response Y3 should be maximized A 2 2 full factorial design was applied
  • 13.
    Example 1: (continued)Main and interaction effects were considered: Yield raises with temperature and decreases with the increase of molar ratio Molar ratio effect depends on temperature (mild interaction)
  • 14.
    Computation of effects- Least square analysis Seeking the model that minimizes the sum of the squares of the residuals Multiple linear regression applied to the modelling of several factors Y3= aX1+bX2+c Regression coefficients are scaled and centered. Low confidence interval depends on the quality of the design. Parameters : R 2 (green) is a measure of goodness of fit Q 2 (blue) is a measure of goodness of prediction ( >0.5) difference R 2- Q 2 <0.2-0.3 Model validity (yellow) ( >0.25) Reproducibility (cyan)( >0.5)
  • 15.
    Causes of poormodels Curvature Quadratic terms to be optimized Skew response distribution Logaritmic transformation or NegLog Bad replicates Control of experimental set-up Deviating experiments Outliers outsite ± 4 standard deviations
  • 16.
    Optimization You areable to extract detailed information regarding how the factors combine to influence the responses. Positive or negative relation between factor and response Linear or quadratic relation It requires additional experiments in relation to the number of investigated factors. Central composite design (CCC) or face-centered design (CCF) A response surface modelling (RSM) allows: Prediction of response values for any factor setting in the experimental region Identification of the factor setting corresponding to the optimal point
  • 17.
    Response contour plotAllows the use of model to make decisions Can compare simultaneously more than one response Can visualize a conflict in the choice of factor variation Allows the choise of further validating experiments Gradient techniques Optimizer
  • 18.
    Robustness testing Itis possible to: Identify those factors that might have an effect on the results Regulate these factors to maintain the results within the specifications Determine the sensitivity of the responses to small changes in the factors
  • 19.
    Example 2: Qualitydocumentation of a HPLC system Five factors varied Four quantitative One qualitative Three responses measured The resolution is constantly maintained = 1.5 or greater A linear model is applied 2 5-2 fractional factorial design Eight experiments Four repicates, two for each column
  • 20.
    Example 2: (continued)To evaluate data distribution of the responses To verify an extremely weak relationship between factors and resolution To predict the response values of most extreme experiments To reformulate the factor settings so that robustness can be obtained
  • 21.
    Selection of themodel and generation of design Screening Linear and interaction models Full or fractional factorial design Optimization Quadratic model Composite design Robustness testing Linear models Full or fractional factorial design
  • 22.
    Bibliography MODDE software– Umetrics www.umetrics.com Eriksson L. et al. Design of experiments –Umetrics Carlson R.&Carlson J. Design and optimization in organic synthesis . Vol 24 Elsevier 2005 Andersson M. et al Multivariate methods in tablet formulation suitable for early drug discovery: Predictive models from a screening design of several linked responses, Chemometrics and Intelligent Laboratory System , 87, 2007, 151-156