The document discusses improvements made to Kafka's at-least-once performance at Uber, highlighting various optimizations aimed at enhancing throughput and reducing latency. Key enhancements include increasing consumer fetch sizes, garbage collection adjustments, protocol changes, and optimizations to I/O operations. As a result, significant latency reductions were achieved, with production benchmarks showing p99 latency improving from ~70 ms to less than 20 ms and p50 latency from ~15 ms to 3-4 ms.
Kafka at Uber
●Use cases
○ General Pub-Sub
○ Stream Processing
○ Ingestion
○ Database Changelog Transport
○ Logging
● Scale
○ Trillion+ messages / day
○ Tens of thousands of topics
3.
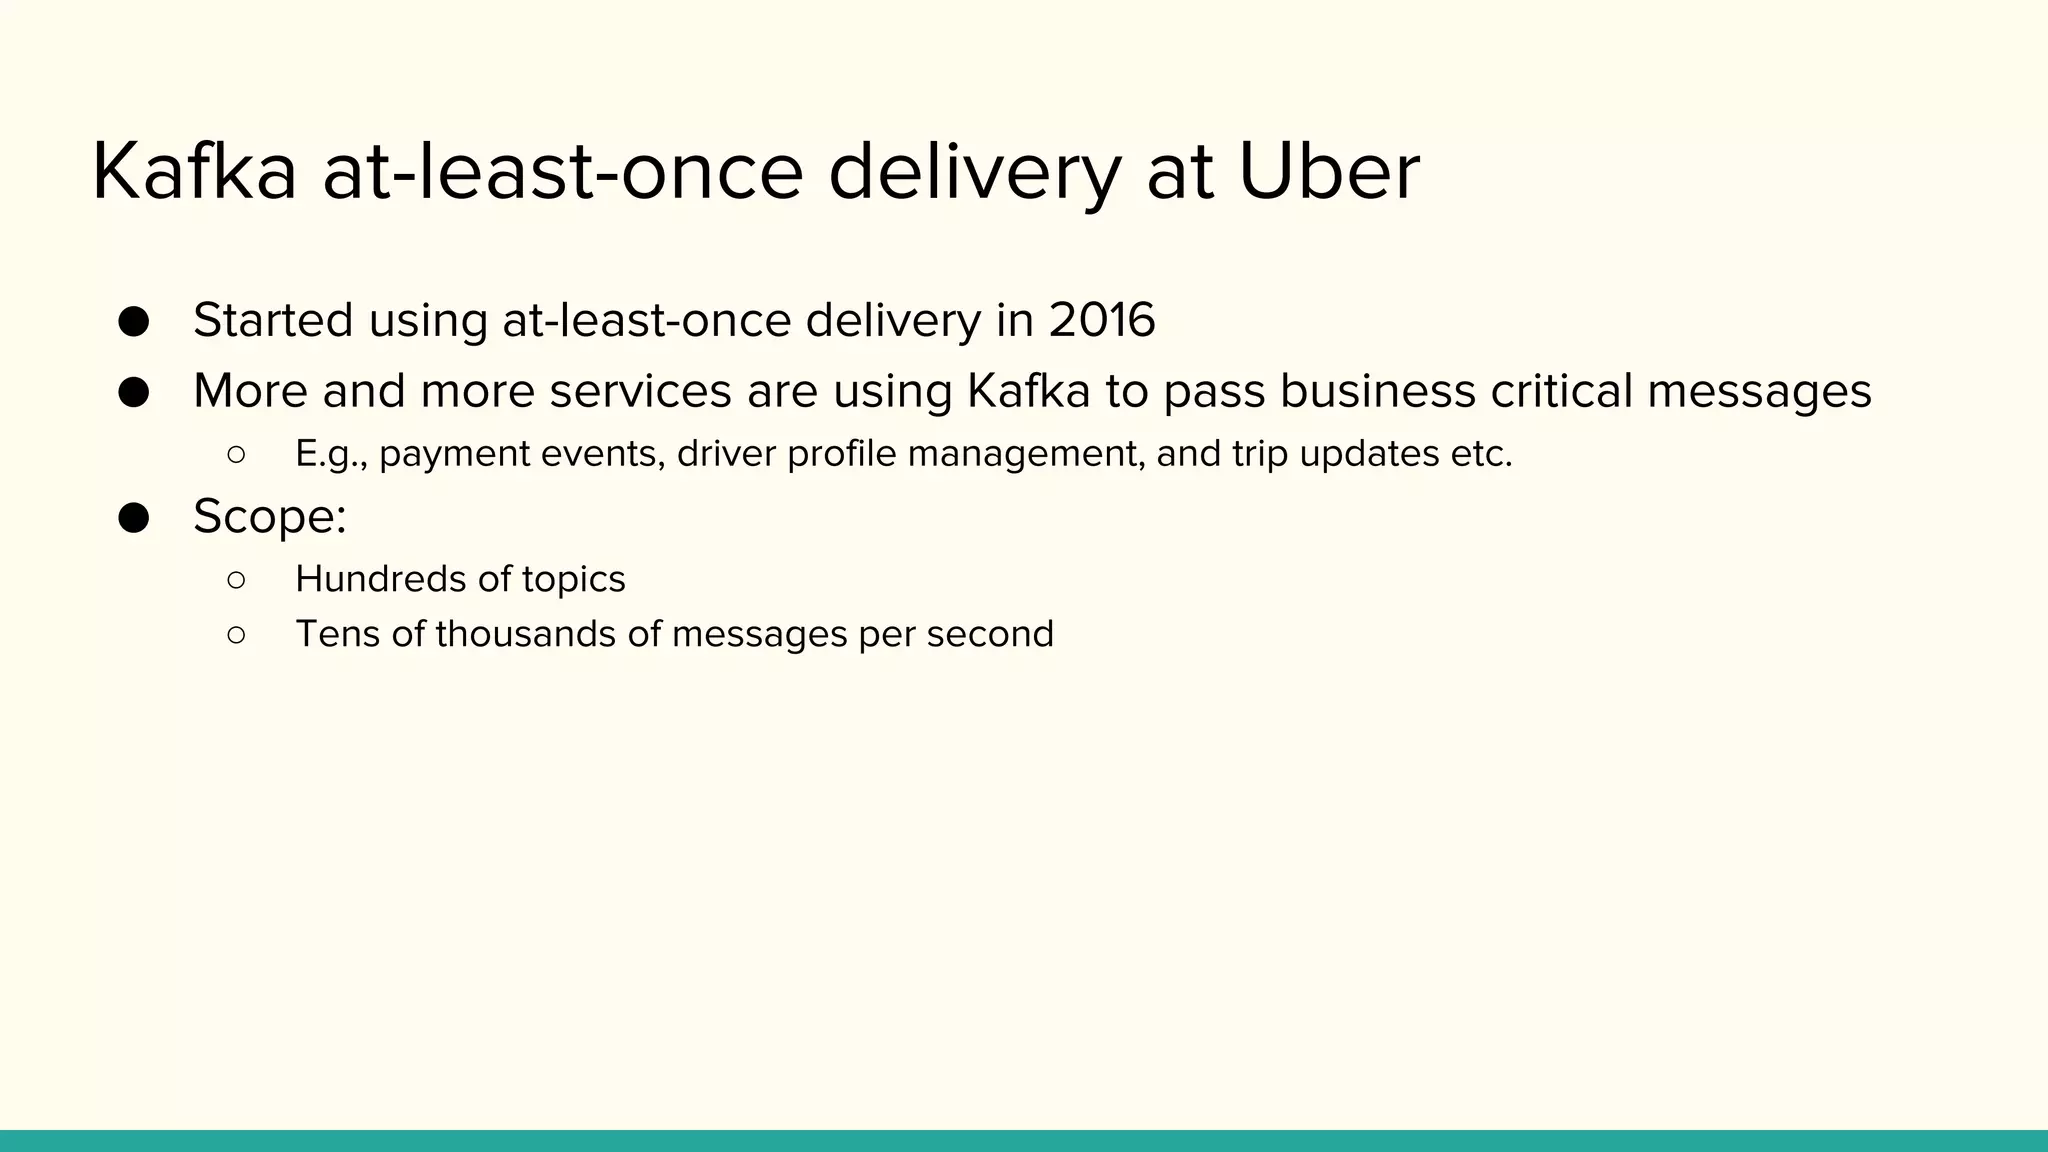
Kafka at-least-once deliveryat Uber
● Started using at-least-once delivery in 2016
● More and more services are using Kafka to pass business critical messages
○ E.g., payment events, driver profile management, and trip updates etc.
● Scope:
○ Hundreds of topics
○ Tens of thousands of messages per second
4.
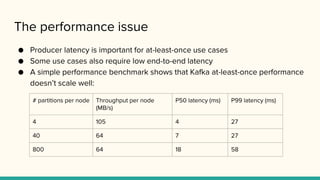
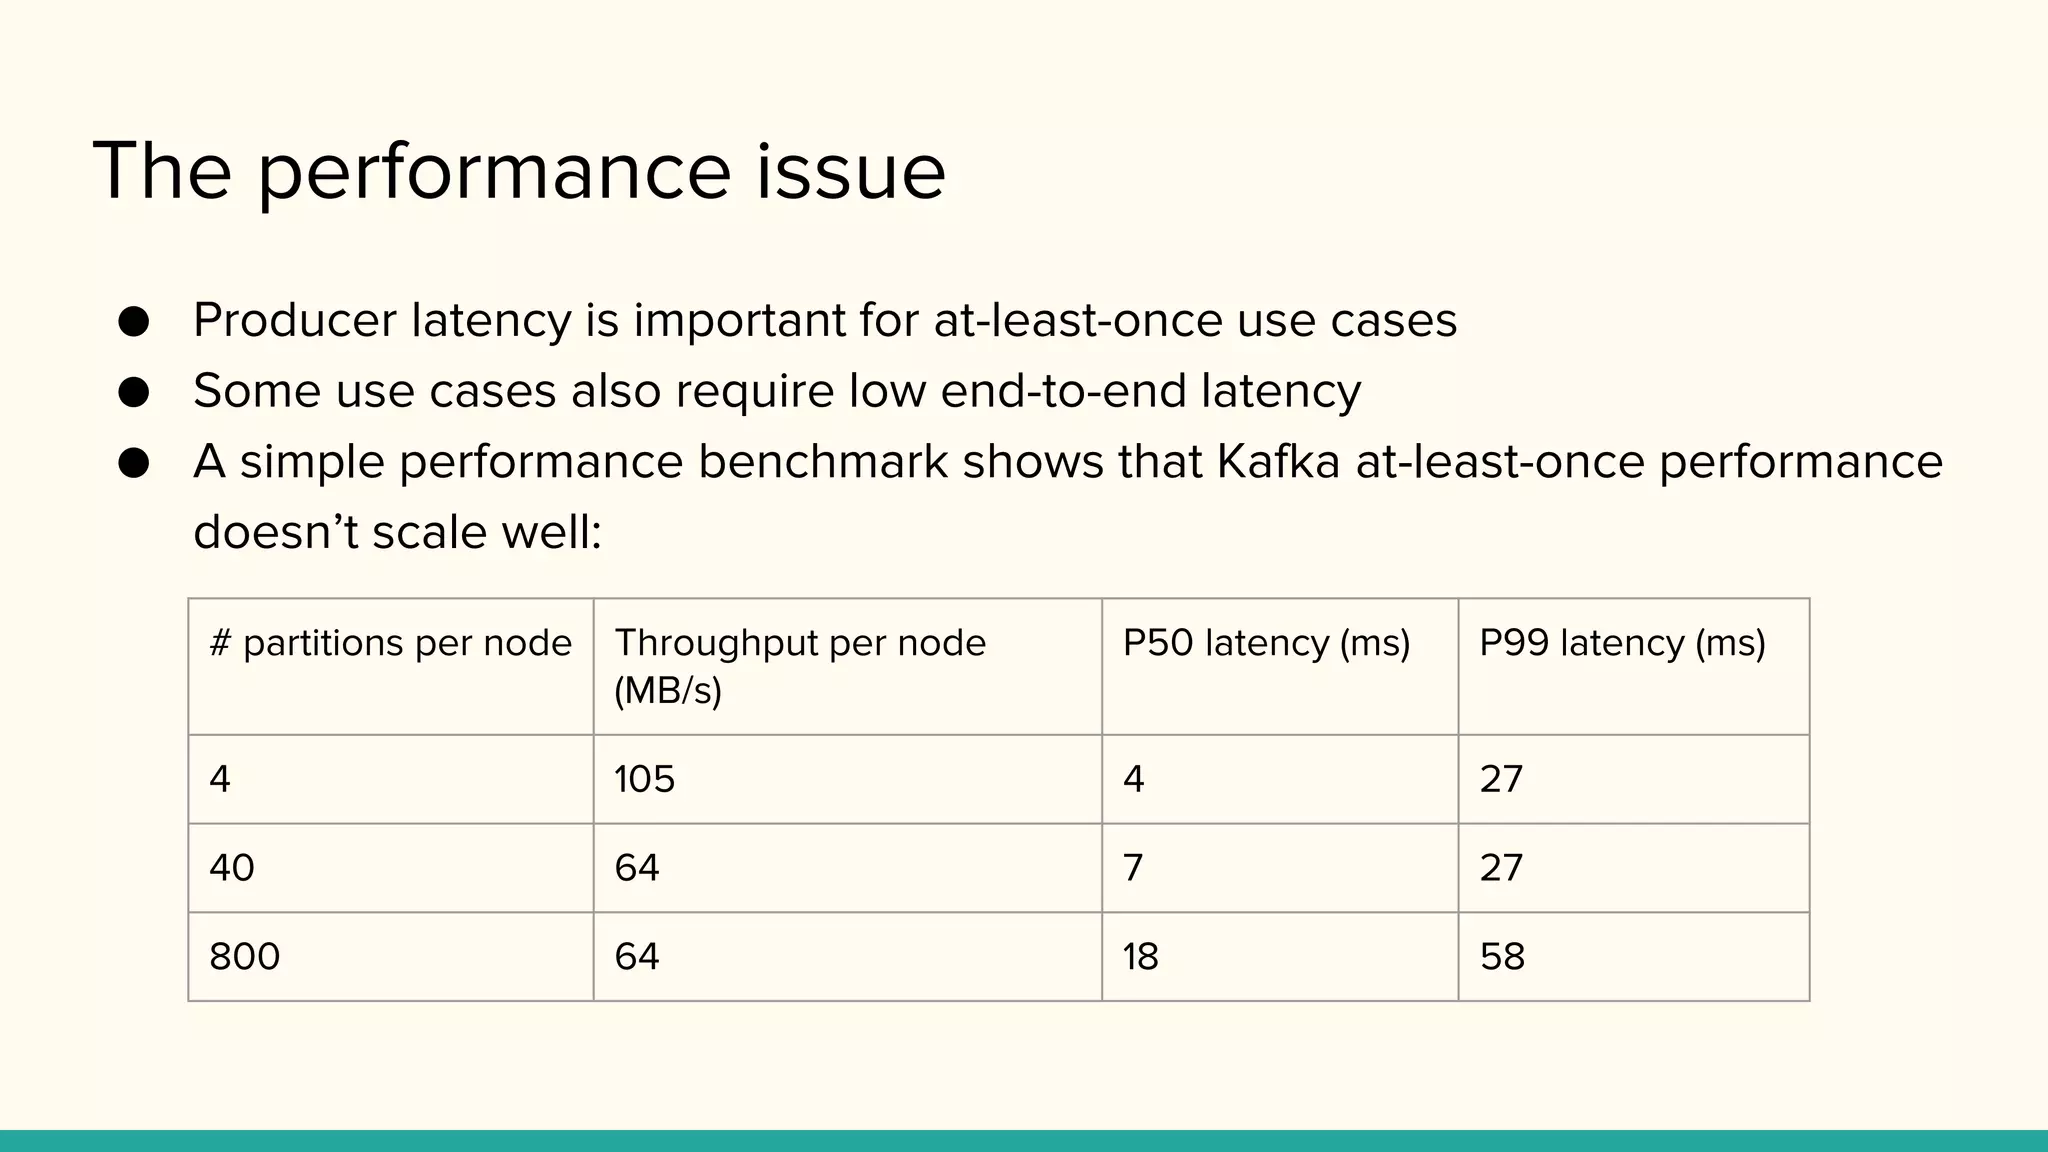
The performance issue
●Producer latency is important for at-least-once use cases
● Some use cases also require low end-to-end latency
● A simple performance benchmark shows that Kafka at-least-once performance
doesn’t scale well:
# partitions per node Throughput per node
(MB/s)
P50 latency (ms) P99 latency (ms)
4 105 4 27
40 64 7 27
800 64 18 58
5.
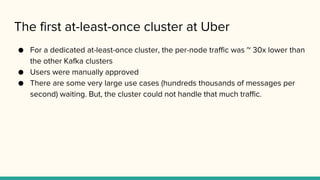
The first at-least-oncecluster at Uber
● For a dedicated at-least-once cluster, the per-node traffic was ~ 30x lower than
the other Kafka clusters
● Users were manually approved
● There are some very large use cases (hundreds thousands of messages per
second) waiting. But, the cluster could not handle that much traffic.
6.
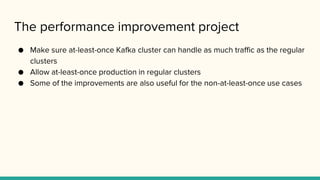
The performance improvementproject
● Make sure at-least-once Kafka cluster can handle as much traffic as the regular
clusters
● Allow at-least-once production in regular clusters
● Some of the improvements are also useful for the non-at-least-once use cases
7.
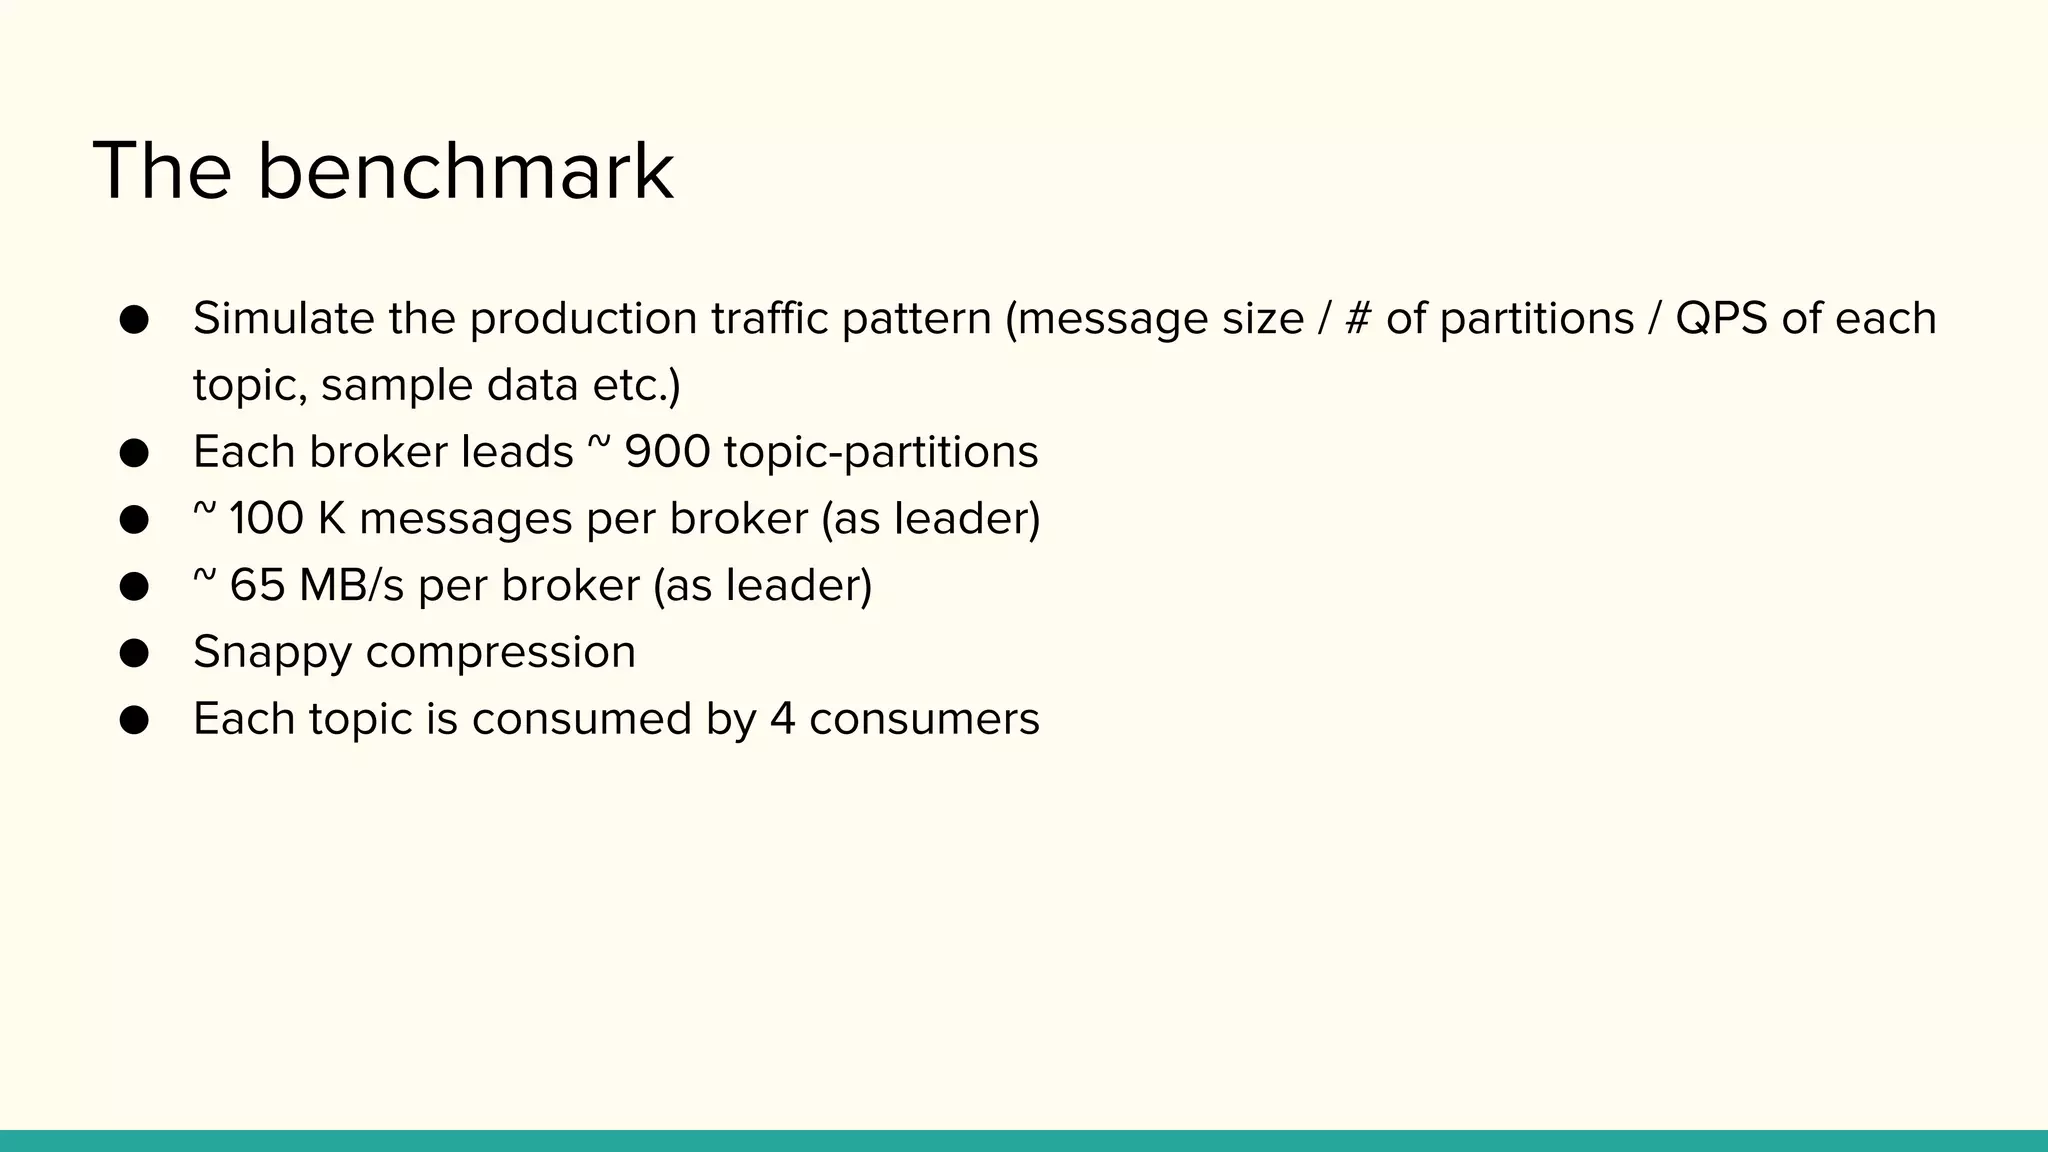
The benchmark
● Simulatethe production traffic pattern (message size / # of partitions / QPS of each
topic, sample data etc.)
● Each broker leads ~ 900 topic-partitions
● ~ 100 K messages per broker (as leader)
● ~ 65 MB/s per broker (as leader)
● Snappy compression
● Each topic is consumed by 4 consumers
8.
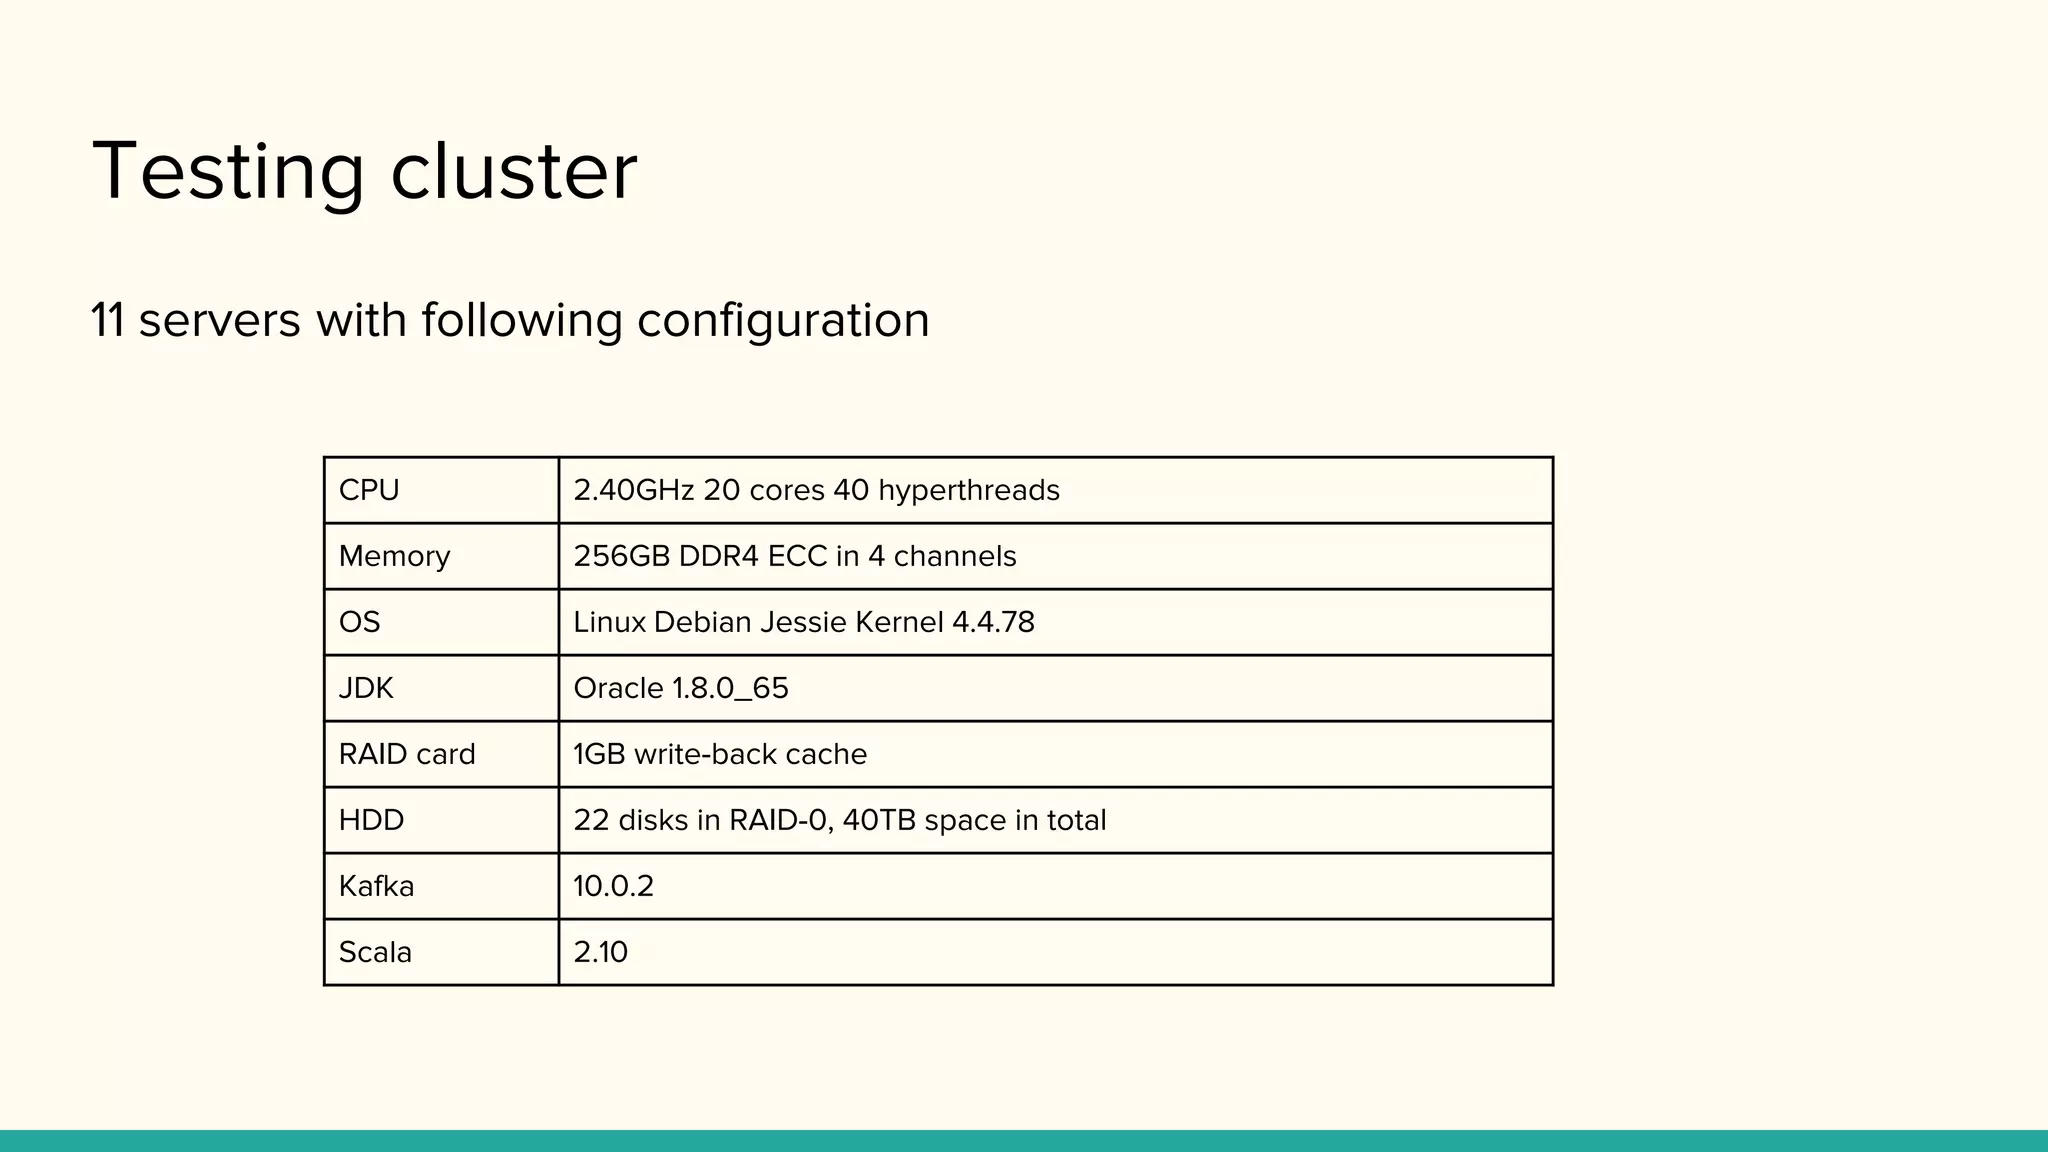
Testing cluster
11 serverswith following configuration
CPU 2.40GHz 20 cores 40 hyperthreads
Memory 256GB DDR4 ECC in 4 channels
OS Linux Debian Jessie Kernel 4.4.78
JDK Oracle 1.8.0_65
RAID card 1GB write-back cache
HDD 22 disks in RAID-0, 40TB space in total
Kafka 10.0.2
Scala 2.10
9.
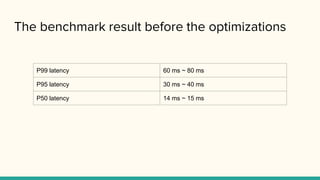
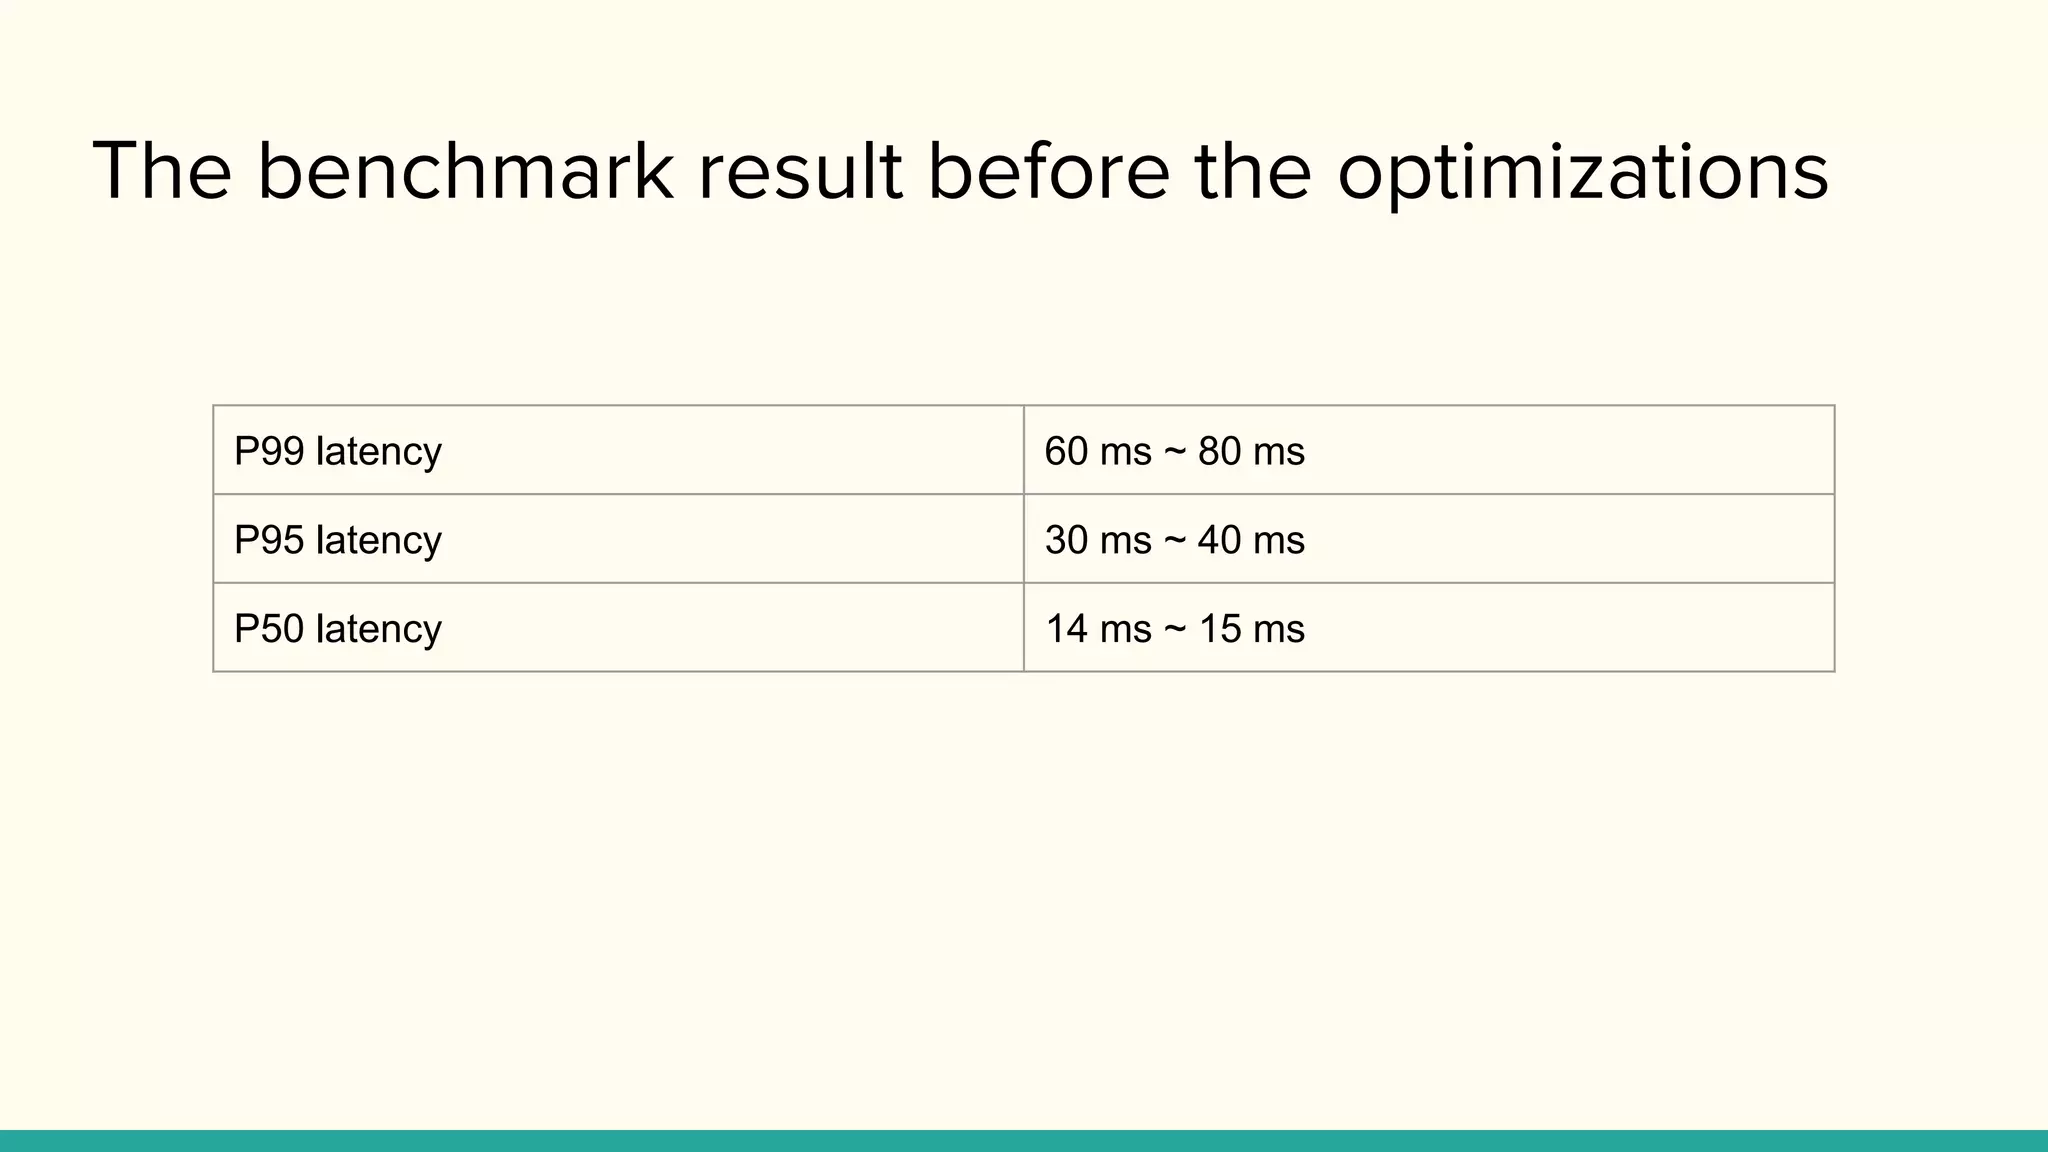
The benchmark resultbefore the optimizations
P99 latency 60 ms ~ 80 ms
P95 latency 30 ms ~ 40 ms
P50 latency 14 ms ~ 15 ms
10.
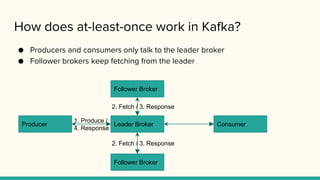
How does at-least-oncework in Kafka?
● Producers and consumers only talk to the leader broker
● Follower brokers keep fetching from the leader
Producer Consumer
Follower Broker
Leader Broker
Follower Broker
2. Fetch / 3. Response
2. Fetch / 3. Response
1. Produce /
4. Response
11.
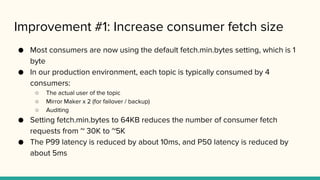
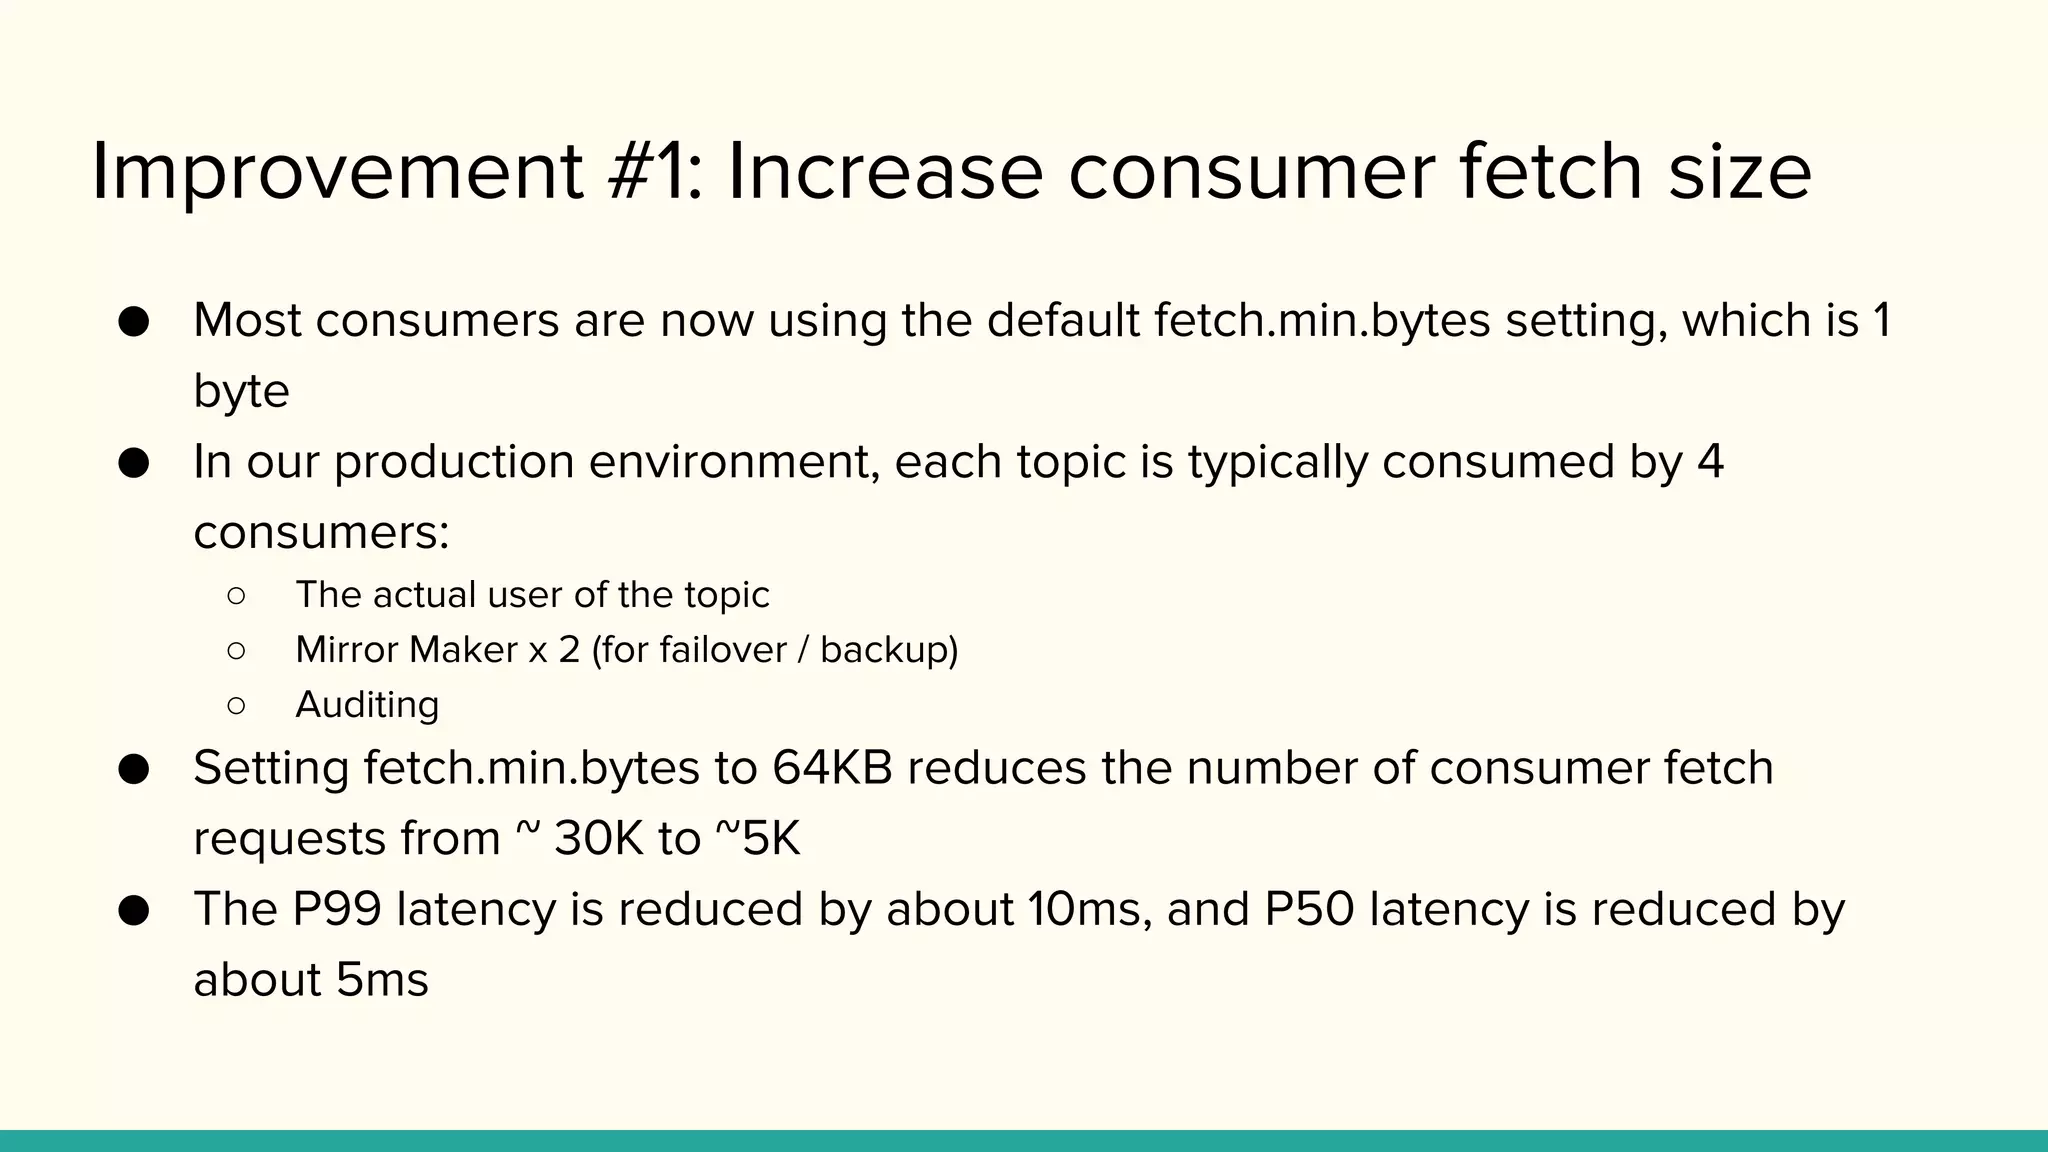
Improvement #1: Increaseconsumer fetch size
● Most consumers are now using the default fetch.min.bytes setting, which is 1
byte
● In our production environment, each topic is typically consumed by 4
consumers:
○ The actual user of the topic
○ Mirror Maker x 2 (for failover / backup)
○ Auditing
● Setting fetch.min.bytes to 64KB reduces the number of consumer fetch
requests from ~ 30K to ~5K
● The P99 latency is reduced by about 10ms, and P50 latency is reduced by
about 5ms
12.
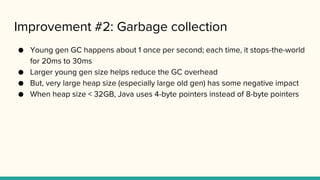
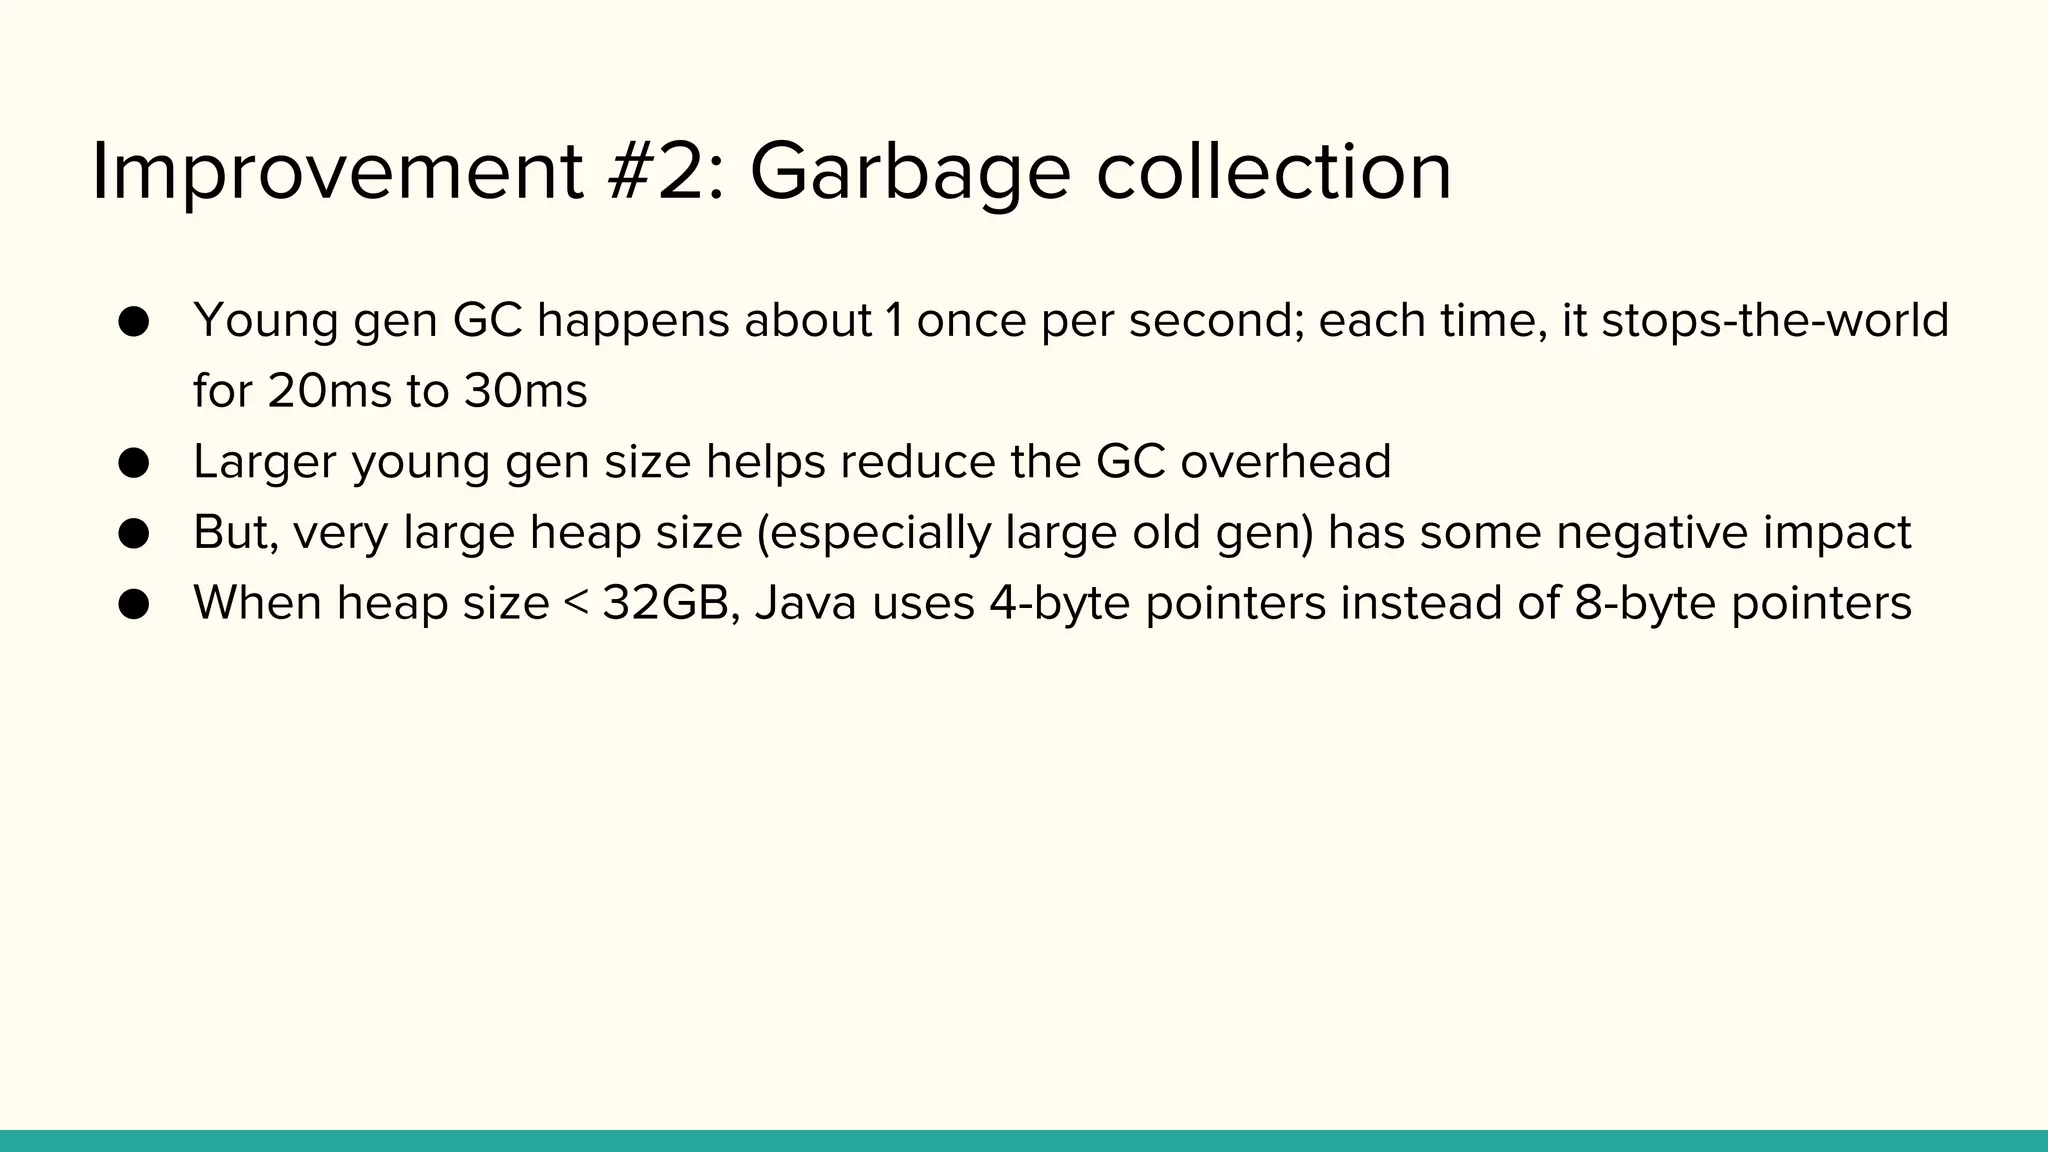
Improvement #2: Garbagecollection
● Young gen GC happens about 1 once per second; each time, it stops-the-world
for 20ms to 30ms
● Larger young gen size helps reduce the GC overhead
● But, very large heap size (especially large old gen) has some negative impact
● When heap size < 32GB, Java uses 4-byte pointers instead of 8-byte pointers
13.
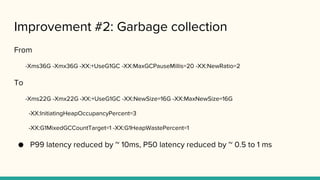
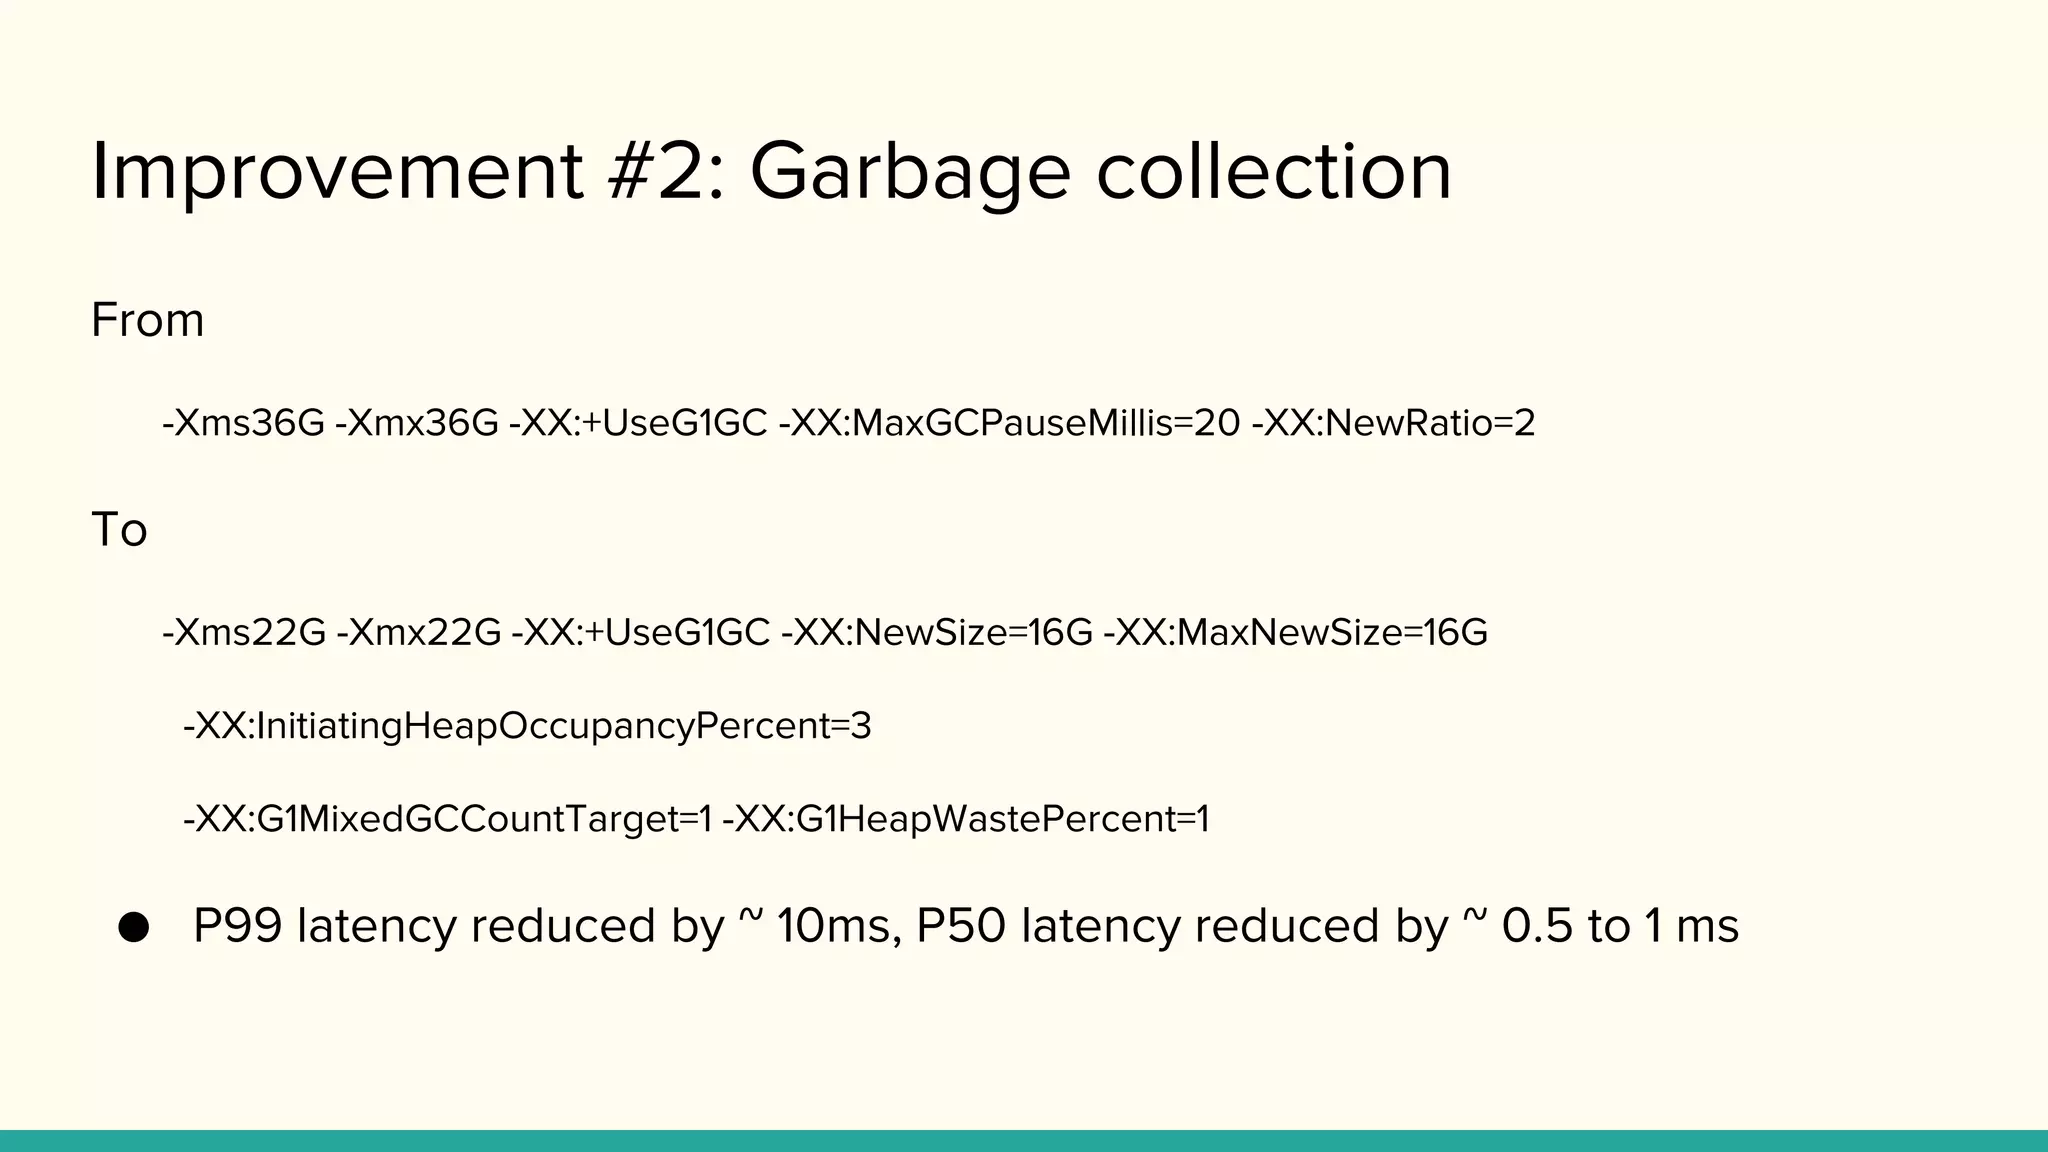
Improvement #2: Garbagecollection
From
-Xms36G -Xmx36G -XX:+UseG1GC -XX:MaxGCPauseMillis=20 -XX:NewRatio=2
To
-Xms22G -Xmx22G -XX:+UseG1GC -XX:NewSize=16G -XX:MaxNewSize=16G
-XX:InitiatingHeapOccupancyPercent=3
-XX:G1MixedGCCountTarget=1 -XX:G1HeapWastePercent=1
● P99 latency reduced by ~ 10ms, P50 latency reduced by ~ 0.5 to 1 ms
14.
Improvement #3: FixtoString
● In Kafka broker code, some toString methods are declared like this:
case class FetchMetadata(...) {
override def toString =
"[minBytes: " + fetchMinBytes + ", " +
"onlyLeader:" + fetchOnlyLeader + ", "
"onlyCommitted: " + fetchOnlyCommitted + ", "
"partitionStatus: " + fetchPartitionStatus + "]"
}
● This String is only used in trace log
● This fix reduces P99 latency by a few ms
case class FetchMetadata(...) {
override def toString() = {
"[minBytes: " + fetchMinBytes + ", " +
"onlyLeader:" + fetchOnlyLeader + ", "
"onlyCommitted: " + fetchOnlyCommitted + ", "
"partitionStatus: " + fetchPartitionStatus + "]"
}
}
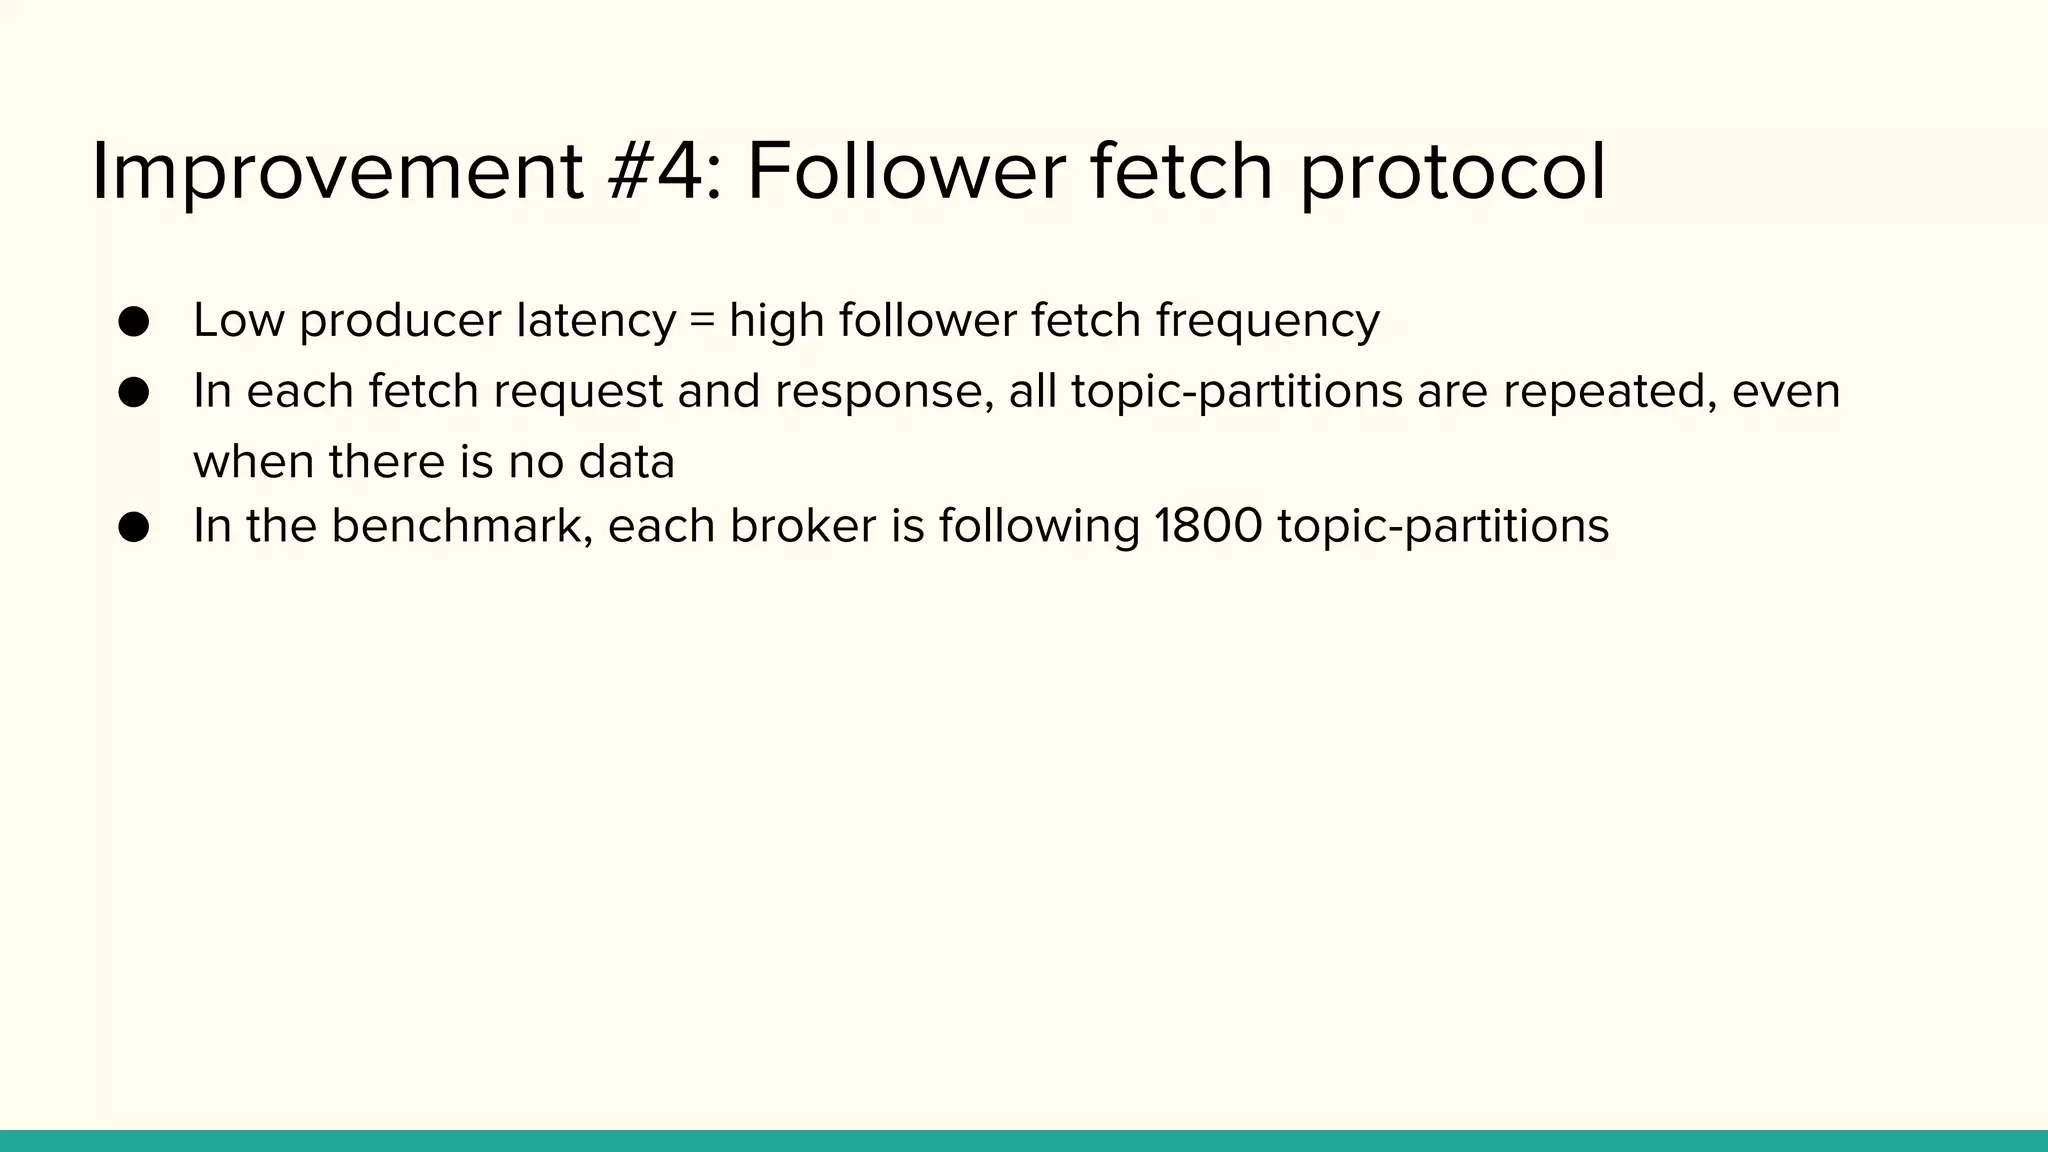
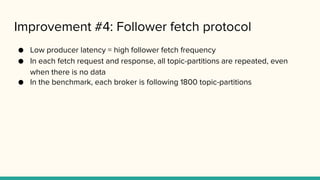
Improvement #4: Followerfetch protocol
● Low producer latency = high follower fetch frequency
● In each fetch request and response, all topic-partitions are repeated, even
when there is no data
● In the benchmark, each broker is following 1800 topic-partitions
17.
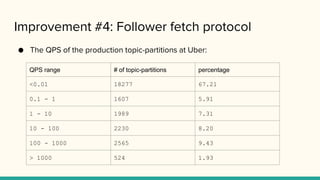
Improvement #4: Followerfetch protocol
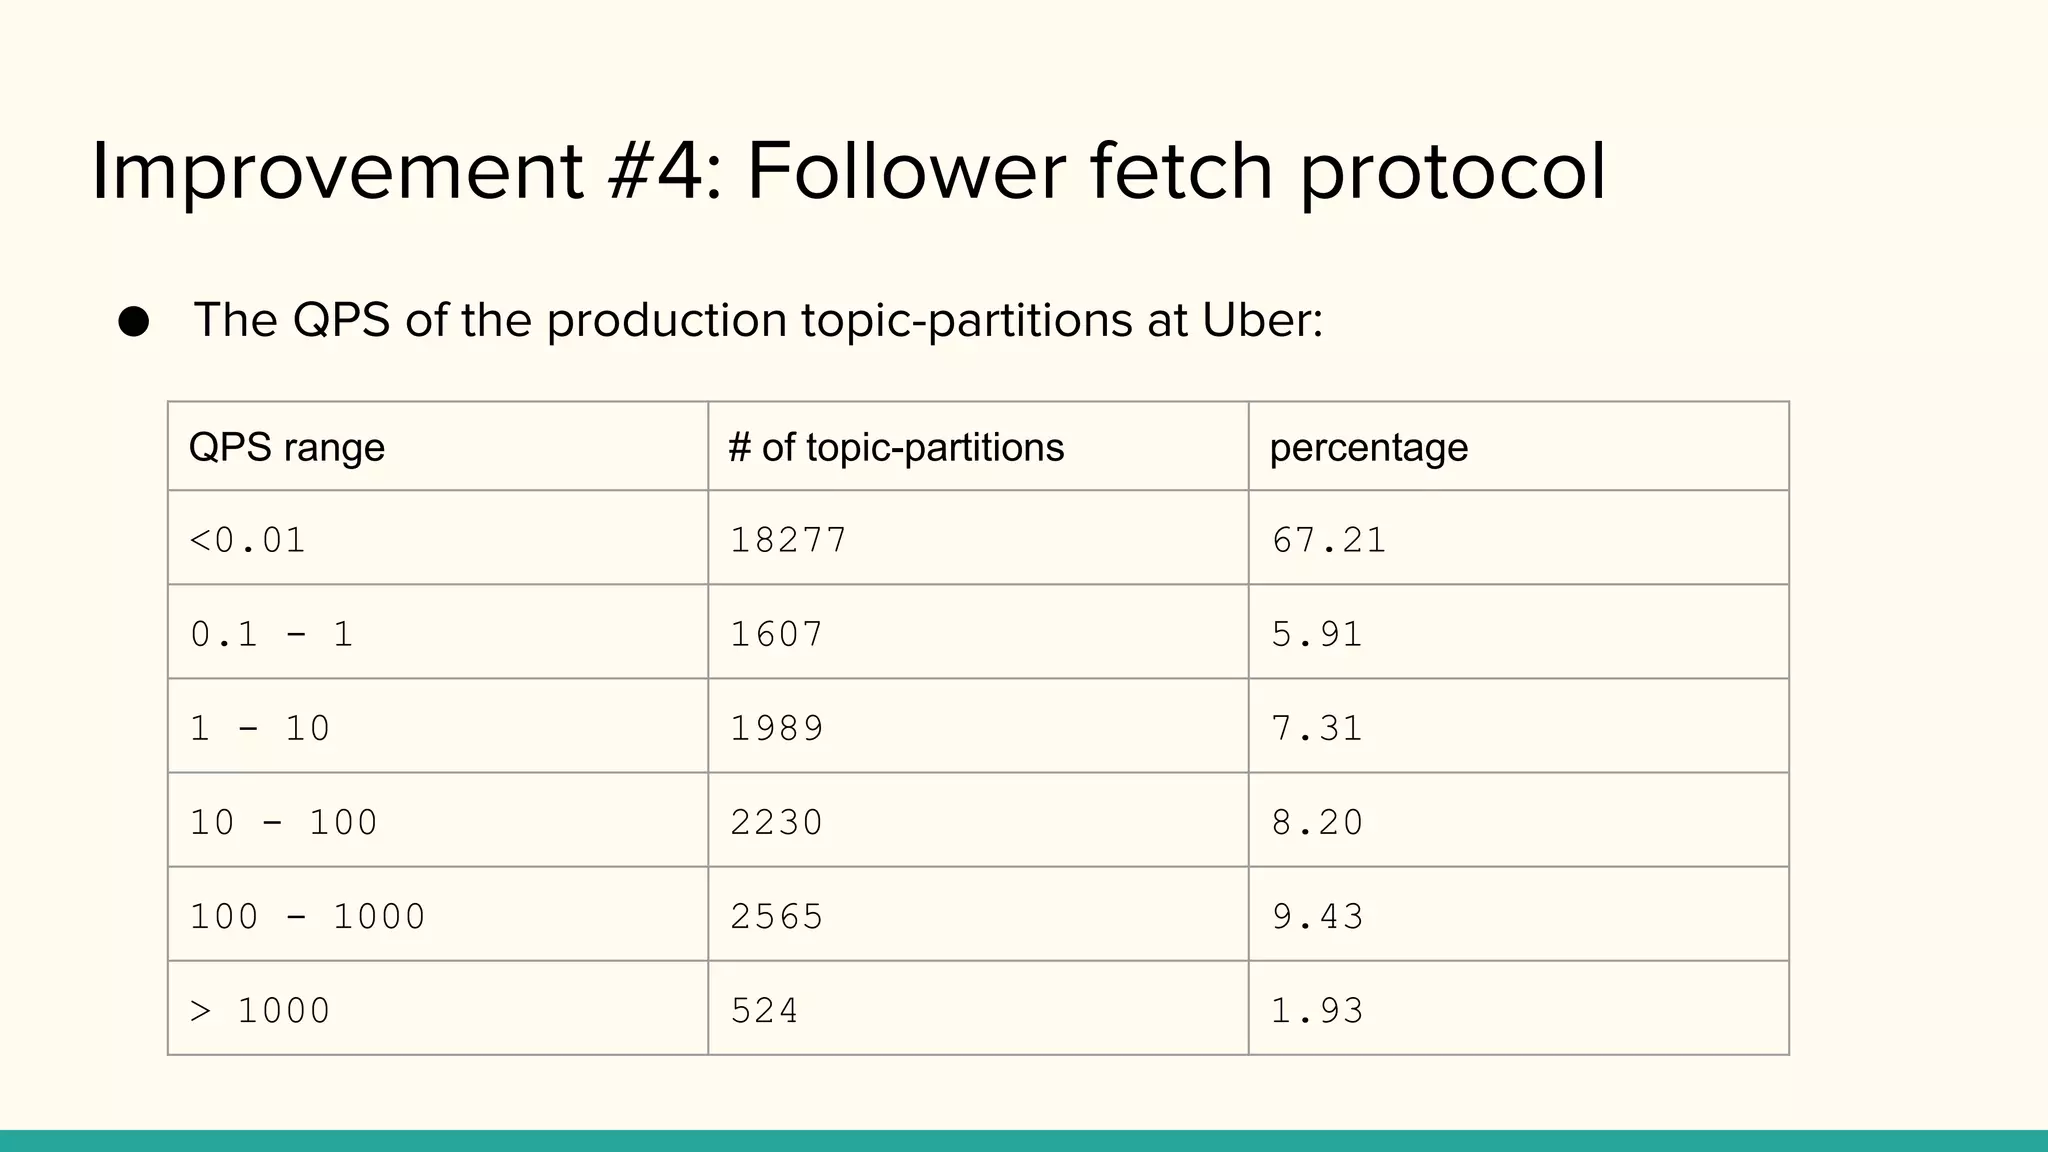
● The QPS of the production topic-partitions at Uber:
QPS range # of topic-partitions percentage
<0.01 18277 67.21
0.1 - 1 1607 5.91
1 - 10 1989 7.31
10 - 100 2230 8.20
100 - 1000 2565 9.43
> 1000 524 1.93
18.
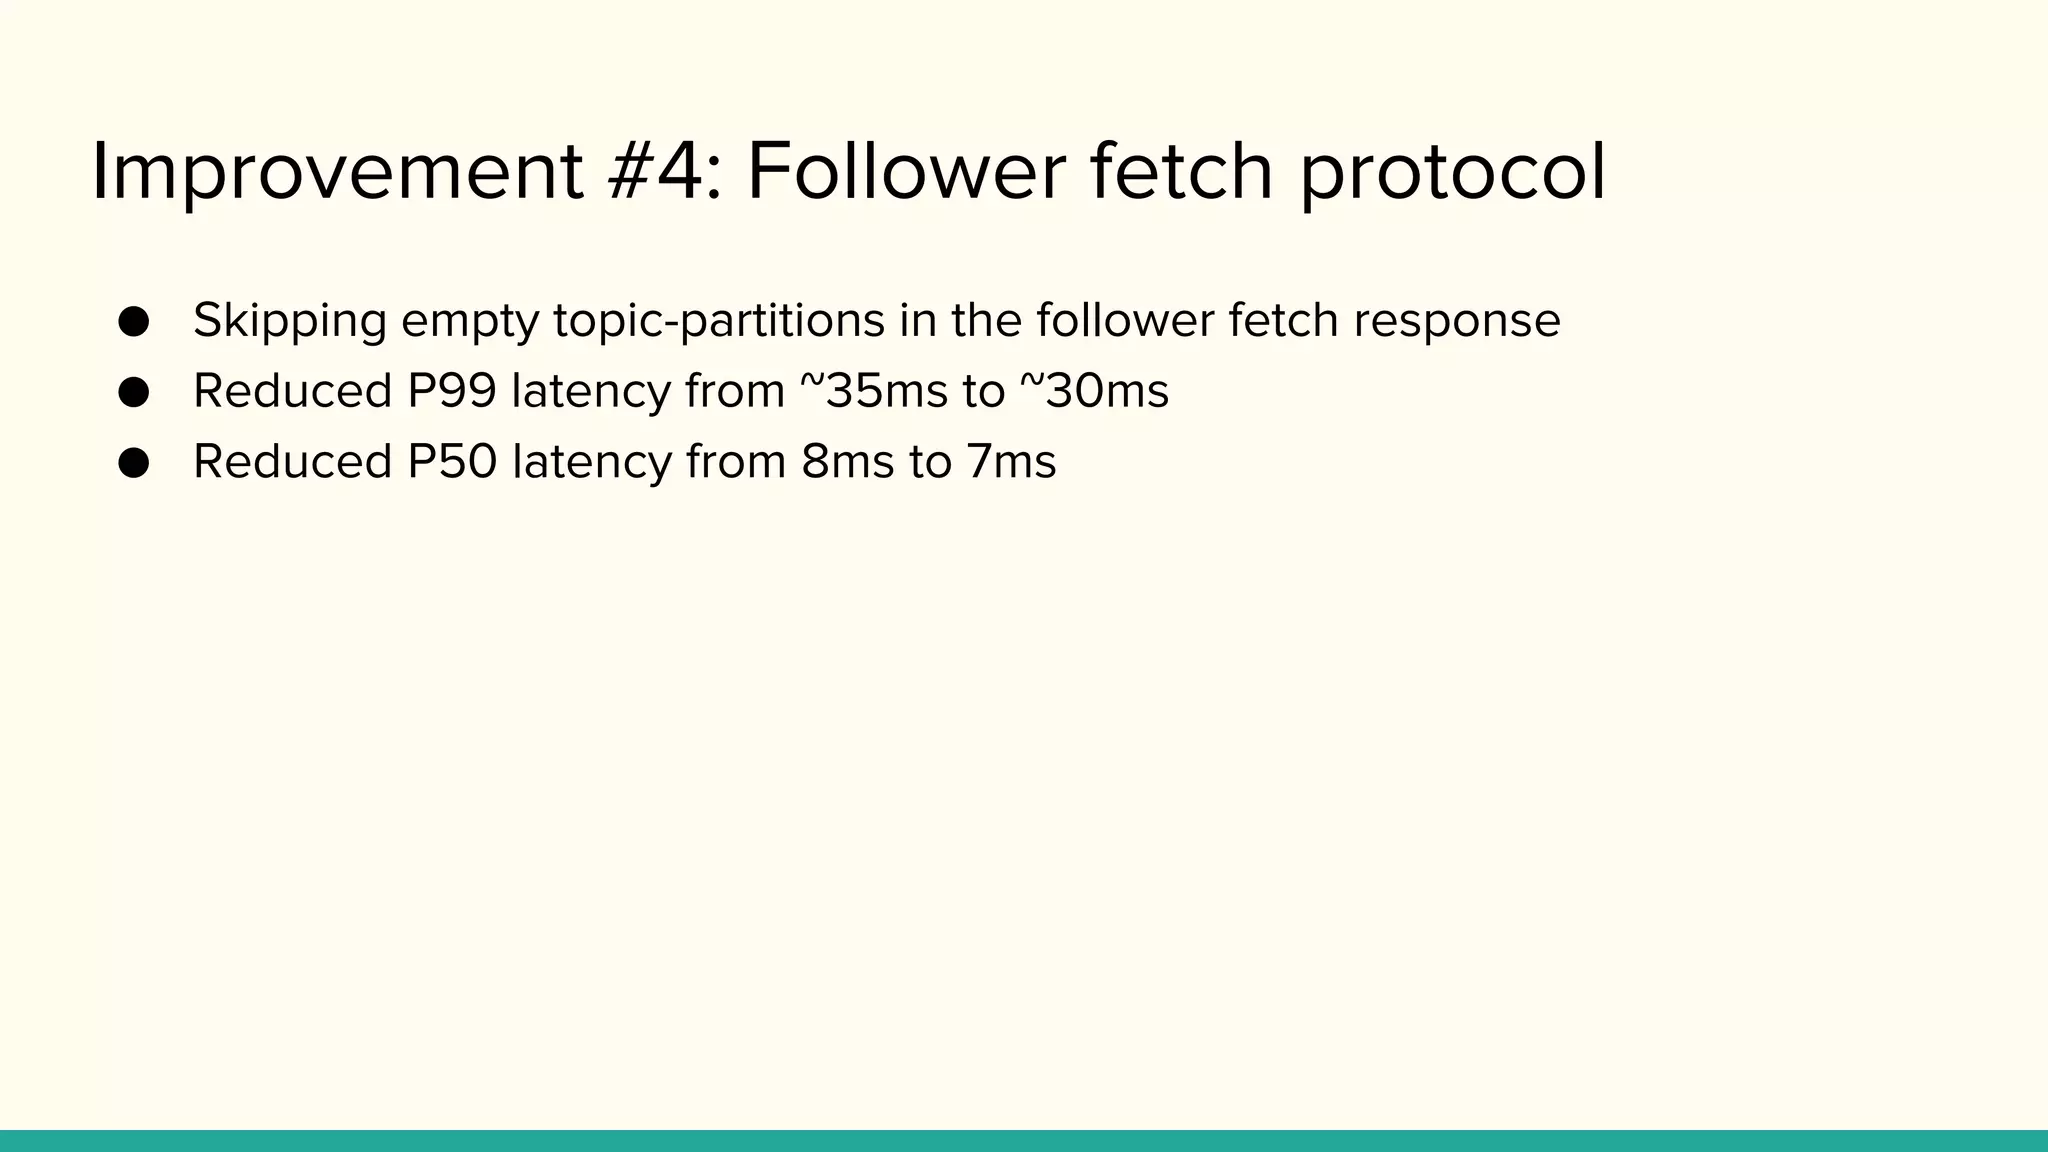
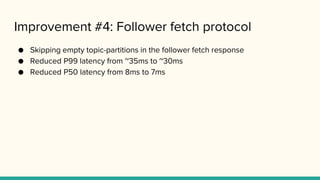
Improvement #4: Followerfetch protocol
● Skipping empty topic-partitions in the follower fetch response
● Reduced P99 latency from ~35ms to ~30ms
● Reduced P50 latency from 8ms to 7ms
19.
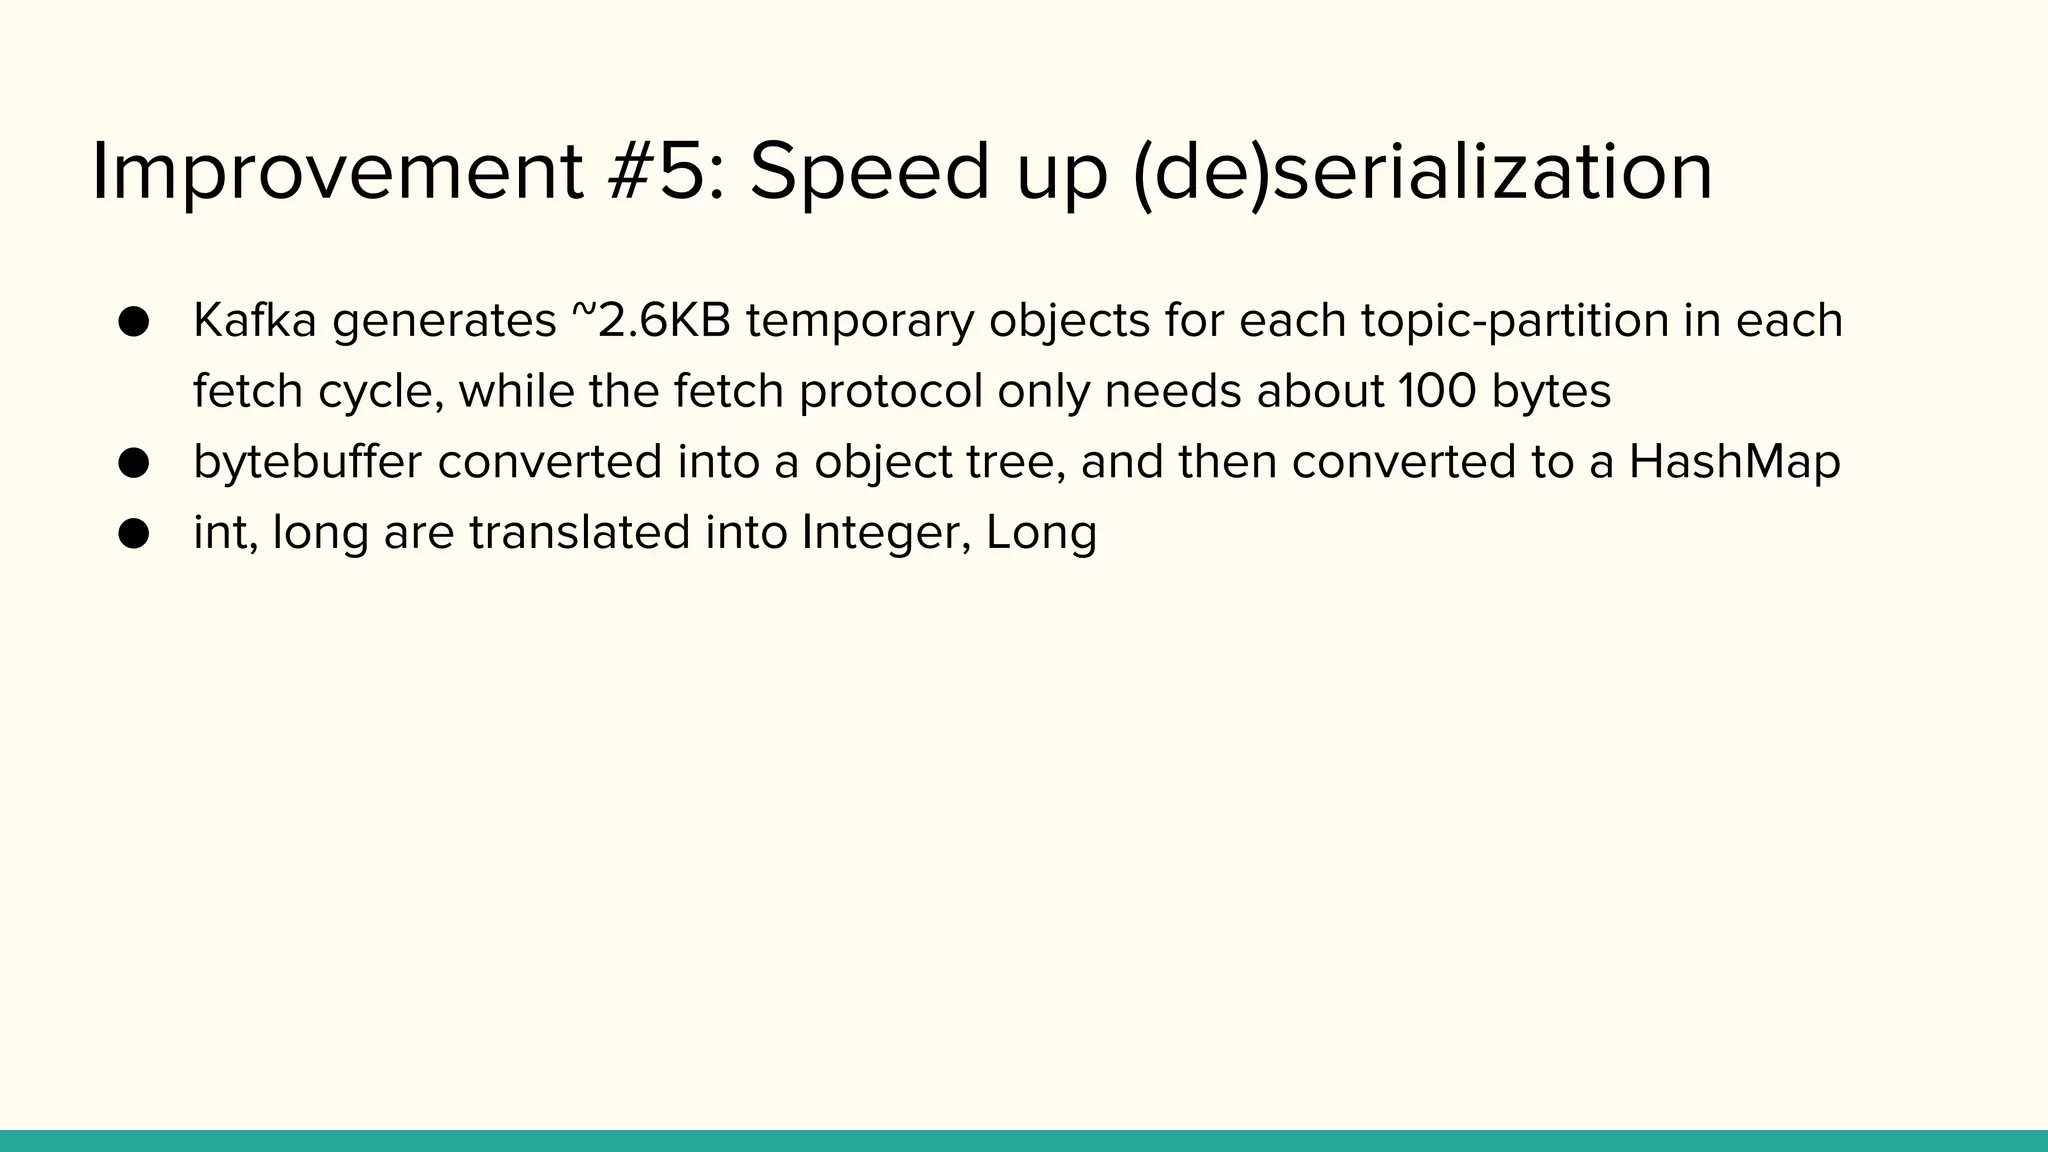
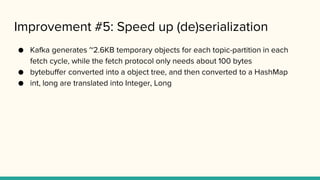
Improvement #5: Speedup (de)serialization
● Kafka generates ~2.6KB temporary objects for each topic-partition in each
fetch cycle, while the fetch protocol only needs about 100 bytes
● bytebuffer converted into a object tree, and then converted to a HashMap
● int, long are translated into Integer, Long
20.
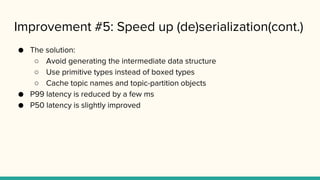
Improvement #5: Speedup (de)serialization(cont.)
● The solution:
○ Avoid generating the intermediate data structure
○ Use primitive types instead of boxed types
○ Cache topic names and topic-partition objects
● P99 latency is reduced by a few ms
● P50 latency is slightly improved
21.
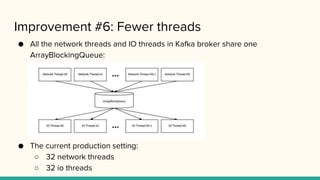
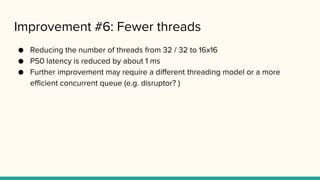
Improvement #6: Fewerthreads
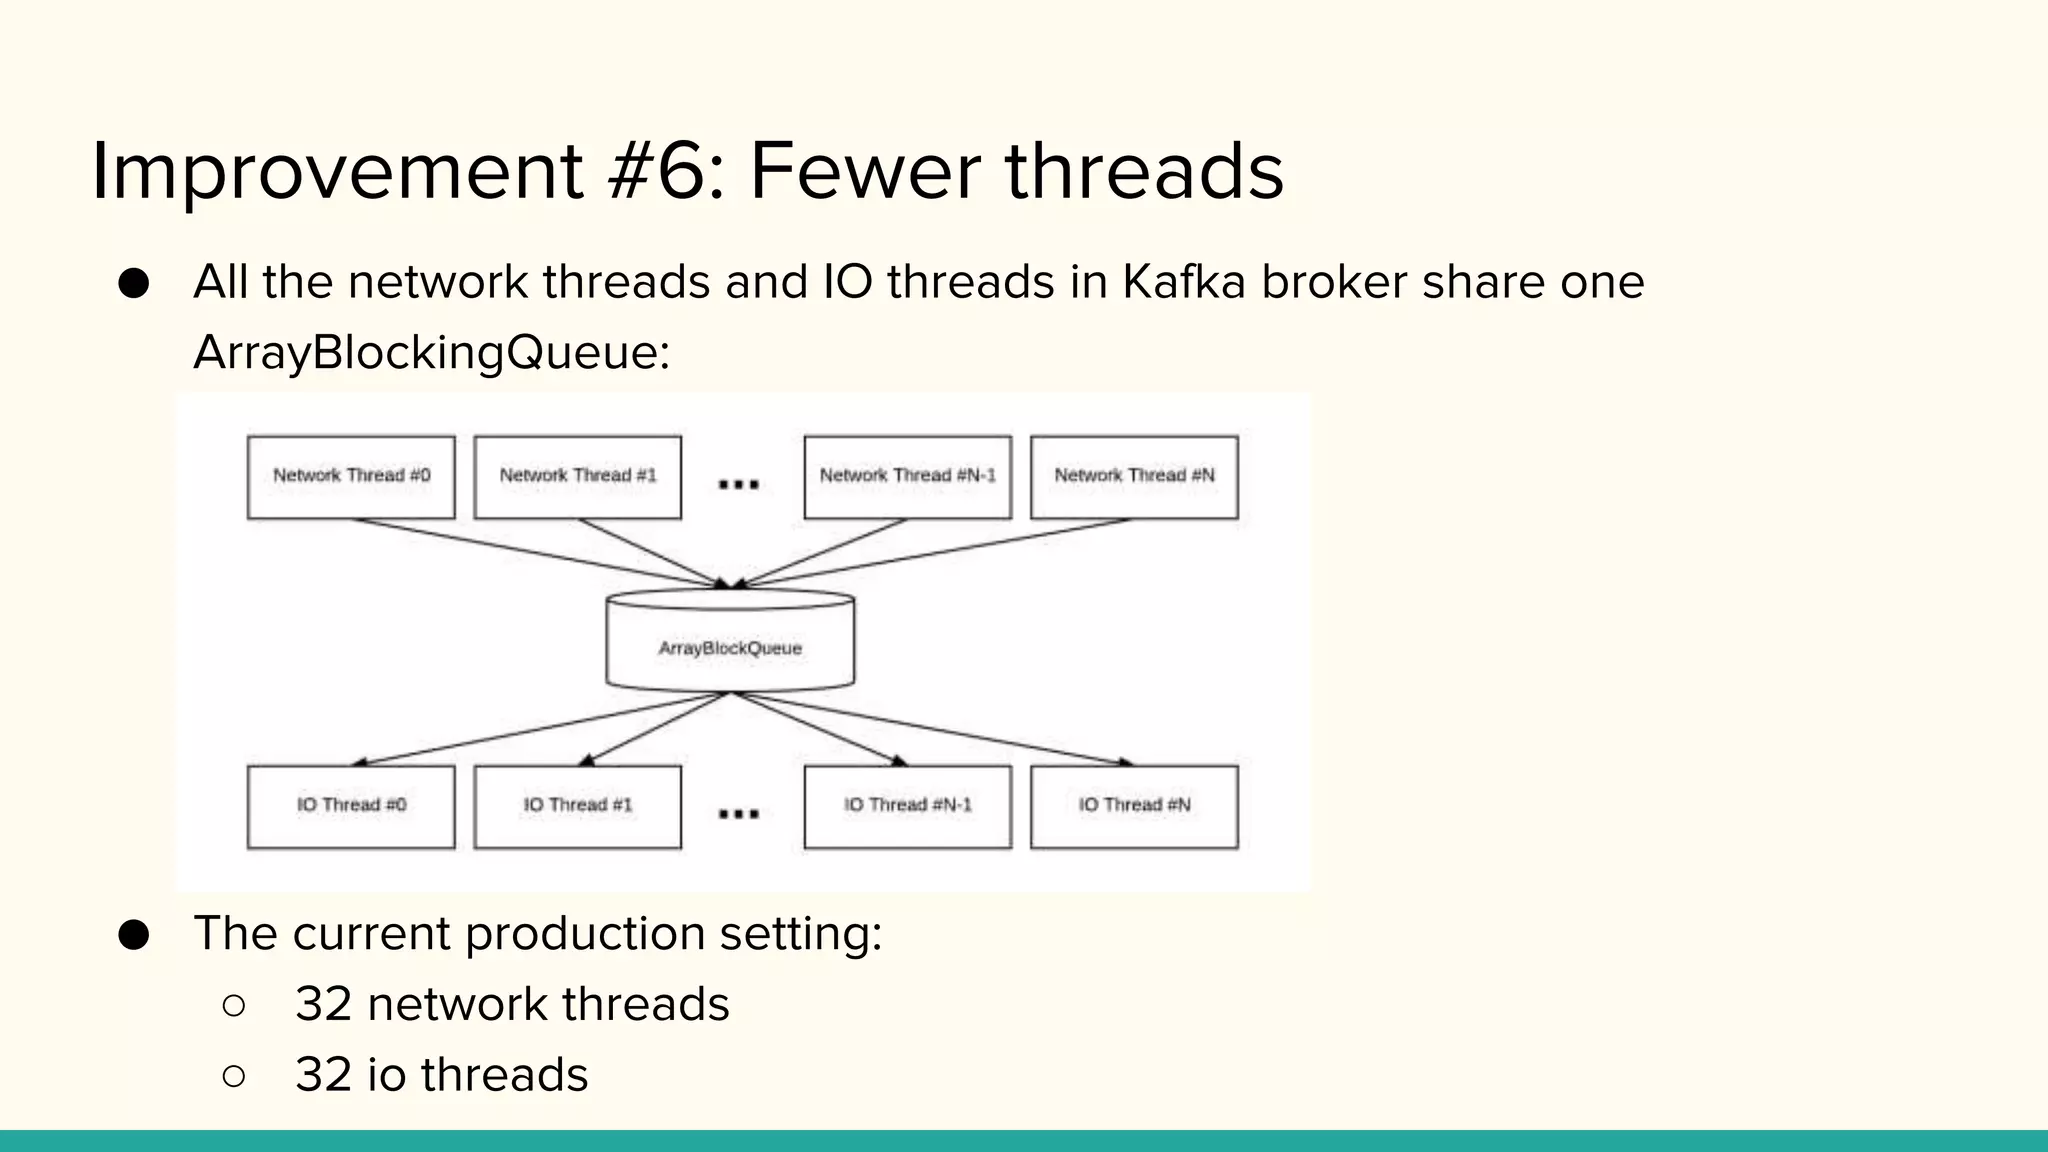
● All the network threads and IO threads in Kafka broker share one
ArrayBlockingQueue:
● The current production setting:
○ 32 network threads
○ 32 io threads
22.
Improvement #6: Fewerthreads
● Reducing the number of threads from 32 / 32 to 16x16
● P50 latency is reduced by about 1 ms
● Further improvement may require a different threading model or a more
efficient concurrent queue (e.g. disruptor? )
23.
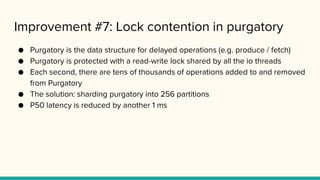
Improvement #7: Lockcontention in purgatory
● Purgatory is the data structure for delayed operations (e.g. produce / fetch)
● Purgatory is protected with a read-write lock shared by all the io threads
● Each second, there are tens of thousands of operations added to and removed
from Purgatory
● The solution: sharding purgatory into 256 partitions
● P50 latency is reduced by another 1 ms
24.
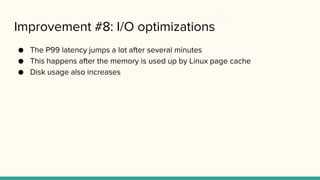
Improvement #8: I/Ooptimizations
● The P99 latency jumps a lot after several minutes
● This happens after the memory is used up by Linux page cache
● Disk usage also increases
25.
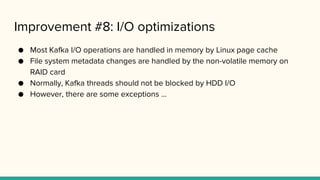
Improvement #8: I/Ooptimizations
● Most Kafka I/O operations are handled in memory by Linux page cache
● File system metadata changes are handled by the non-volatile memory on
RAID card
● Normally, Kafka threads should not be blocked by HDD I/O
● However, there are some exceptions ...
26.
Improvement #8: I/Ooptimizations
● There is an optional flush
● Write operations may have to load file system metadata (e.g. inode) and the last
page of the file from disk (I’m not an Linux expert, so not 100% sure about this)
● Rolling a segment file needs dentry and inode
● The solution:
○ Turn off flush
○ Periodically touch the last 2 pages of each index and segment file
27.
Improvement #8: I/Ooptimizations
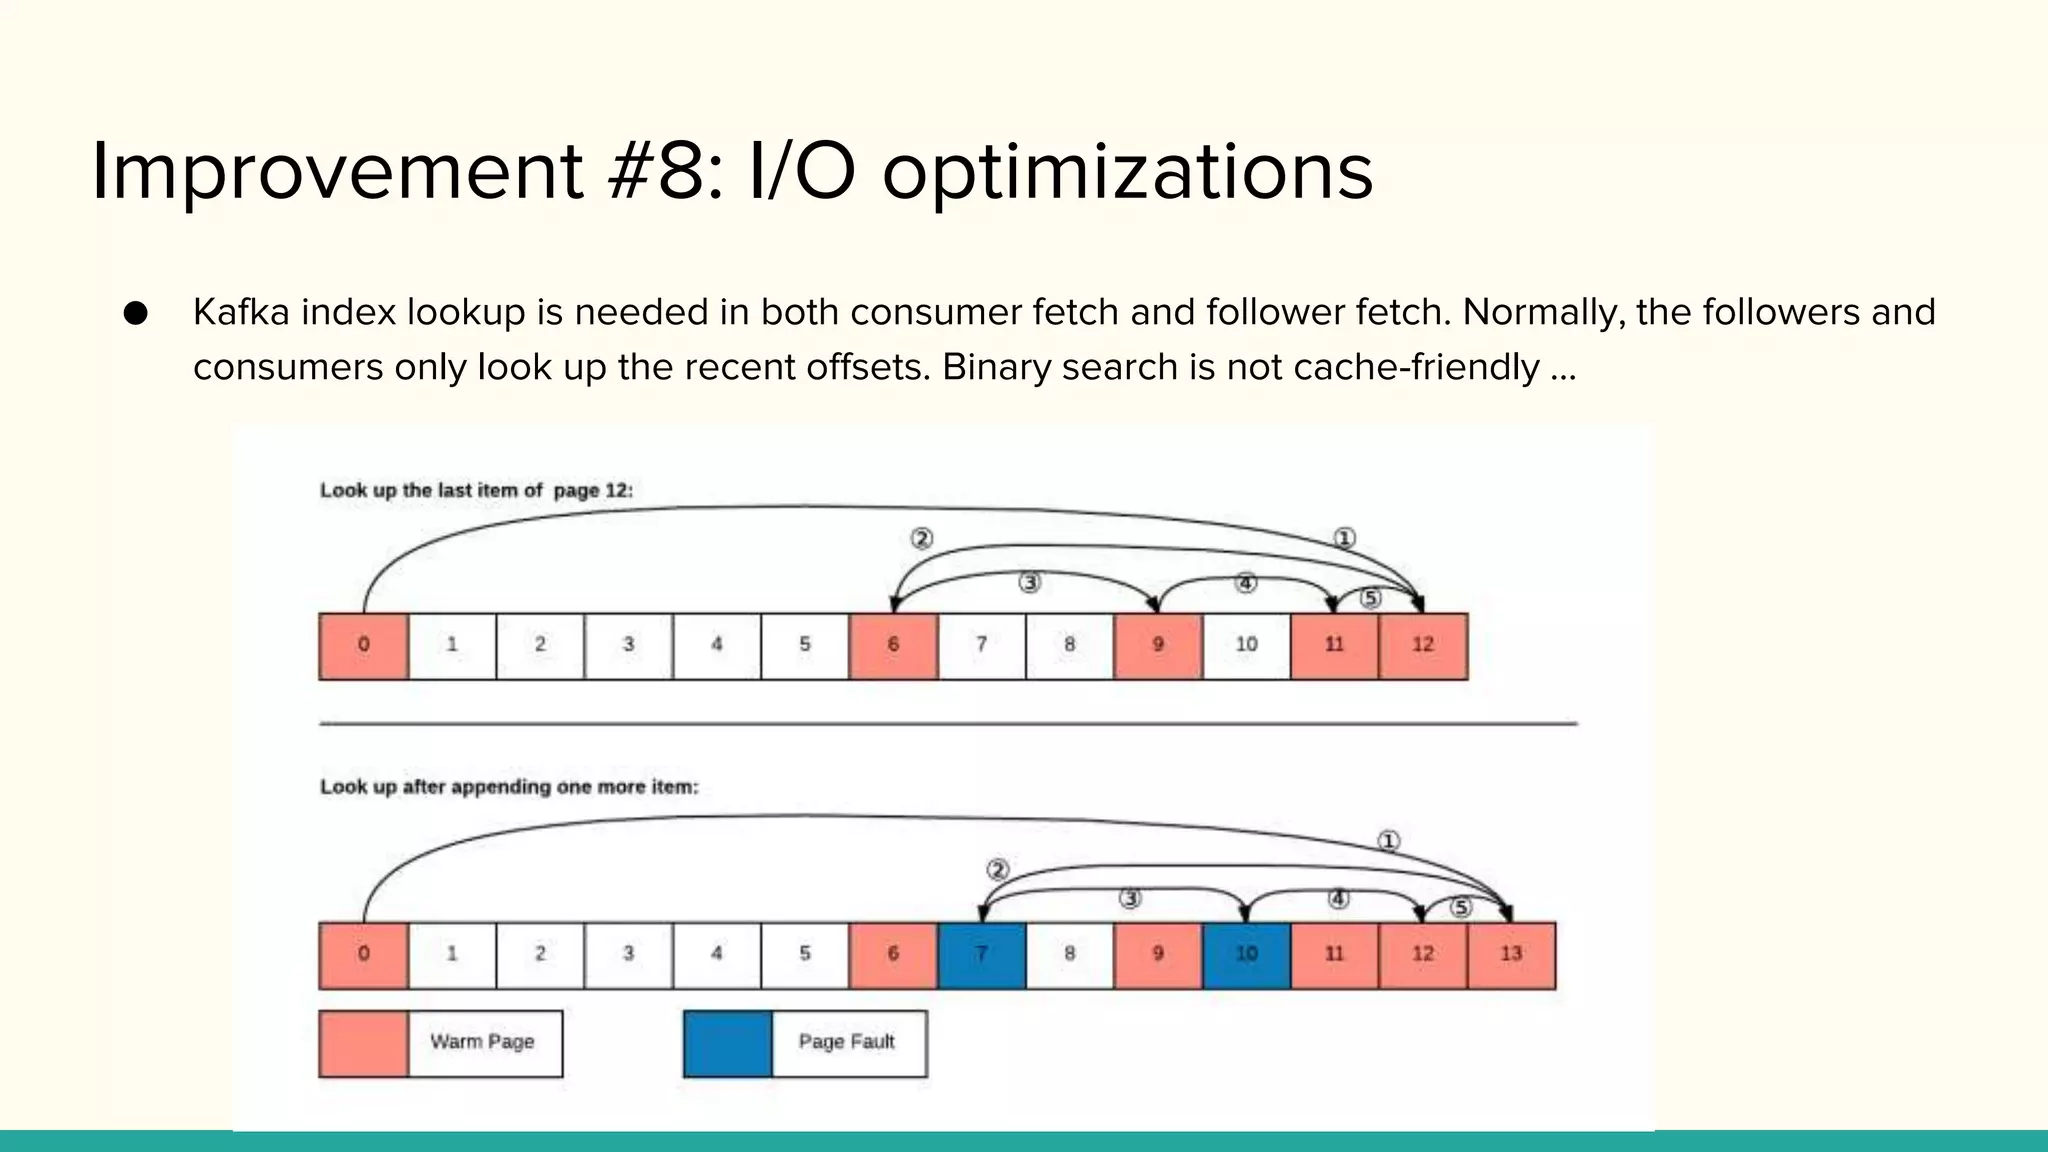
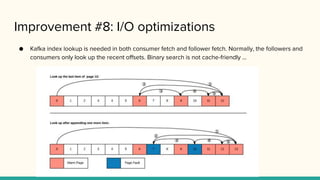
● Kafka index lookup is needed in both consumer fetch and follower fetch. Normally, the followers and
consumers only look up the recent offsets. Binary search is not cache-friendly ...
28.
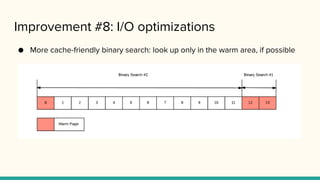
Improvement #8: I/Ooptimizations
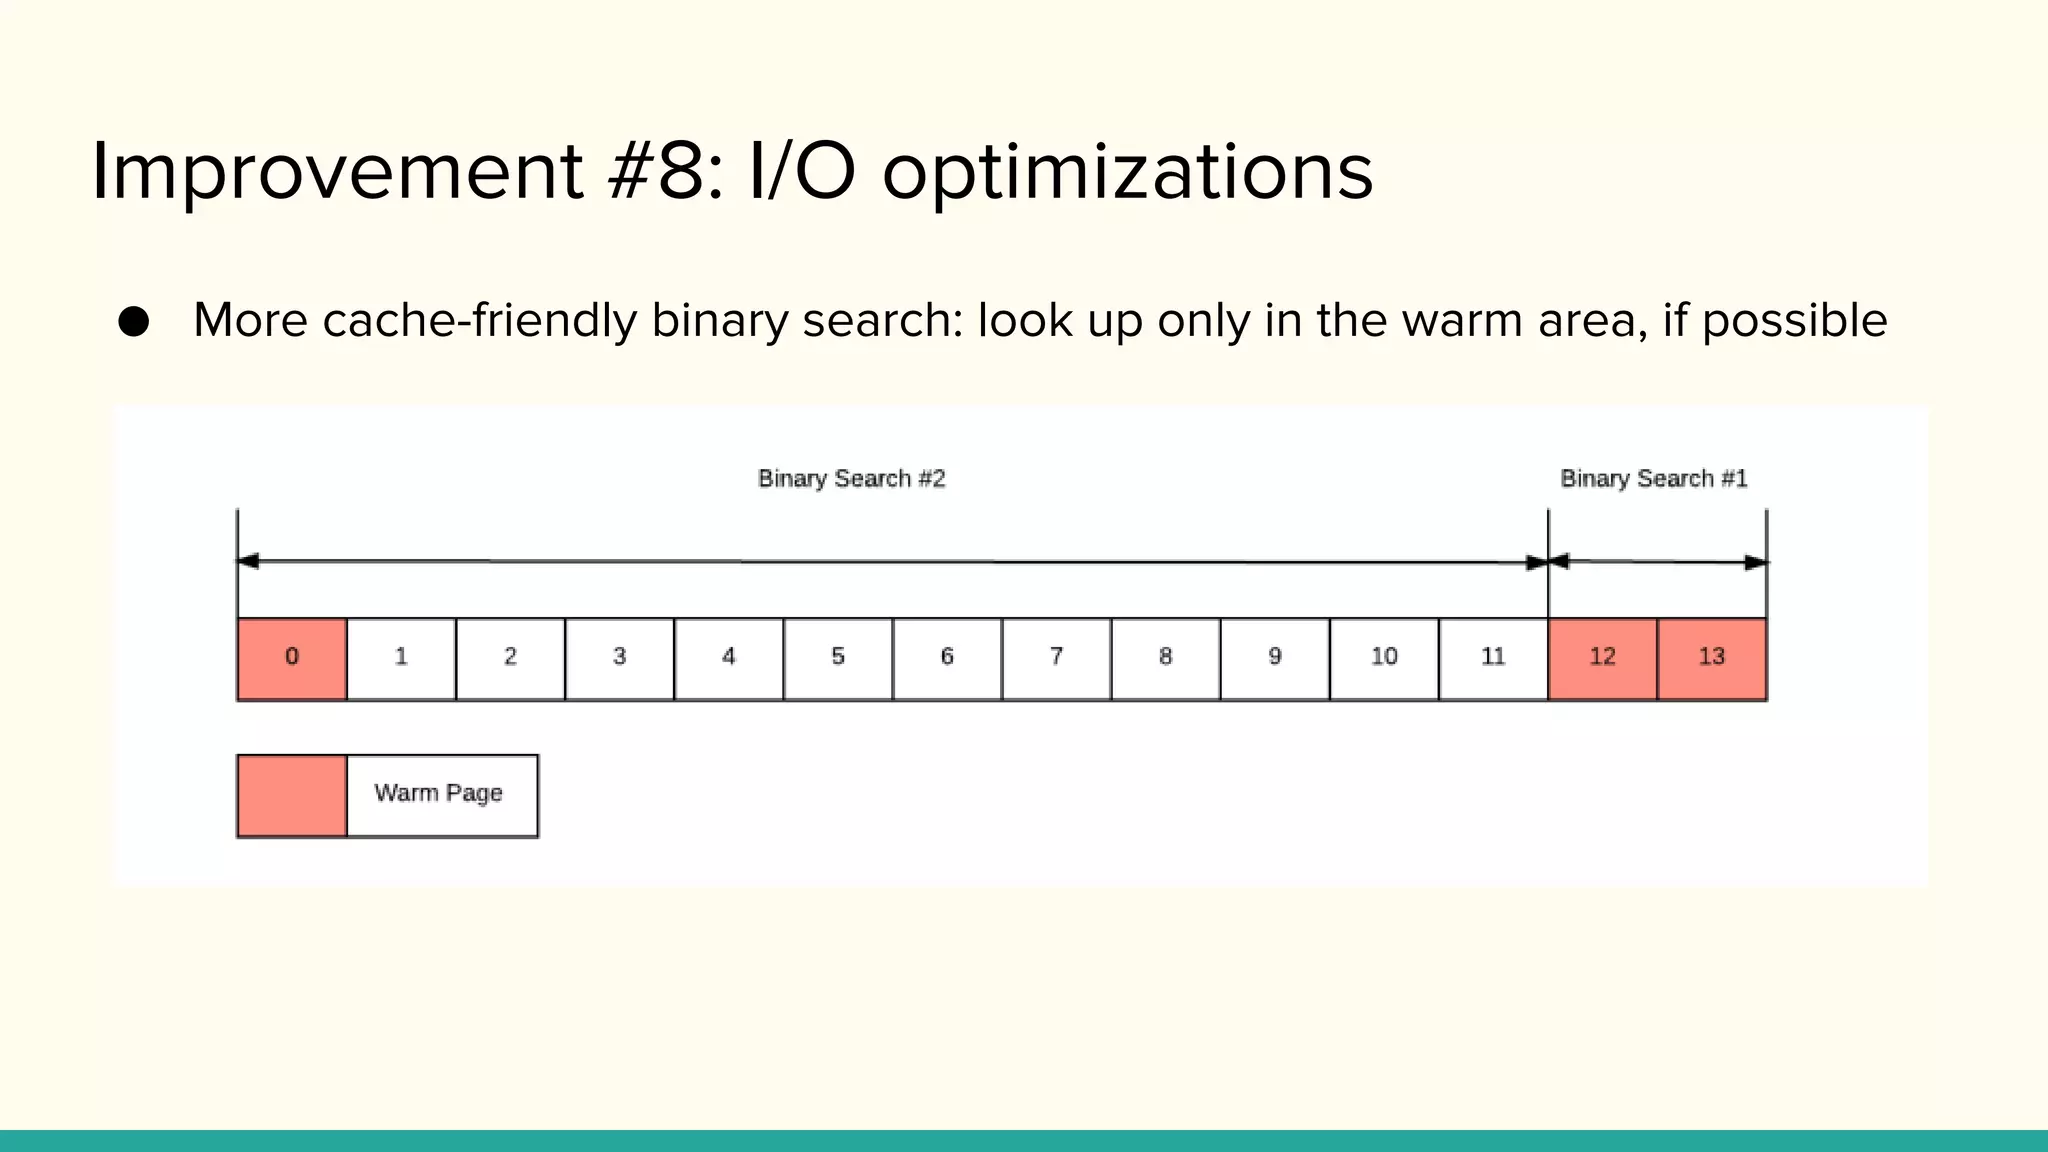
● More cache-friendly binary search: look up only in the warm area, if possible
29.
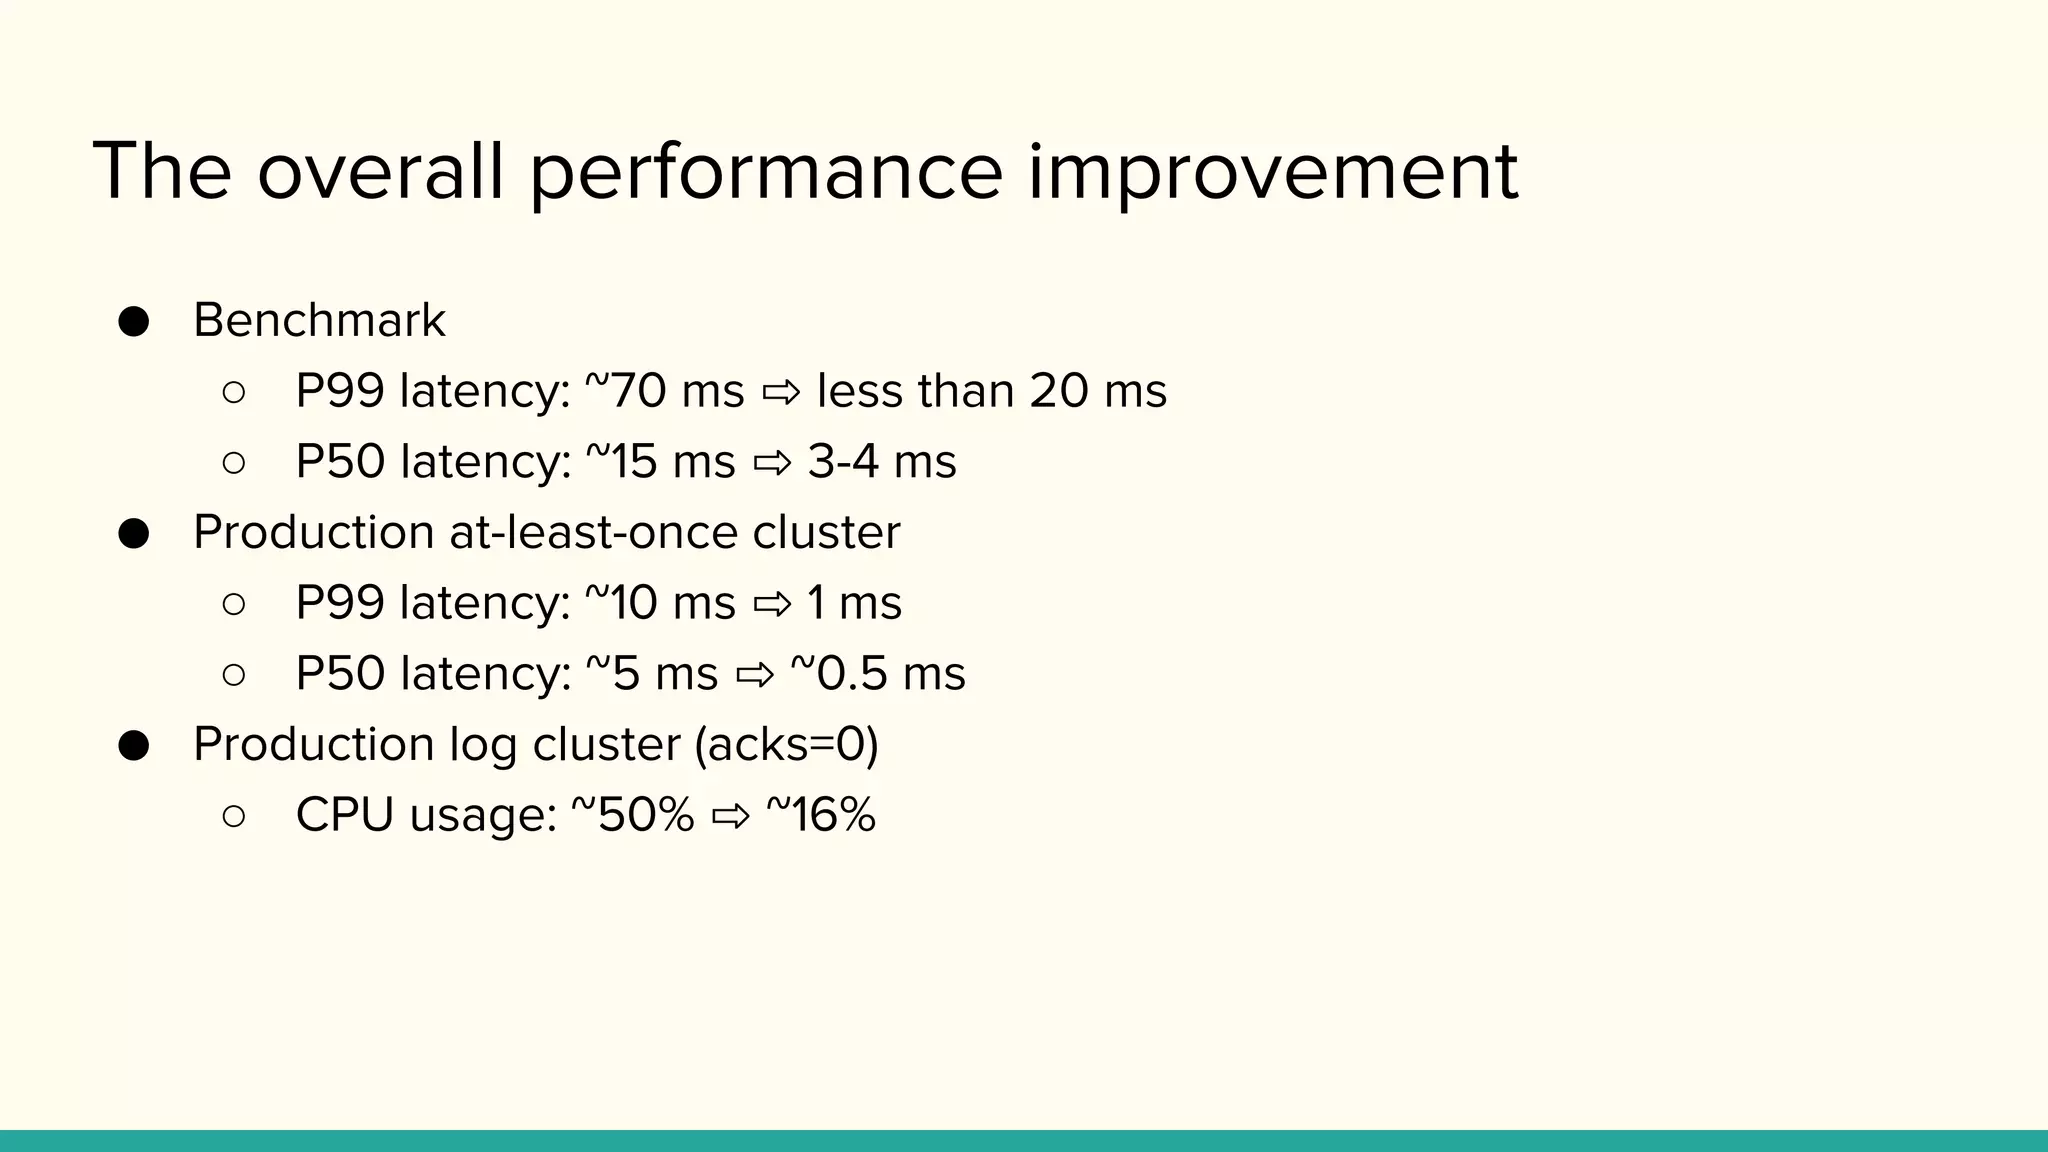
The overall performanceimprovement
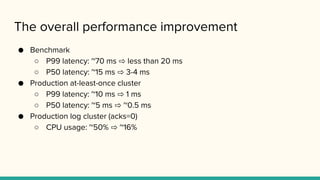
● Benchmark
○ P99 latency: ~70 ms ⇨ less than 20 ms
○ P50 latency: ~15 ms ⇨ 3-4 ms
● Production at-least-once cluster
○ P99 latency: ~10 ms ⇨ 1 ms
○ P50 latency: ~5 ms ⇨ ~0.5 ms
● Production log cluster (acks=0)
○ CPU usage: ~50% ⇨ ~16%
30.
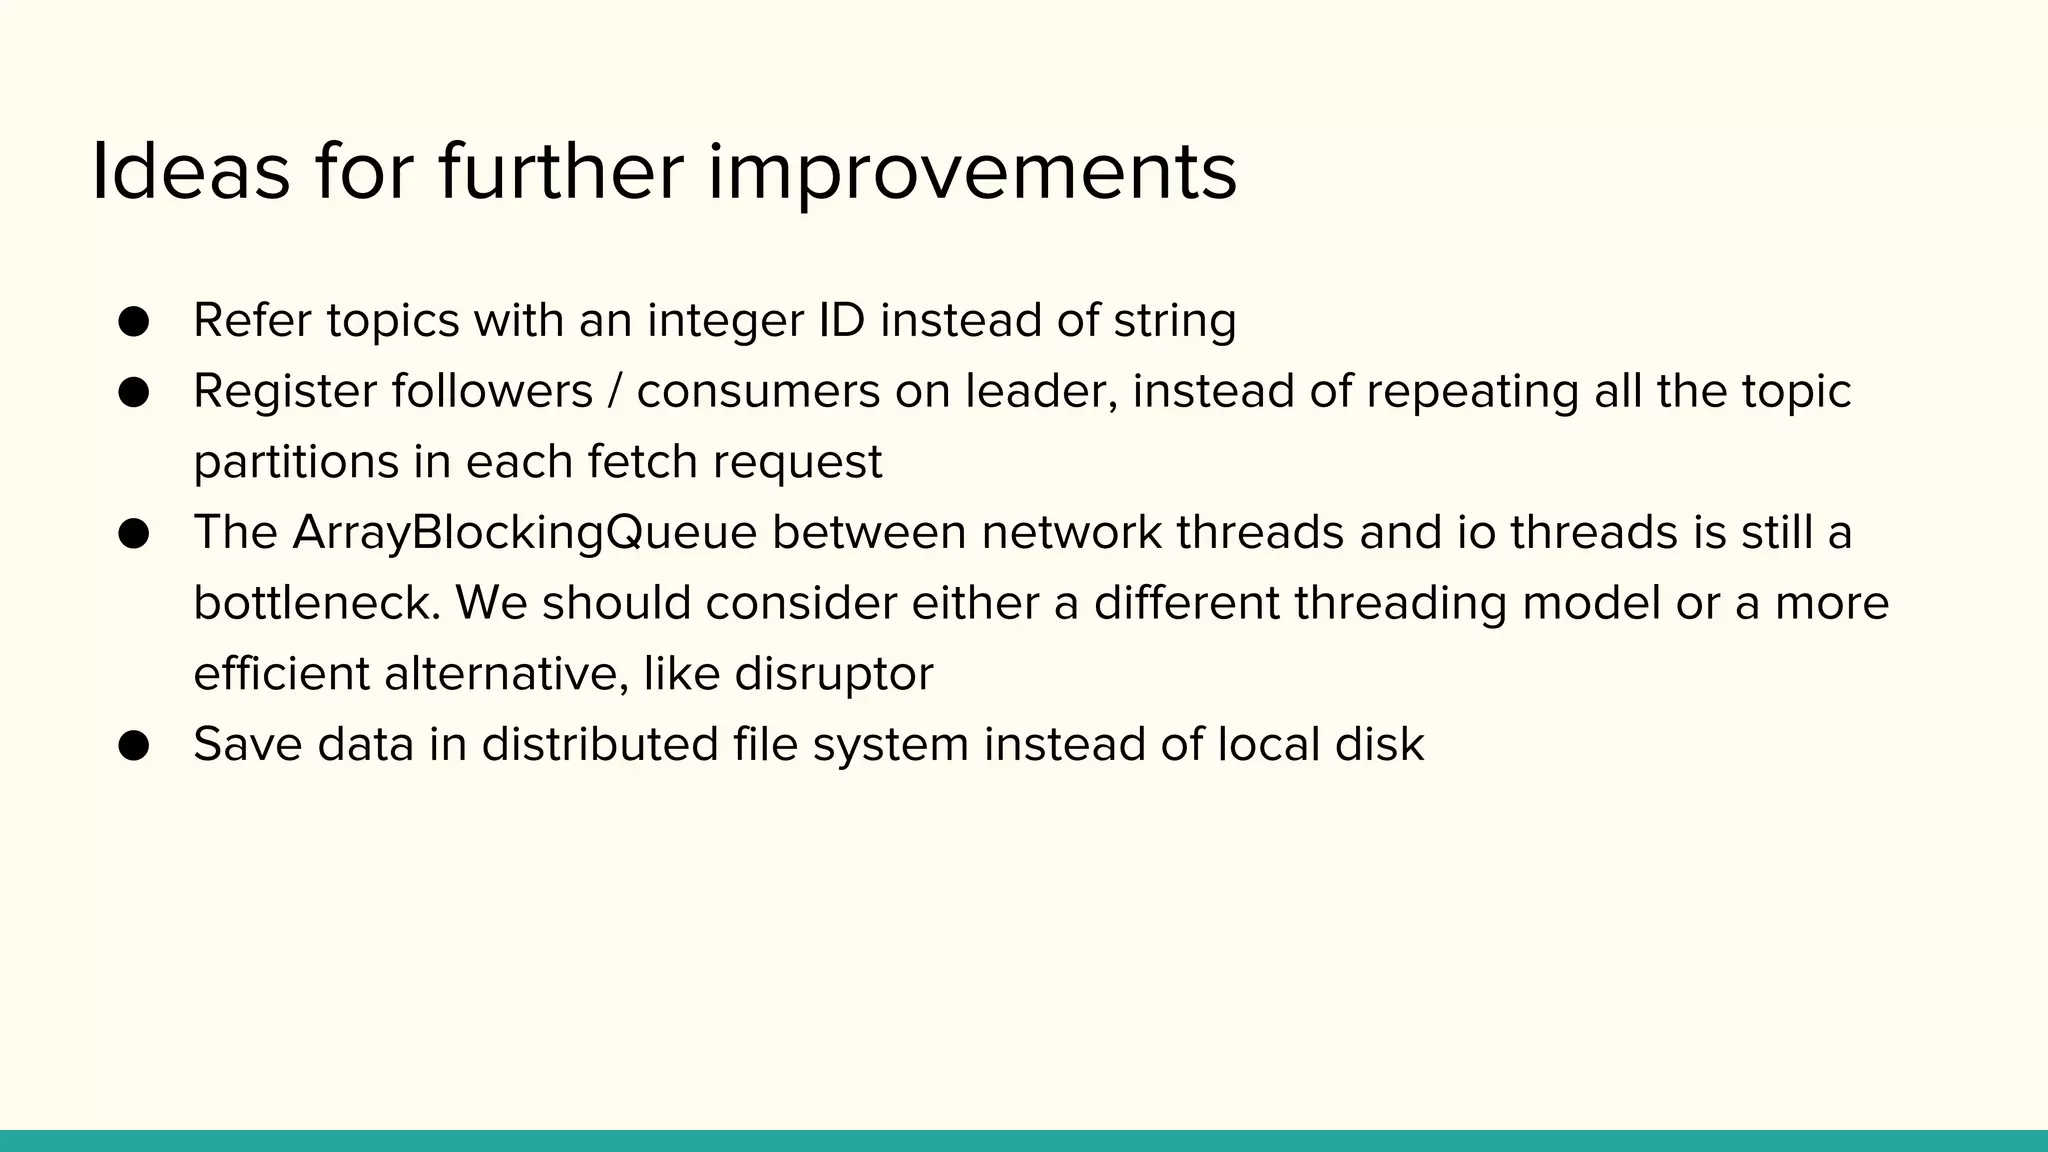
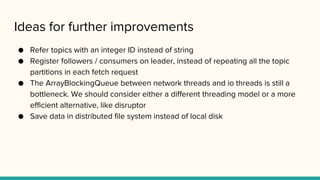
Ideas for furtherimprovements
● Refer topics with an integer ID instead of string
● Register followers / consumers on leader, instead of repeating all the topic
partitions in each fetch request
● The ArrayBlockingQueue between network threads and io threads is still a
bottleneck. We should consider either a different threading model or a more
efficient alternative, like disruptor
● Save data in distributed file system instead of local disk


![Improvement #3: Fix toString
● In Kafka broker code, some toString methods are declared like this:
case class FetchMetadata(...) {
override def toString =
"[minBytes: " + fetchMinBytes + ", " +
"onlyLeader:" + fetchOnlyLeader + ", "
"onlyCommitted: " + fetchOnlyCommitted + ", "
"partitionStatus: " + fetchPartitionStatus + "]"
}
● This String is only used in trace log
● This fix reduces P99 latency by a few ms
case class FetchMetadata(...) {
override def toString() = {
"[minBytes: " + fetchMinBytes + ", " +
"onlyLeader:" + fetchOnlyLeader + ", "
"onlyCommitted: " + fetchOnlyCommitted + ", "
"partitionStatus: " + fetchPartitionStatus + "]"
}
}](https://image.slidesharecdn.com/kafkaat-least-onceperformanceimprovements-171208210715/85/Improving-Kafka-at-least-once-performance-at-Uber-14-320.jpg)
![Improvement #4: Follower fetch protocol
Fetch Response (Version: 3) => {
throttle_time_ms => INT32
responses => [
topic => STRING
partition_responses => [
partition_header => {
partition => INT32
error_code => INT16
high_watermark => INT64
}
record_set => {RECORDS}
] * (# of partitions)
] * (# of topics)
}
Fetch Request (Version: 3) => {
replica_id => INT32
max_wait_time => INT32
min_bytes => INT32
max_bytes => INT32
topics => [
topic => STRING
partitions => [
partition => INT32
fetch_offset => INT64
max_bytes => INT32
] * (#of partitions)
] * (# of topics)
}](https://image.slidesharecdn.com/kafkaat-least-onceperformanceimprovements-171208210715/85/Improving-Kafka-at-least-once-performance-at-Uber-15-320.jpg)


![Improvement #3: Fix toString
● In Kafka broker code, some toString methods are declared like this:
case class FetchMetadata(...) {
override def toString =
"[minBytes: " + fetchMinBytes + ", " +
"onlyLeader:" + fetchOnlyLeader + ", "
"onlyCommitted: " + fetchOnlyCommitted + ", "
"partitionStatus: " + fetchPartitionStatus + "]"
}
● This String is only used in trace log
● This fix reduces P99 latency by a few ms
case class FetchMetadata(...) {
override def toString() = {
"[minBytes: " + fetchMinBytes + ", " +
"onlyLeader:" + fetchOnlyLeader + ", "
"onlyCommitted: " + fetchOnlyCommitted + ", "
"partitionStatus: " + fetchPartitionStatus + "]"
}
}](https://image.slidesharecdn.com/kafkaat-least-onceperformanceimprovements-171208210715/75/Improving-Kafka-at-least-once-performance-at-Uber-14-2048.jpg)
![Improvement #4: Follower fetch protocol
Fetch Response (Version: 3) => {
throttle_time_ms => INT32
responses => [
topic => STRING
partition_responses => [
partition_header => {
partition => INT32
error_code => INT16
high_watermark => INT64
}
record_set => {RECORDS}
] * (# of partitions)
] * (# of topics)
}
Fetch Request (Version: 3) => {
replica_id => INT32
max_wait_time => INT32
min_bytes => INT32
max_bytes => INT32
topics => [
topic => STRING
partitions => [
partition => INT32
fetch_offset => INT64
max_bytes => INT32
] * (#of partitions)
] * (# of topics)
}](https://image.slidesharecdn.com/kafkaat-least-onceperformanceimprovements-171208210715/75/Improving-Kafka-at-least-once-performance-at-Uber-15-2048.jpg)