Downloaded 640 times

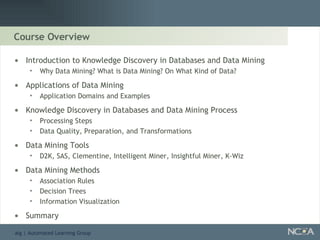

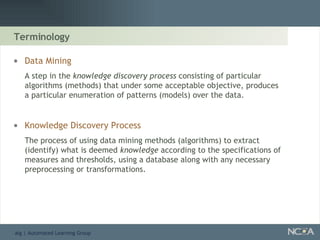


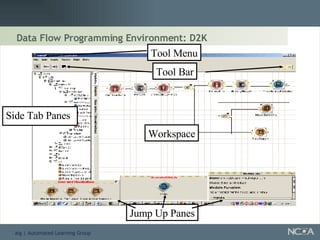
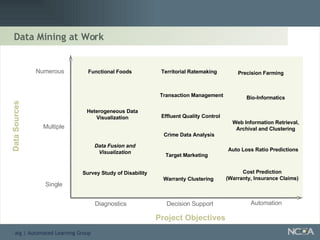
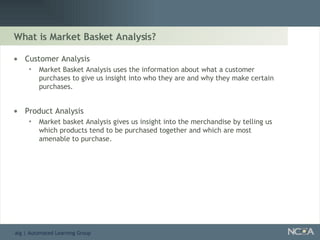


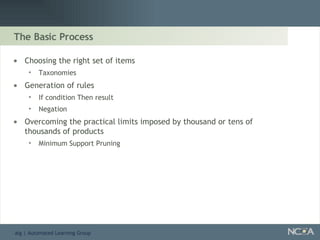
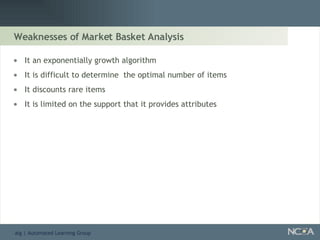
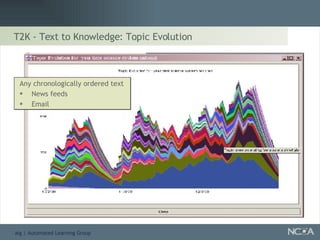
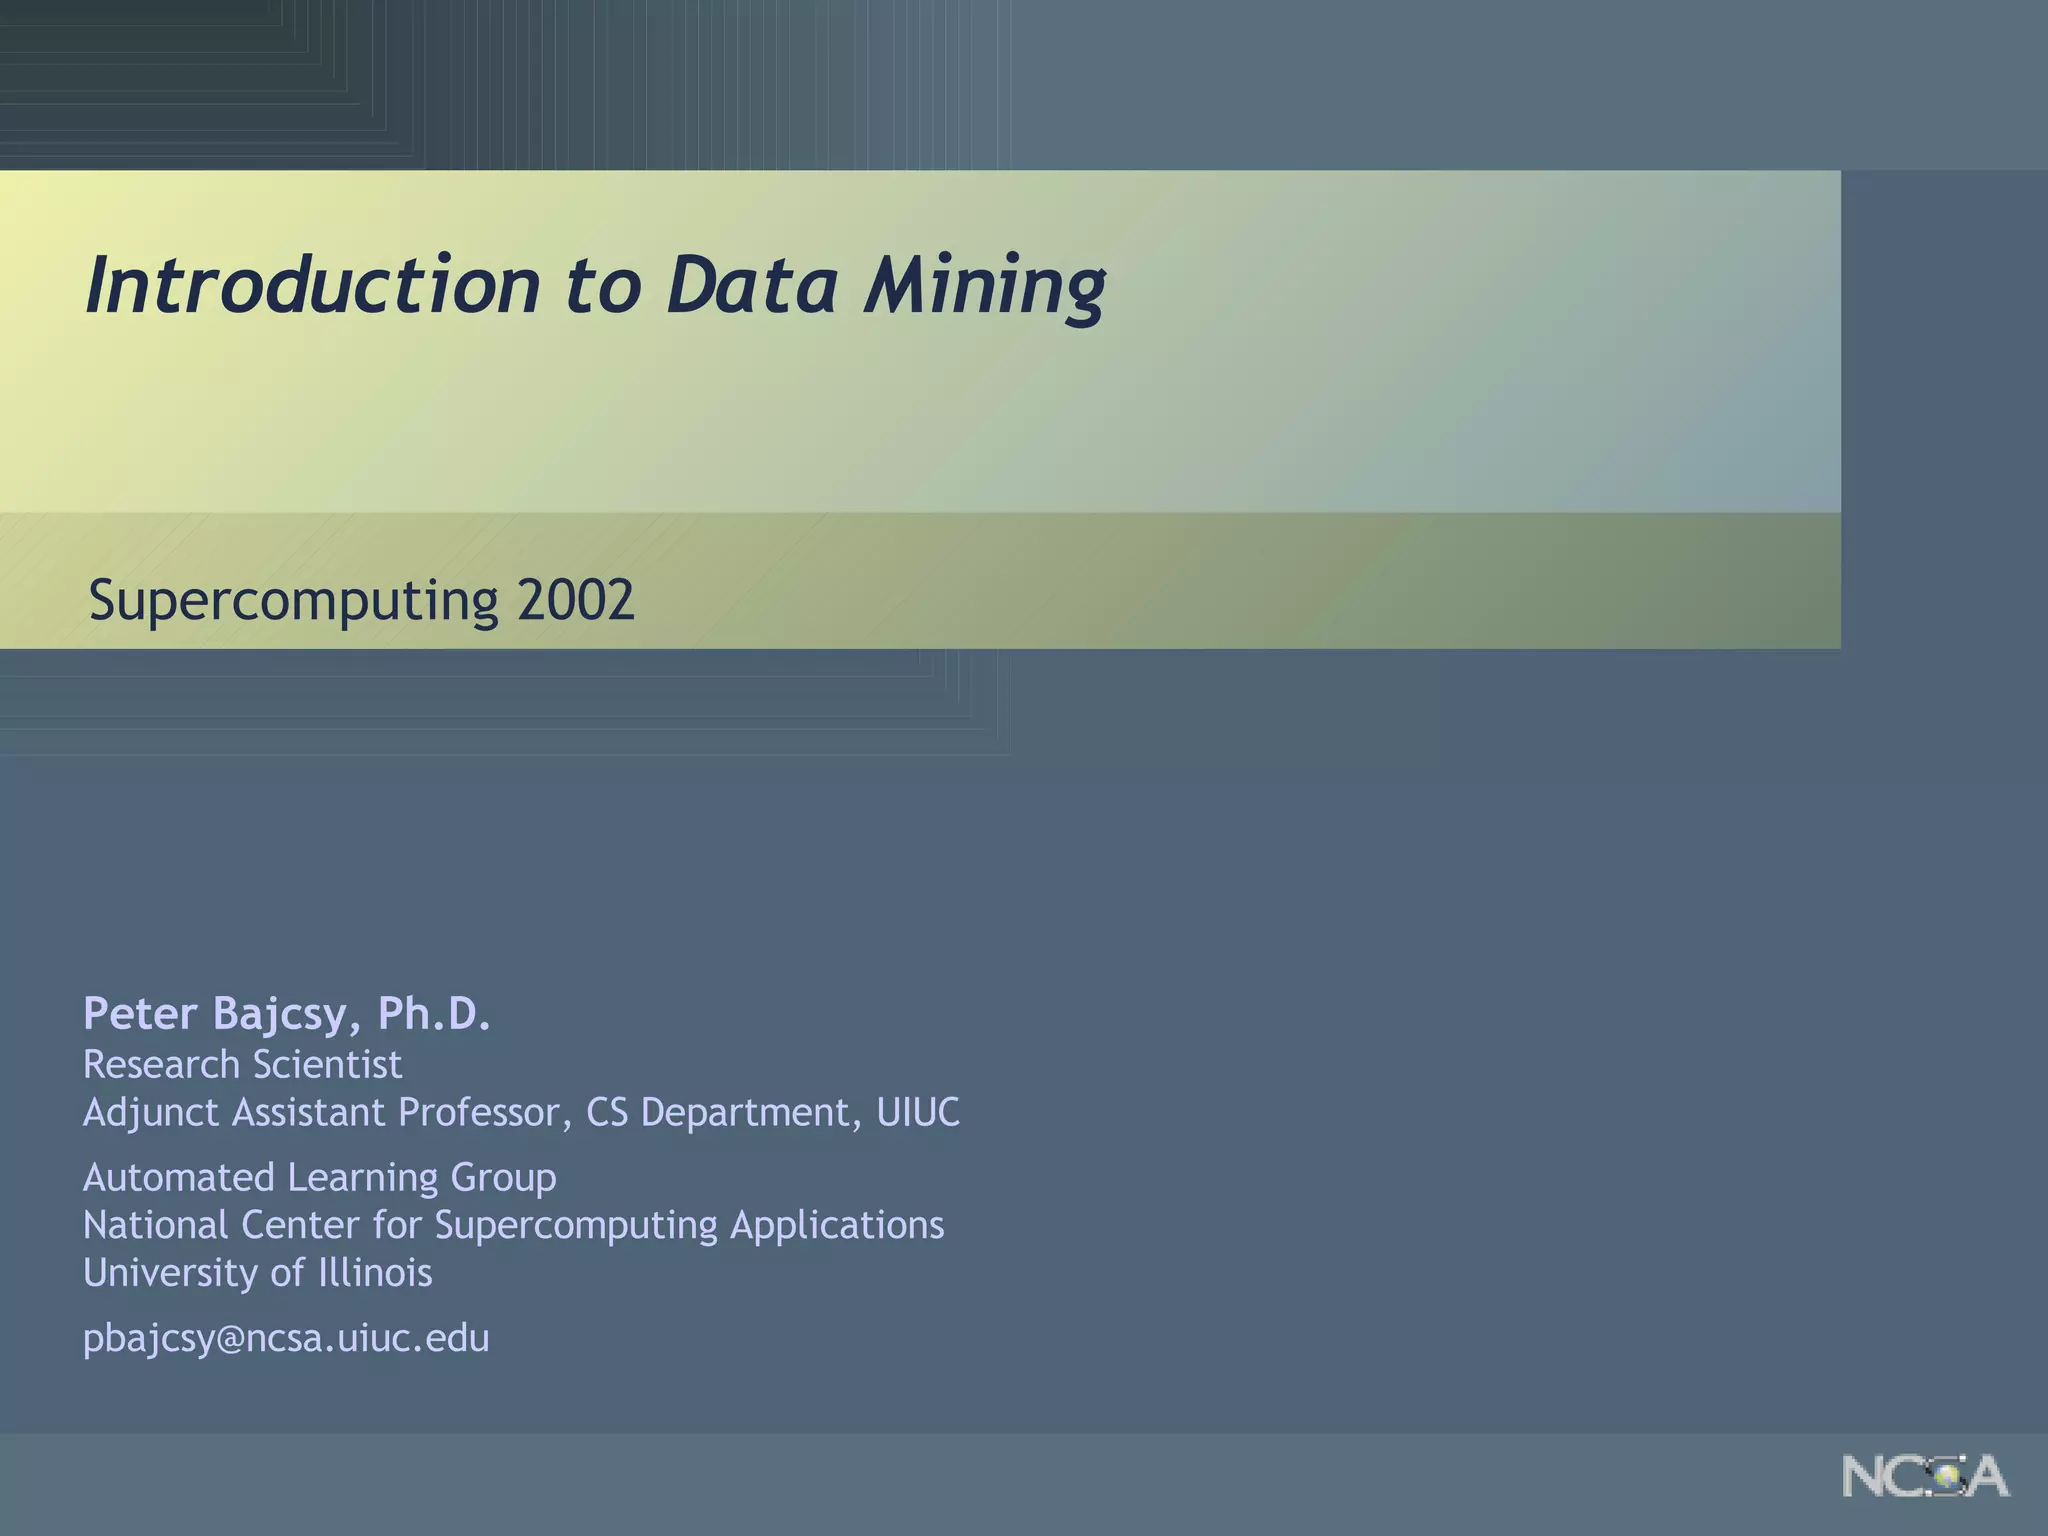
![Other Association Rule Applications Quantitative Association Rules Age[35..40] and Married[Yes] -> NumCars[2] Association Rules with Constraints Find all association rules where the prices of items are > 100 dollars Temporal Association Rules Diaper -> Beer (1% support, 80% confidence) Diaper -> Beer (20%support) 7:00-9:00 PM weekdays Optimized Association Rules Given a rule (l < A < u) and X -> Y, Find values for l and u such that support greater than certain threshold and maximizes a support and confidence. Check Balance [$ 30,000 .. $50,000] -> Certificate of Deposit (CD)= Yes +](https://image.slidesharecdn.com/introduction-to-data-mining1872/85/Introduction-To-Data-Mining-52-320.jpg)

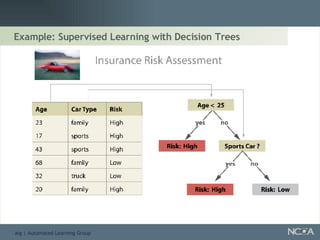
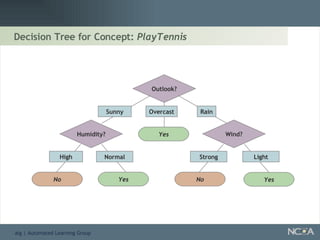
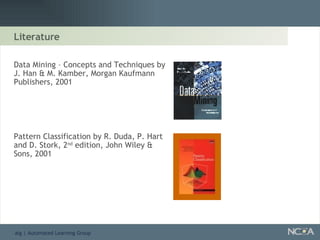
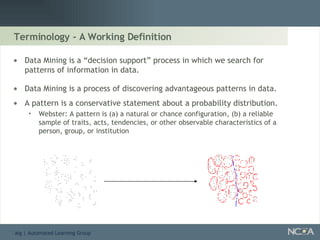
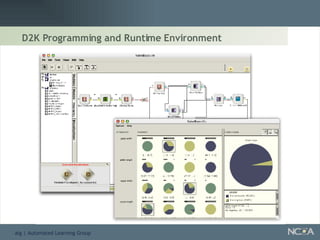
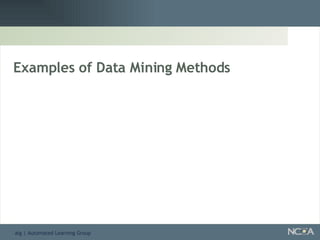
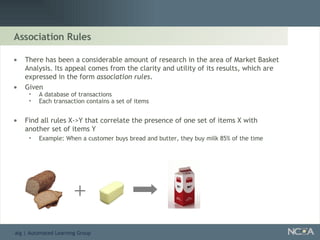
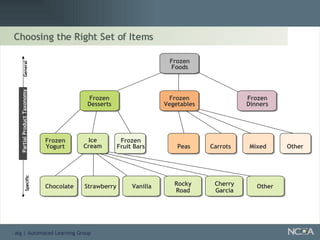
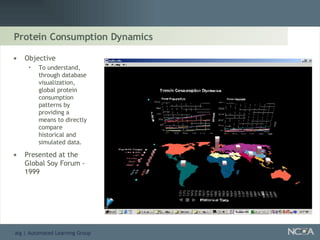
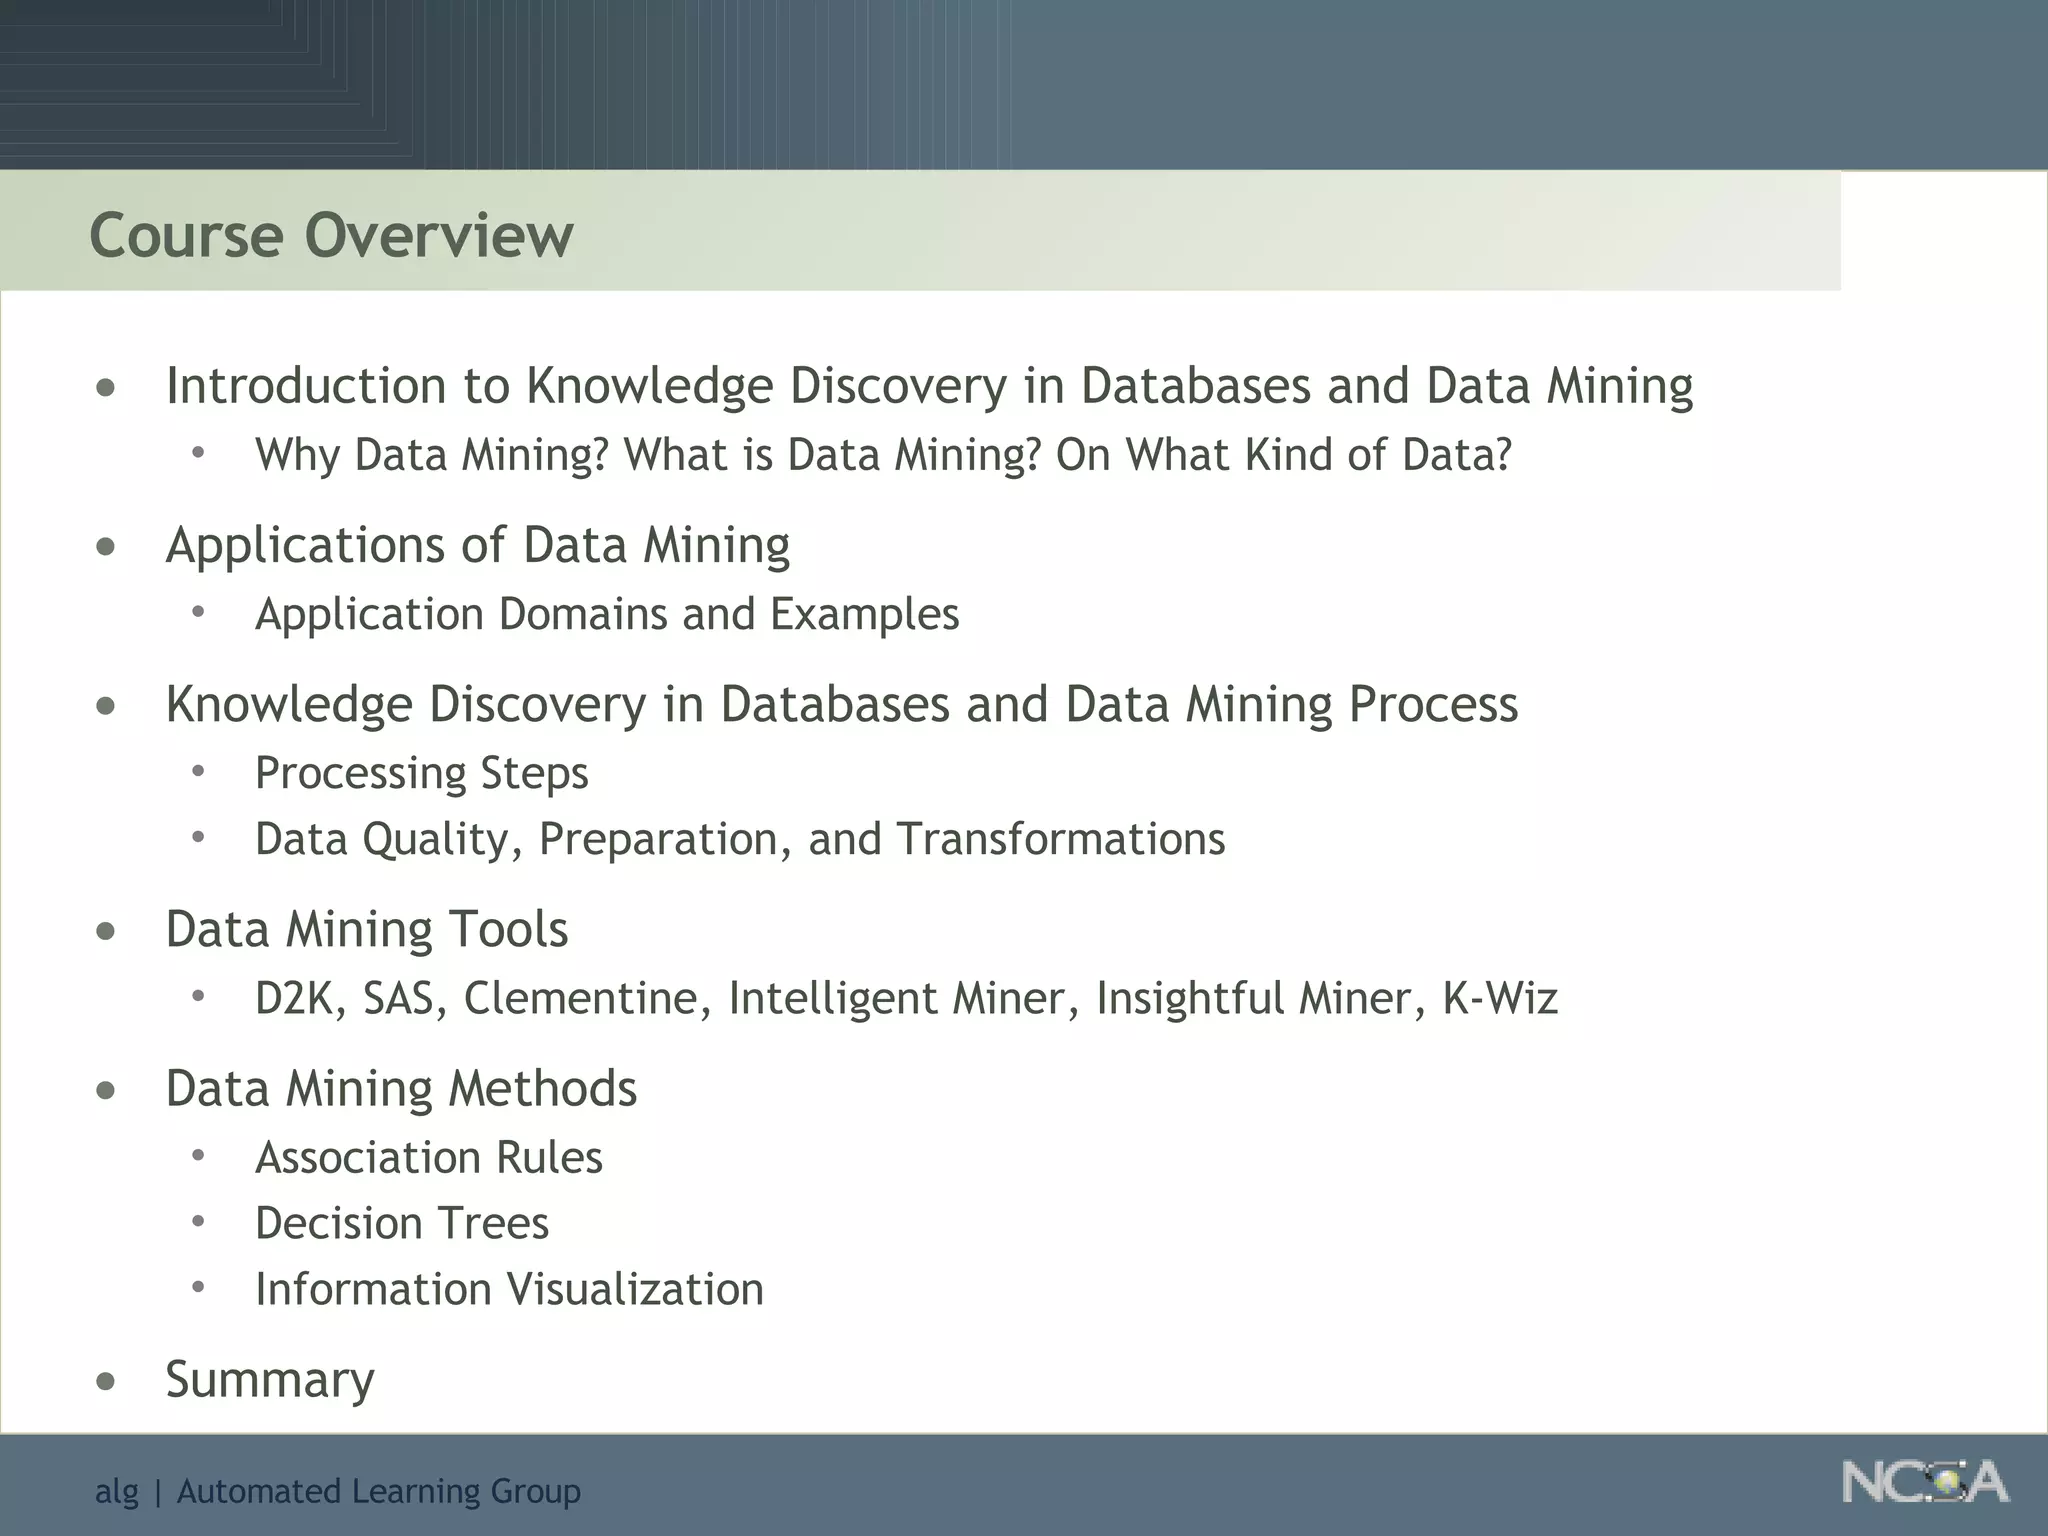
![Constructing a Decision Tree for PlayTennis [9+, 5-] E(D) = min(9/14, 5/14) = 5/14 = 36% The Initial Decision Tree with One Leaf Goal: maximize error reduction E, where the error reduction relative to attribute A is the expected reduction in error due to splitting on A: Question: What attribute A and what value of A should we split on? 1 2 3 4 5 6 7 8 9 10 11 12 13 14 Day Sunny Sunny Overcast Rain Rain Rain Overcast Sunny Sunny Rain Sunny Overcast Overcast Rain Hot Hot Hot Mild Cool Cool Cool Mild Cool Mild Mild Mild Hot Mild Temperature Humidity Wind Play Tennis? High High High High Normal Normal Normal High Normal Normal Normal High Normal High Outlook Light Strong Light Light Light Strong Strong Light Light Light Strong Strong Light Strong No No Yes Yes Yes No Yes No Yes Yes Yes Yes Yes No](https://image.slidesharecdn.com/introduction-to-data-mining1872/85/Introduction-To-Data-Mining-62-320.jpg)
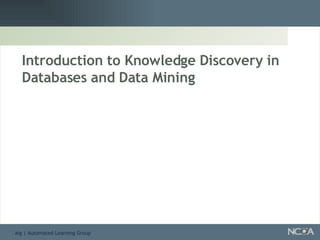
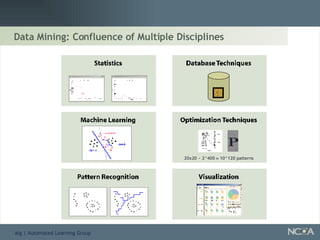
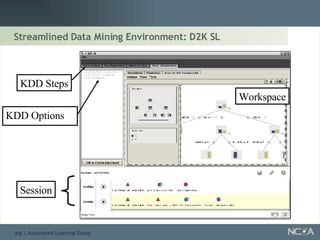
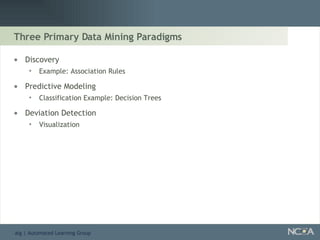
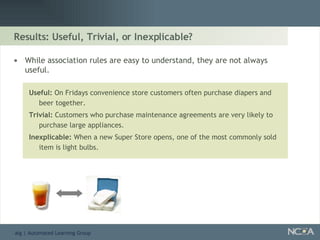
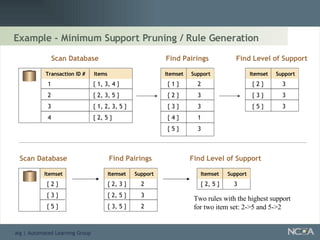
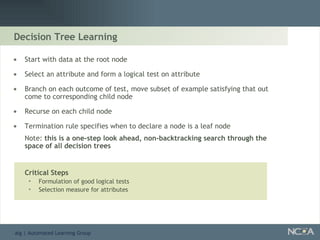
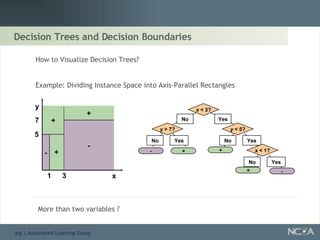
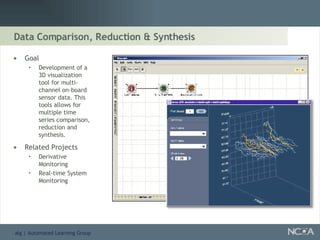
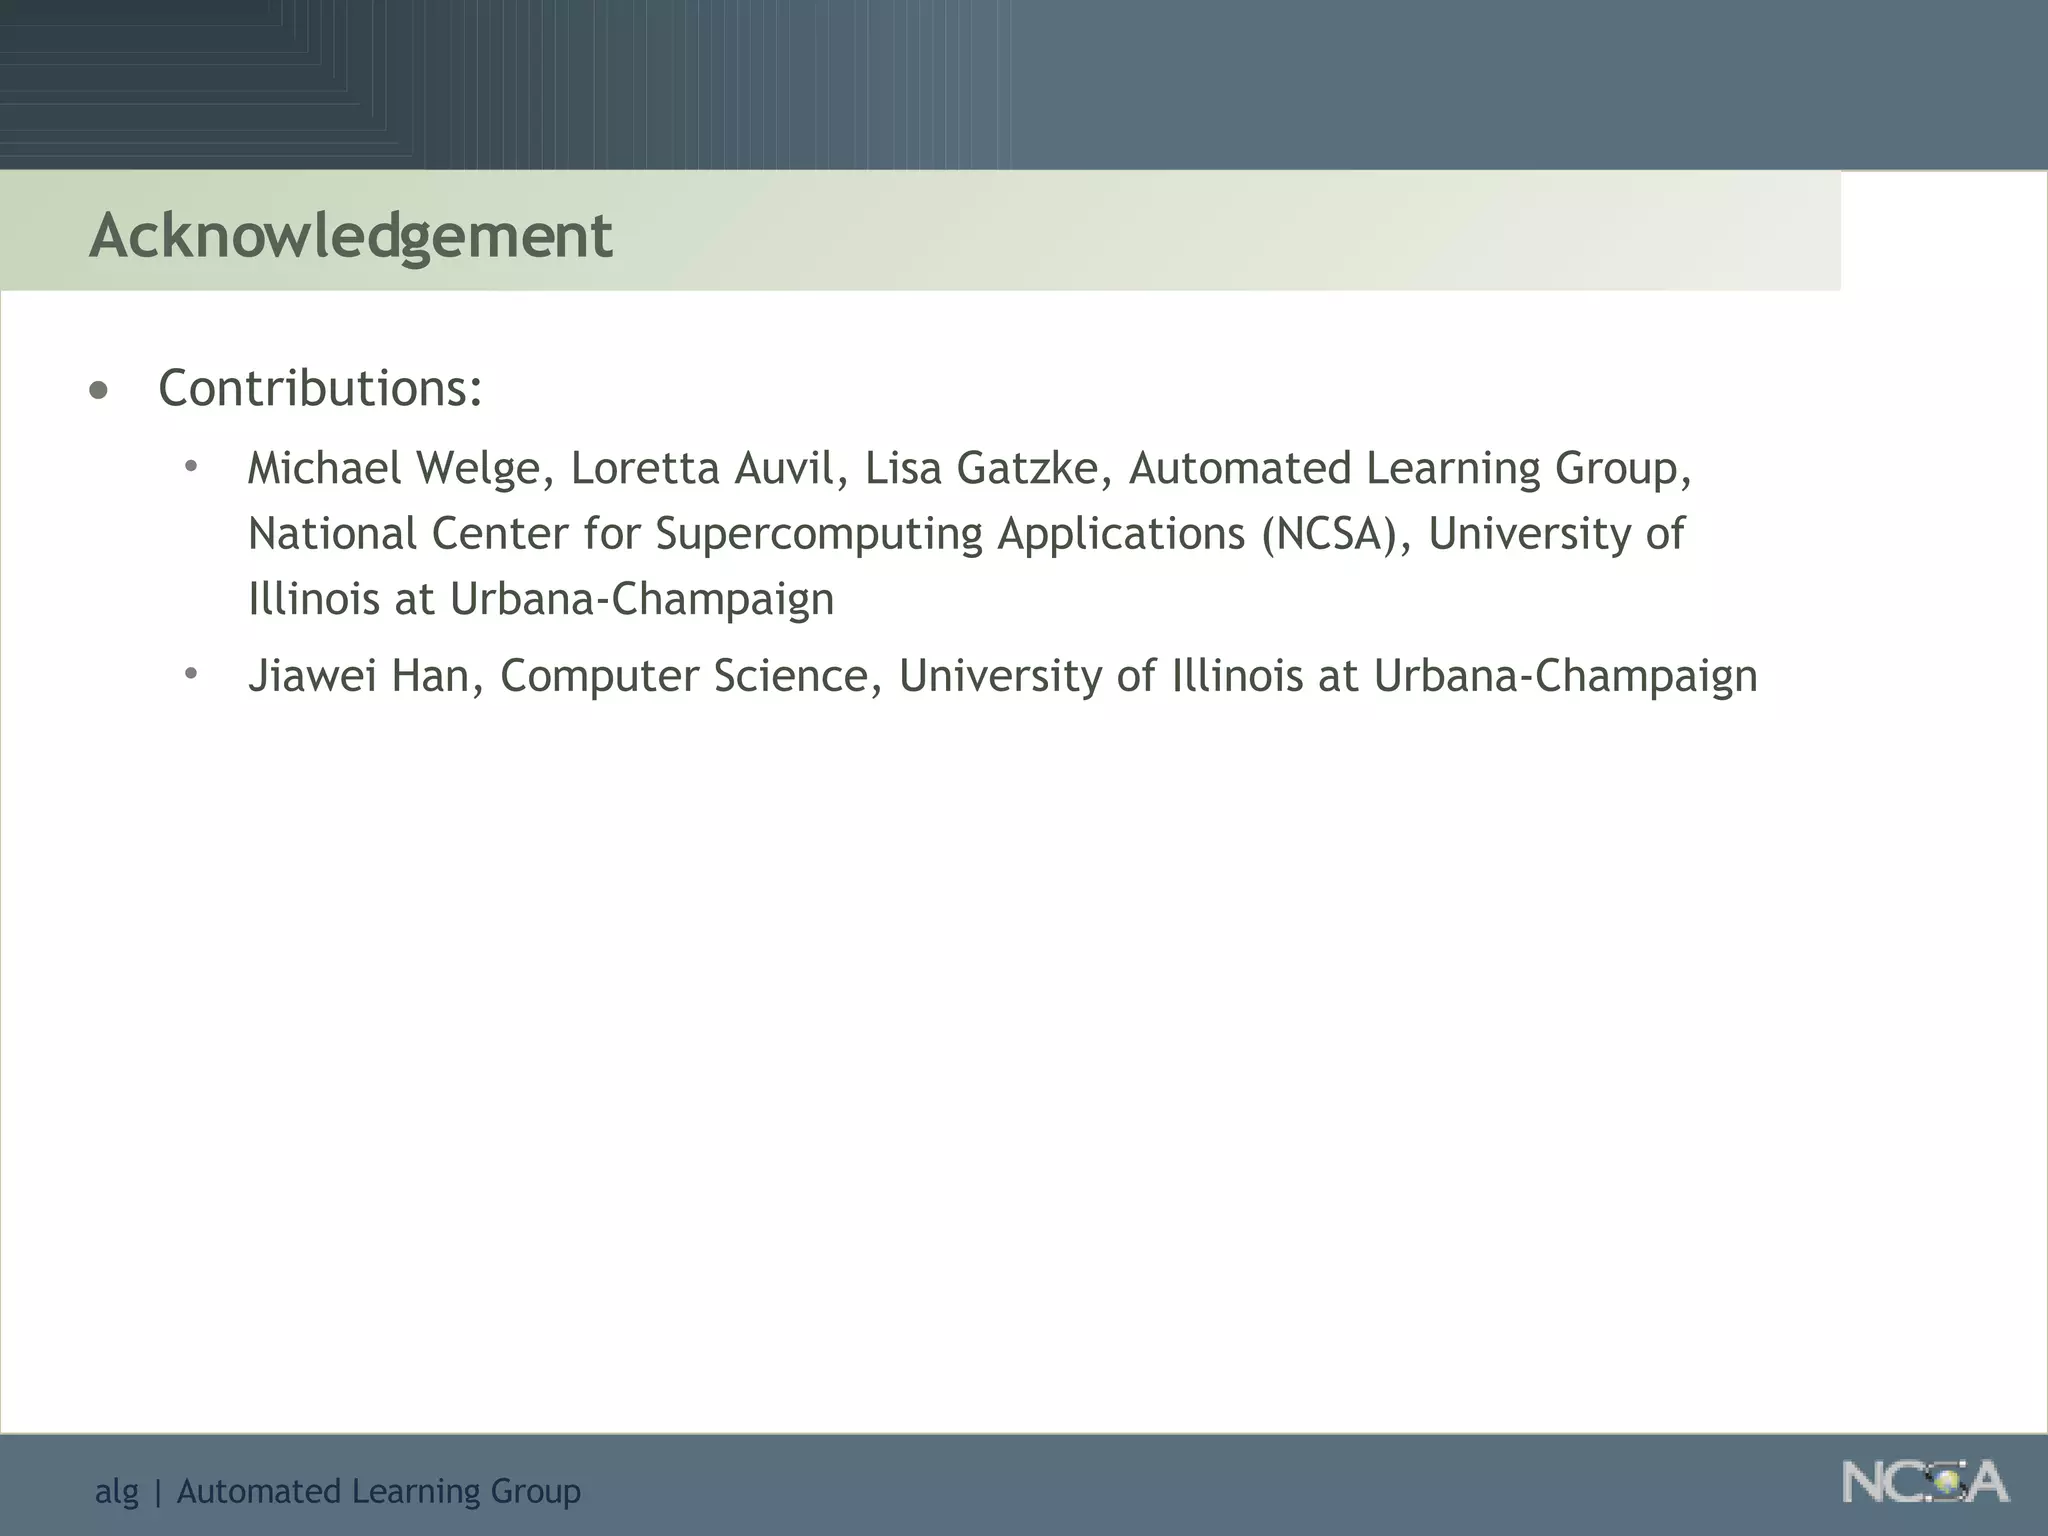
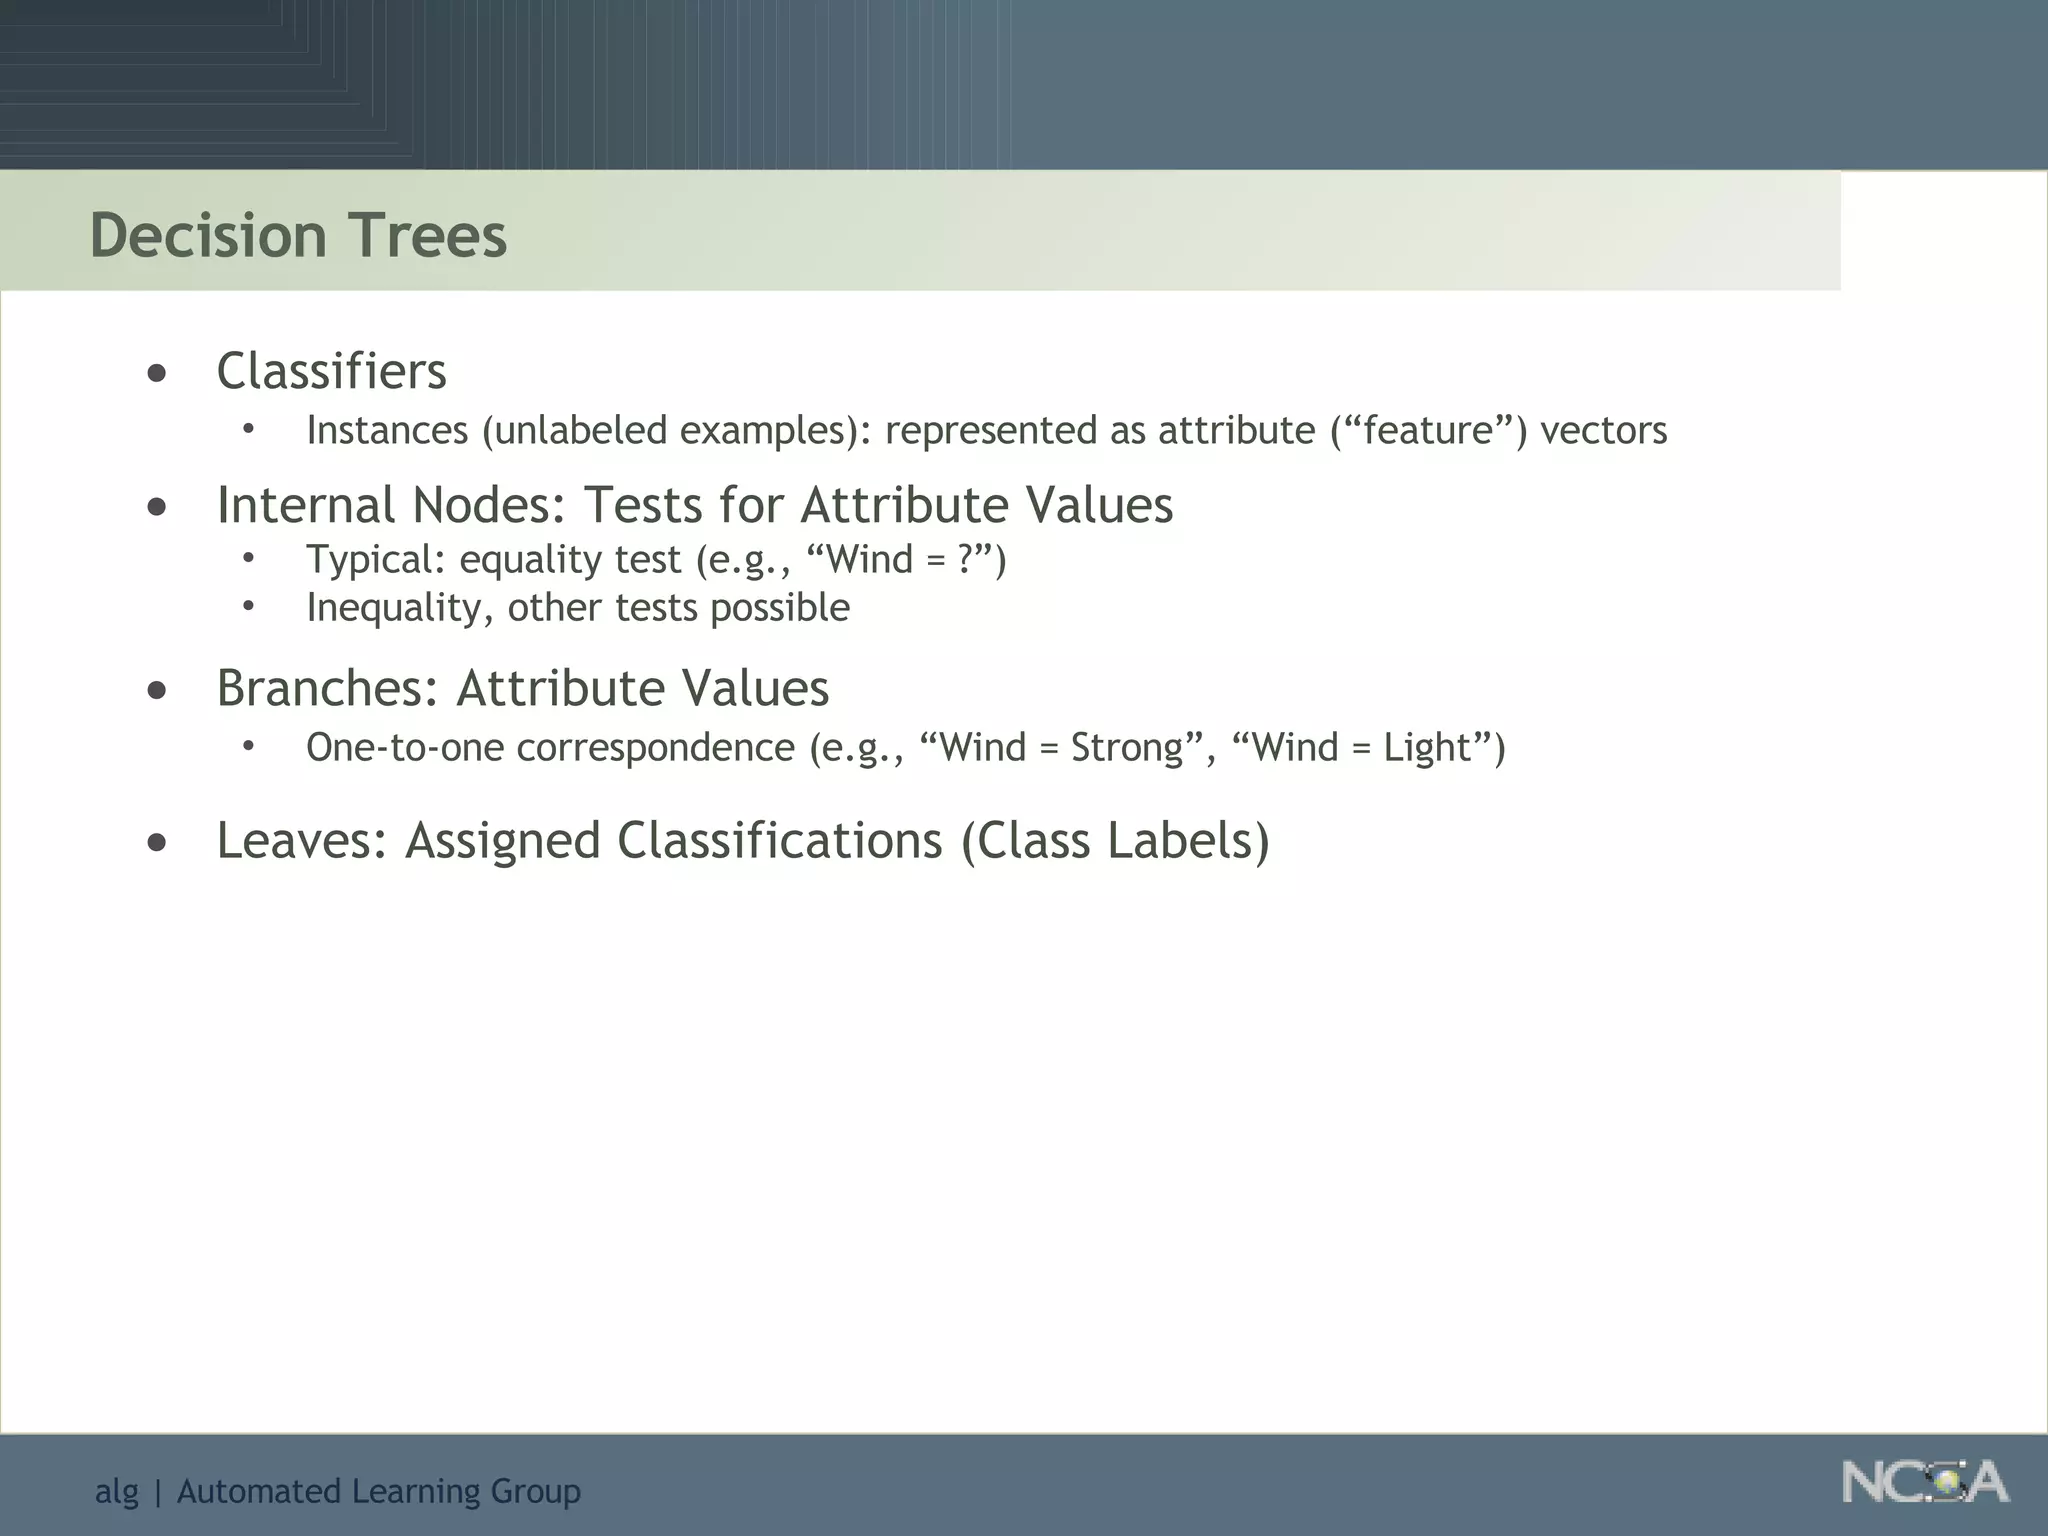
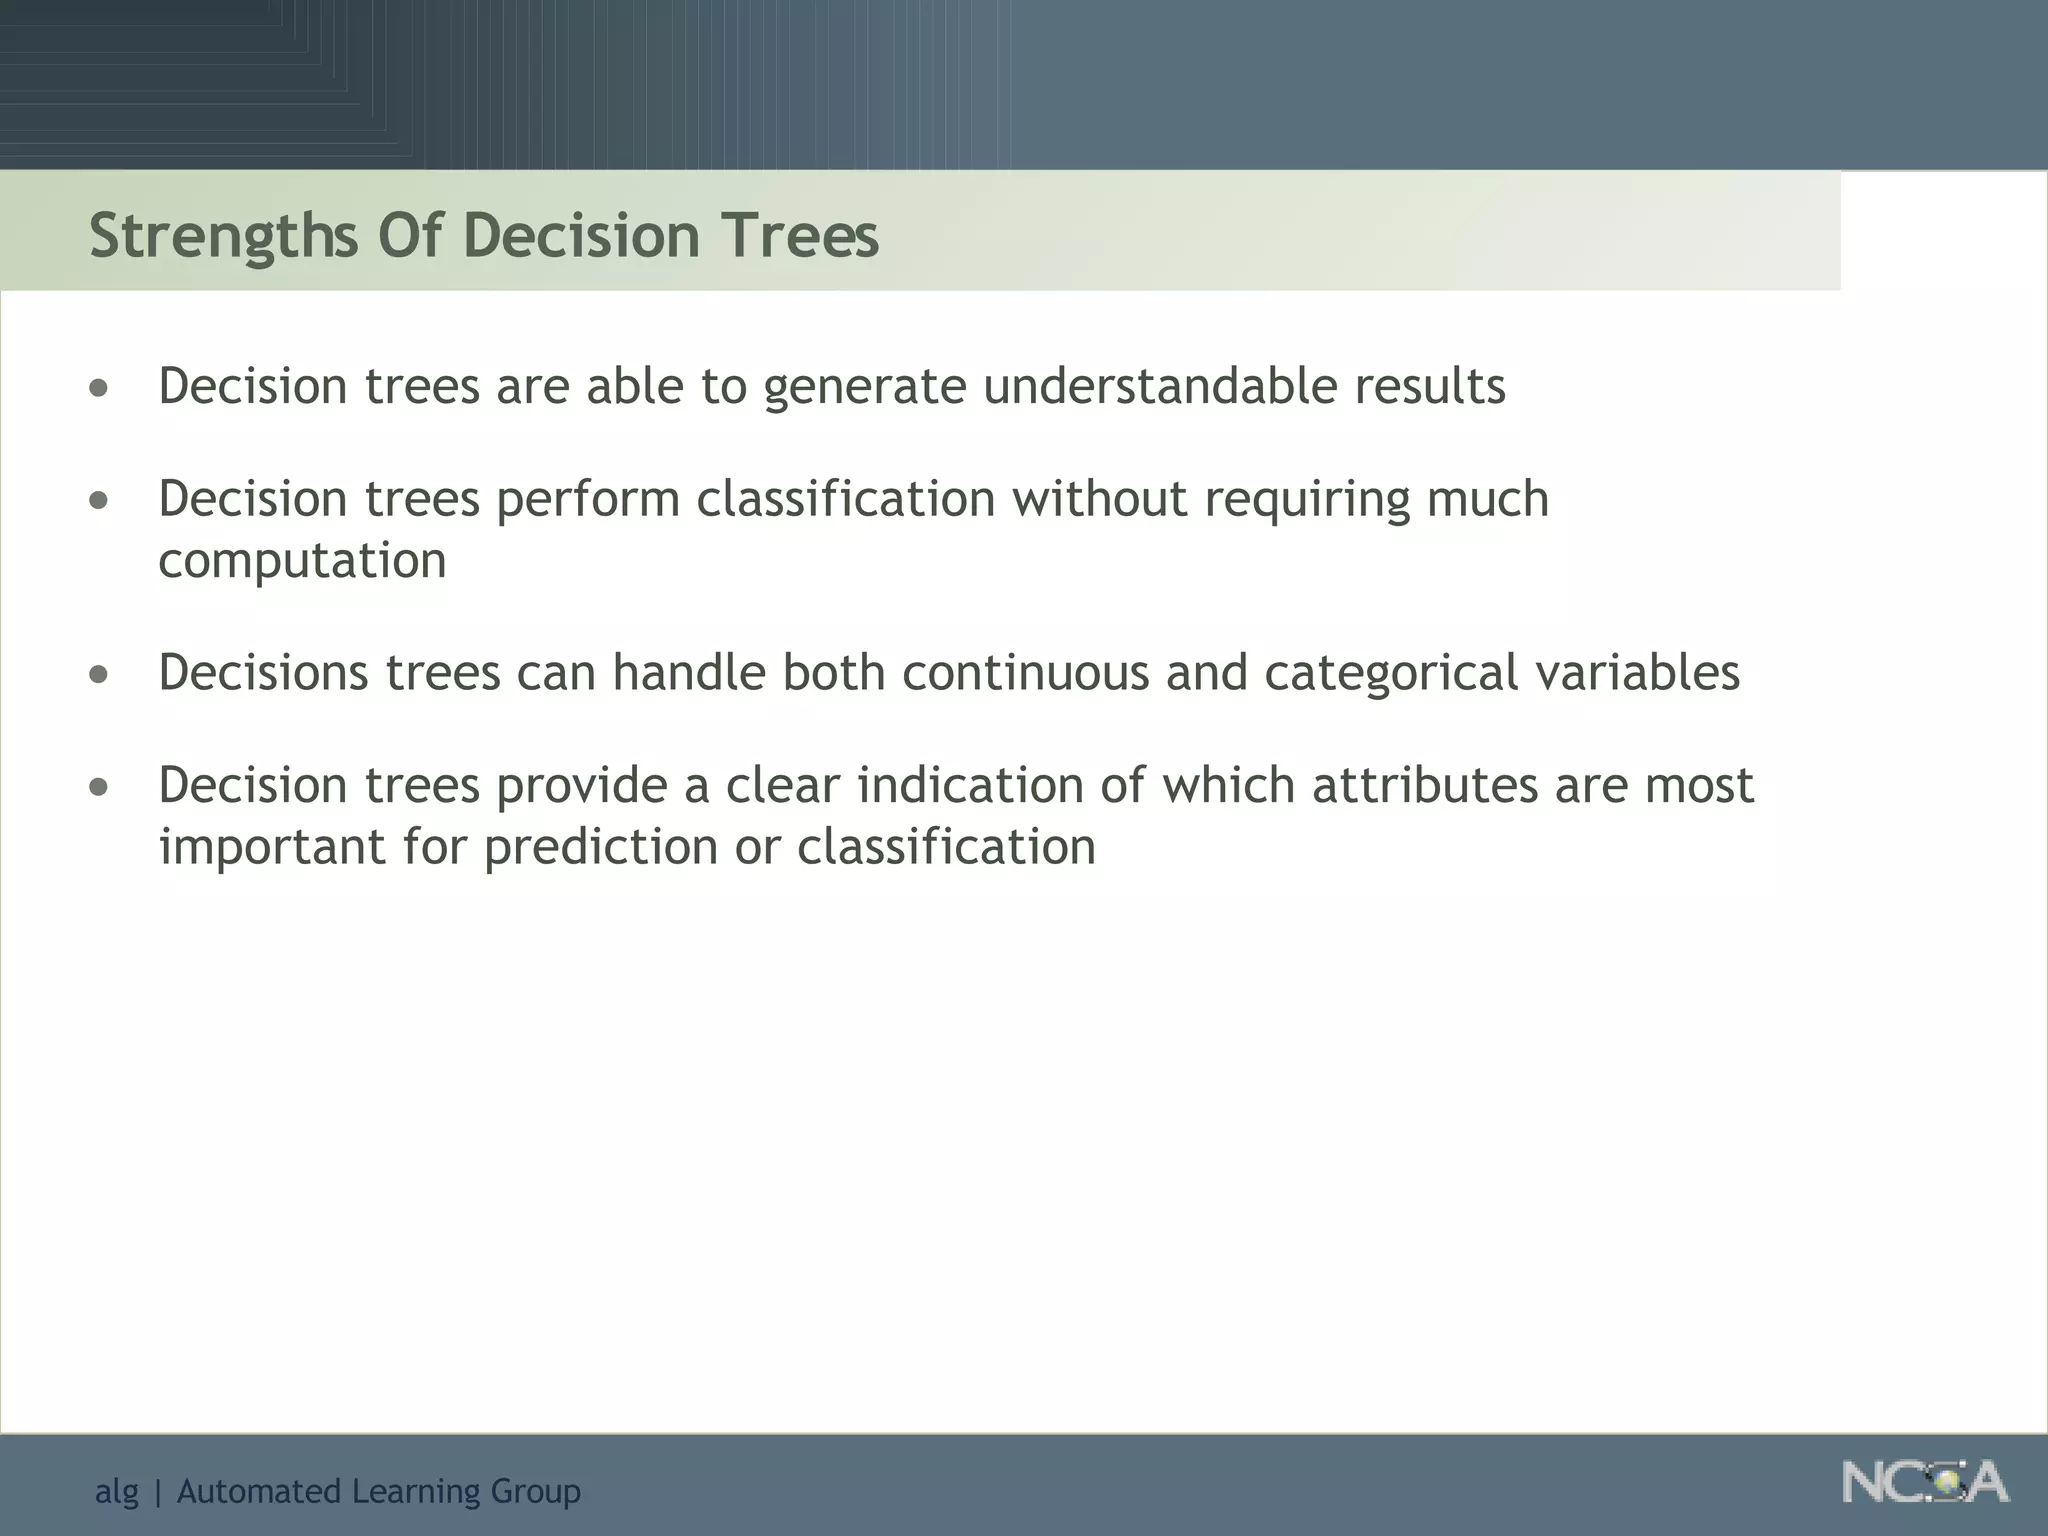
![Constructing a Decision Tree for PlayTennis Potential Splits of Root Node [3+, 4-] [6+, 1-] Humidity High Normal [9+, 5-] [6+, 2-] [3+, 3-] Wind Light Strong [9+, 5-] [2+, 3-] [3+, 2-] Outlook Sunny Rain [9+, 5-] Overcast [4+, 0-] [3+, 1-] [2+, 2-] Temperature Cool Hot [9+, 5-] Mild [4+, 2-] E(Split/Outlook) = (5/14) – ((5/14)(min(2/5,3/5)) + (4/14)(min(4/4,0/4)) + (5/14)(min(3/5,2/5))) = 7% E(Split/Temperature) = (5/14) – ((4/14)(min(3/4,1/4)) + (6/14)(min(4/6,2/6)) + (4/14)(min(2/4,2/4))) = 0% E(Split/Humidity) = (5/14) – ((7/14)(min(3/7,4/7)) + (7/14)(min(6/7,1/7))) = 7% E(Split/Wind) = (5/14) – ((8/14)(min(6/8,2/8)) + (6/14)(min(3/6,3/6))) = 0%](https://image.slidesharecdn.com/introduction-to-data-mining1872/85/Introduction-To-Data-Mining-63-320.jpg)
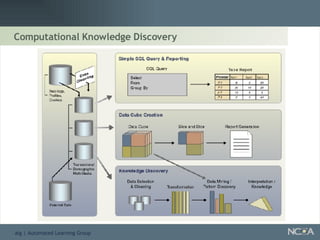
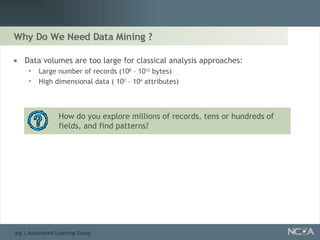
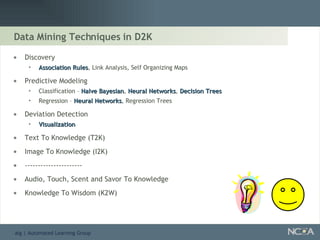
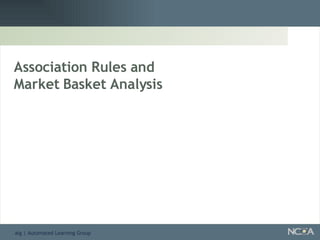
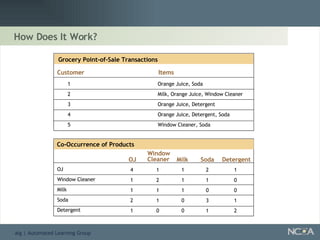
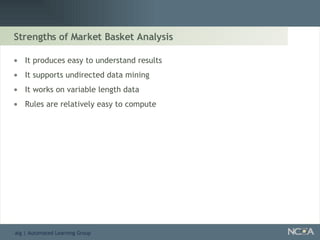
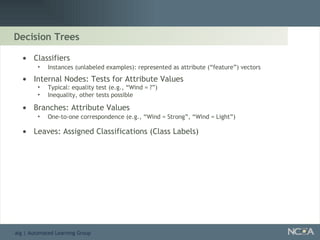
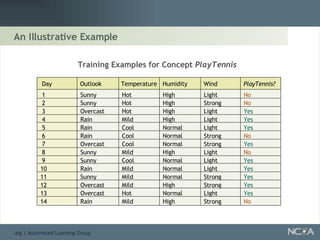
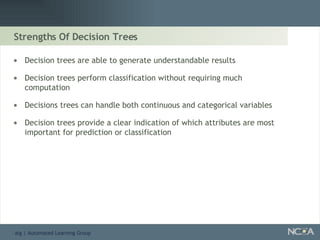
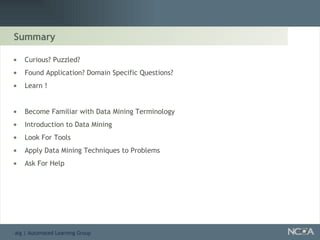
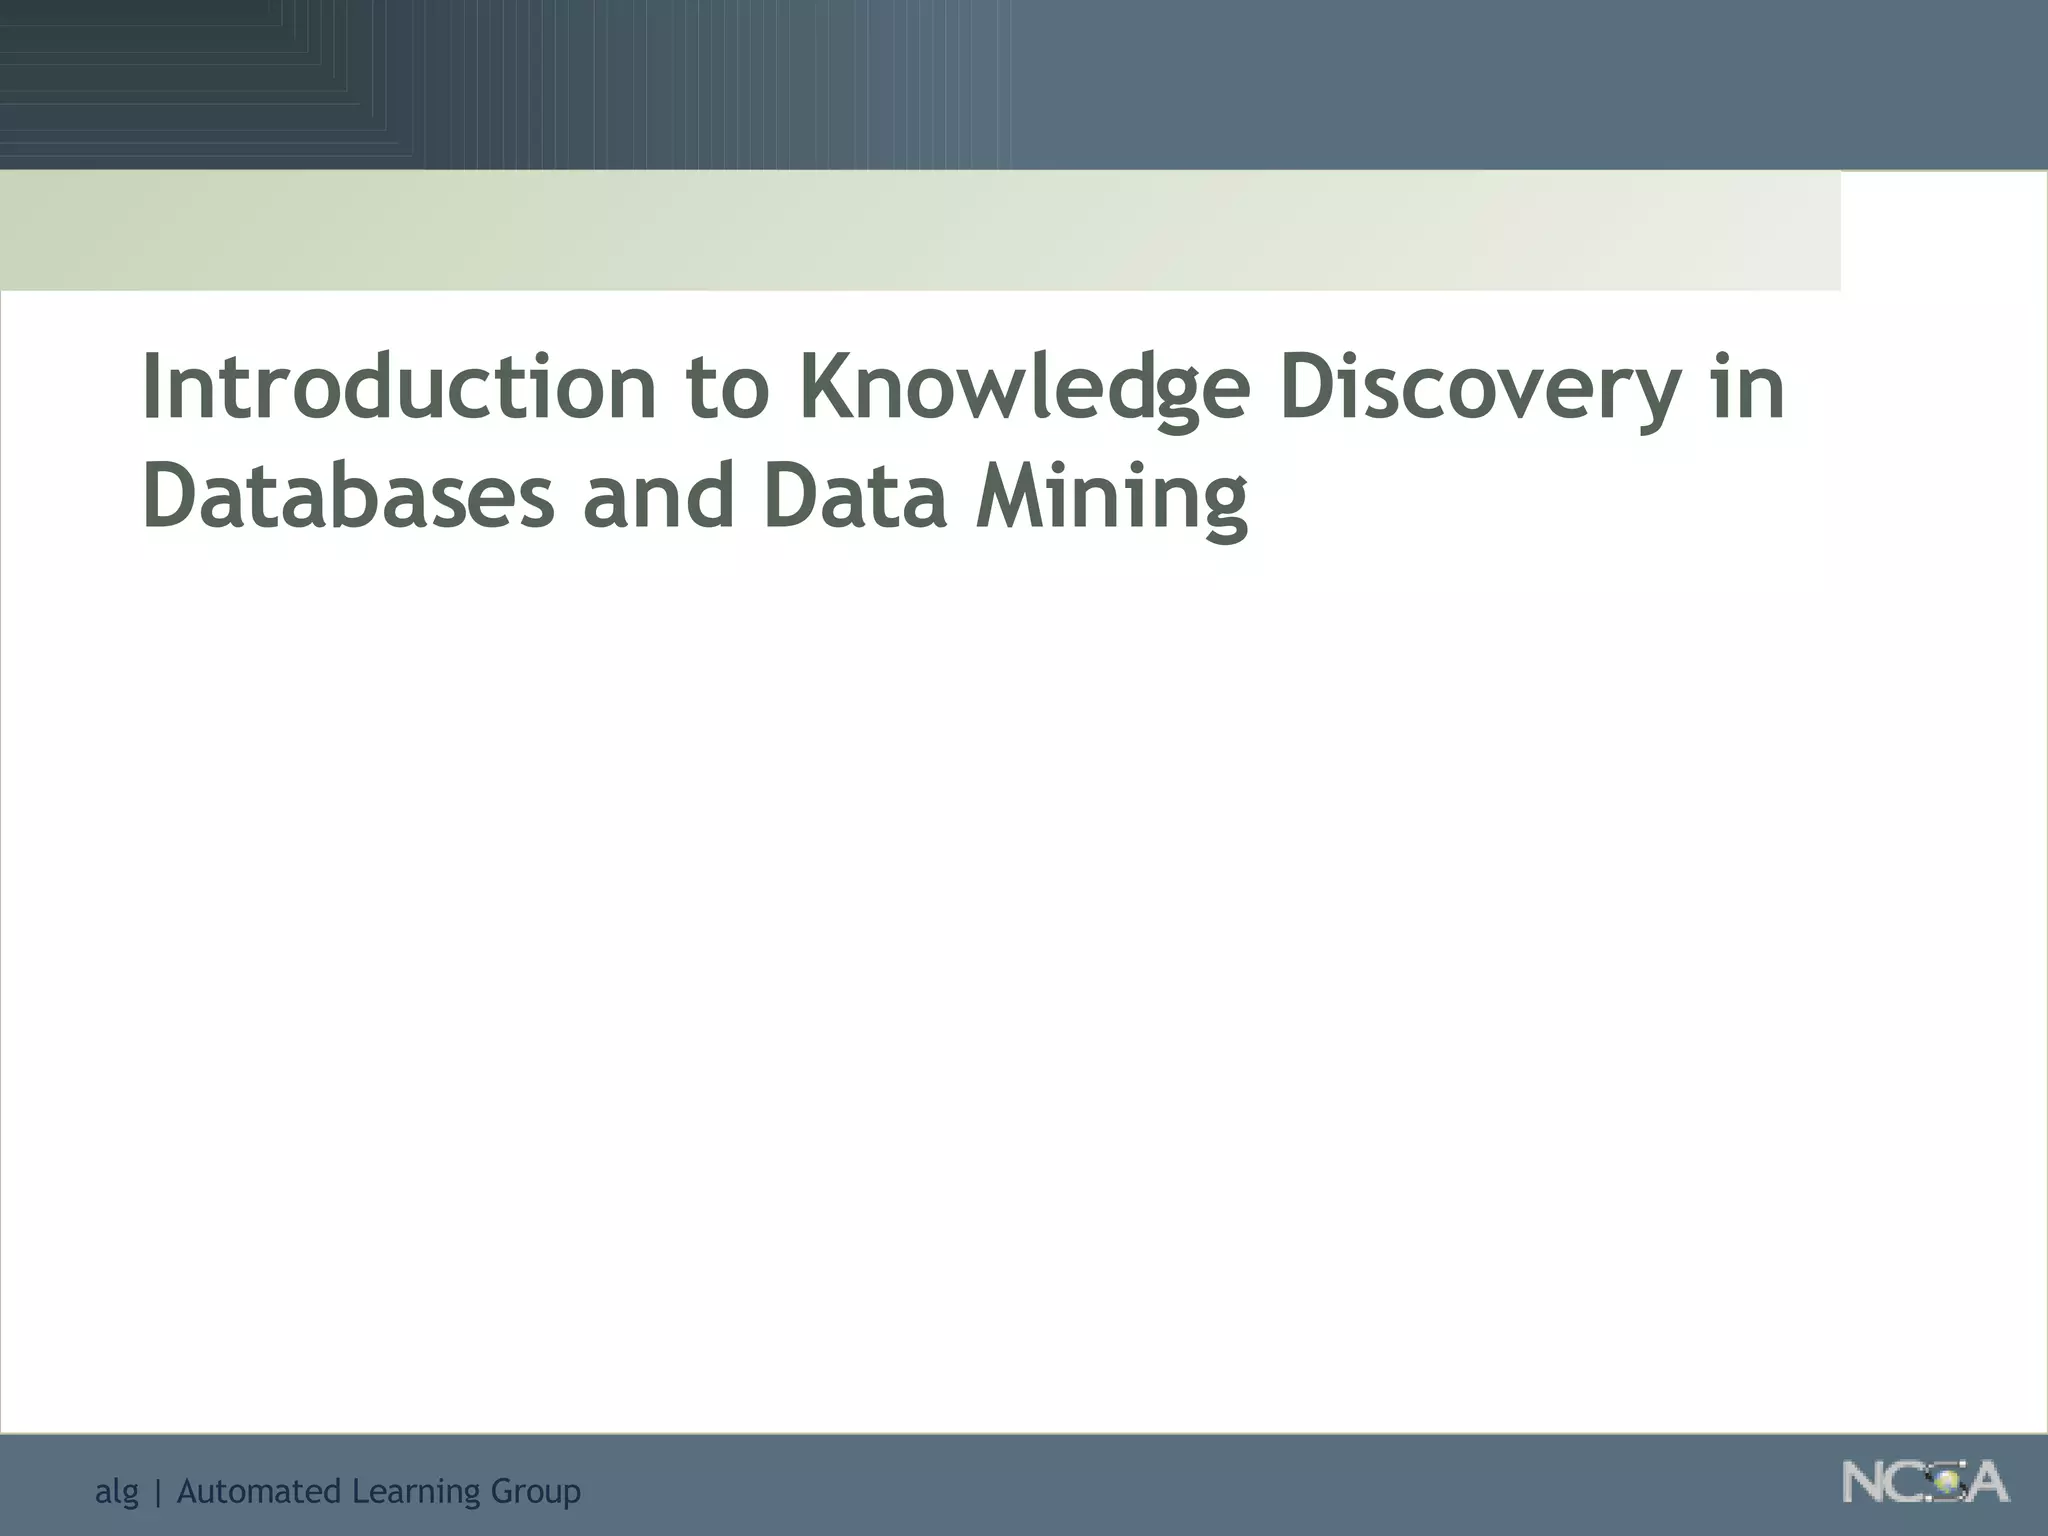
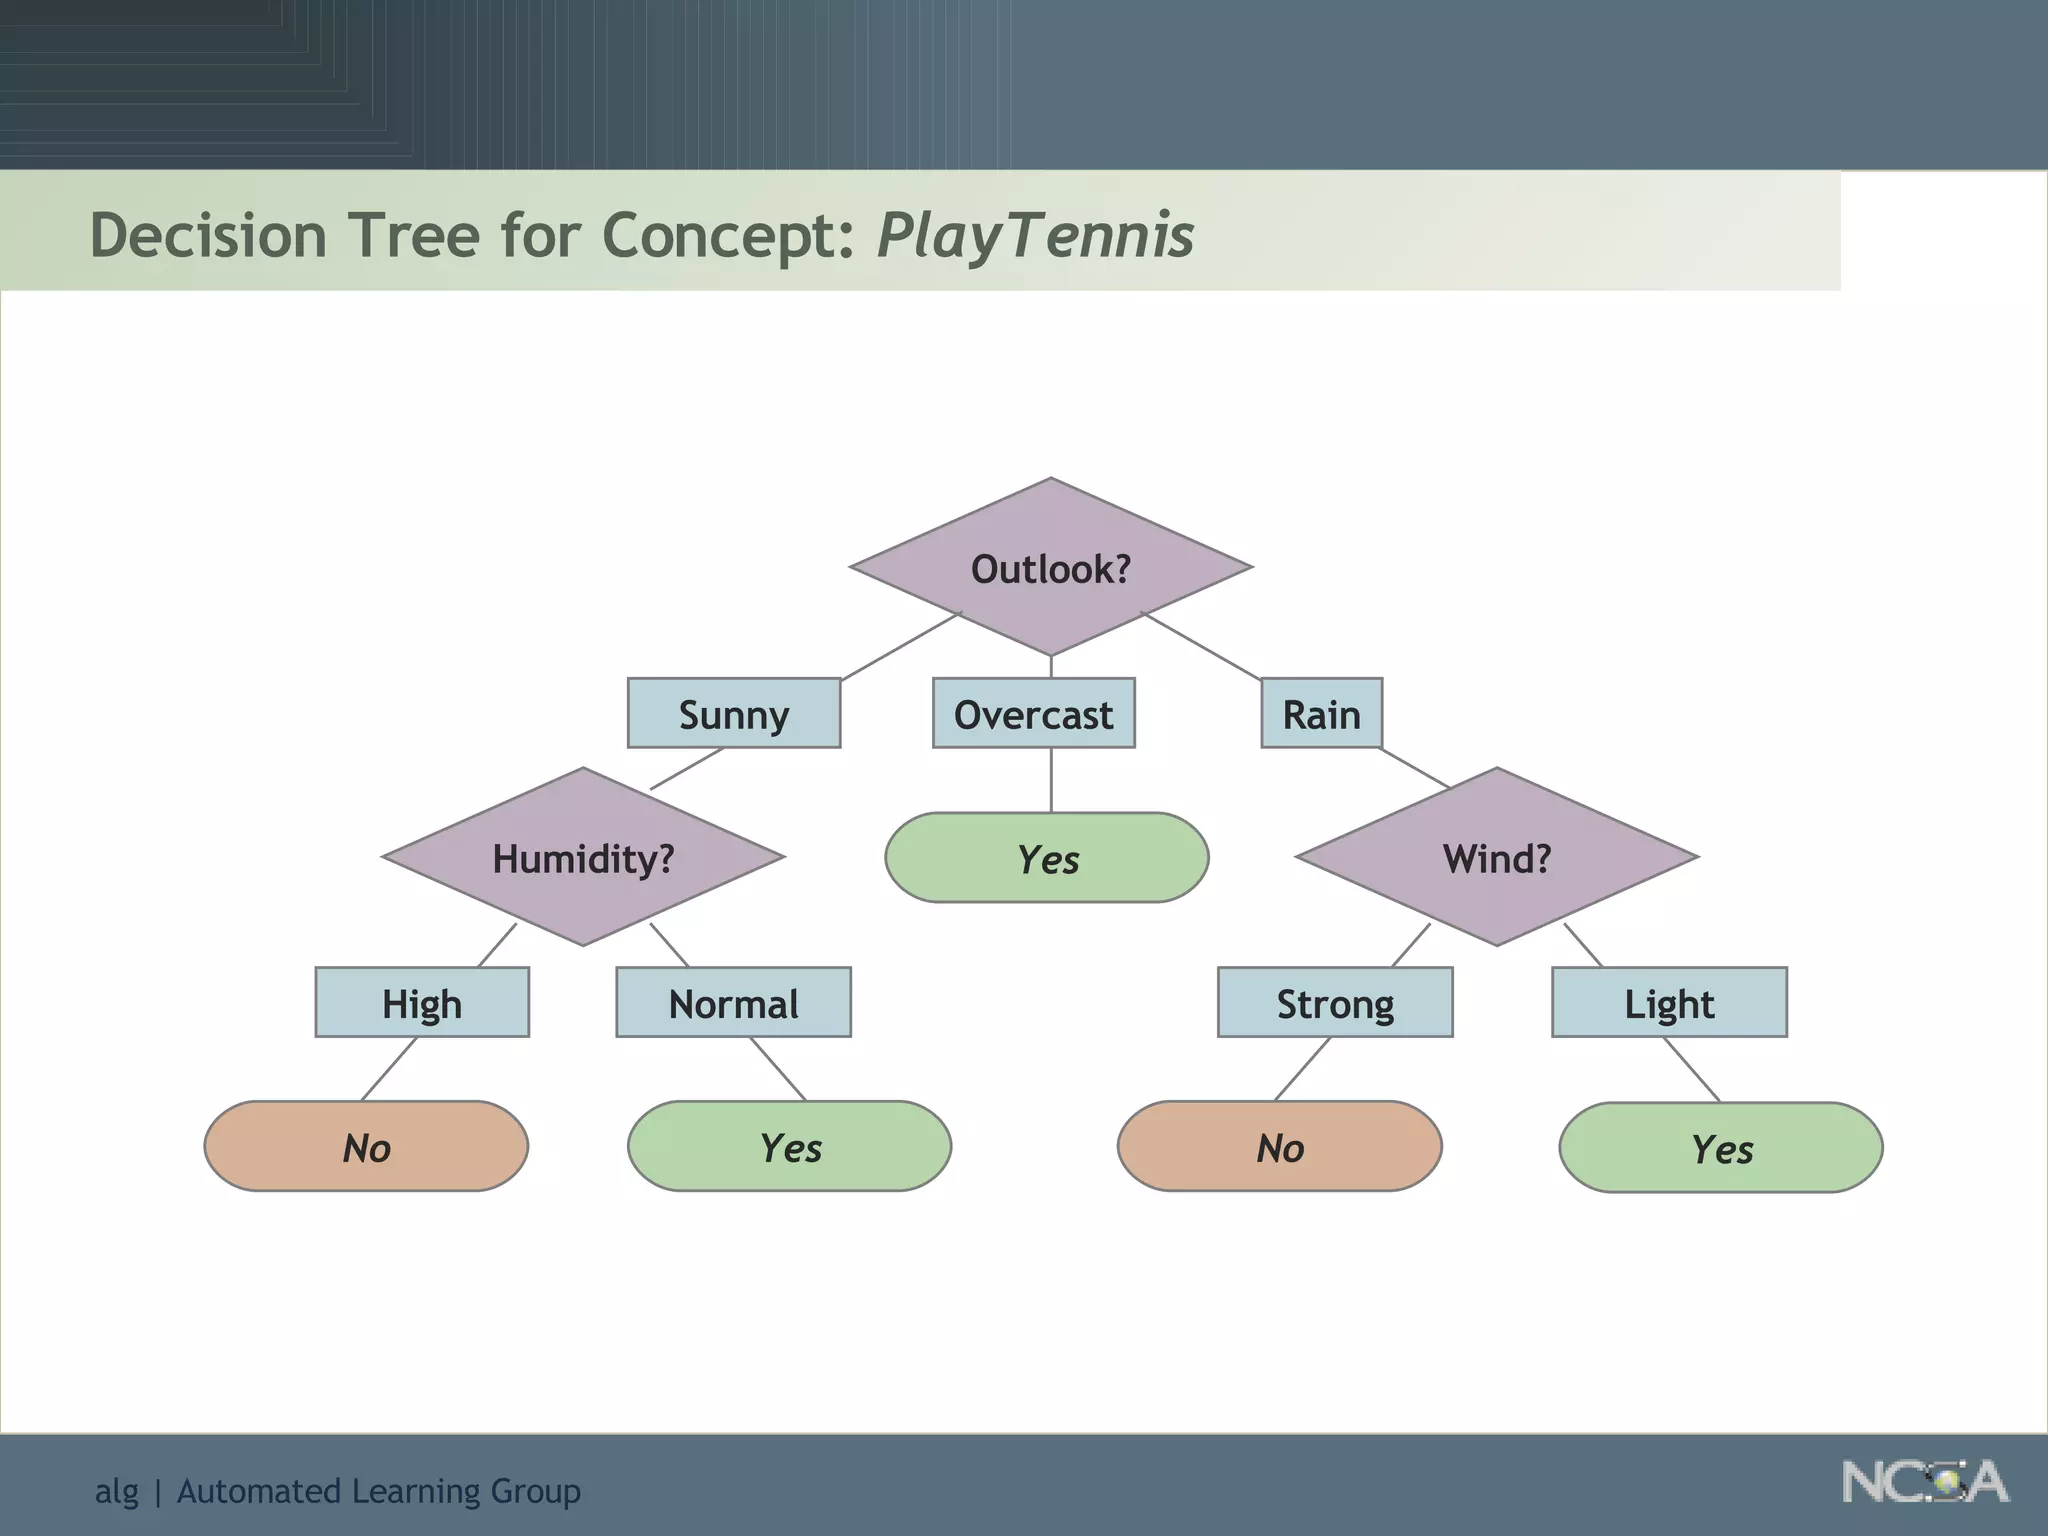
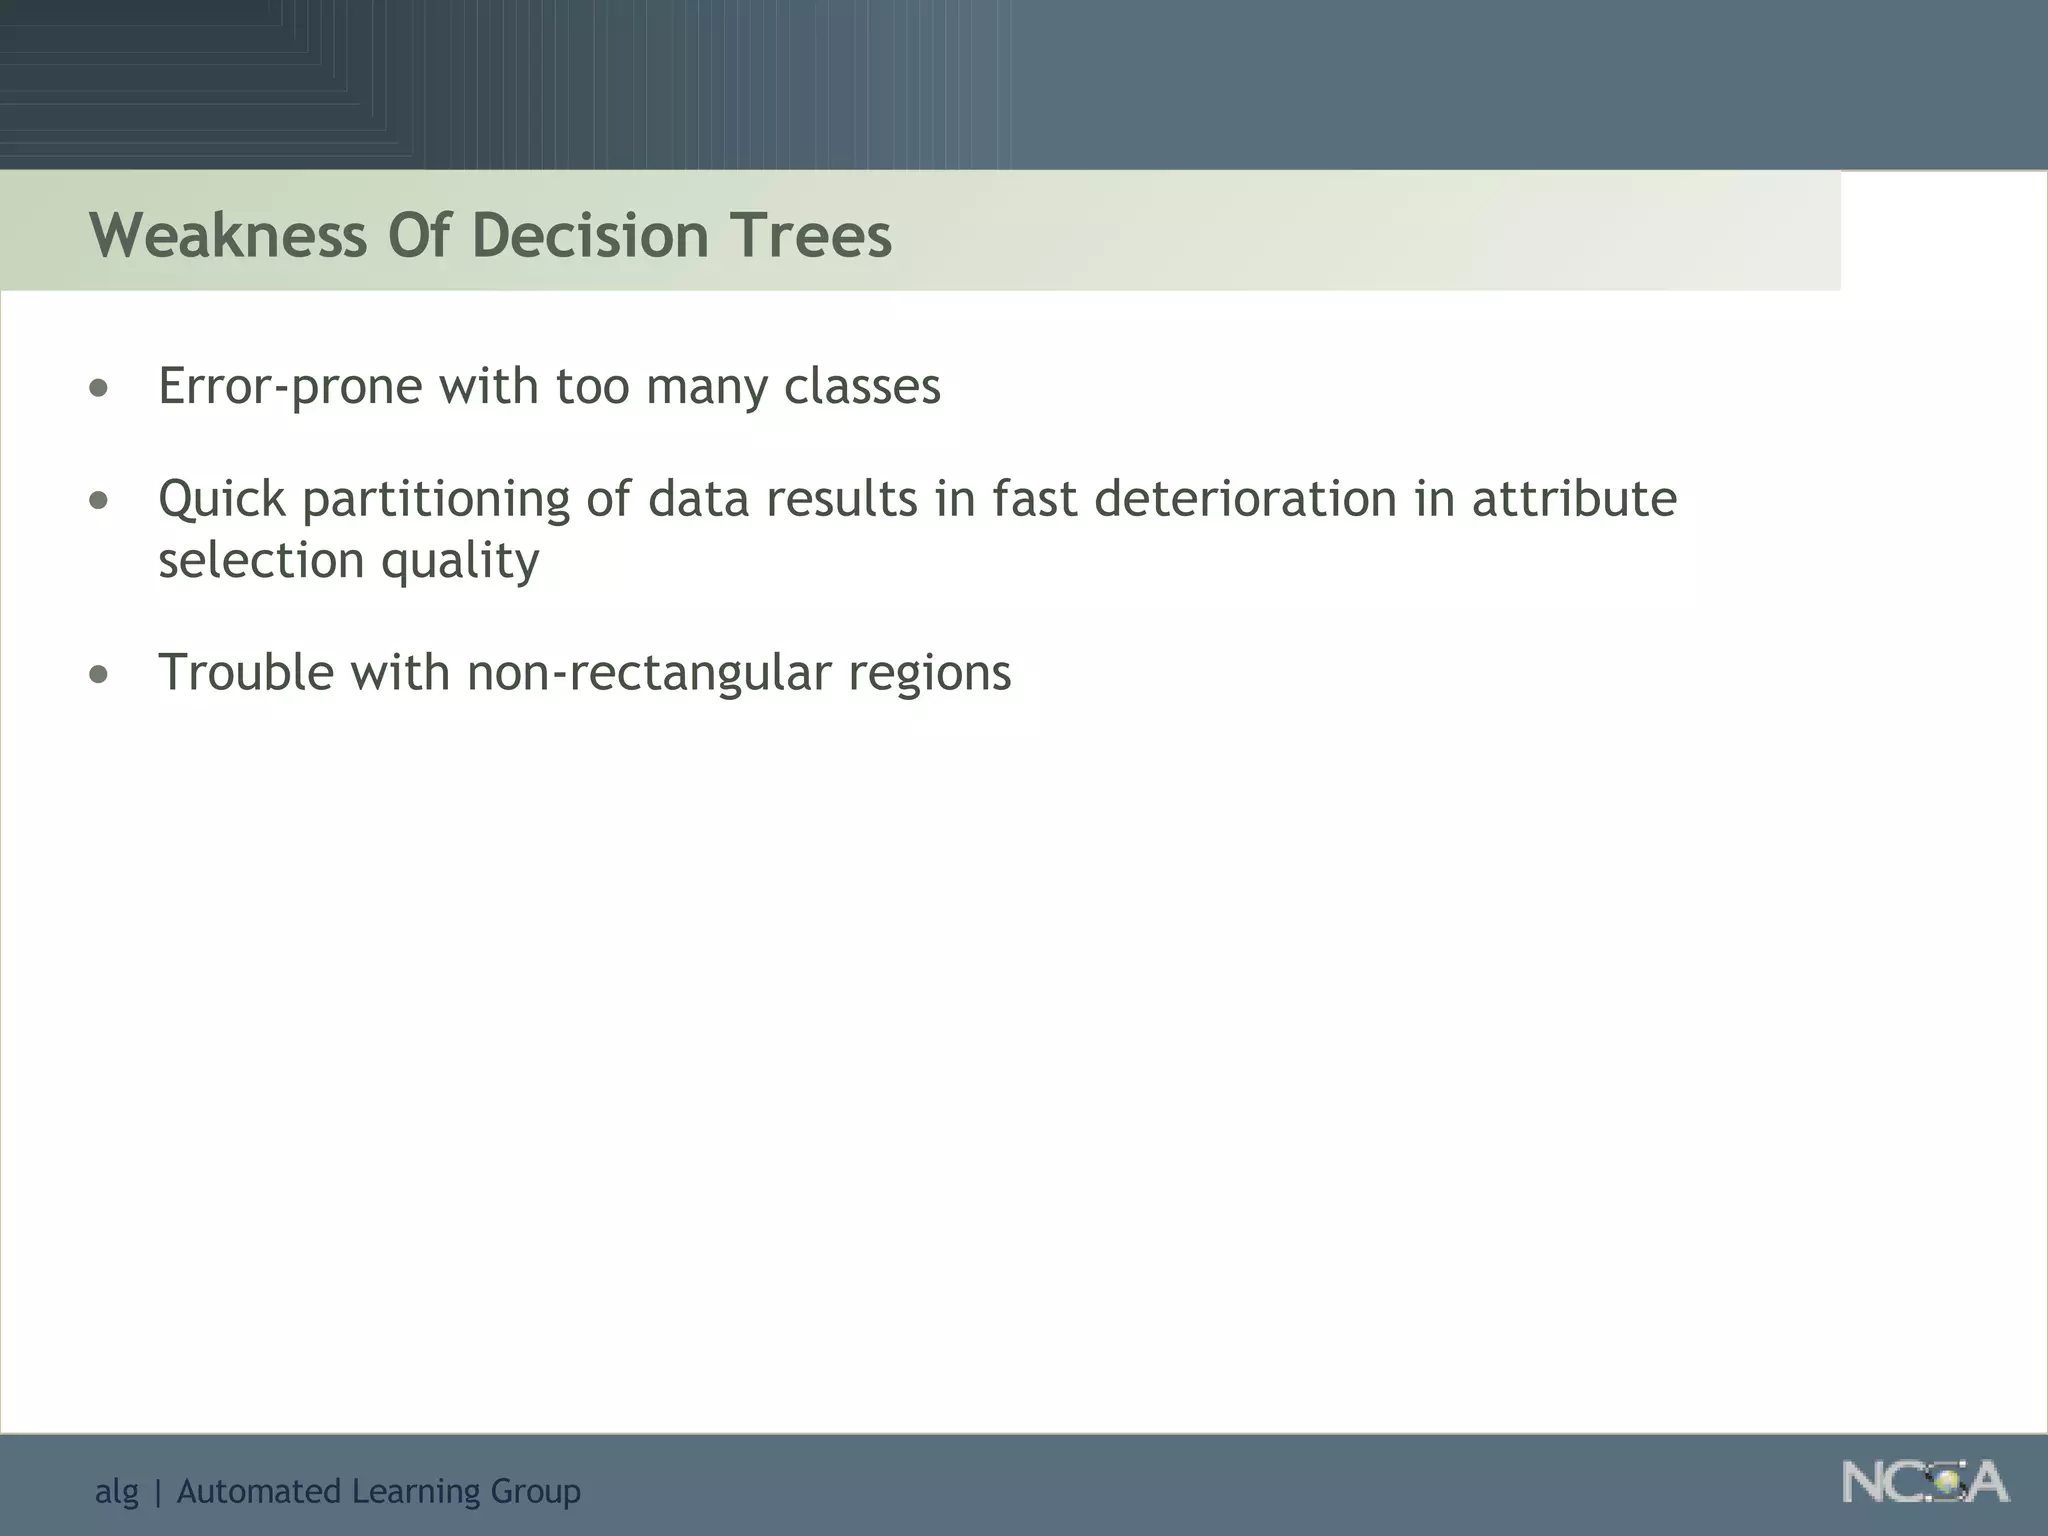
![Constructing a Decision Tree for PlayTennis Humidity? Wind? Yes Yes No Yes No Outlook? 1 , 2 , 3 , 4 , 5 , 6 , 7 , 8 , 9 , 10 , 11 , 12 , 13 , 14 [ 9+ , 5- ] Top-Down Induction For discrete-valued attributes, terminates in ( n ) splits Makes at most one pass through data set at each level (why?) Sunny Overcast Rain 1 , 2 , 8 , 9 , 11 [ 2+ , 3- ] 3 , 7 , 12 , 13 [ 4+ , 0- ] 4 , 5 , 6 , 10 , 14 [ 3+ , 2- ] High Normal 1 , 2 , 8 [ 0+ , 3- ] 9 , 11 [ 2+ , 0- ] Strong Light 6 , 14 [ 0+ , 2- ] 4 , 5 , 10 [ 3+ , 0- ]](https://image.slidesharecdn.com/introduction-to-data-mining1872/85/Introduction-To-Data-Mining-64-320.jpg)


![Other Association Rule Applications Quantitative Association Rules Age[35..40] and Married[Yes] -> NumCars[2] Association Rules with Constraints Find all association rules where the prices of items are > 100 dollars Temporal Association Rules Diaper -> Beer (1% support, 80% confidence) Diaper -> Beer (20%support) 7:00-9:00 PM weekdays Optimized Association Rules Given a rule (l < A < u) and X -> Y, Find values for l and u such that support greater than certain threshold and maximizes a support and confidence. Check Balance [$ 30,000 .. $50,000] -> Certificate of Deposit (CD)= Yes +](https://image.slidesharecdn.com/introduction-to-data-mining1872/75/Introduction-To-Data-Mining-52-2048.jpg)

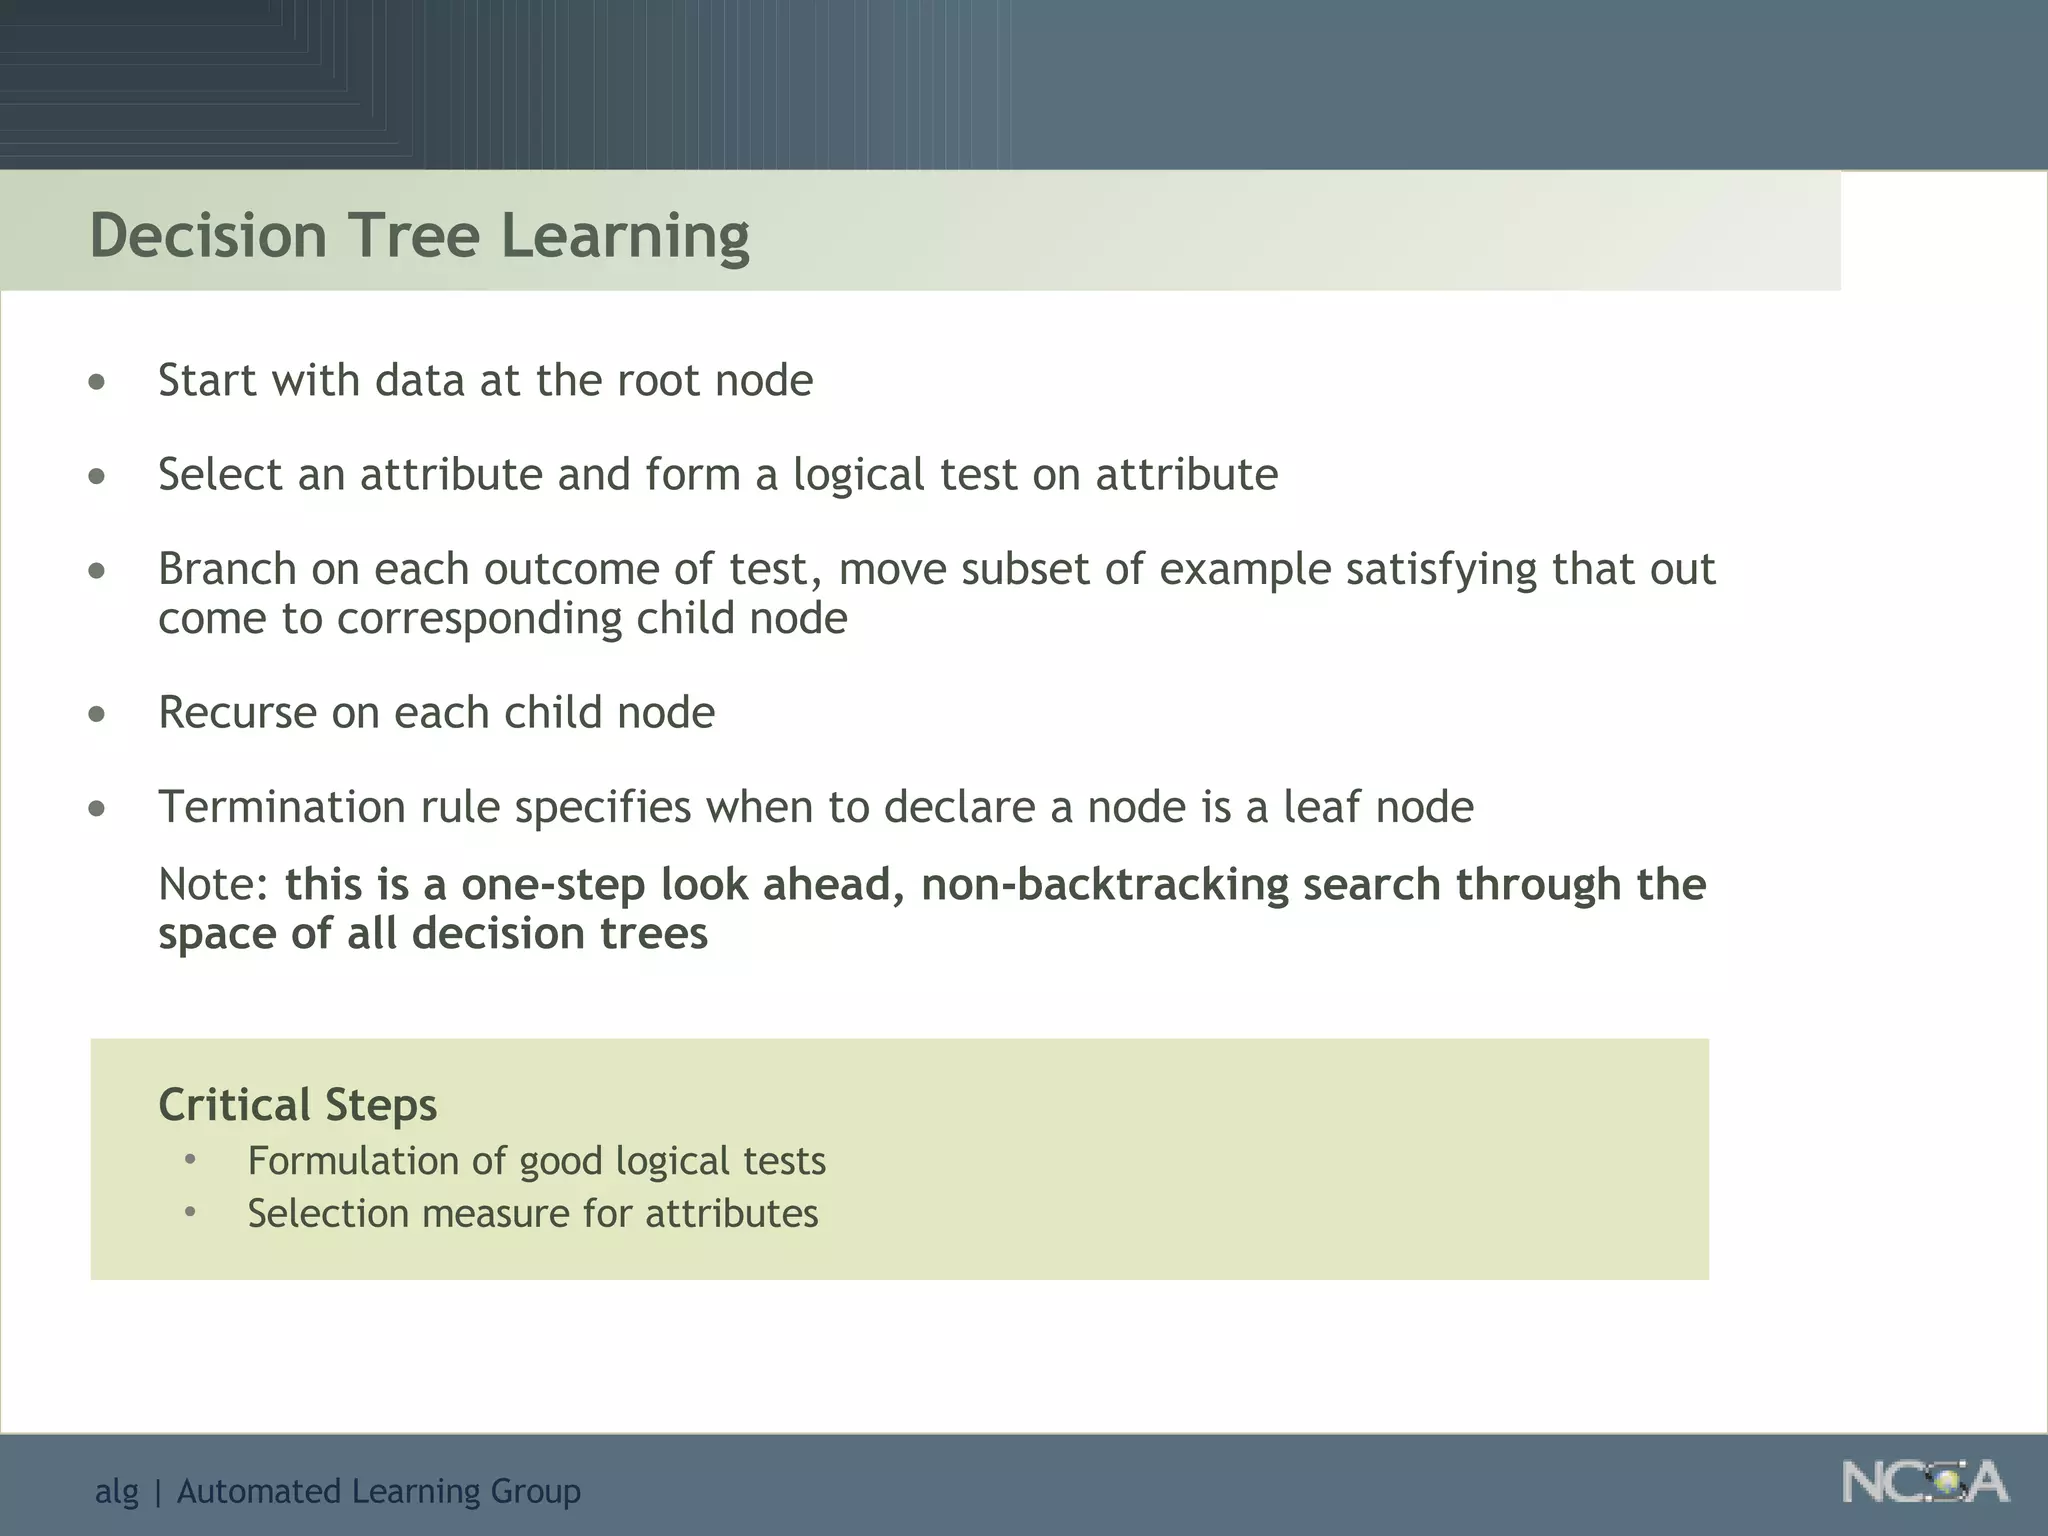
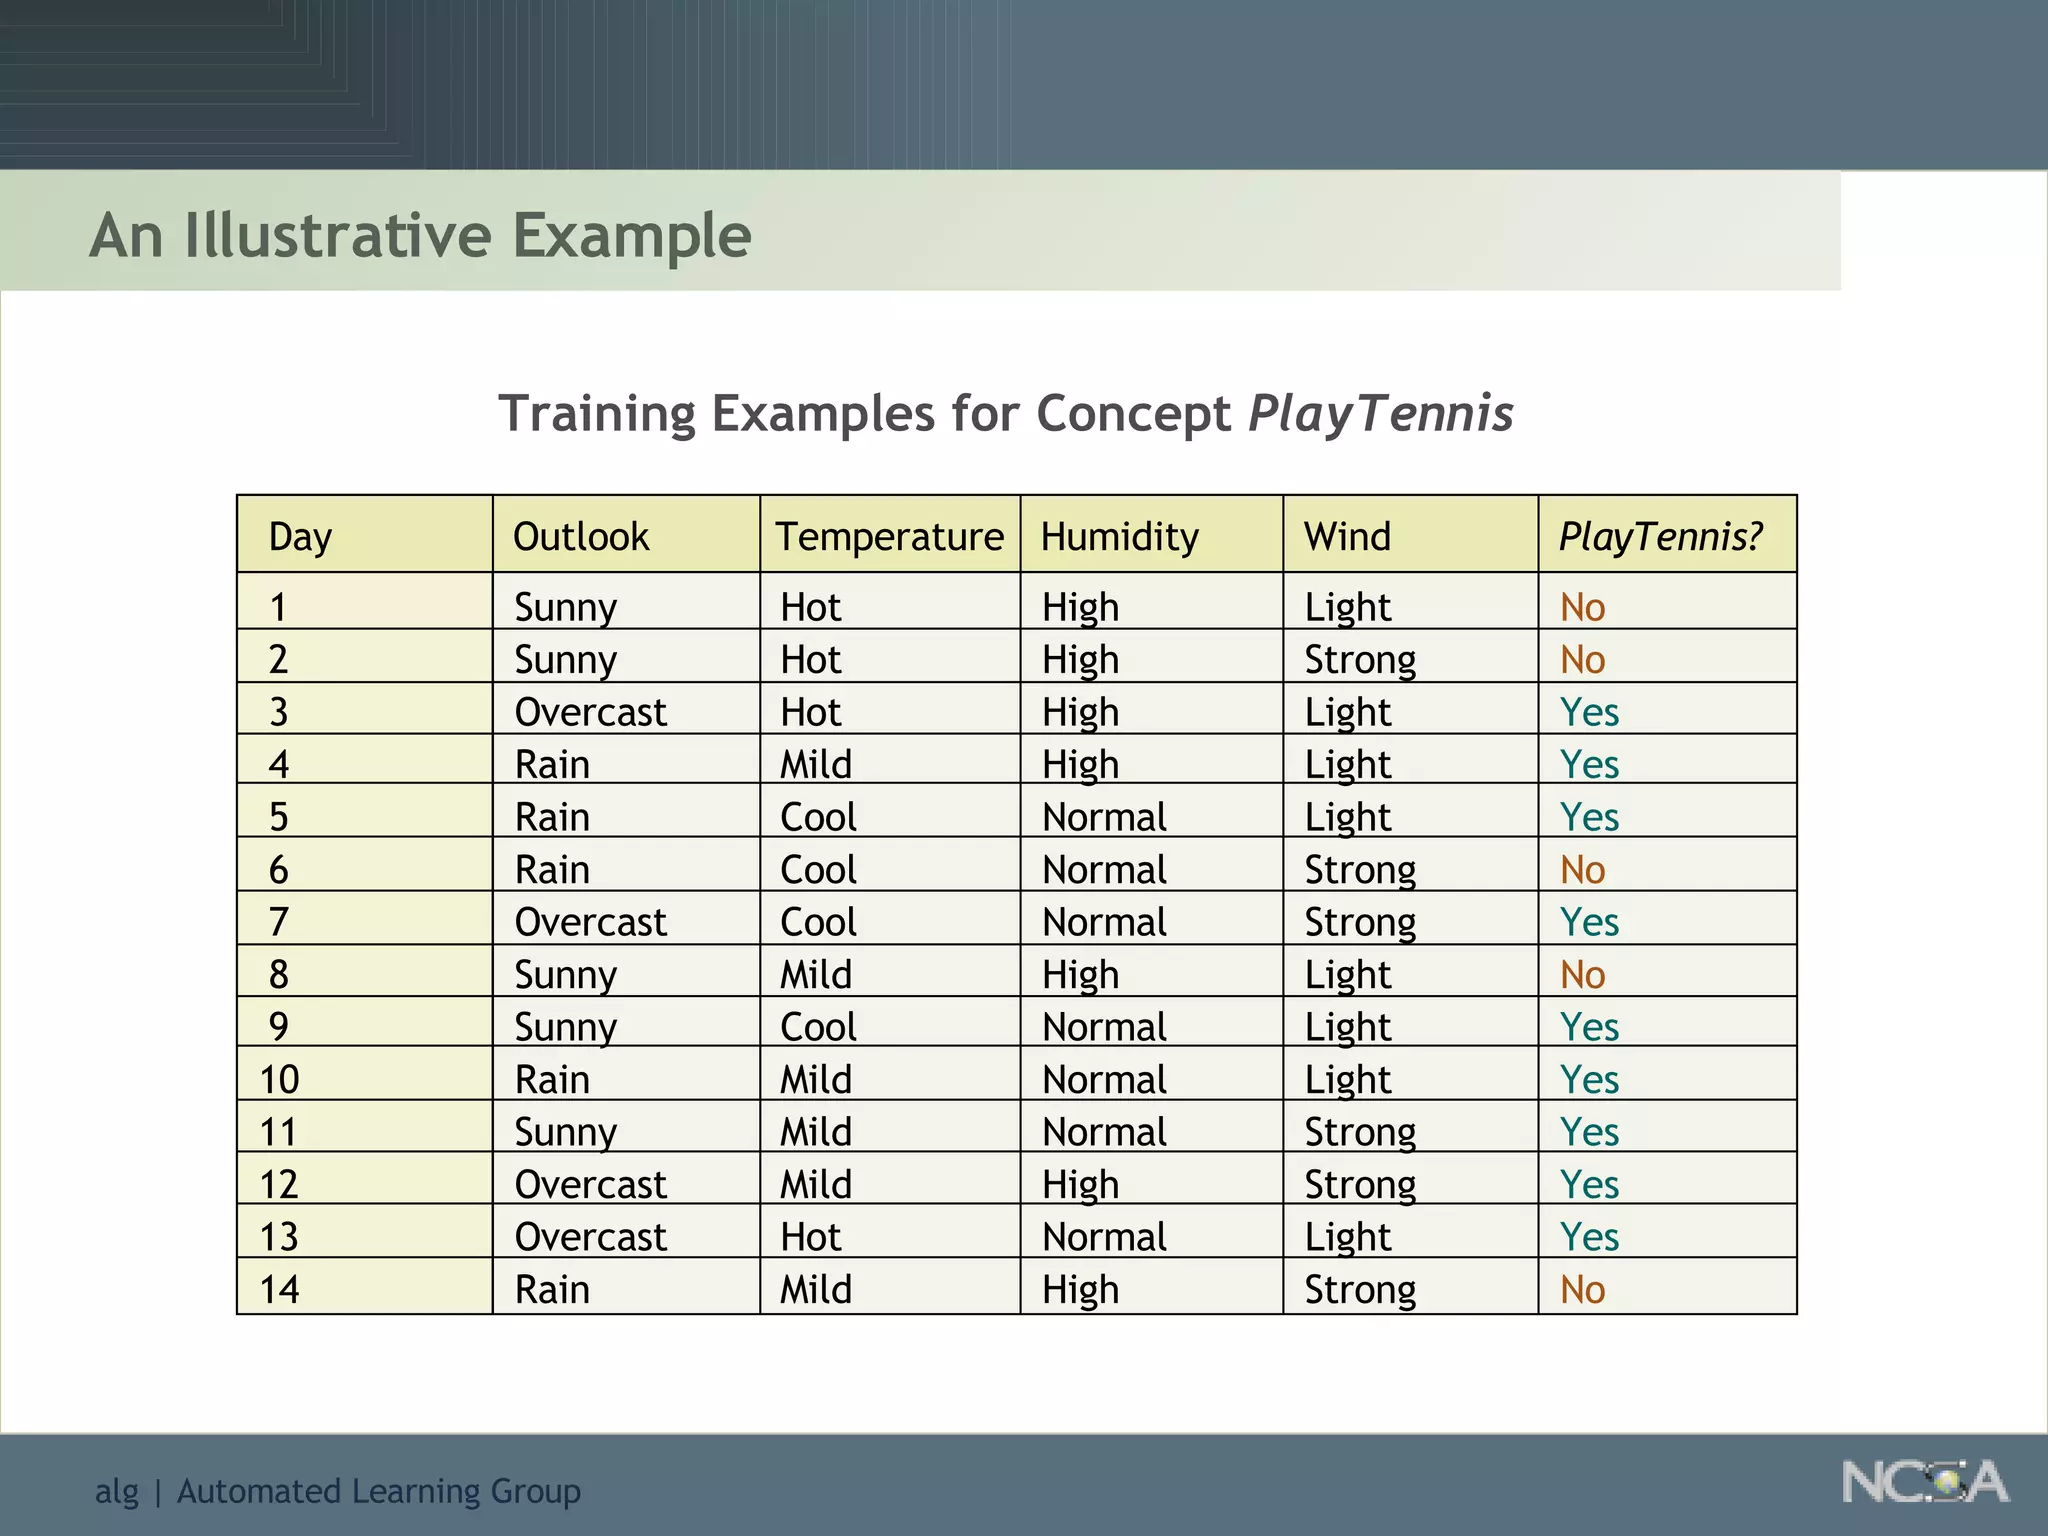
![Constructing a Decision Tree for PlayTennis [9+, 5-] E(D) = min(9/14, 5/14) = 5/14 = 36% The Initial Decision Tree with One Leaf Goal: maximize error reduction E, where the error reduction relative to attribute A is the expected reduction in error due to splitting on A: Question: What attribute A and what value of A should we split on? 1 2 3 4 5 6 7 8 9 10 11 12 13 14 Day Sunny Sunny Overcast Rain Rain Rain Overcast Sunny Sunny Rain Sunny Overcast Overcast Rain Hot Hot Hot Mild Cool Cool Cool Mild Cool Mild Mild Mild Hot Mild Temperature Humidity Wind Play Tennis? High High High High Normal Normal Normal High Normal Normal Normal High Normal High Outlook Light Strong Light Light Light Strong Strong Light Light Light Strong Strong Light Strong No No Yes Yes Yes No Yes No Yes Yes Yes Yes Yes No](https://image.slidesharecdn.com/introduction-to-data-mining1872/75/Introduction-To-Data-Mining-62-2048.jpg)
![Constructing a Decision Tree for PlayTennis Potential Splits of Root Node [3+, 4-] [6+, 1-] Humidity High Normal [9+, 5-] [6+, 2-] [3+, 3-] Wind Light Strong [9+, 5-] [2+, 3-] [3+, 2-] Outlook Sunny Rain [9+, 5-] Overcast [4+, 0-] [3+, 1-] [2+, 2-] Temperature Cool Hot [9+, 5-] Mild [4+, 2-] E(Split/Outlook) = (5/14) – ((5/14)(min(2/5,3/5)) + (4/14)(min(4/4,0/4)) + (5/14)(min(3/5,2/5))) = 7% E(Split/Temperature) = (5/14) – ((4/14)(min(3/4,1/4)) + (6/14)(min(4/6,2/6)) + (4/14)(min(2/4,2/4))) = 0% E(Split/Humidity) = (5/14) – ((7/14)(min(3/7,4/7)) + (7/14)(min(6/7,1/7))) = 7% E(Split/Wind) = (5/14) – ((8/14)(min(6/8,2/8)) + (6/14)(min(3/6,3/6))) = 0%](https://image.slidesharecdn.com/introduction-to-data-mining1872/75/Introduction-To-Data-Mining-63-2048.jpg)
![Constructing a Decision Tree for PlayTennis Humidity? Wind? Yes Yes No Yes No Outlook? 1 , 2 , 3 , 4 , 5 , 6 , 7 , 8 , 9 , 10 , 11 , 12 , 13 , 14 [ 9+ , 5- ] Top-Down Induction For discrete-valued attributes, terminates in ( n ) splits Makes at most one pass through data set at each level (why?) Sunny Overcast Rain 1 , 2 , 8 , 9 , 11 [ 2+ , 3- ] 3 , 7 , 12 , 13 [ 4+ , 0- ] 4 , 5 , 6 , 10 , 14 [ 3+ , 2- ] High Normal 1 , 2 , 8 [ 0+ , 3- ] 9 , 11 [ 2+ , 0- ] Strong Light 6 , 14 [ 0+ , 2- ] 4 , 5 , 10 [ 3+ , 0- ]](https://image.slidesharecdn.com/introduction-to-data-mining1872/75/Introduction-To-Data-Mining-64-2048.jpg)


The document introduces data mining and knowledge discovery in databases. It discusses why data mining is needed due to large datasets that cannot be analyzed manually. It also covers the data mining process, common data mining techniques like association rules and decision trees, applications of data mining in various domains, and some popular data mining tools.
Introduction to data mining, its applications, process, and tools used in the Knowledge Discovery in Databases.
Credits contributors to the project and references key literature related to data mining.
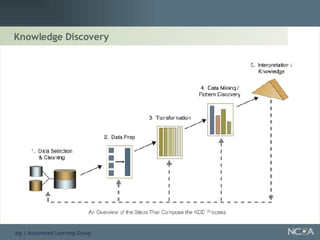
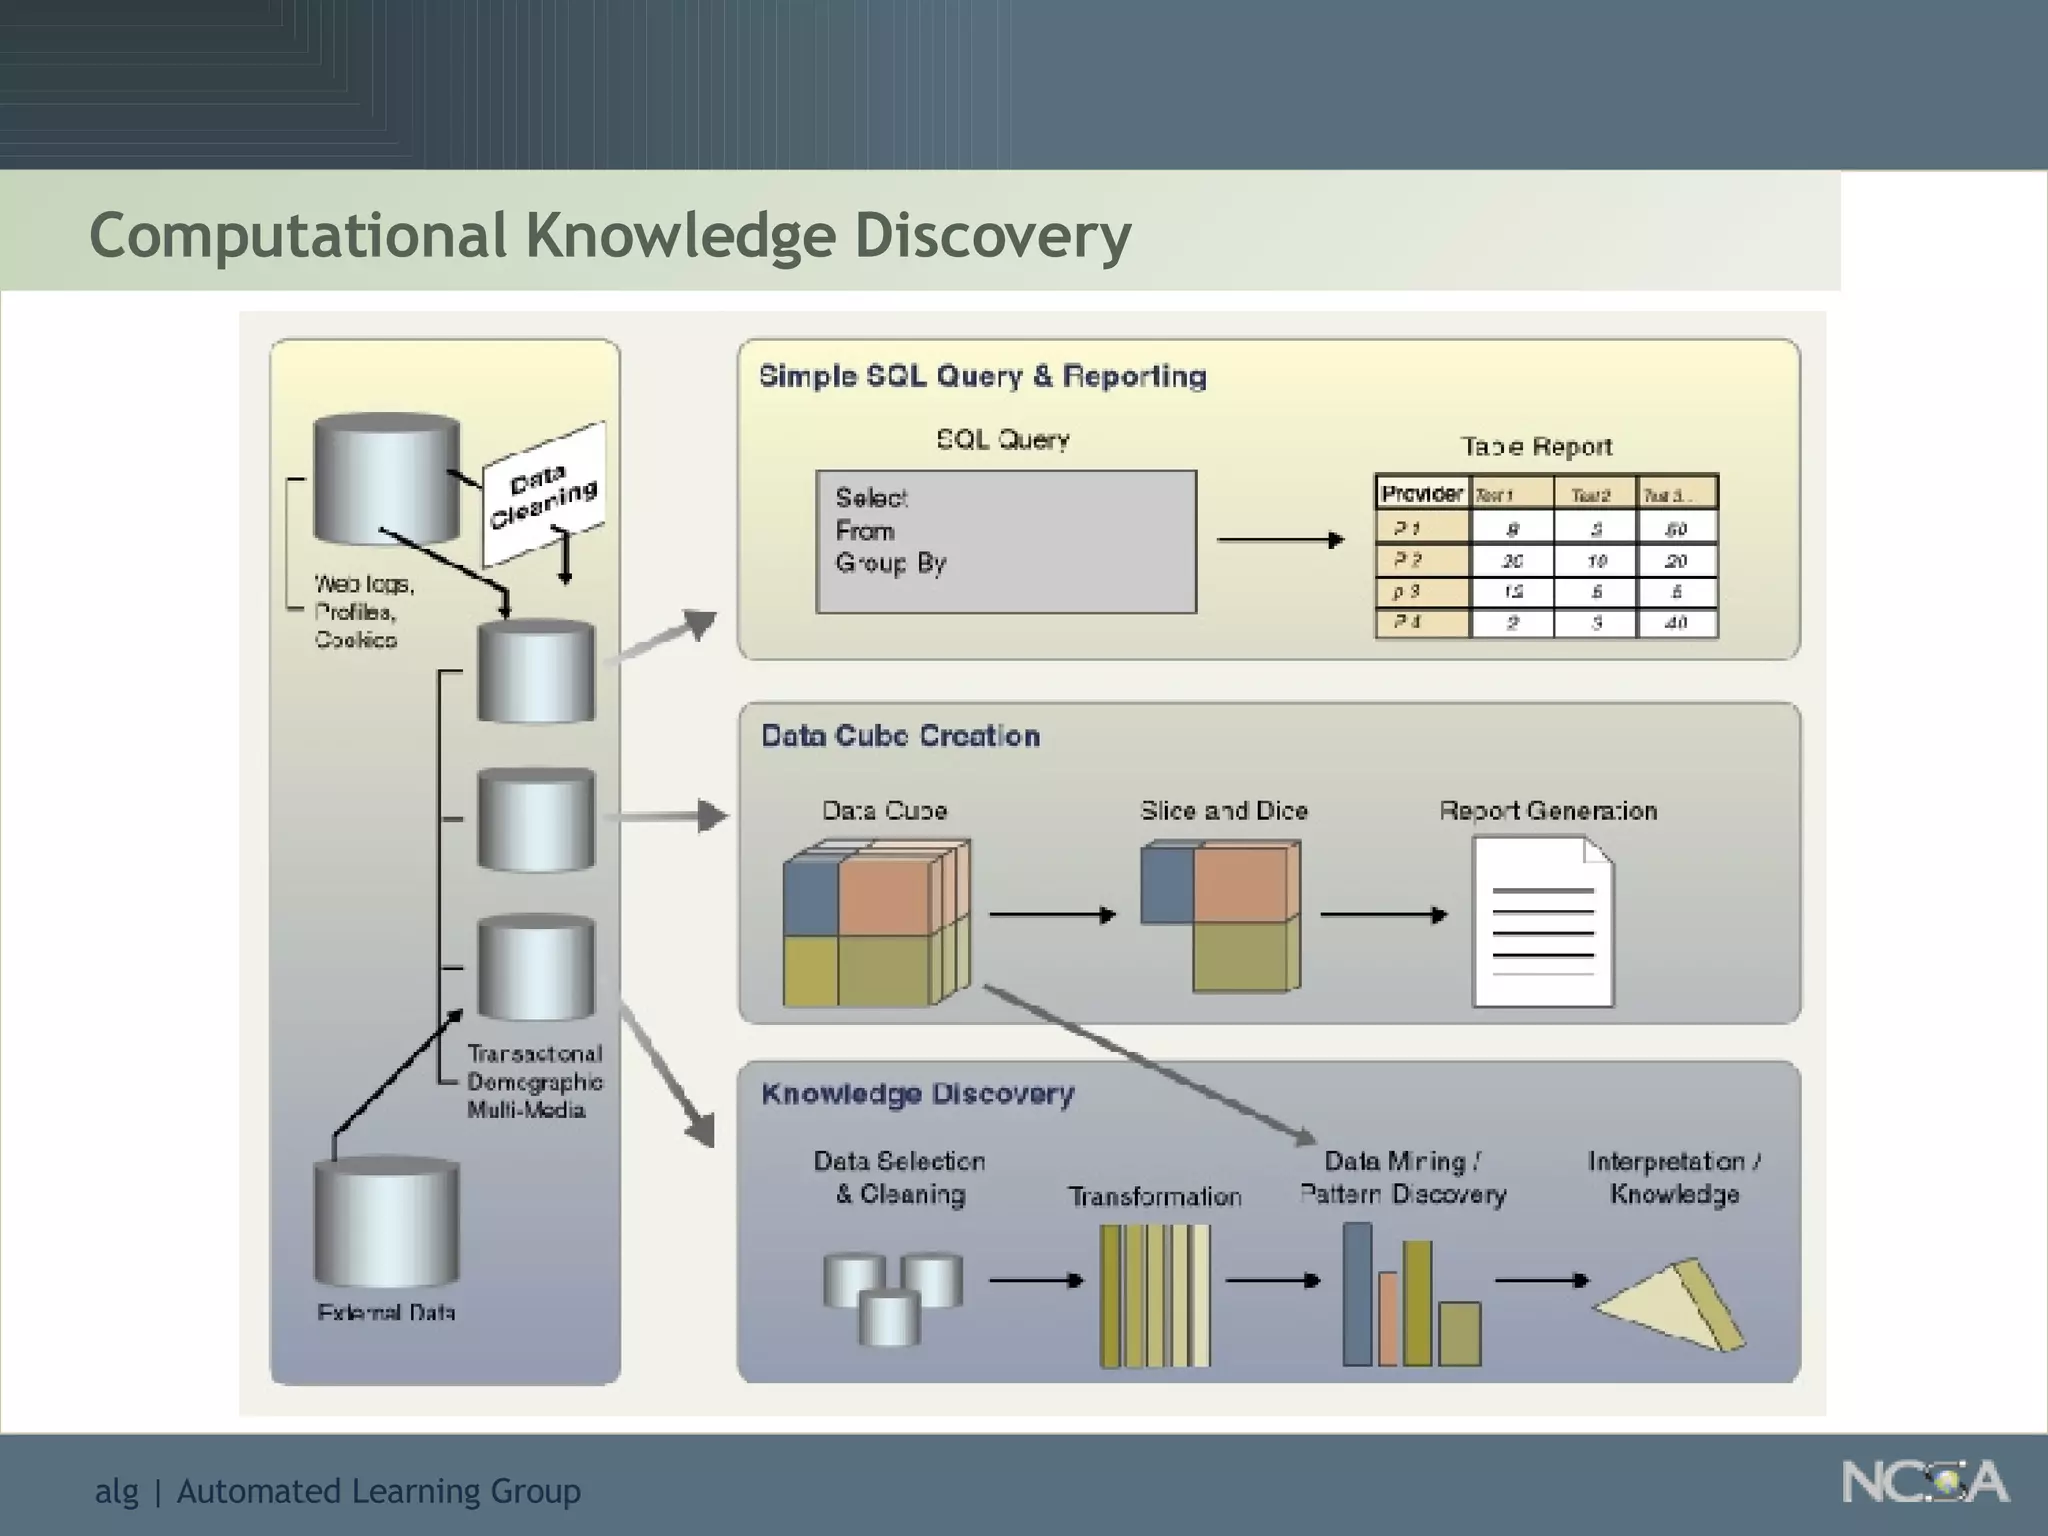
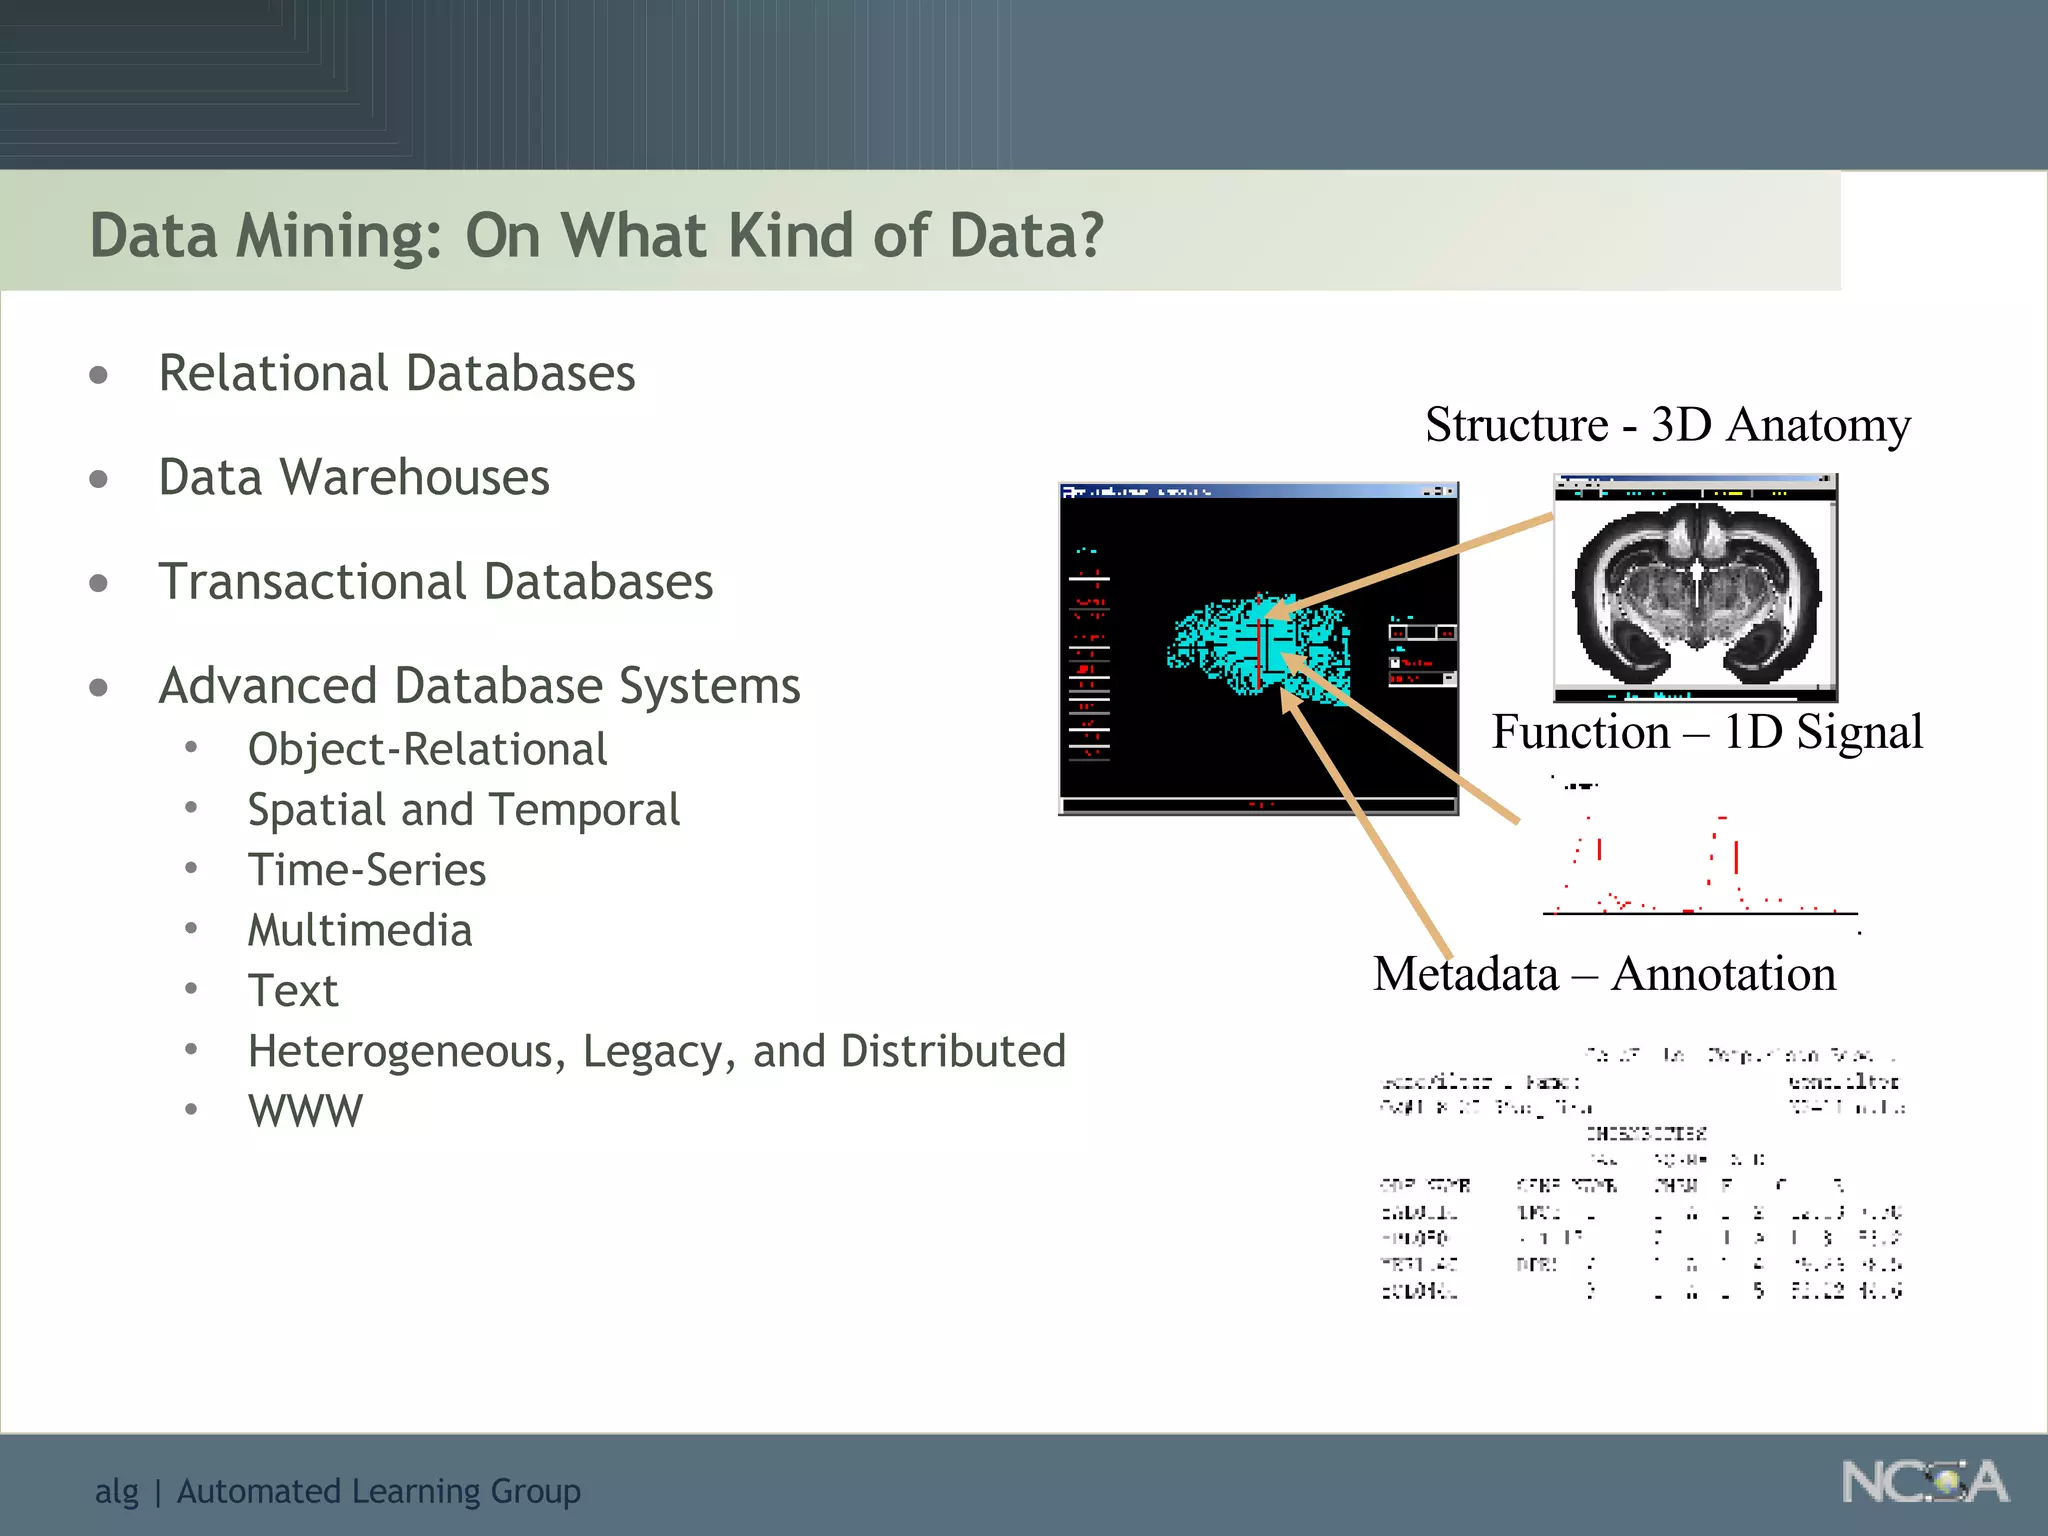
Details the knowledge discovery process, the data types involved, and the necessity and understanding of data mining.
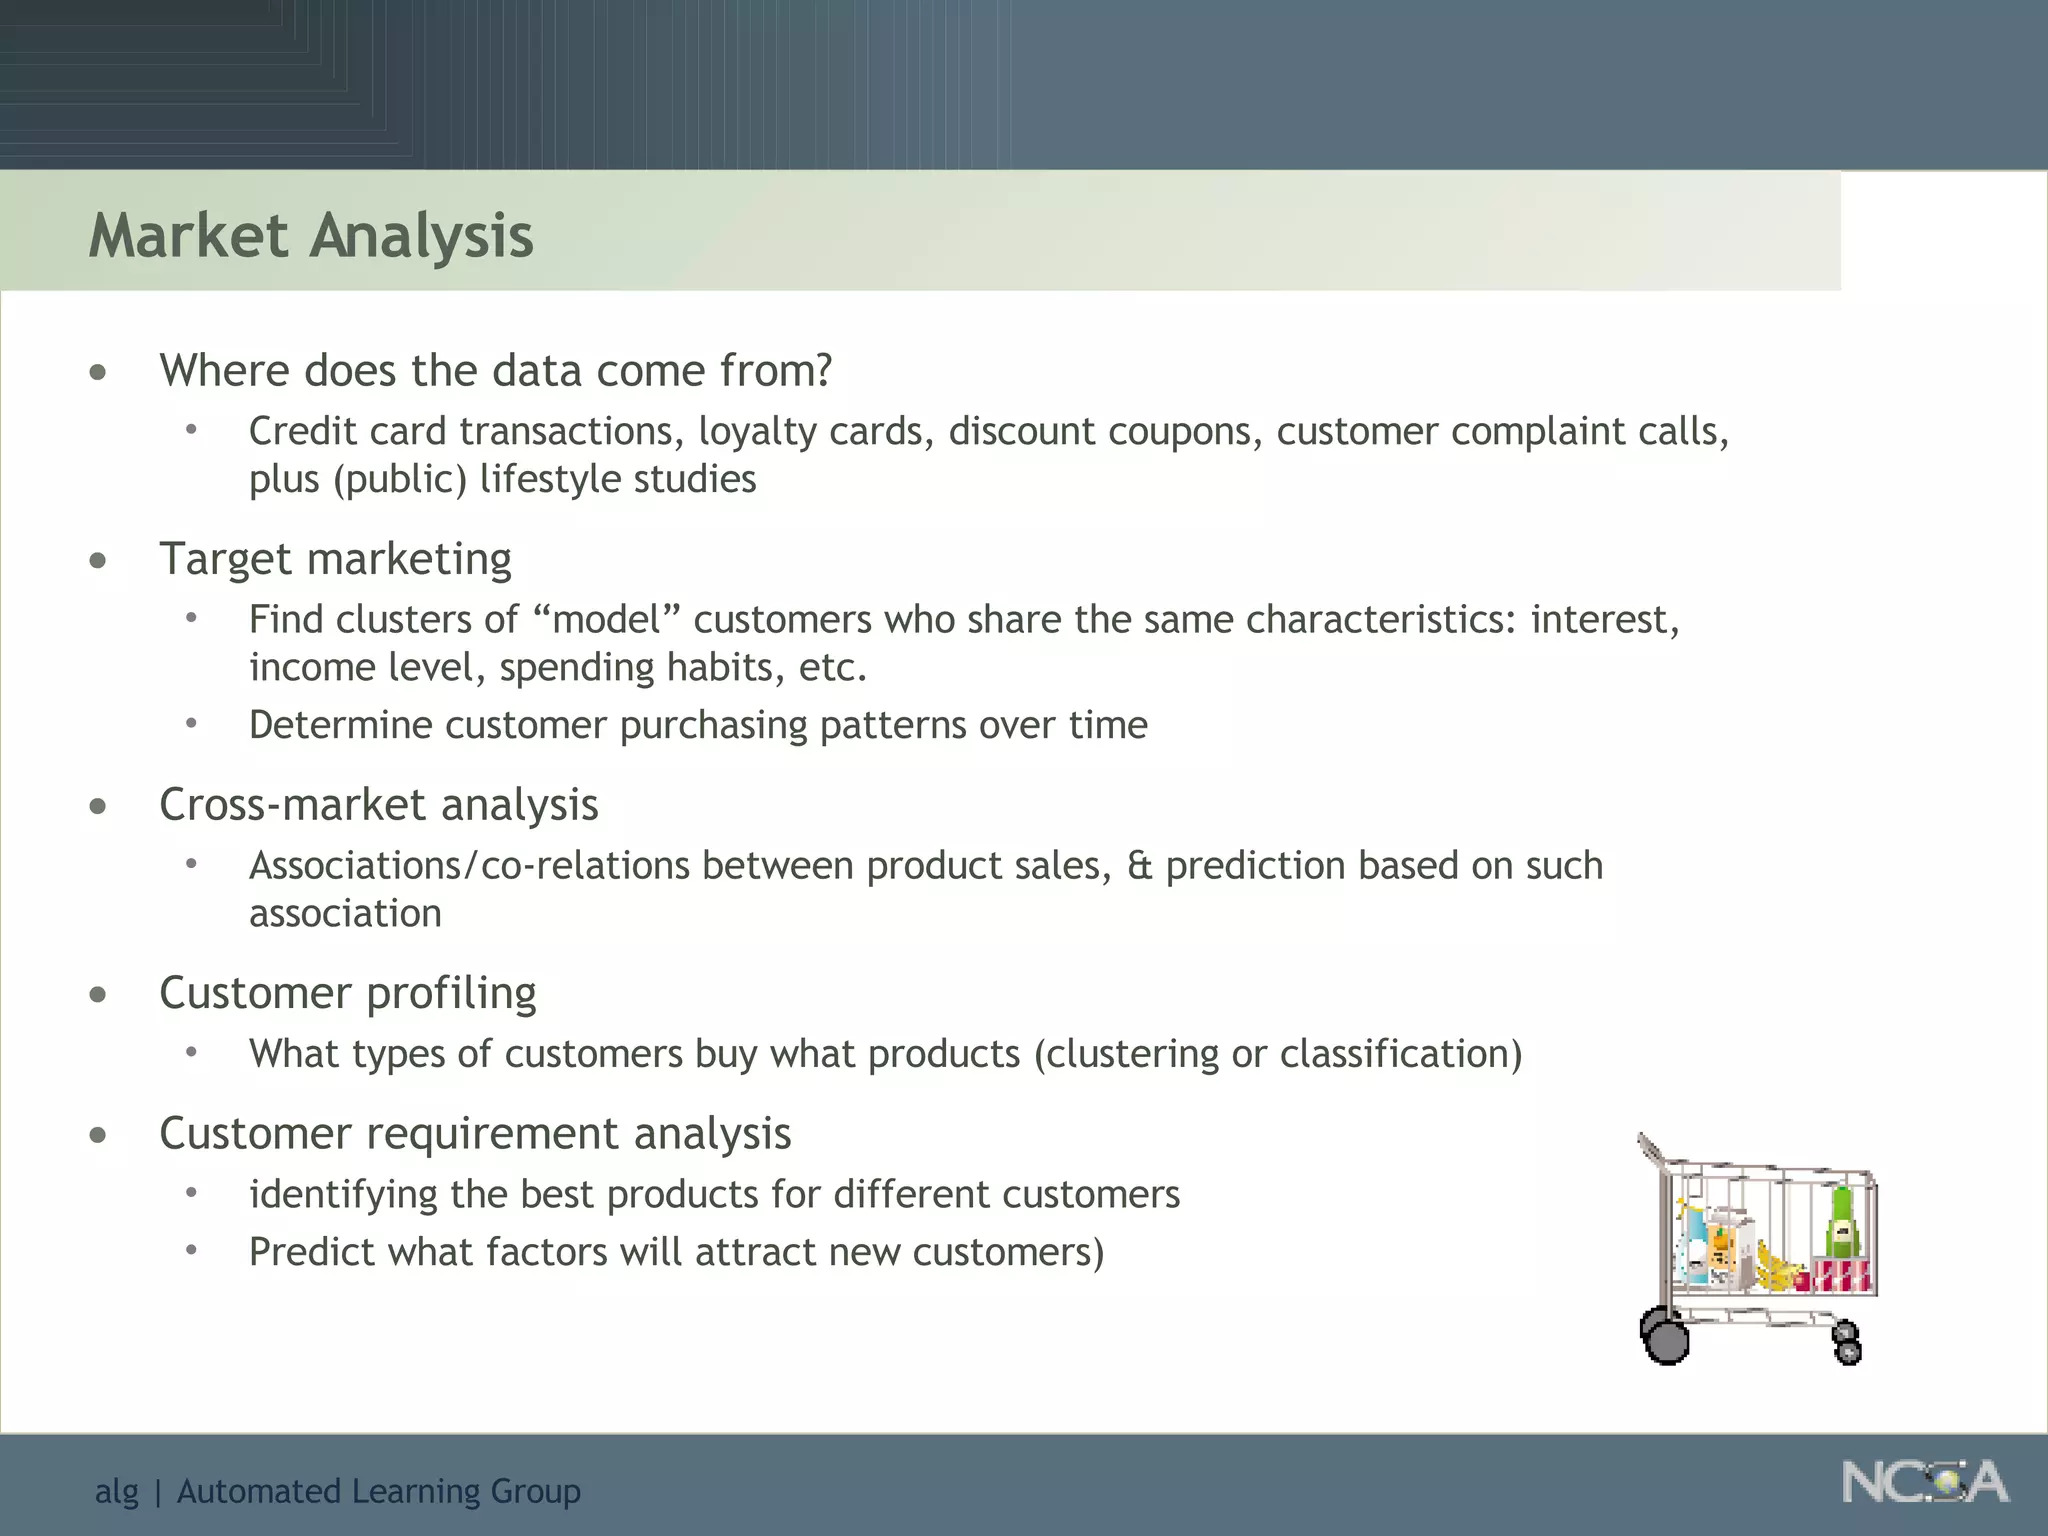
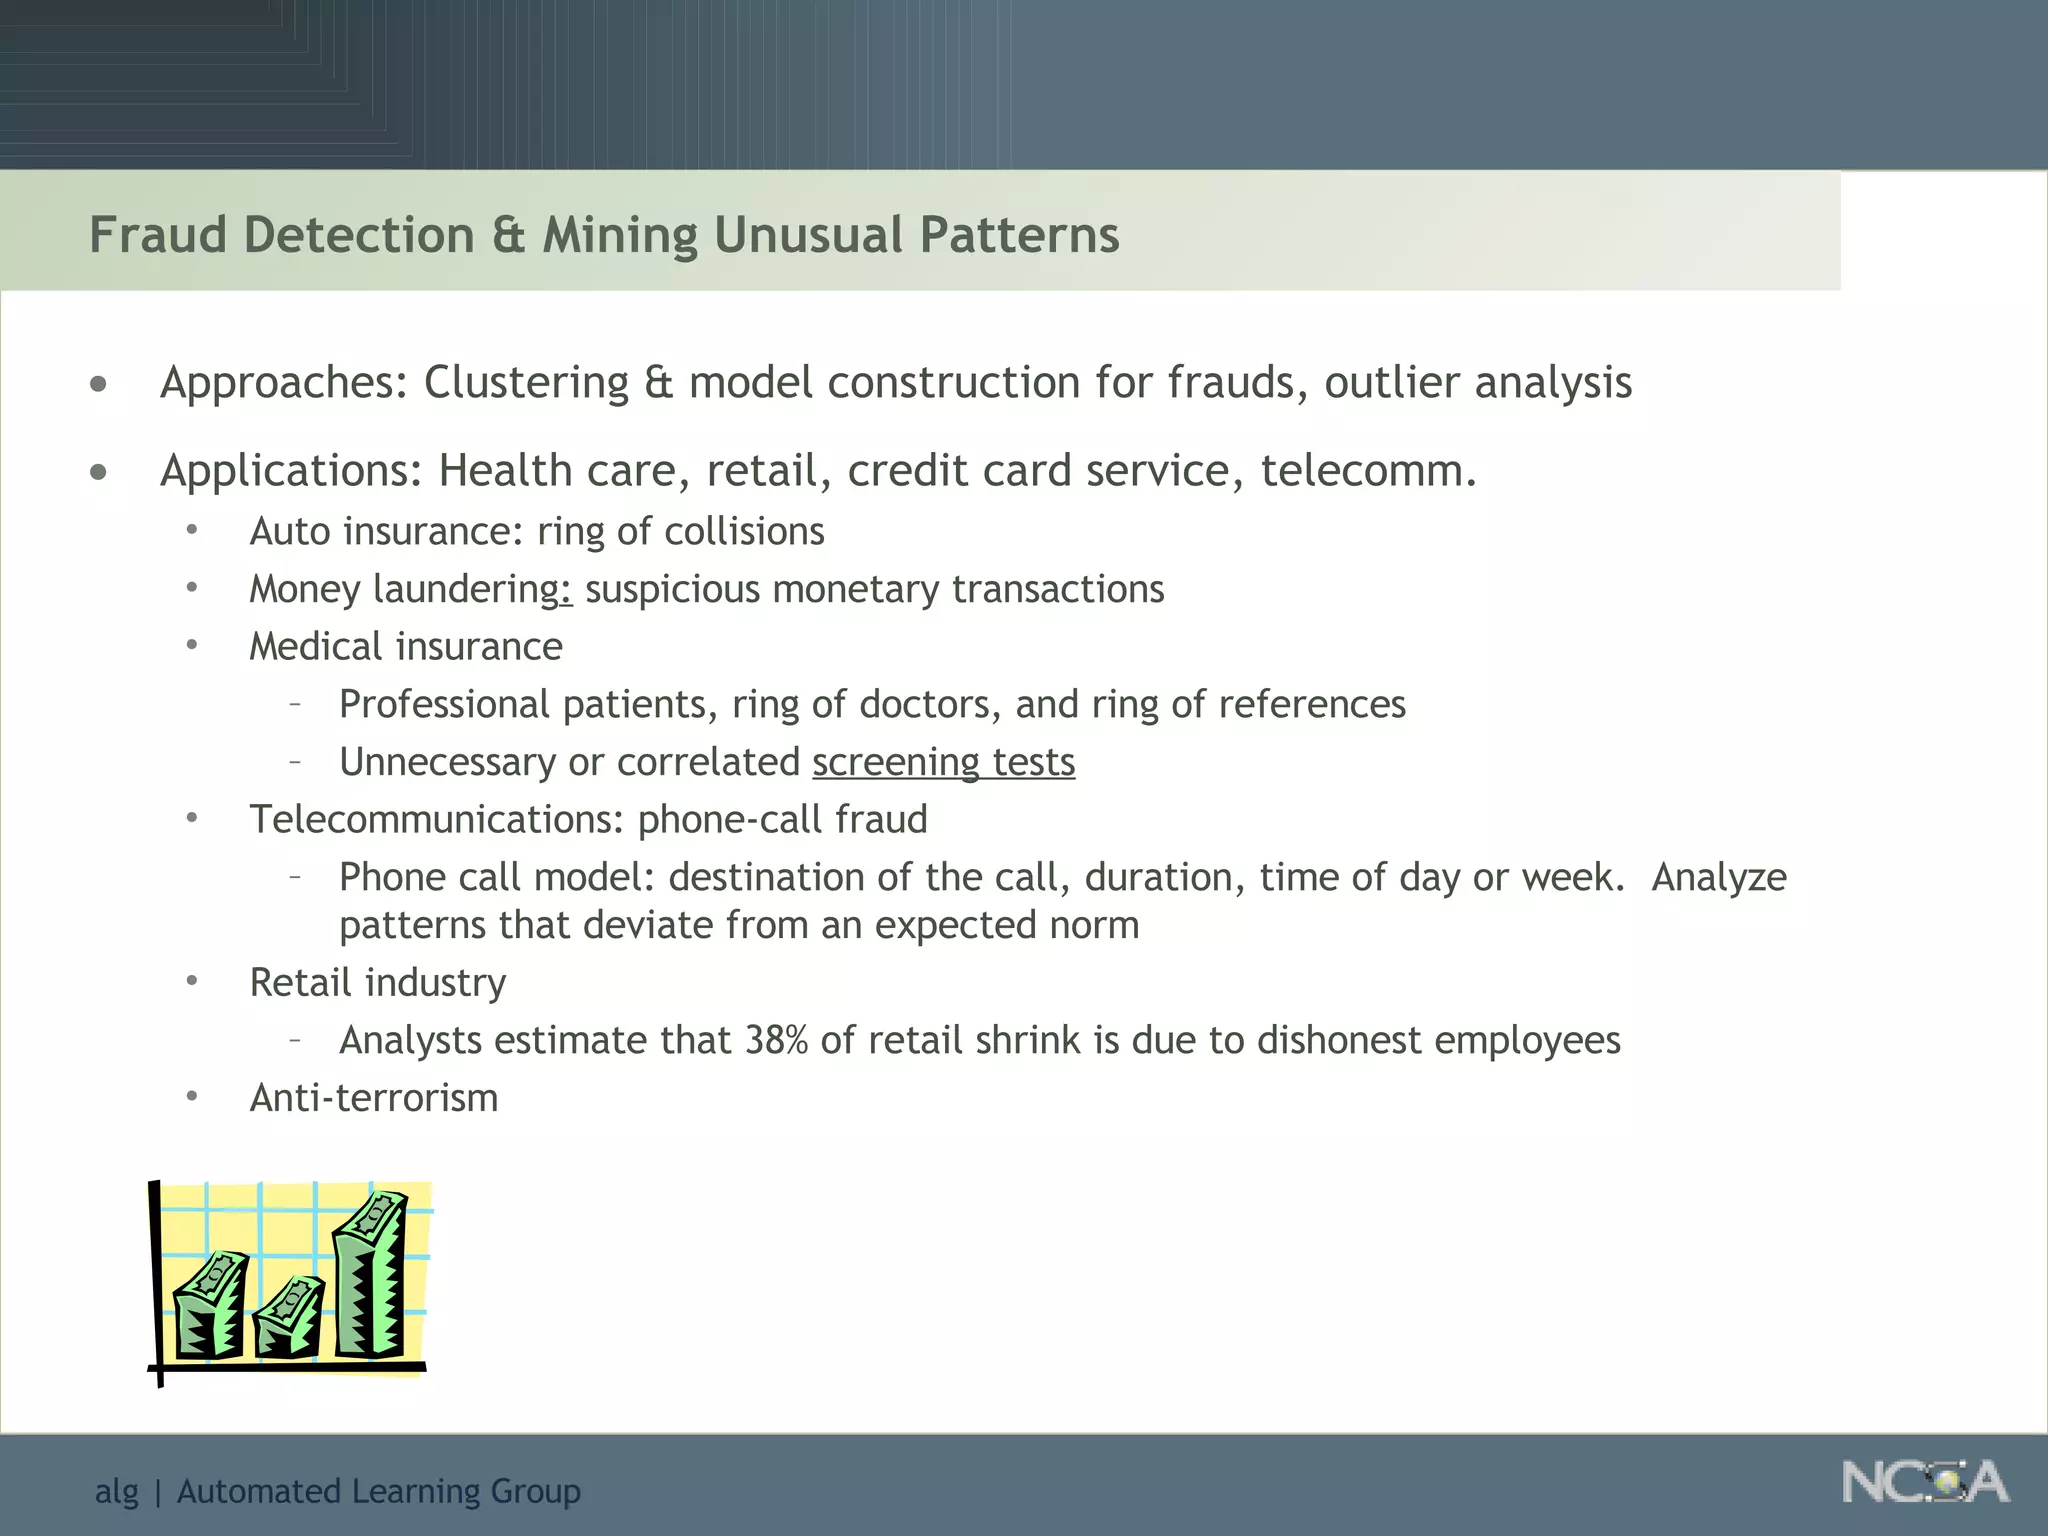
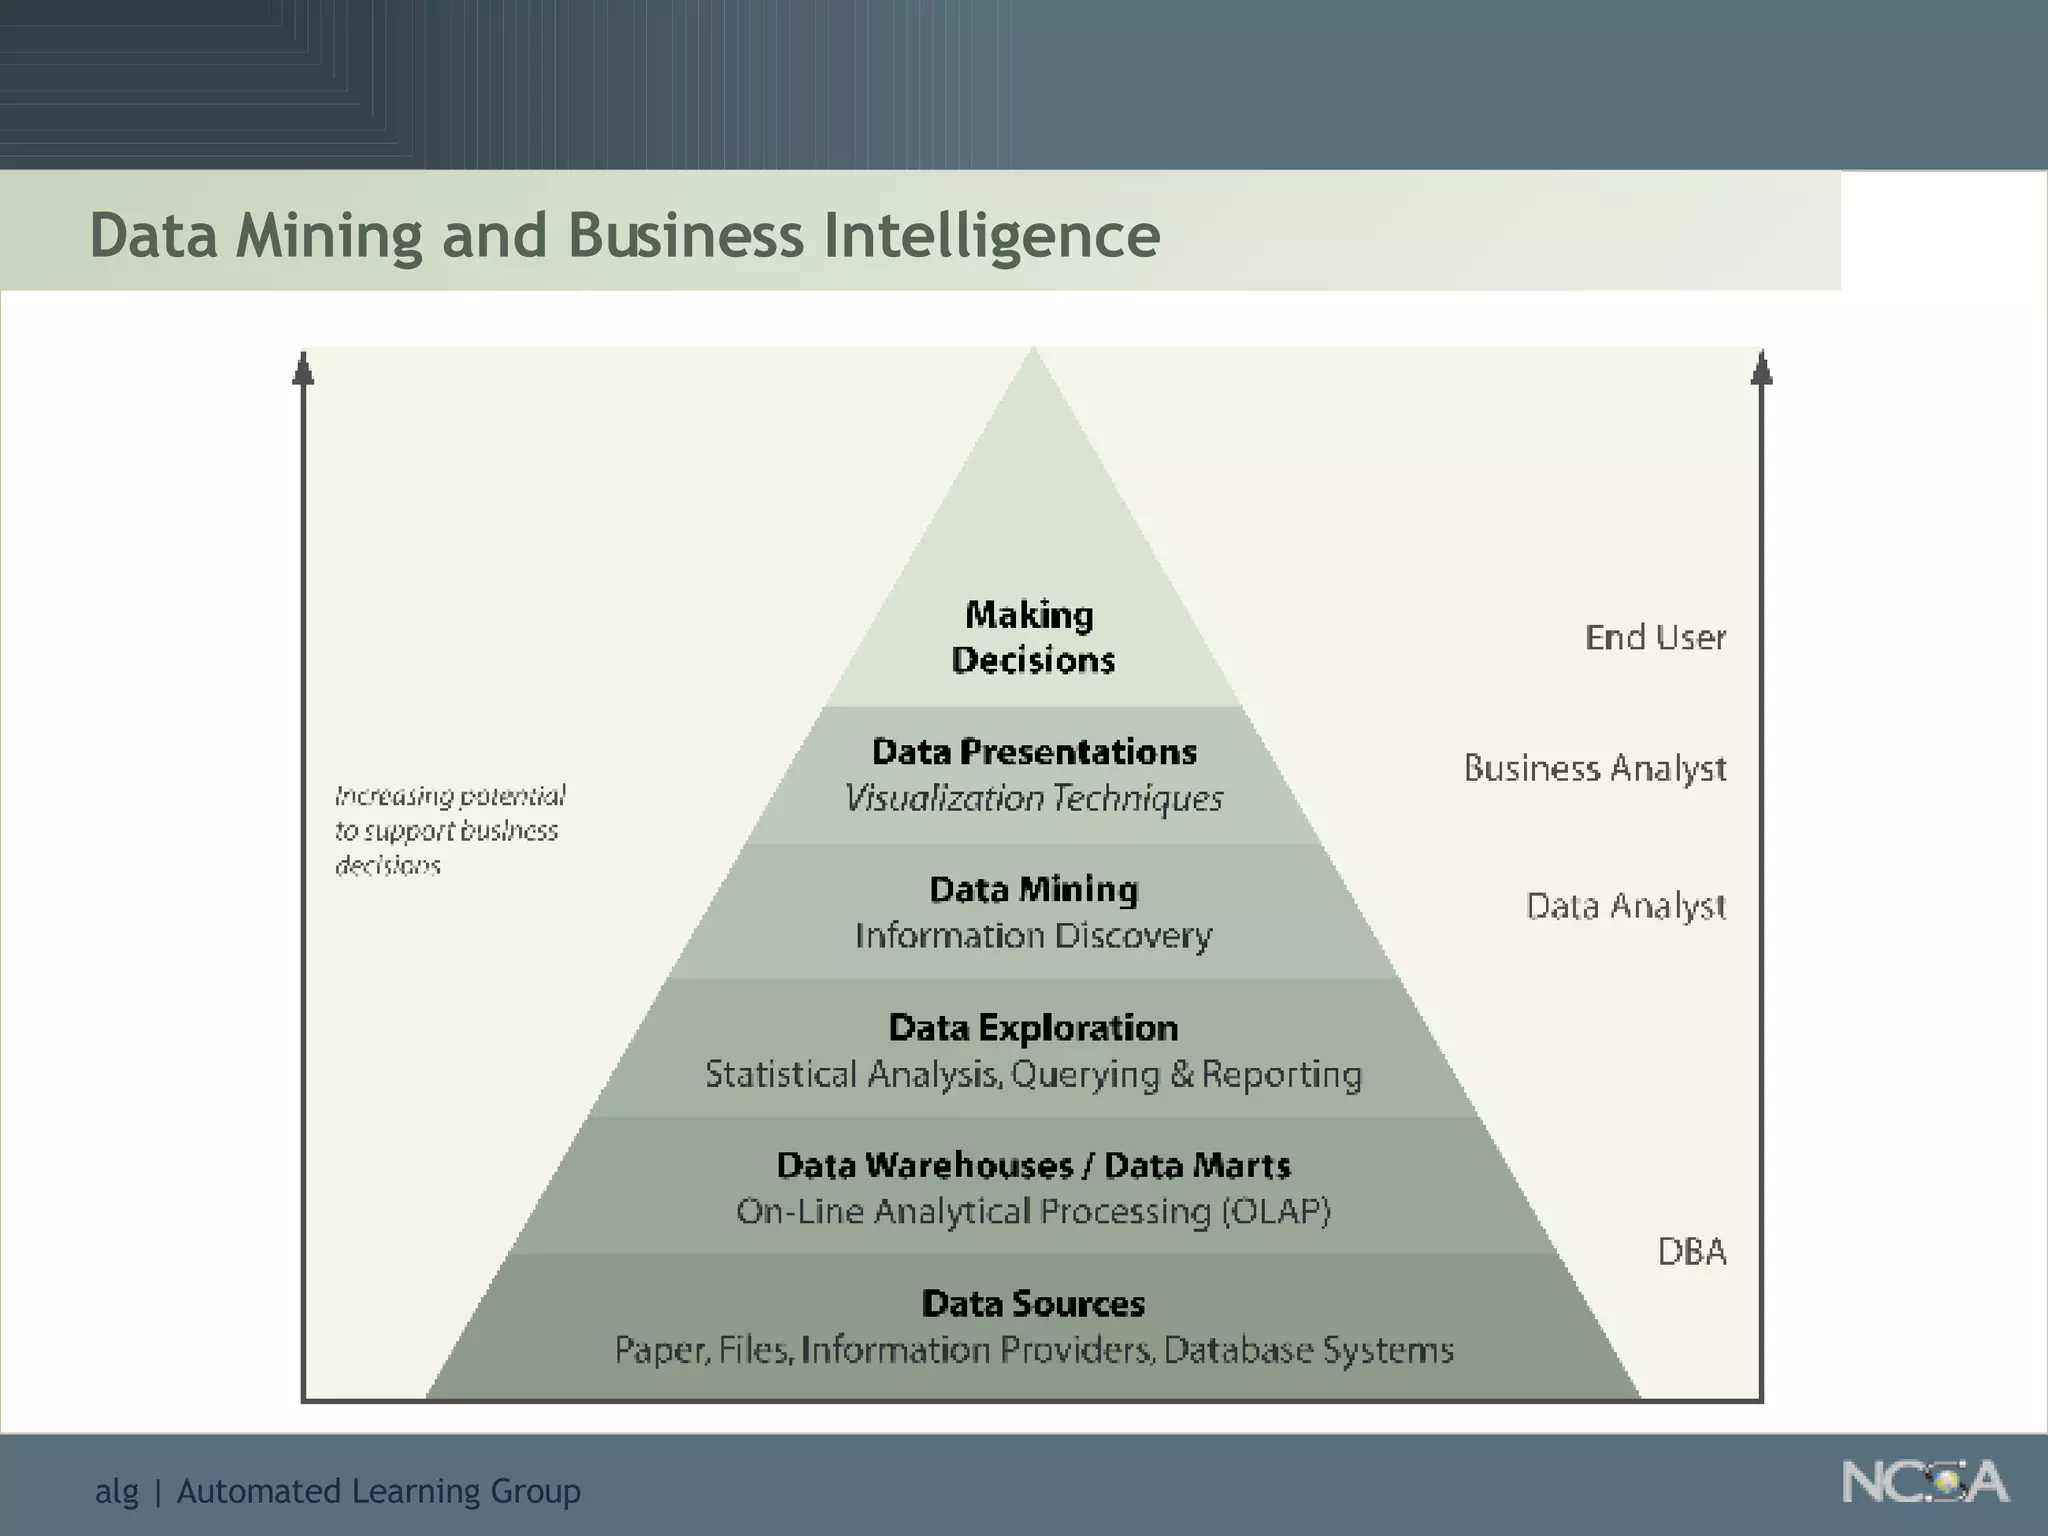
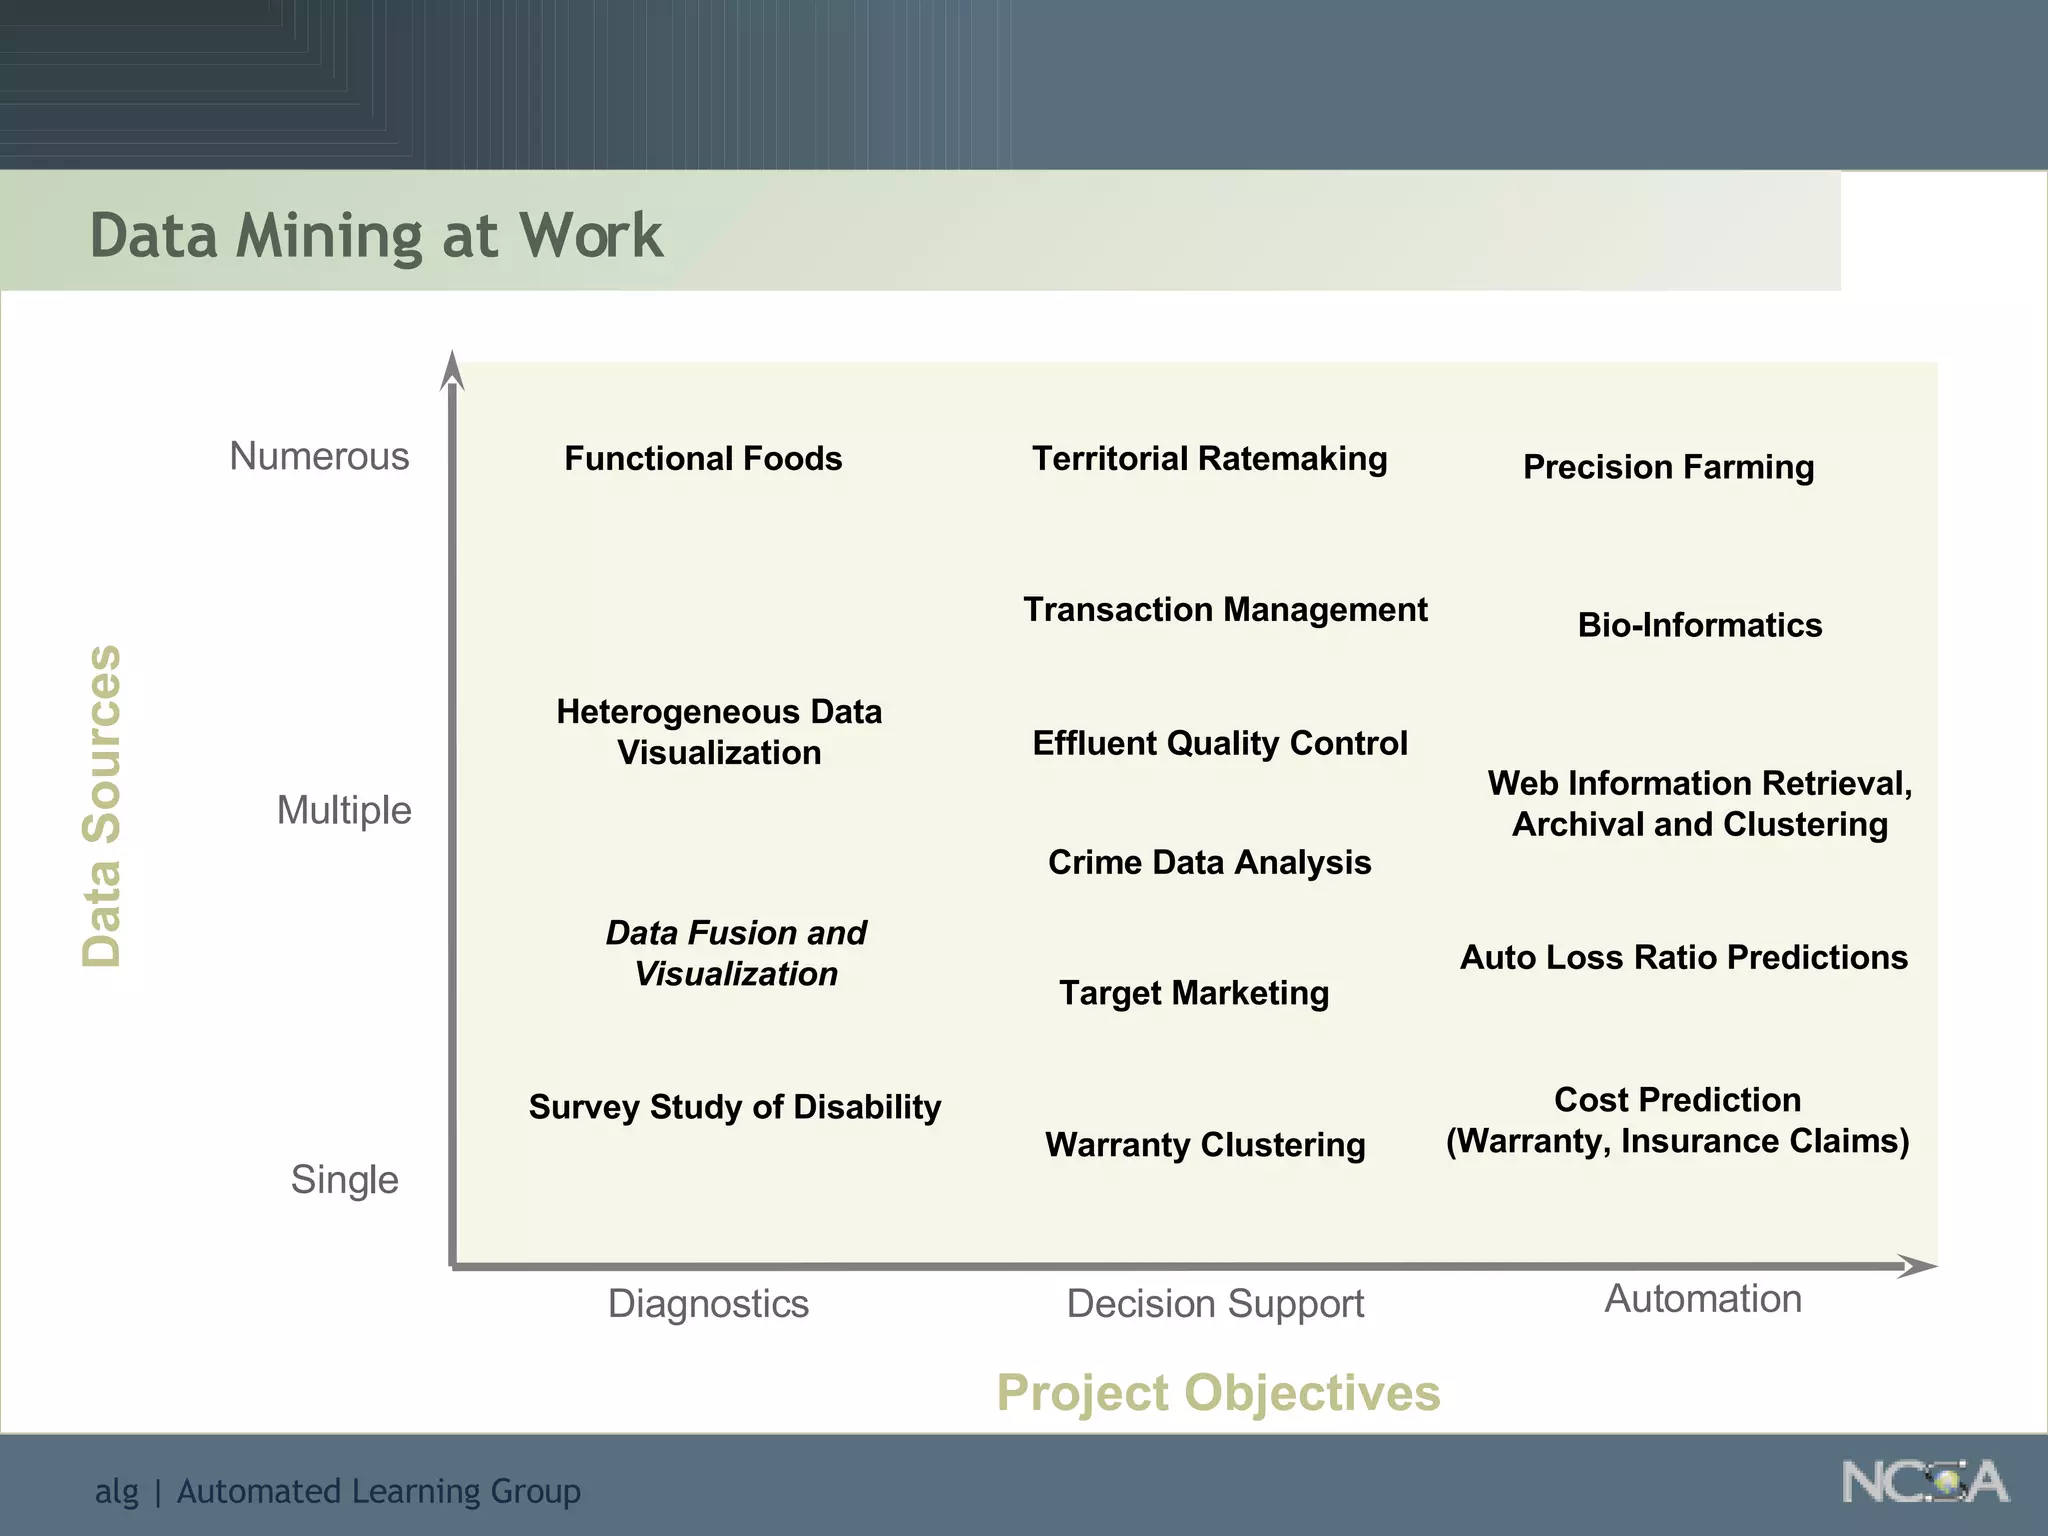
Explains various applications such as market analysis, risk management, fraud detection, and more.
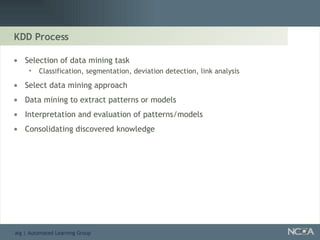
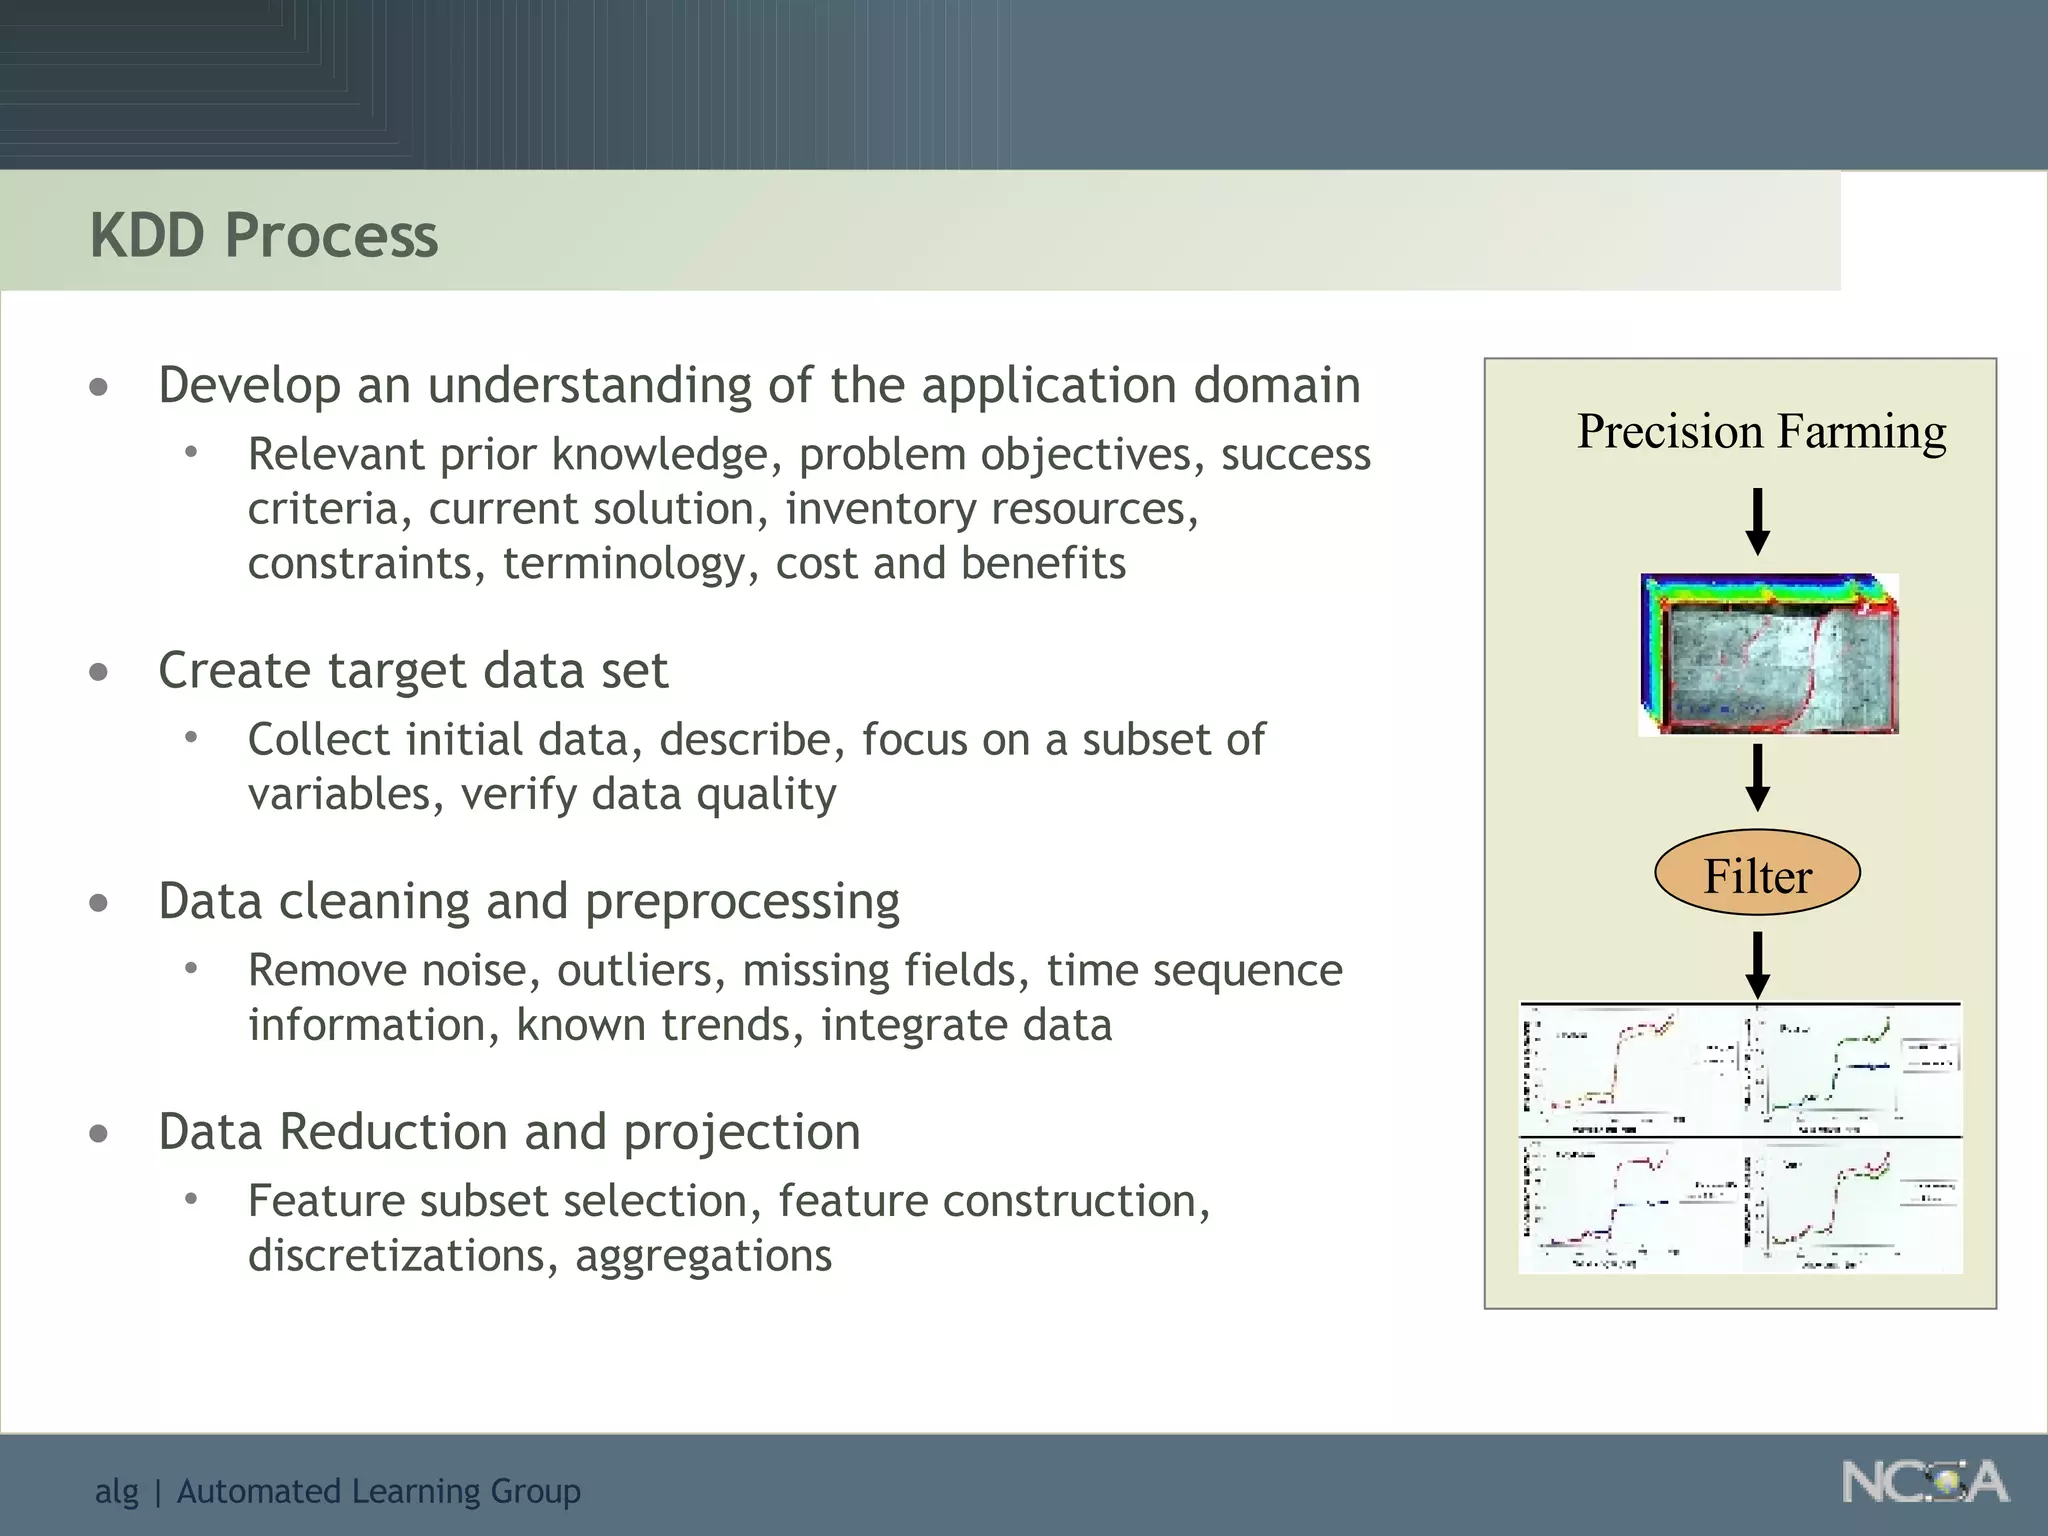
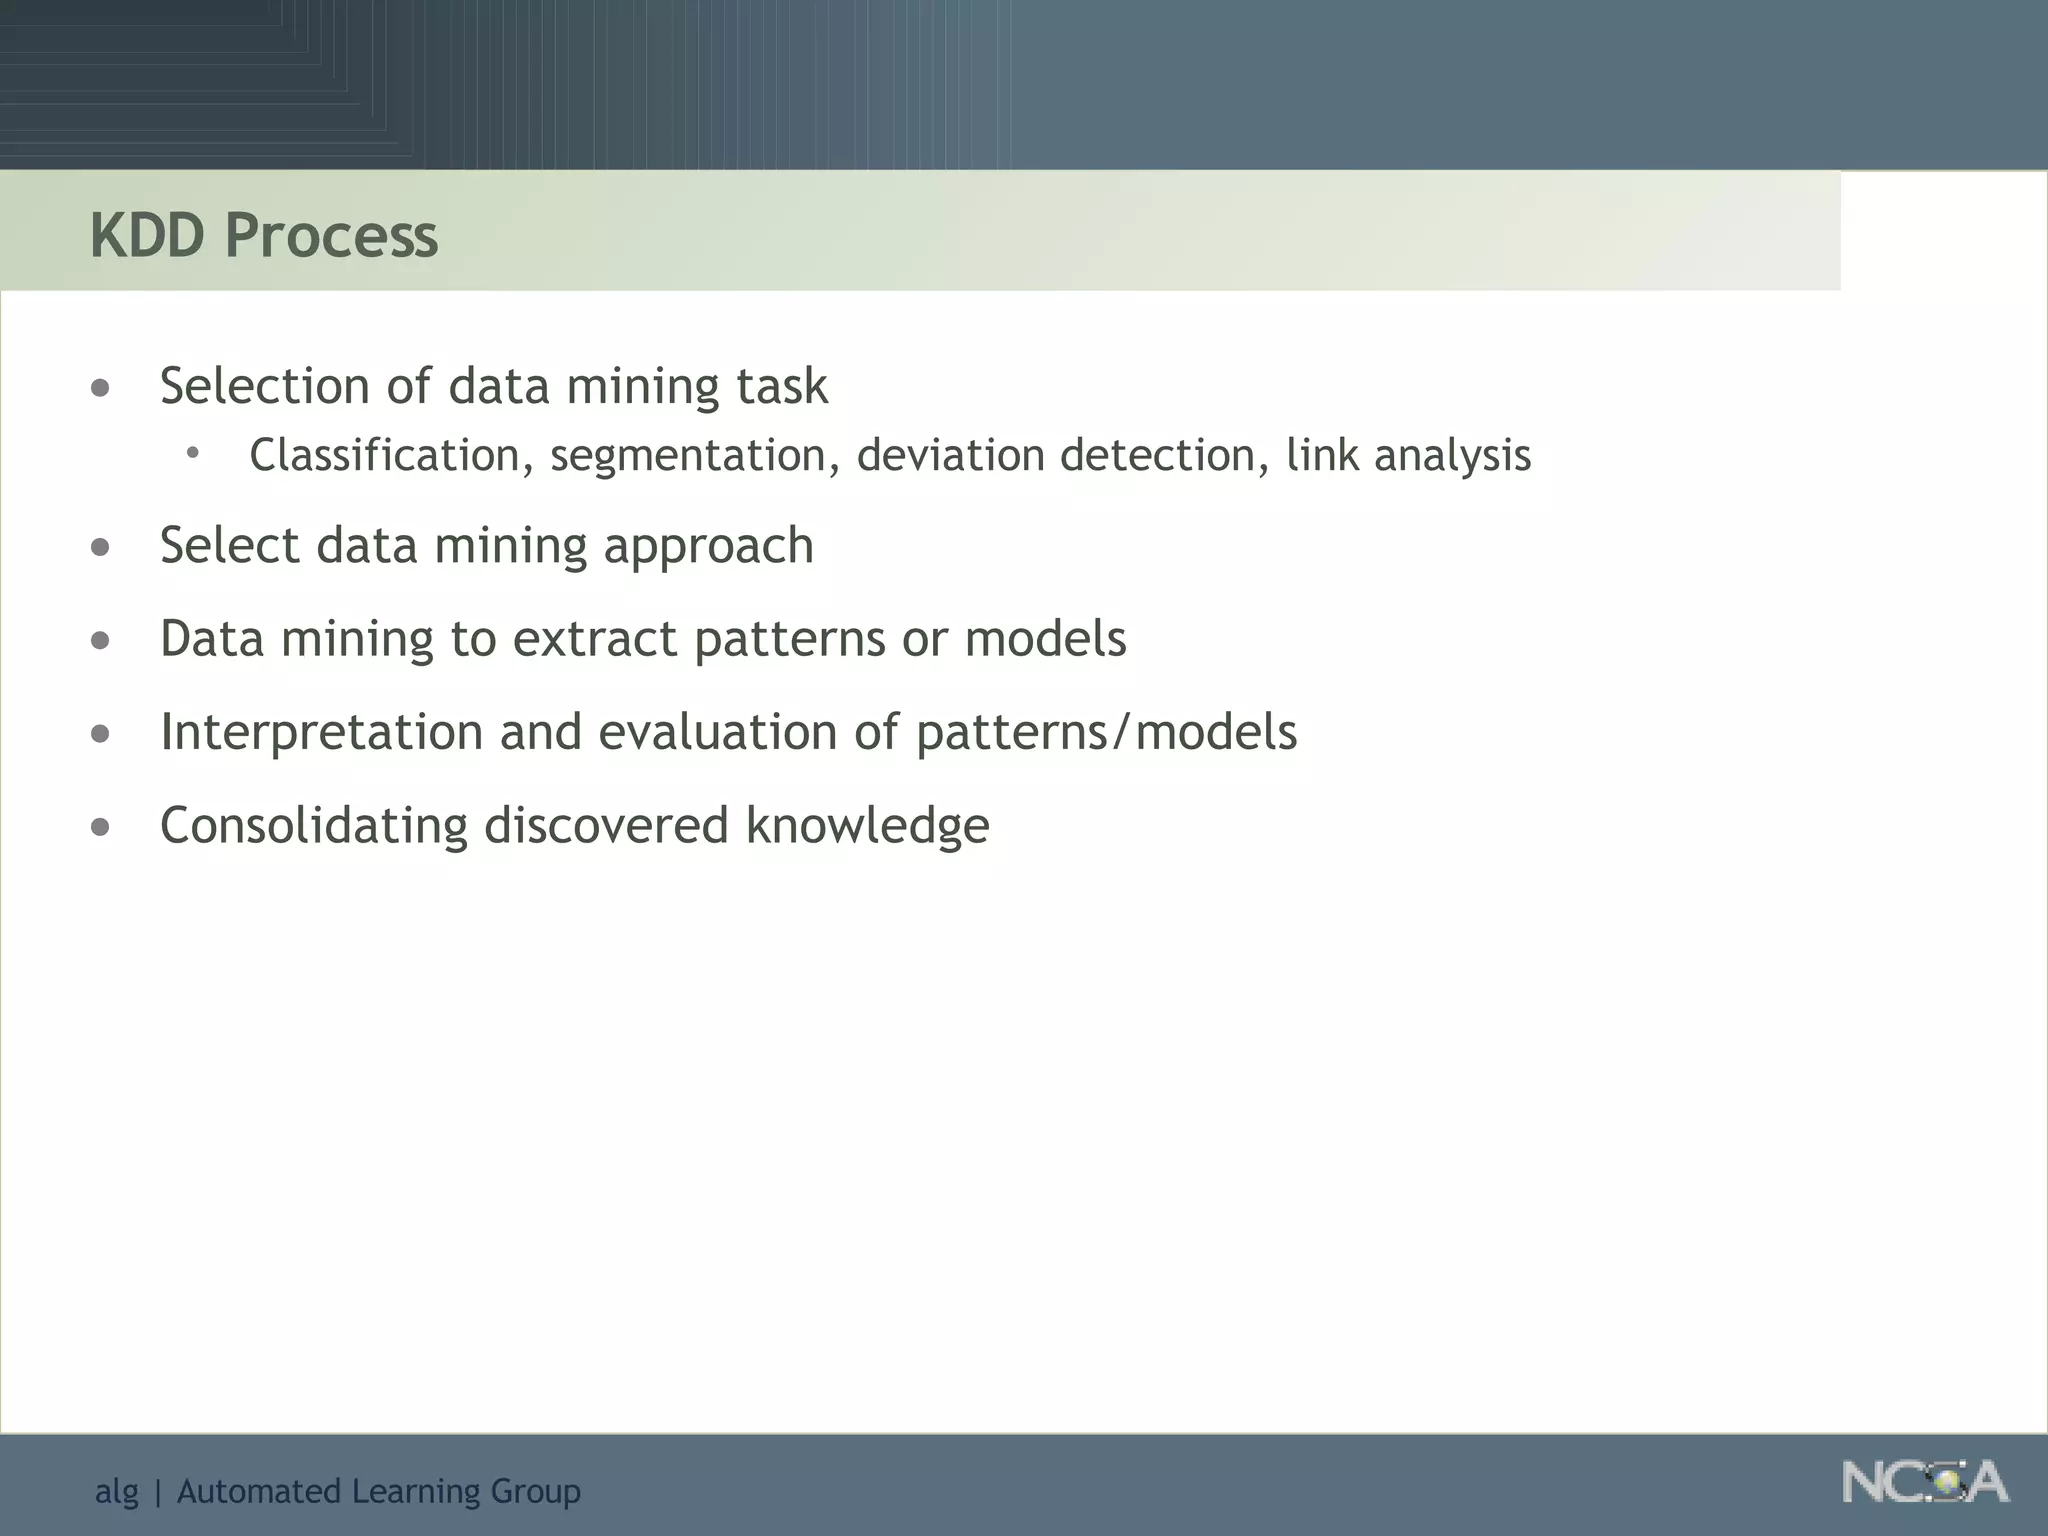
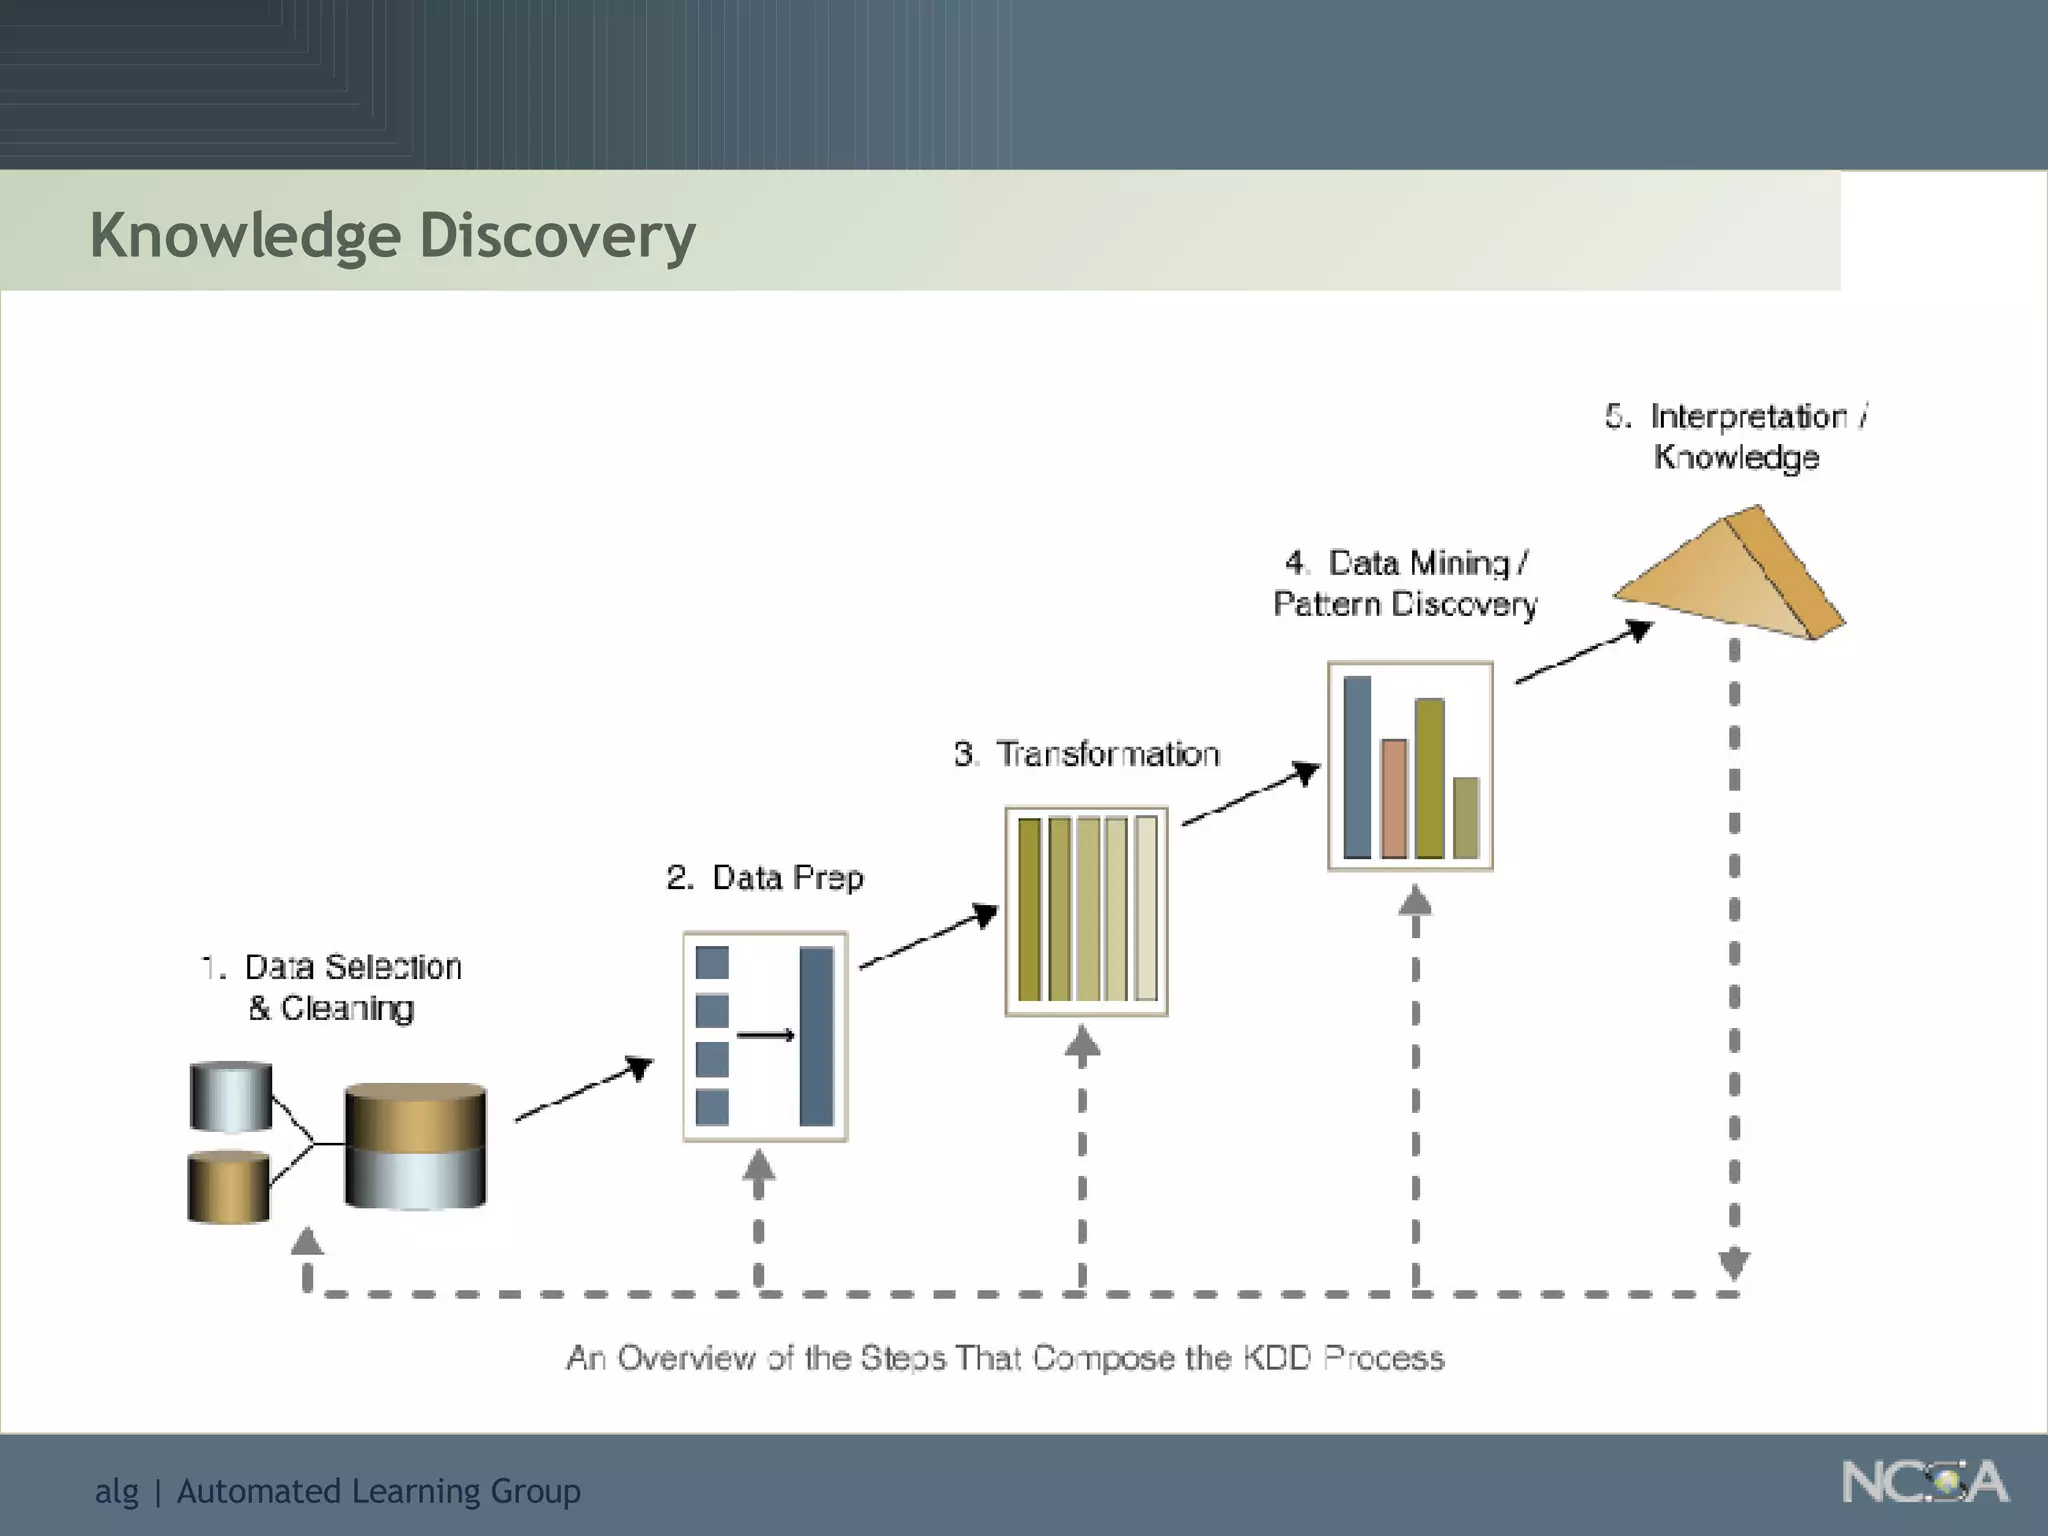
Outlines the KDD process, including data preparation, mining tasks, and the integration of discovered knowledge.
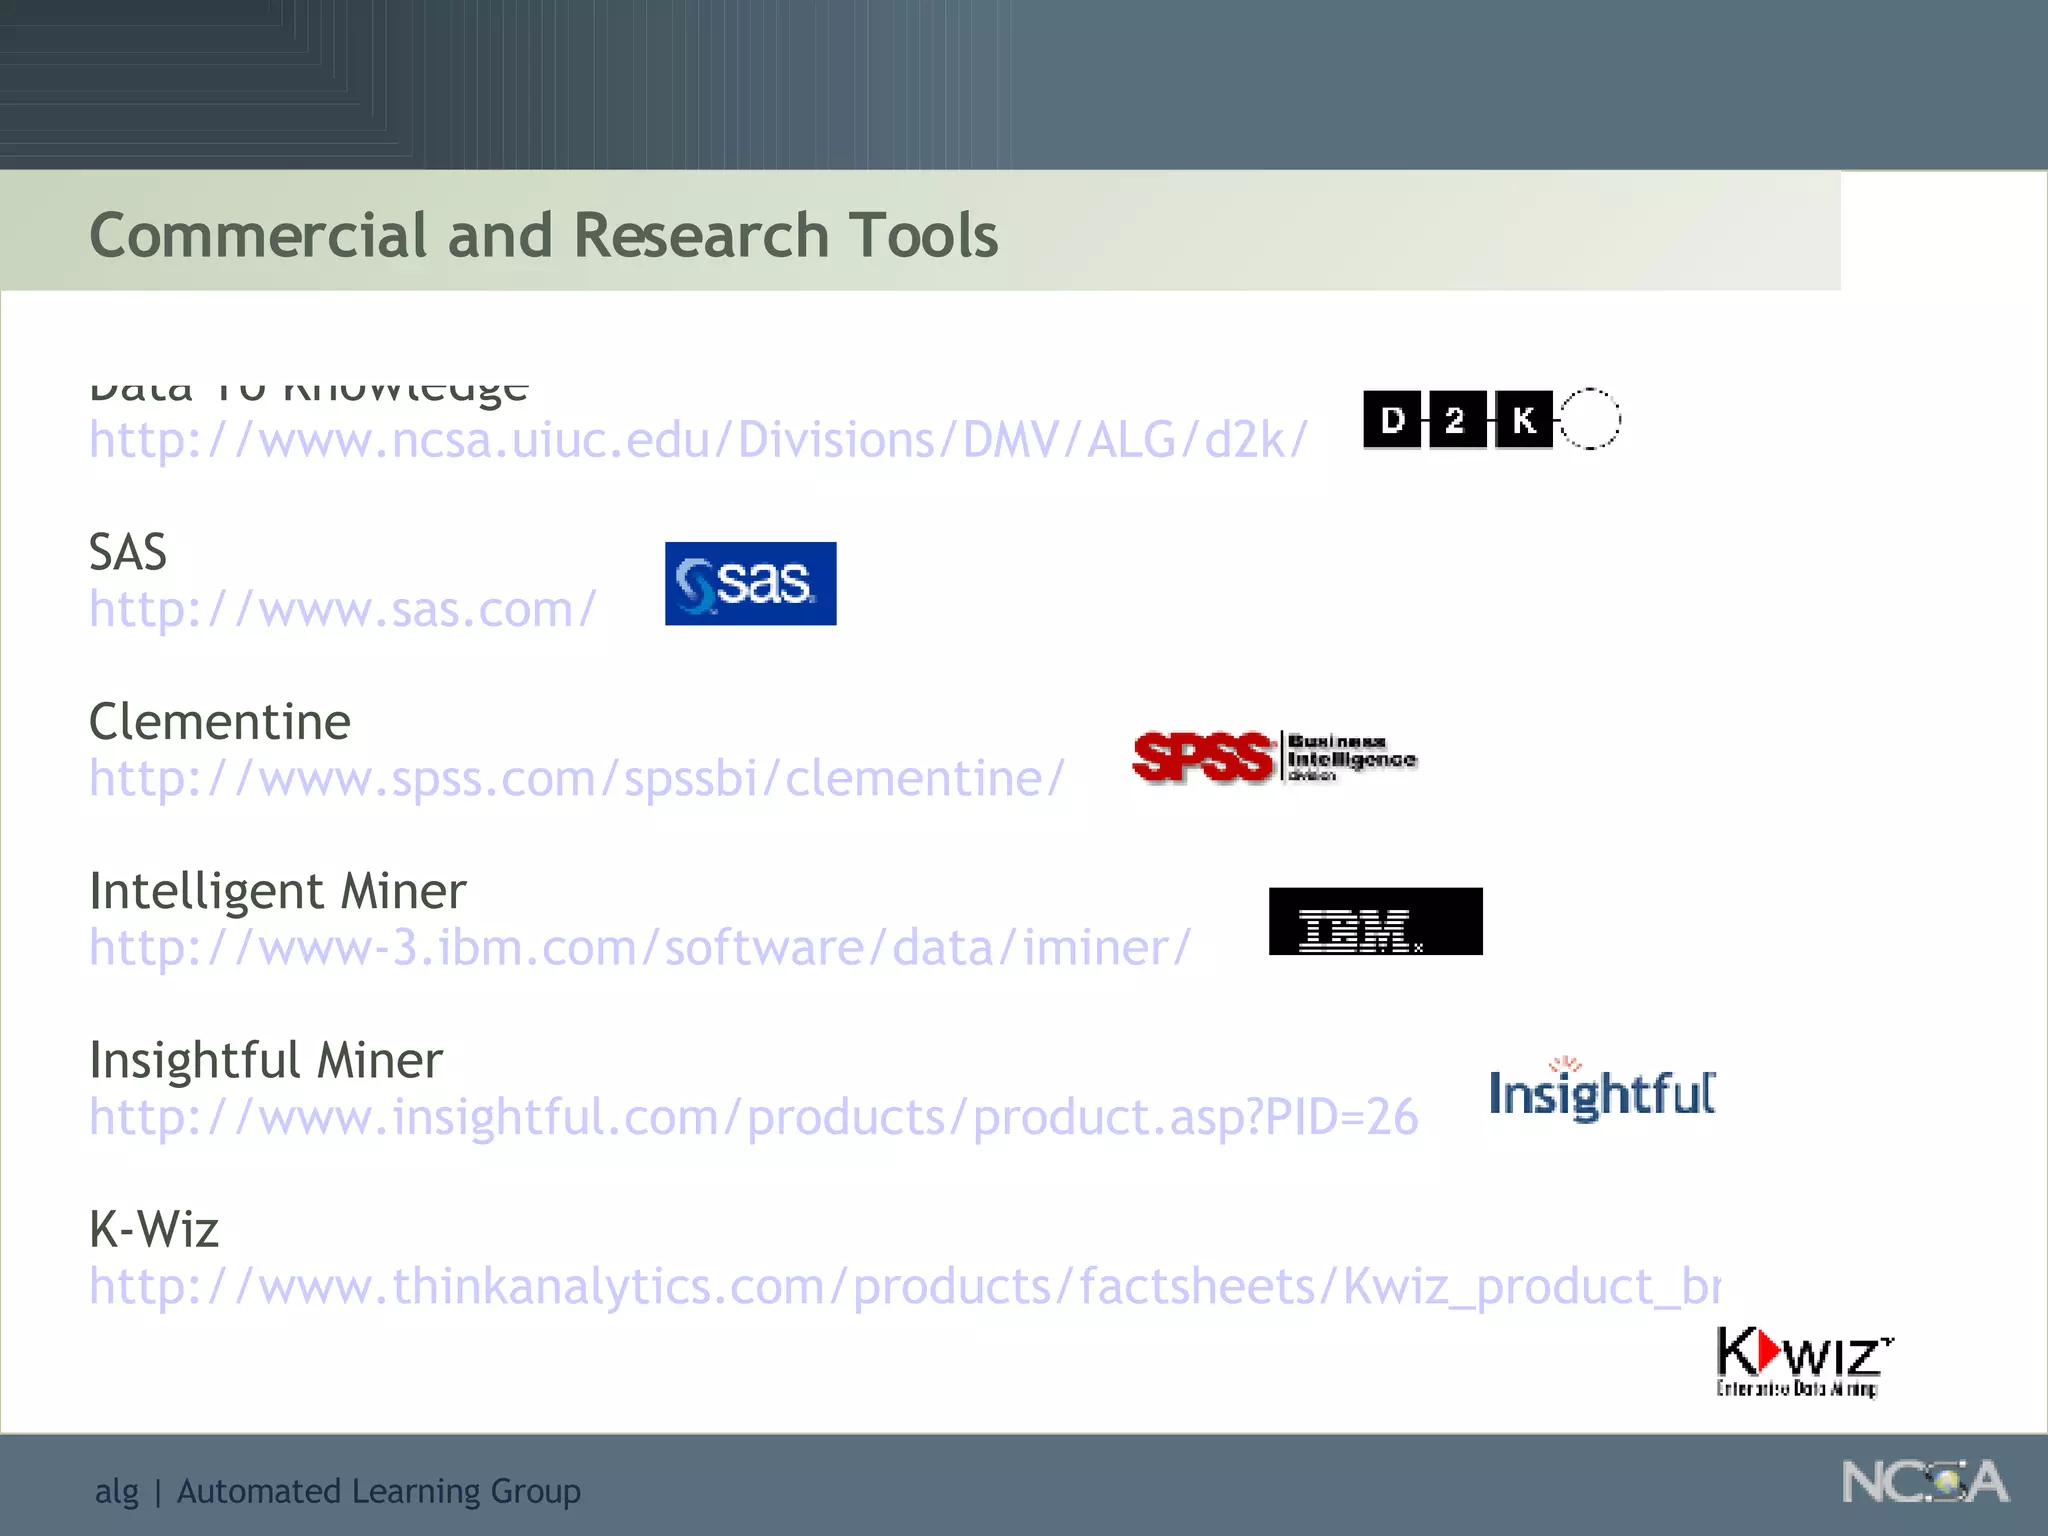
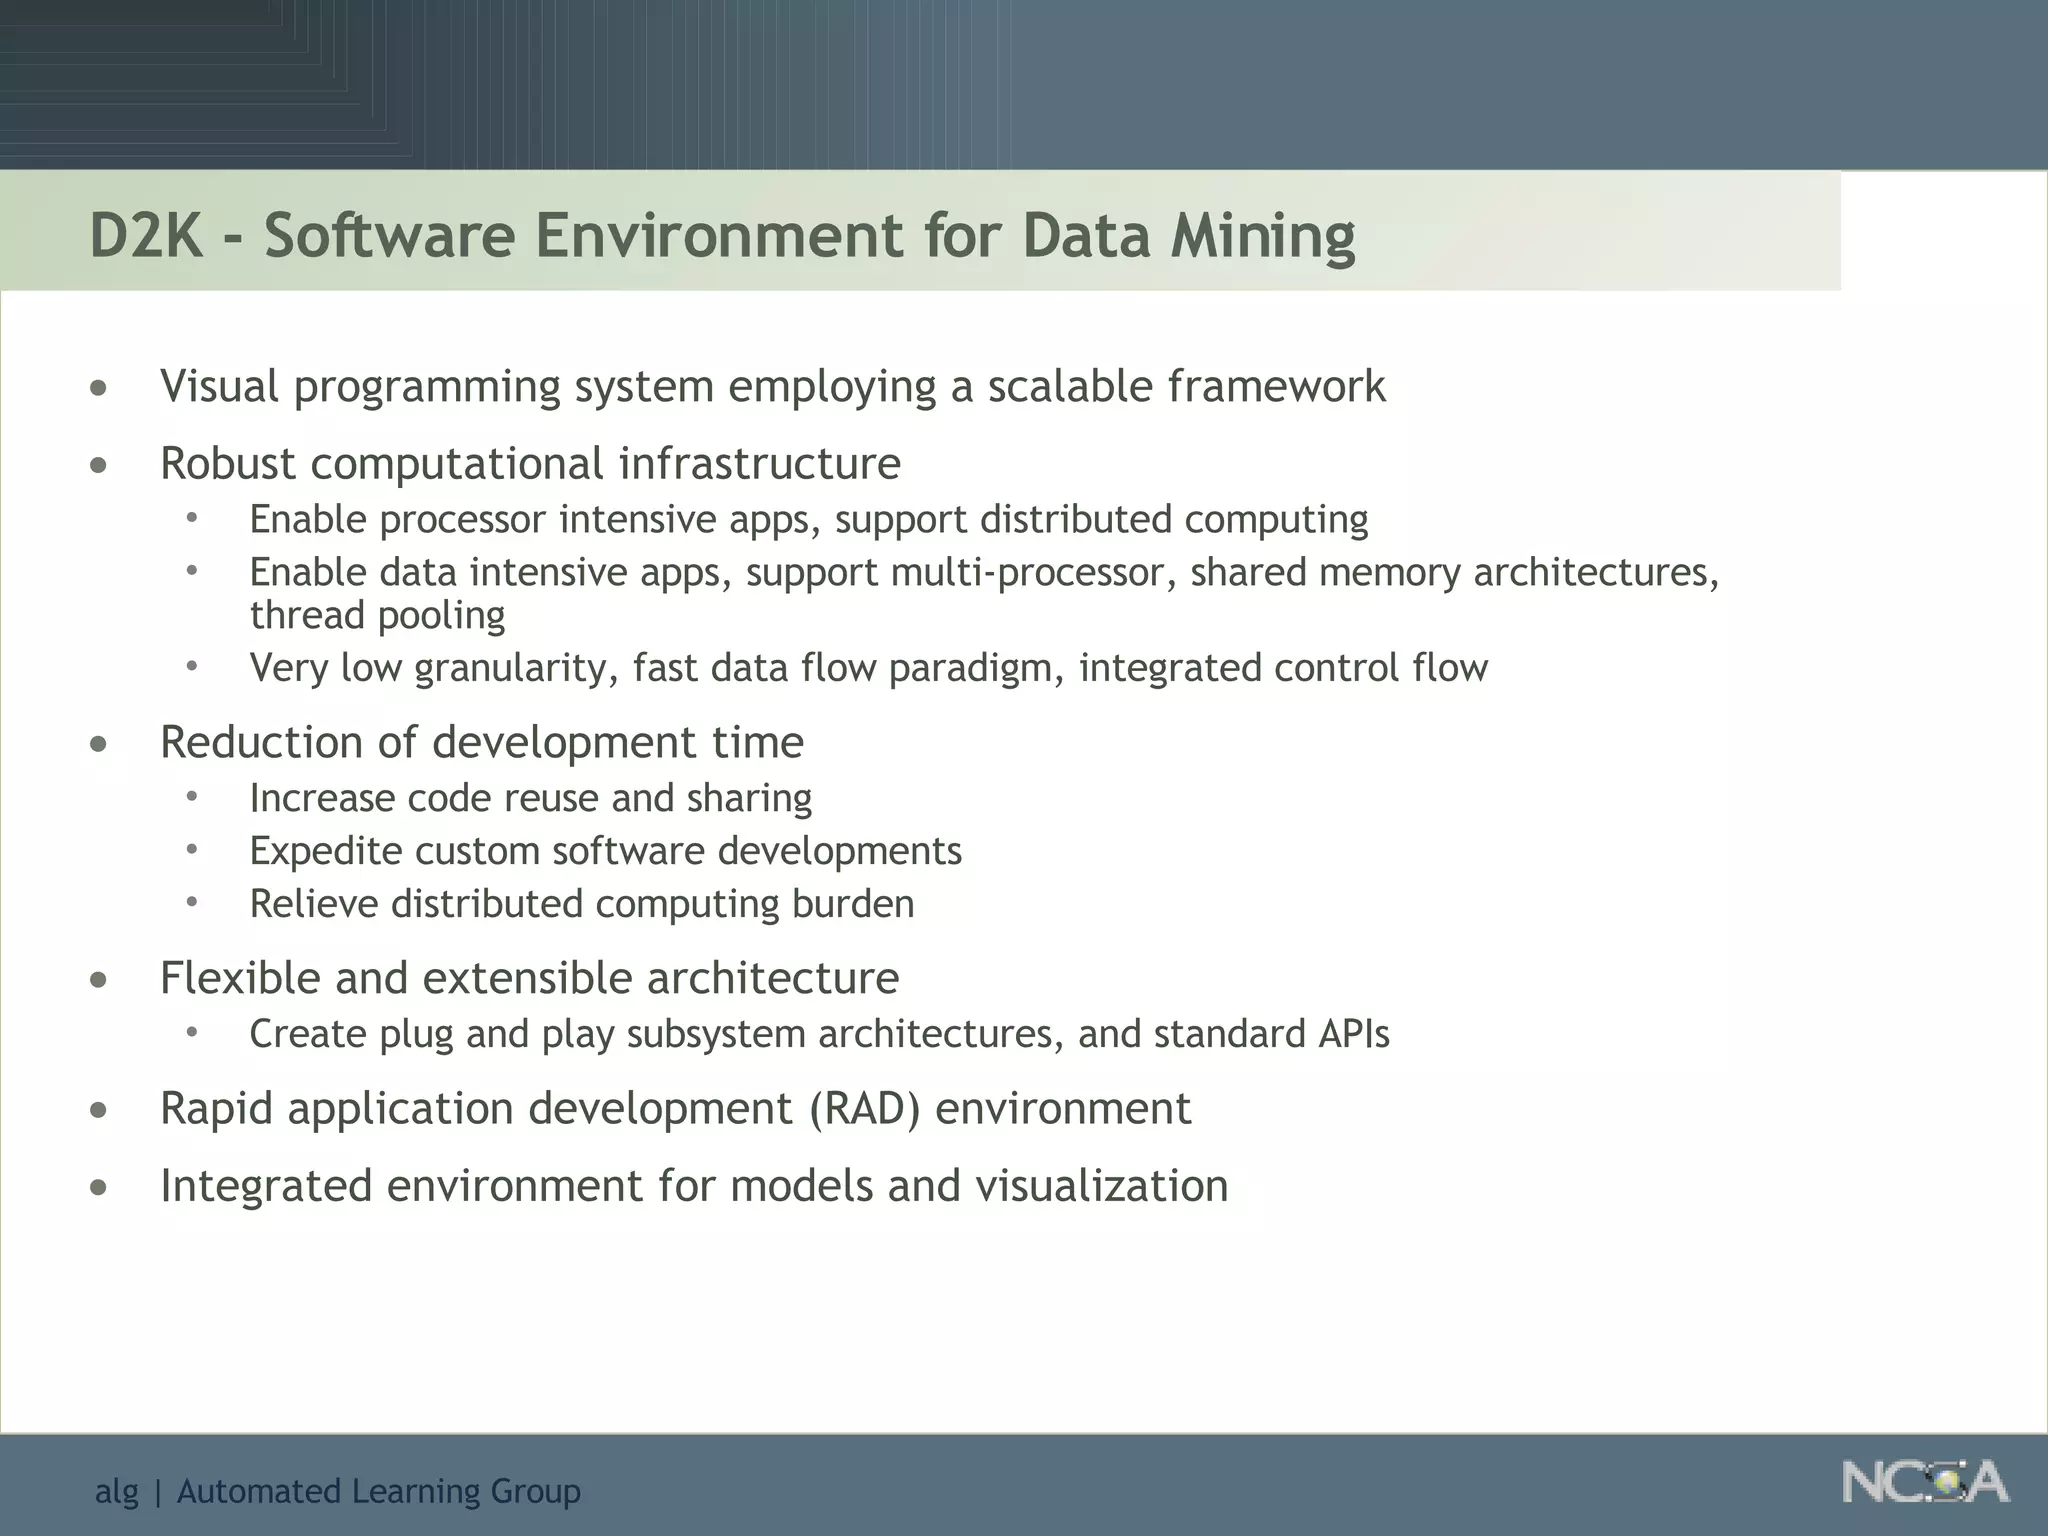
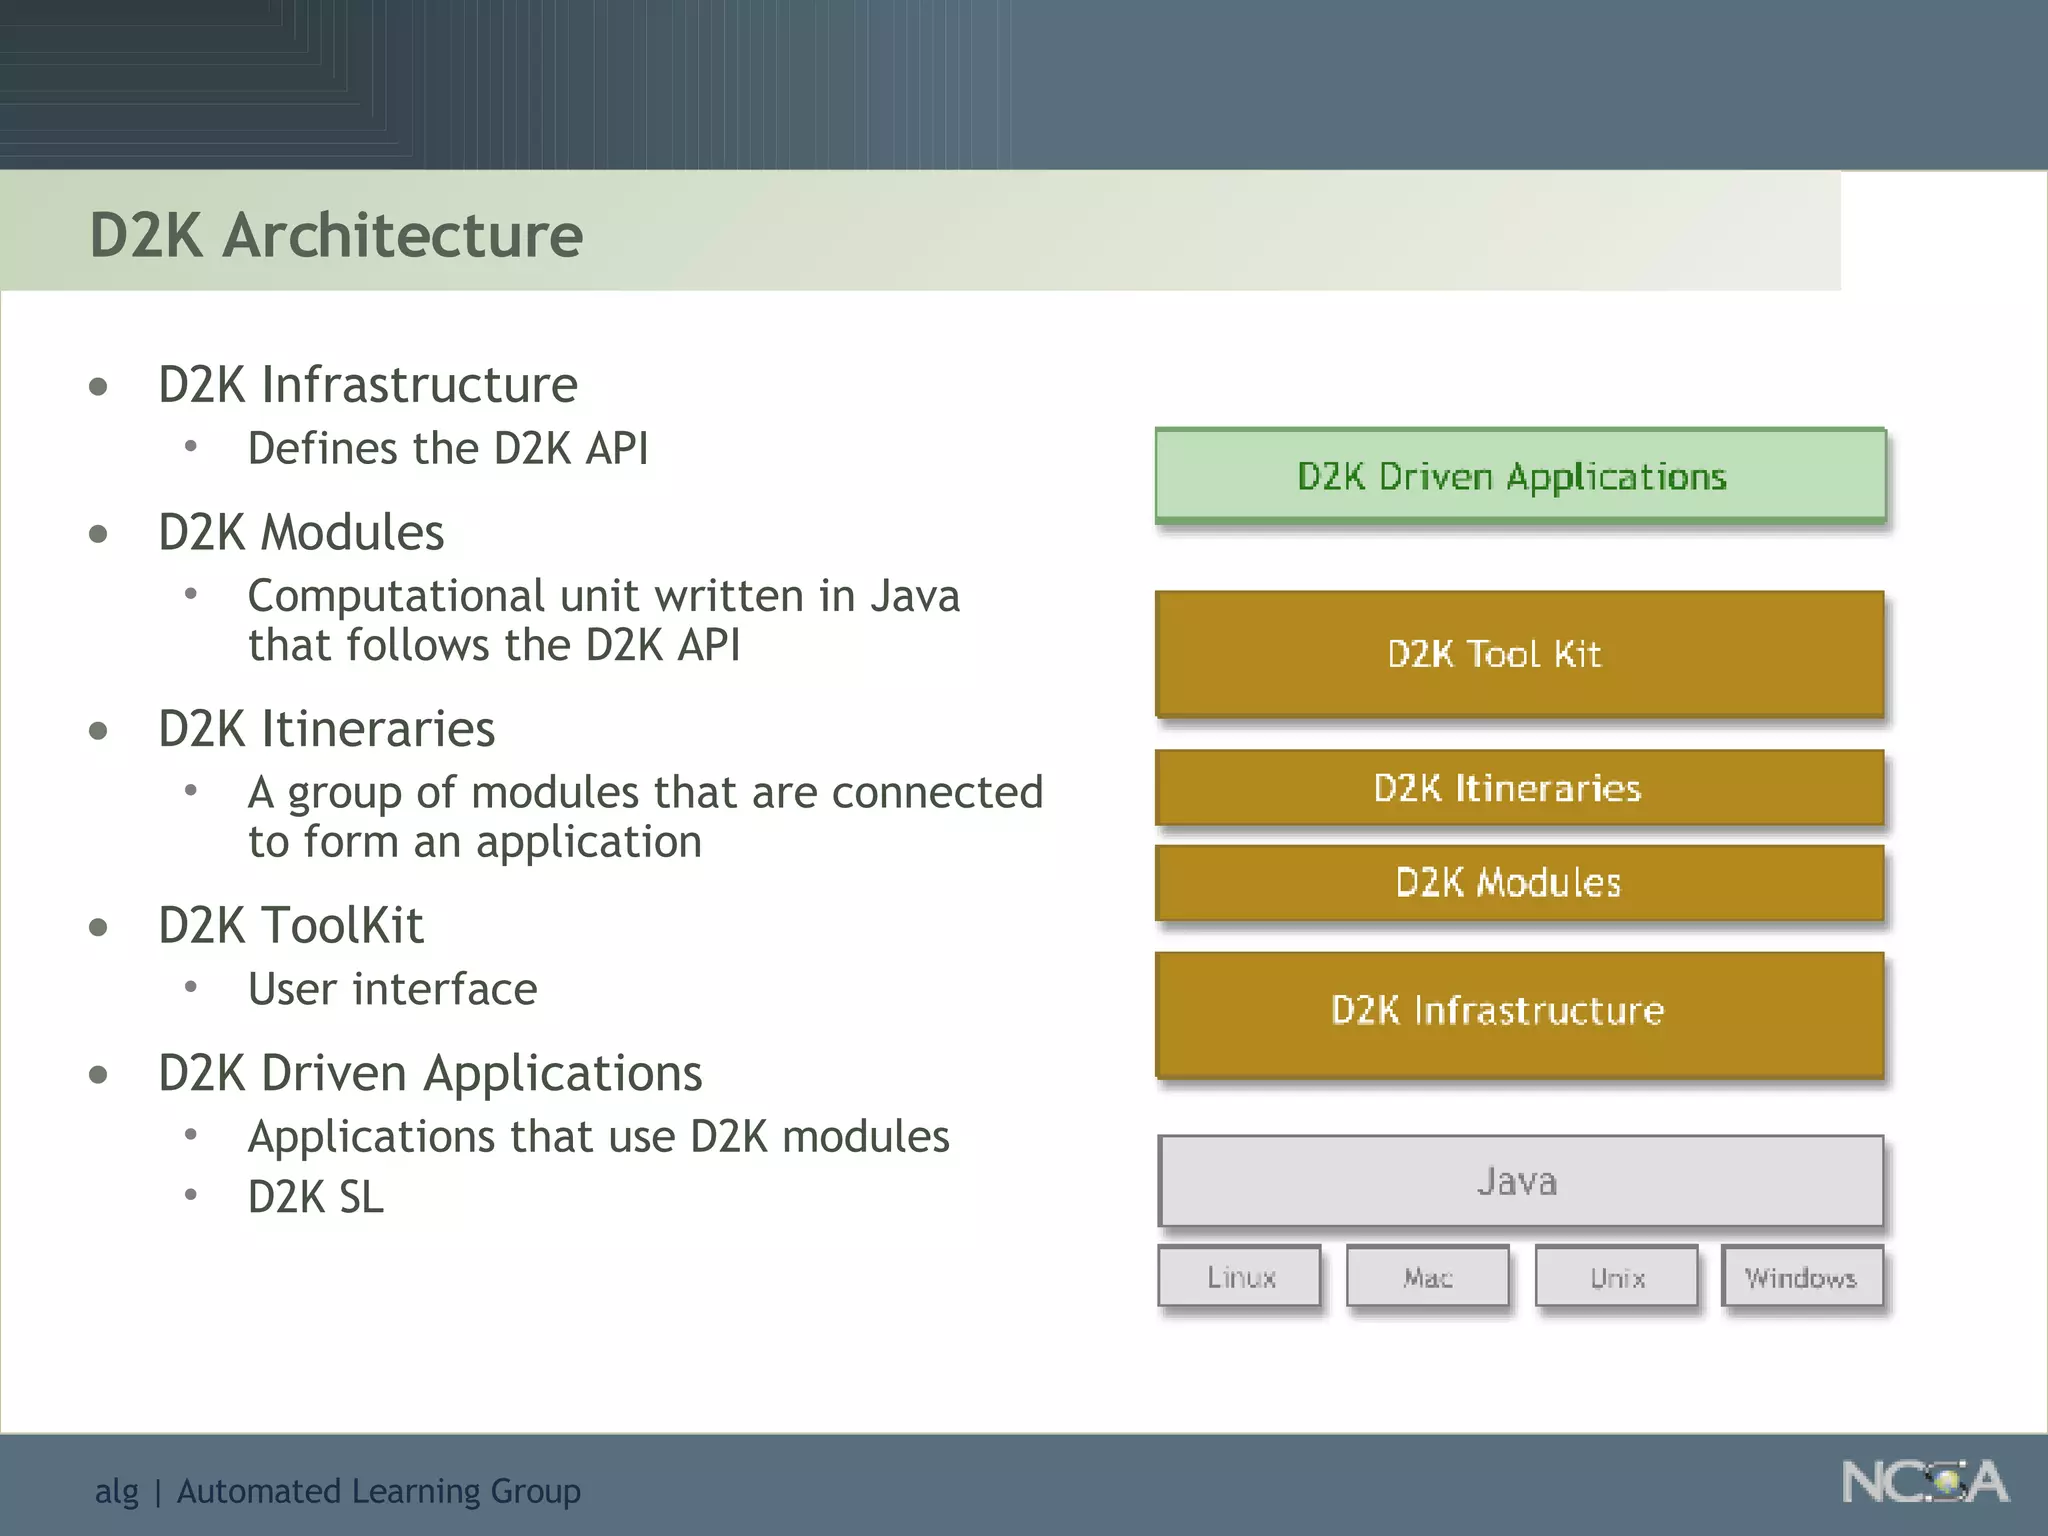
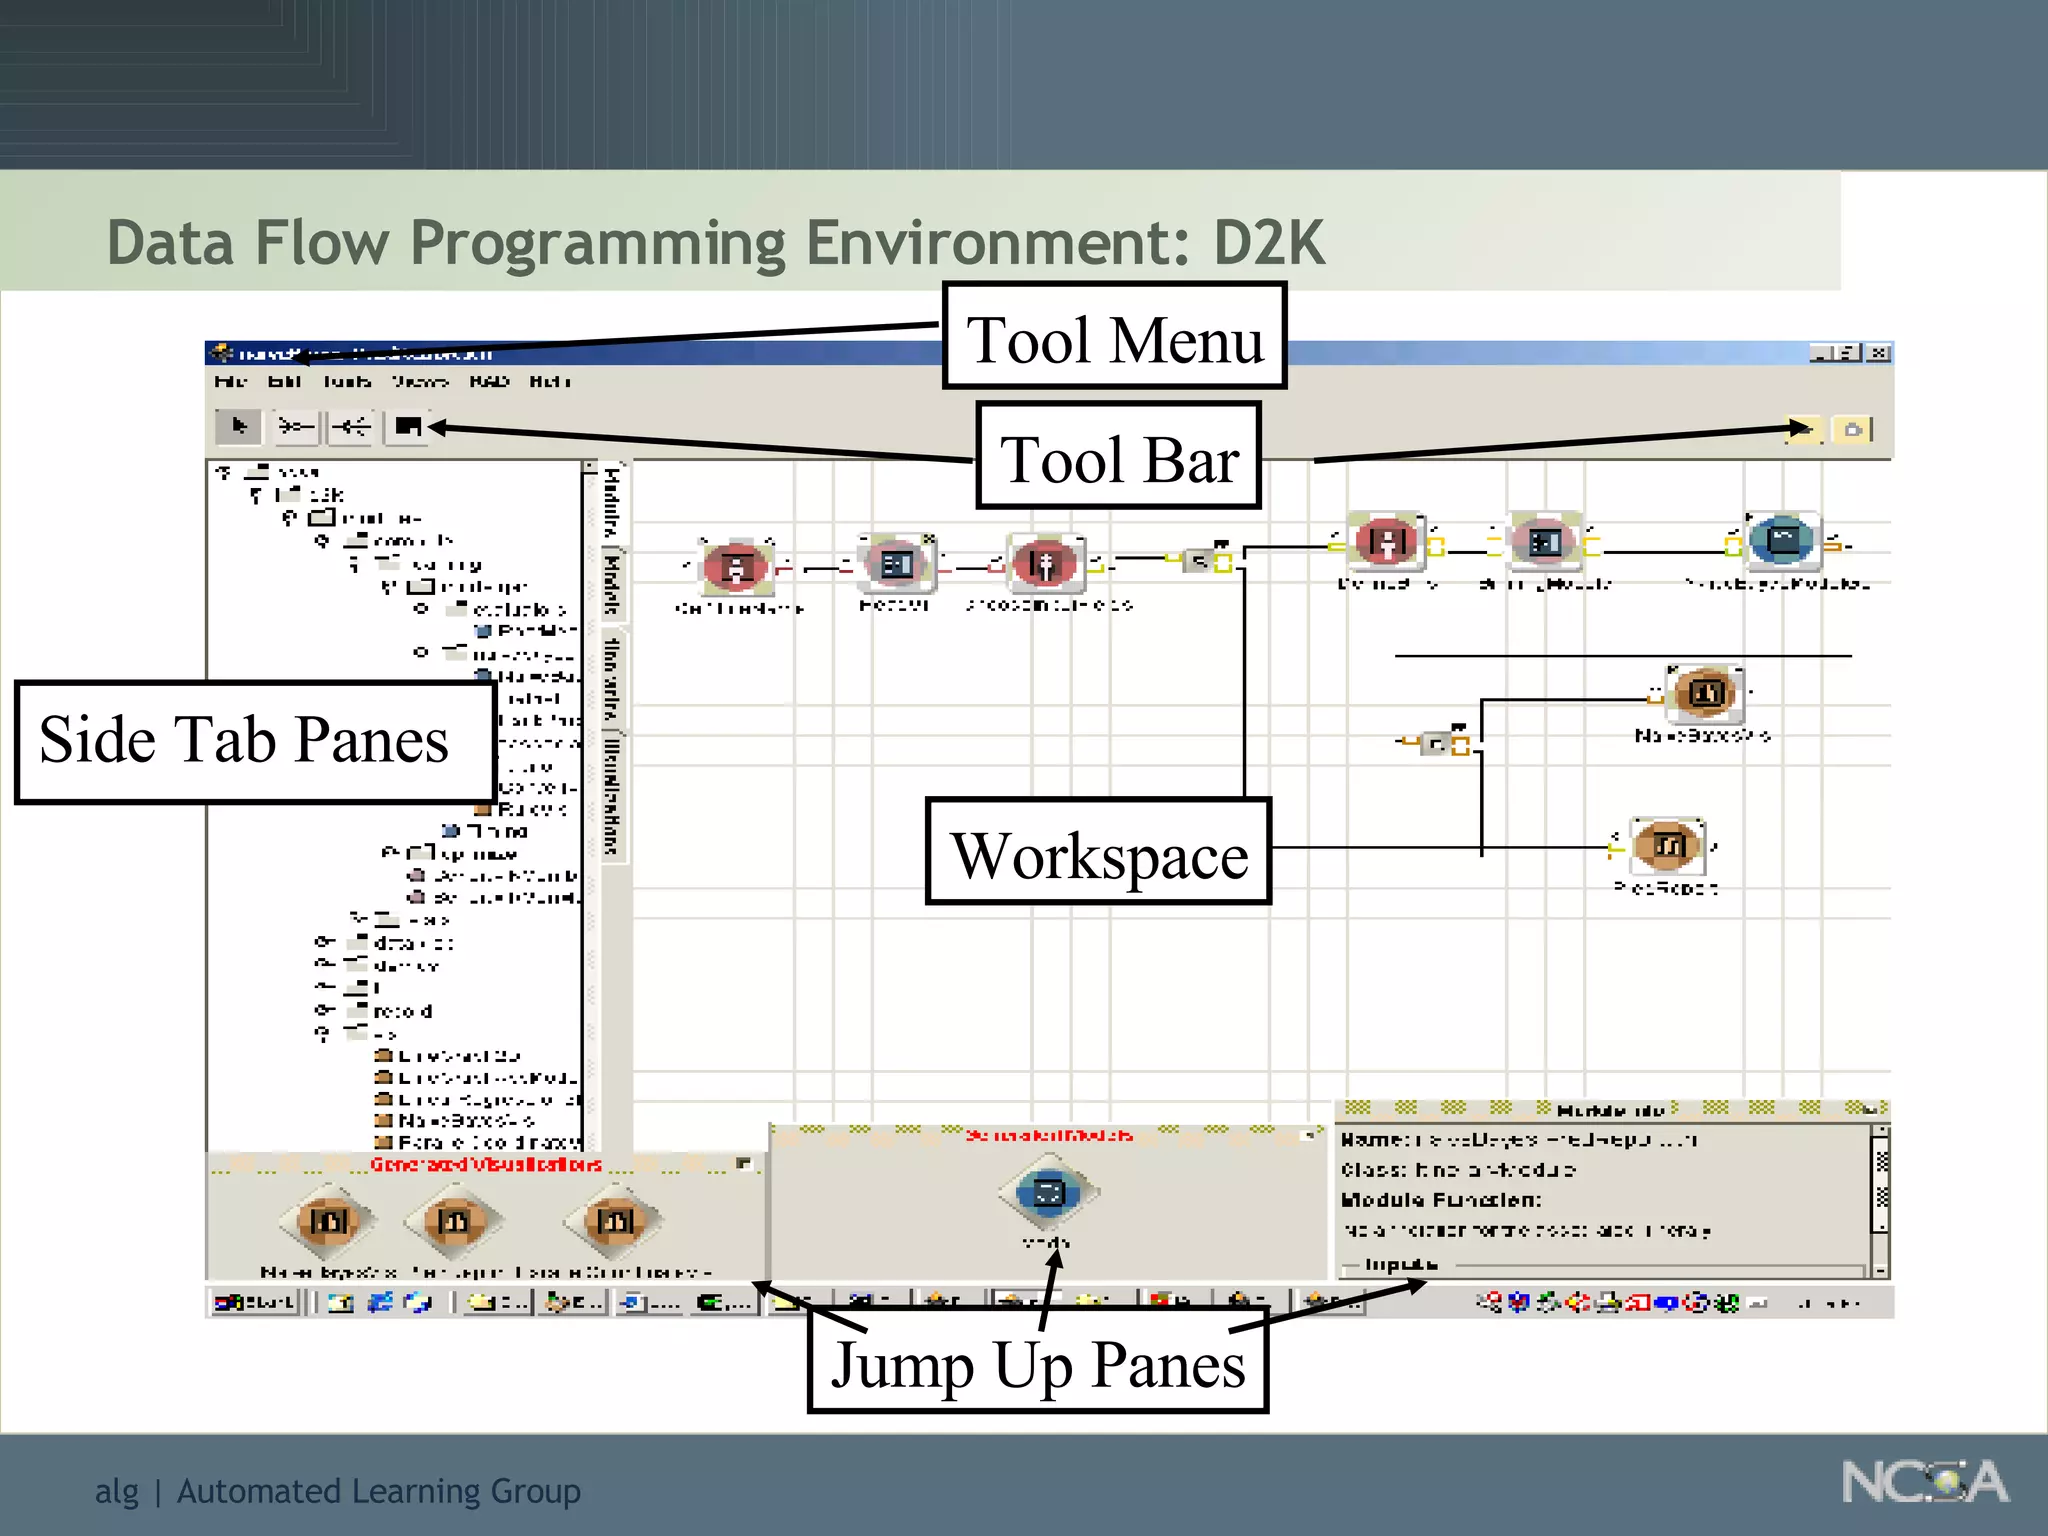
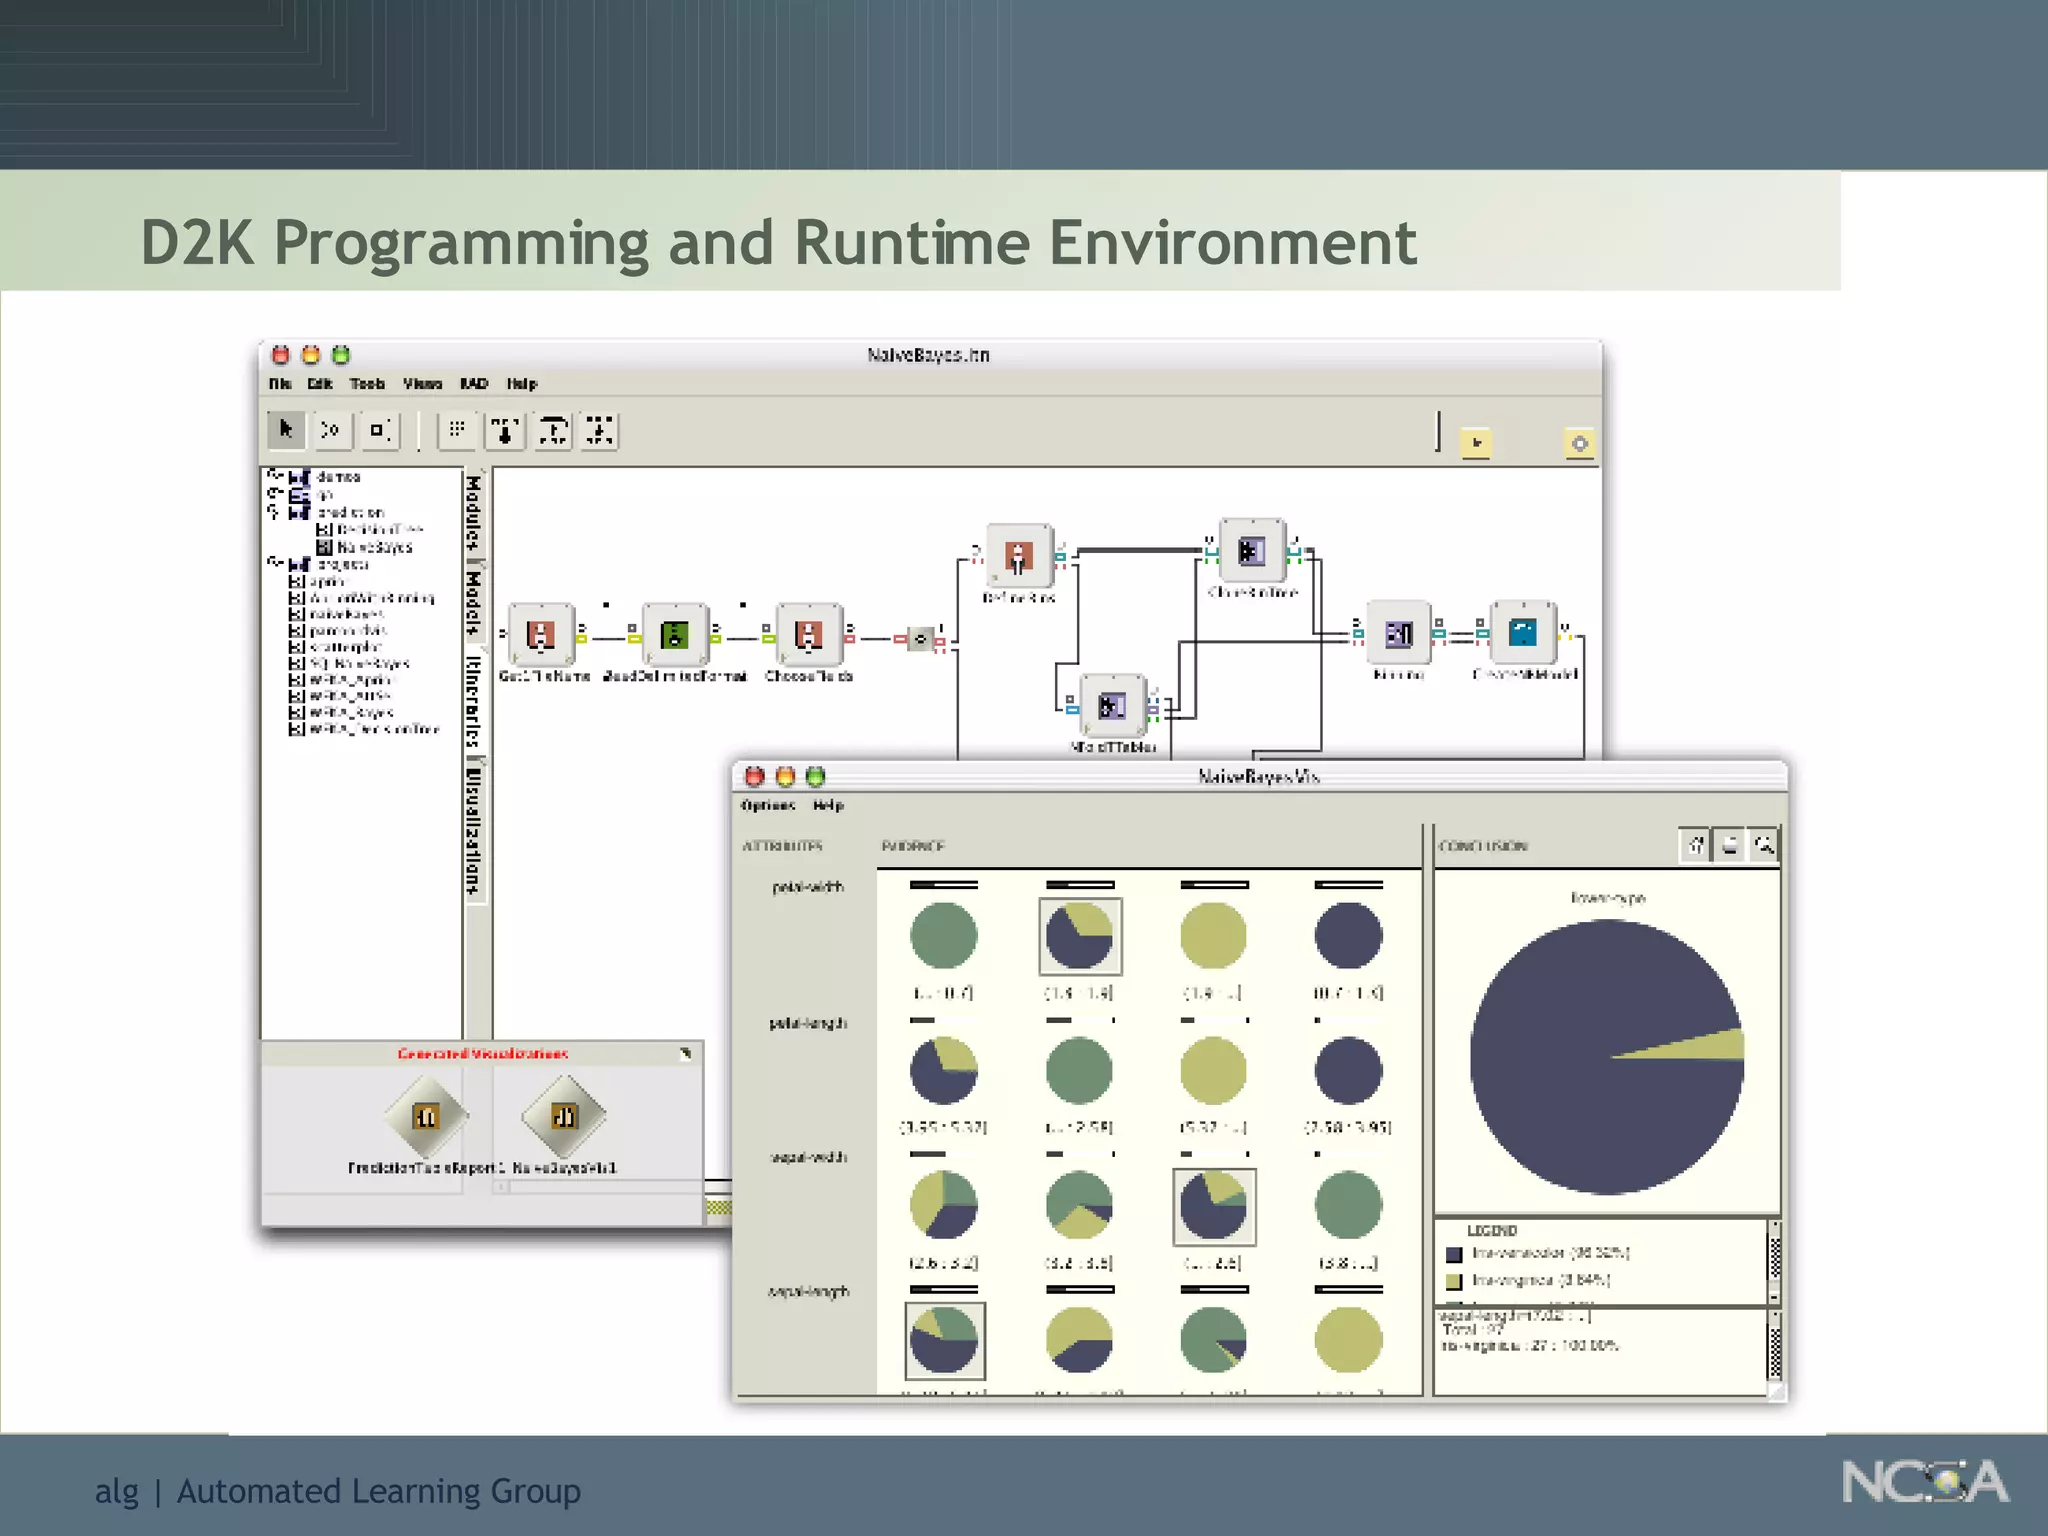
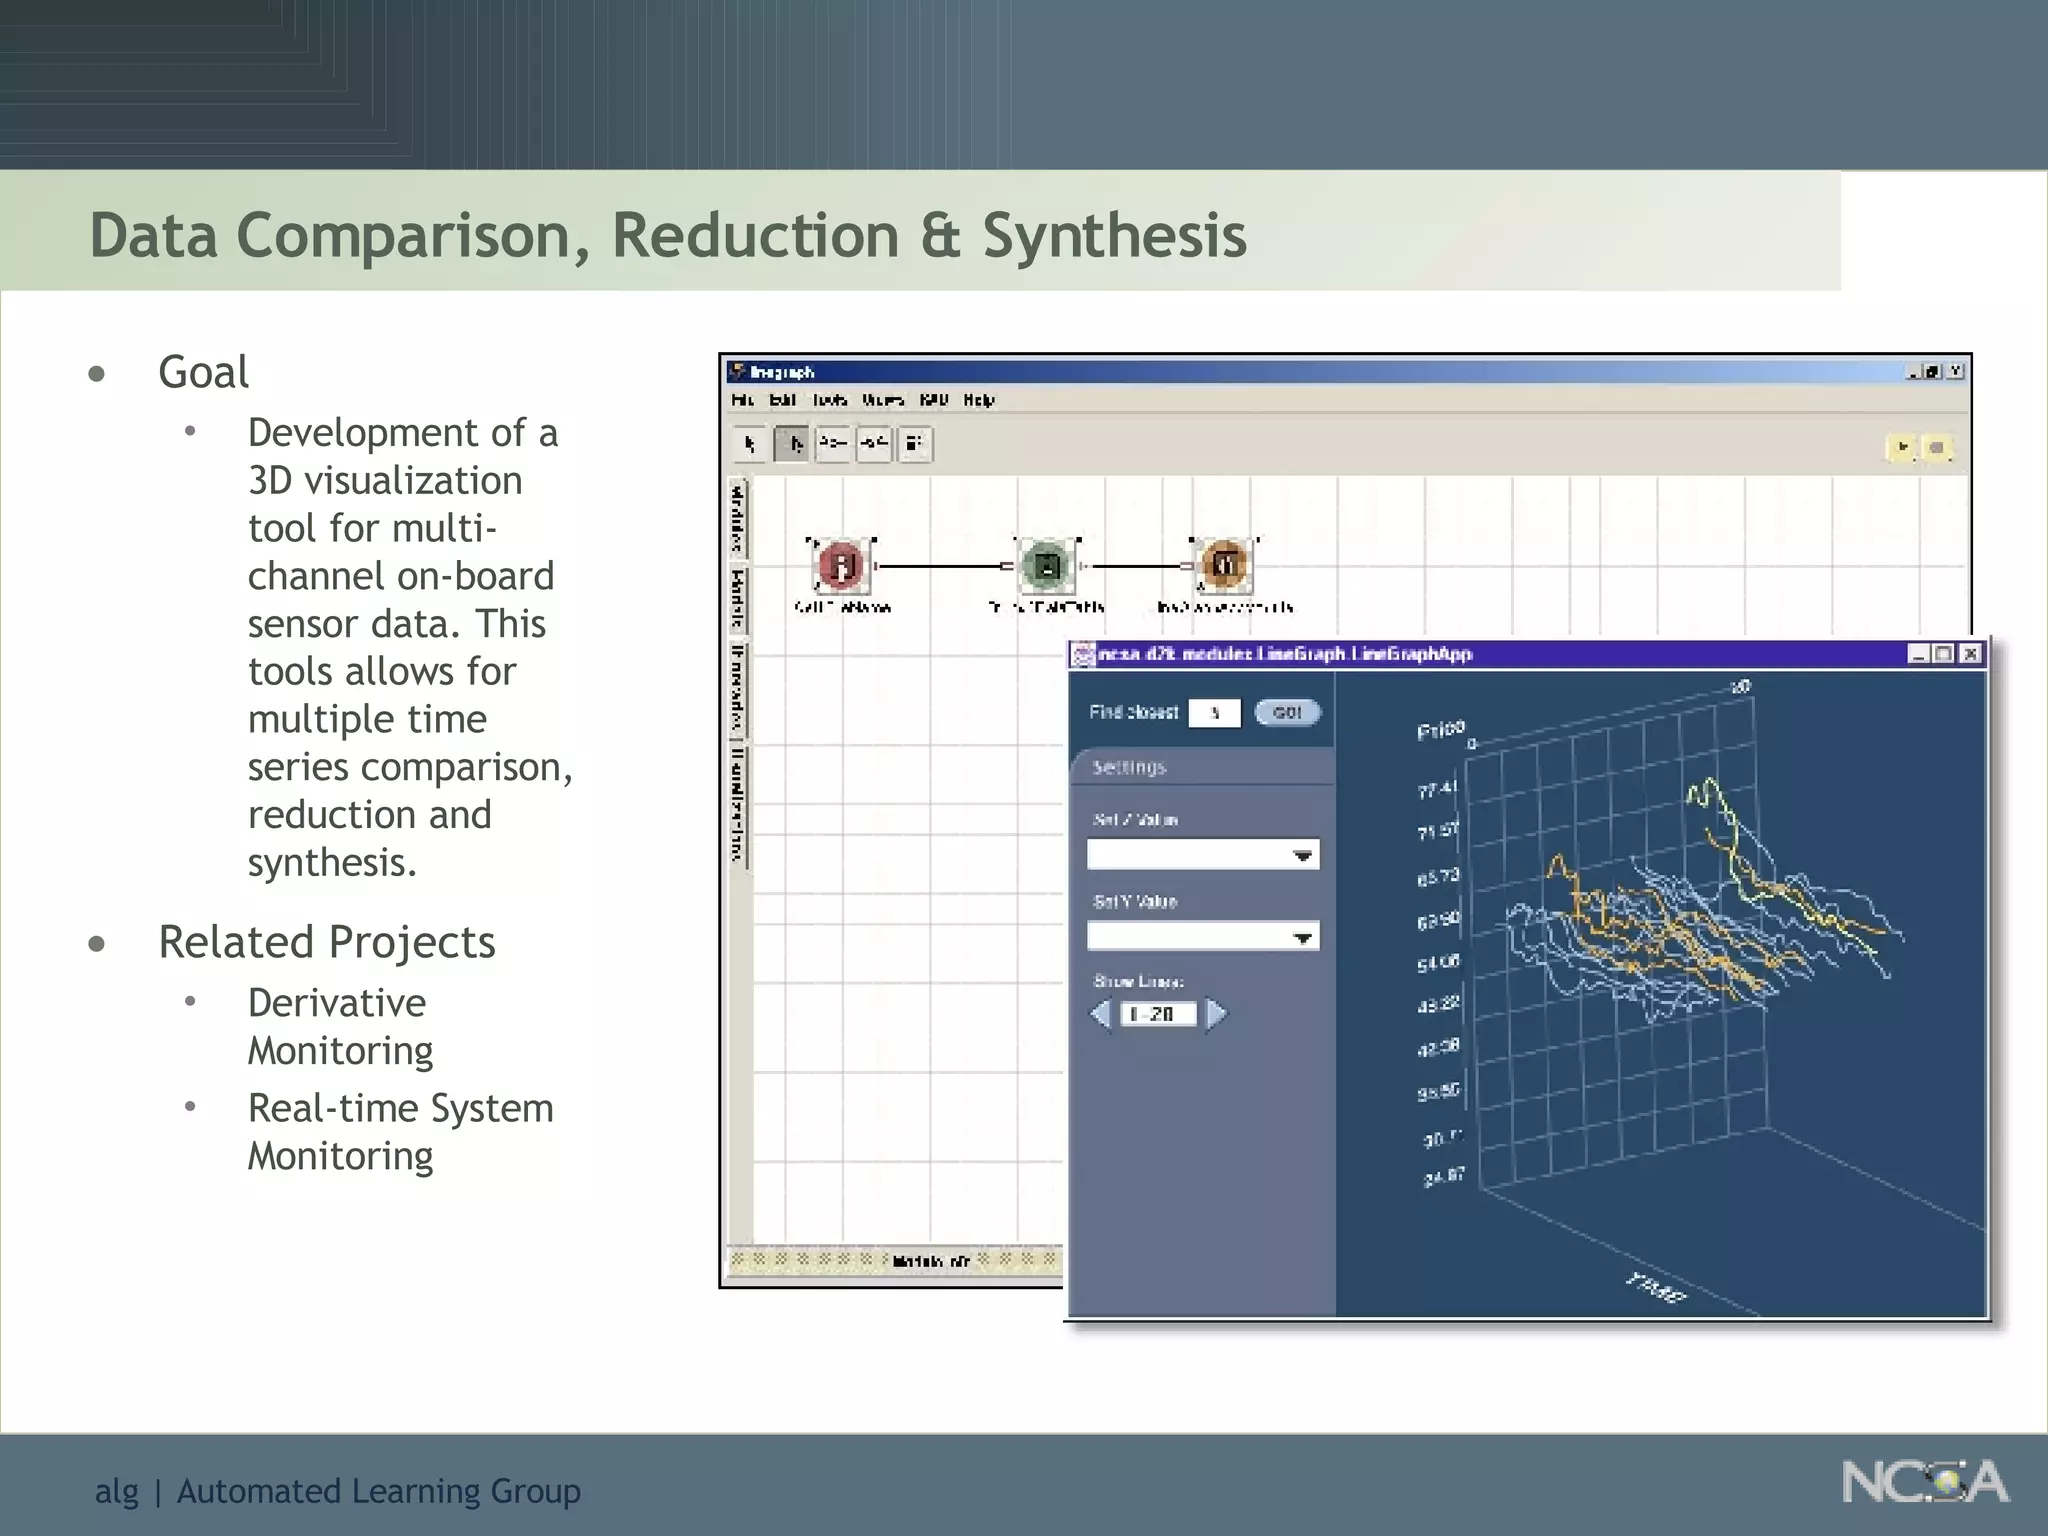
Describes various data mining tools and software like D2K, SAS, and the significance of software engineering. Explains the D2K data mining environment, its architecture, and functionalities.
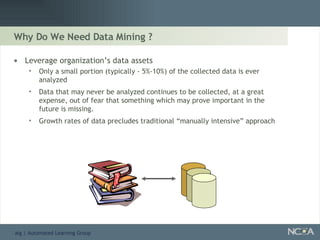
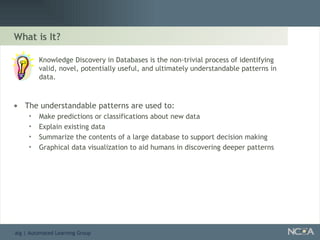
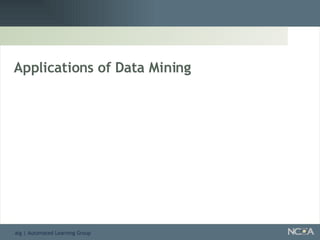
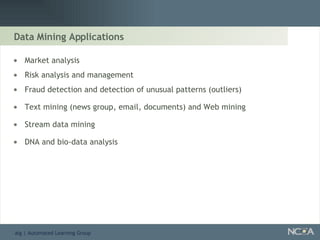
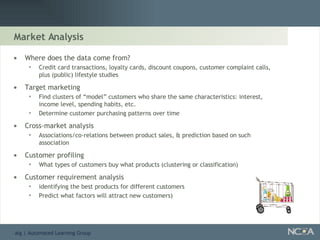
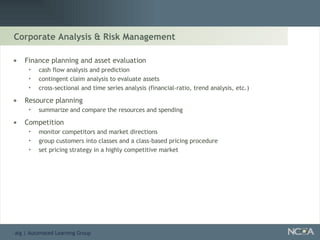
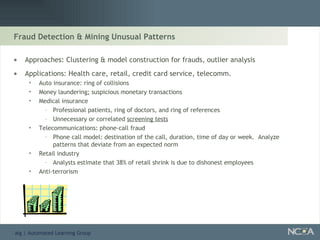
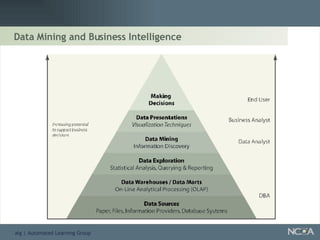
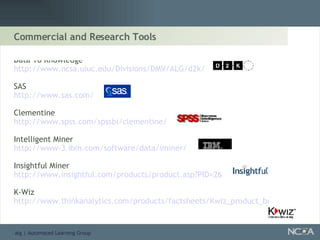
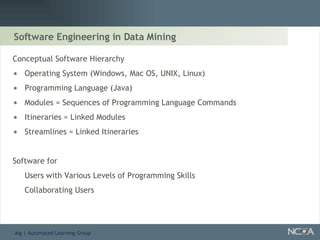
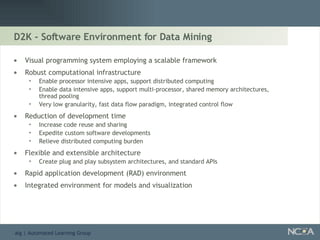
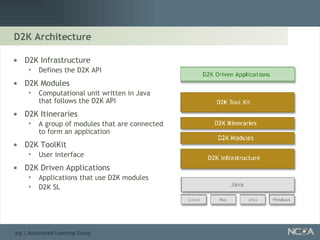
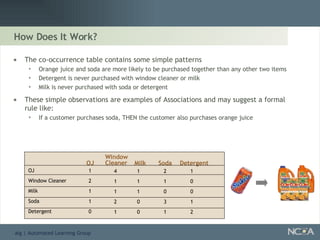
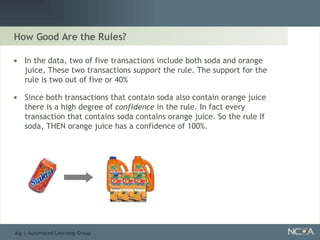
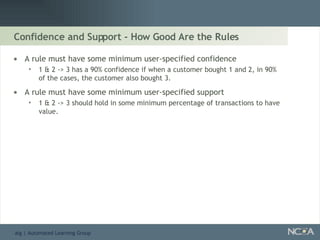
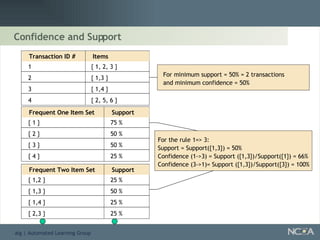
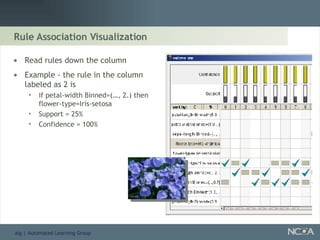
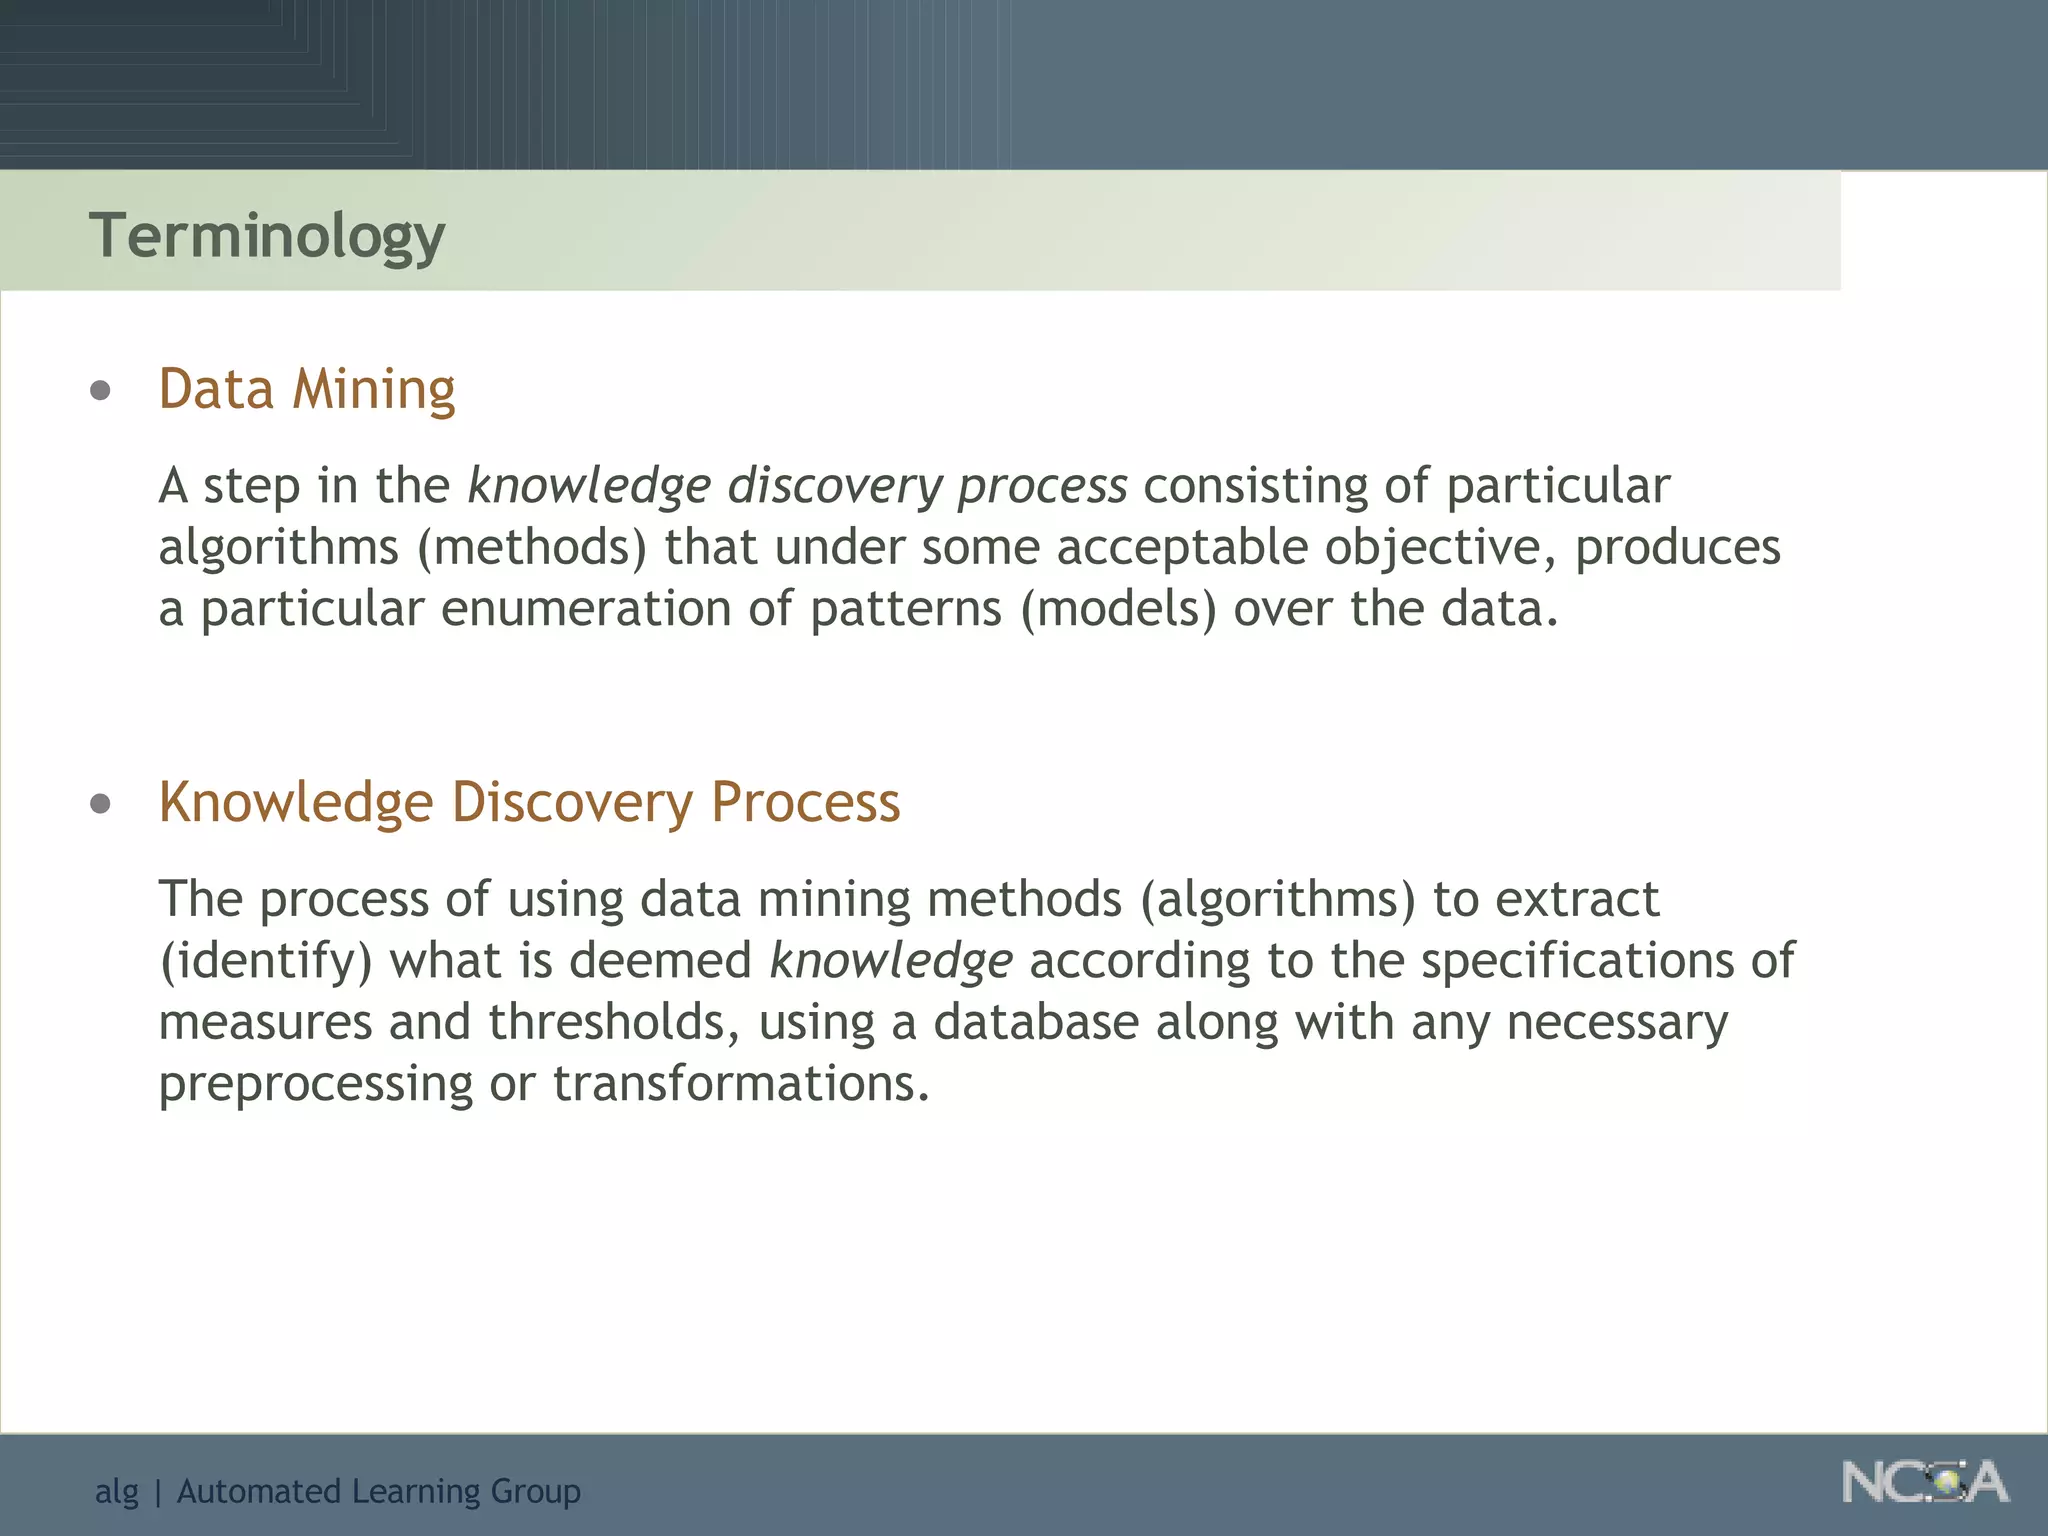
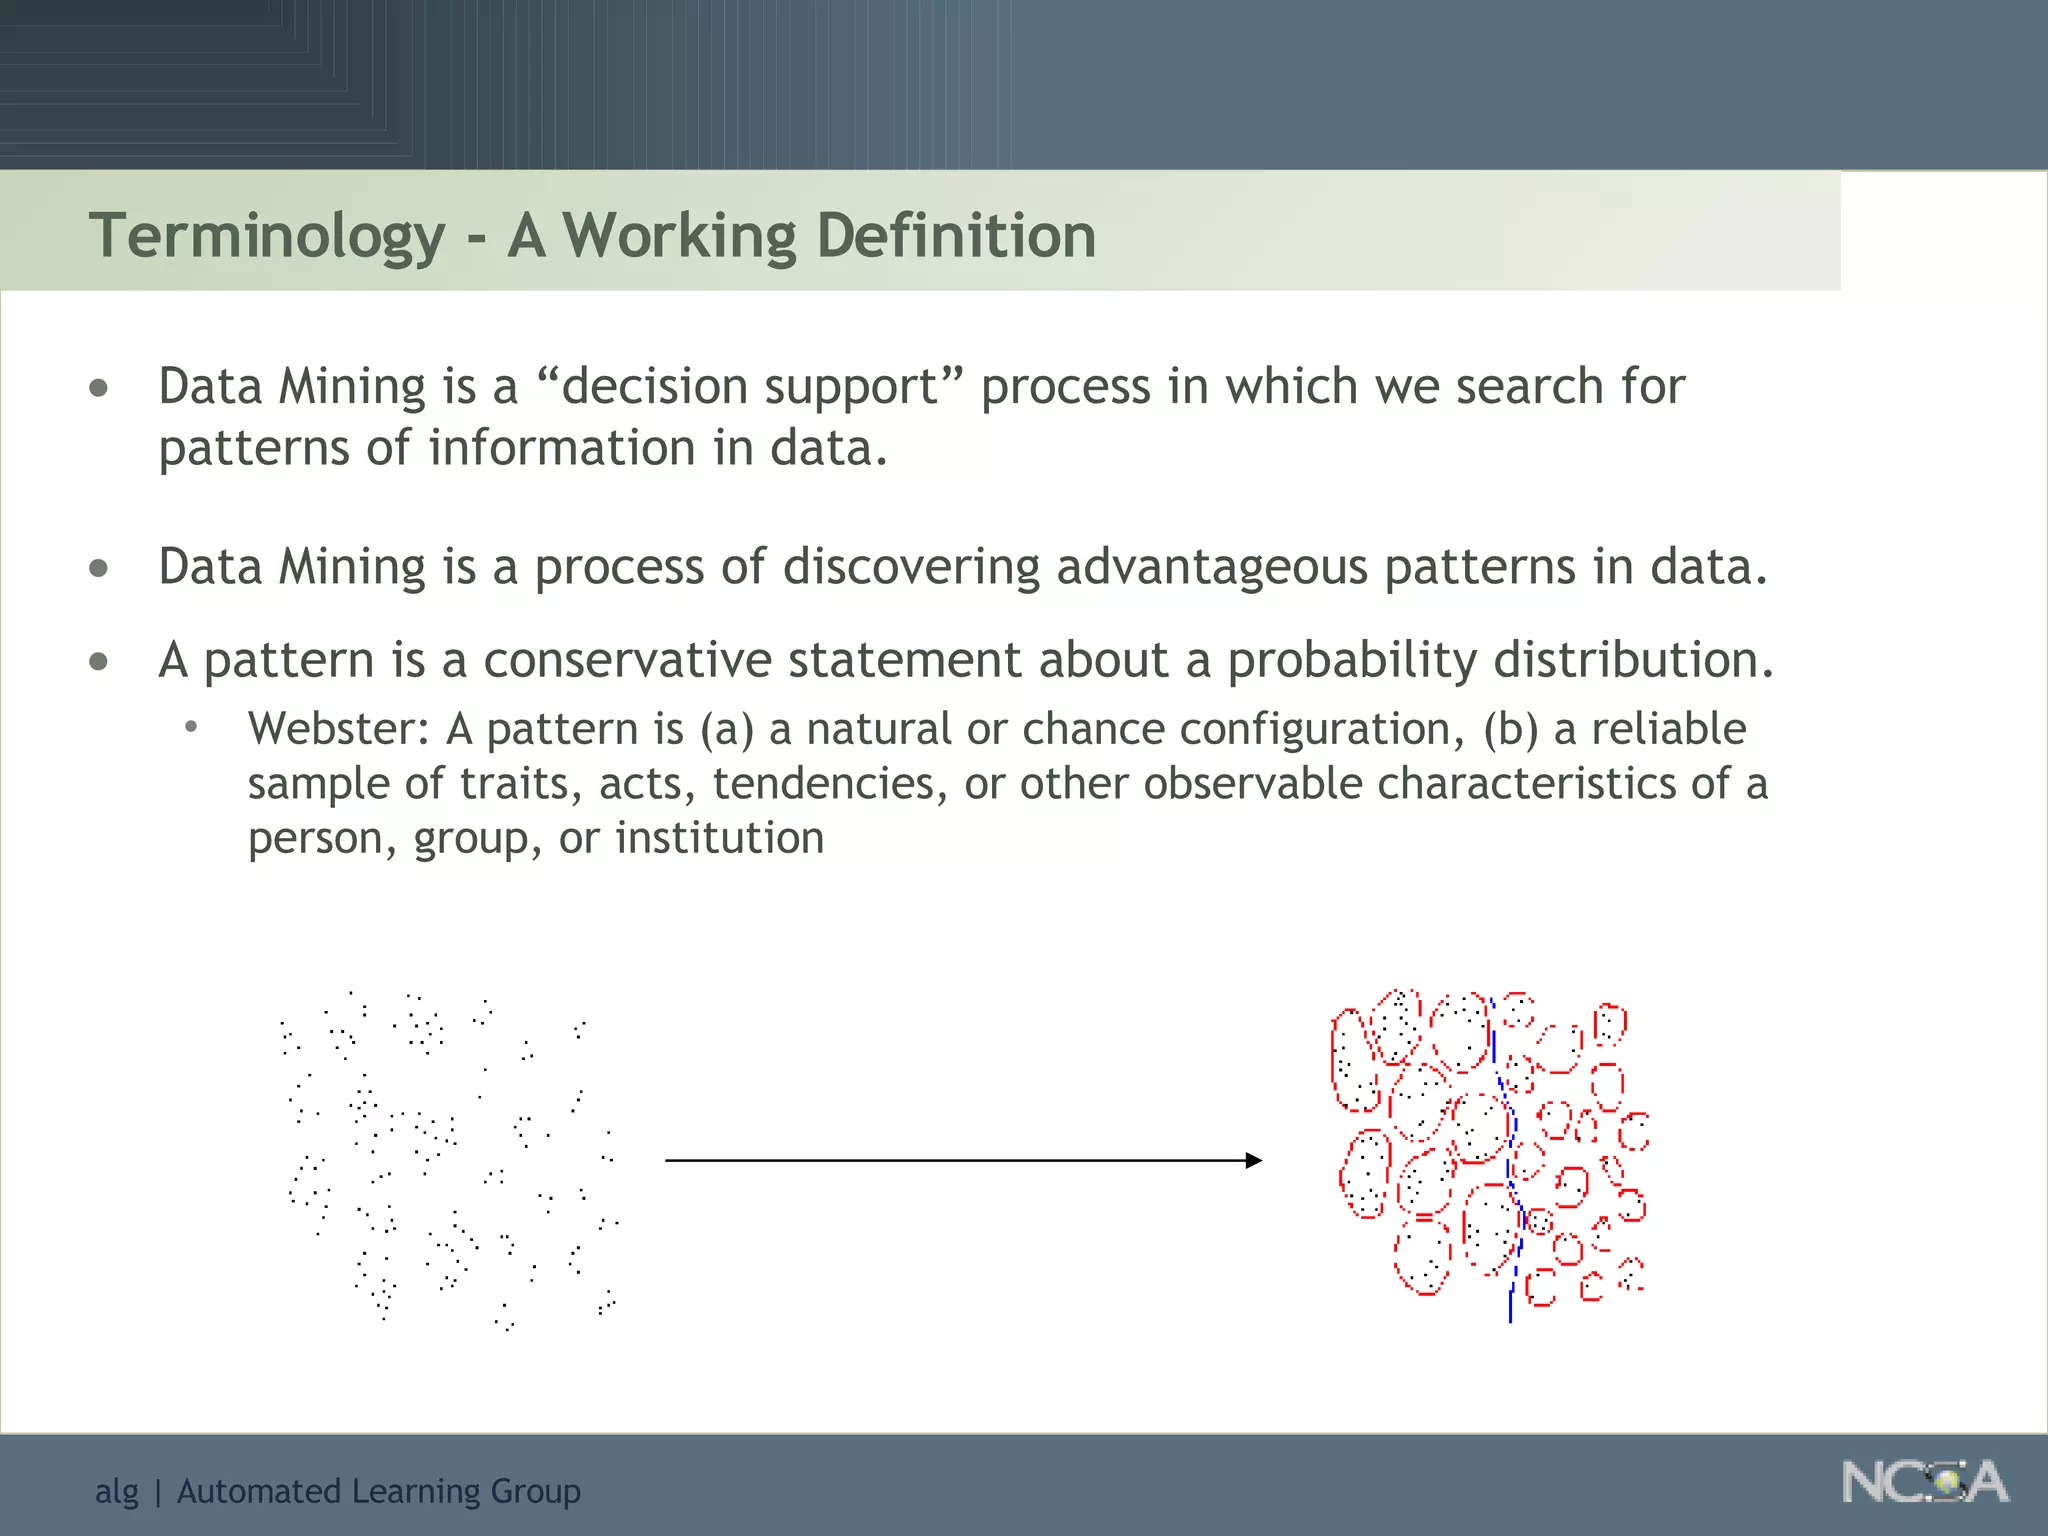
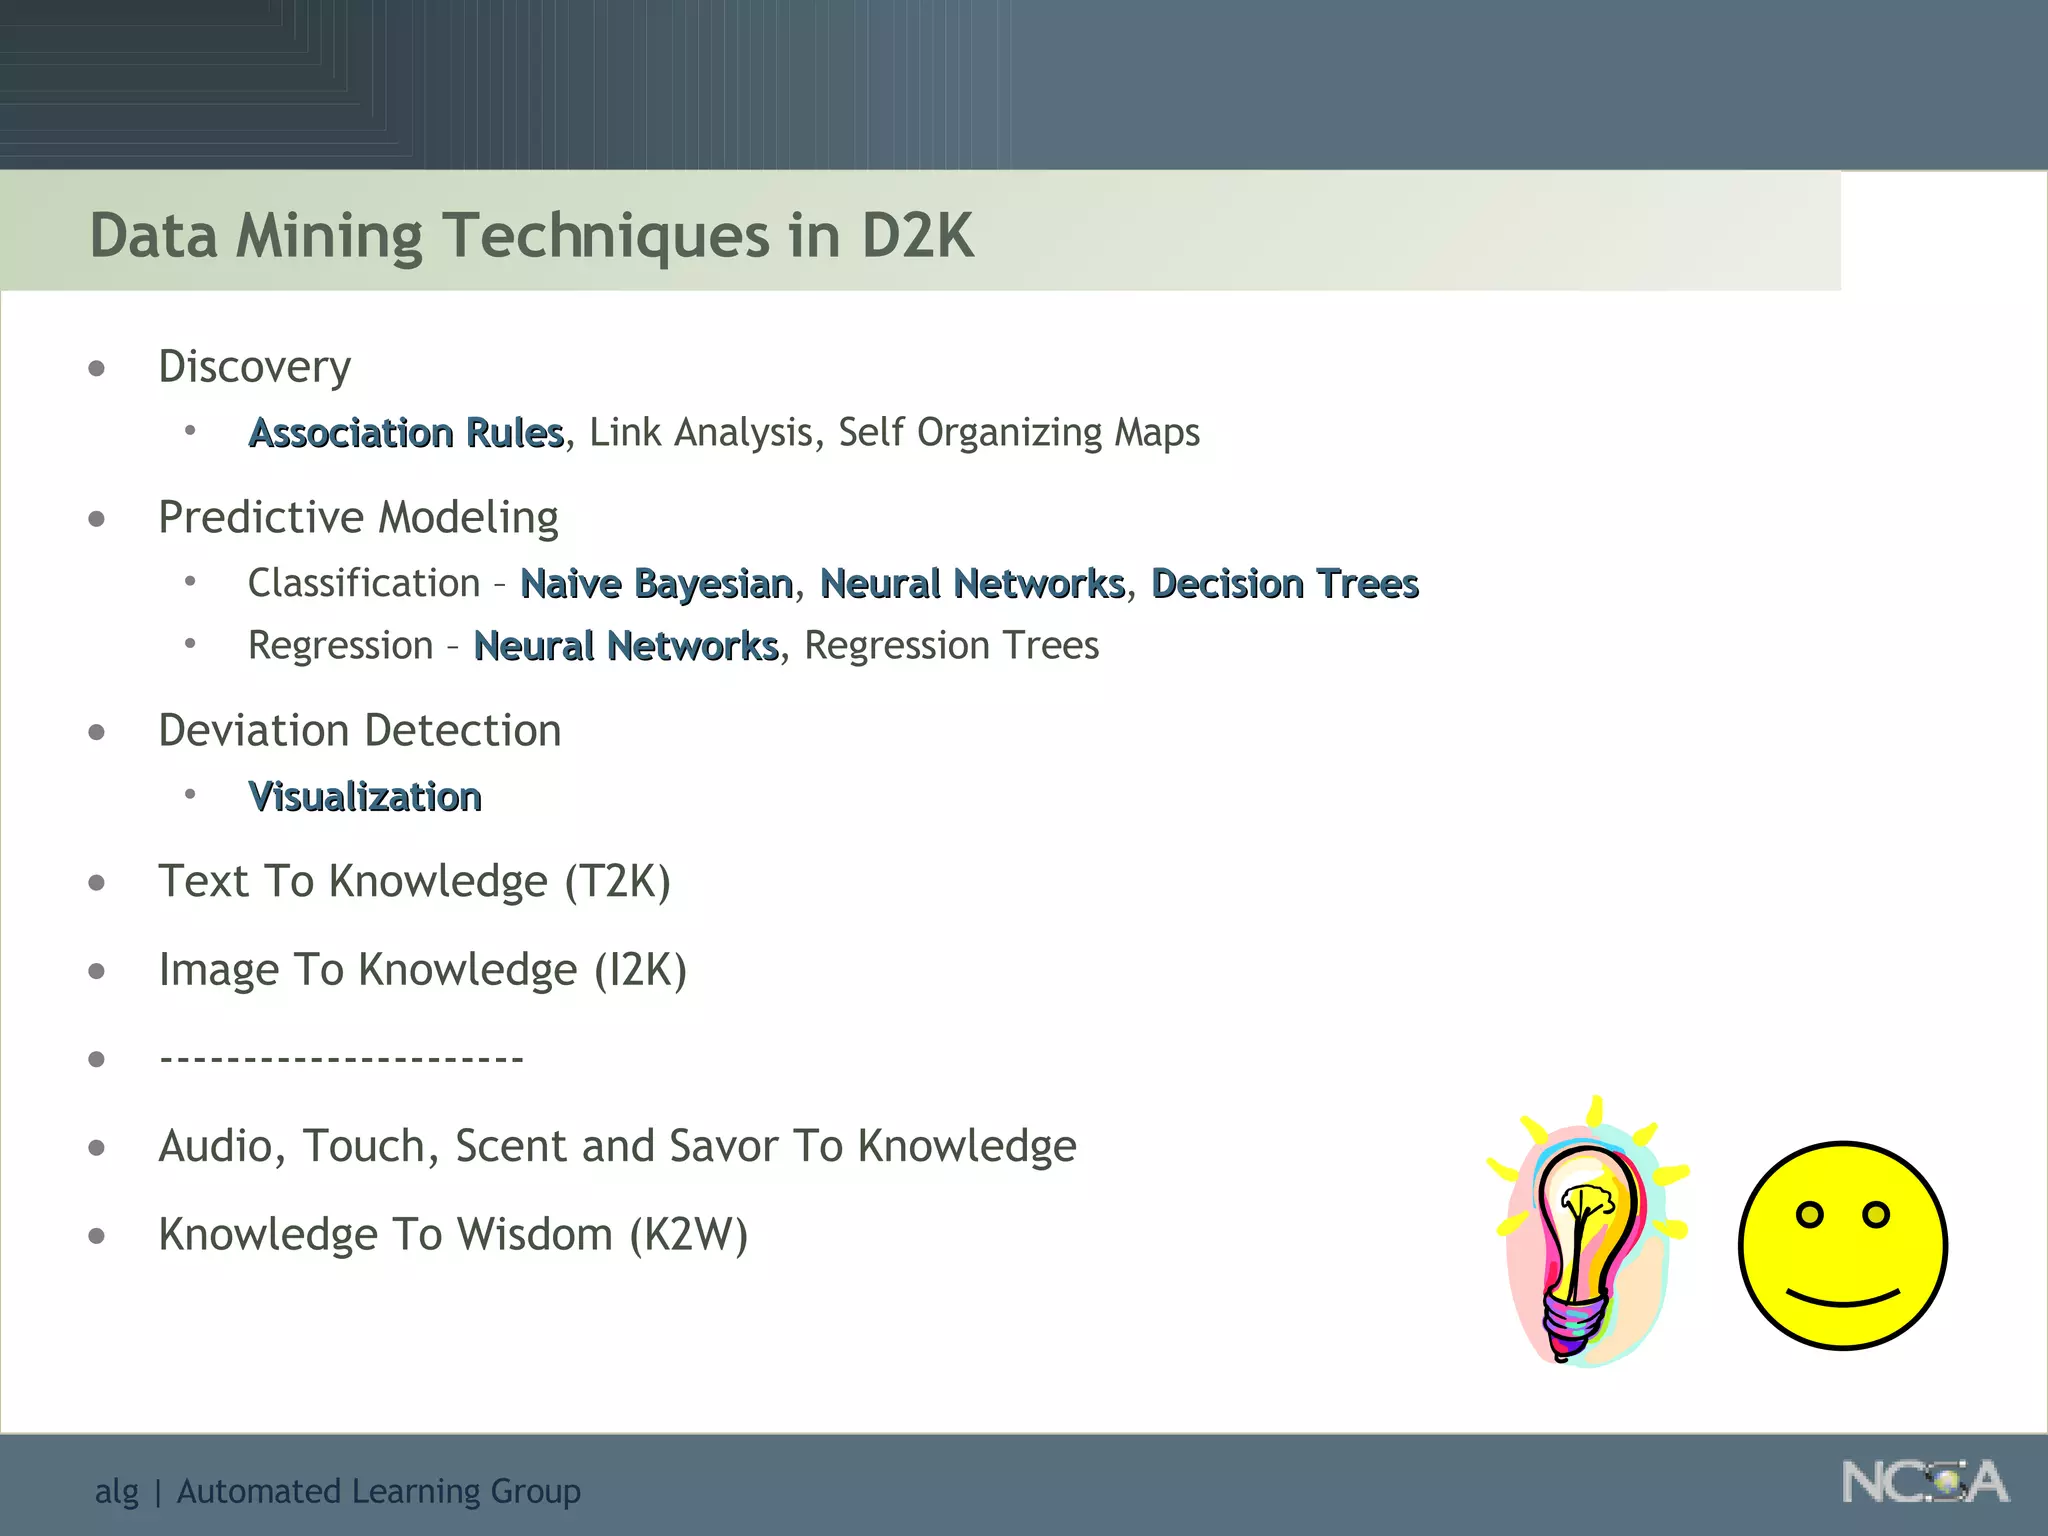
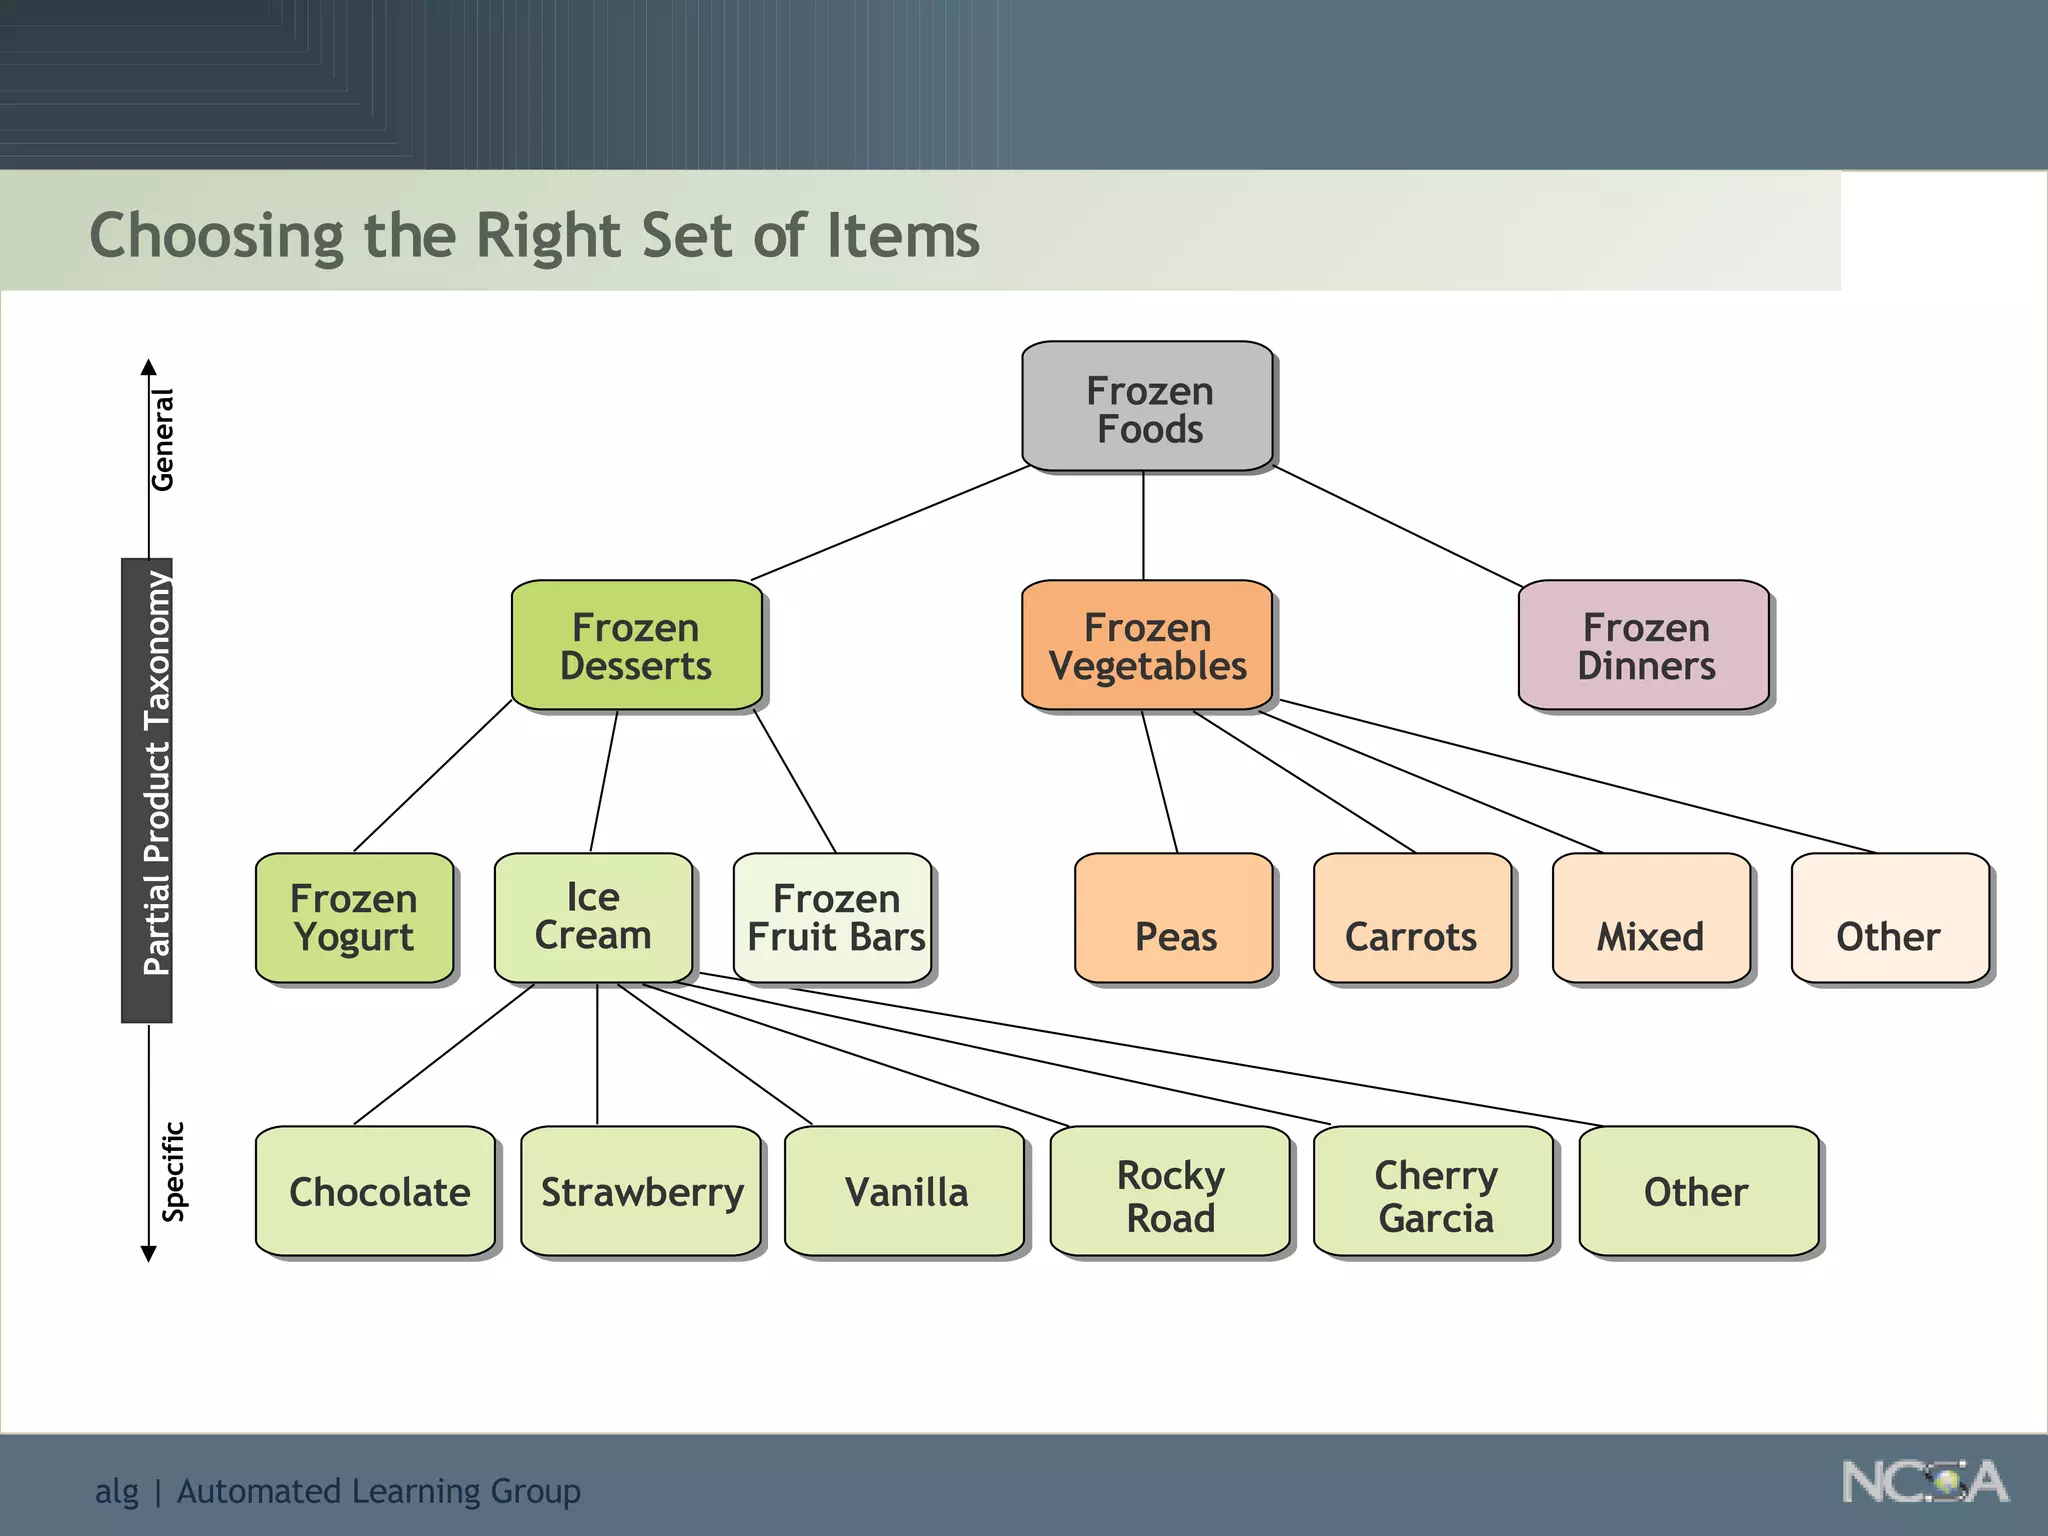
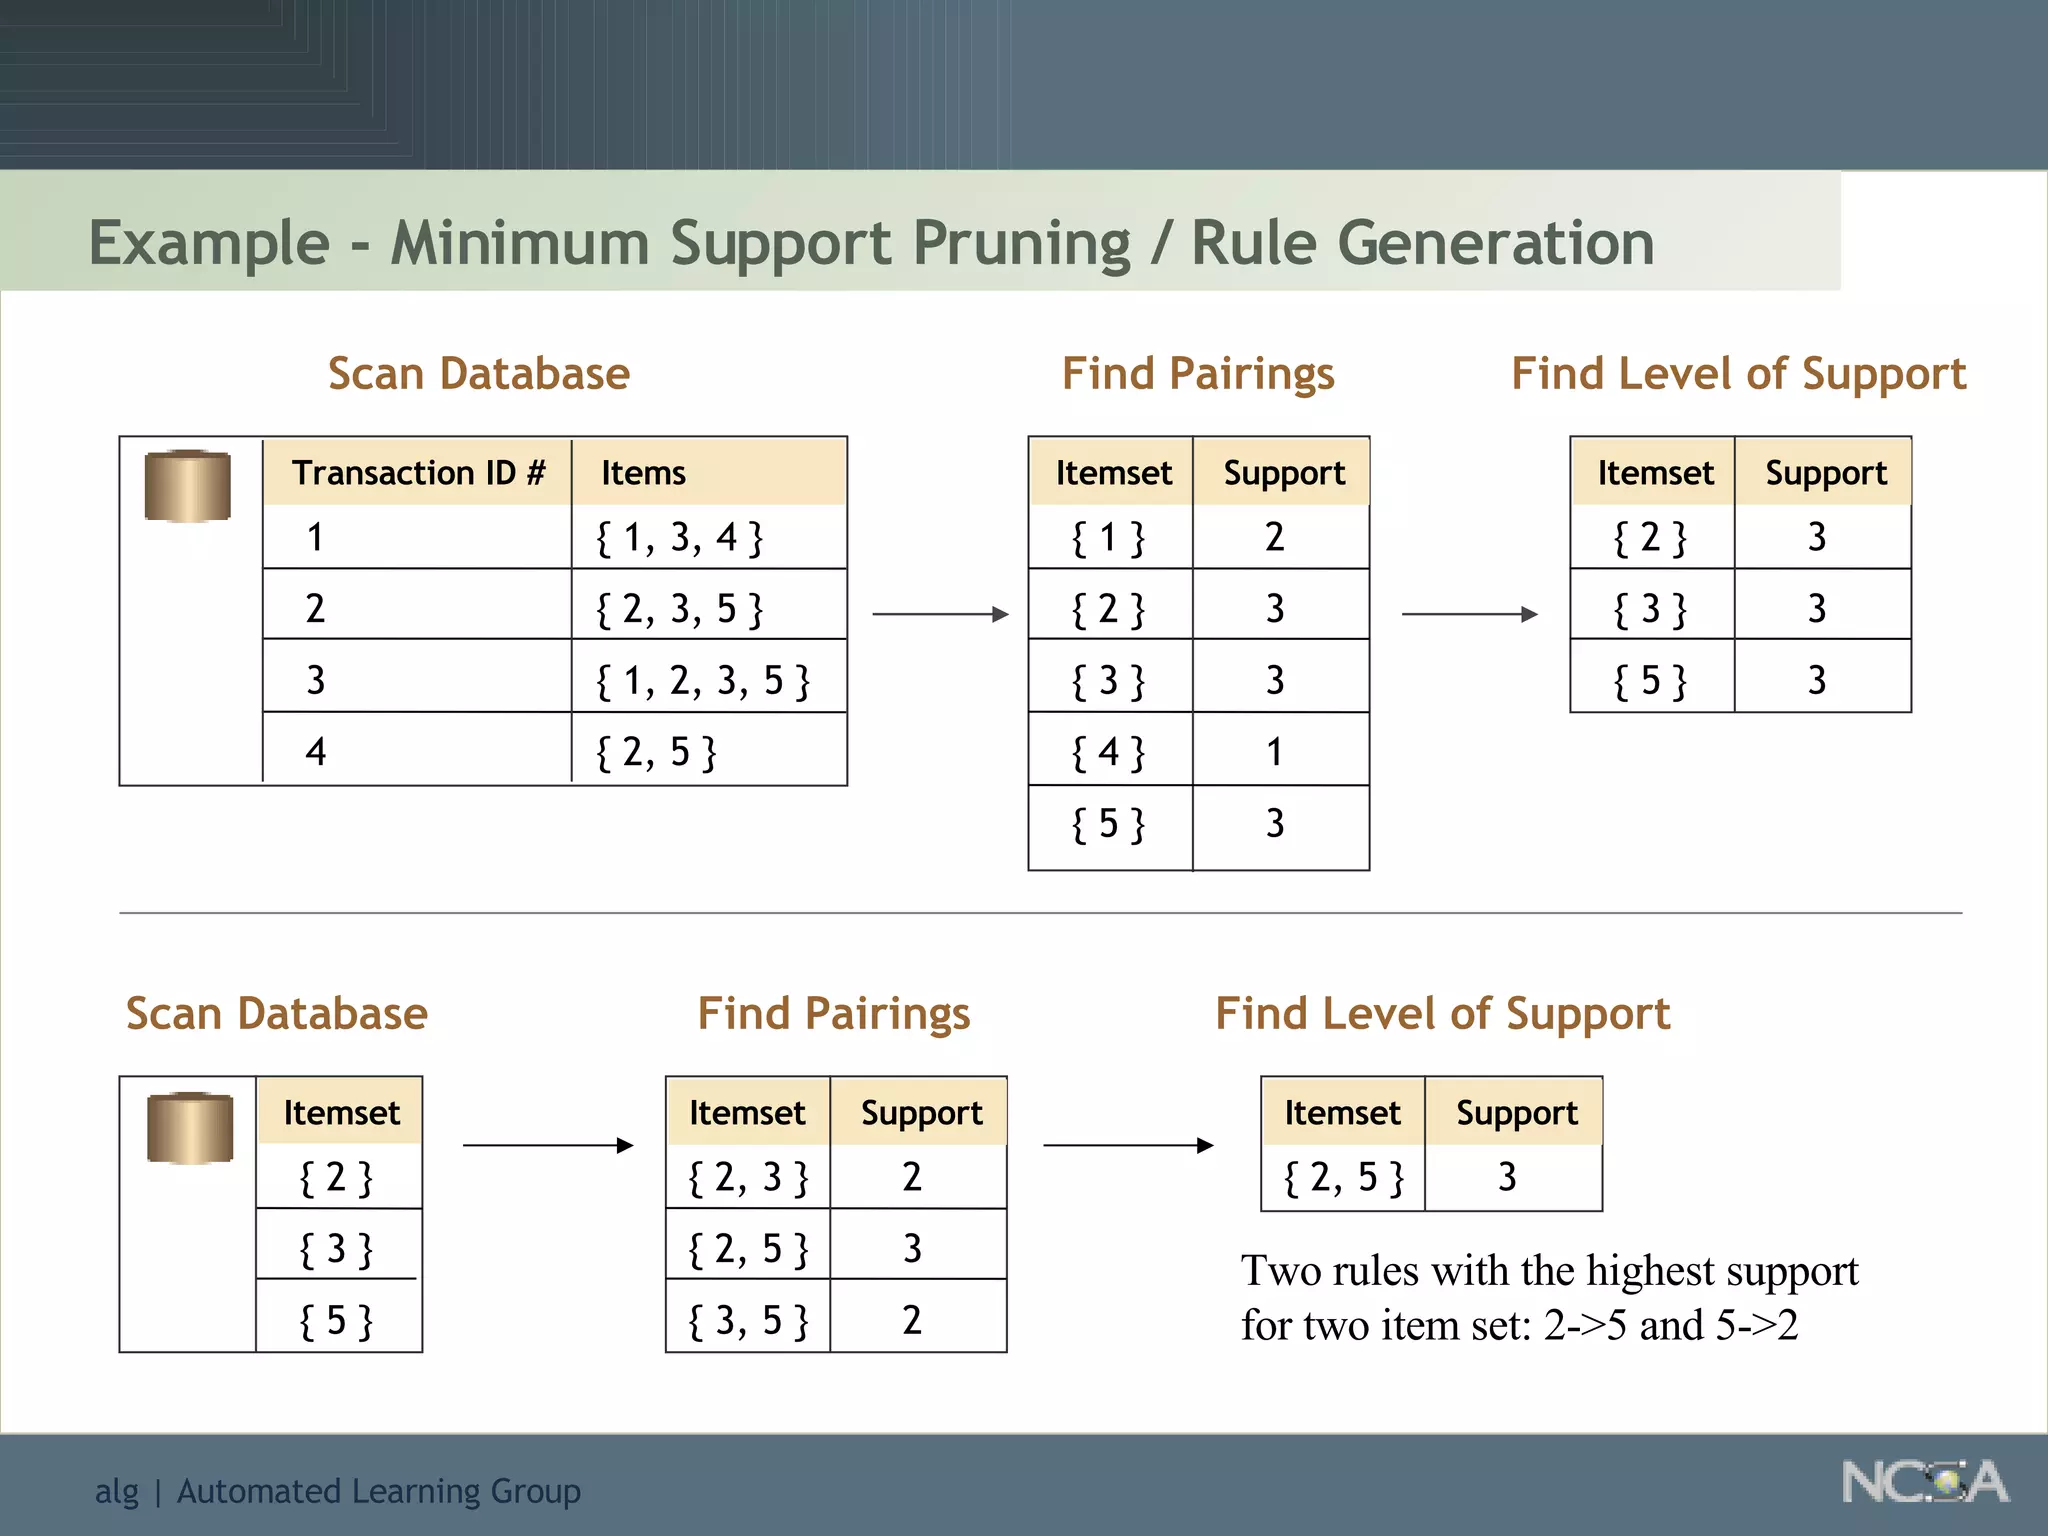
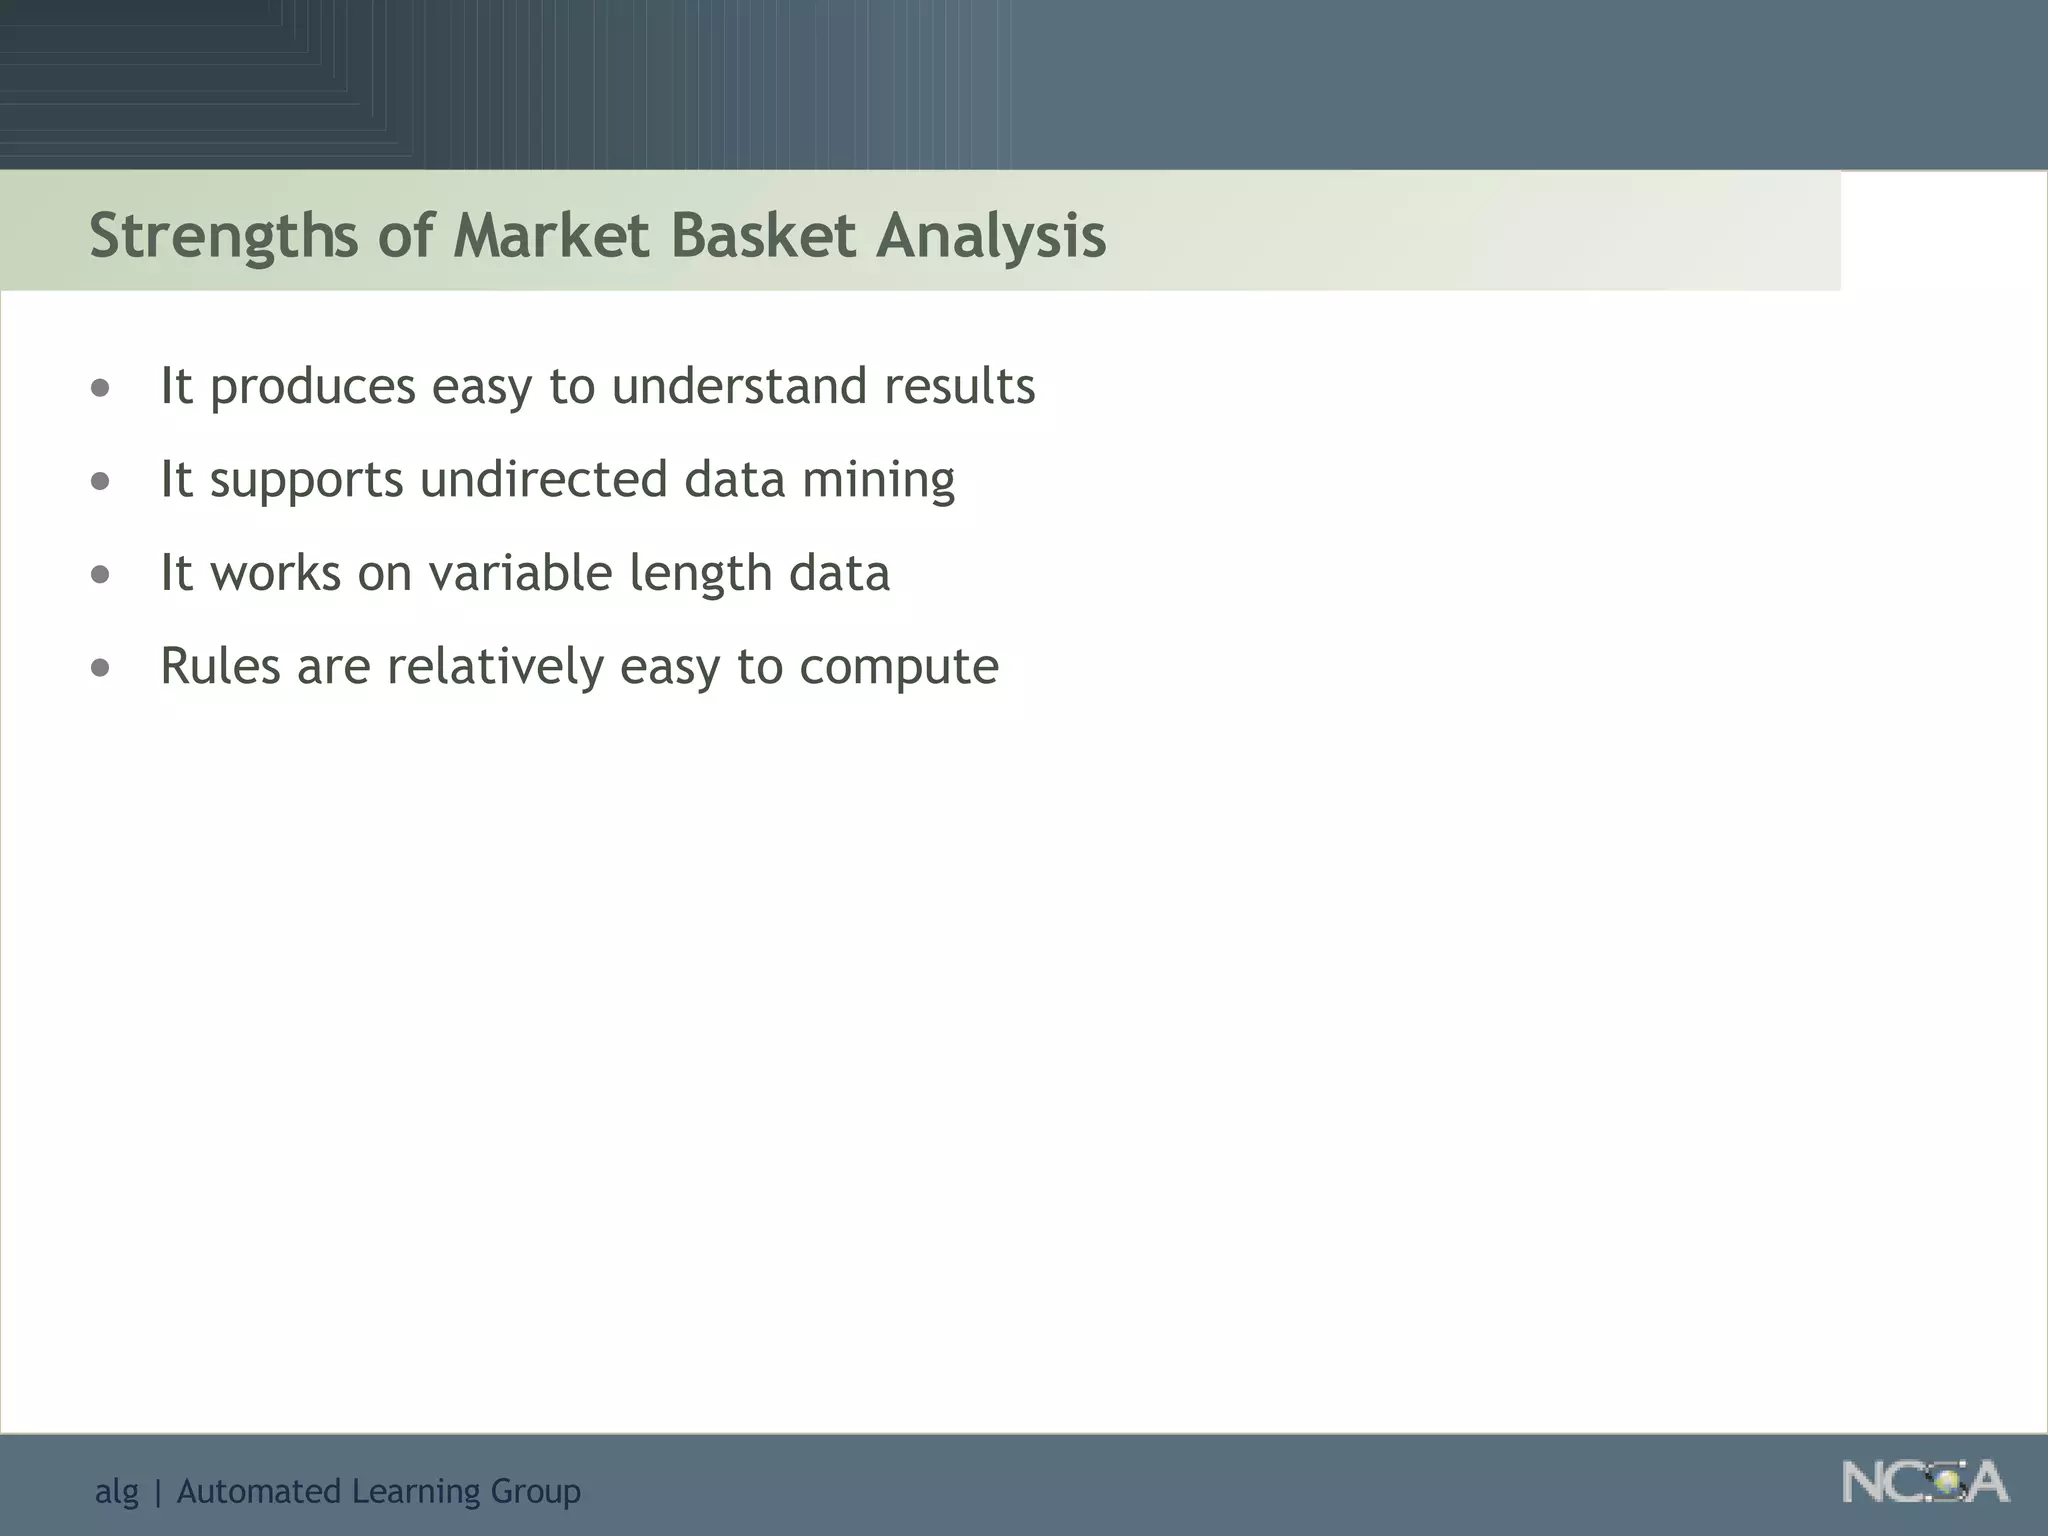
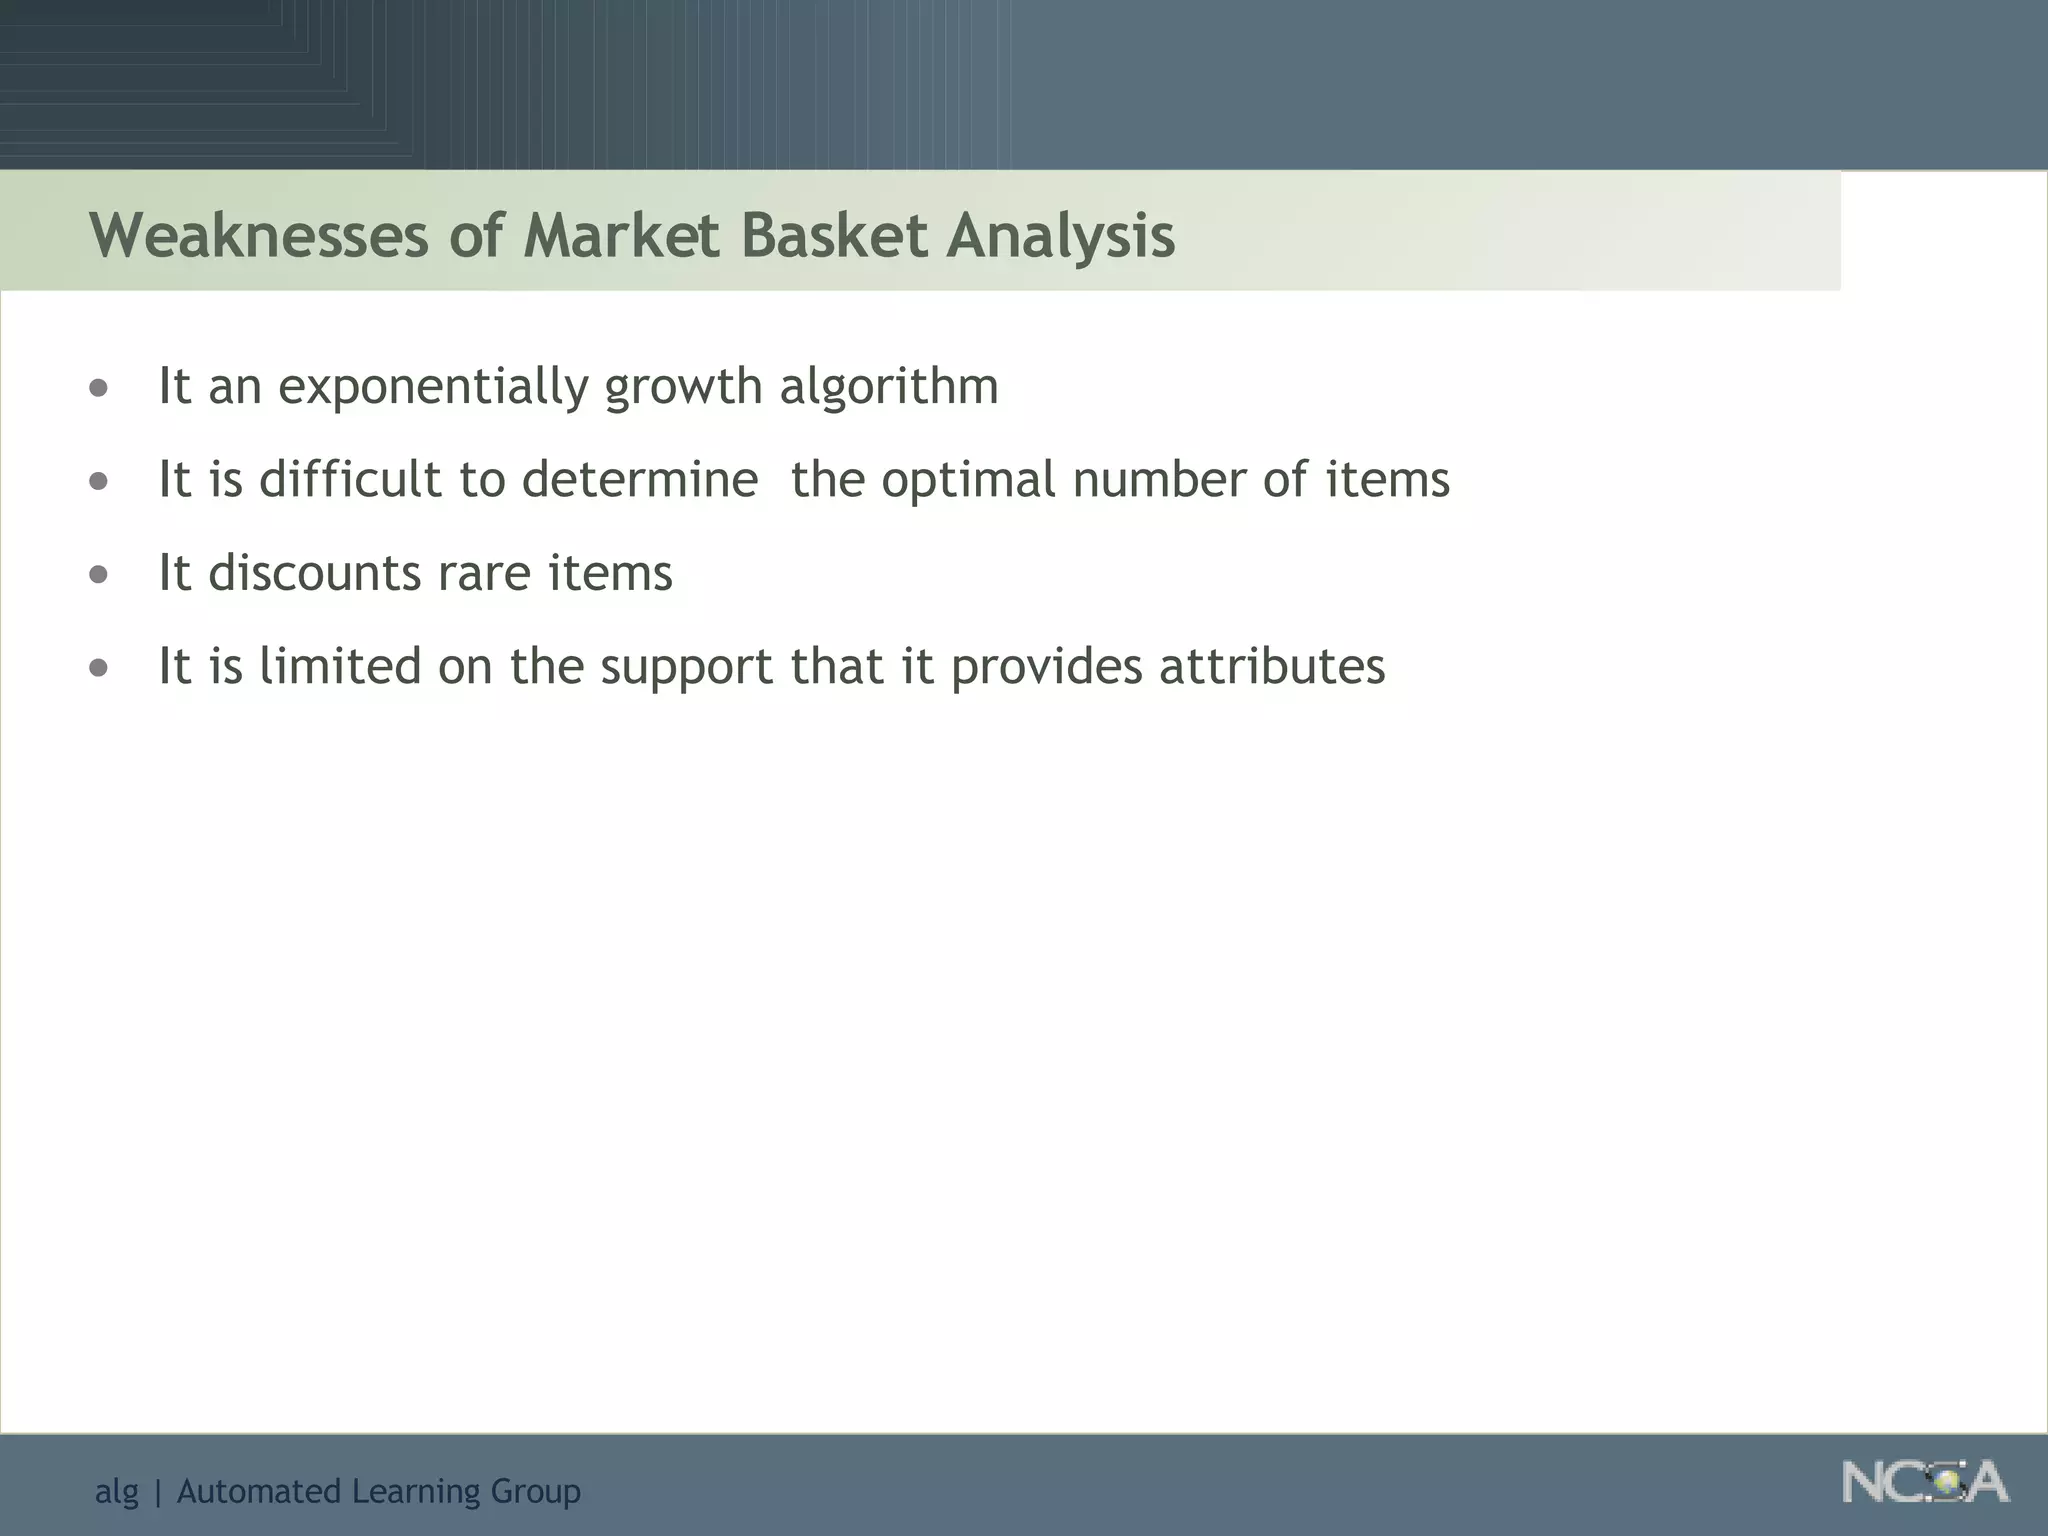
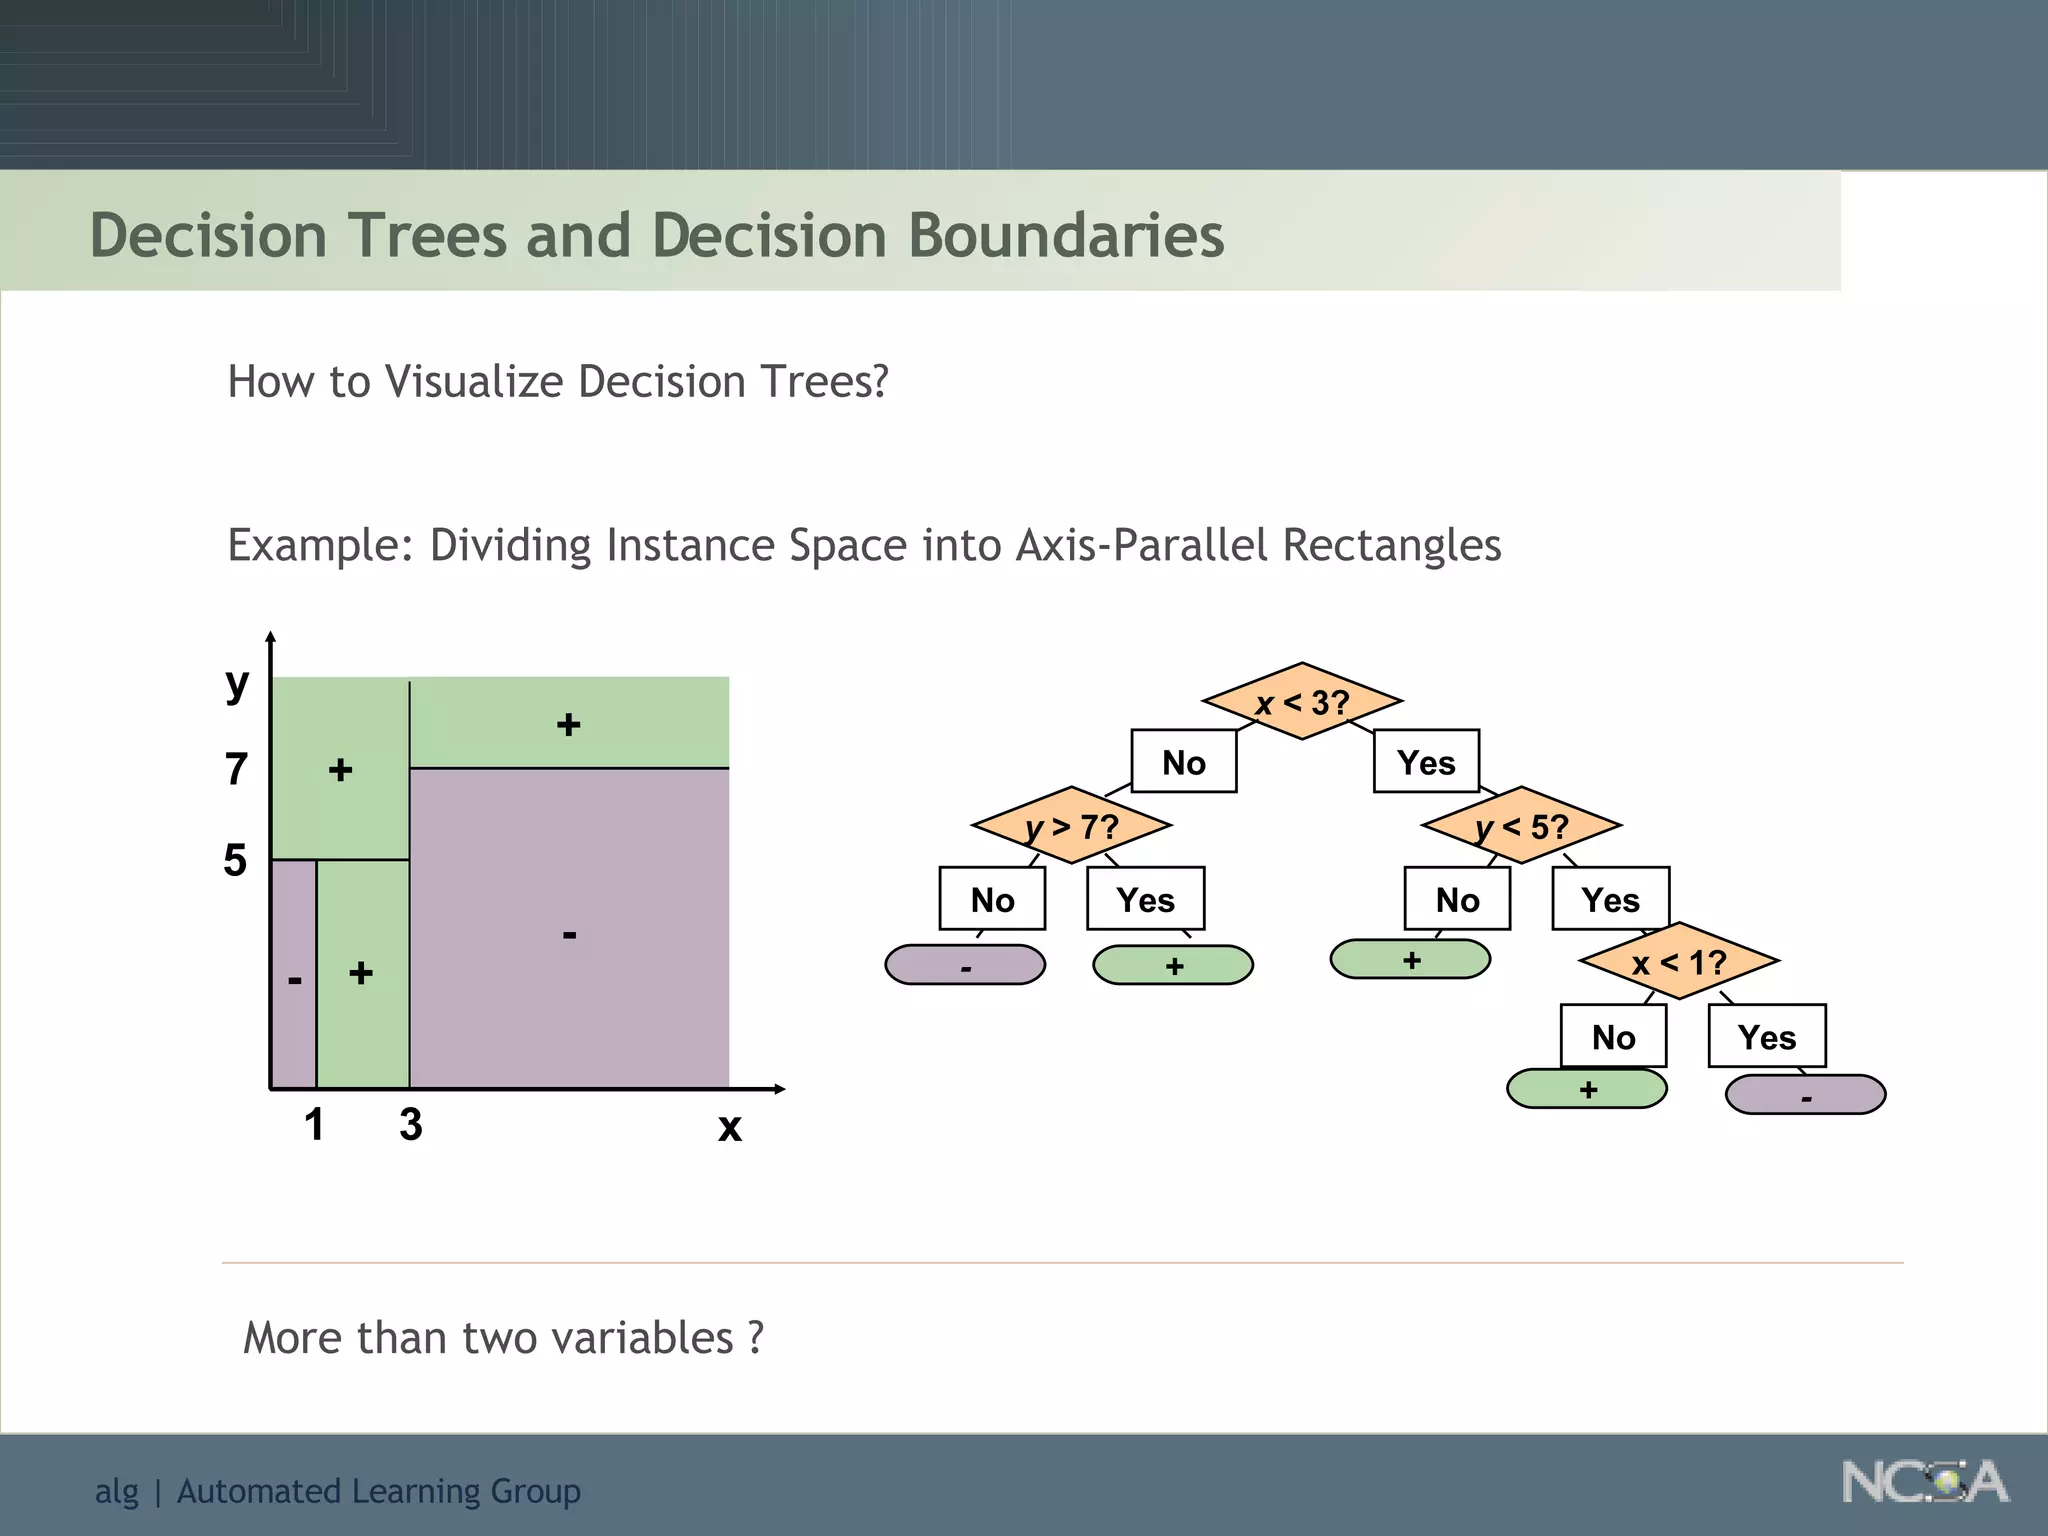
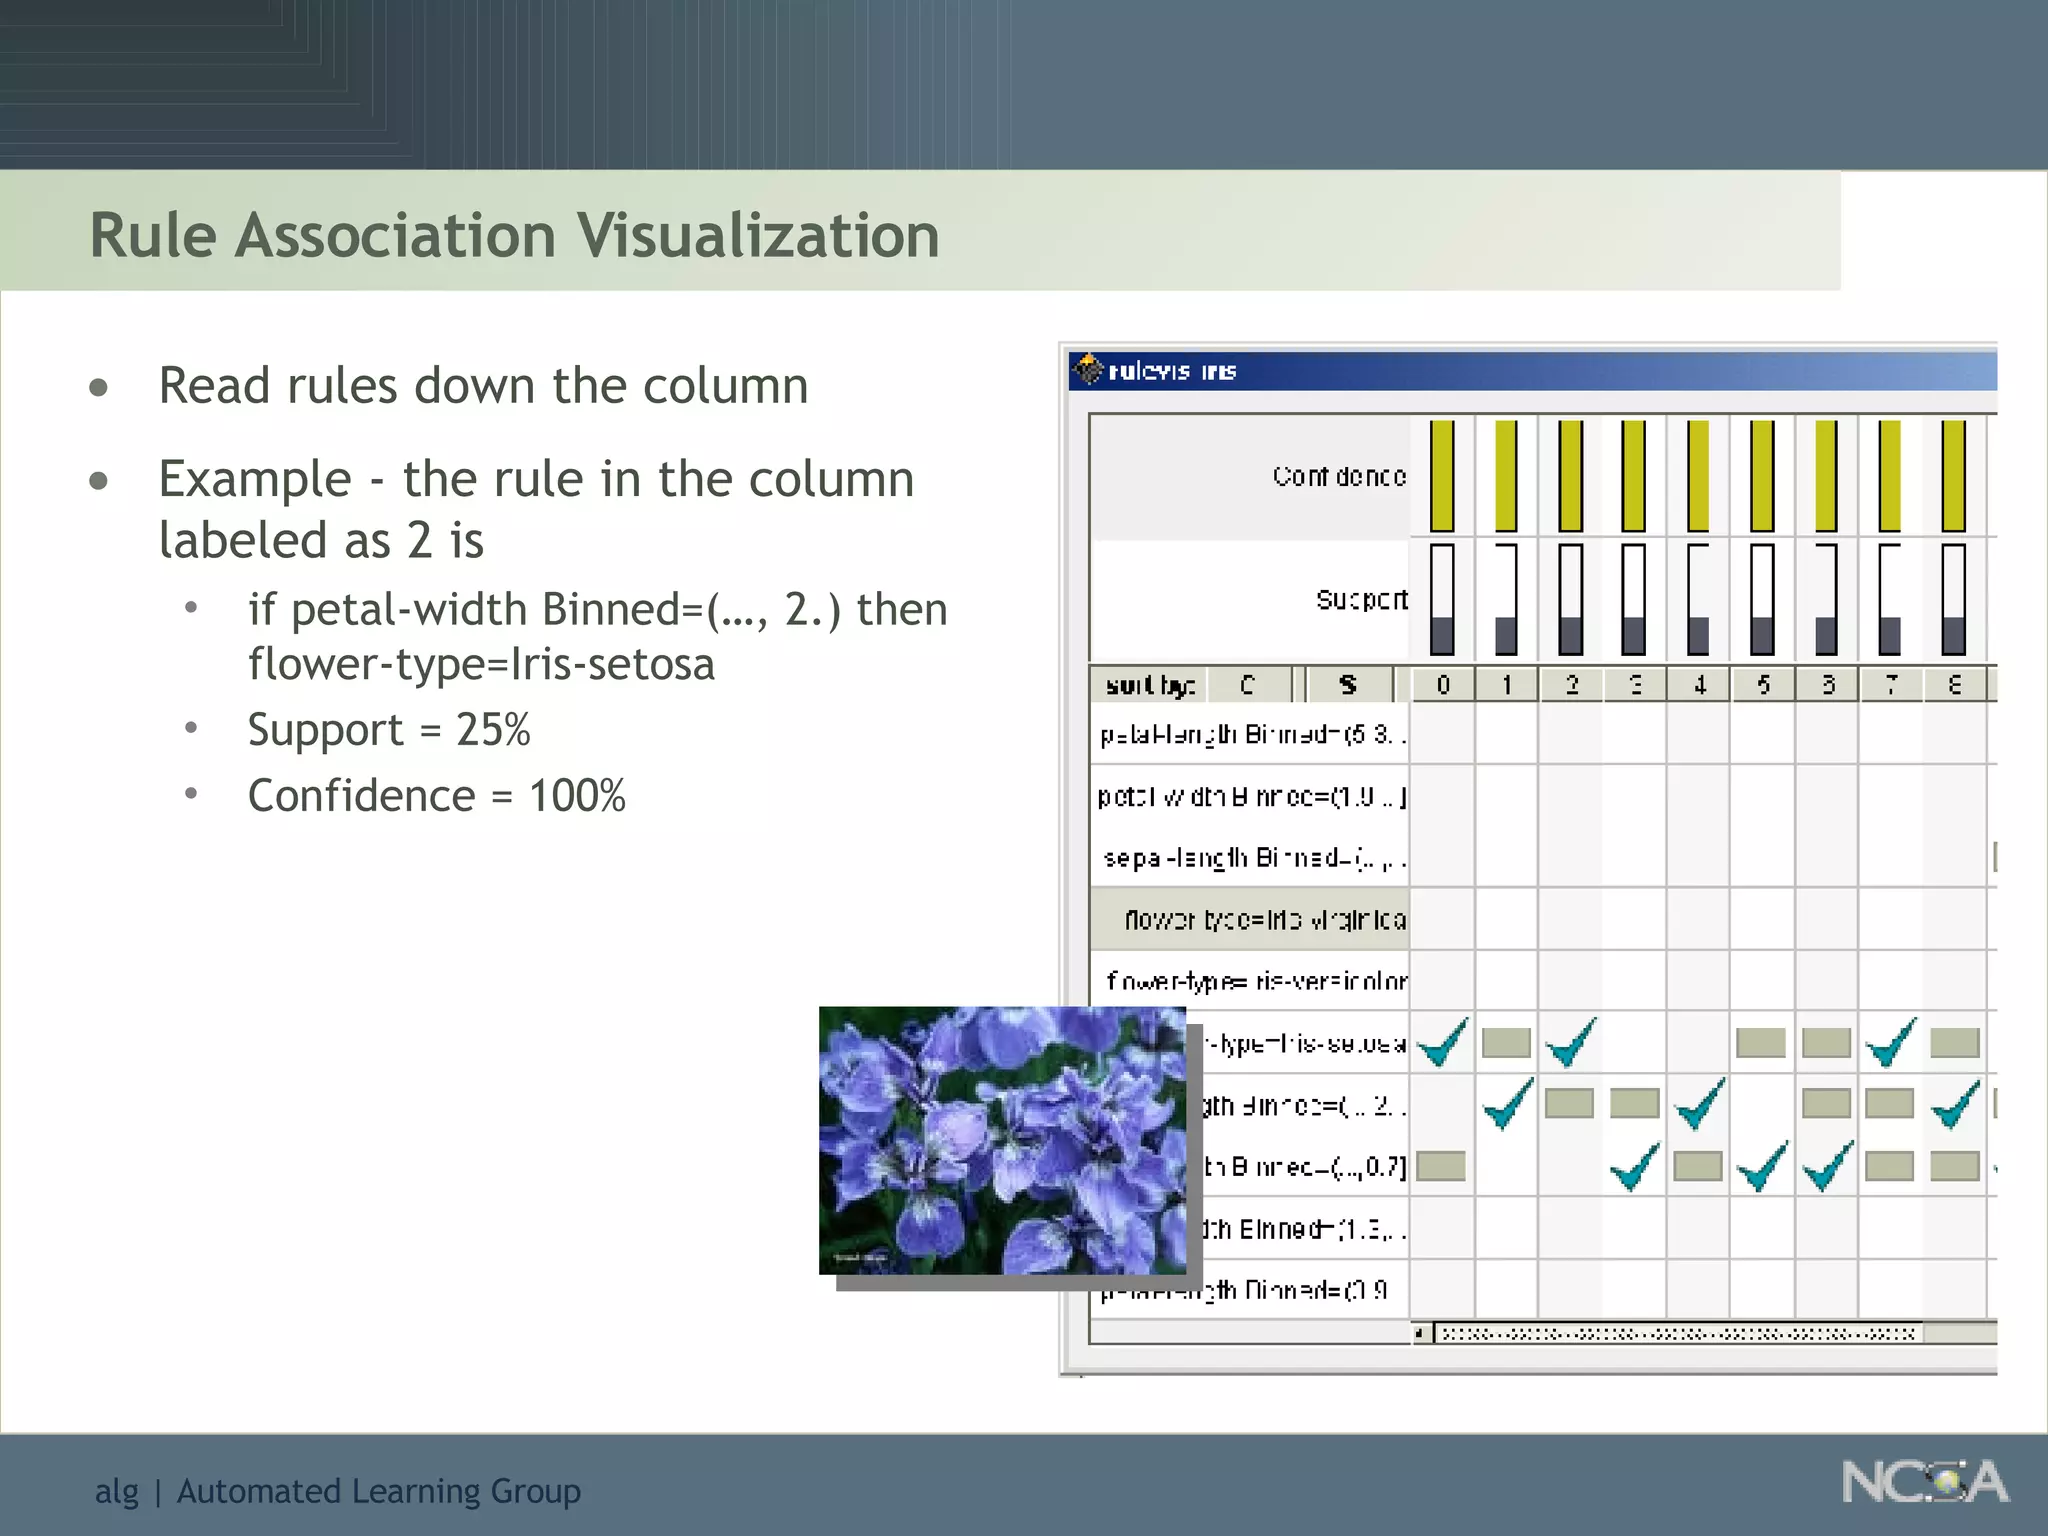
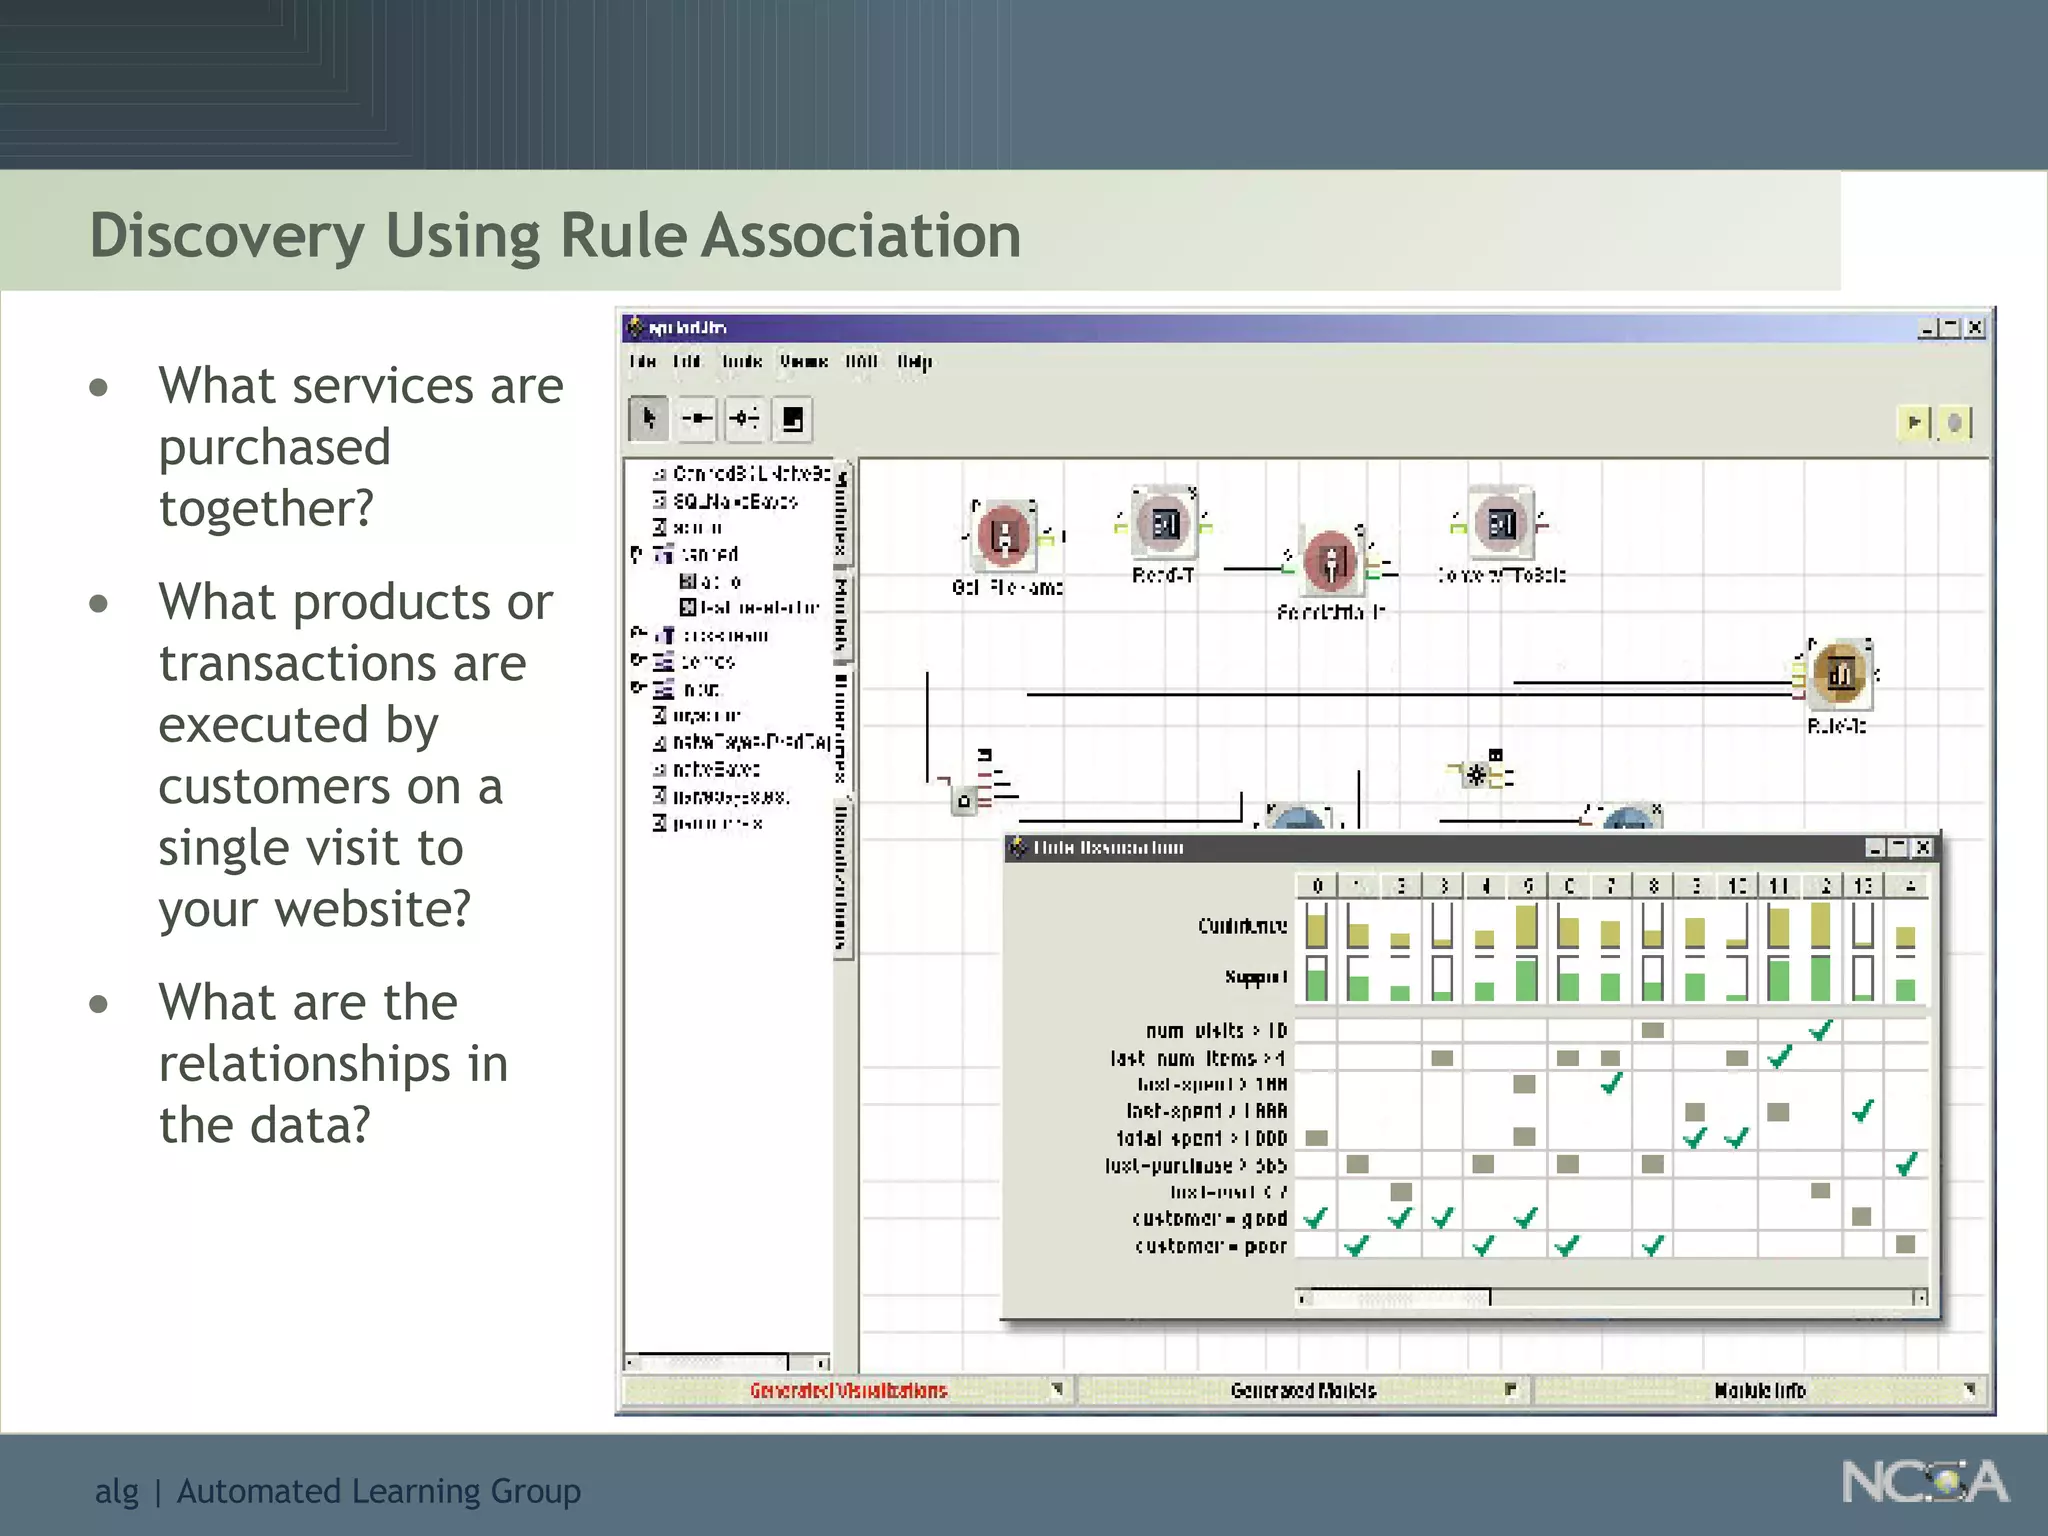
Describes different methodologies in data mining including association rules, predictive modeling, and decision trees. Describes decision tree learning, its construction, strengths, weaknesses, and applications.
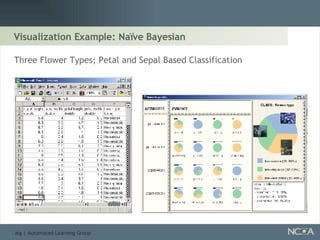
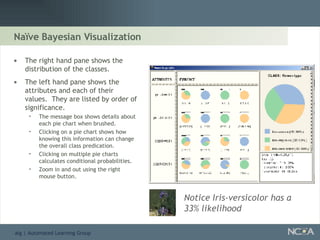
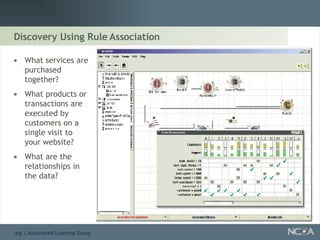
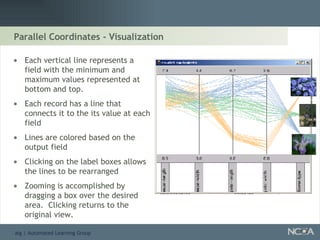
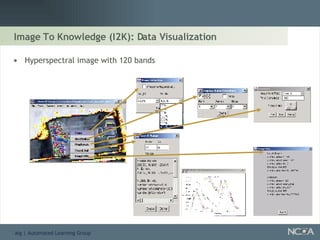
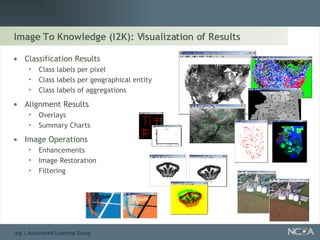
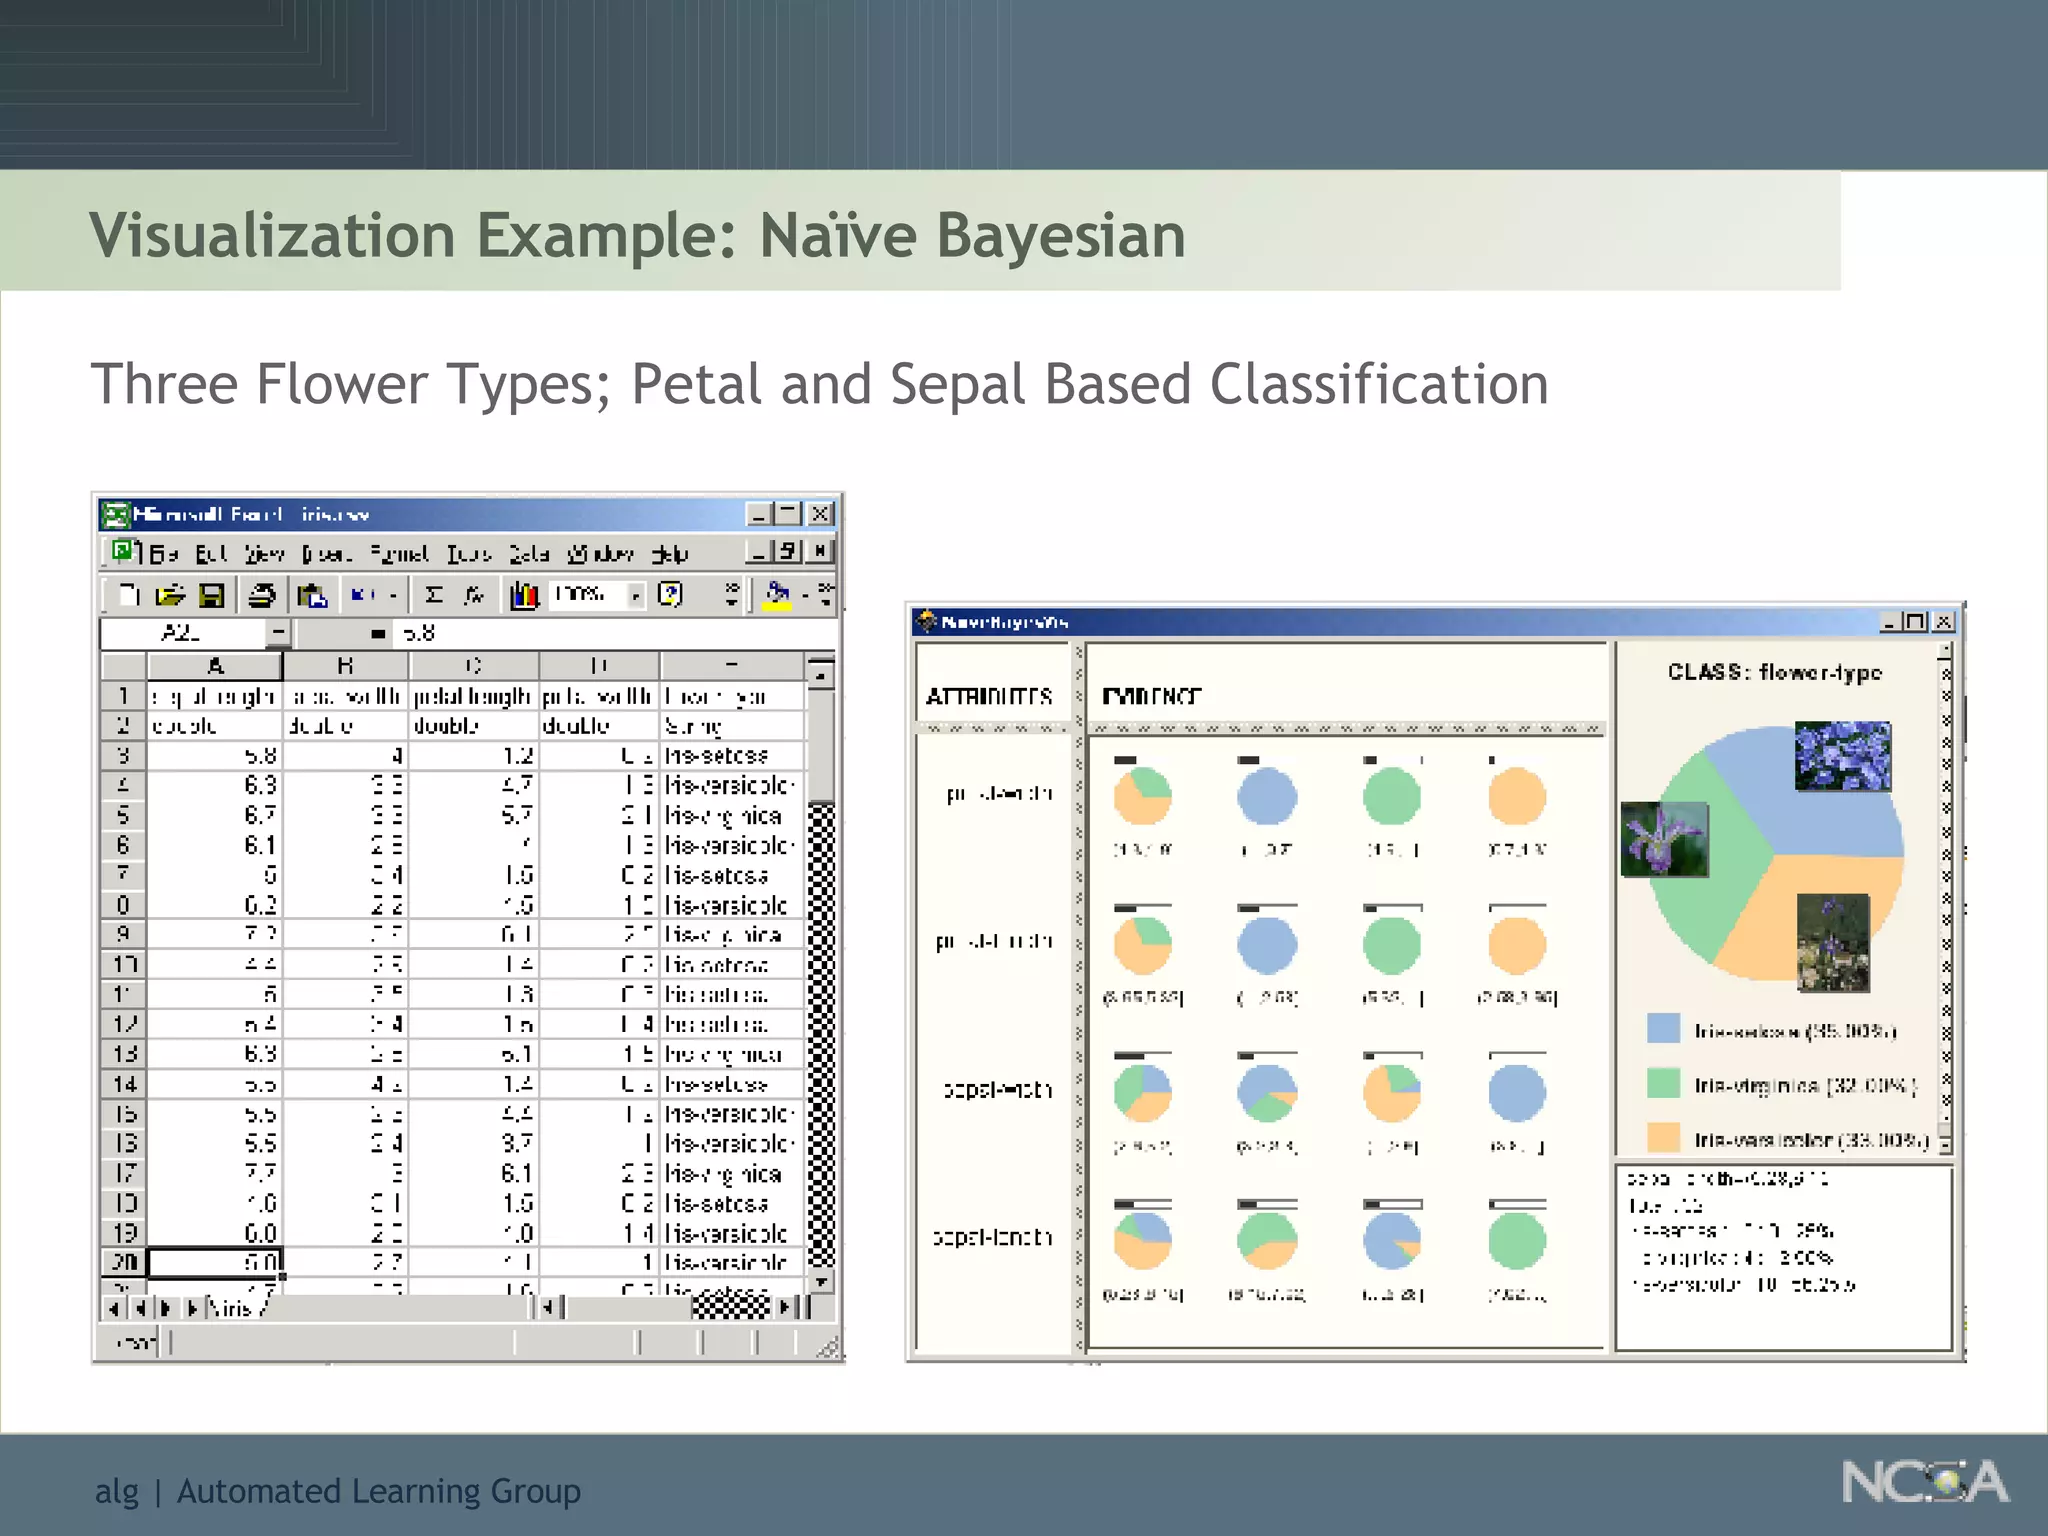
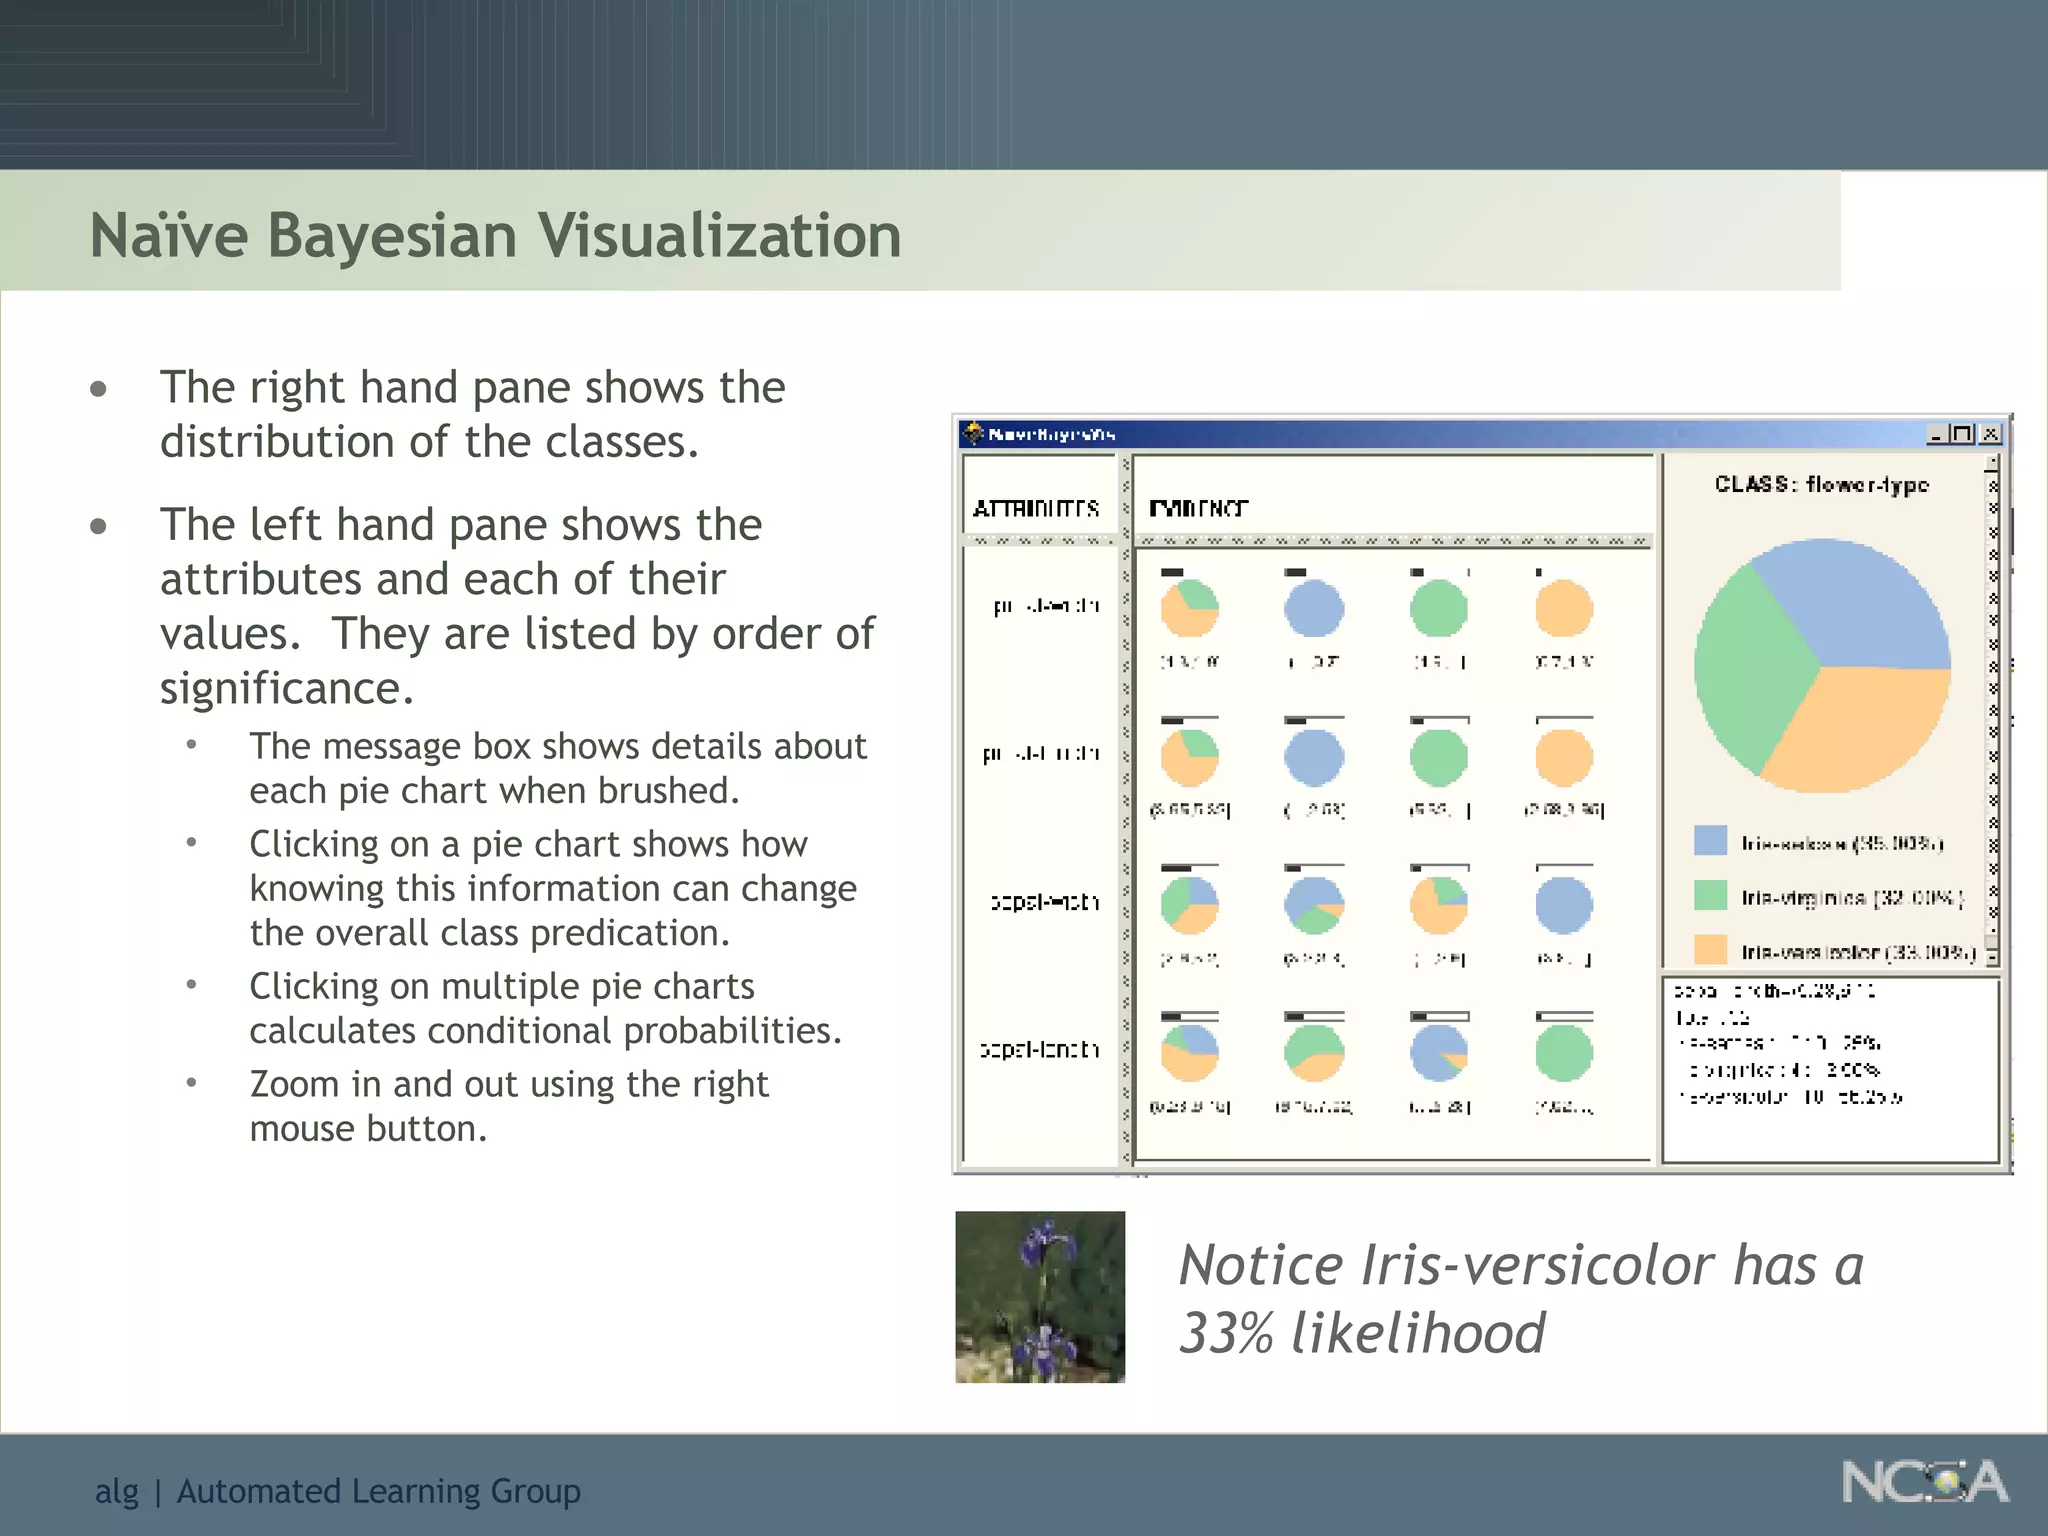
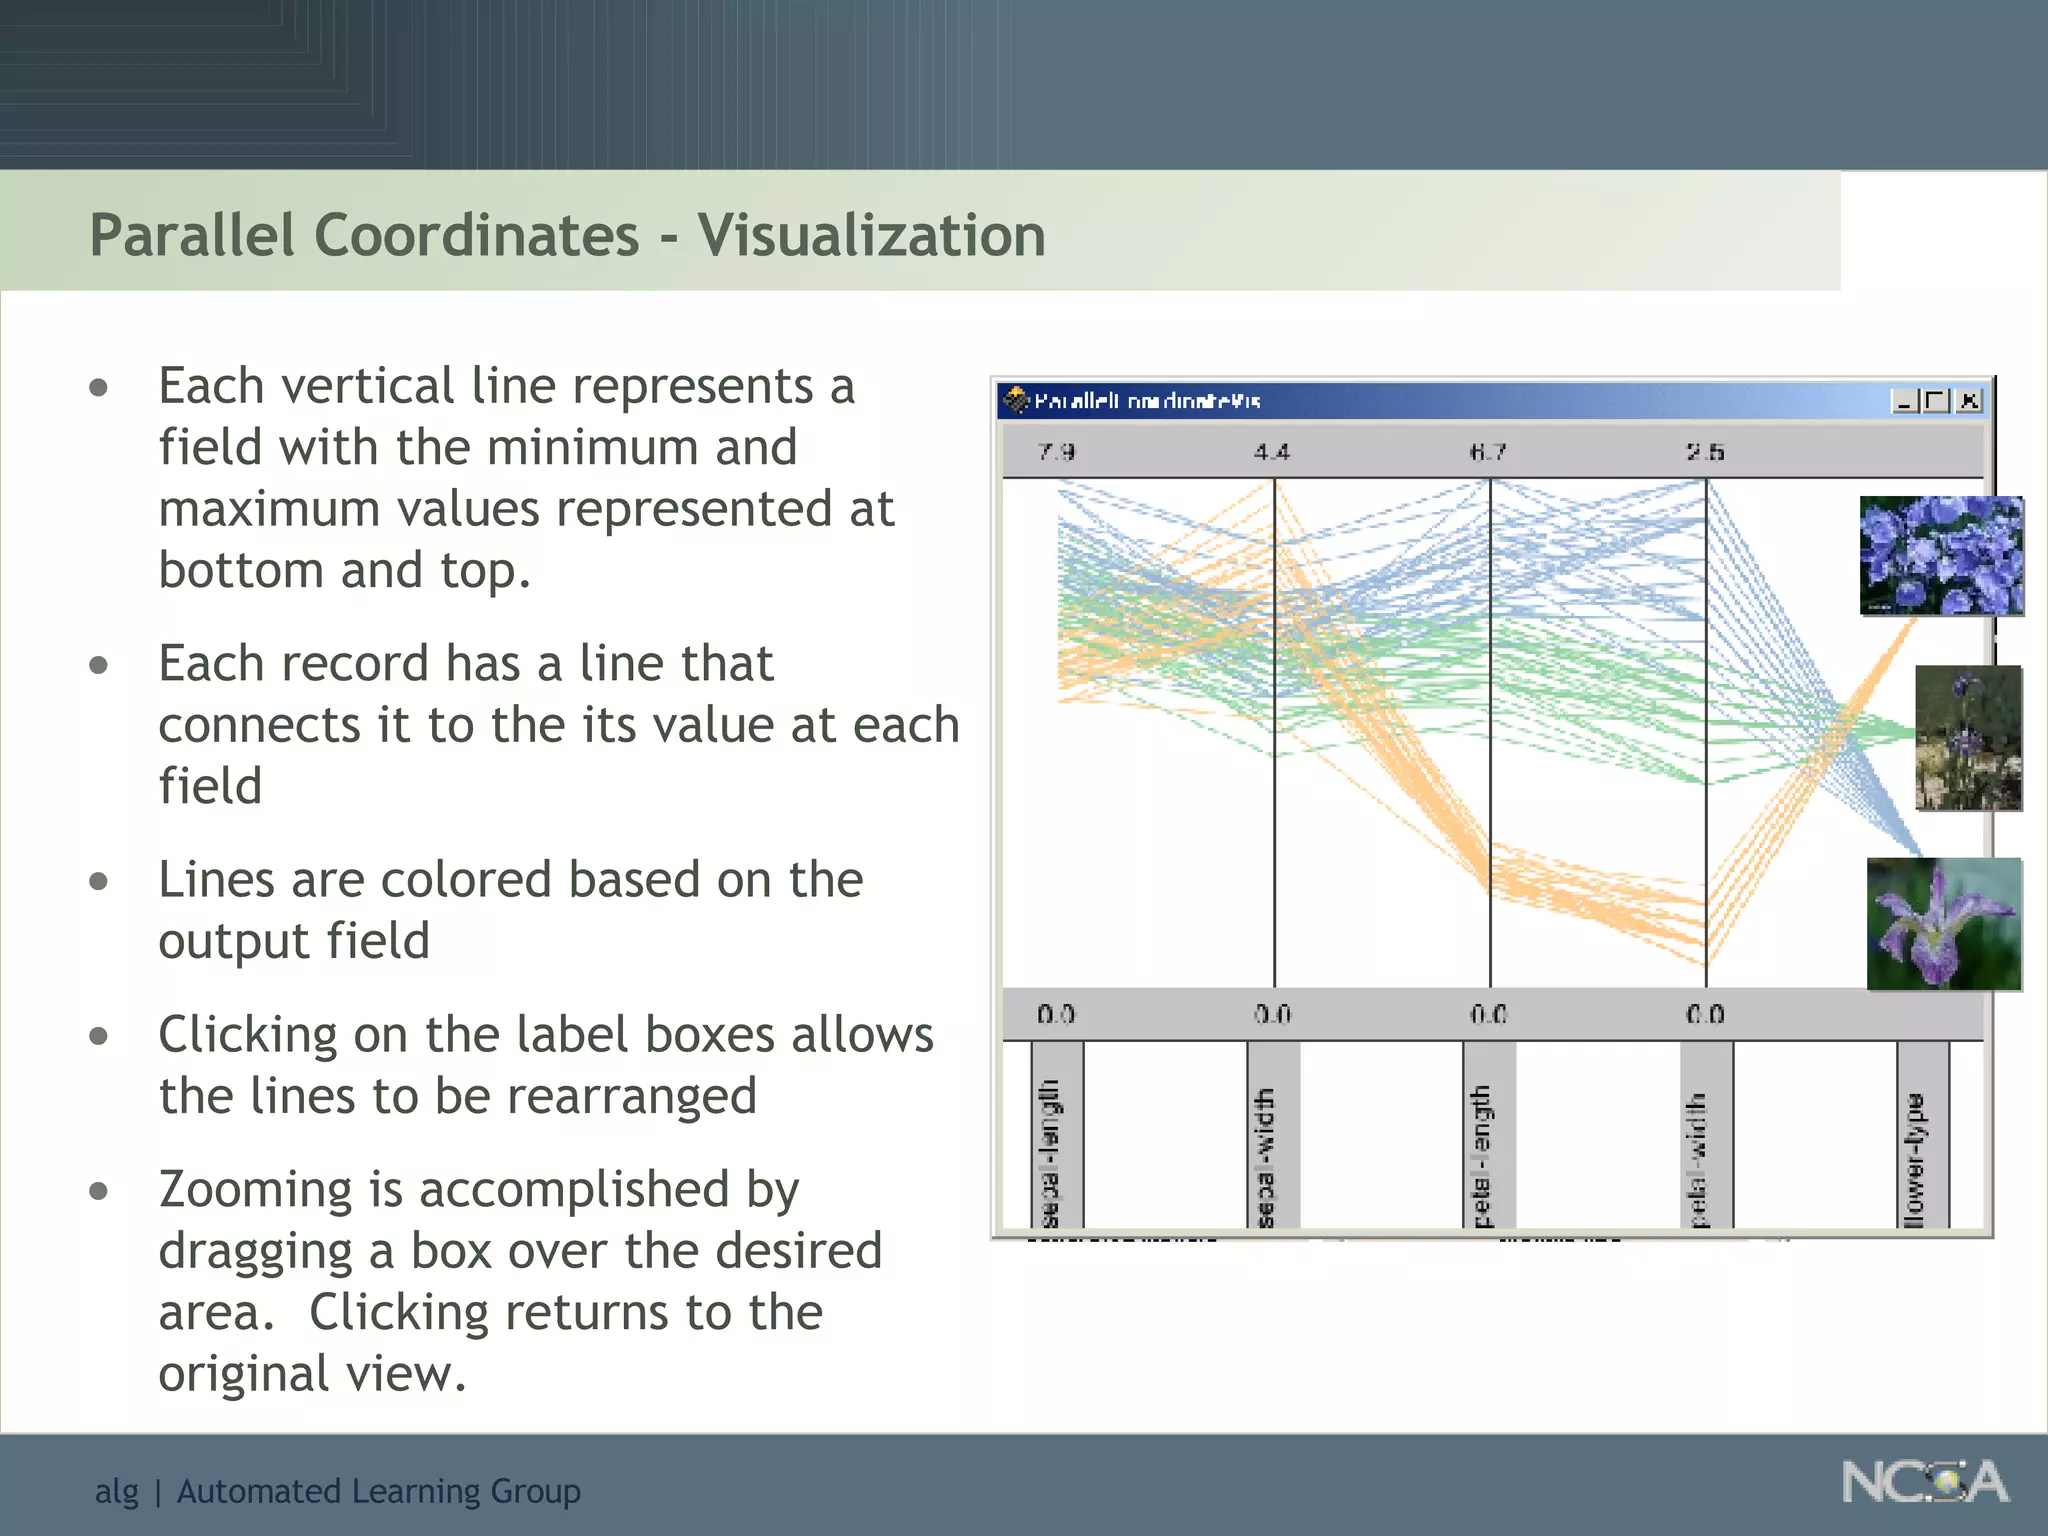
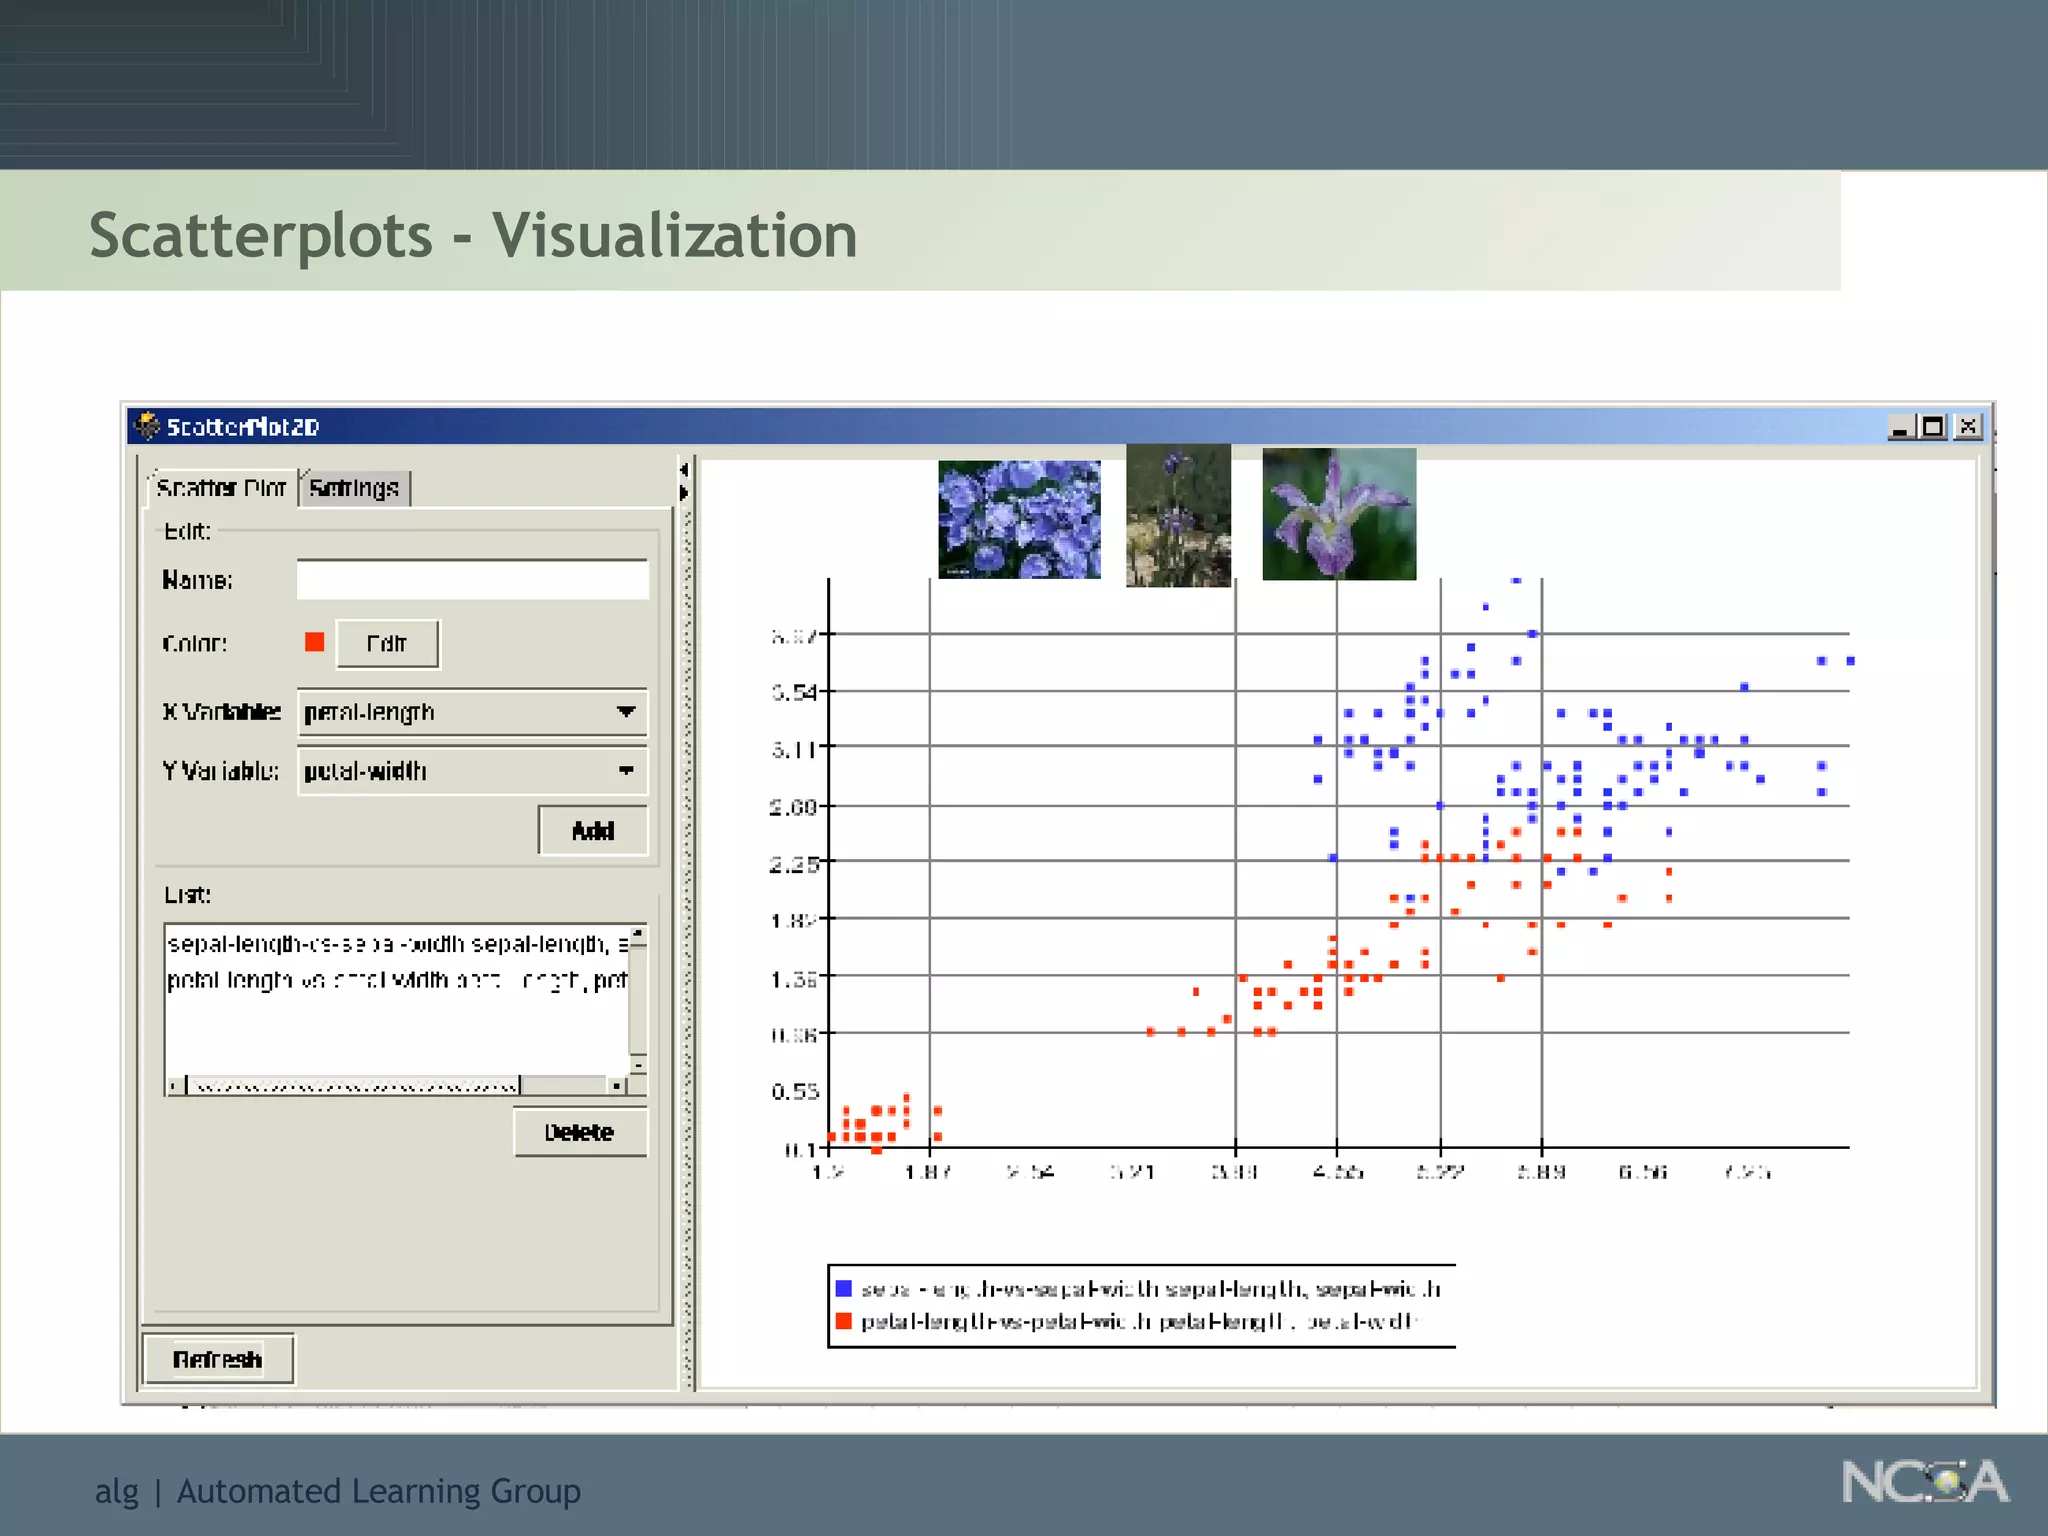
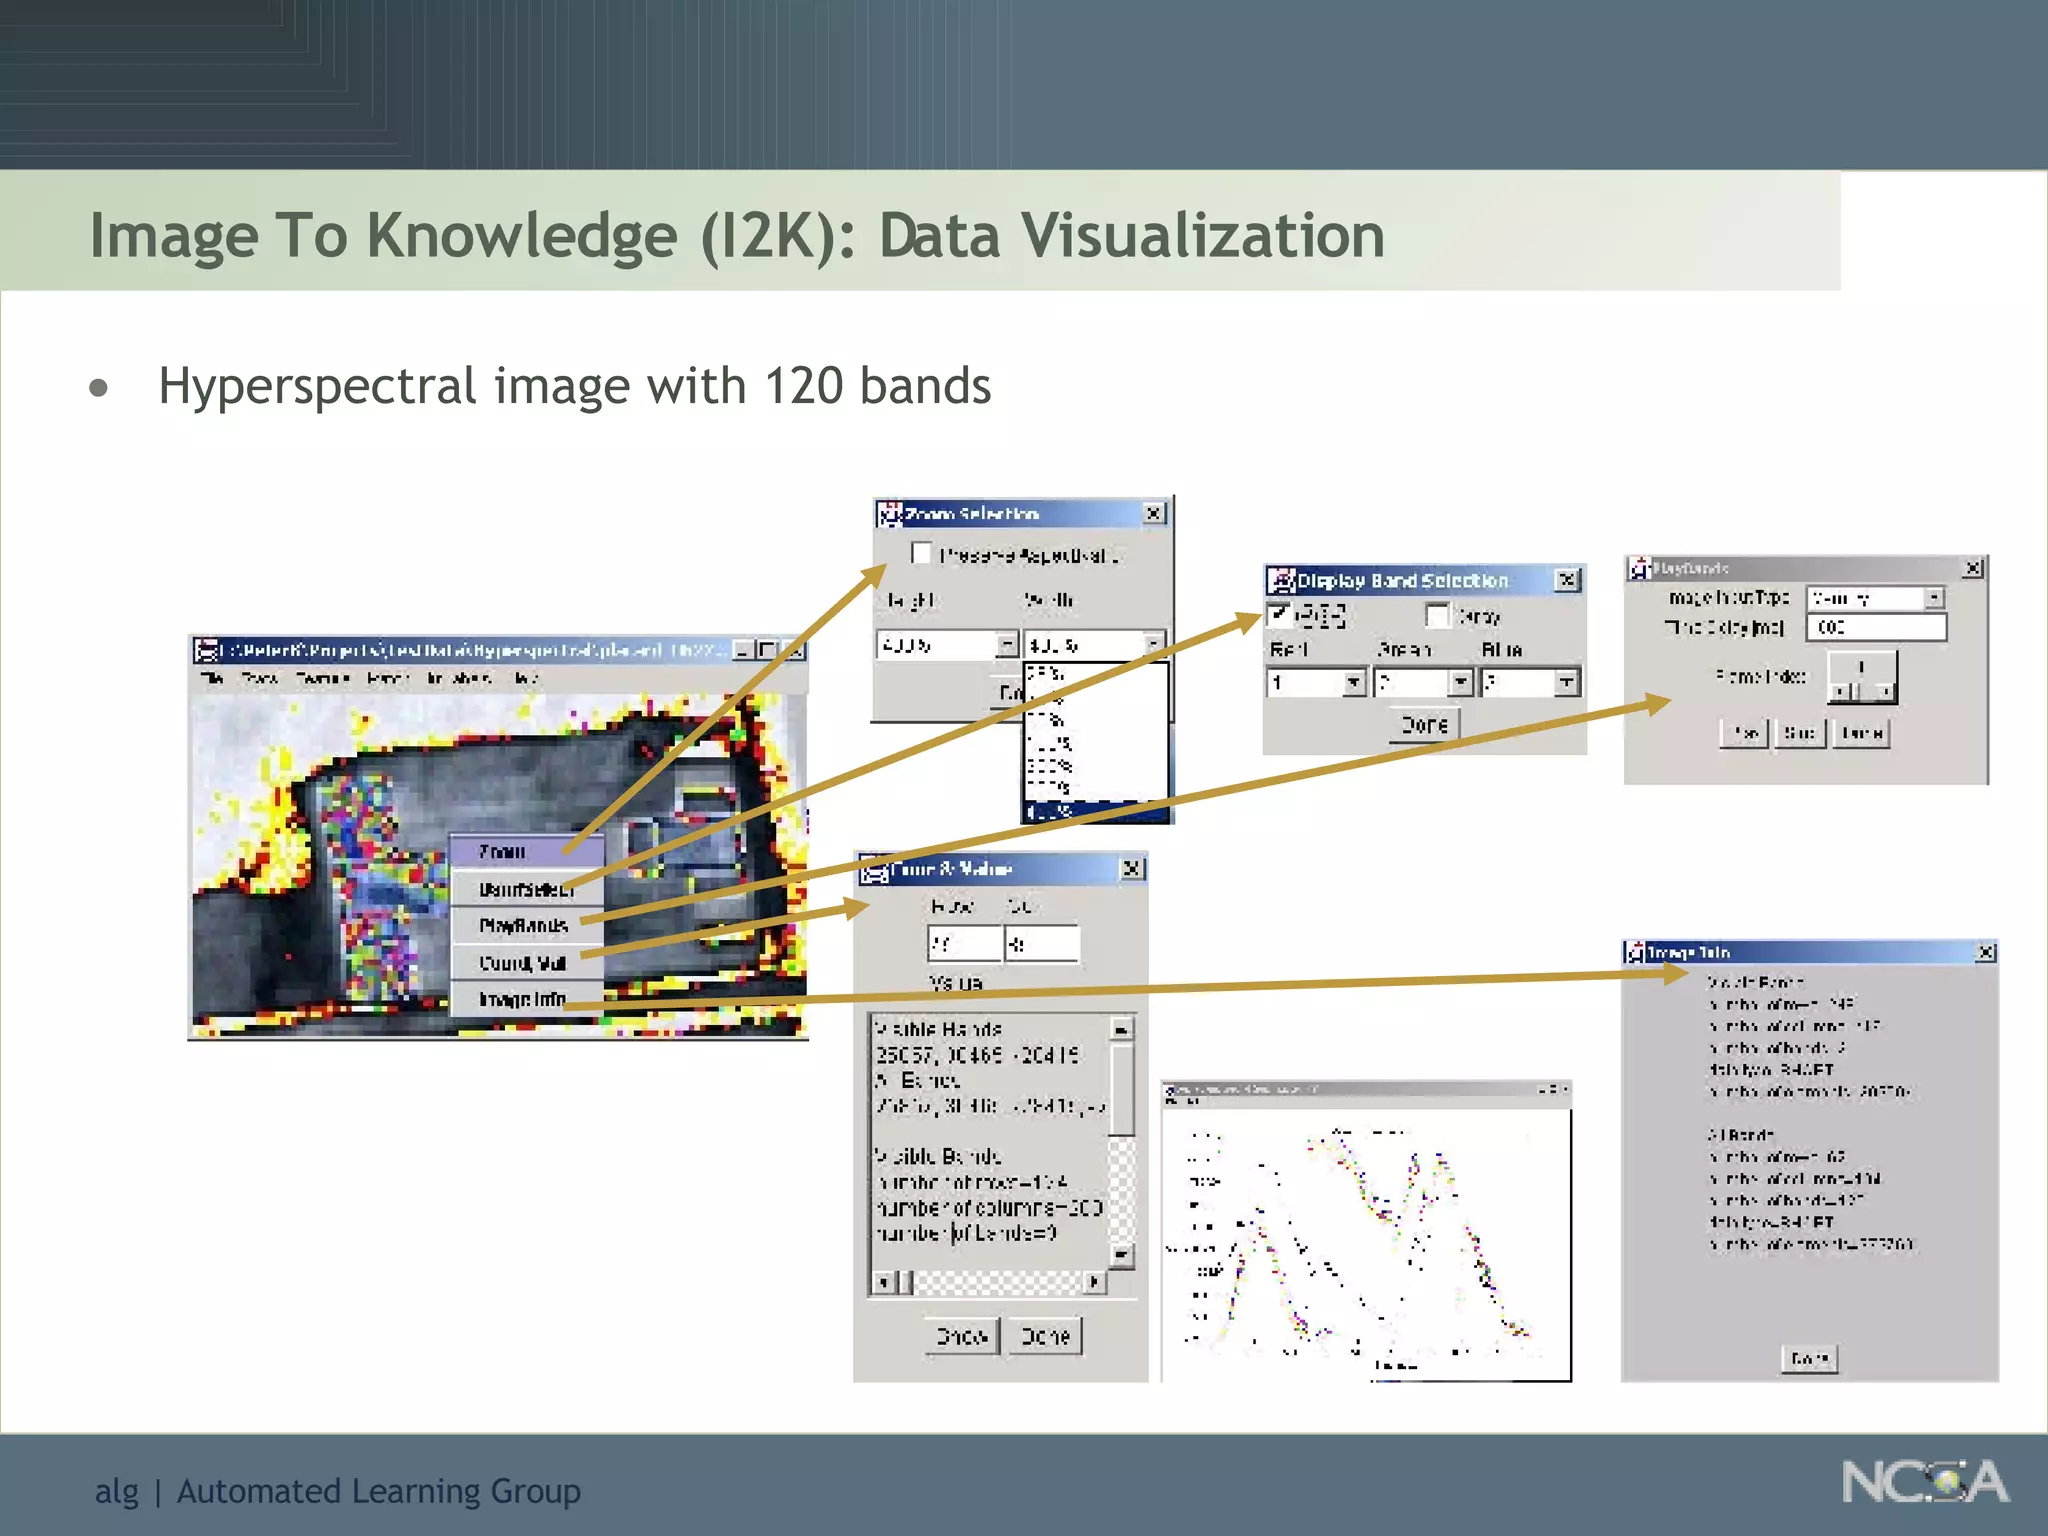
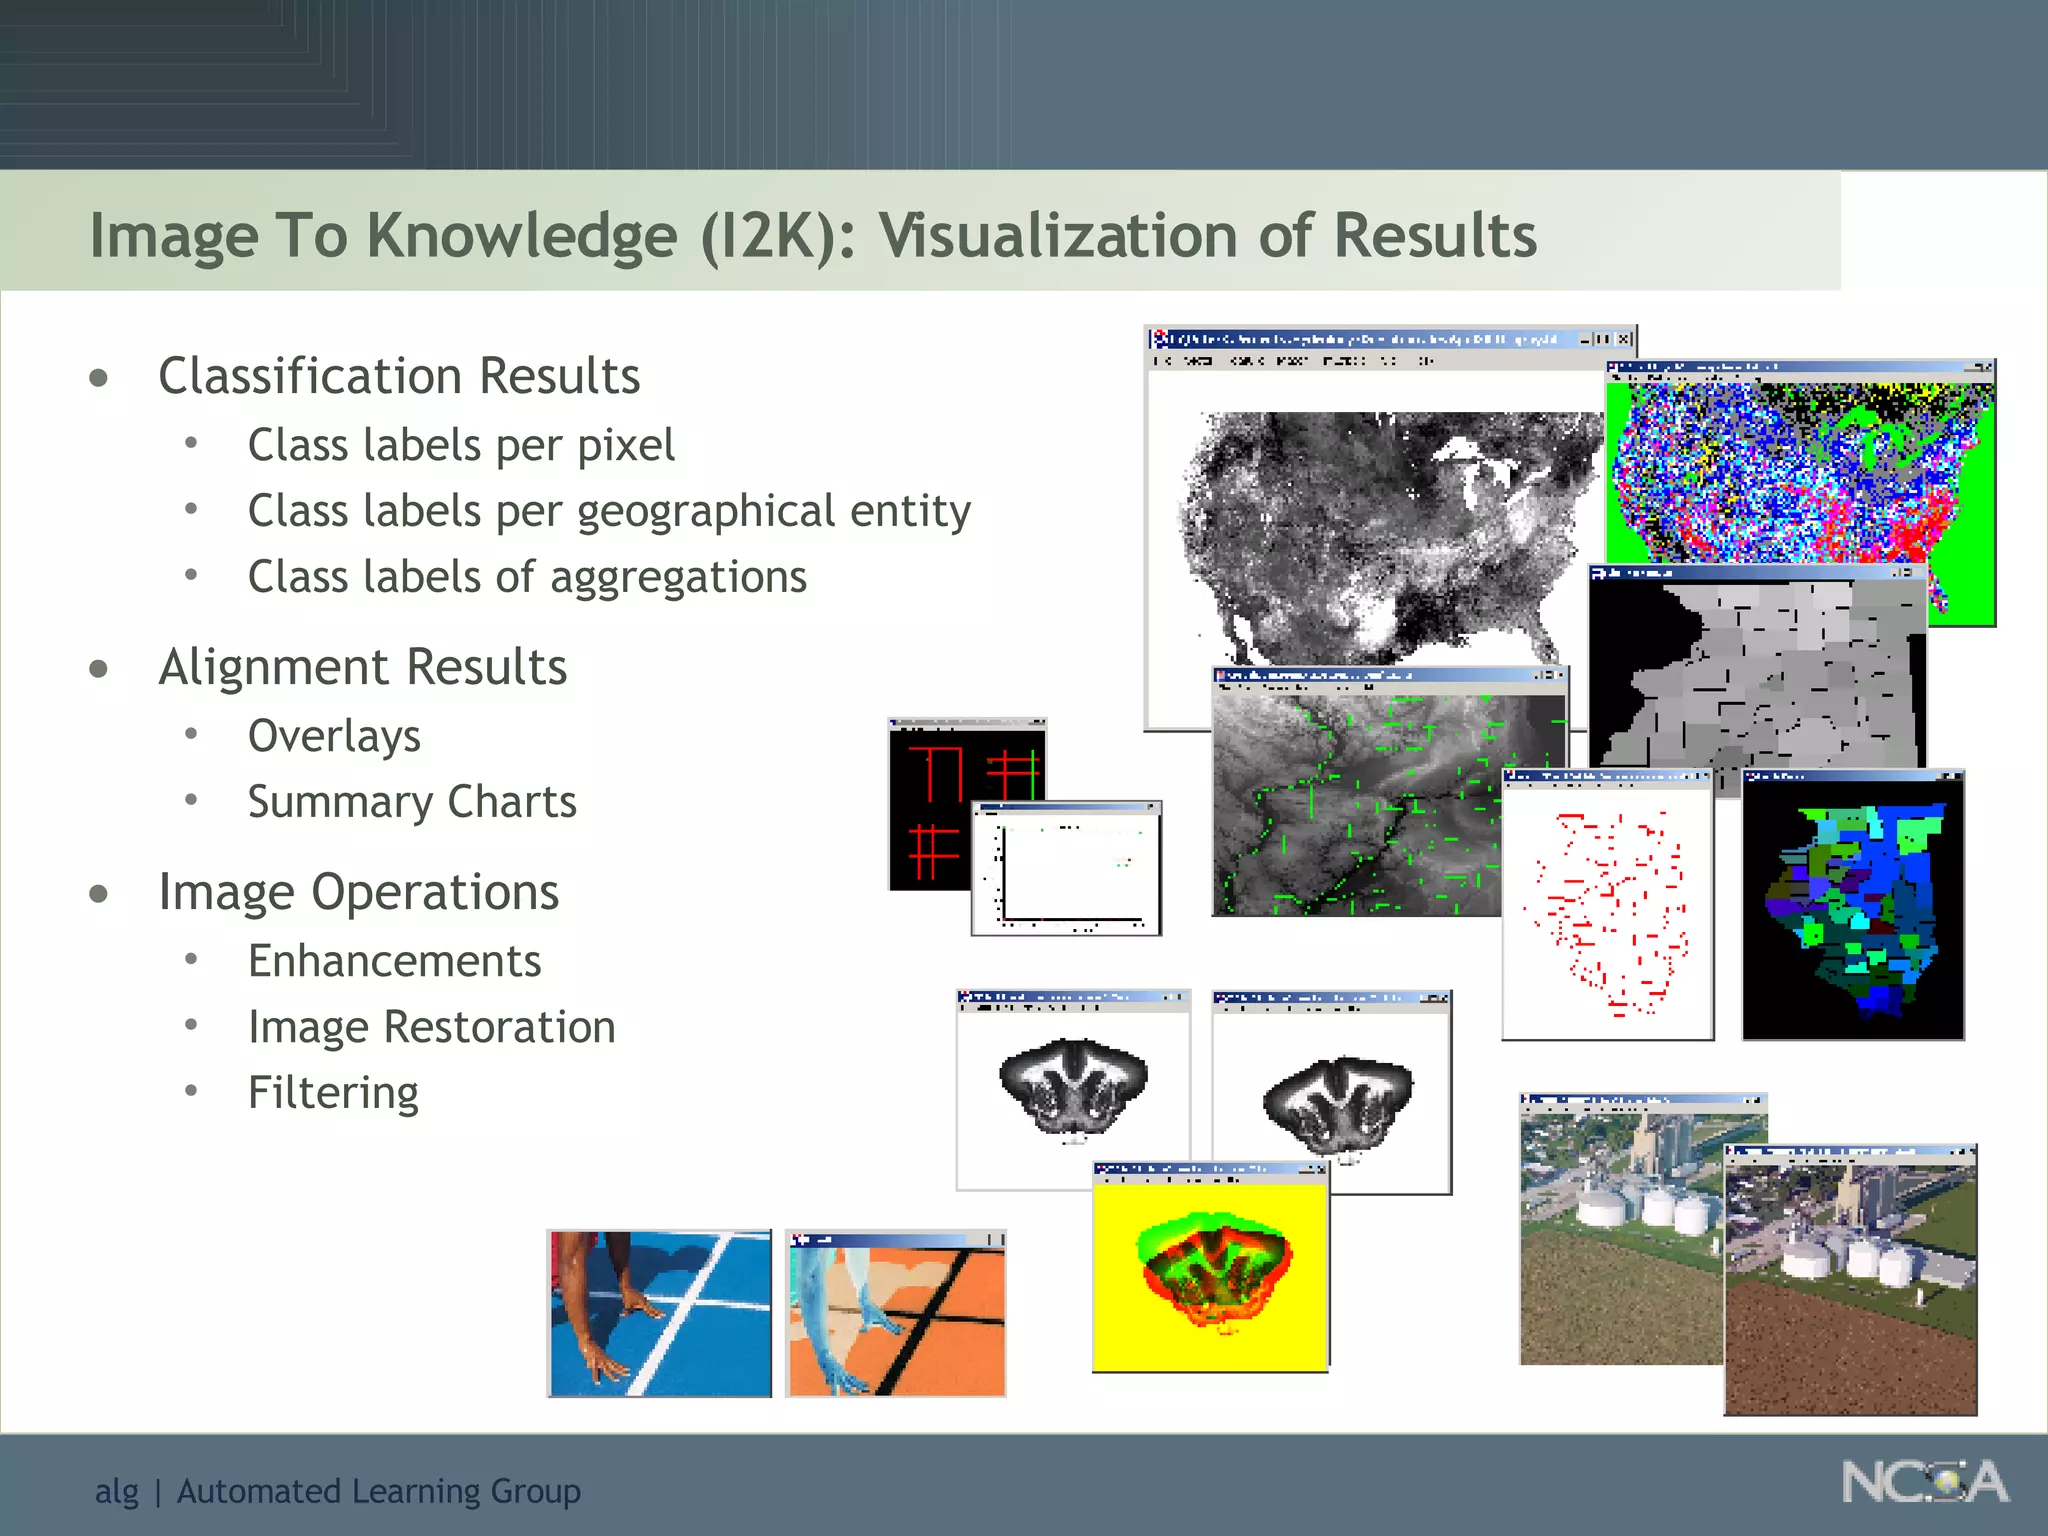
Explores visualization methods in data mining for enhancing data analysis such as Naïve Bayesian.
Showcases summaries of projects utilizing data visualization to understand protein consumption and develop monitoring tools.
Encourages audience to familiarize themselves with data mining and apply techniques to real-world questions.


![China E-commerce Analytics [Credit Suisse]](https://cdn.slidesharecdn.com/ss_thumbnails/creditsuisse-chinae-commerceanalytics-121208092641-phpapp01-thumbnail.jpg?width=600ounds&width=560&fit=bounds)


