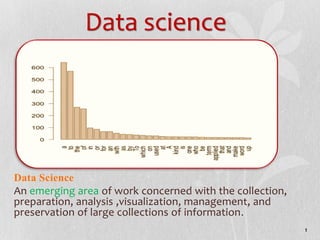
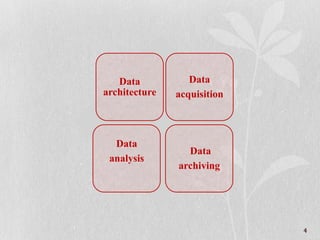
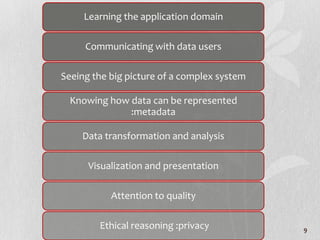
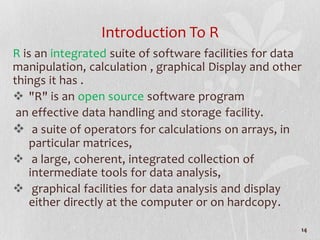
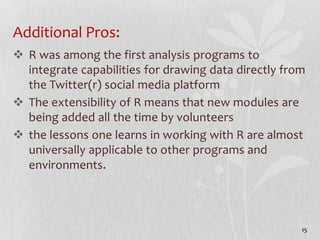
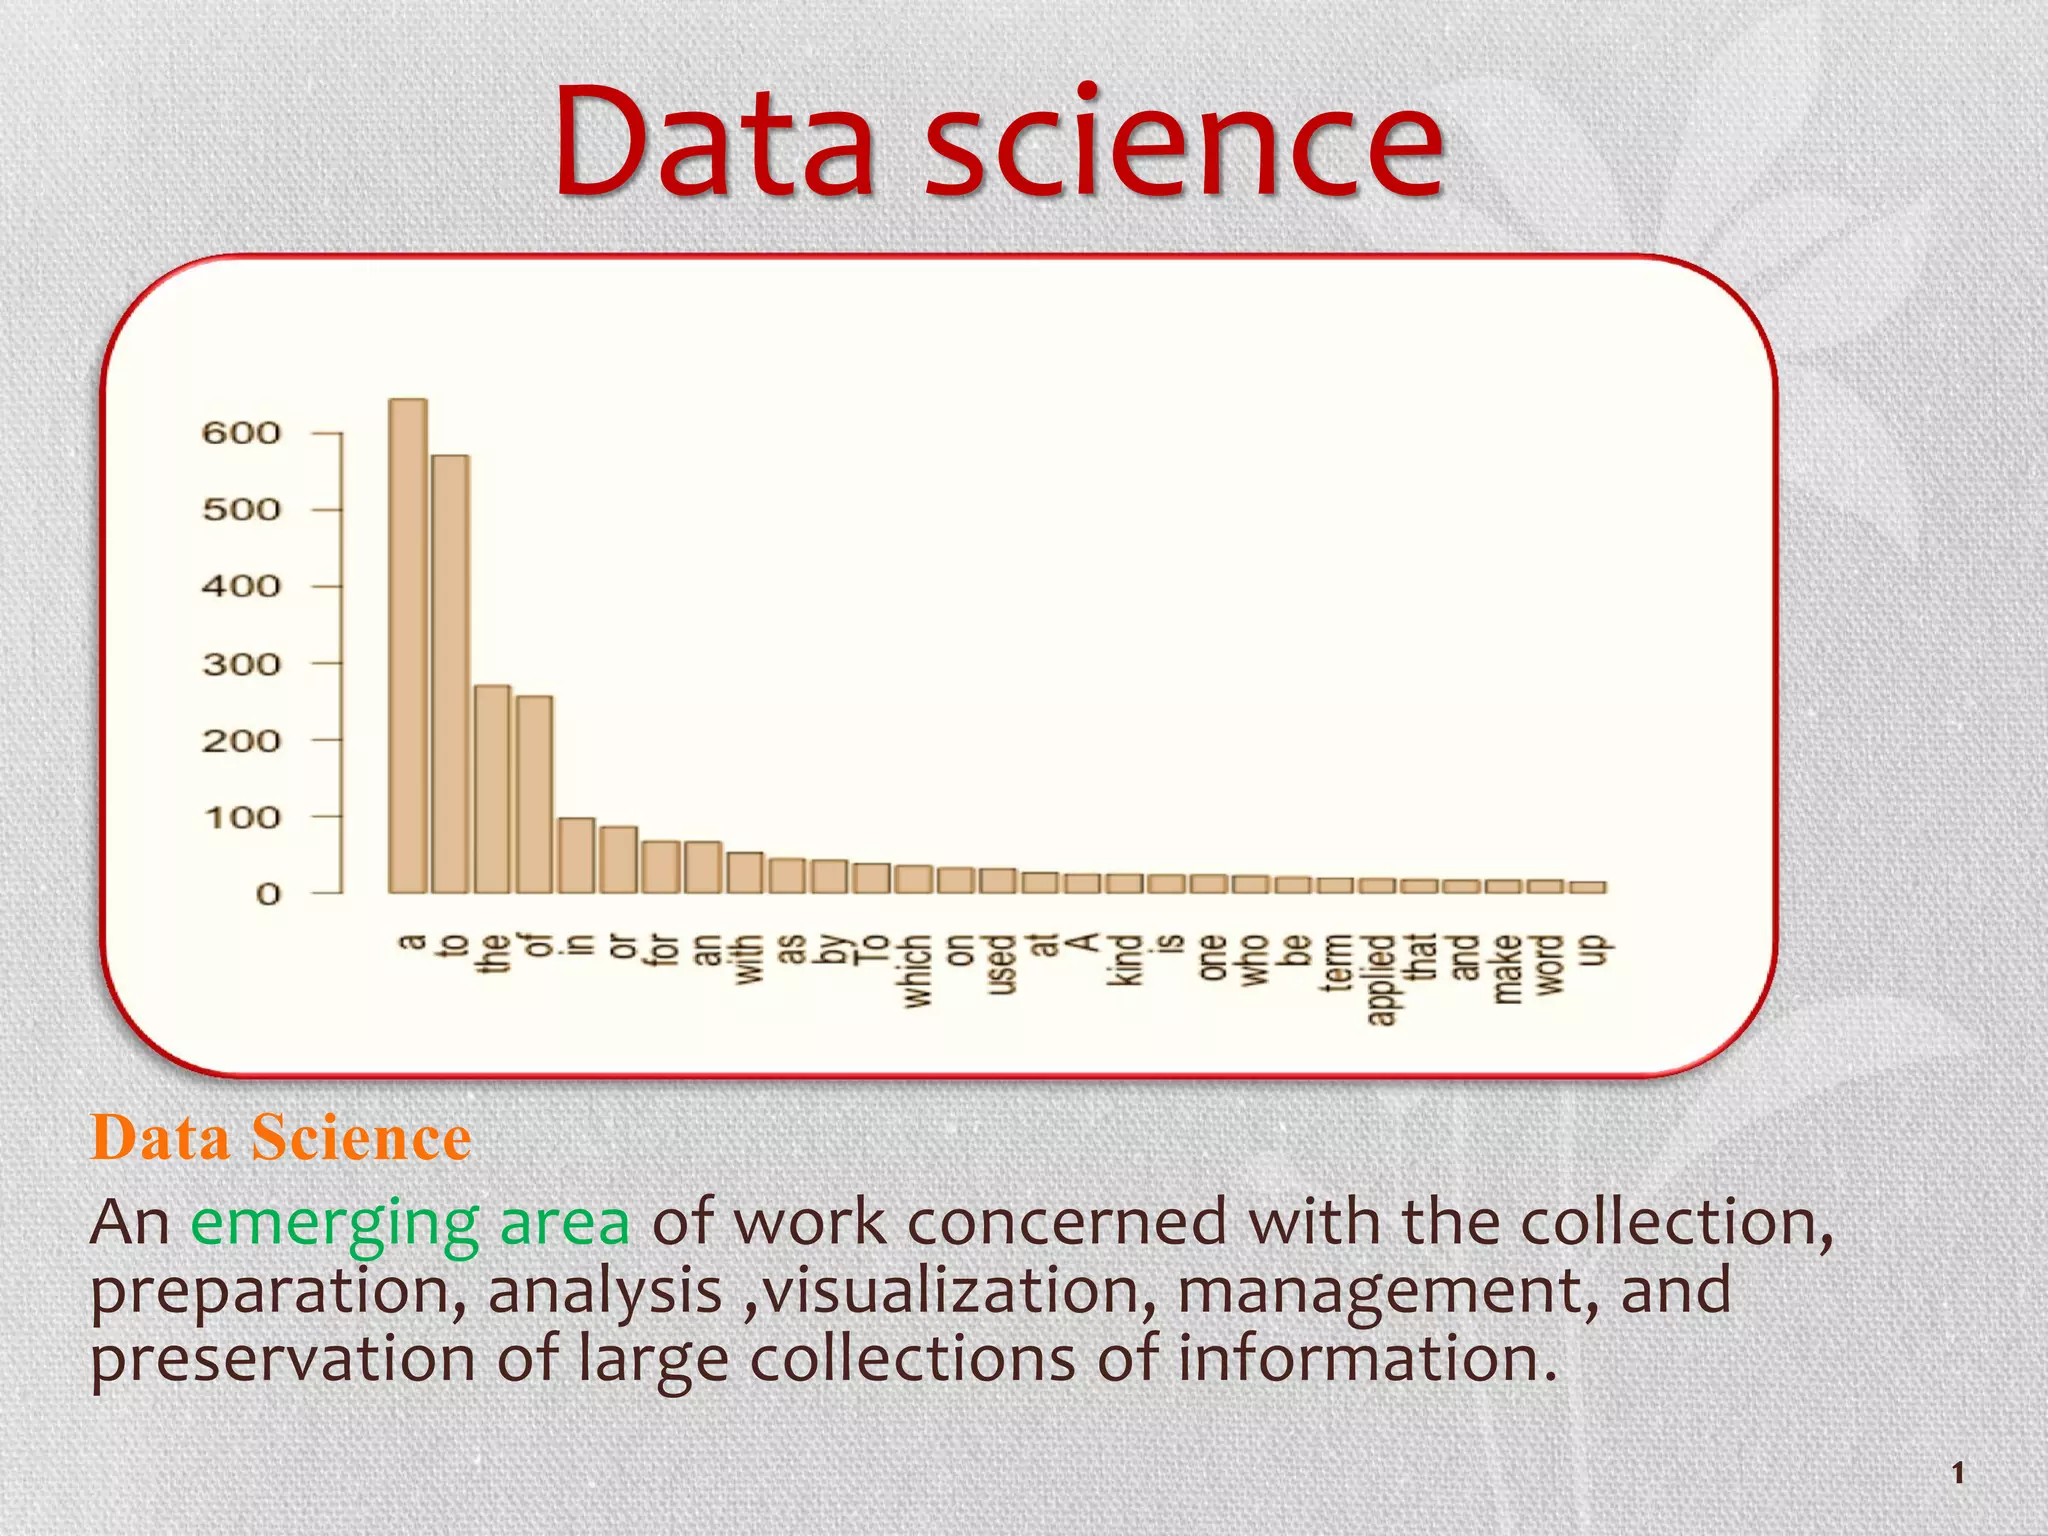
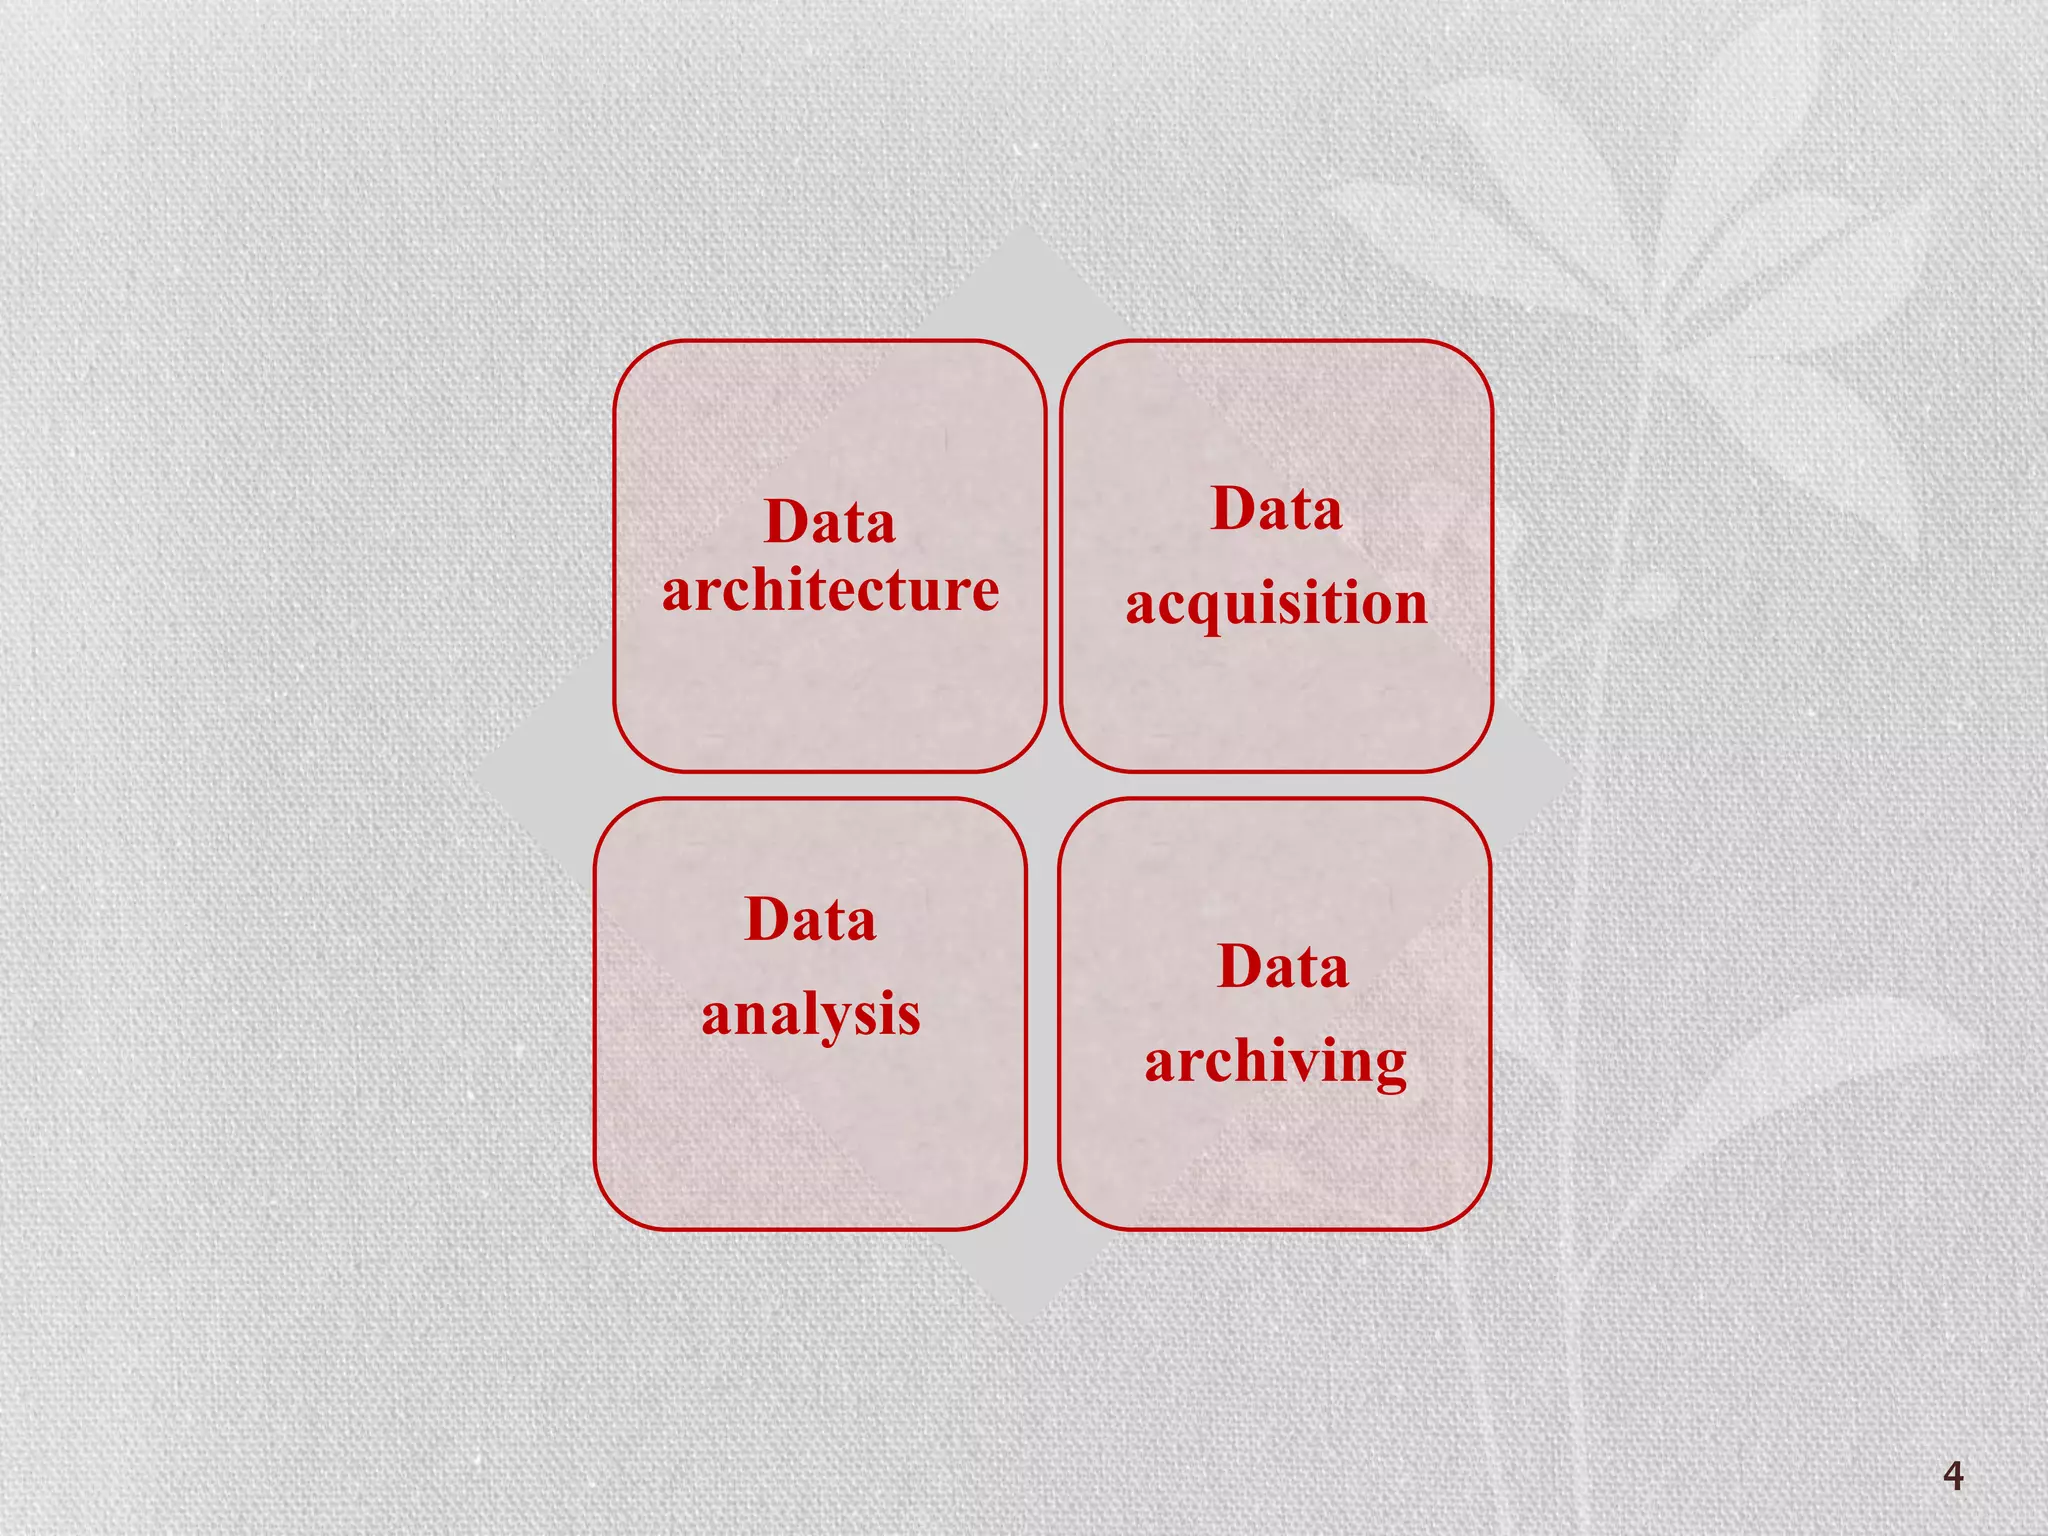
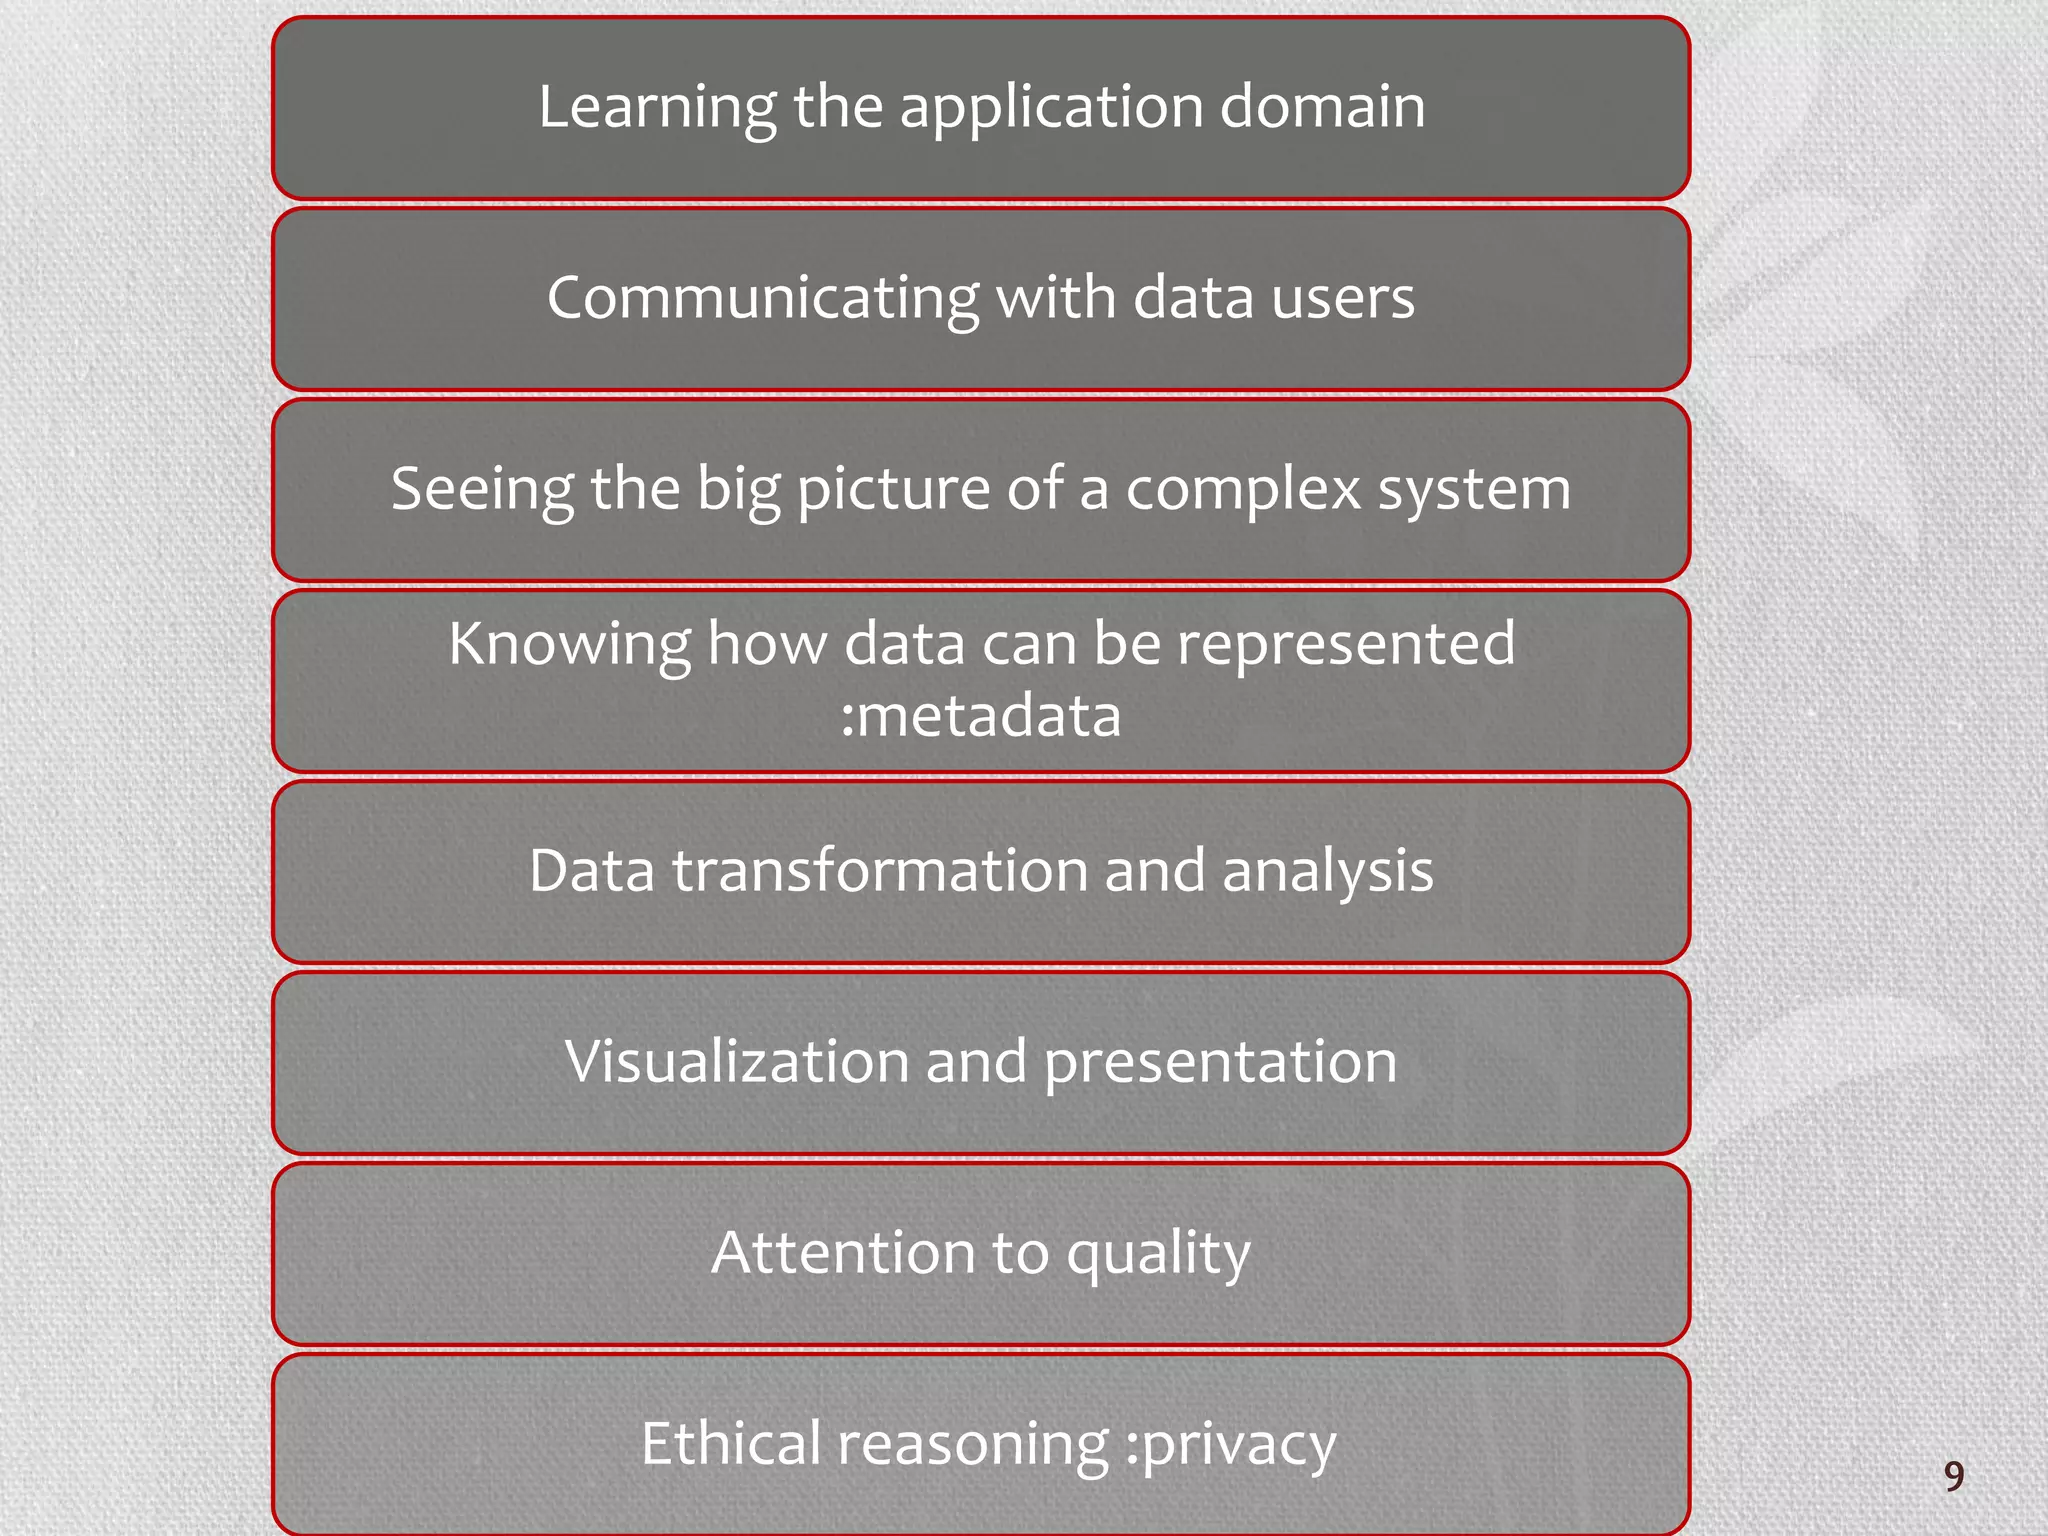
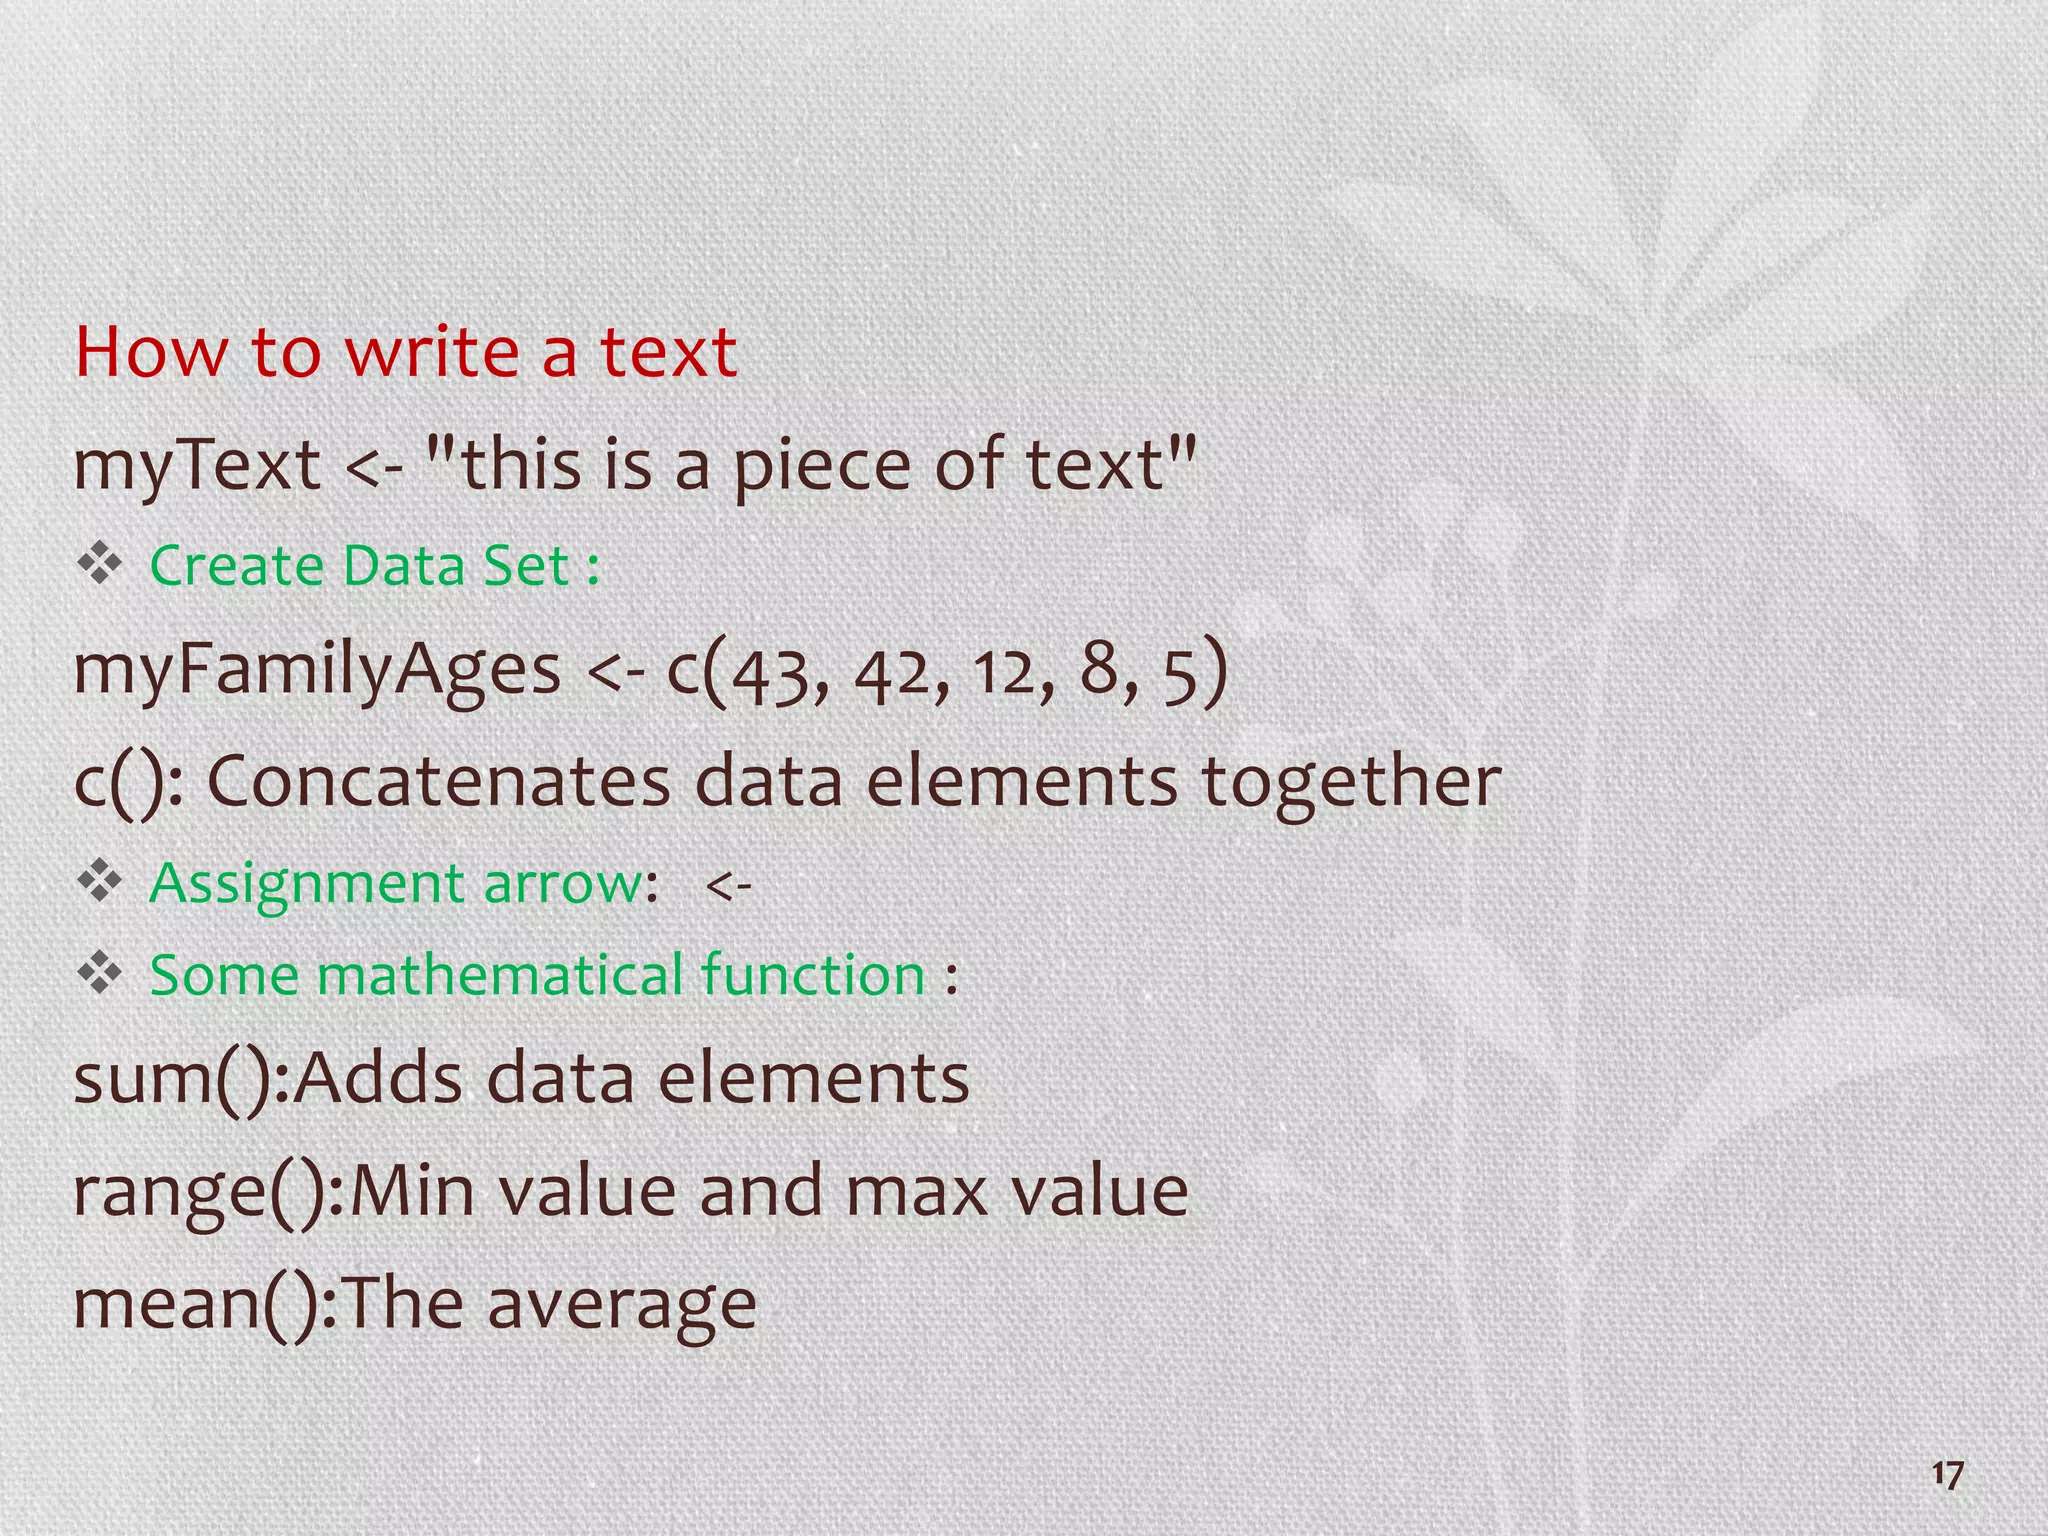
KEMBAR78
Introduction to data science intro,ch(1,2,3) | PDF
Data science
Data Science
An emerging area of work concerned with the collection,
preparation, analysis ,visualization, management, and
preservation of large collections of information.
1
Web page
much of the data in the world is non-numeric and
unstructured.
unstructured means that the data are not arranged in neat
rows and columns. Think of a web page
2
$
3
Data
architecture
Data
acquisition
Data
analysis
Data
archiving
4
Data architect
providing input on how the data would need to be
routed and organized to support the analysis,
visualization, and presentation of the data to the
appropriate people.
5
Data acquisition
focuses on how the data are collected, and
importantly , how the data are represented prior
to analysis and presentation.
Tool example :barcode
Different barcodes are used for the same product.
(for example, for different sized boxes of cereal).
6
Data analysis
using portions of data (samples) to make
inferences about the larger context, and
visualization of the data by presenting it in tables,
graphs, and even animations.
7
Data archiving
Preservation of collected data in a form that
makes it highly reusable ,so "data curation" is
a difficult challenge because it is so hard to
anticipate all of the future uses of the data.
Example(Twitter):
Geocodes : data that shows the geographical location
from which a tweet was sent could be a useful
element to store with the data.
8
Learning the application domain
Communicating with data users
Seeing the big picture of a complex system
Knowing how data can be represented
:metadata
Data transformation and analysis
Visualization and presentation
Attention to quality
Ethical reasoning :privacy 9
About Data
•Data comes from the Latin word, "datum,"
meaning a "thing given“
10
za15id05v2005kamel
11
“The fundamental problem of
communication is that of
reproducing at one point either
exactly or approximately a
message selected at another
point”
CLAUDE SHANNON
yes
1
0
No
Maybe01
ASCII
12
Identifying Data Problems
Data Science is an applied activity and data scientists
serve the needs and solve the problems of data users.
Hint:
The data scientist may never actually become a
farmer, but if you are going to identify a data problem
that a farmer has, you have to learn to think like a
farmer, to some degree.
3 questions:
 subject matter experts.
 ask about anomalies
 ask about risks and uncertainty
13
Introduction To R
R is an integrated suite of software facilities for data
manipulation, calculation , graphical Display and other
things it has .
 "R" is an open source software program
an effective data handling and storage facility.
 a suite of operators for calculations on arrays, in
particular matrices,
 a large, coherent, integrated collection of
intermediate tools for data analysis,
 graphical facilities for data analysis and display
either directly at the computer or on hardcopy.
14
Additional Pros:
 R was among the first analysis programs to
integrate capabilities for drawing data directly from
the Twitter(r) social media platform
 The extensibility of R means that new modules are
being added all the time by volunteers
 the lessons one learns in working with R are almost
universally applicable to other programs and
environments.
15
CONS:
R is "command line" oriented
 R is not especially good at giving feedback or error
messages.
16
How to write a text
myText <- "this is a piece of text"
 Create Data Set :
myFamilyAges <- c(43, 42, 12, 8, 5)
c(): Concatenates data elements together
 Assignment arrow: <-
 Some mathematical function :
sum():Adds data elements
range():Min value and max value
mean():The average
17
18

Introduction to data science intro,ch(1,2,3)

  • 1.
    Data science Data Science Anemerging area of work concerned with the collection, preparation, analysis ,visualization, management, and preservation of large collections of information. 1
  • 2.
    Web page much ofthe data in the world is non-numeric and unstructured. unstructured means that the data are not arranged in neat rows and columns. Think of a web page 2
  • 3.
  • 4.
  • 5.
    Data architect providing inputon how the data would need to be routed and organized to support the analysis, visualization, and presentation of the data to the appropriate people. 5
  • 6.
    Data acquisition focuses onhow the data are collected, and importantly , how the data are represented prior to analysis and presentation. Tool example :barcode Different barcodes are used for the same product. (for example, for different sized boxes of cereal). 6
  • 7.
    Data analysis using portionsof data (samples) to make inferences about the larger context, and visualization of the data by presenting it in tables, graphs, and even animations. 7
  • 8.
    Data archiving Preservation ofcollected data in a form that makes it highly reusable ,so "data curation" is a difficult challenge because it is so hard to anticipate all of the future uses of the data. Example(Twitter): Geocodes : data that shows the geographical location from which a tweet was sent could be a useful element to store with the data. 8
  • 9.
    Learning the applicationdomain Communicating with data users Seeing the big picture of a complex system Knowing how data can be represented :metadata Data transformation and analysis Visualization and presentation Attention to quality Ethical reasoning :privacy 9
  • 10.
    About Data •Data comesfrom the Latin word, "datum," meaning a "thing given“ 10
  • 11.
  • 12.
    “The fundamental problemof communication is that of reproducing at one point either exactly or approximately a message selected at another point” CLAUDE SHANNON yes 1 0 No Maybe01 ASCII 12
  • 13.
    Identifying Data Problems DataScience is an applied activity and data scientists serve the needs and solve the problems of data users. Hint: The data scientist may never actually become a farmer, but if you are going to identify a data problem that a farmer has, you have to learn to think like a farmer, to some degree. 3 questions:  subject matter experts.  ask about anomalies  ask about risks and uncertainty 13
  • 14.
    Introduction To R Ris an integrated suite of software facilities for data manipulation, calculation , graphical Display and other things it has .  "R" is an open source software program an effective data handling and storage facility.  a suite of operators for calculations on arrays, in particular matrices,  a large, coherent, integrated collection of intermediate tools for data analysis,  graphical facilities for data analysis and display either directly at the computer or on hardcopy. 14
  • 15.
    Additional Pros:  Rwas among the first analysis programs to integrate capabilities for drawing data directly from the Twitter(r) social media platform  The extensibility of R means that new modules are being added all the time by volunteers  the lessons one learns in working with R are almost universally applicable to other programs and environments. 15
  • 16.
    CONS: R is "commandline" oriented  R is not especially good at giving feedback or error messages. 16
  • 17.
    How to writea text myText <- "this is a piece of text"  Create Data Set : myFamilyAges <- c(43, 42, 12, 8, 5) c(): Concatenates data elements together  Assignment arrow: <-  Some mathematical function : sum():Adds data elements range():Min value and max value mean():The average 17
  • 18.