Downloaded 457 times


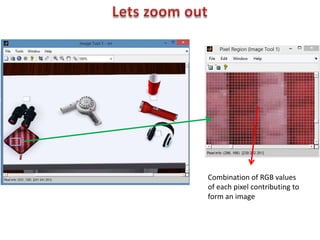


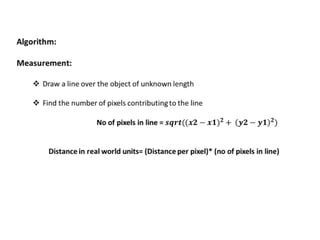
![Input image:
Output image(Extracted blue objects):
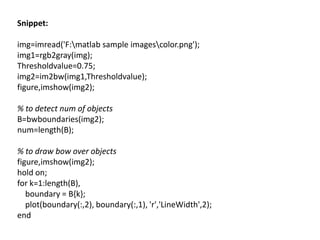
Snippet:
c=imread('F:matlab sample images1.png');
[m,n,t]=size(c);
tmp=zeros(m,n);
for i=1:m
for j=1:n
if(c(i,j,1)==0 && c(i,j,2)==0 && c(i,j,3)==255)
tmp(i,j)=1;
end
end
end
imshow(tmp);](https://image.slidesharecdn.com/introtomachinevision-140424012534-phpapp01/85/Introduction-to-Image-Processing-with-MATLAB-23-320.jpg)
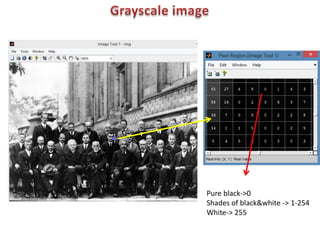
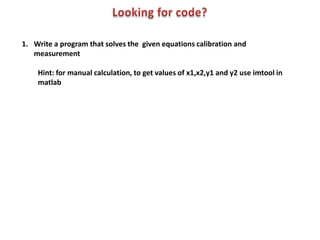
![Input image:
Output image(Extracted red objects):
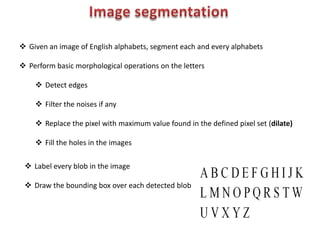
Snippet:
c=imread('F:matlab sample
images1.png');
[m,n,t]=size(c);
tmp=zeros(m,n);
for i=1:m
for j=1:n
if(c(i,j,1)==255 && c(i,j,2)==0 &&
c(i,j,3)==0)
tmp(i,j)=1;
end
end
end
imshow(tmp);
ss=bwboundaries(tmp);
num=length(ss);
Output: num = 3](https://image.slidesharecdn.com/introtomachinevision-140424012534-phpapp01/85/Introduction-to-Image-Processing-with-MATLAB-26-320.jpg)

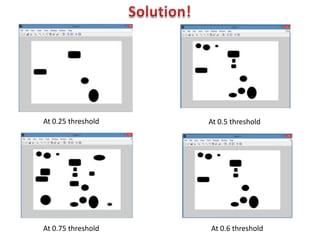

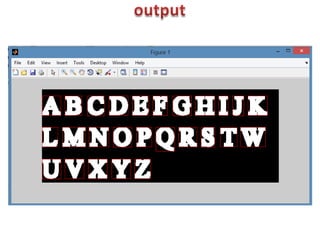
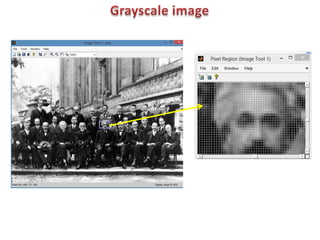
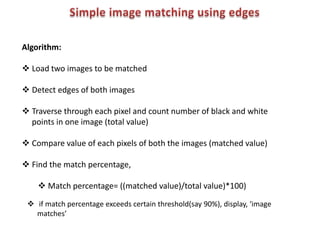
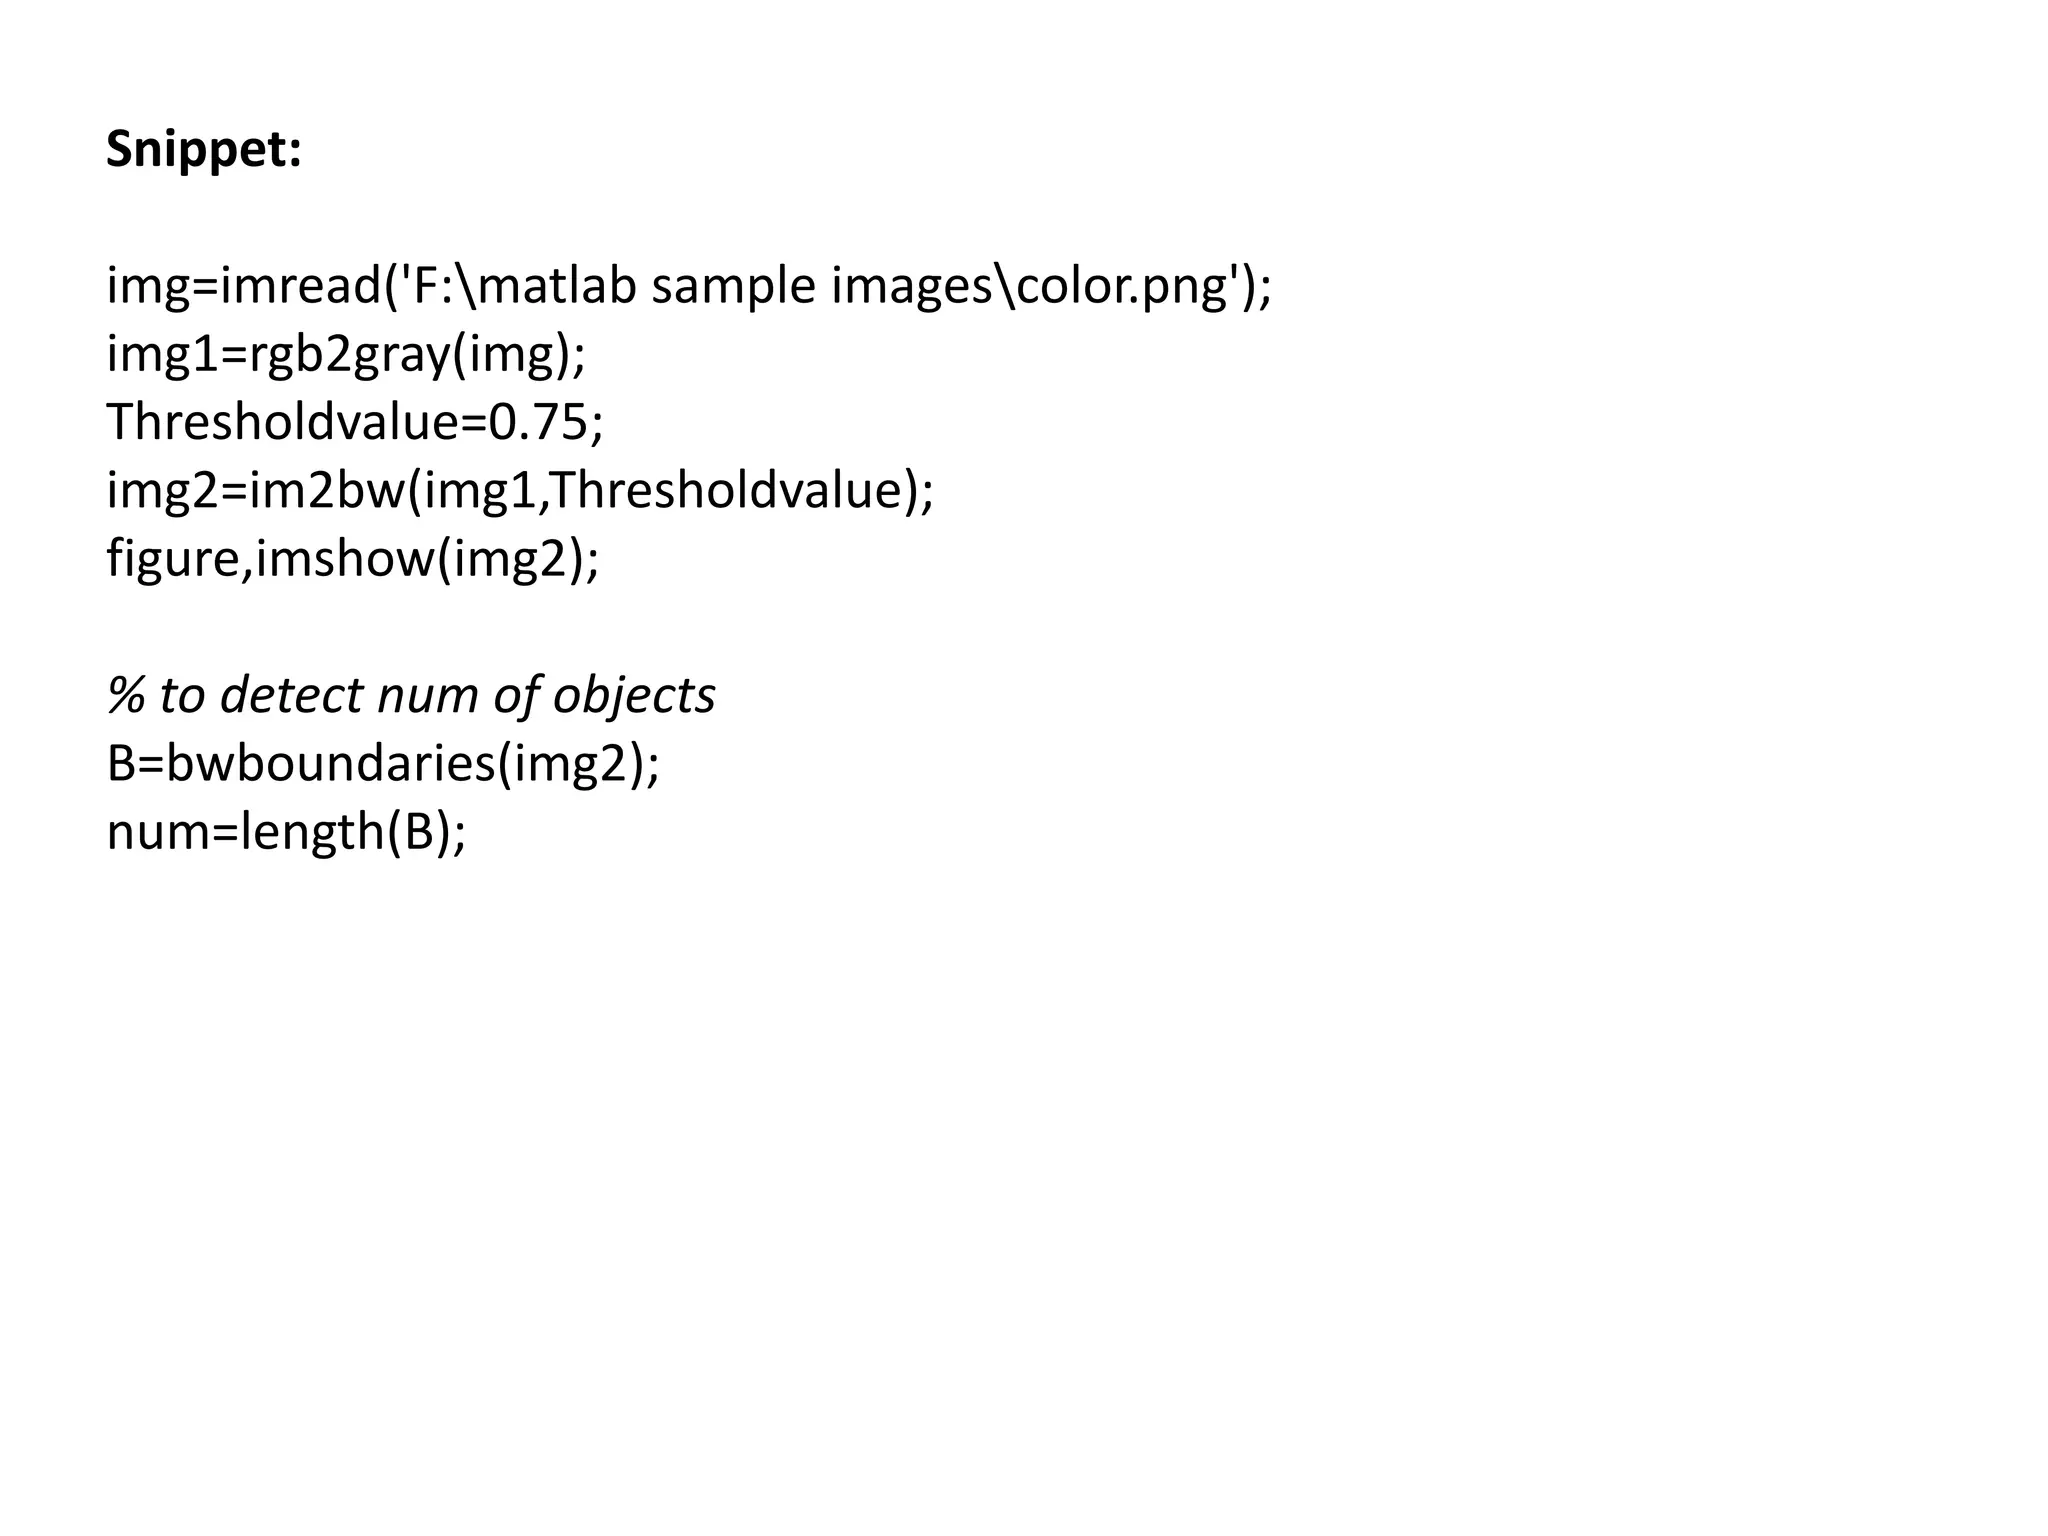
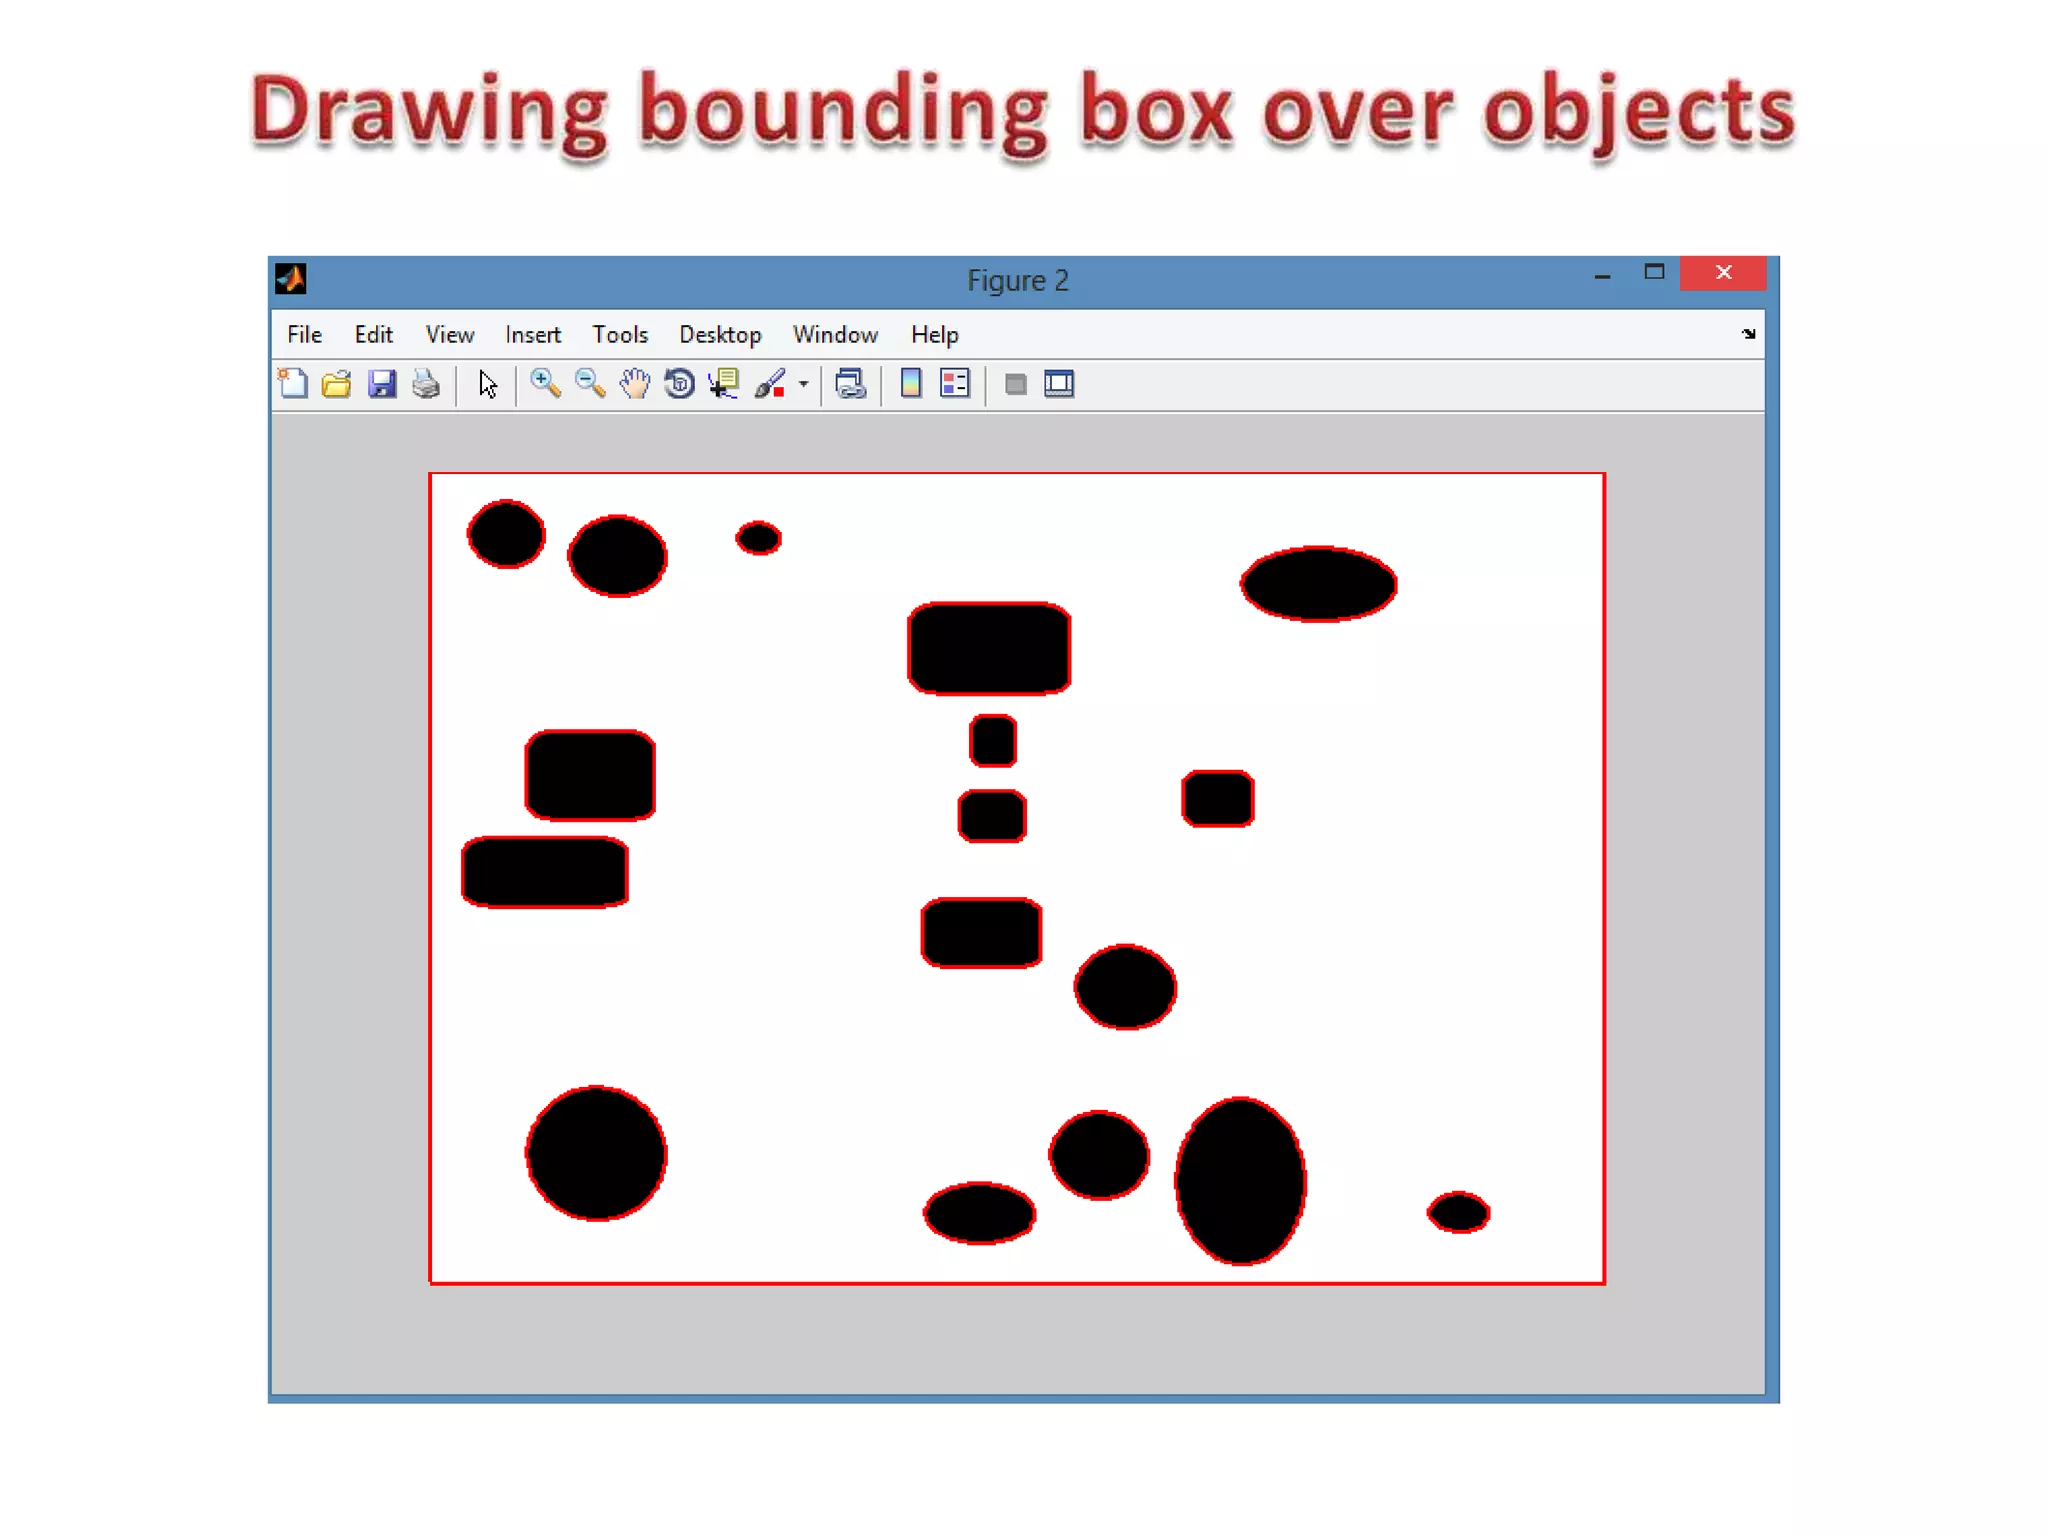
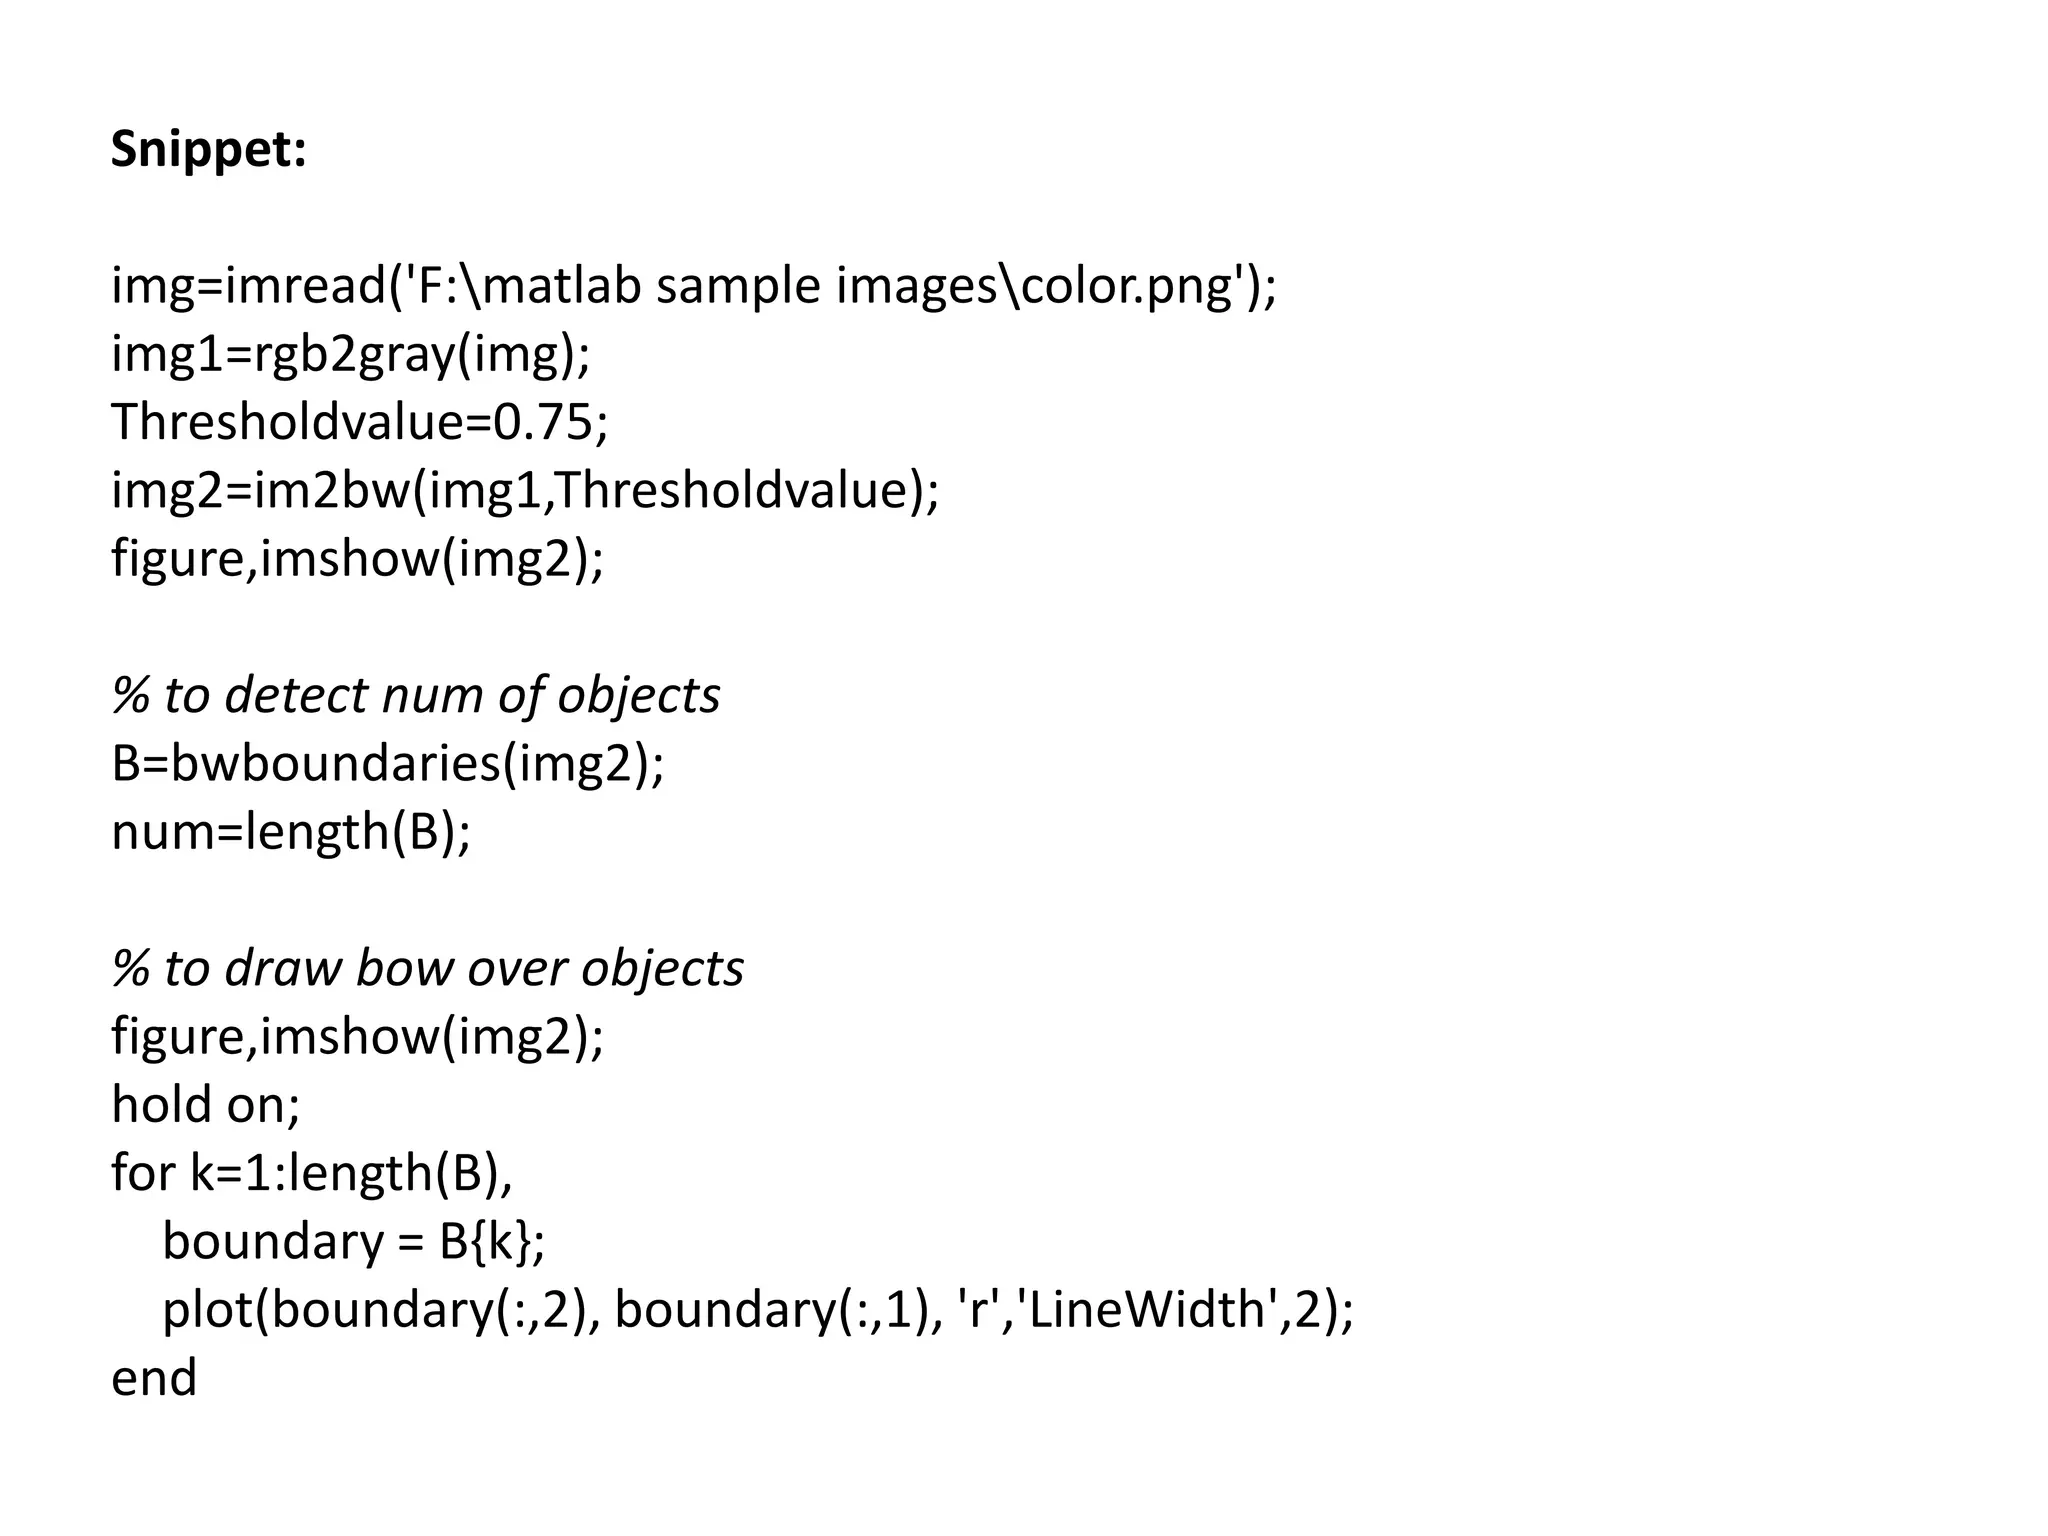
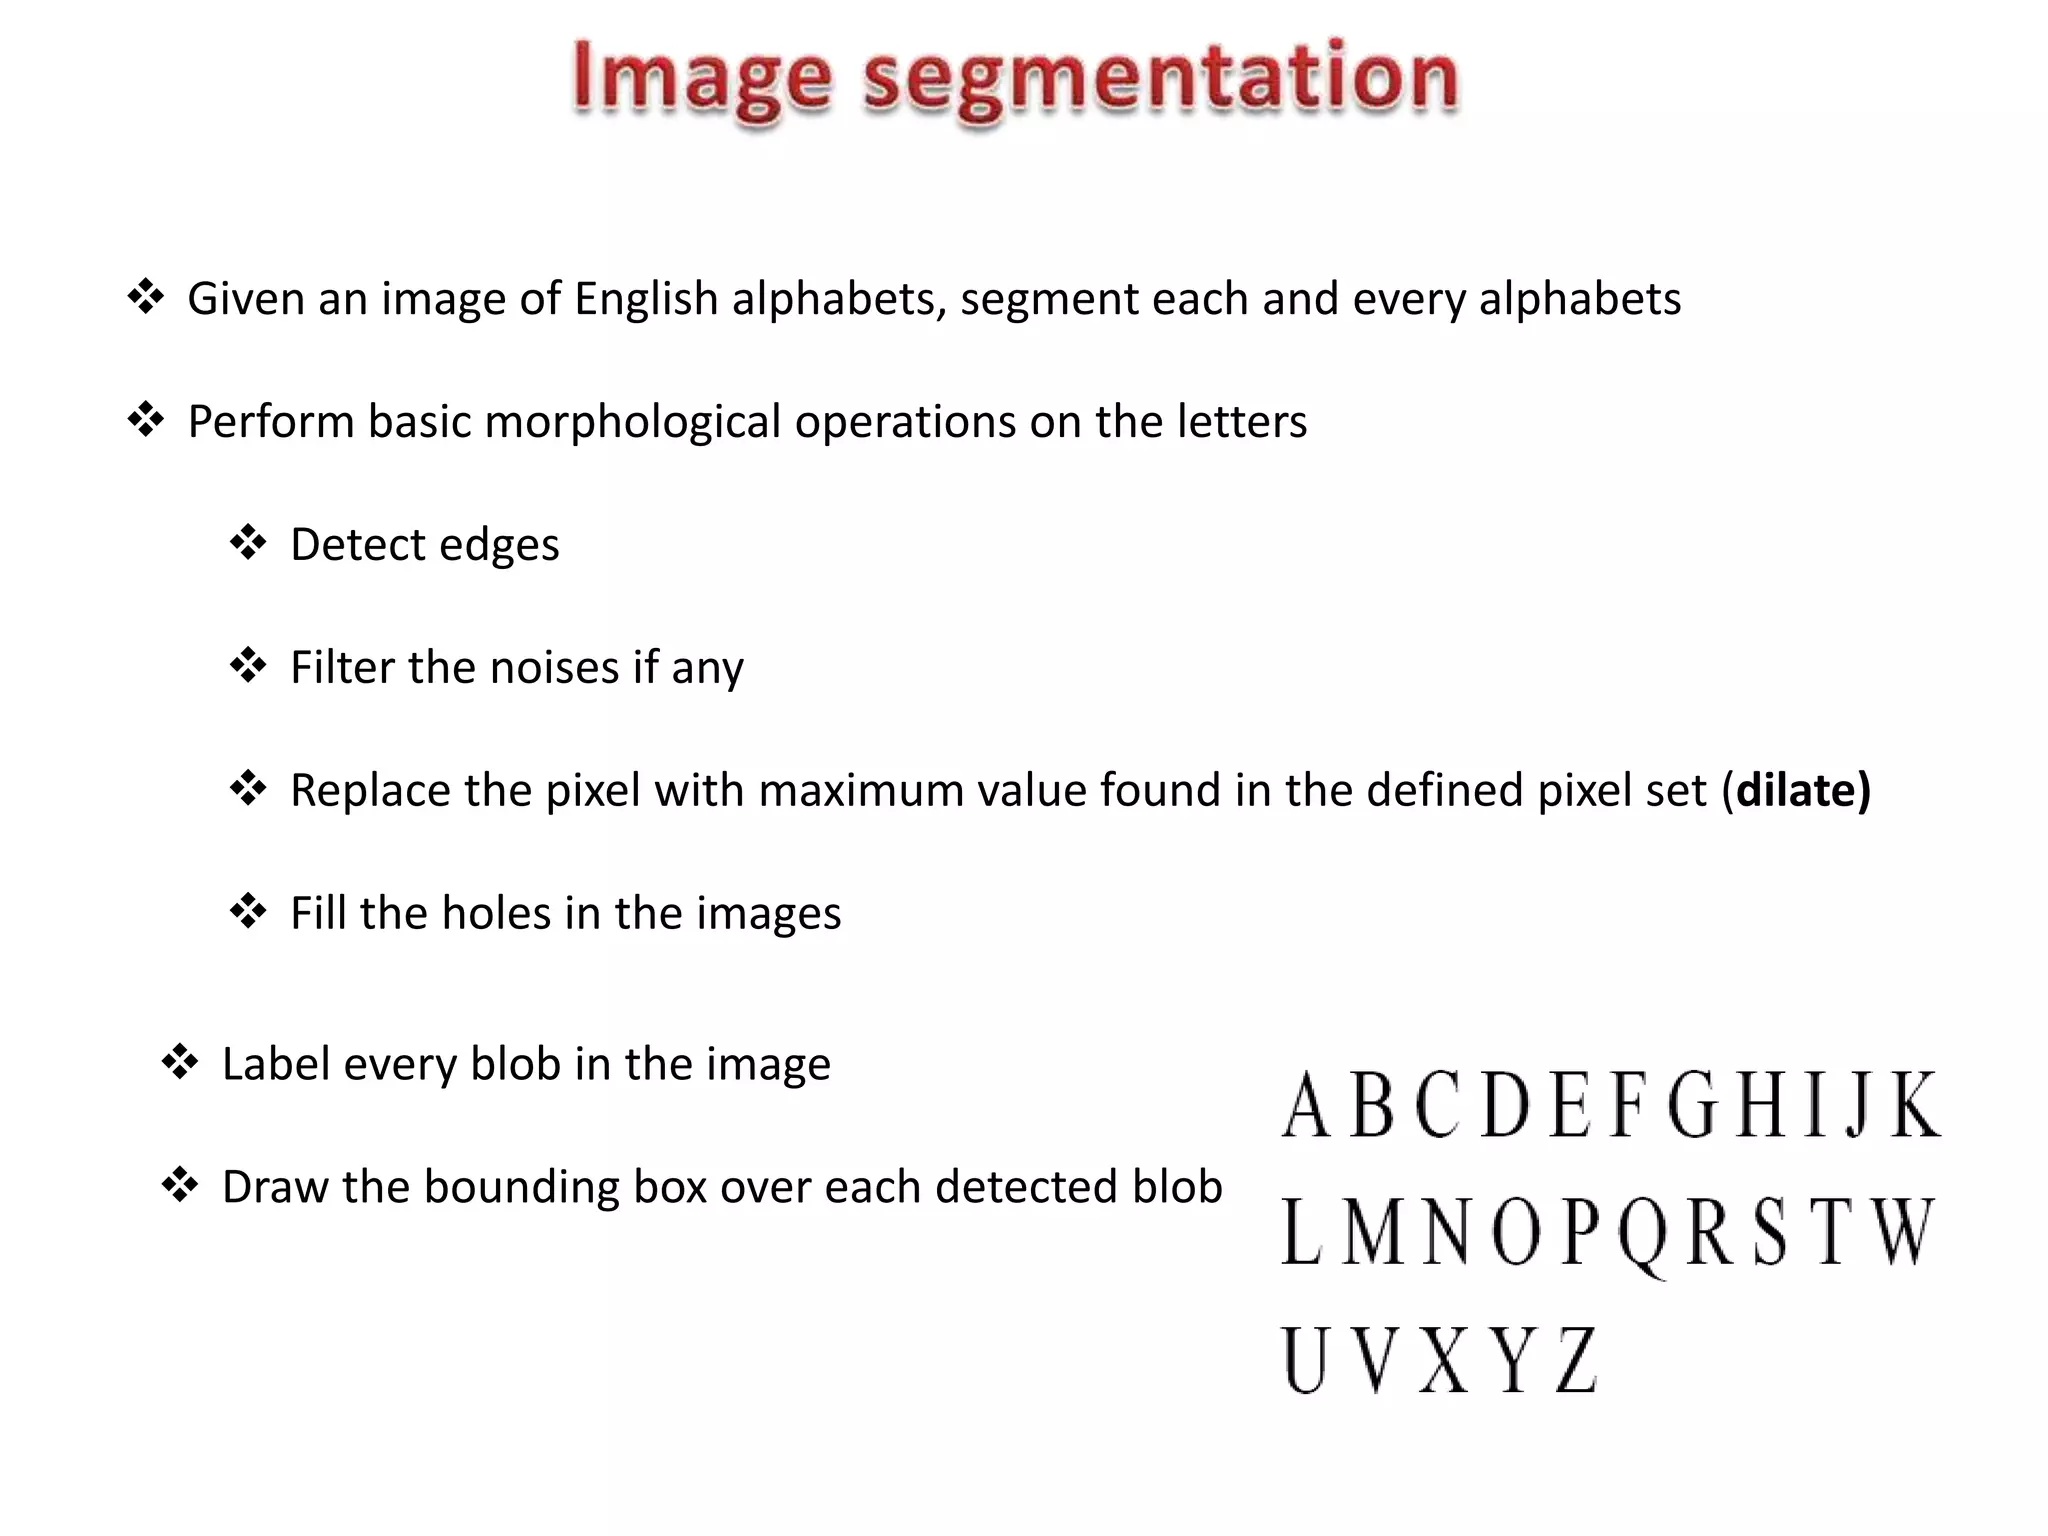
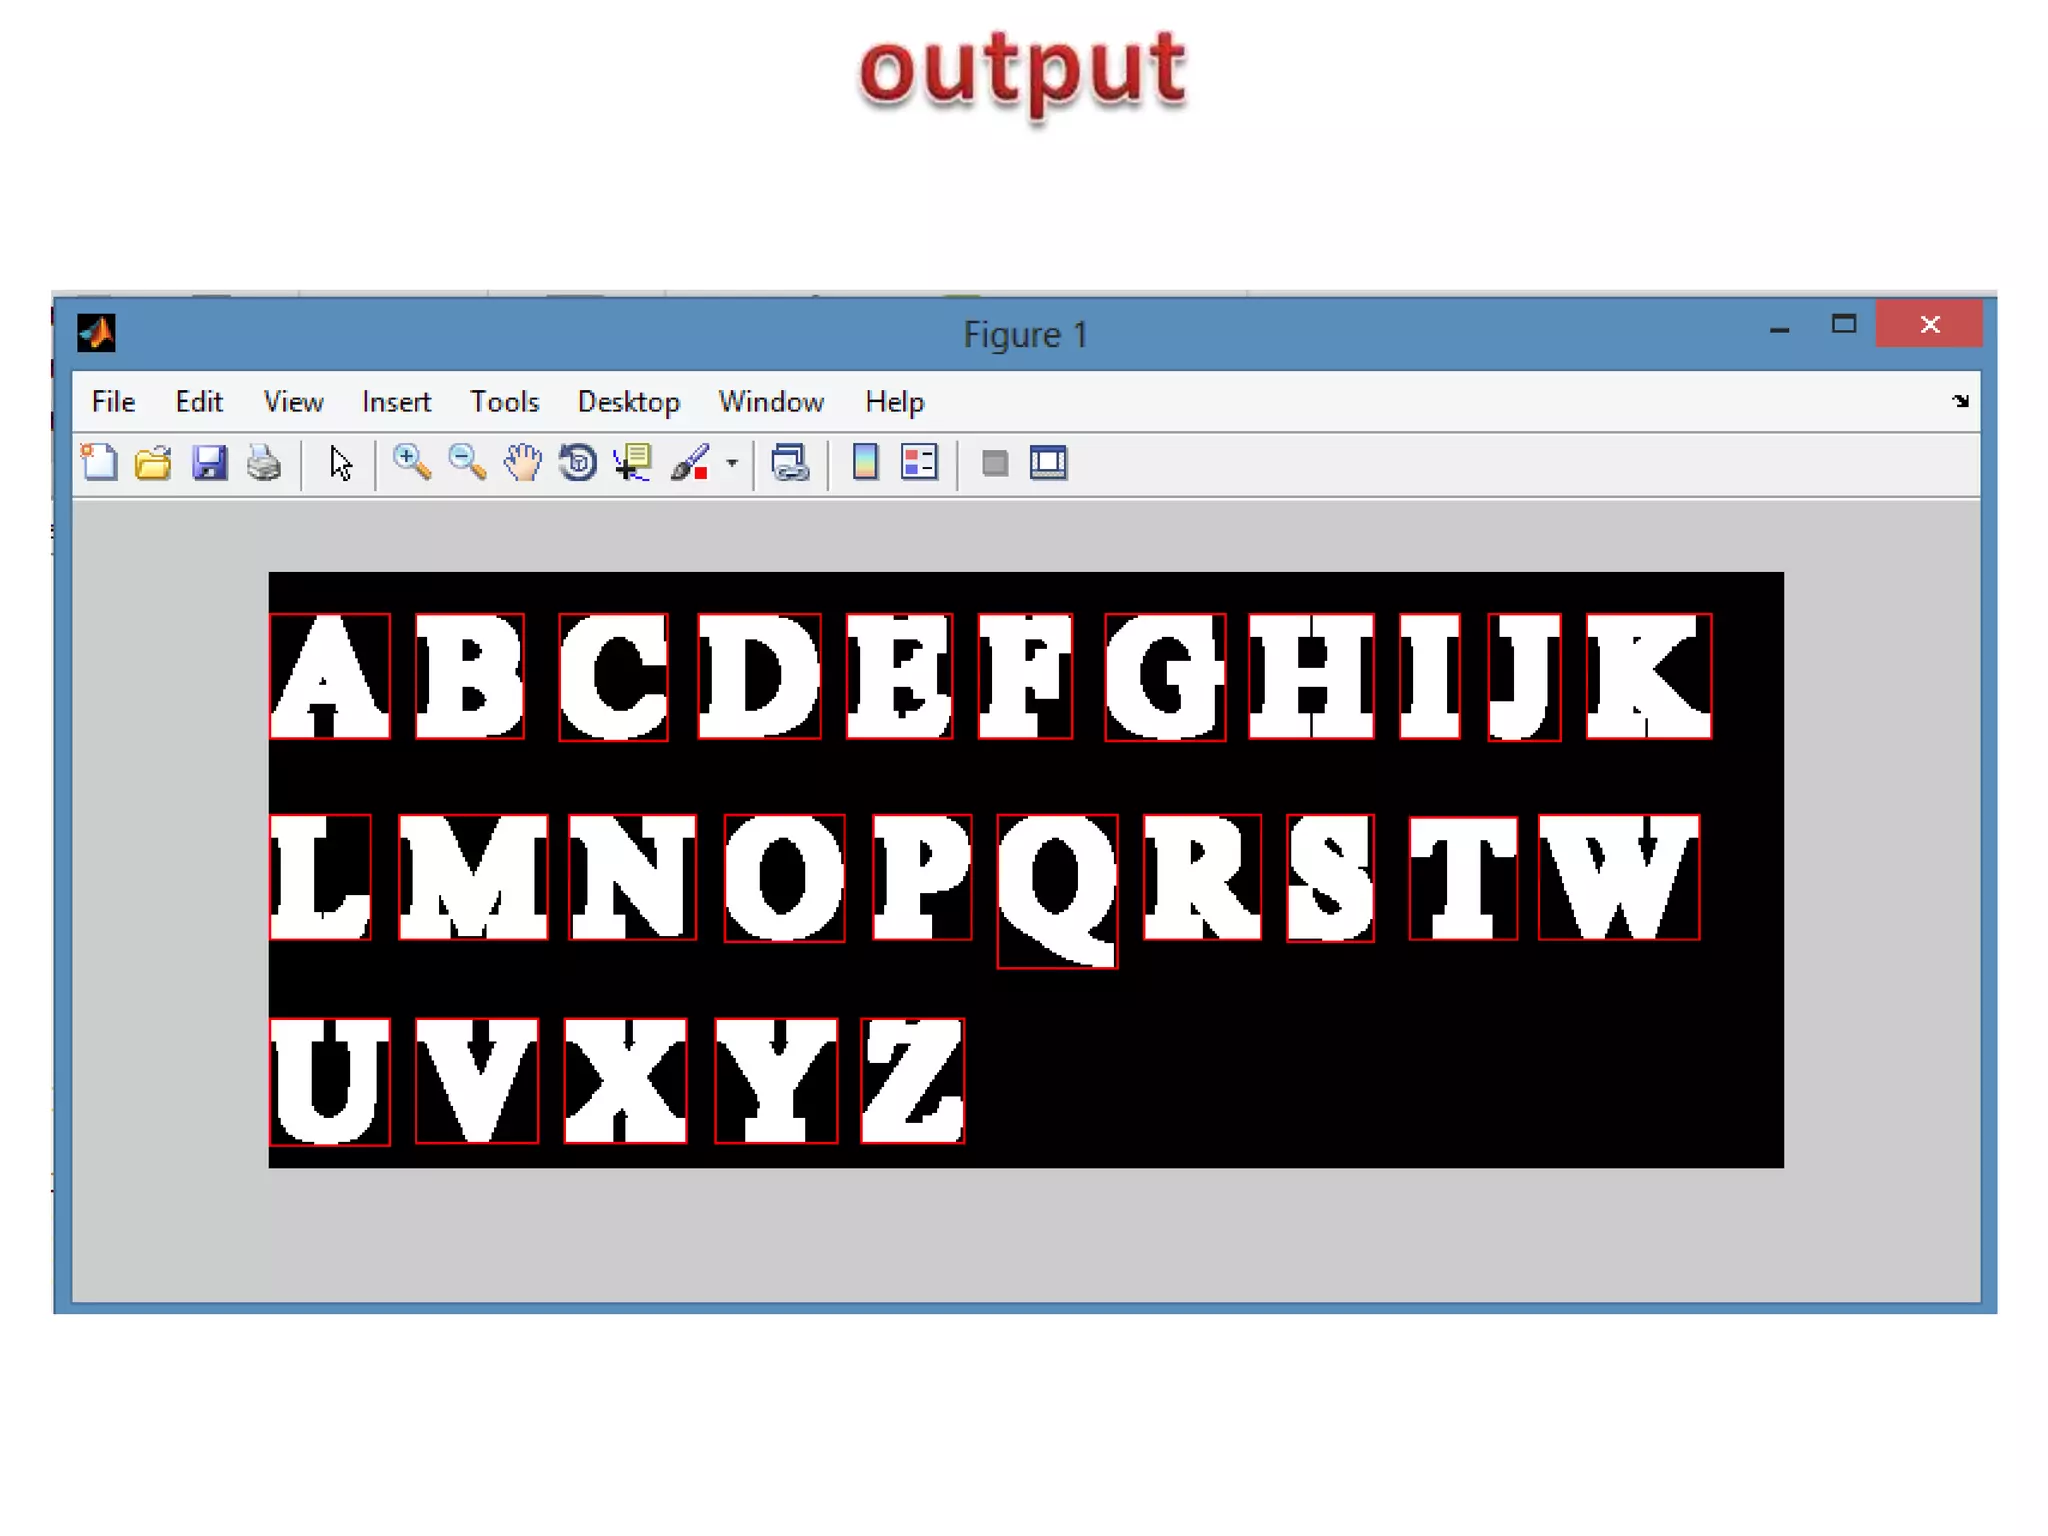
![Snippet:
a=imread('F:matlab sample imagesMYWORDS.png');
im=rgb2gray(a);
c=edge(im);
se = strel('square',8);
I= imdilate(c, se);
img=imfill(I,'holes');
figure,imshow(img);
[Ilabel num] = bwlabel(img);
disp(num);
Iprops = regionprops(Ilabel);
Ibox = [Iprops.BoundingBox];
Ibox = reshape(Ibox,[4 num]);
imshow(I)
hold on;
for cnt = 1:num
rectangle('position',Ibox(:,cnt),'edgecolor','r');
end](https://image.slidesharecdn.com/introtomachinevision-140424012534-phpapp01/85/Introduction-to-Image-Processing-with-MATLAB-36-320.jpg)

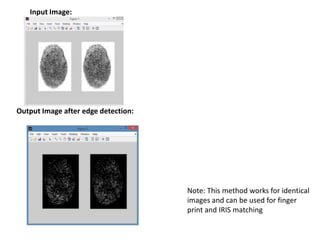


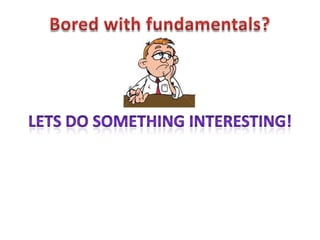
![Input image:
Output image(Extracted blue objects):
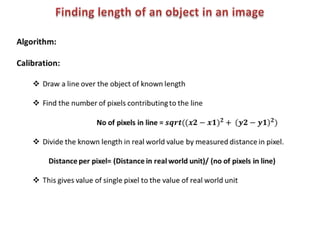
Snippet:
c=imread('F:matlab sample images1.png');
[m,n,t]=size(c);
tmp=zeros(m,n);
for i=1:m
for j=1:n
if(c(i,j,1)==0 && c(i,j,2)==0 && c(i,j,3)==255)
tmp(i,j)=1;
end
end
end
imshow(tmp);](https://image.slidesharecdn.com/introtomachinevision-140424012534-phpapp01/75/Introduction-to-Image-Processing-with-MATLAB-23-2048.jpg)


![Input image:
Output image(Extracted red objects):
Snippet:
c=imread('F:matlab sample
images1.png');
[m,n,t]=size(c);
tmp=zeros(m,n);
for i=1:m
for j=1:n
if(c(i,j,1)==255 && c(i,j,2)==0 &&
c(i,j,3)==0)
tmp(i,j)=1;
end
end
end
imshow(tmp);
ss=bwboundaries(tmp);
num=length(ss);
Output: num = 3](https://image.slidesharecdn.com/introtomachinevision-140424012534-phpapp01/75/Introduction-to-Image-Processing-with-MATLAB-26-2048.jpg)
![Snippet:
a=imread('F:matlab sample imagesMYWORDS.png');
im=rgb2gray(a);
c=edge(im);
se = strel('square',8);
I= imdilate(c, se);
img=imfill(I,'holes');
figure,imshow(img);
[Ilabel num] = bwlabel(img);
disp(num);
Iprops = regionprops(Ilabel);
Ibox = [Iprops.BoundingBox];
Ibox = reshape(Ibox,[4 num]);
imshow(I)
hold on;
for cnt = 1:num
rectangle('position',Ibox(:,cnt),'edgecolor','r');
end](https://image.slidesharecdn.com/introtomachinevision-140424012534-phpapp01/75/Introduction-to-Image-Processing-with-MATLAB-36-2048.jpg)


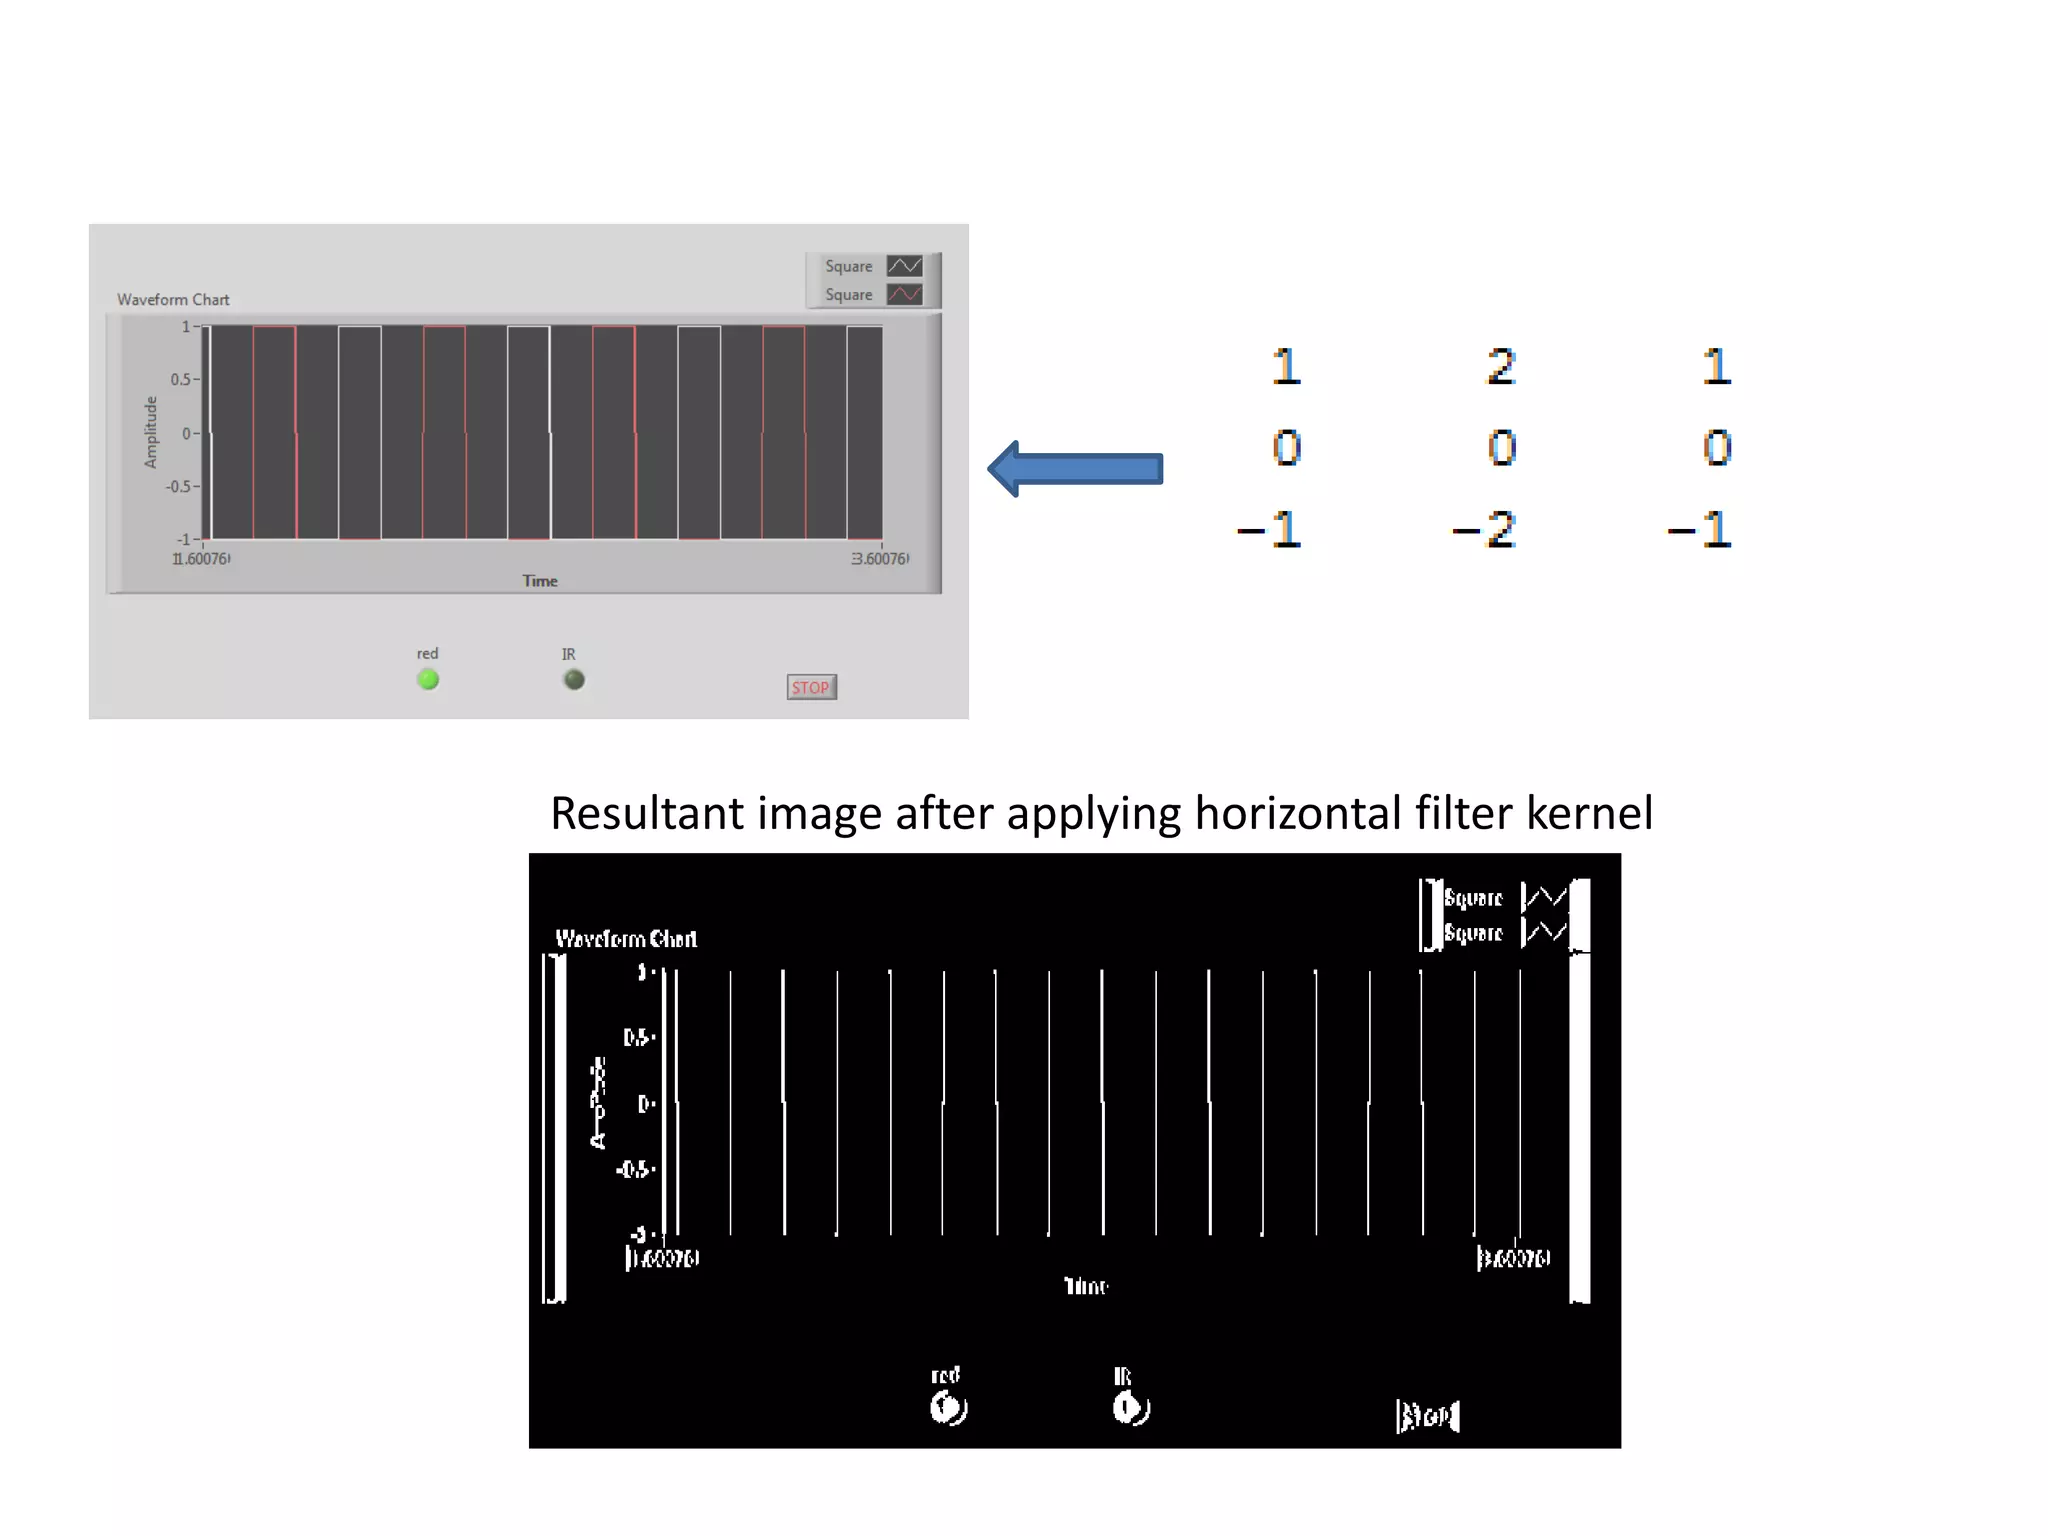
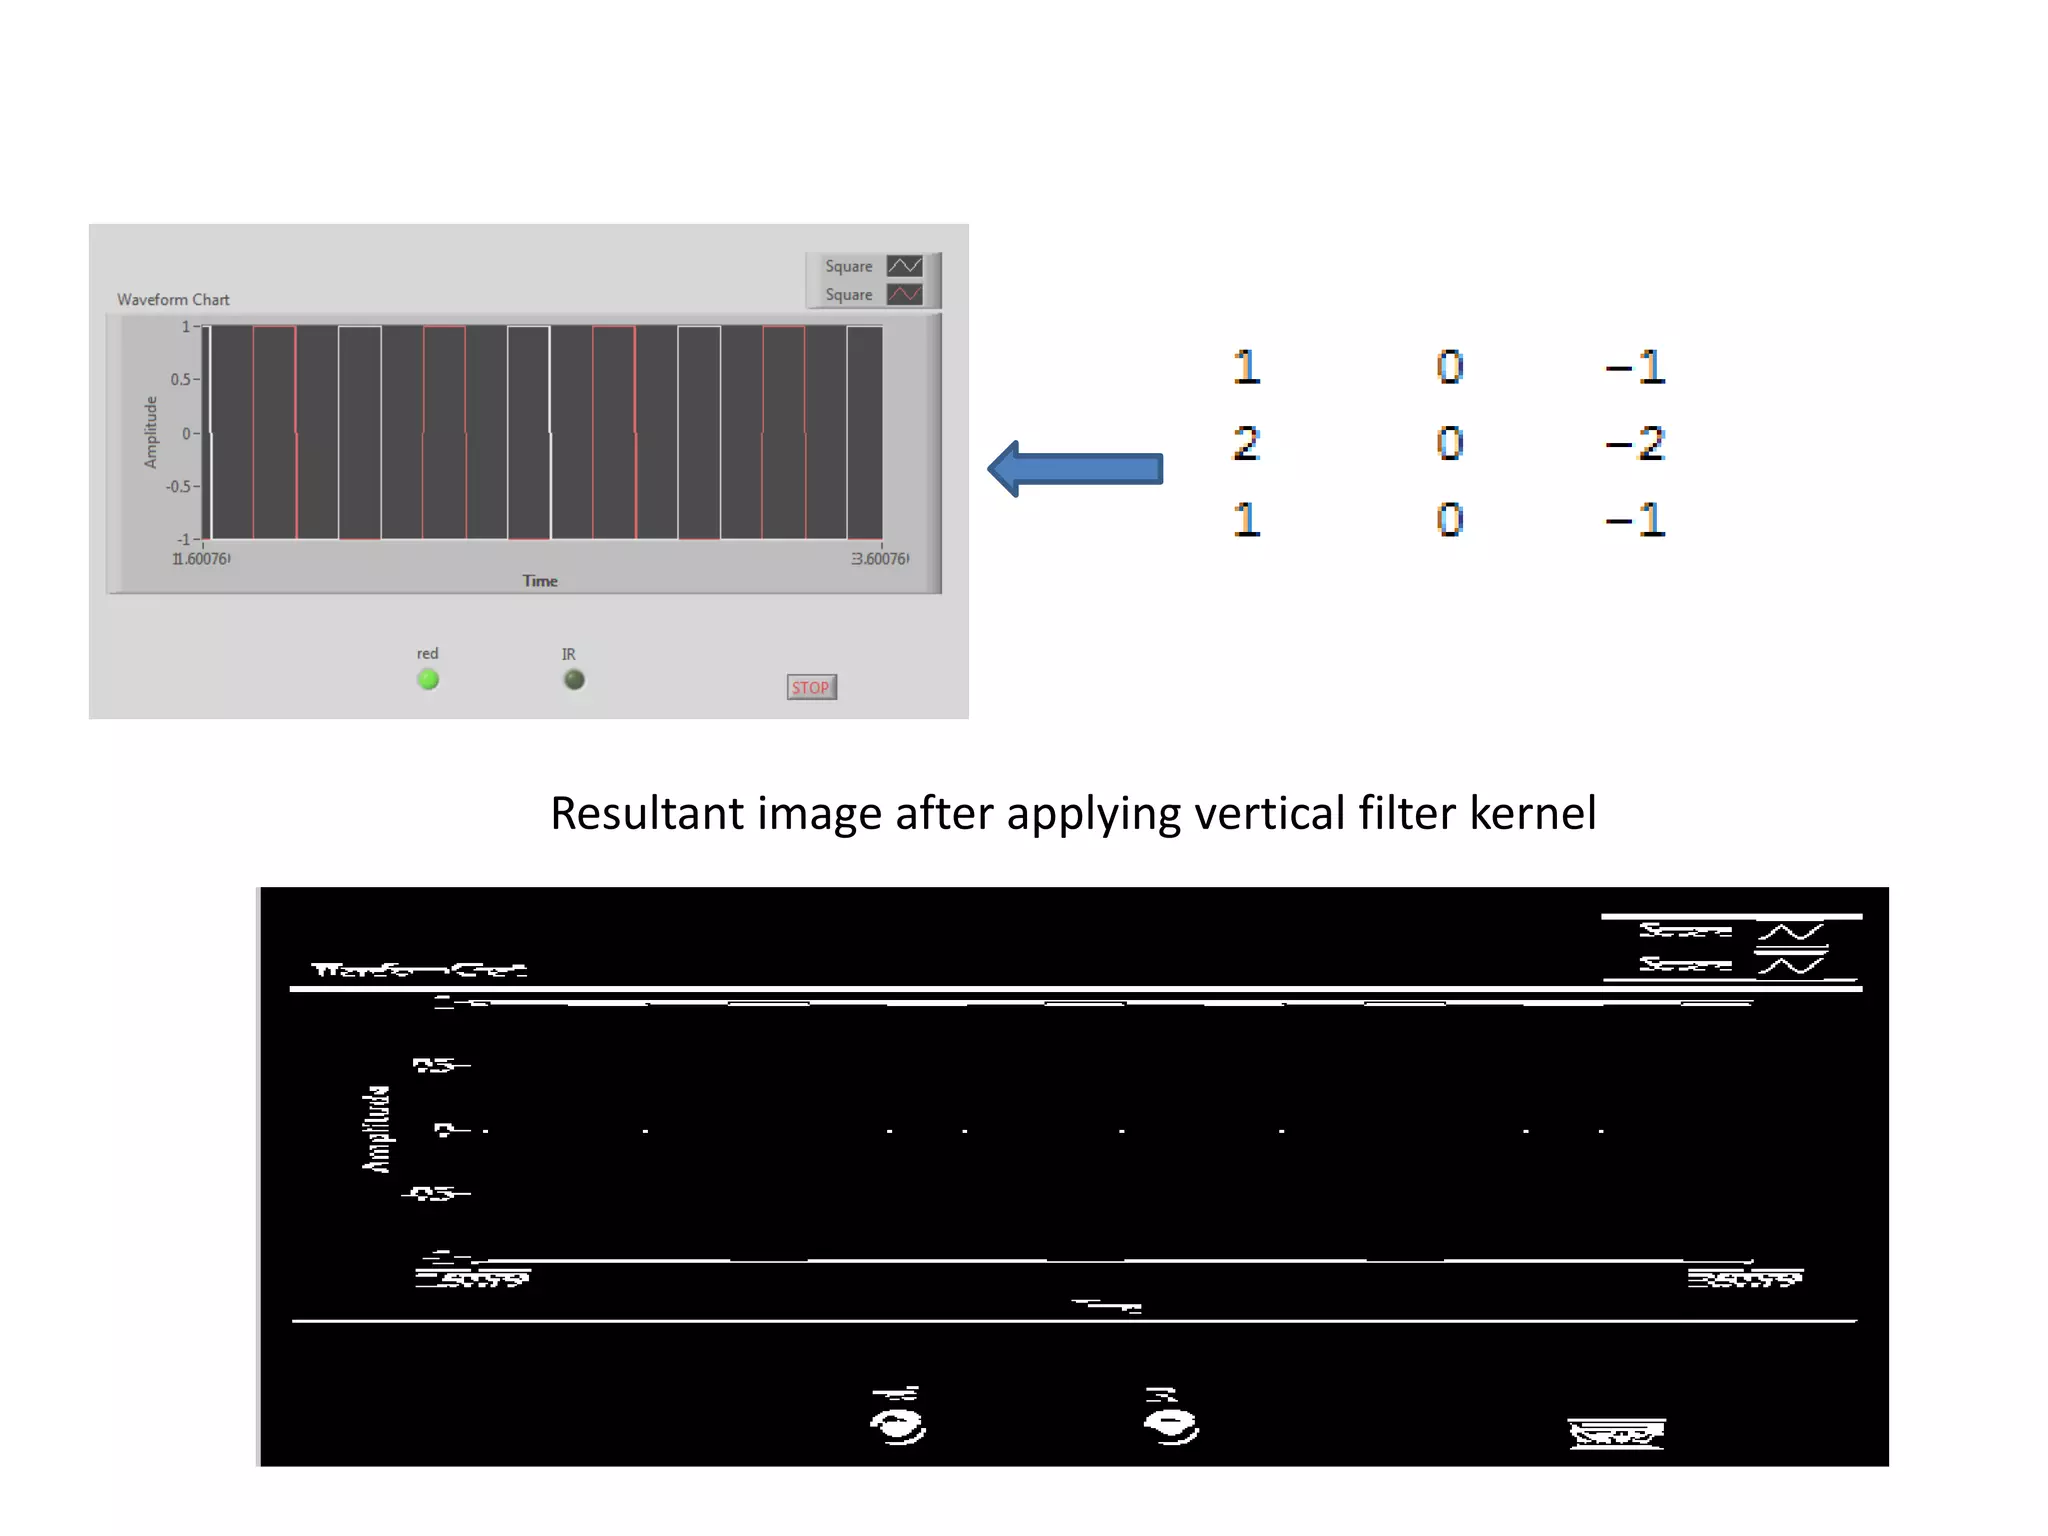

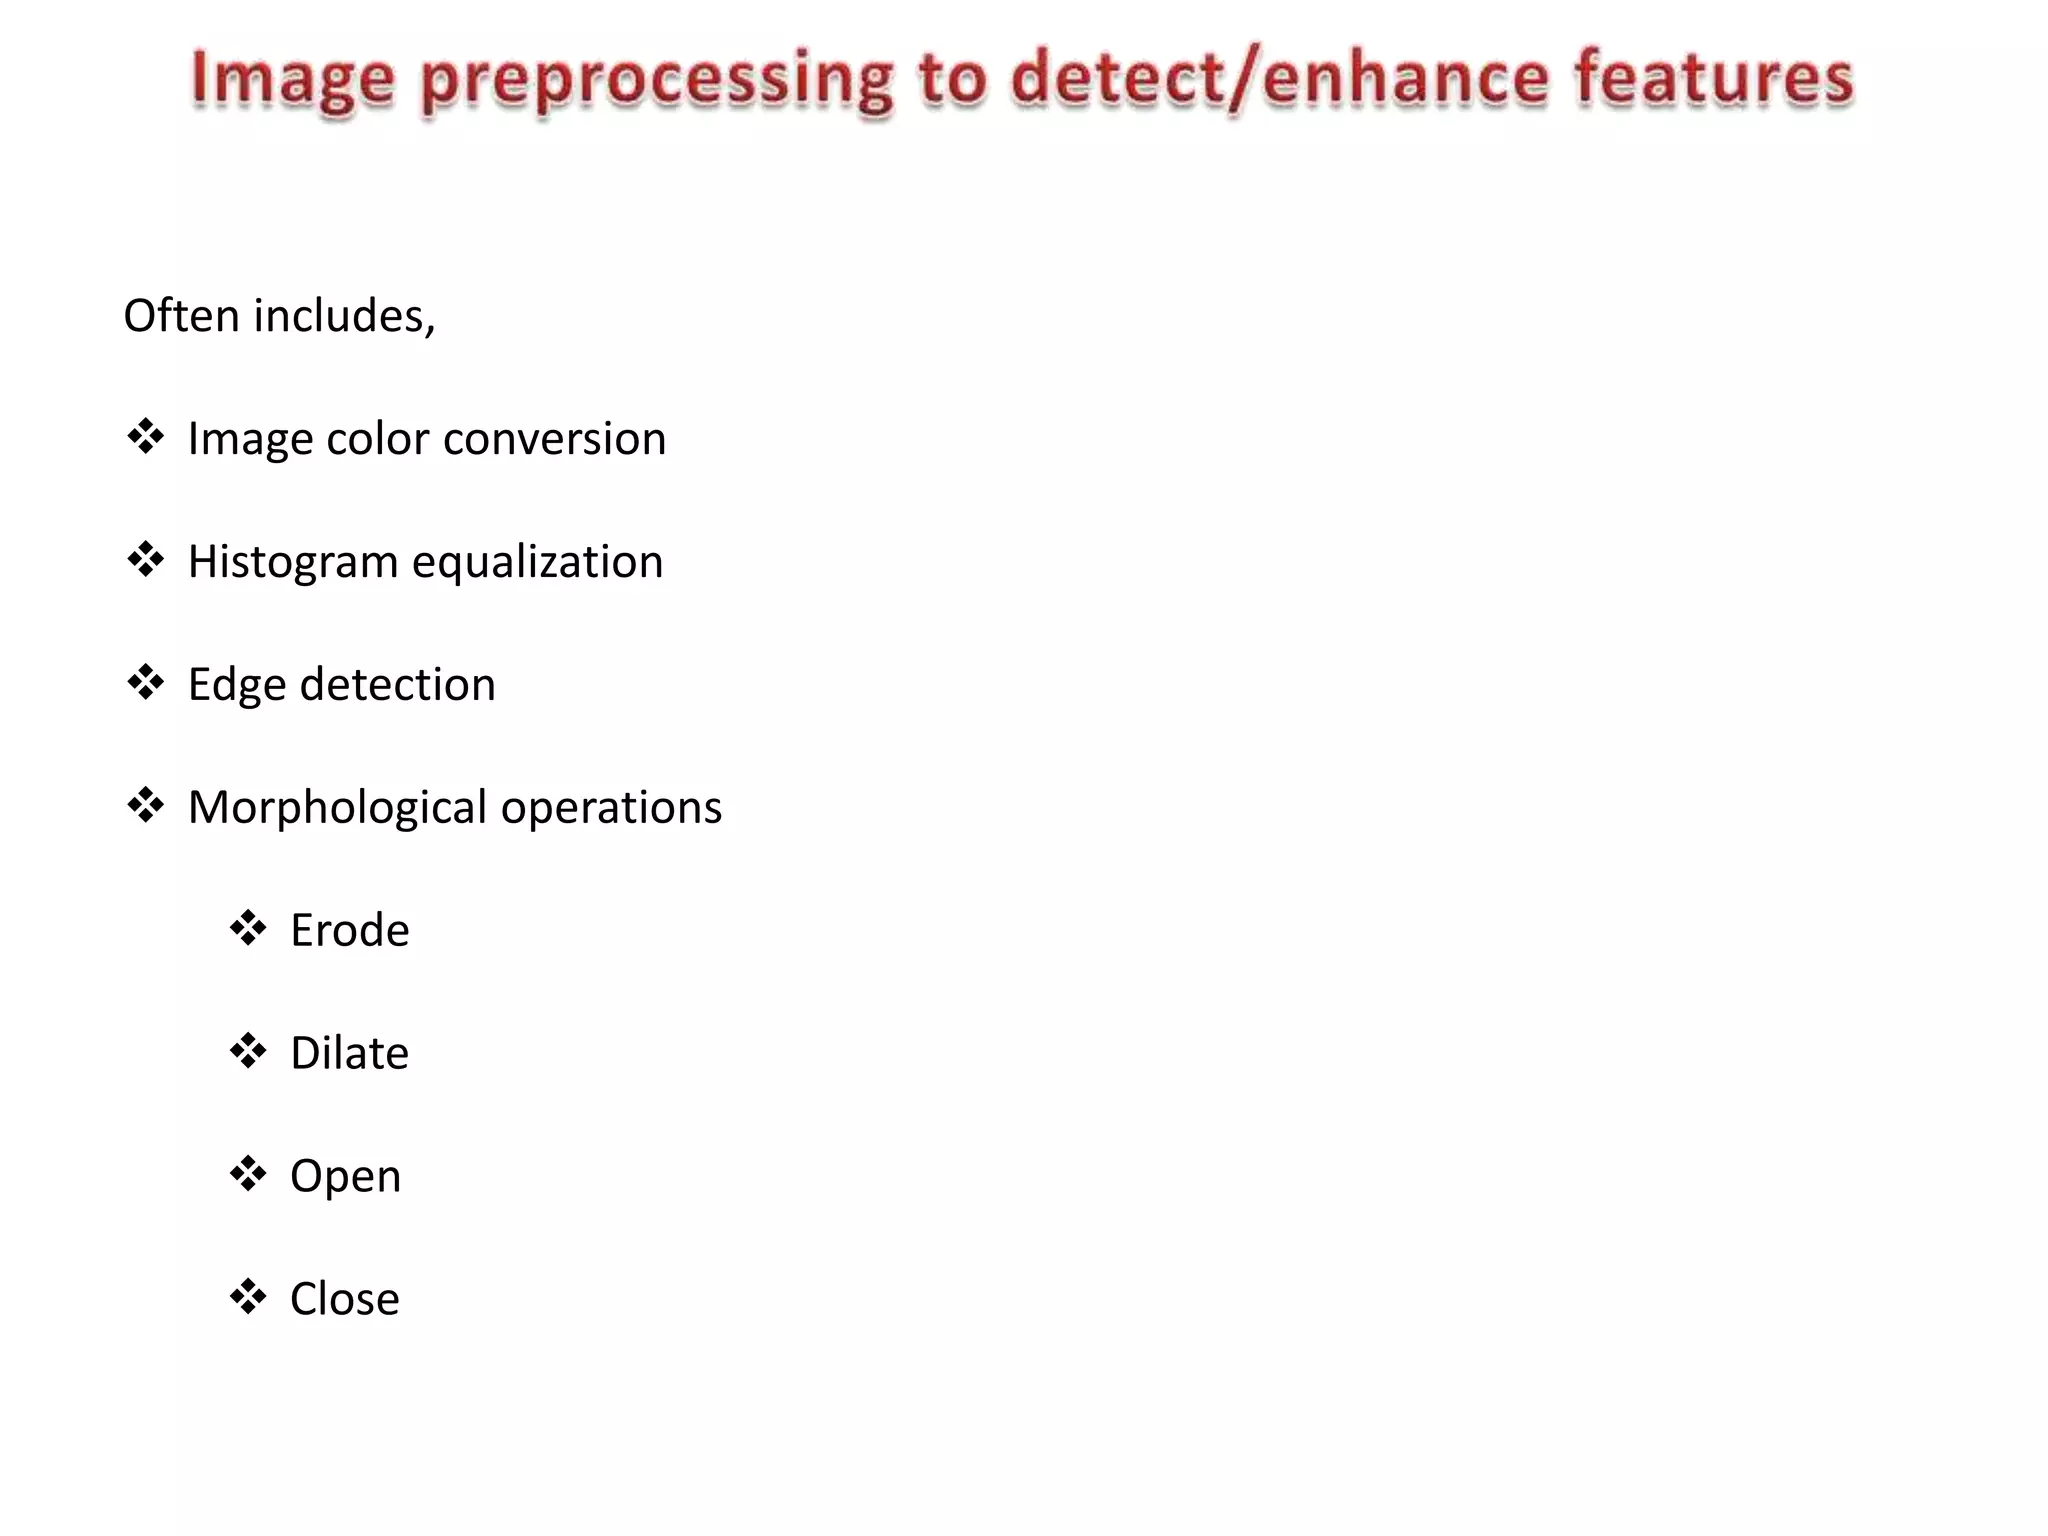
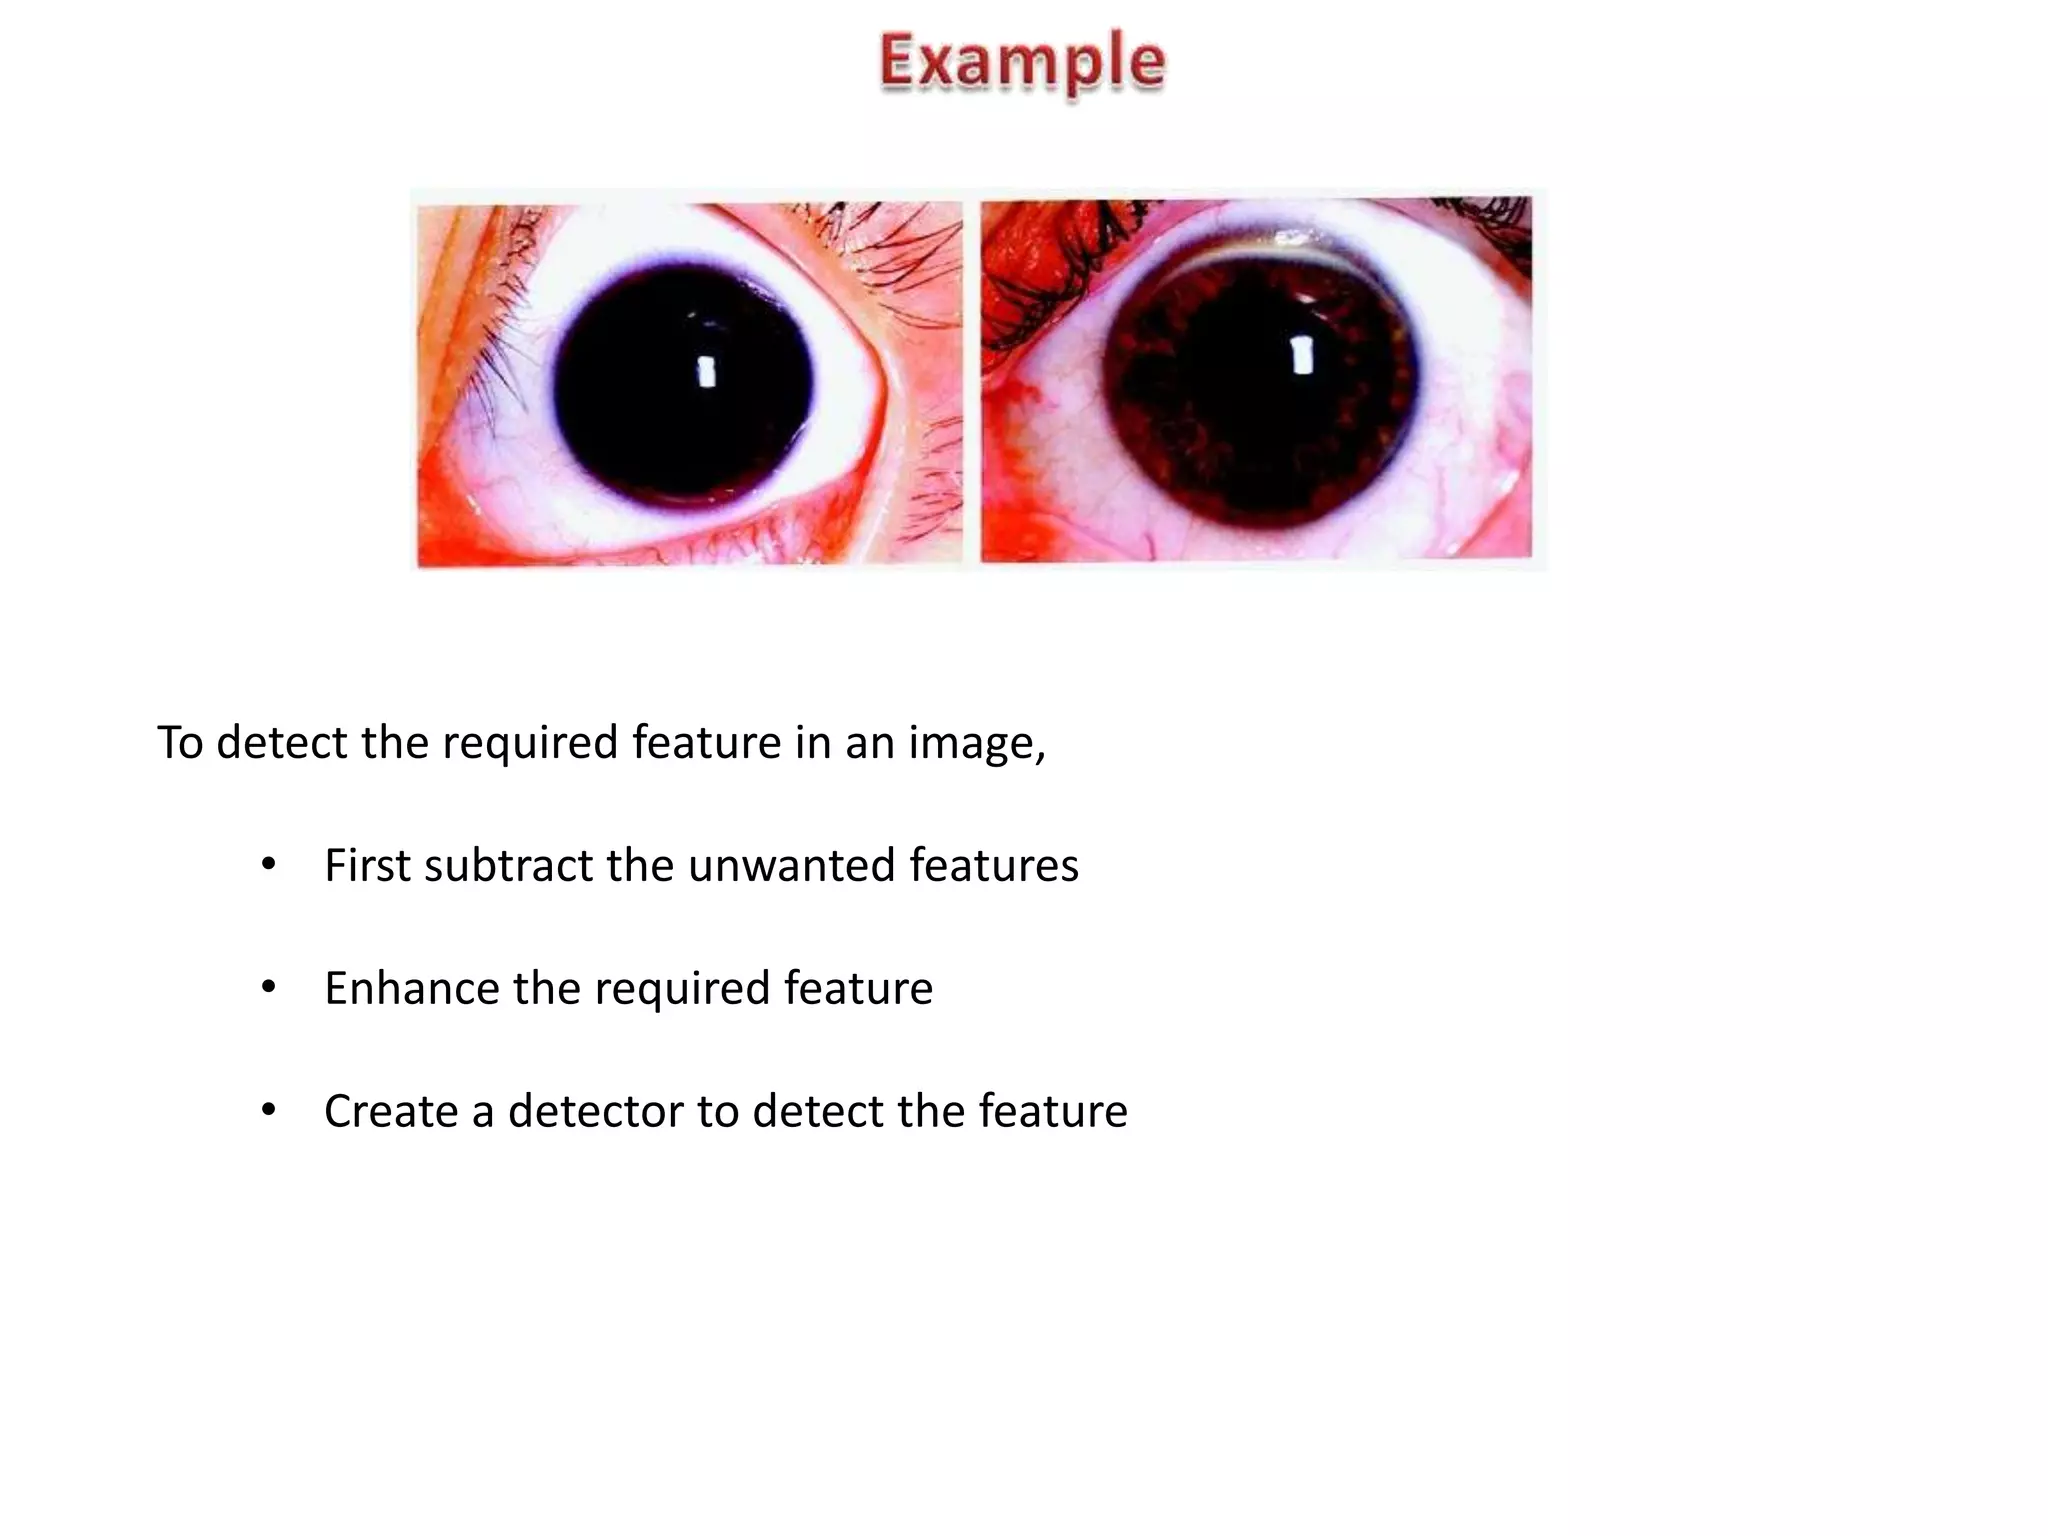
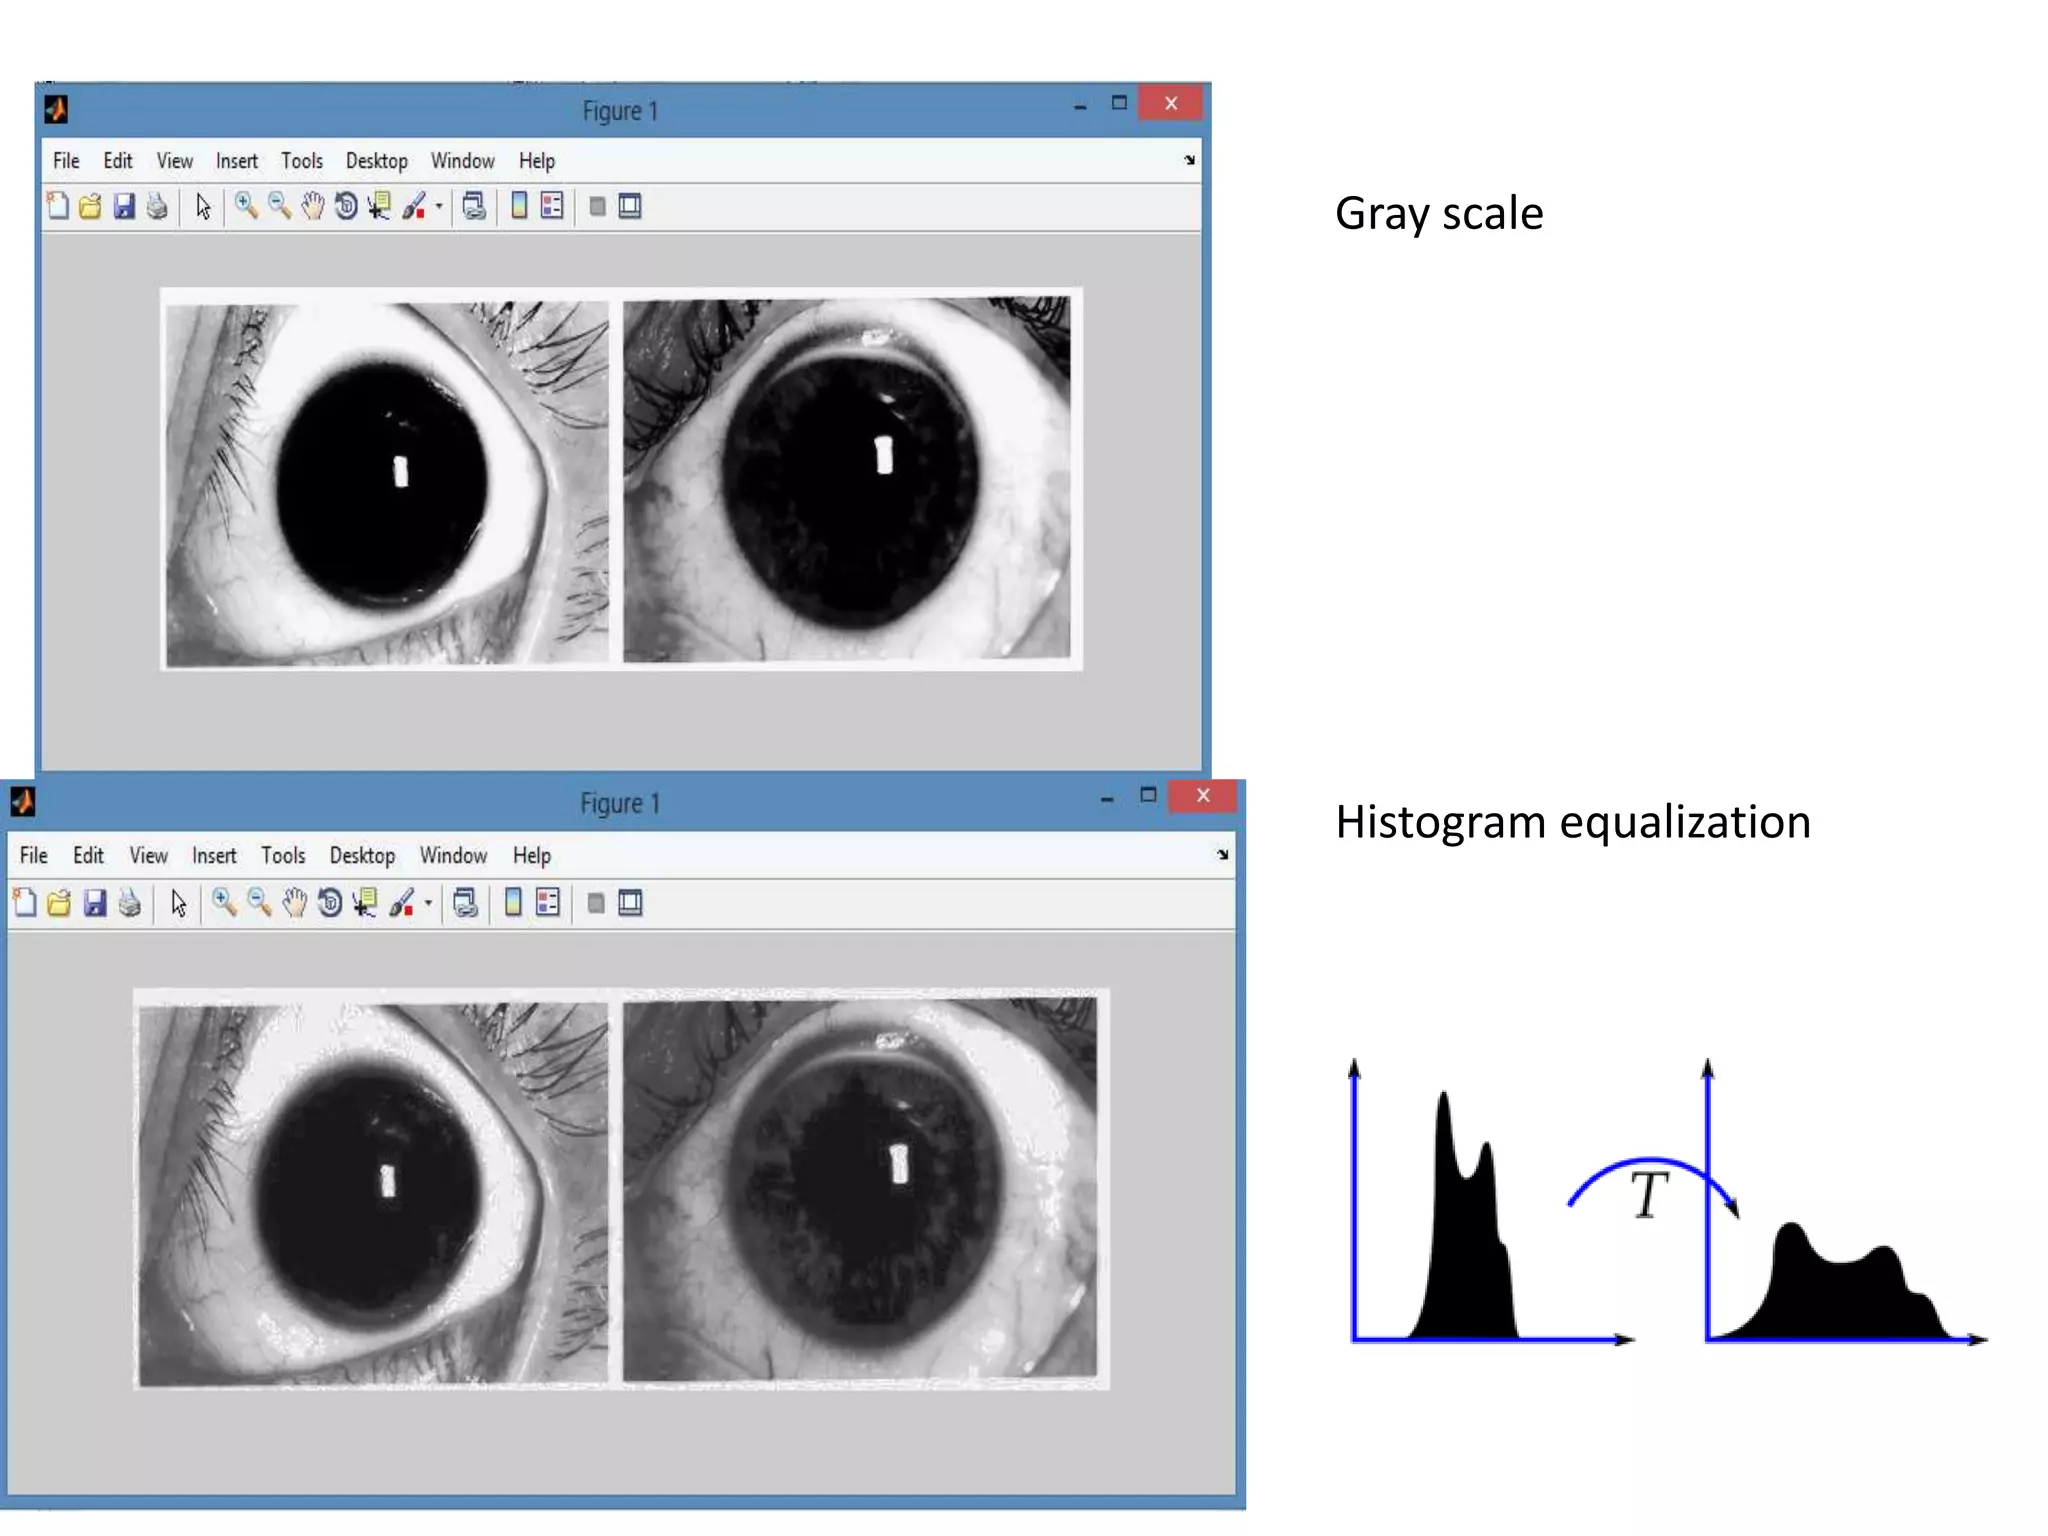
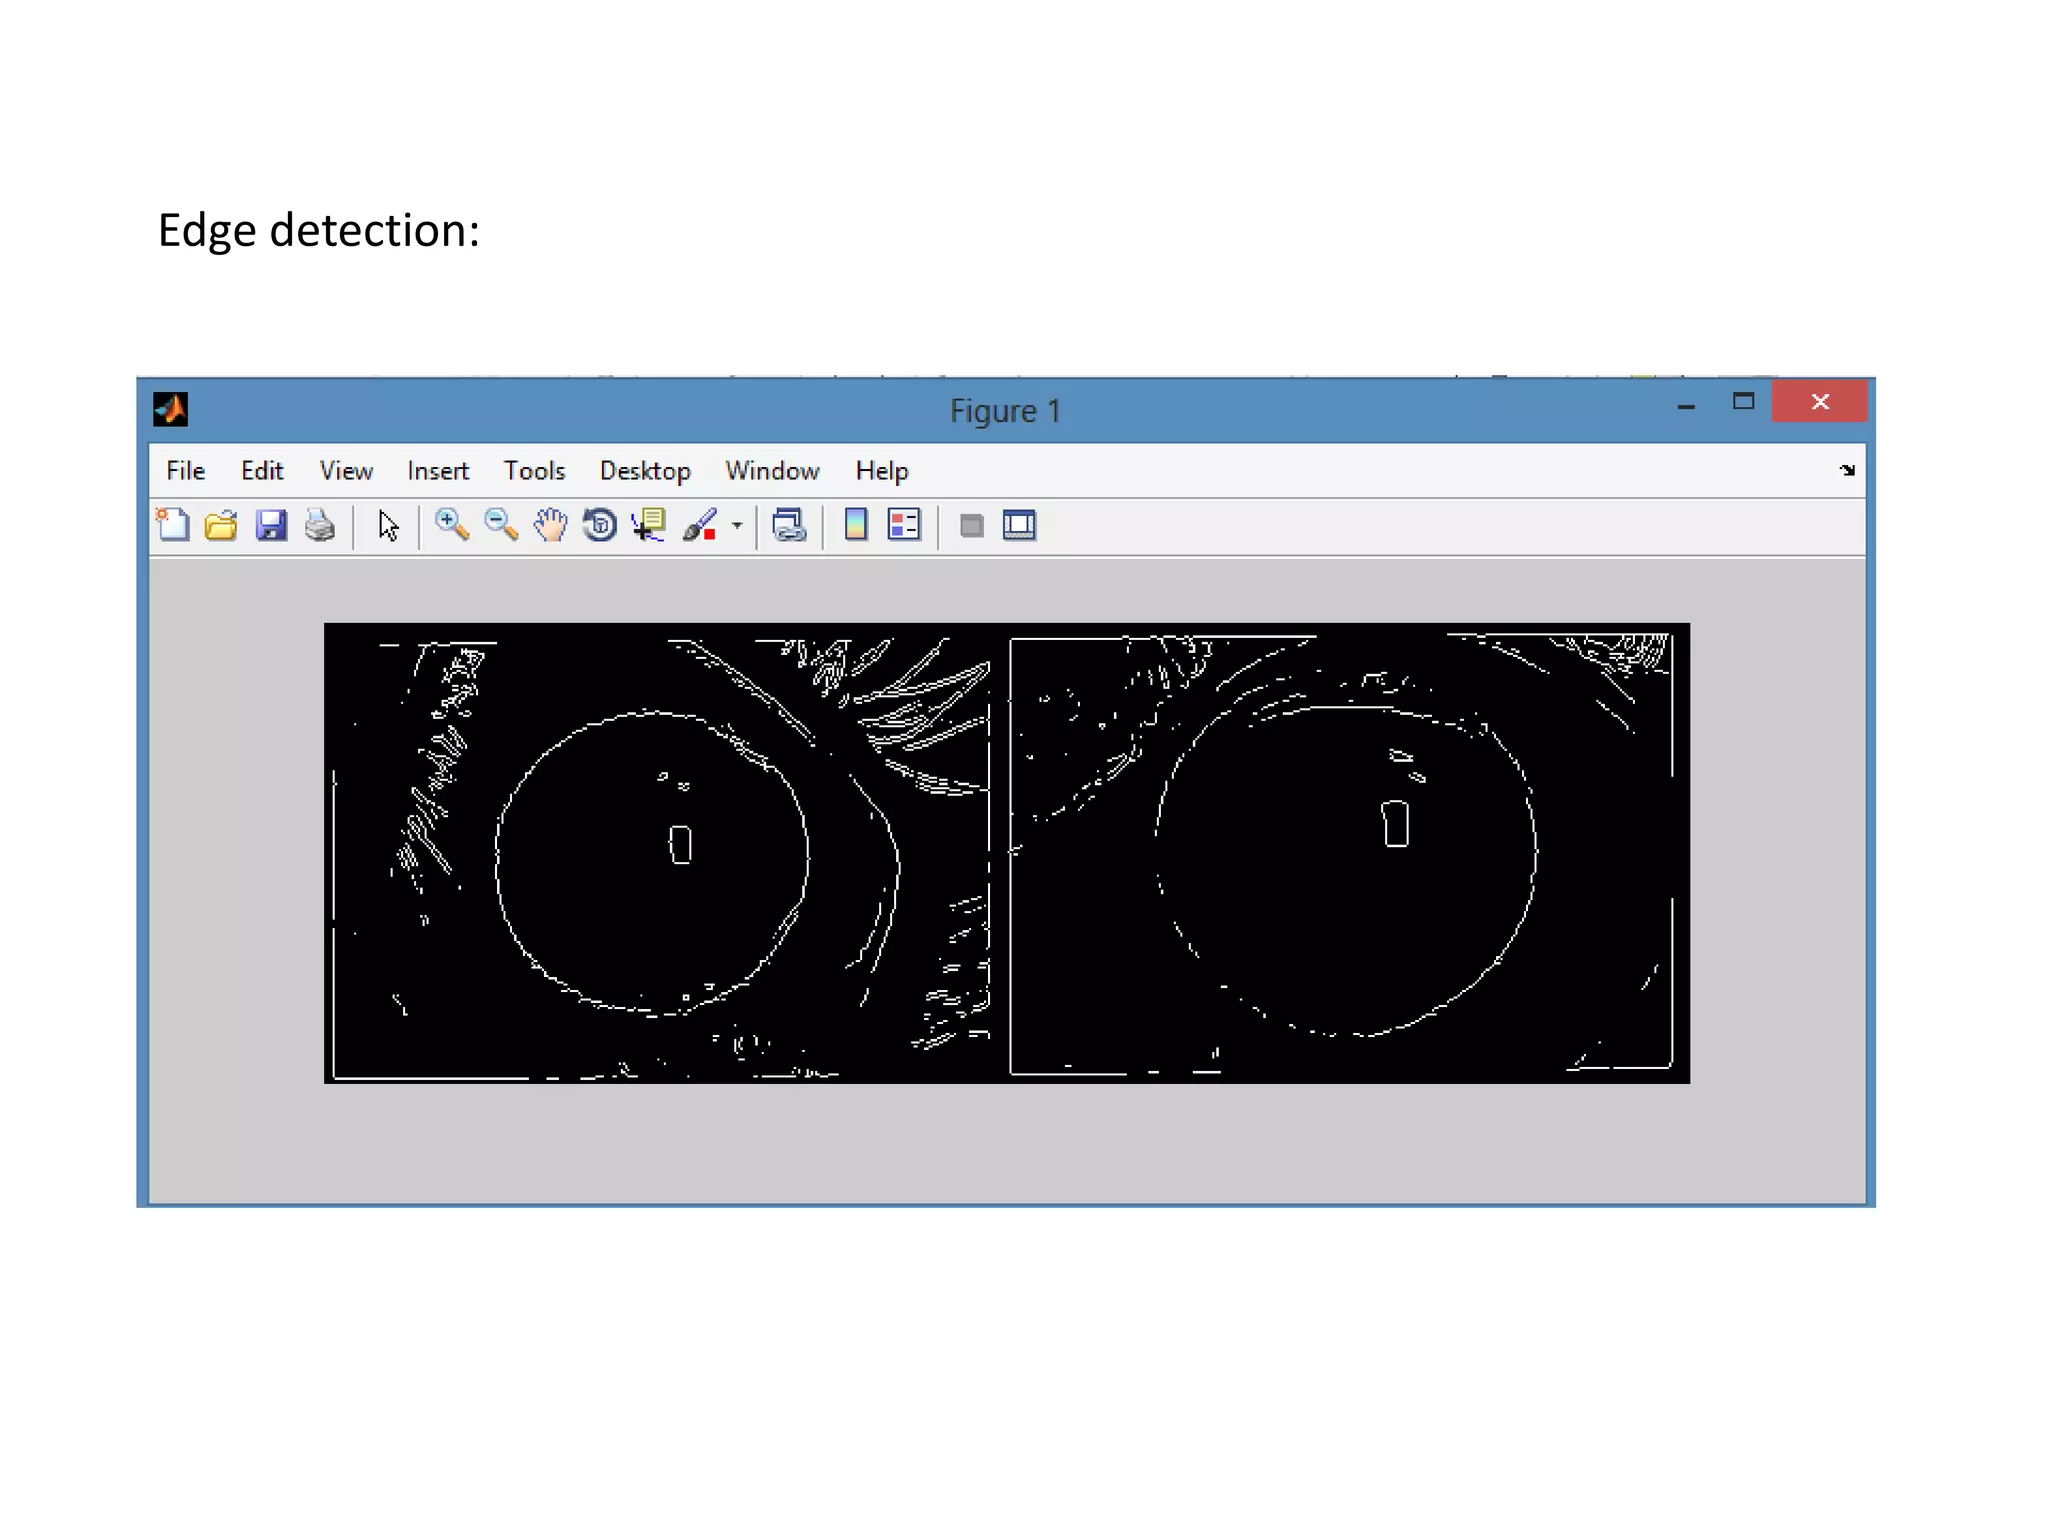
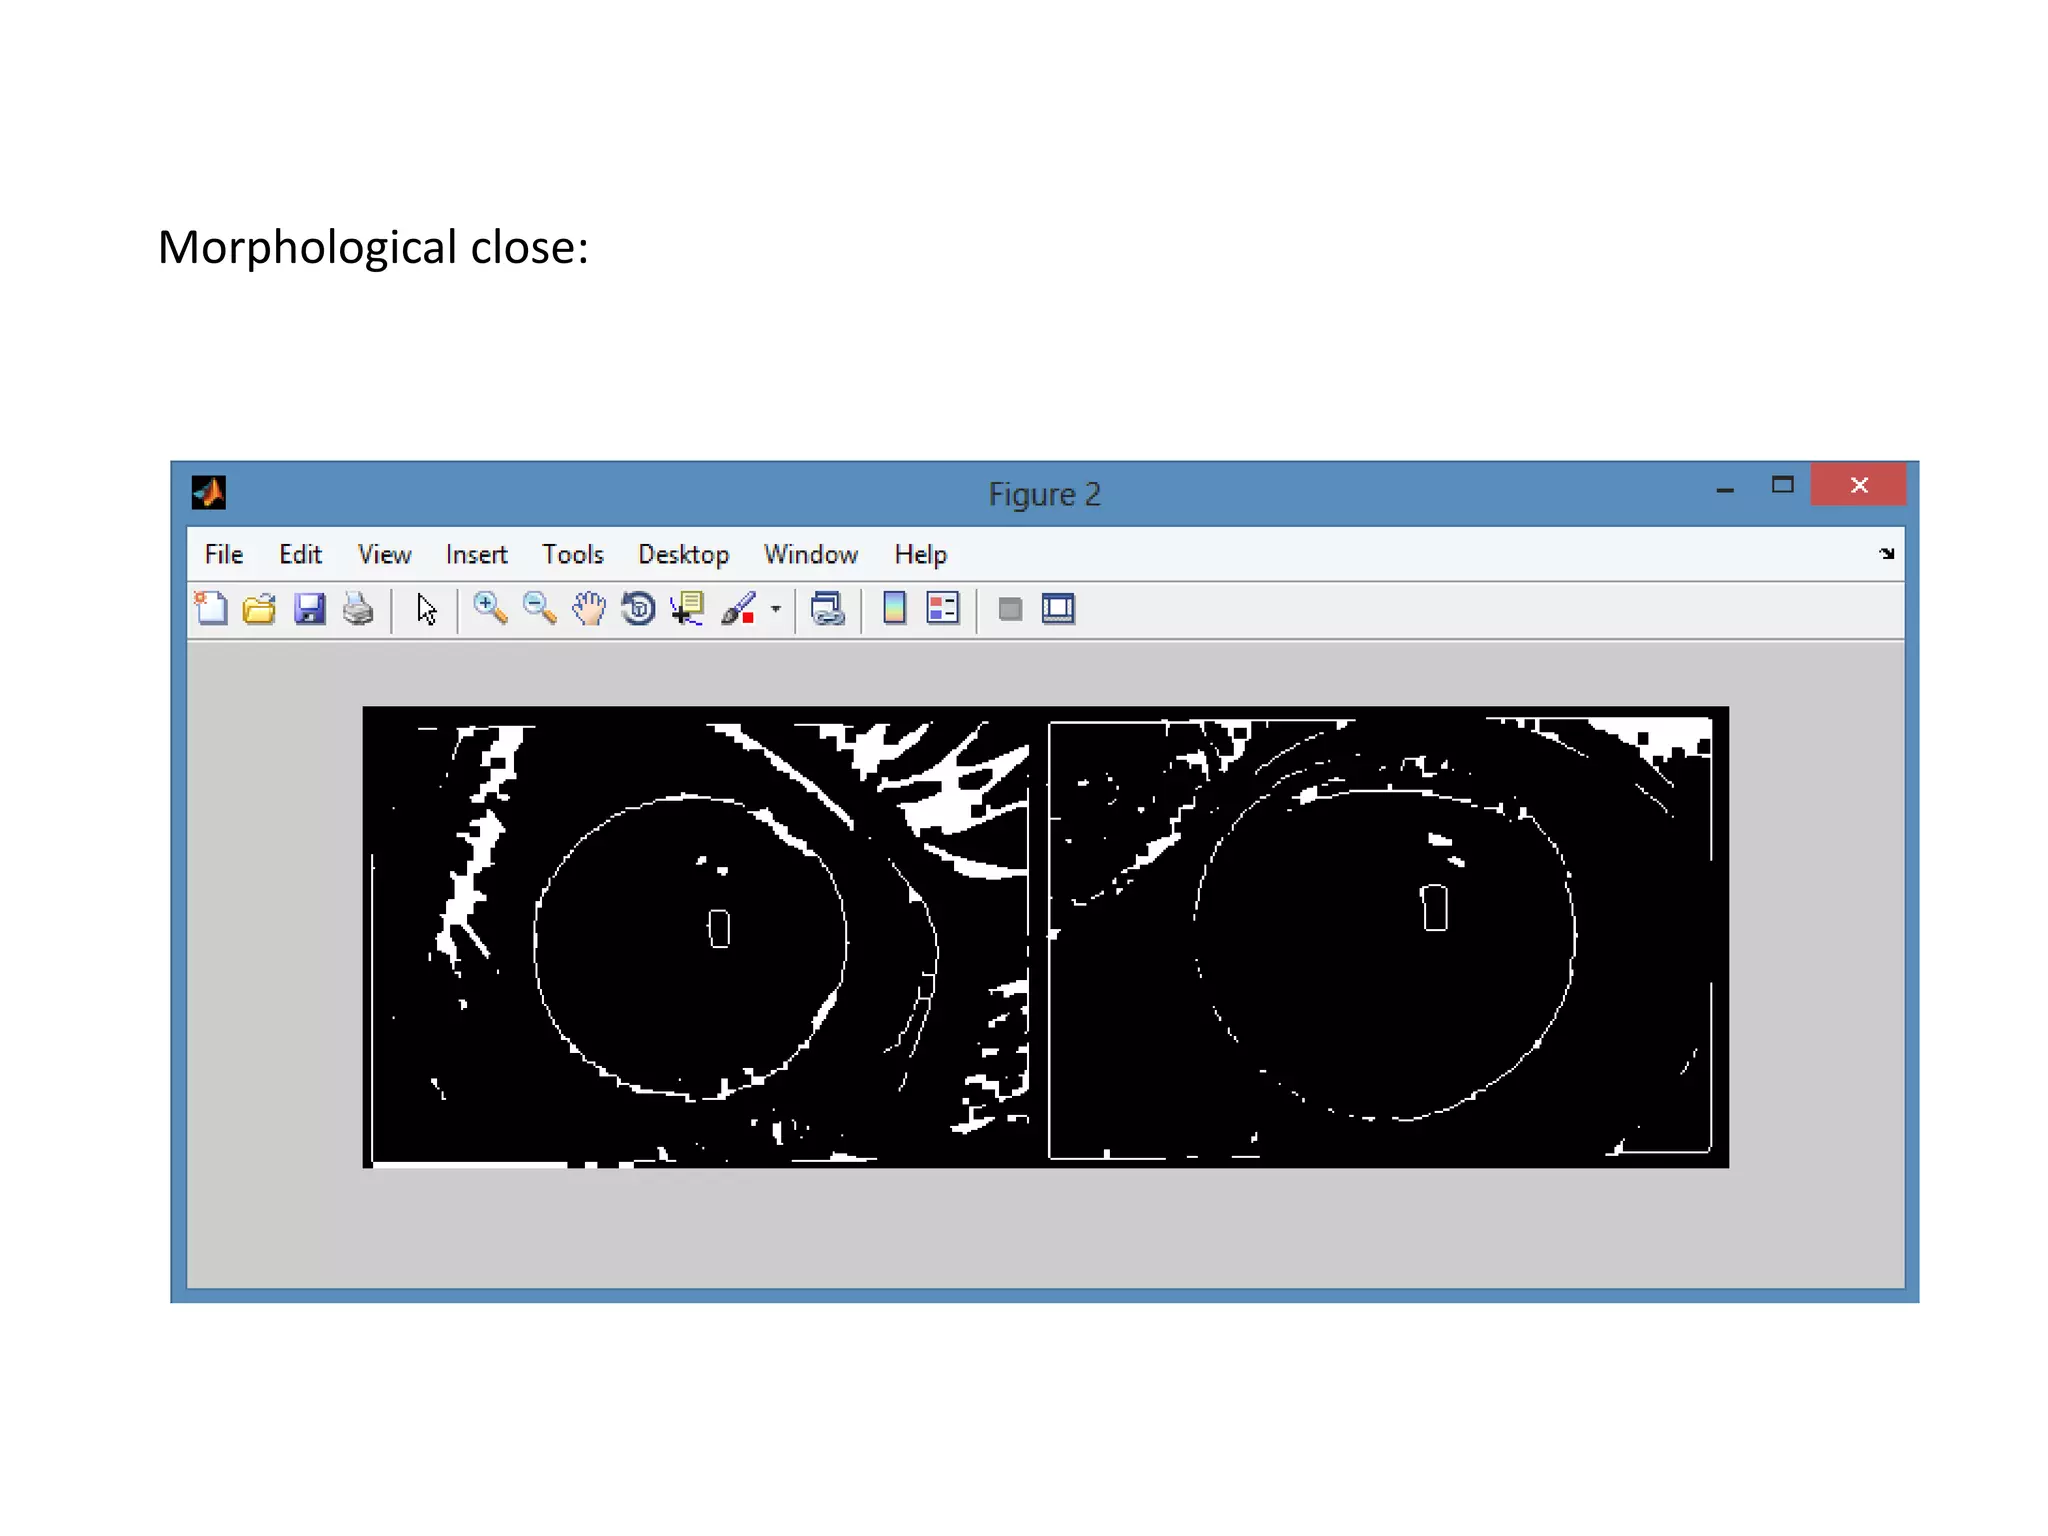
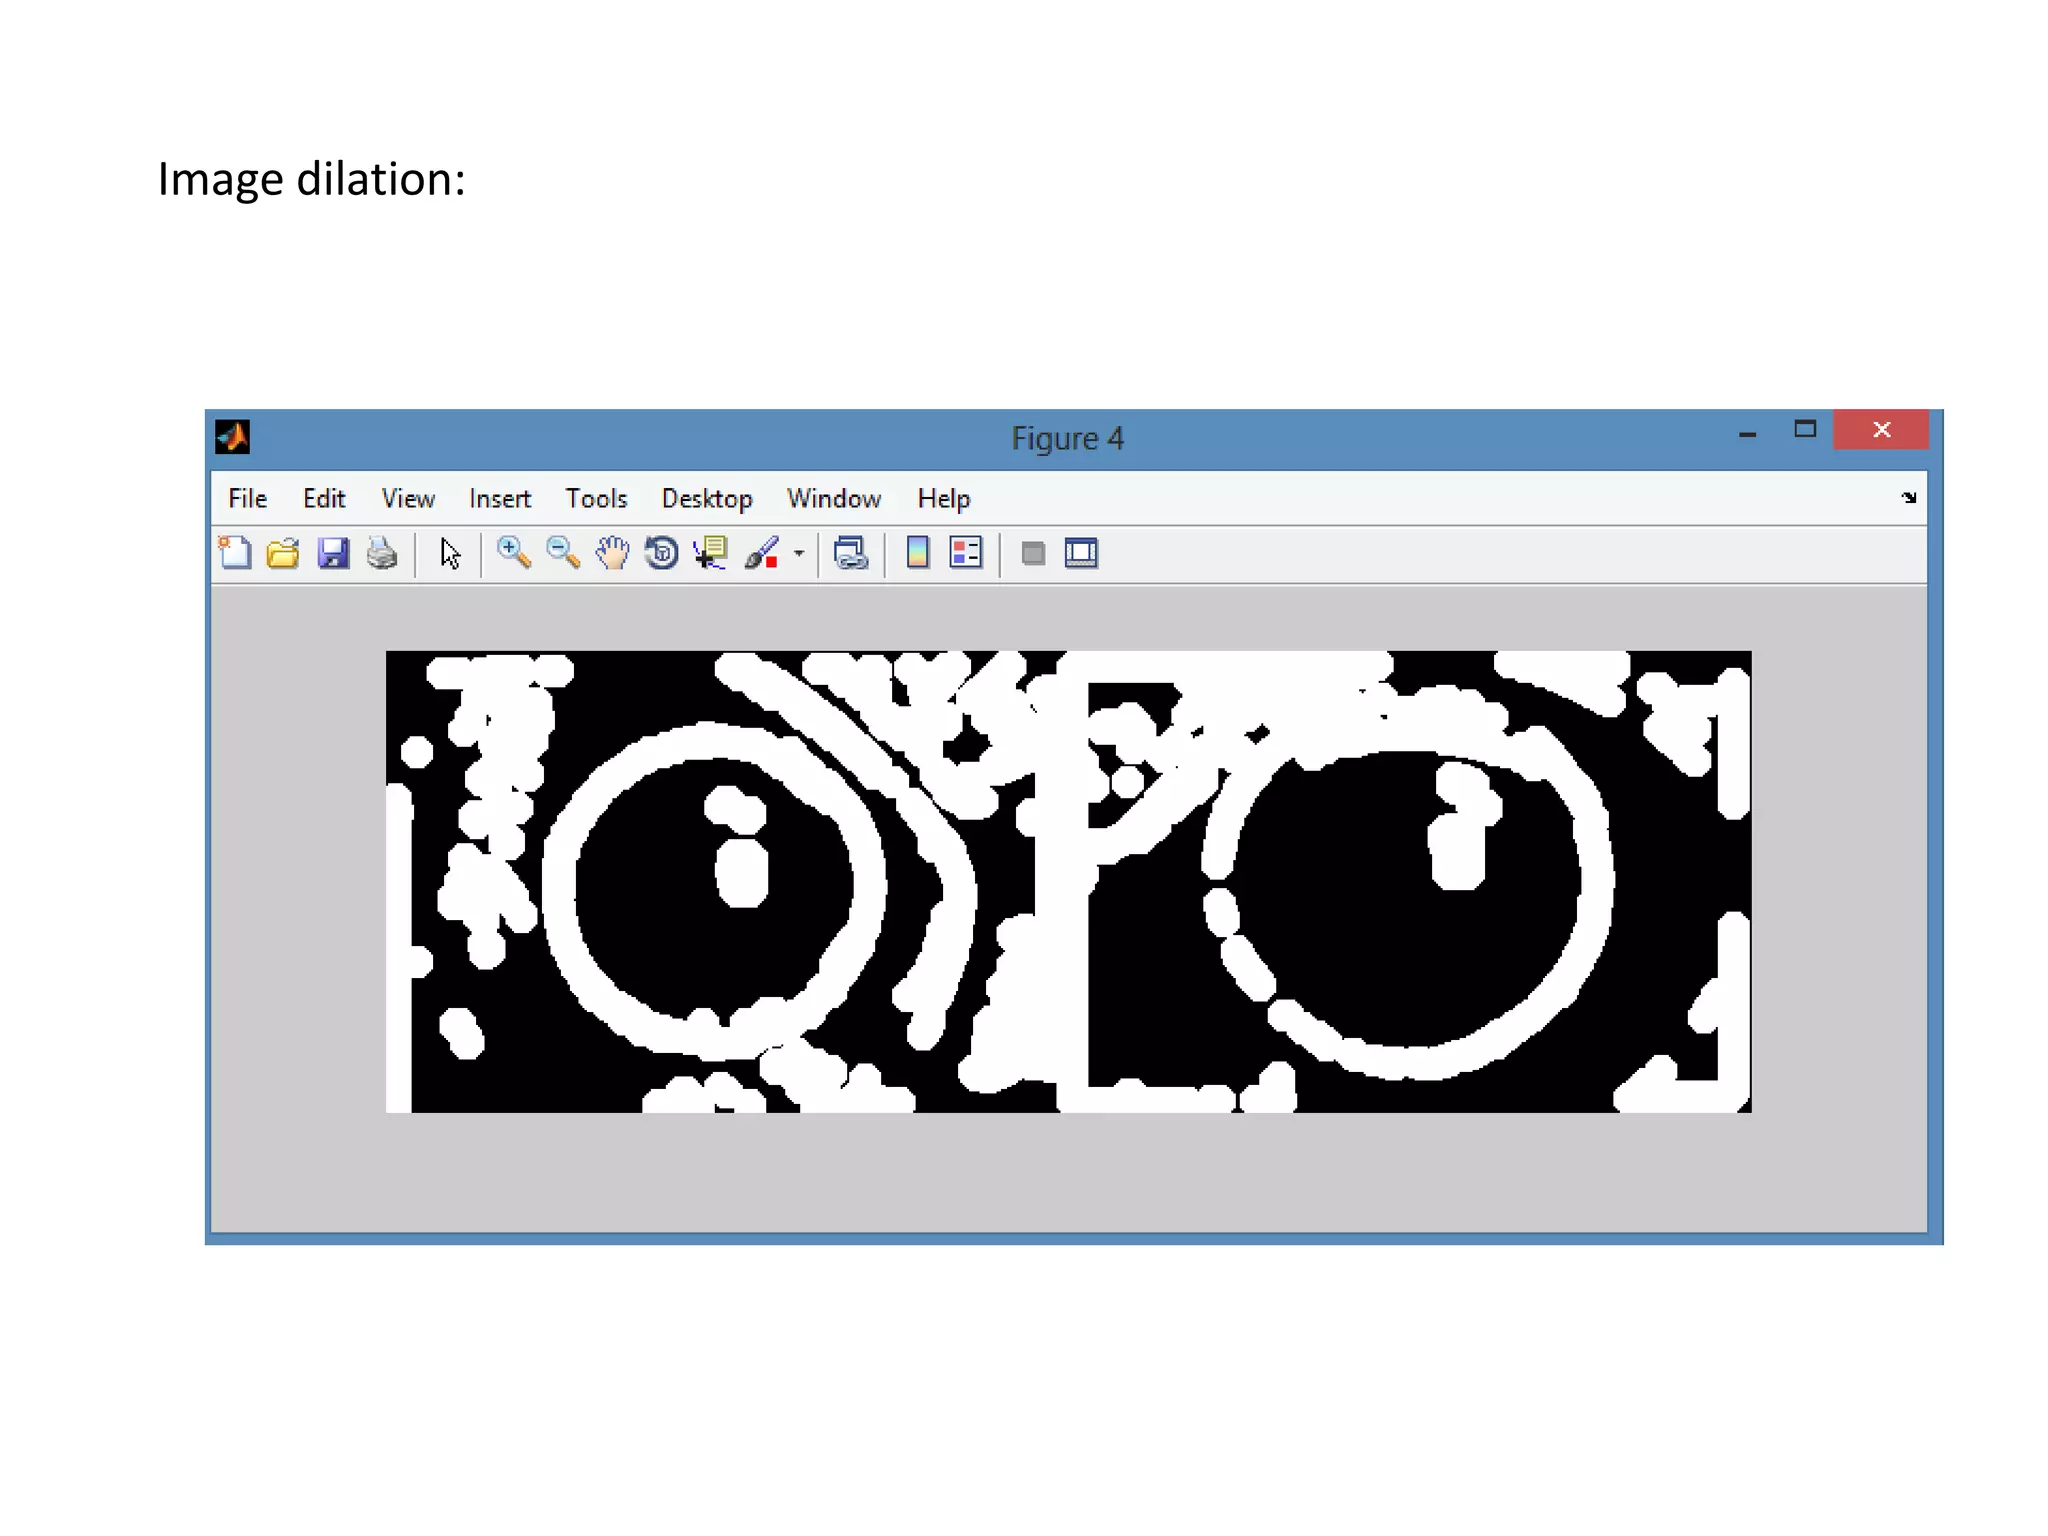

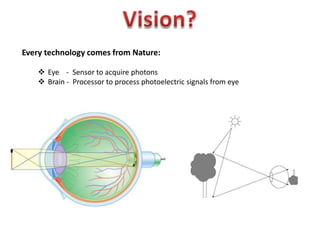
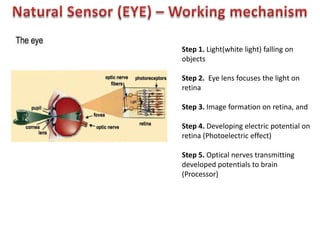
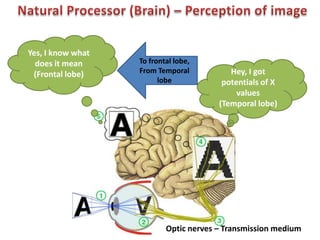
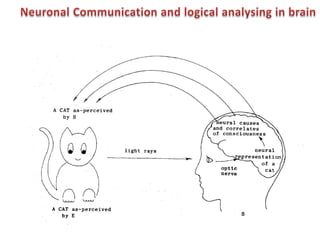
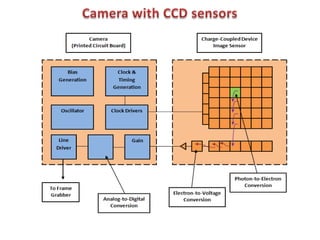
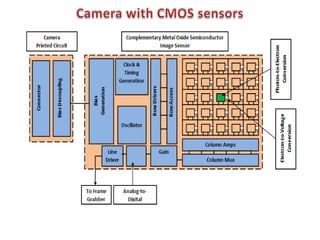
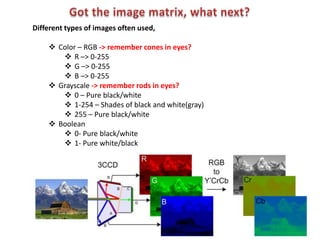
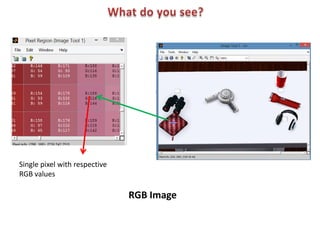
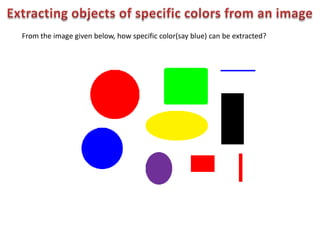
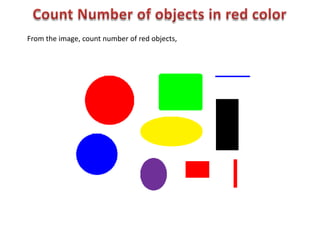
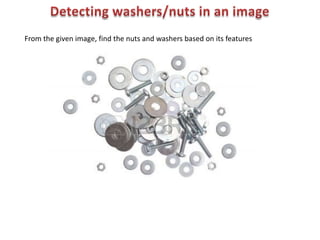
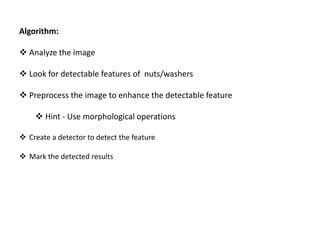
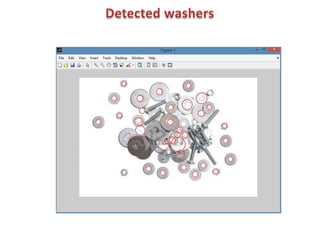
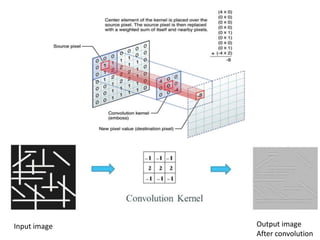
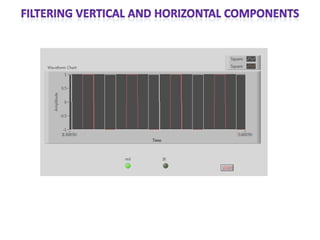
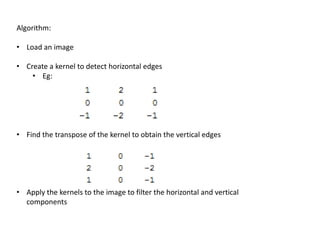
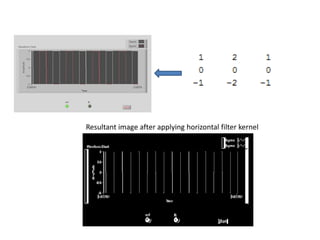
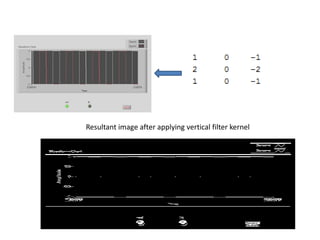
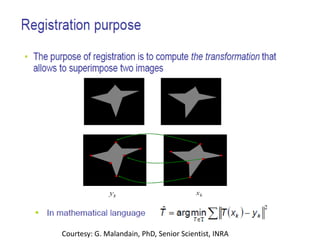
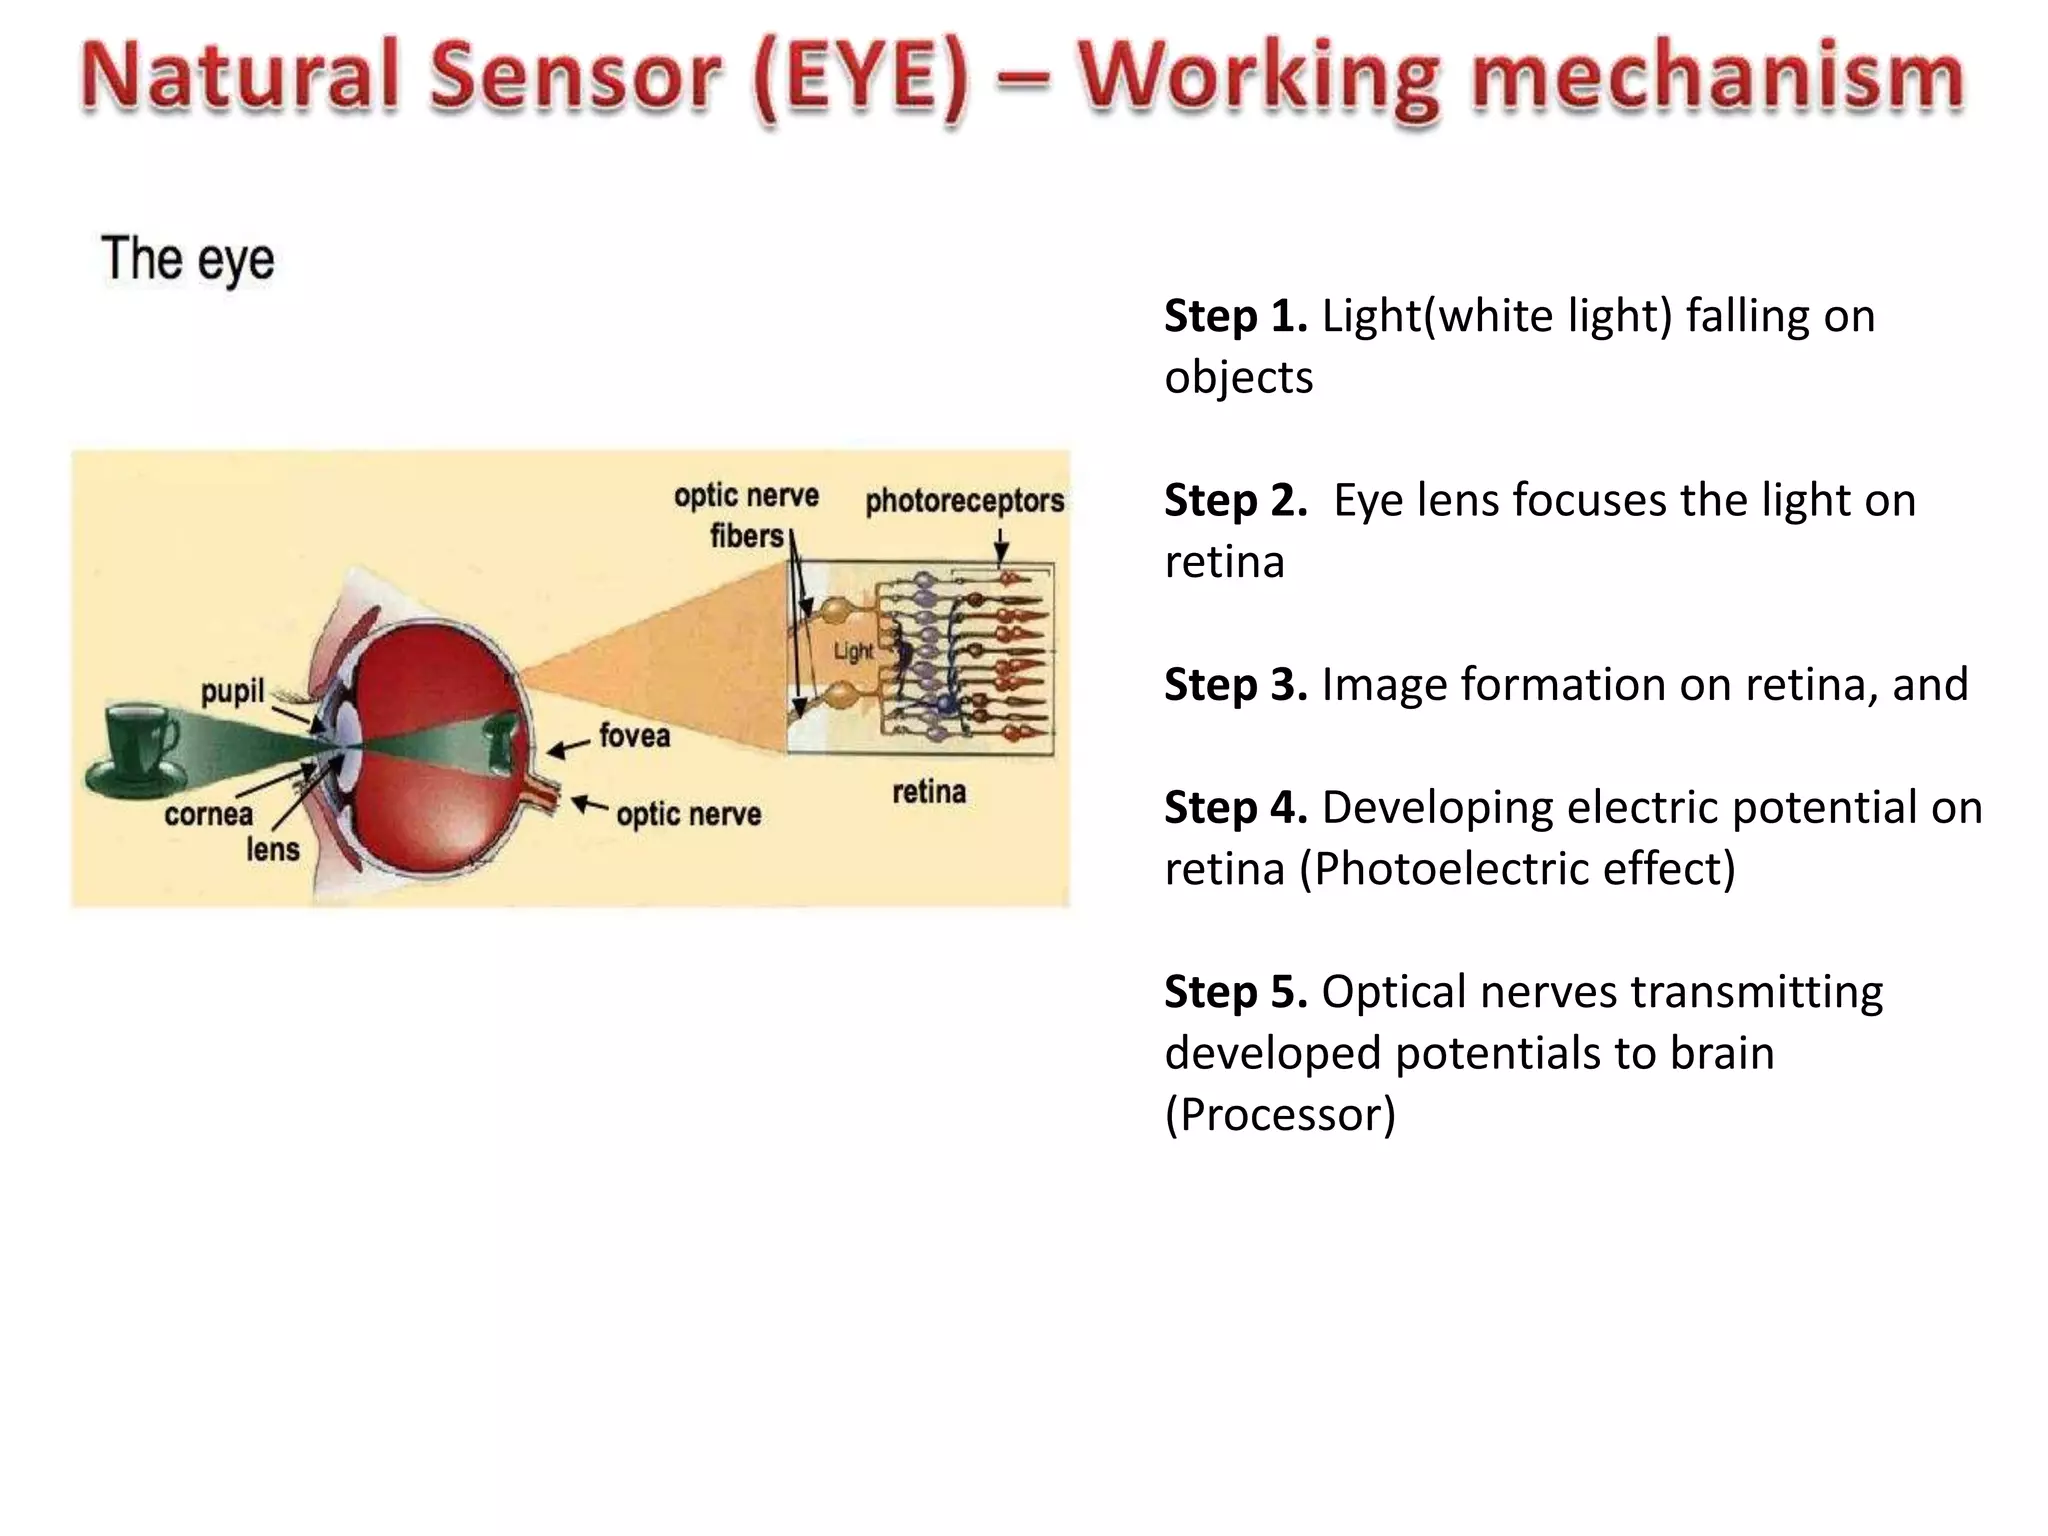
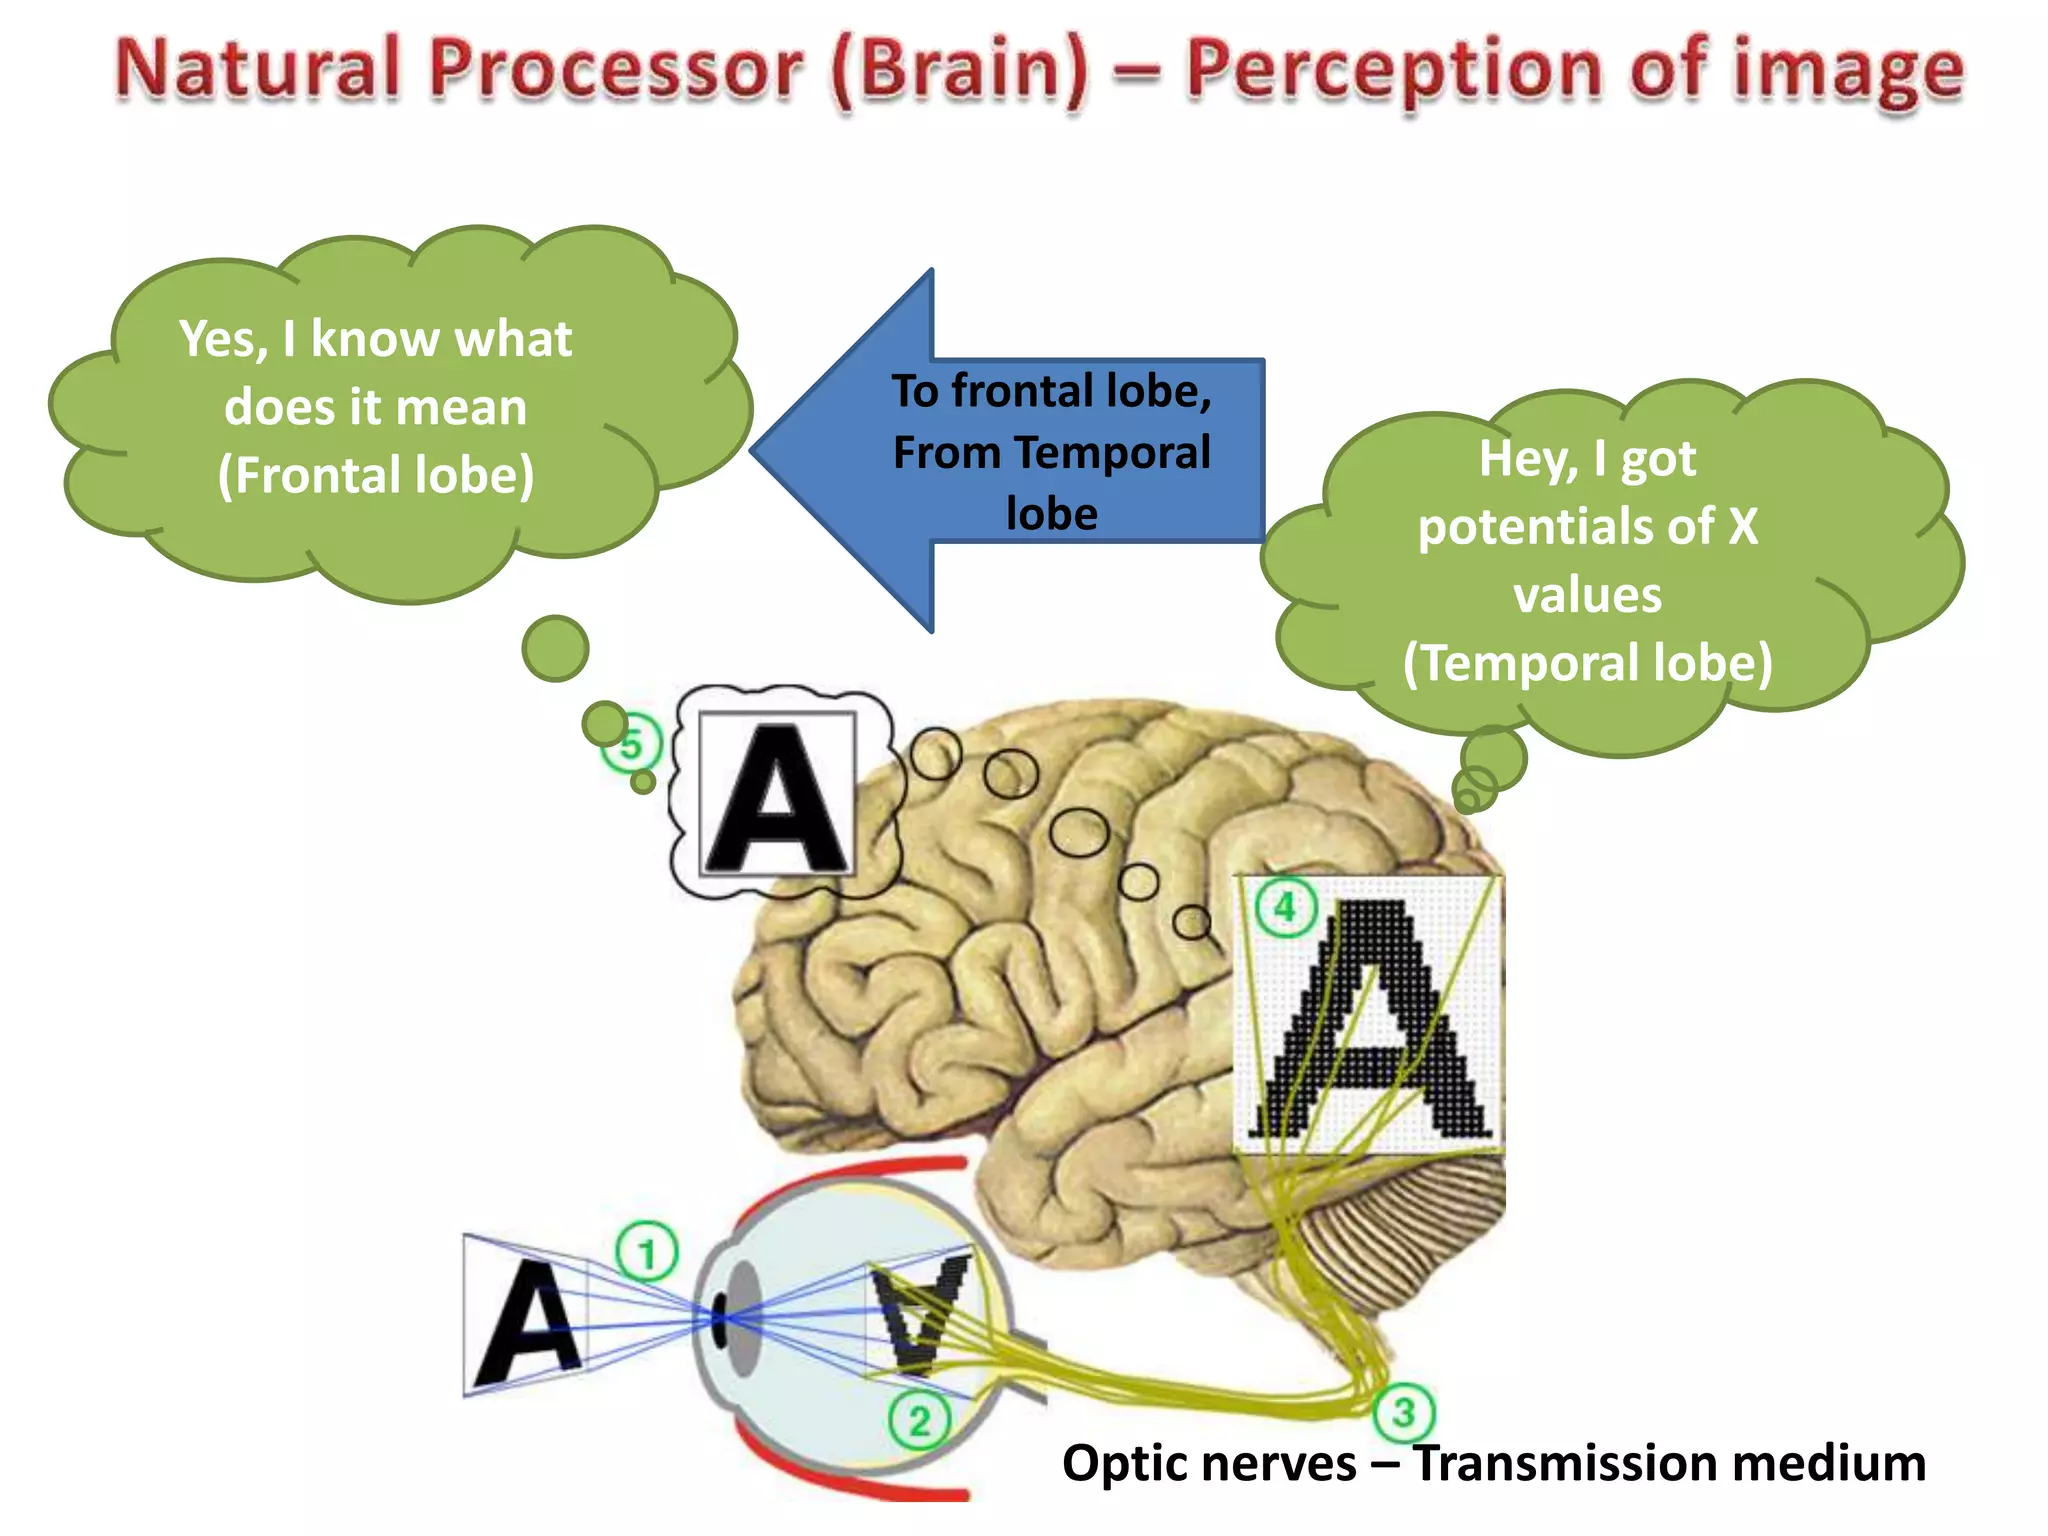
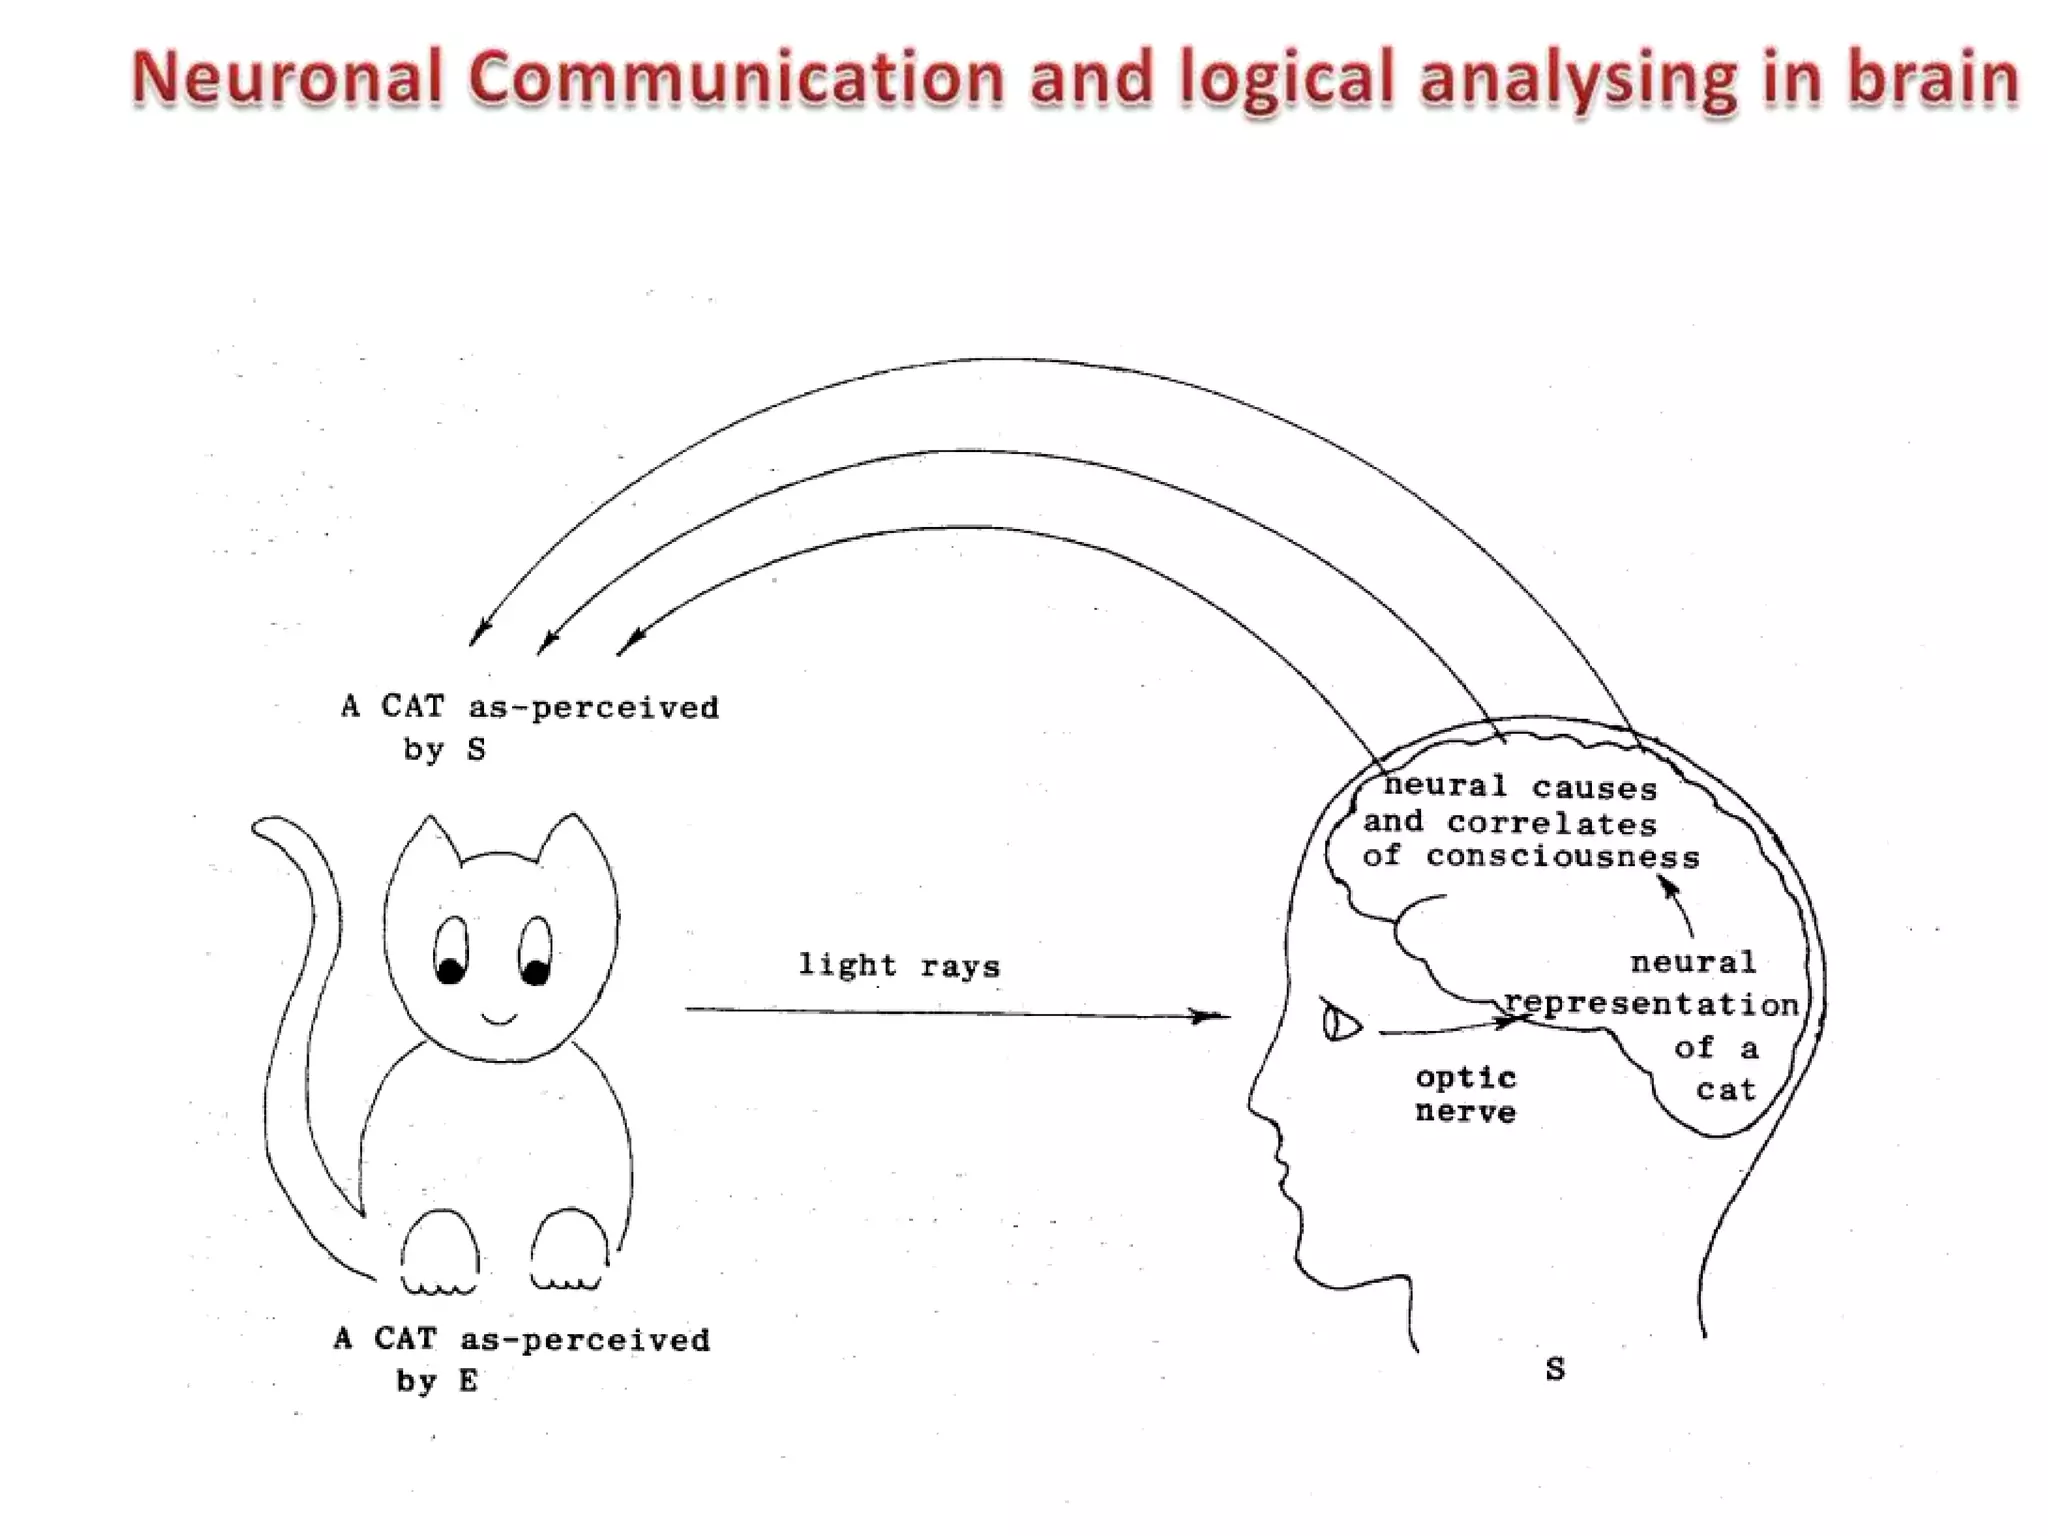
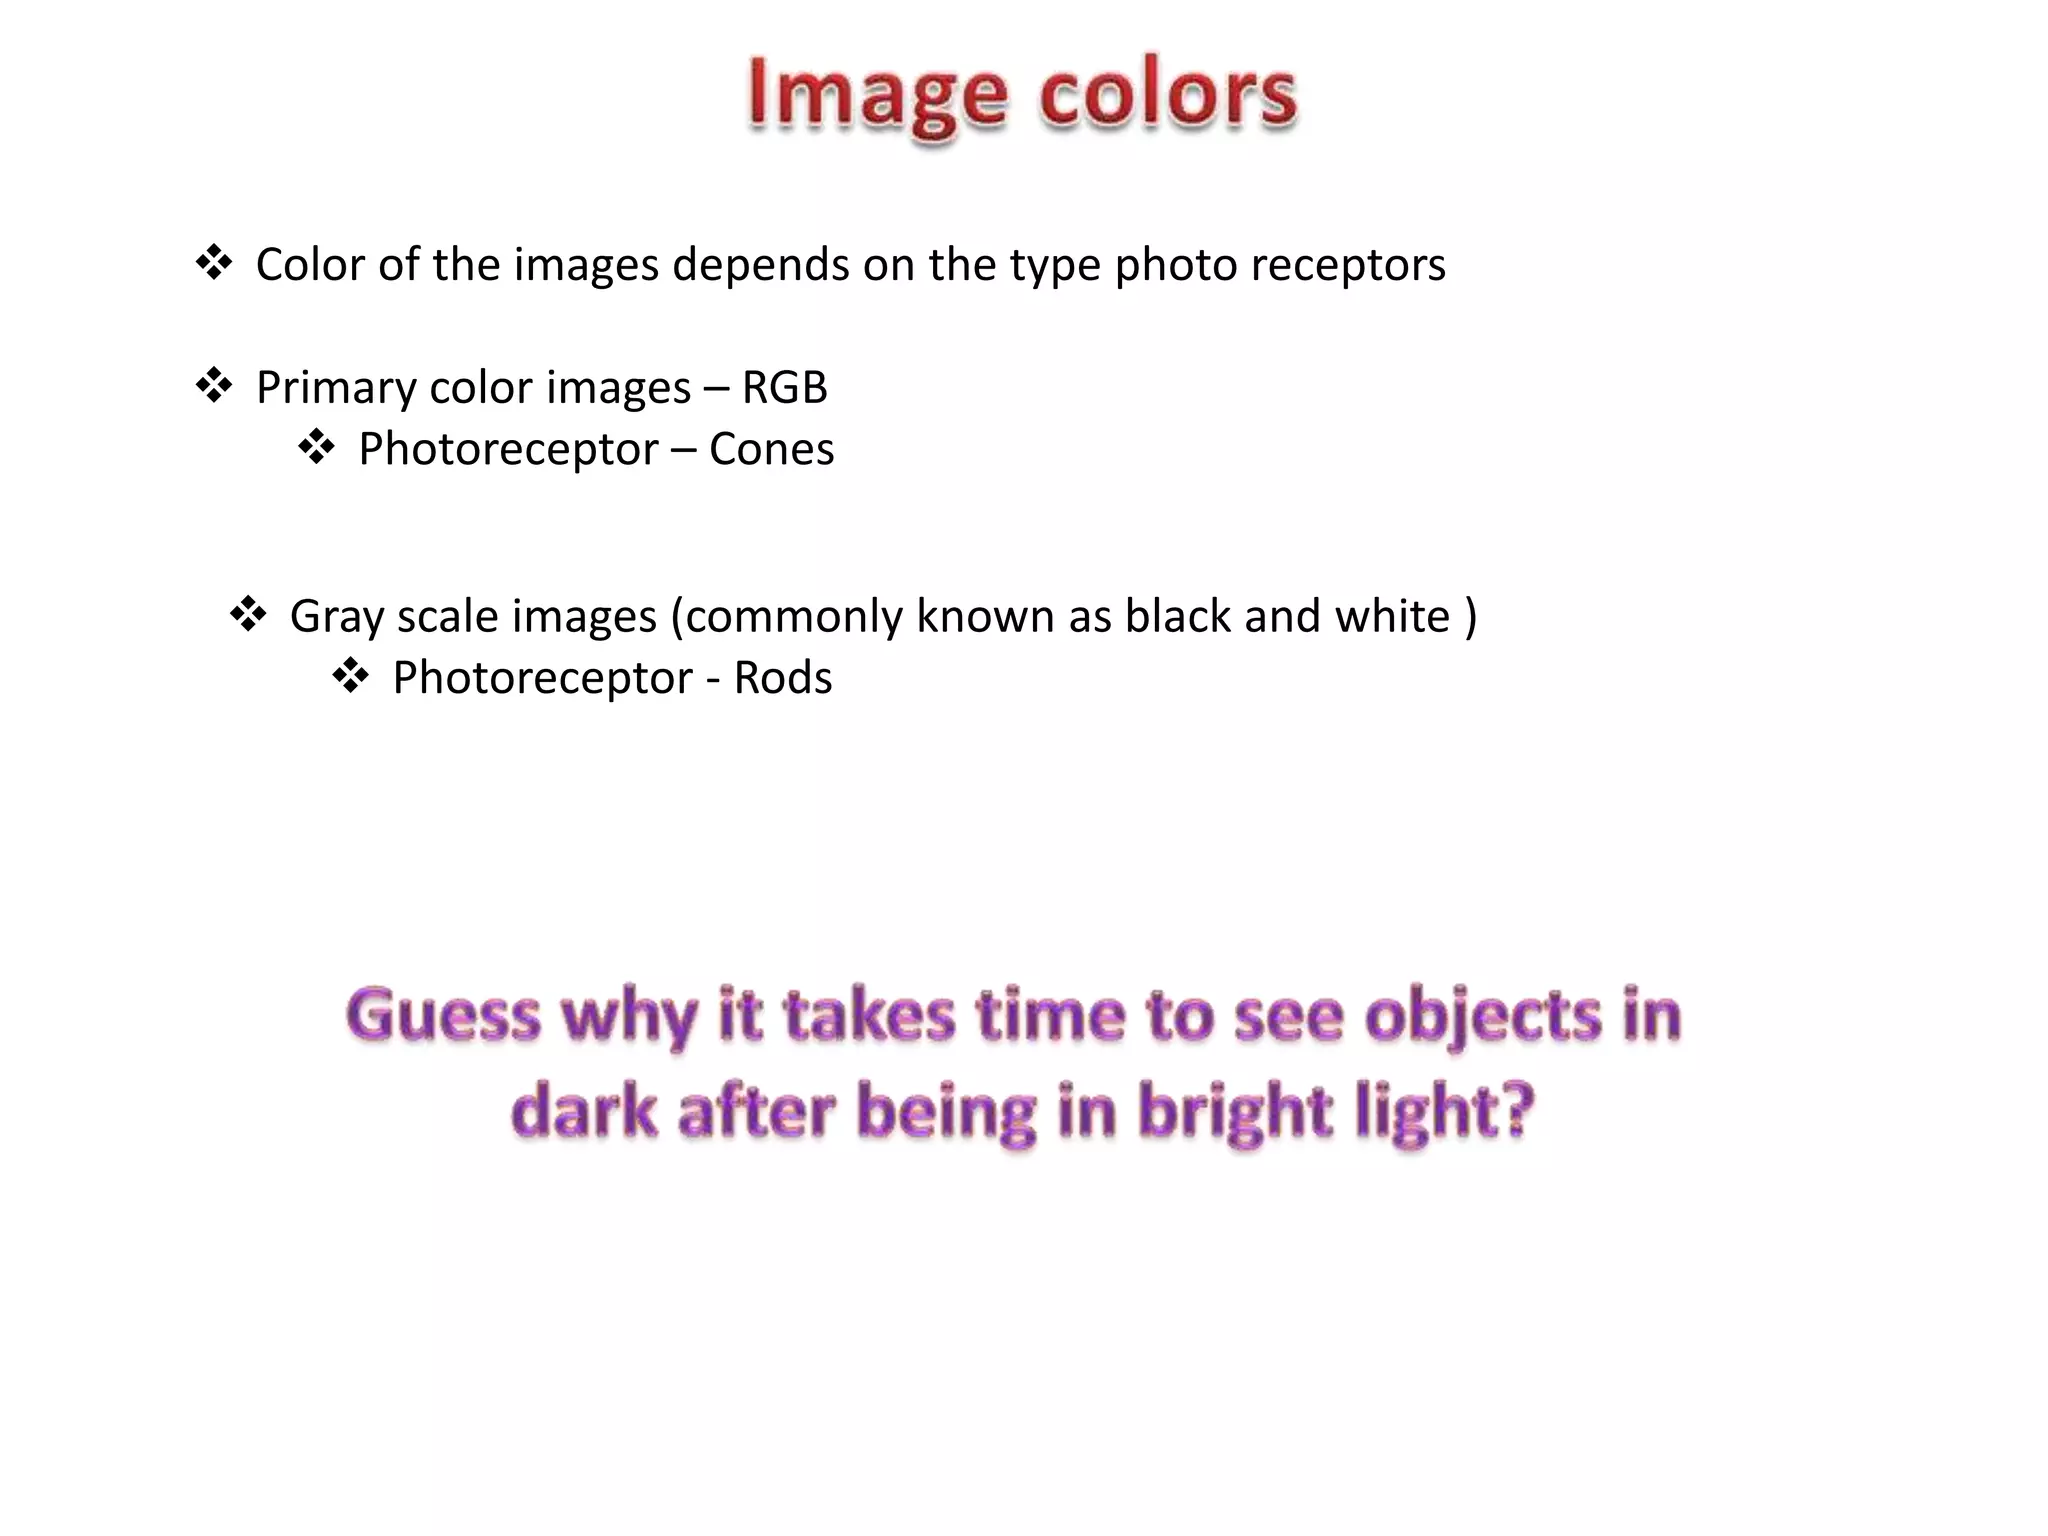
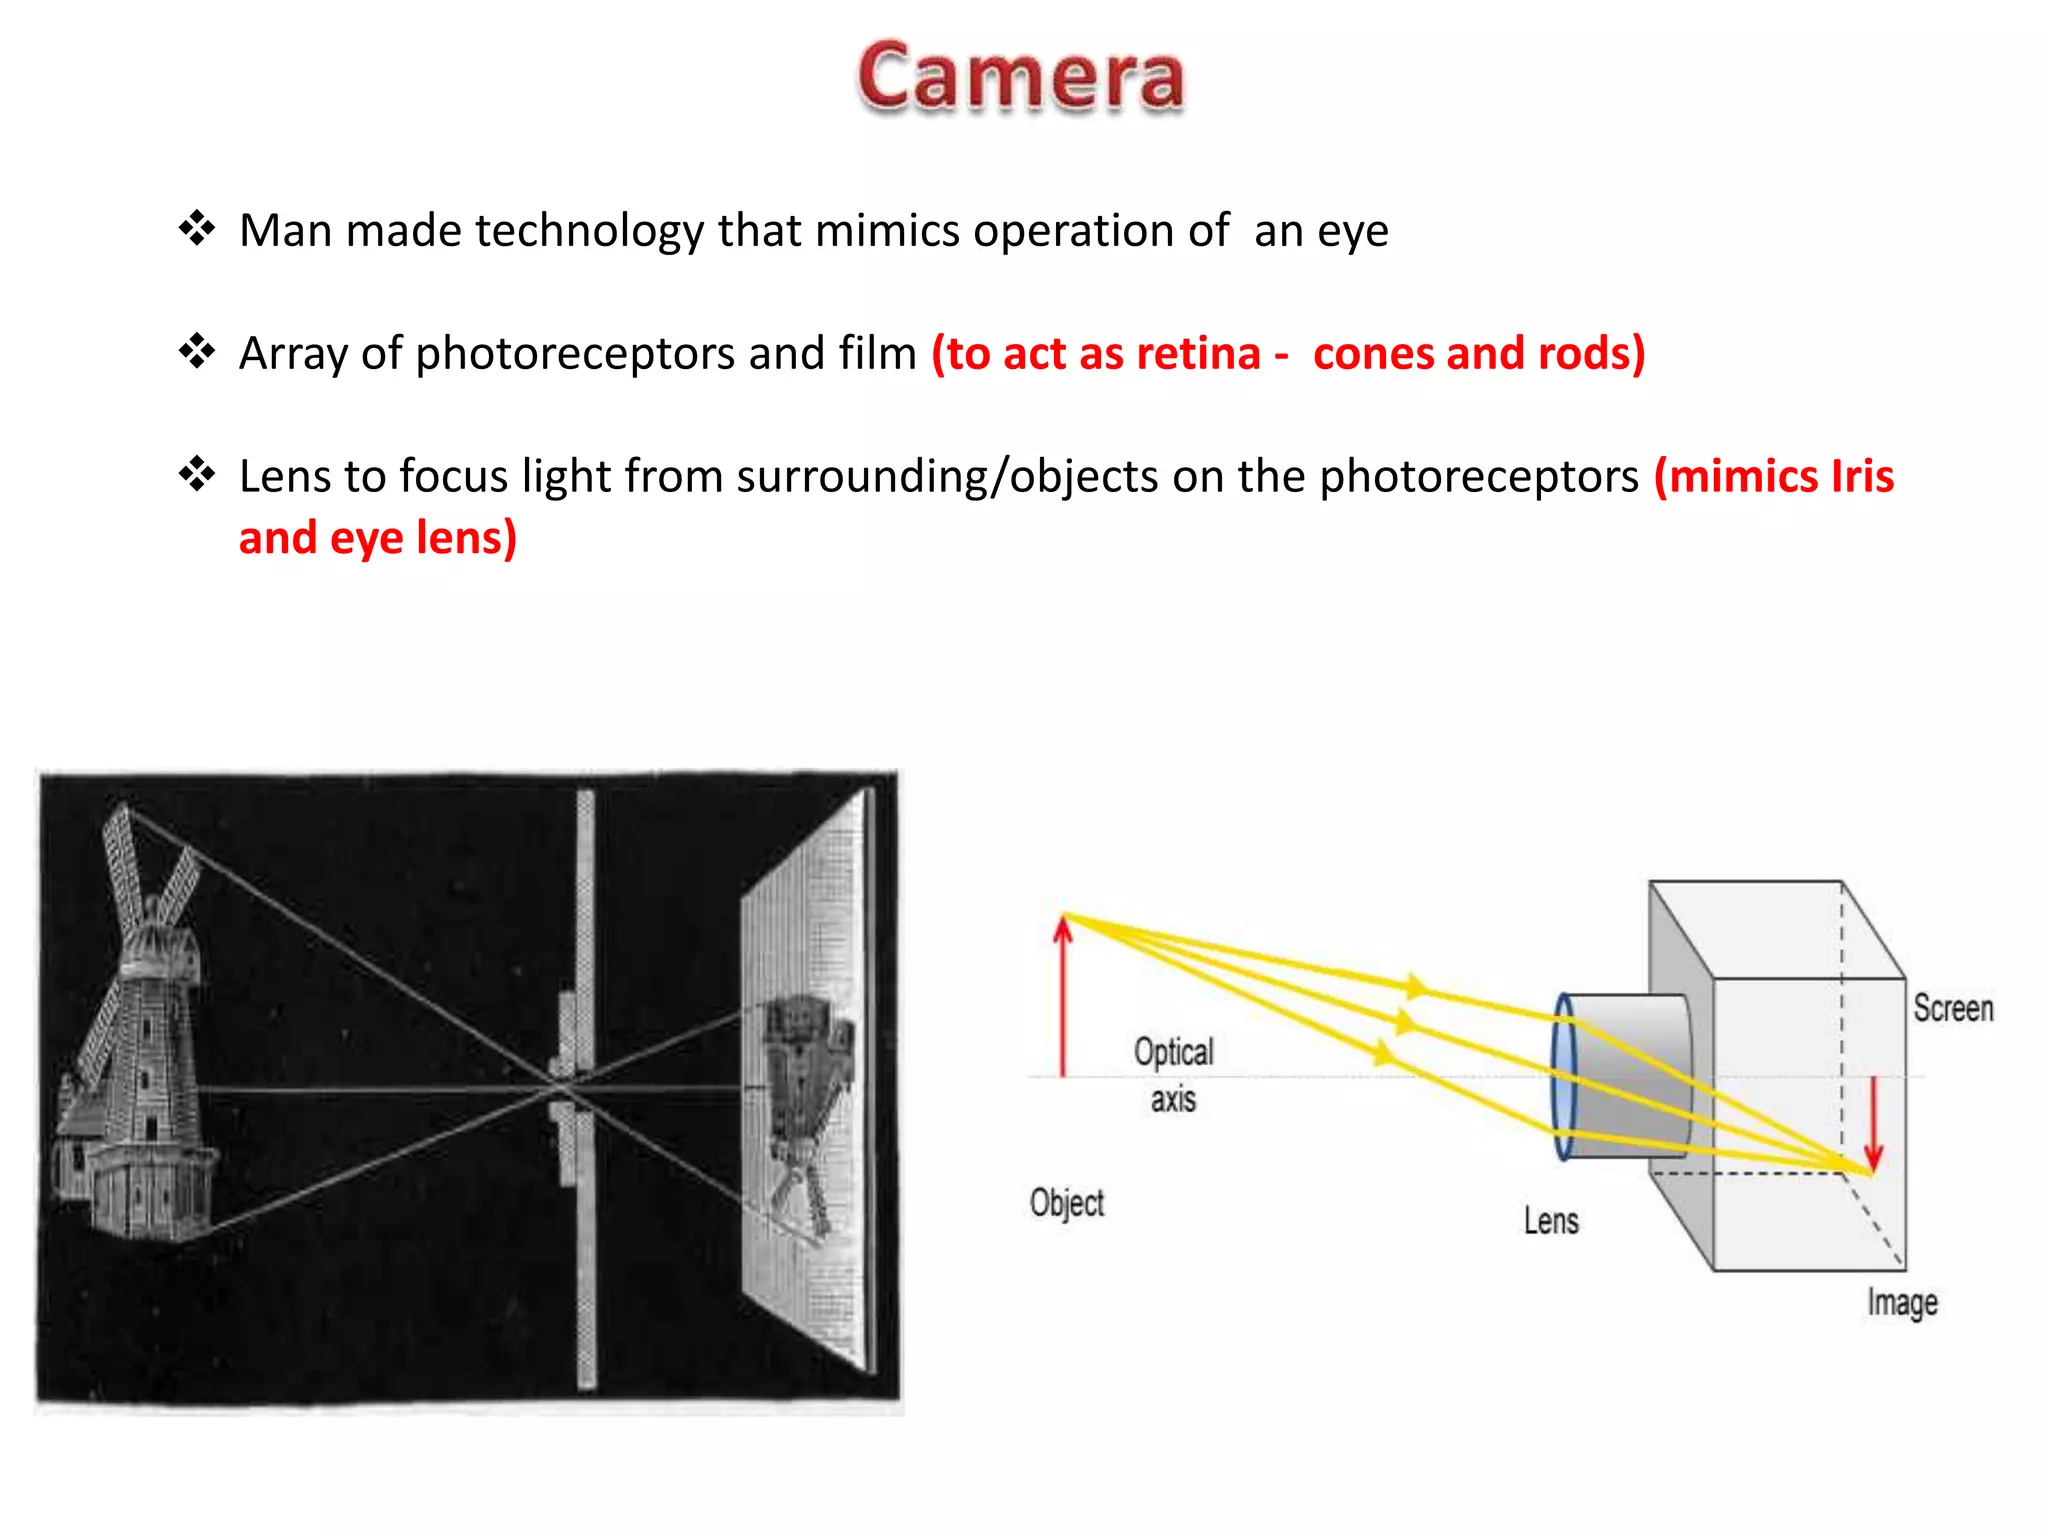
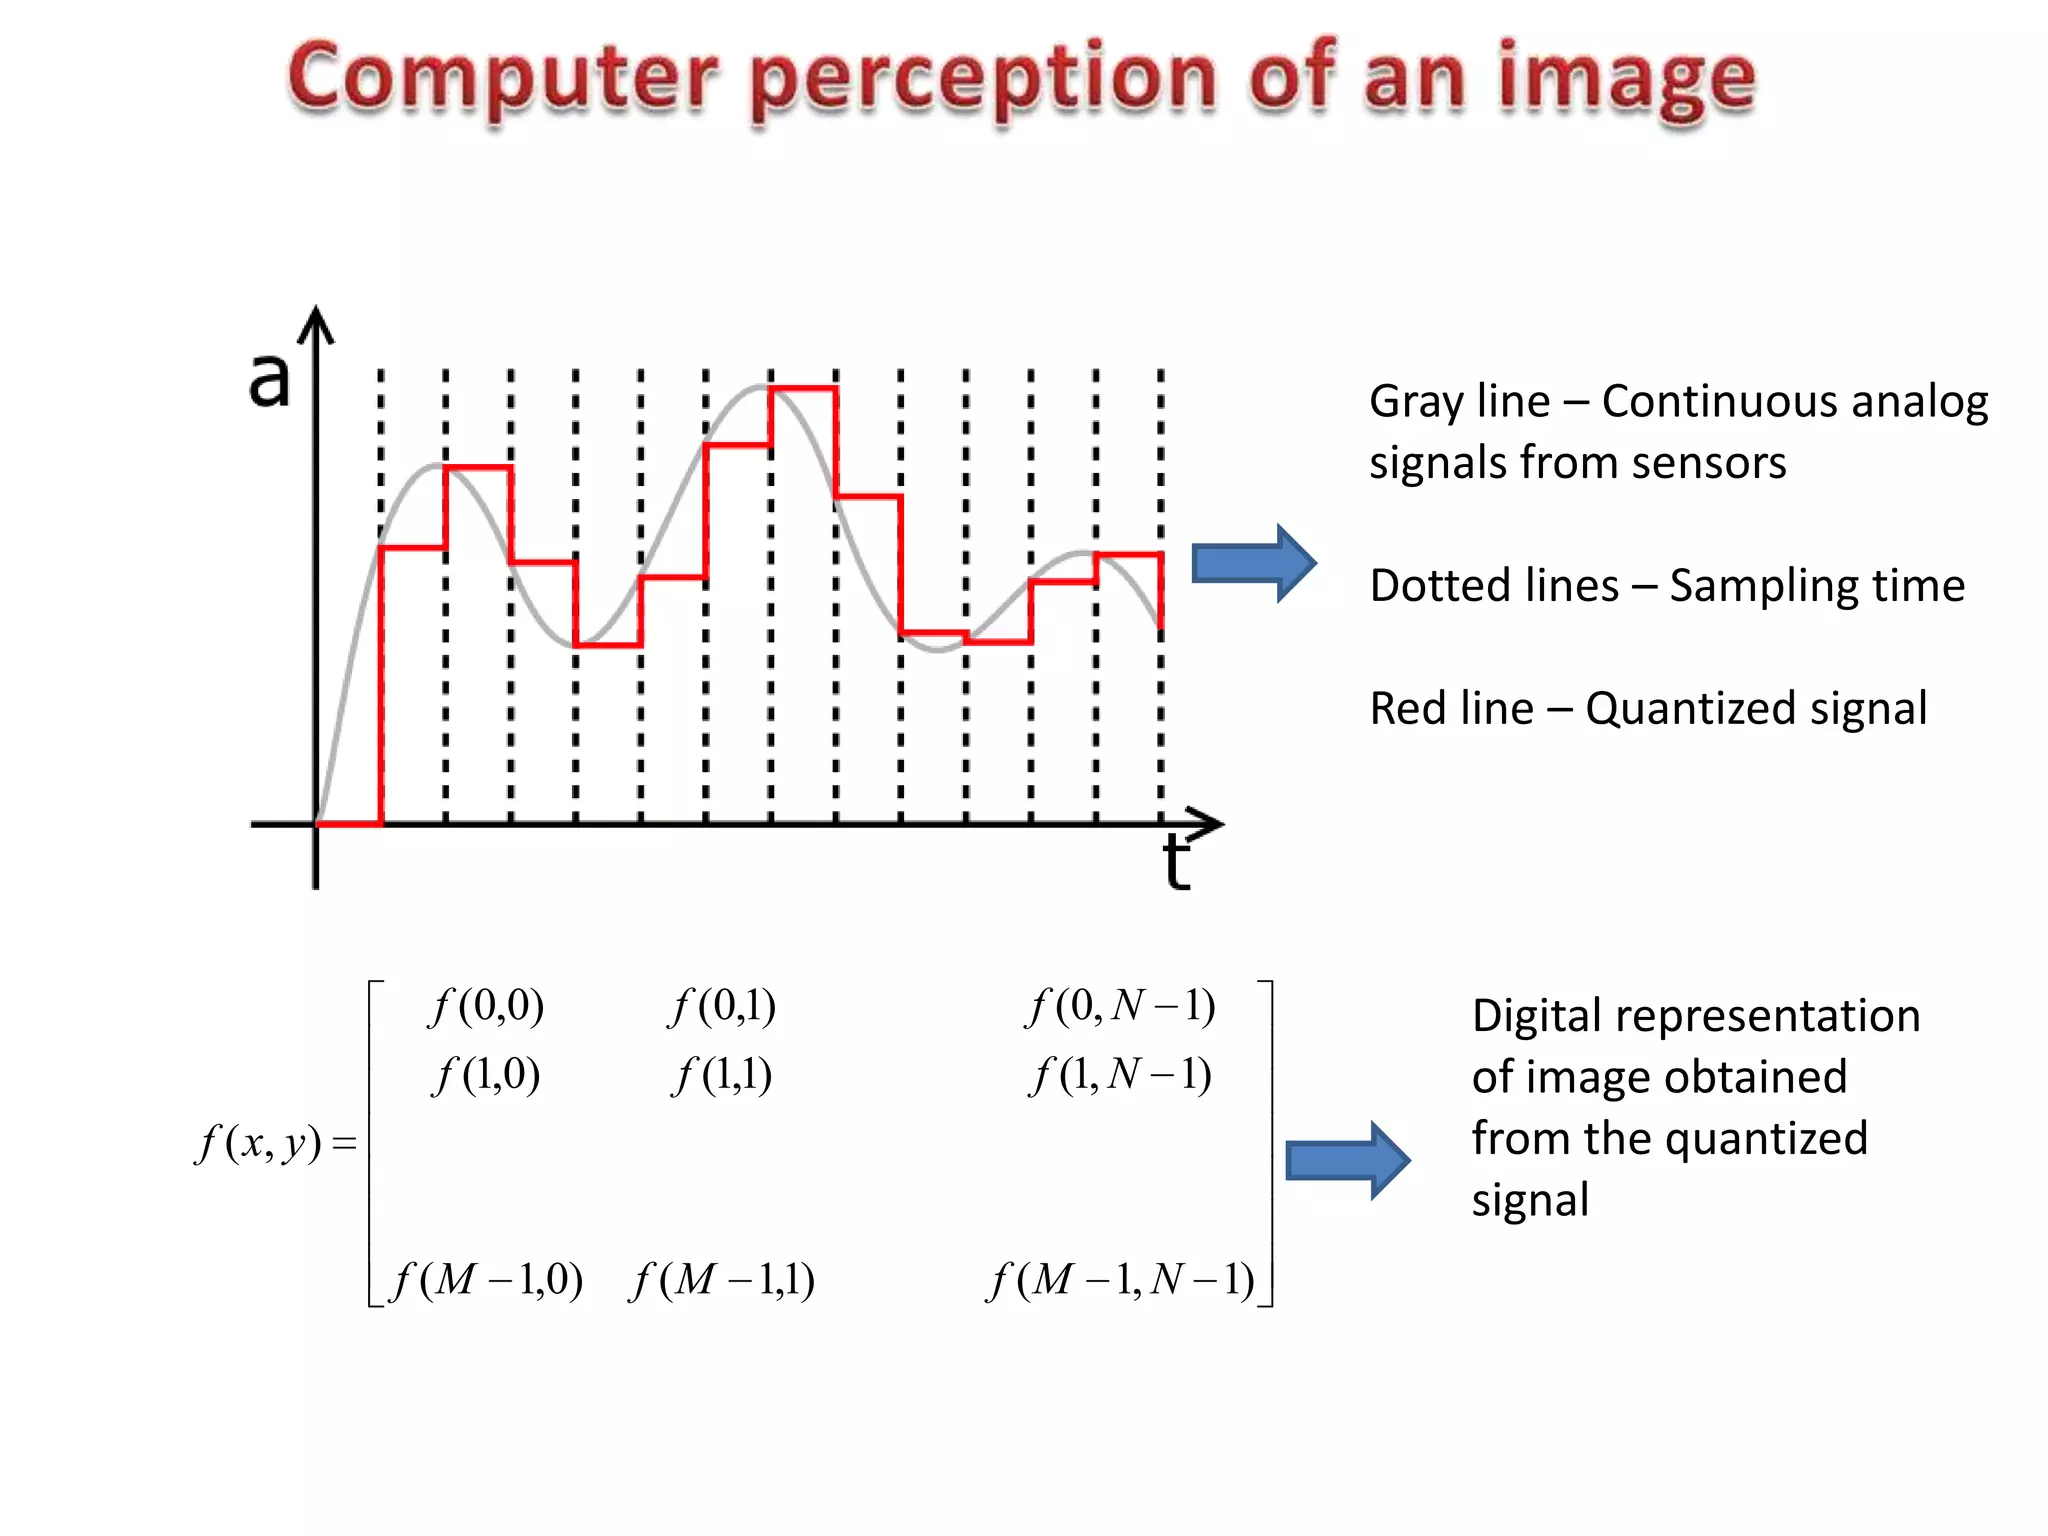
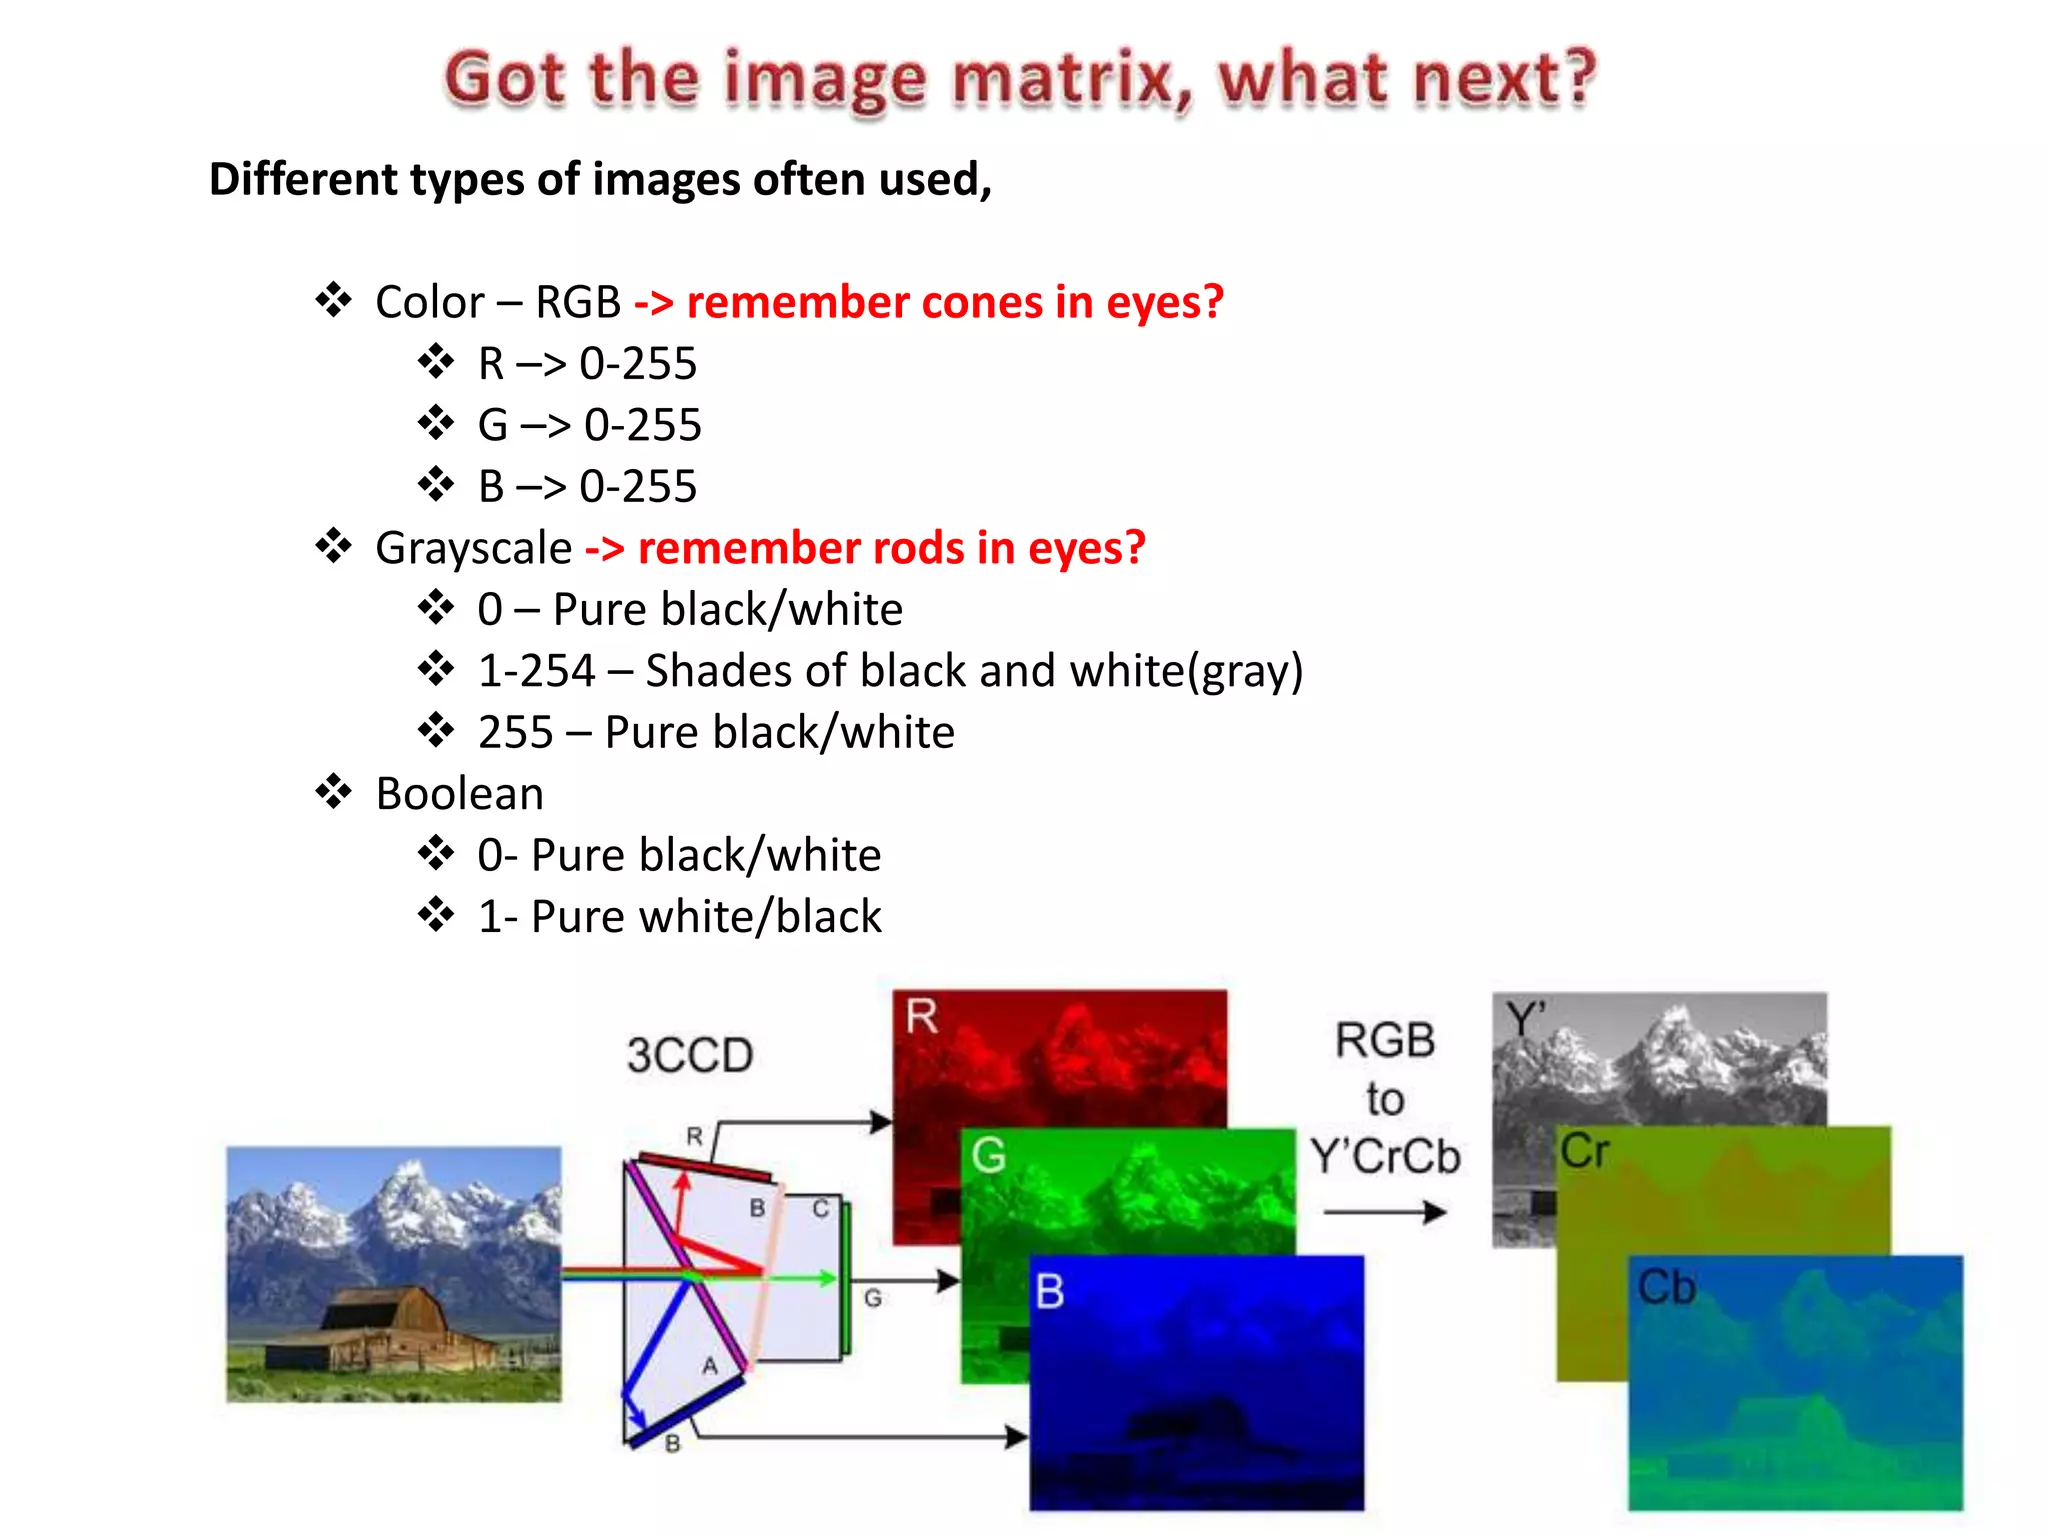
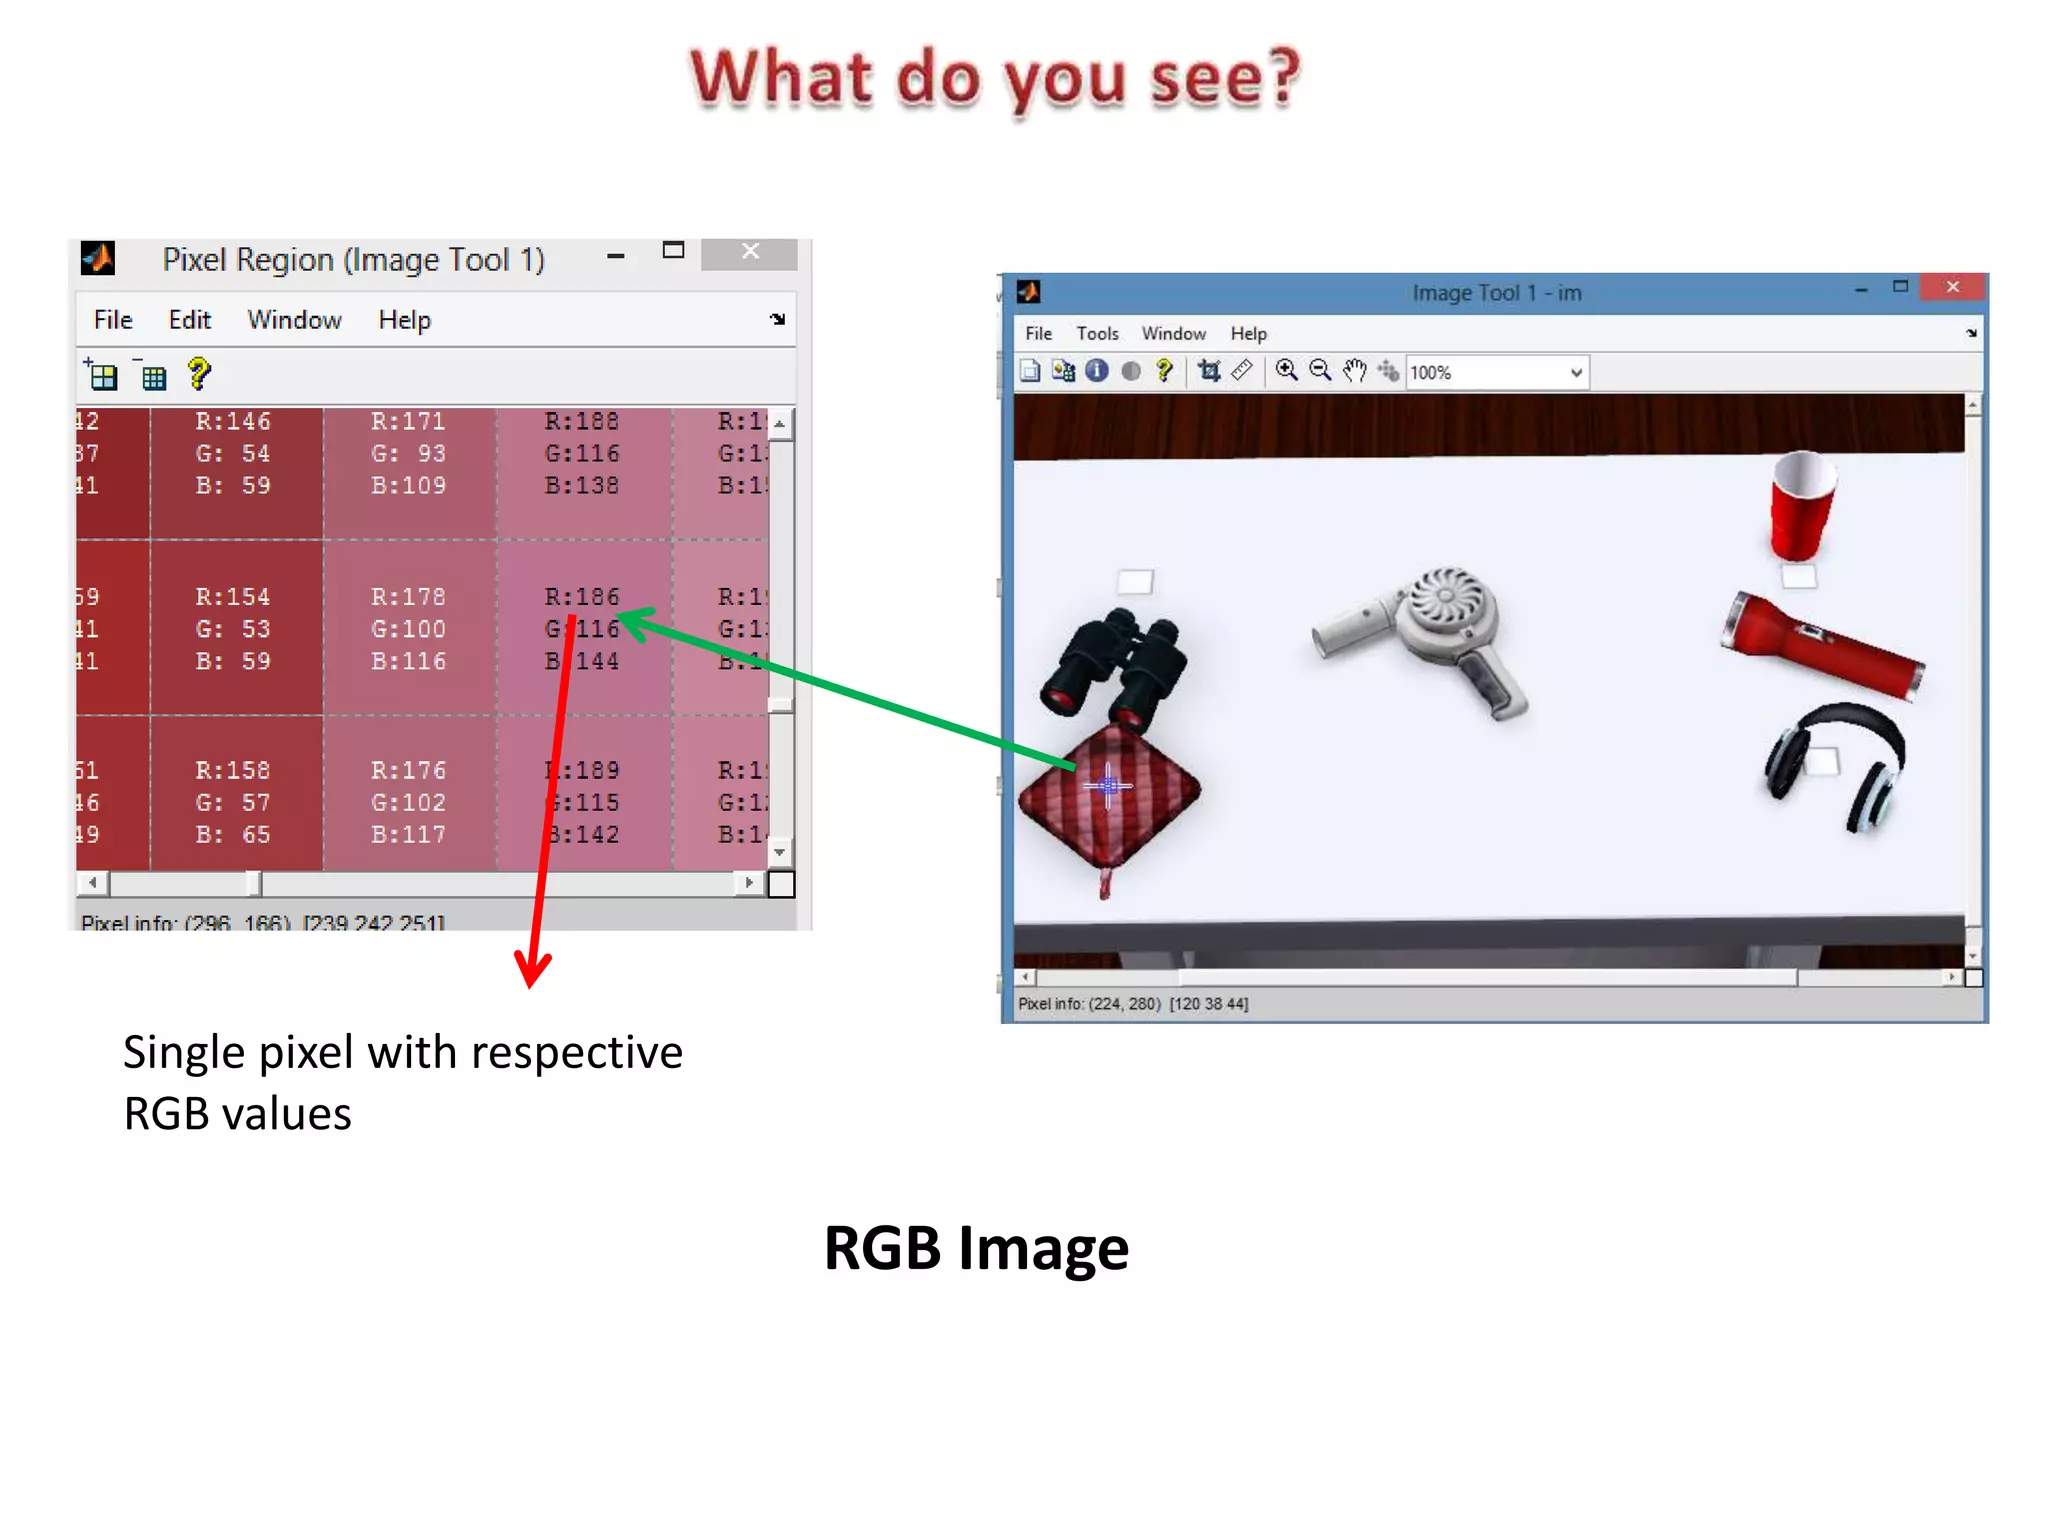
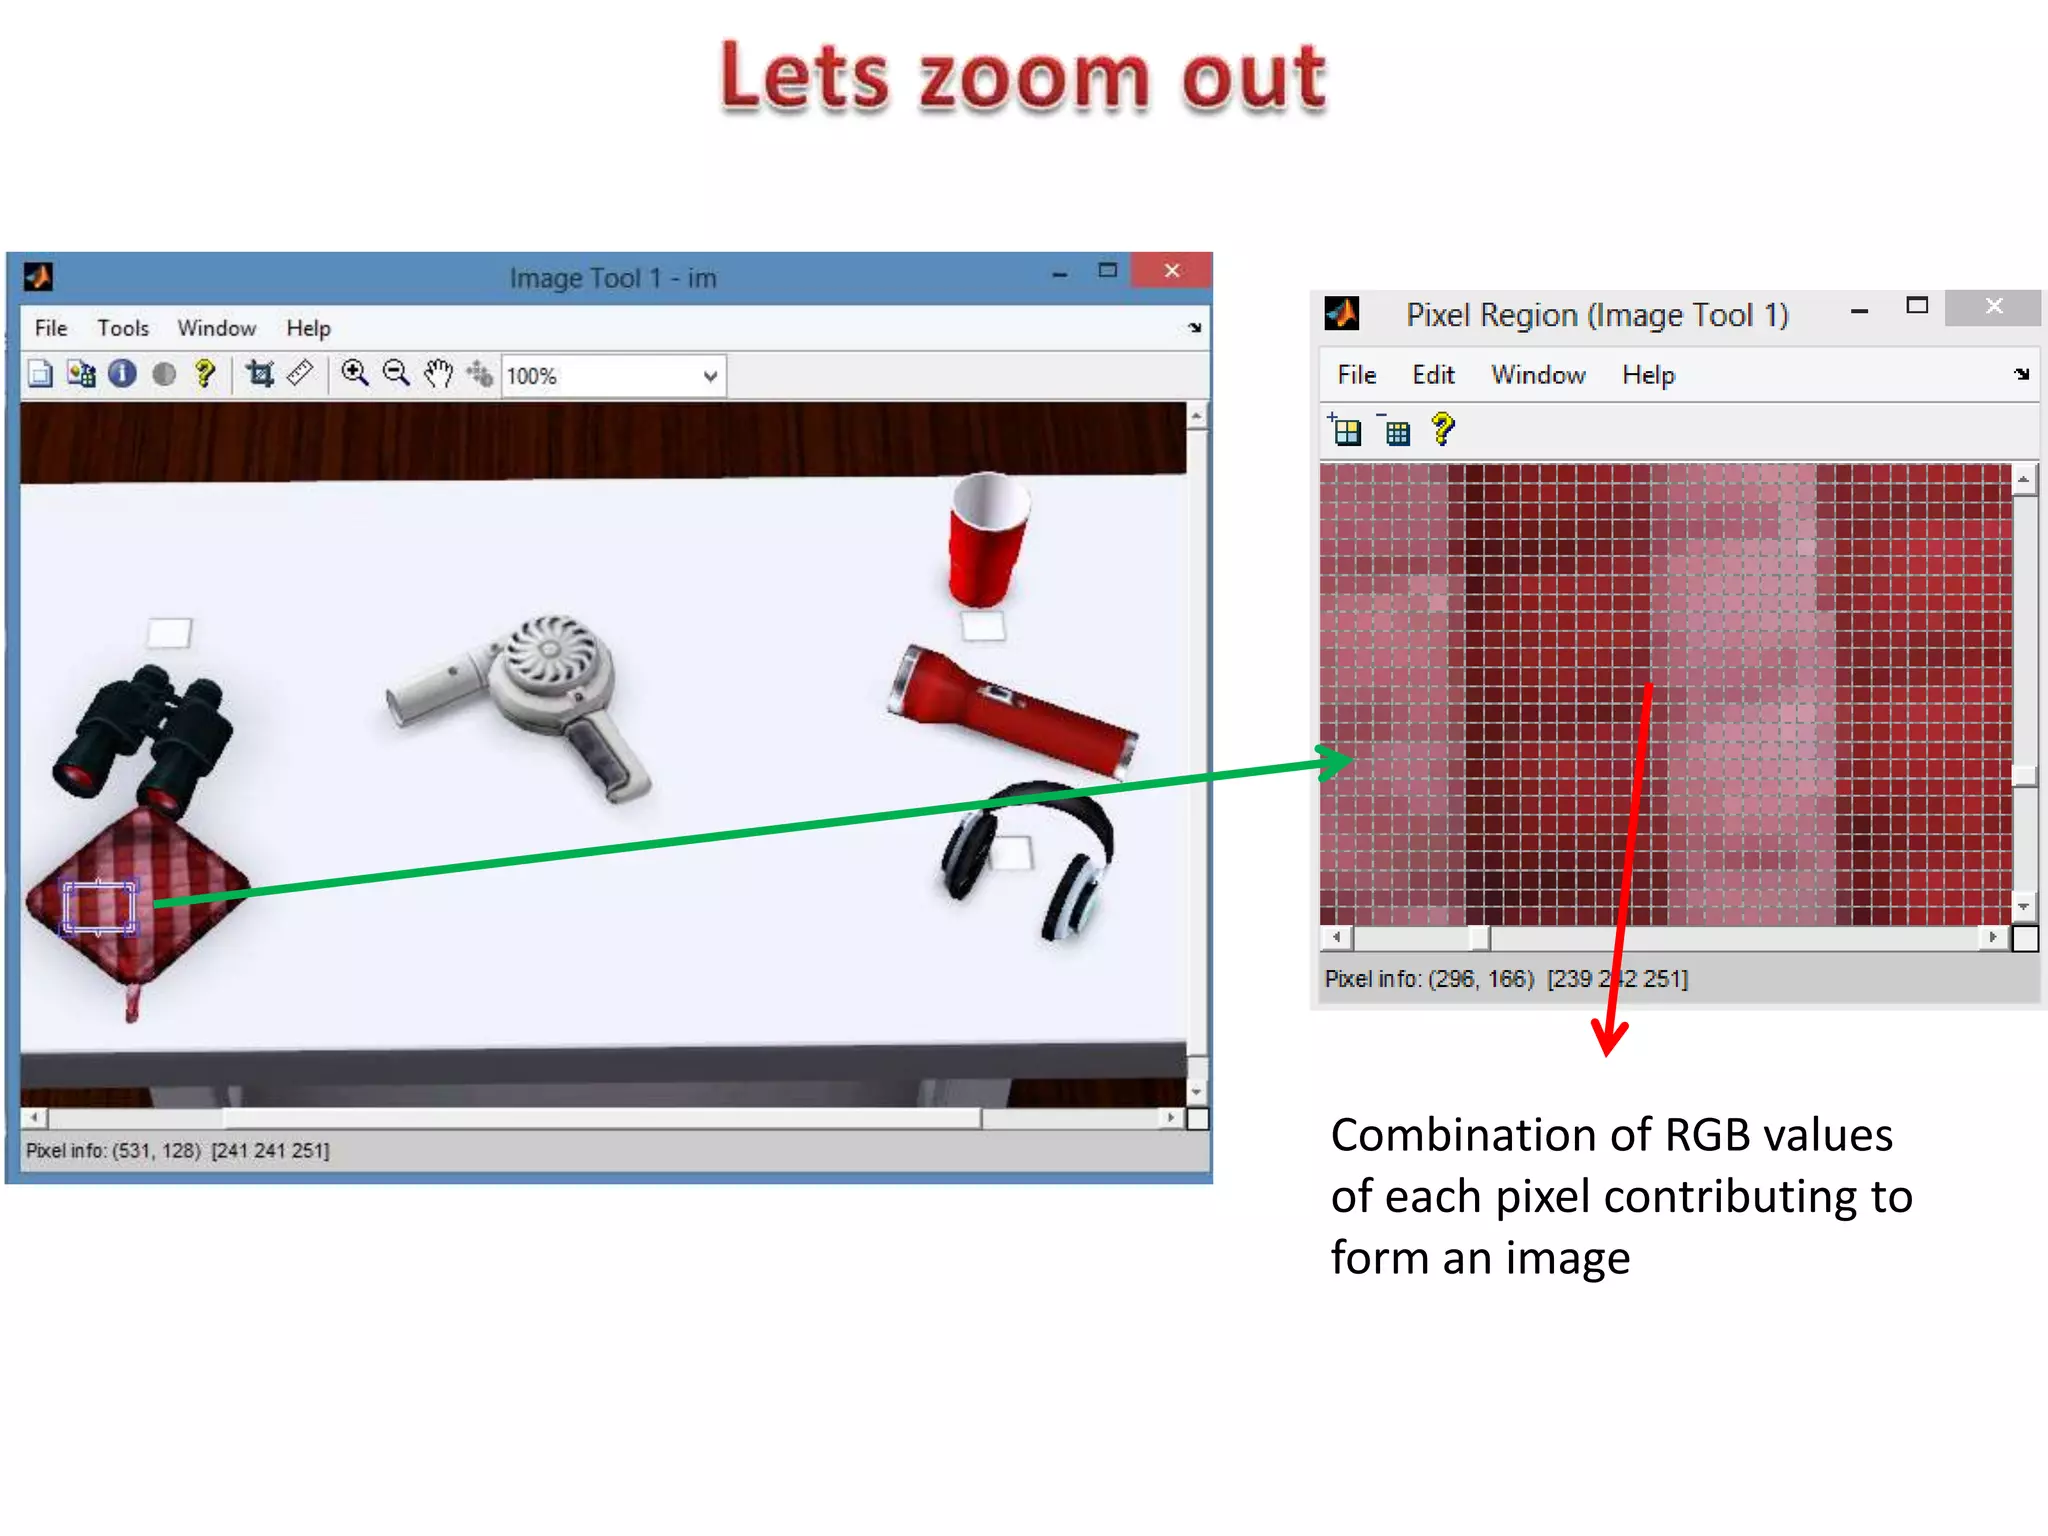
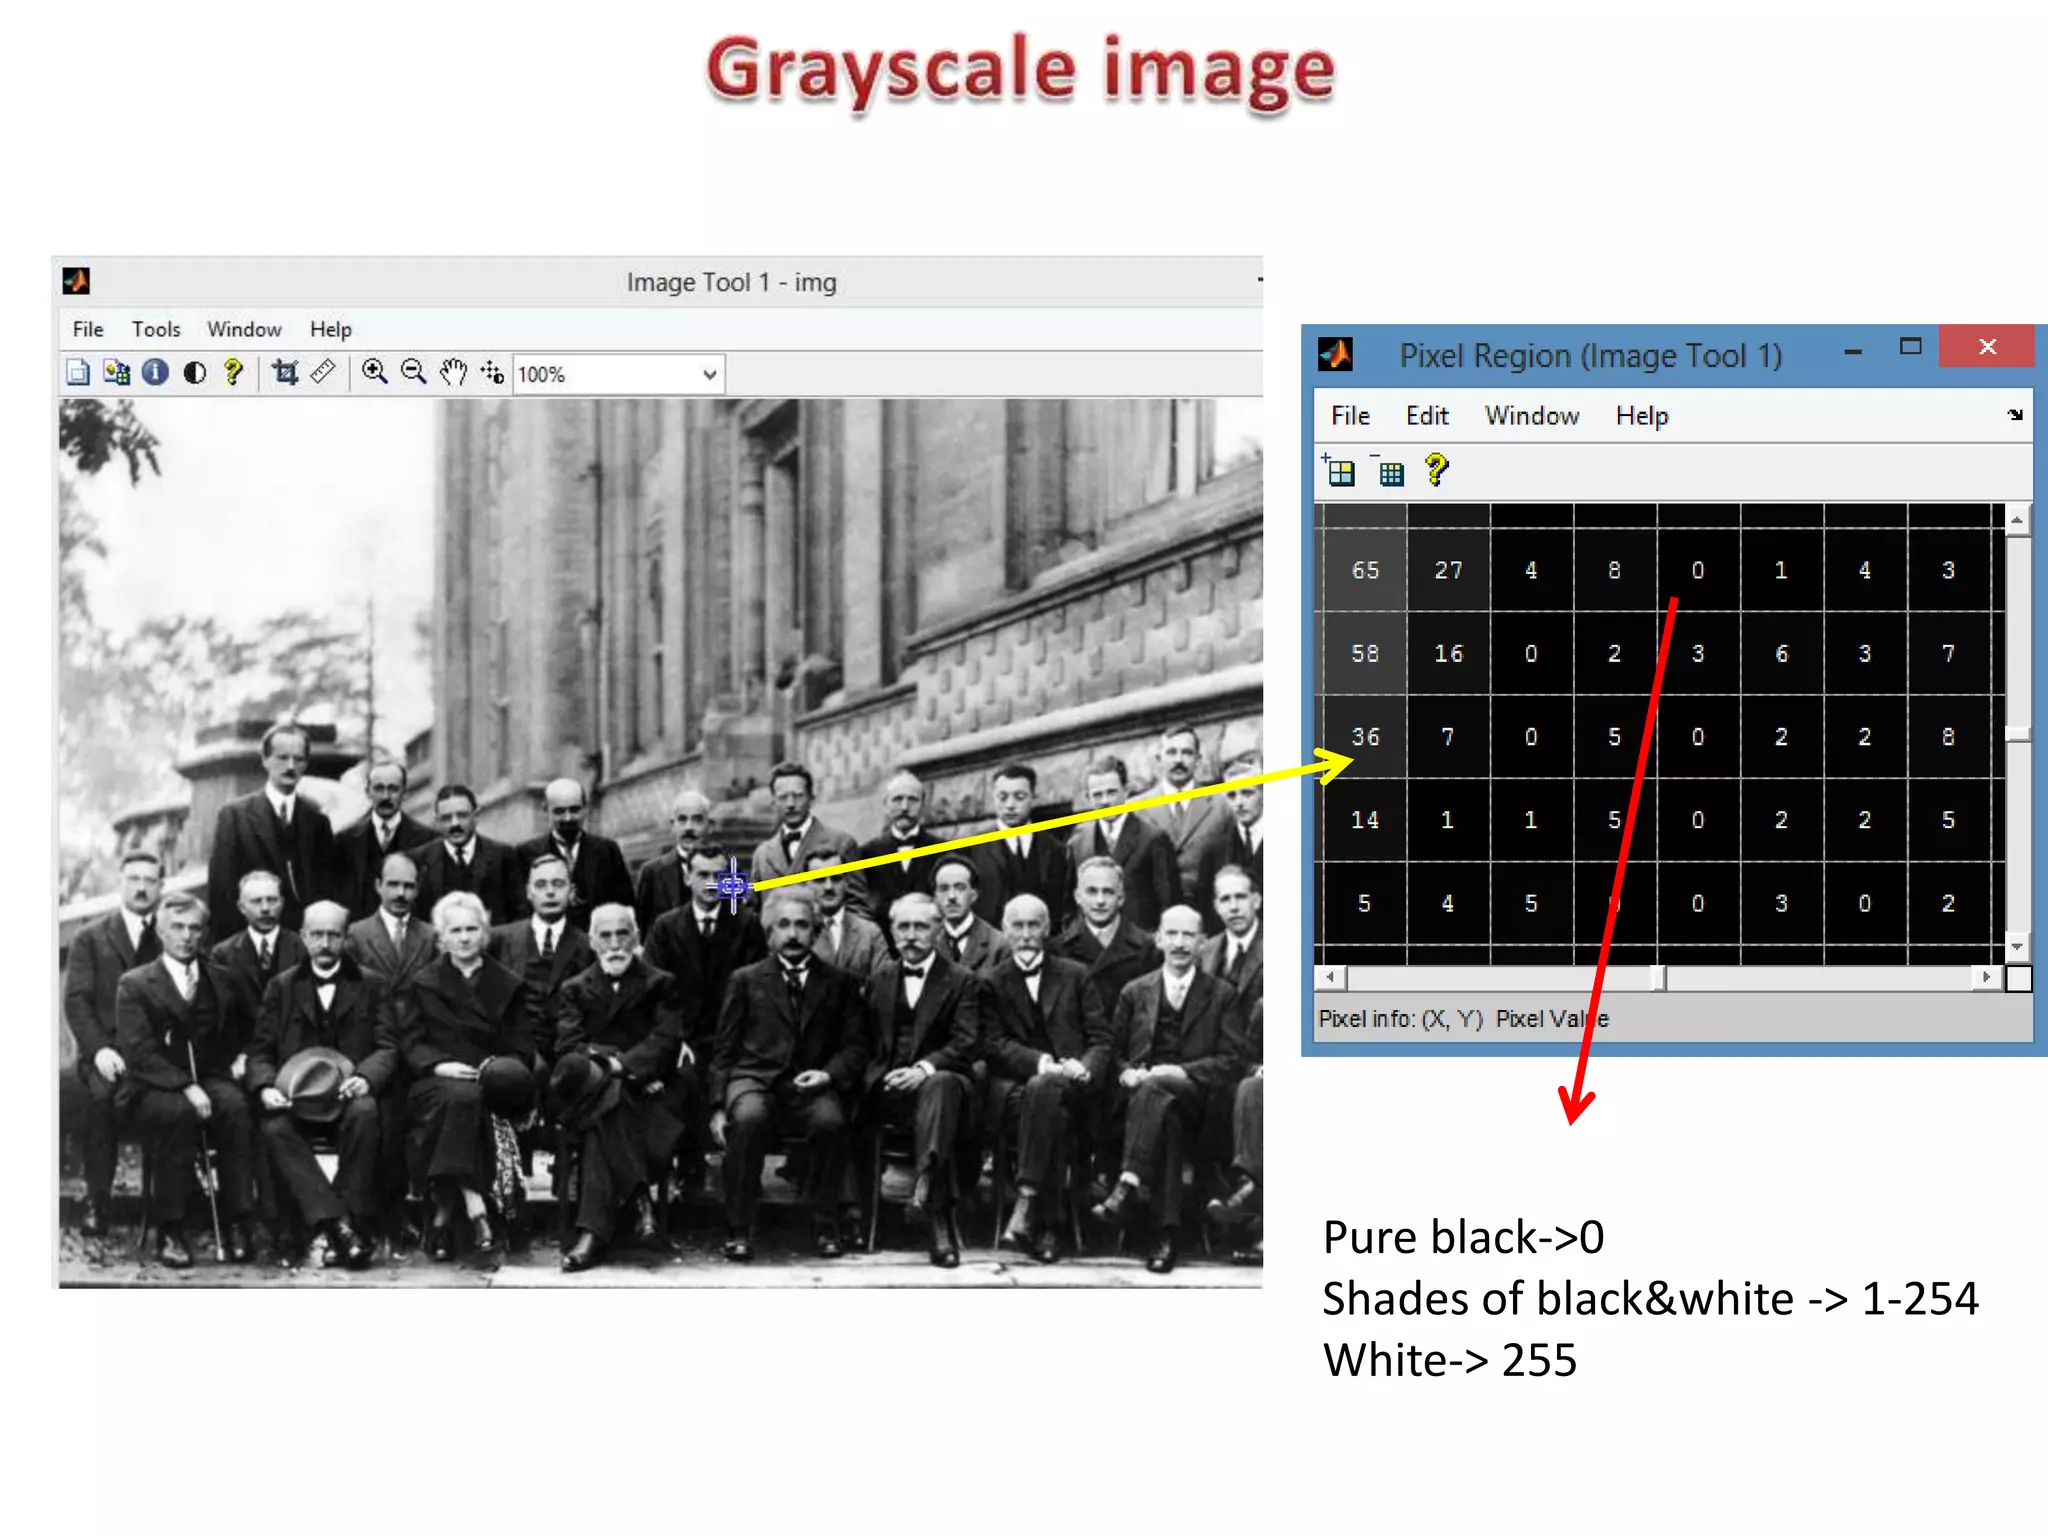
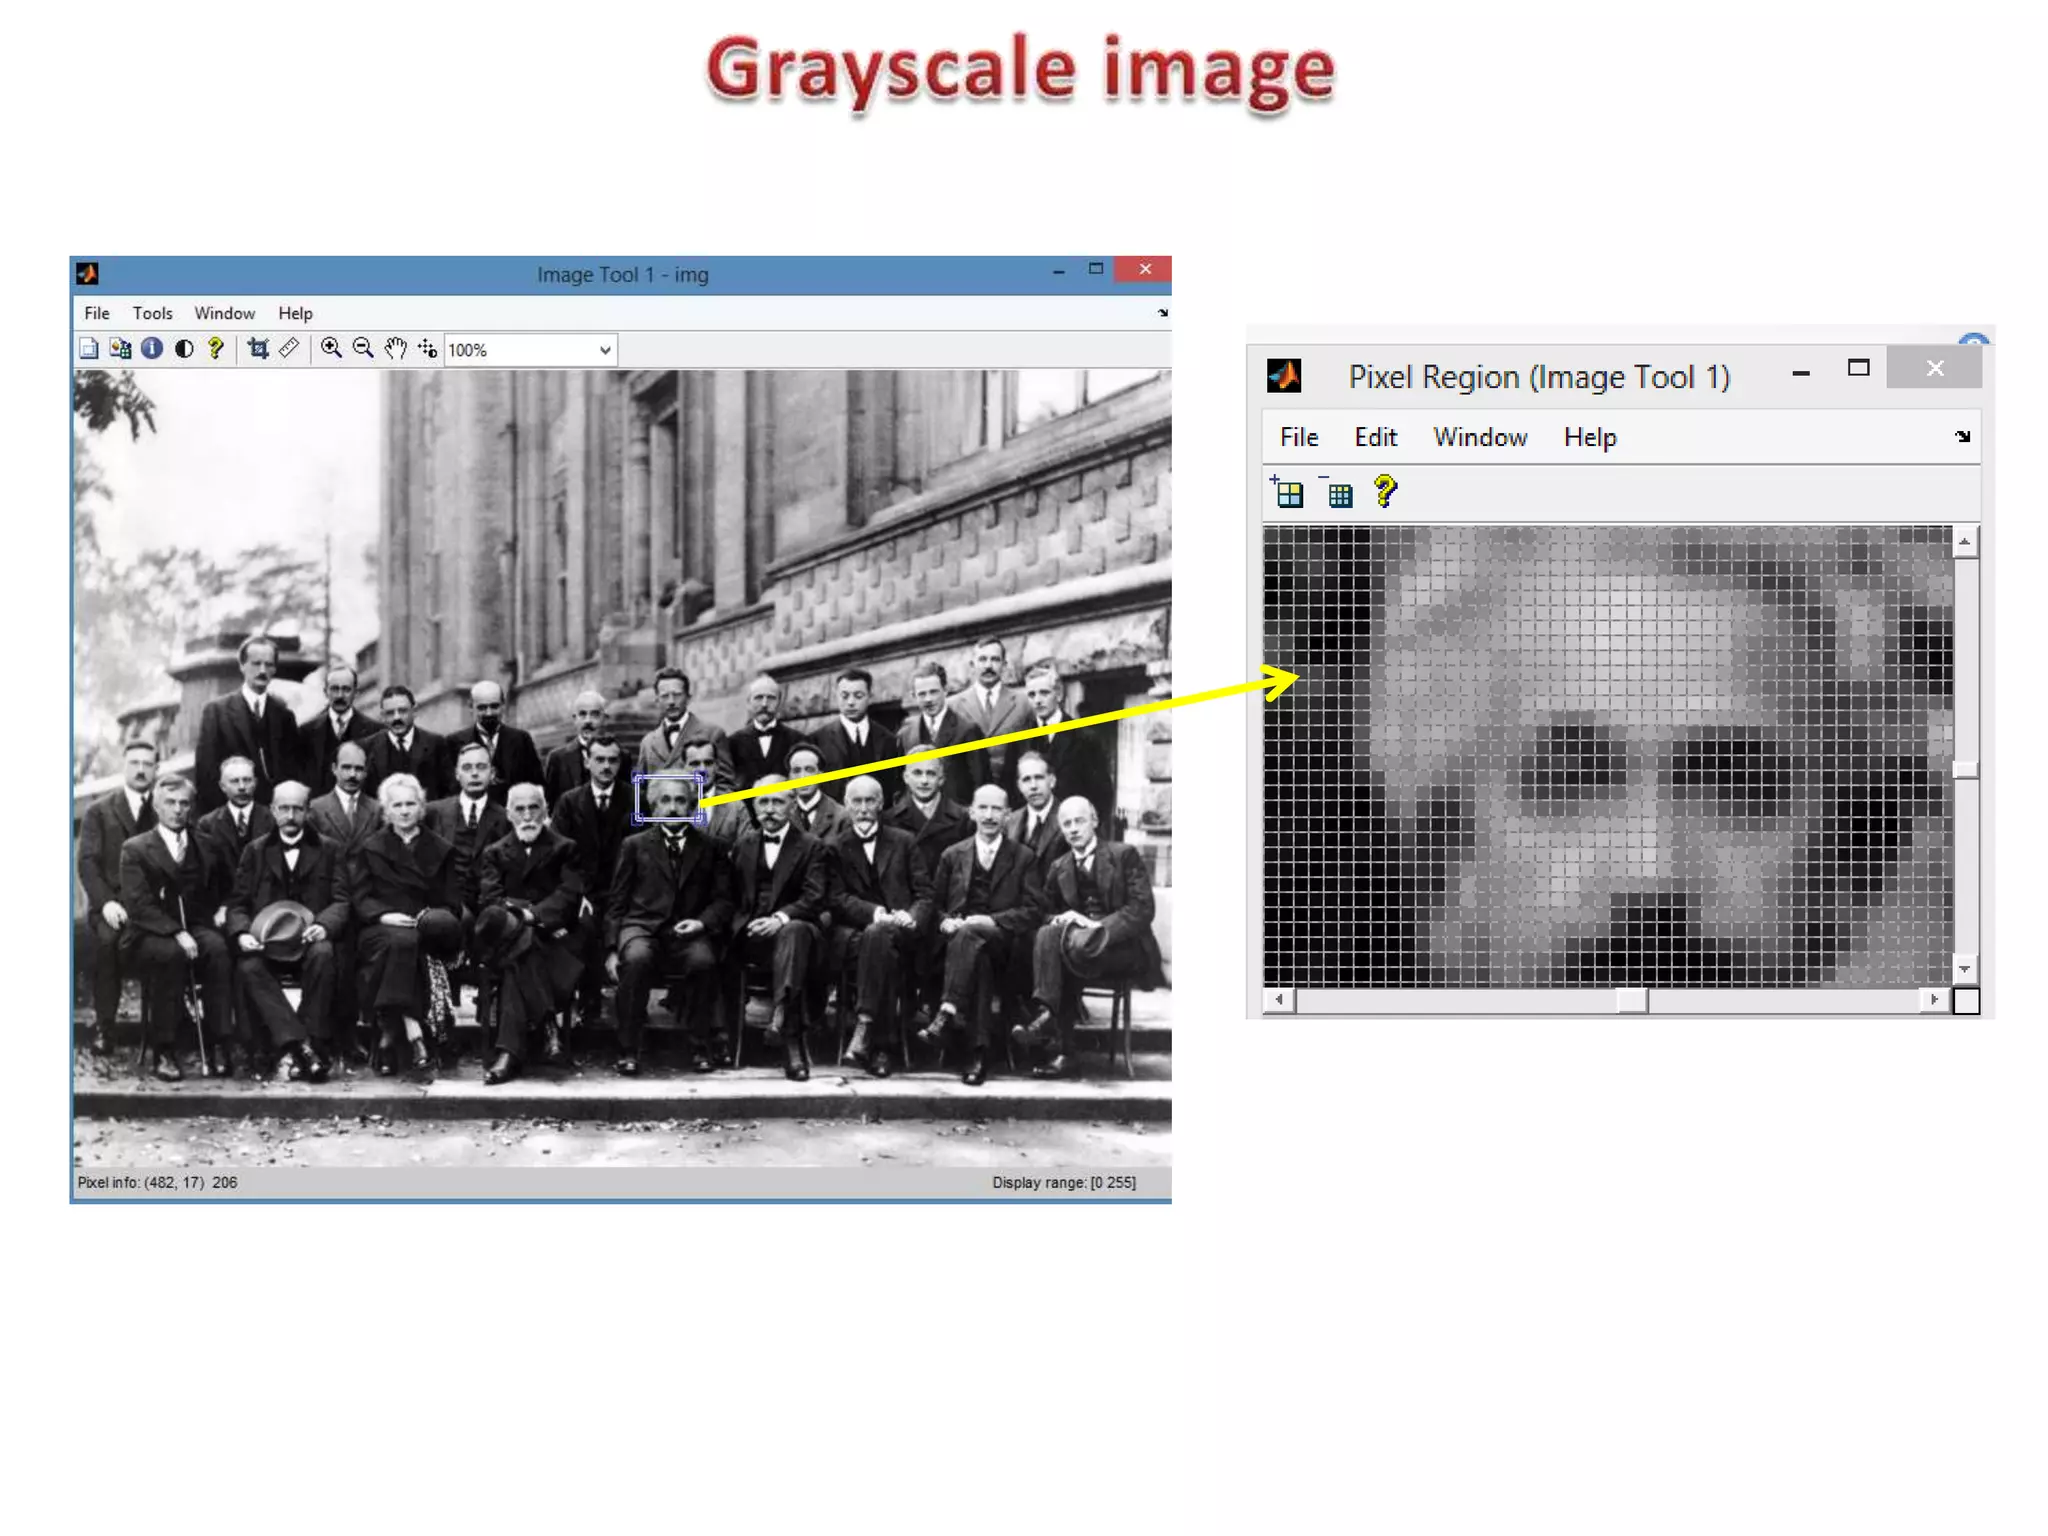
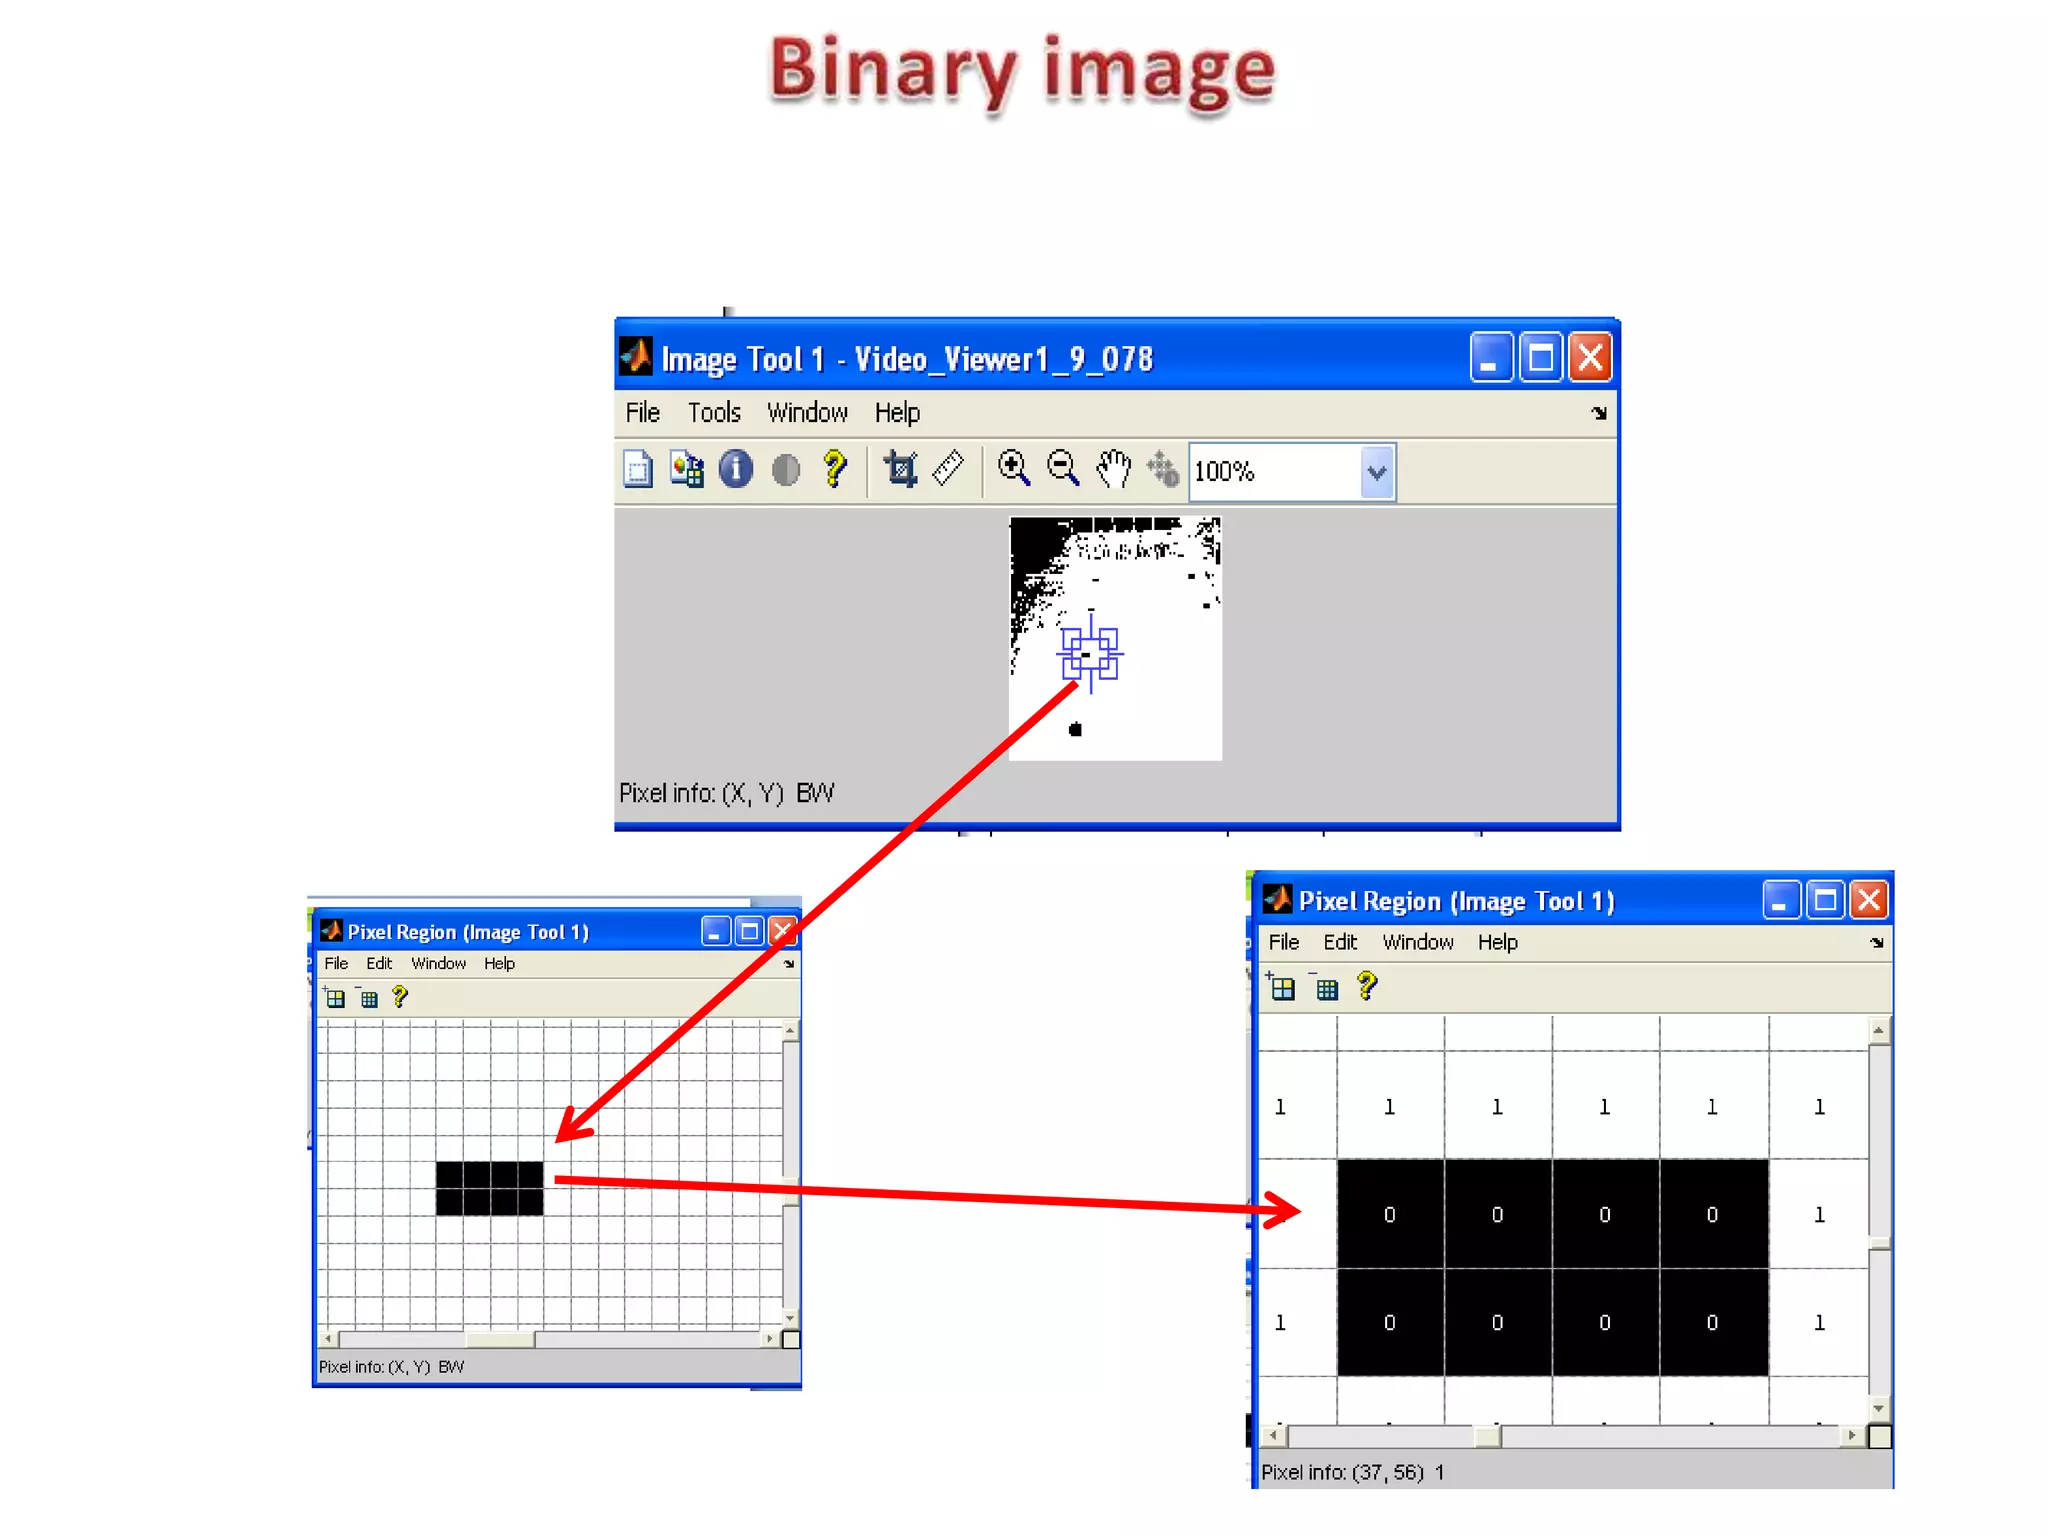
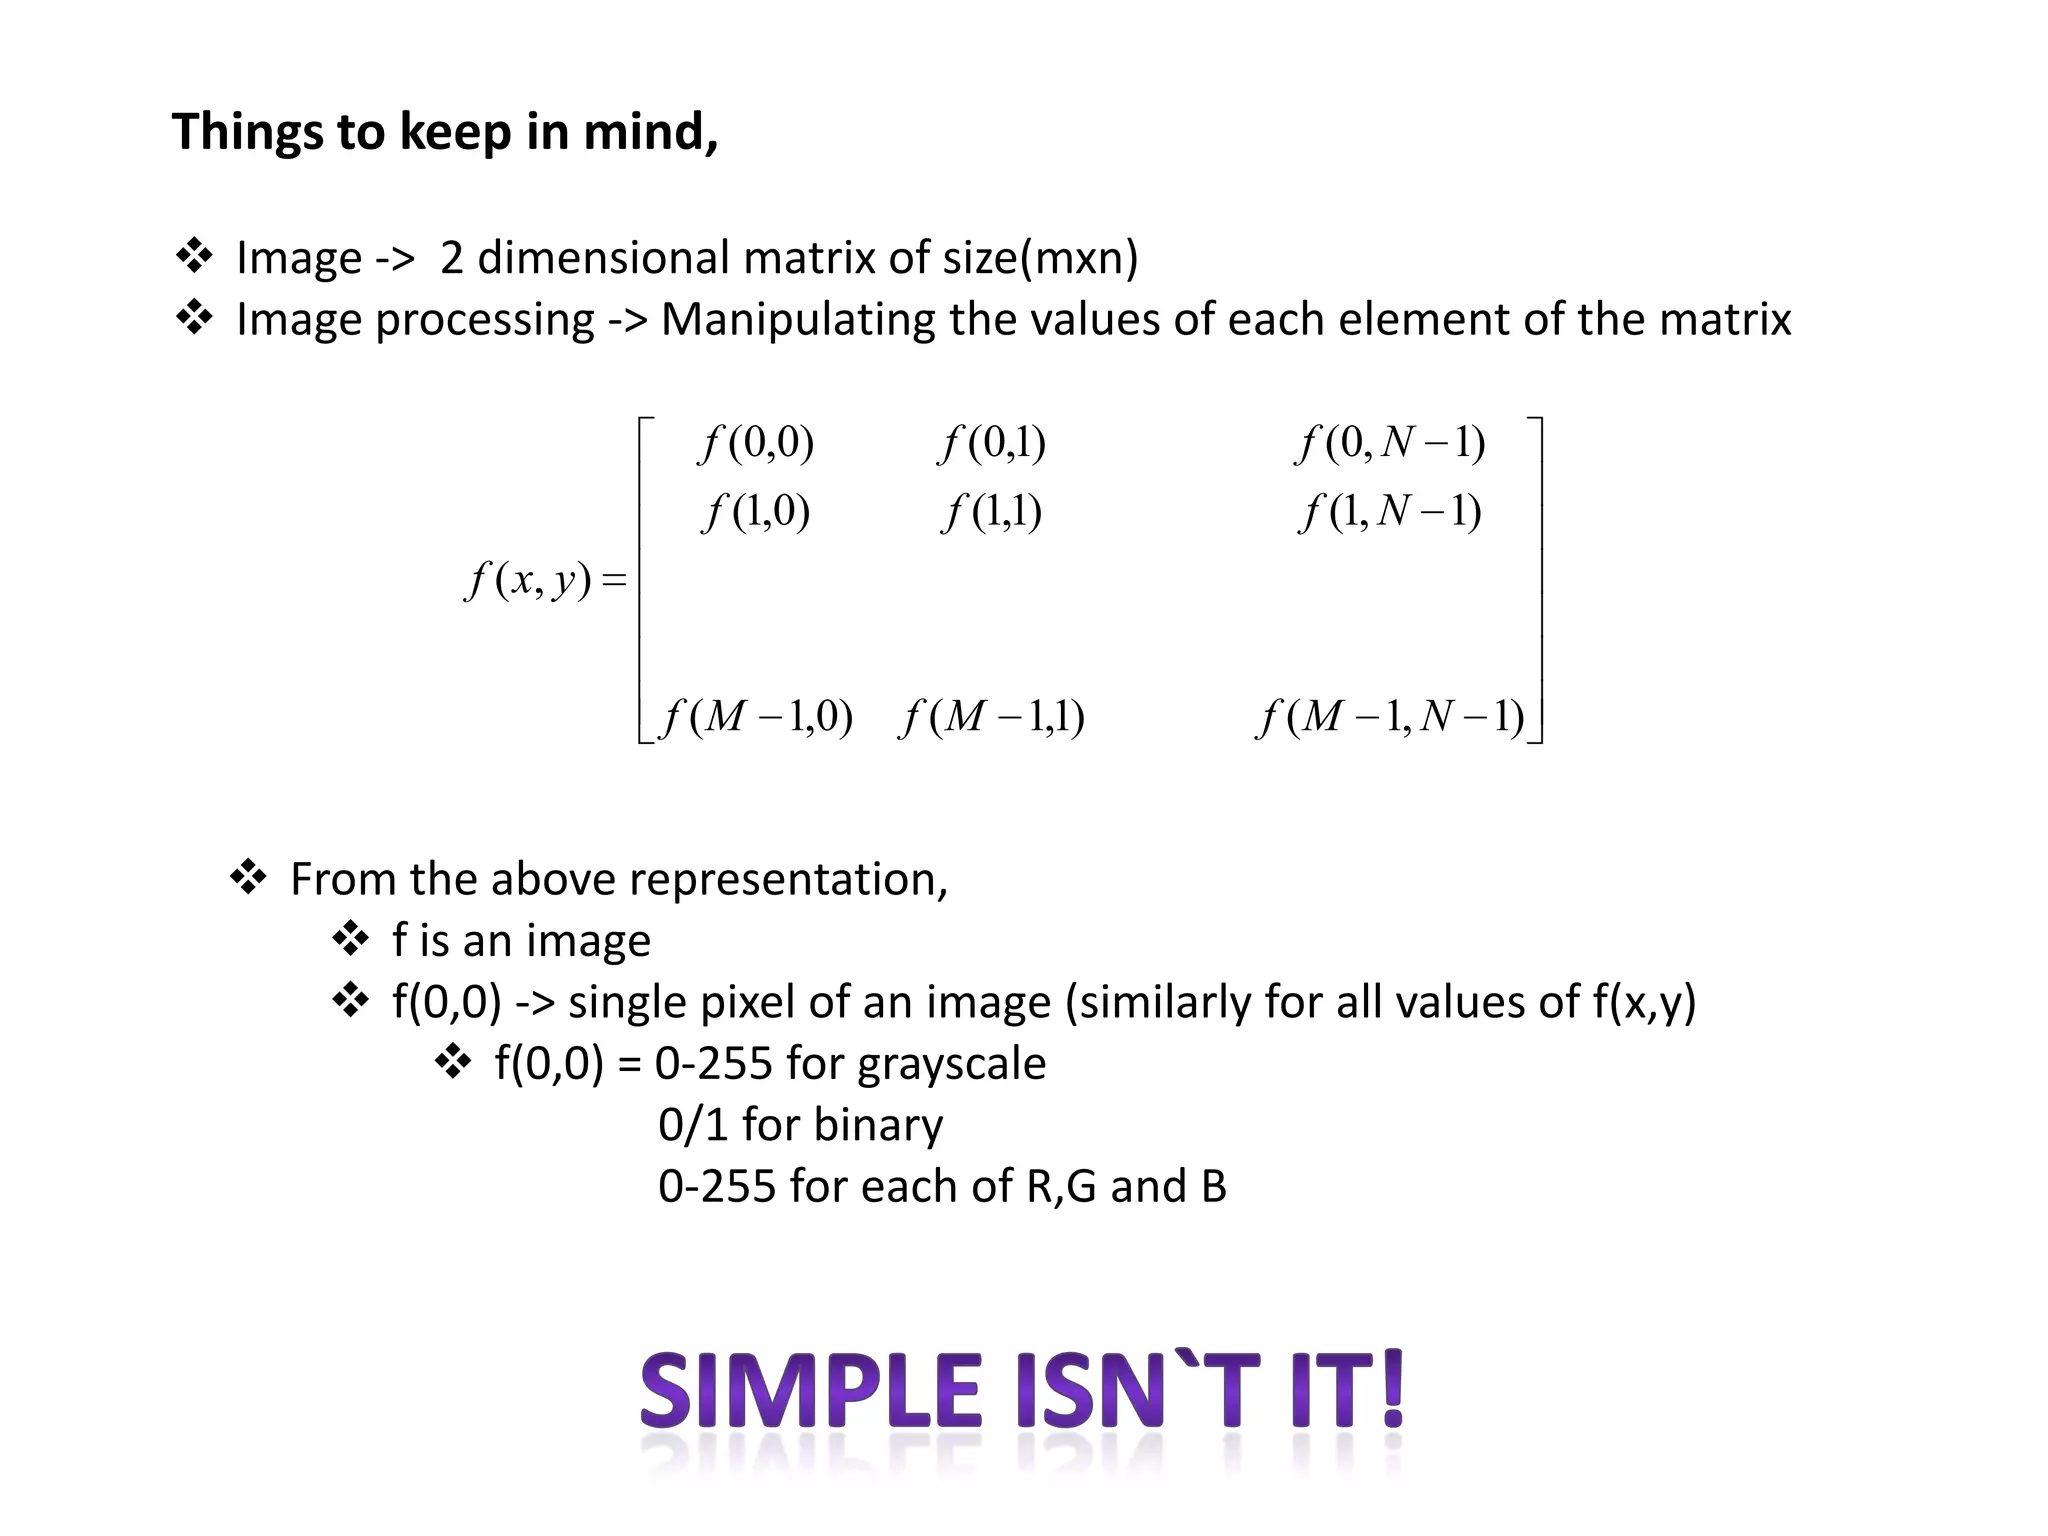
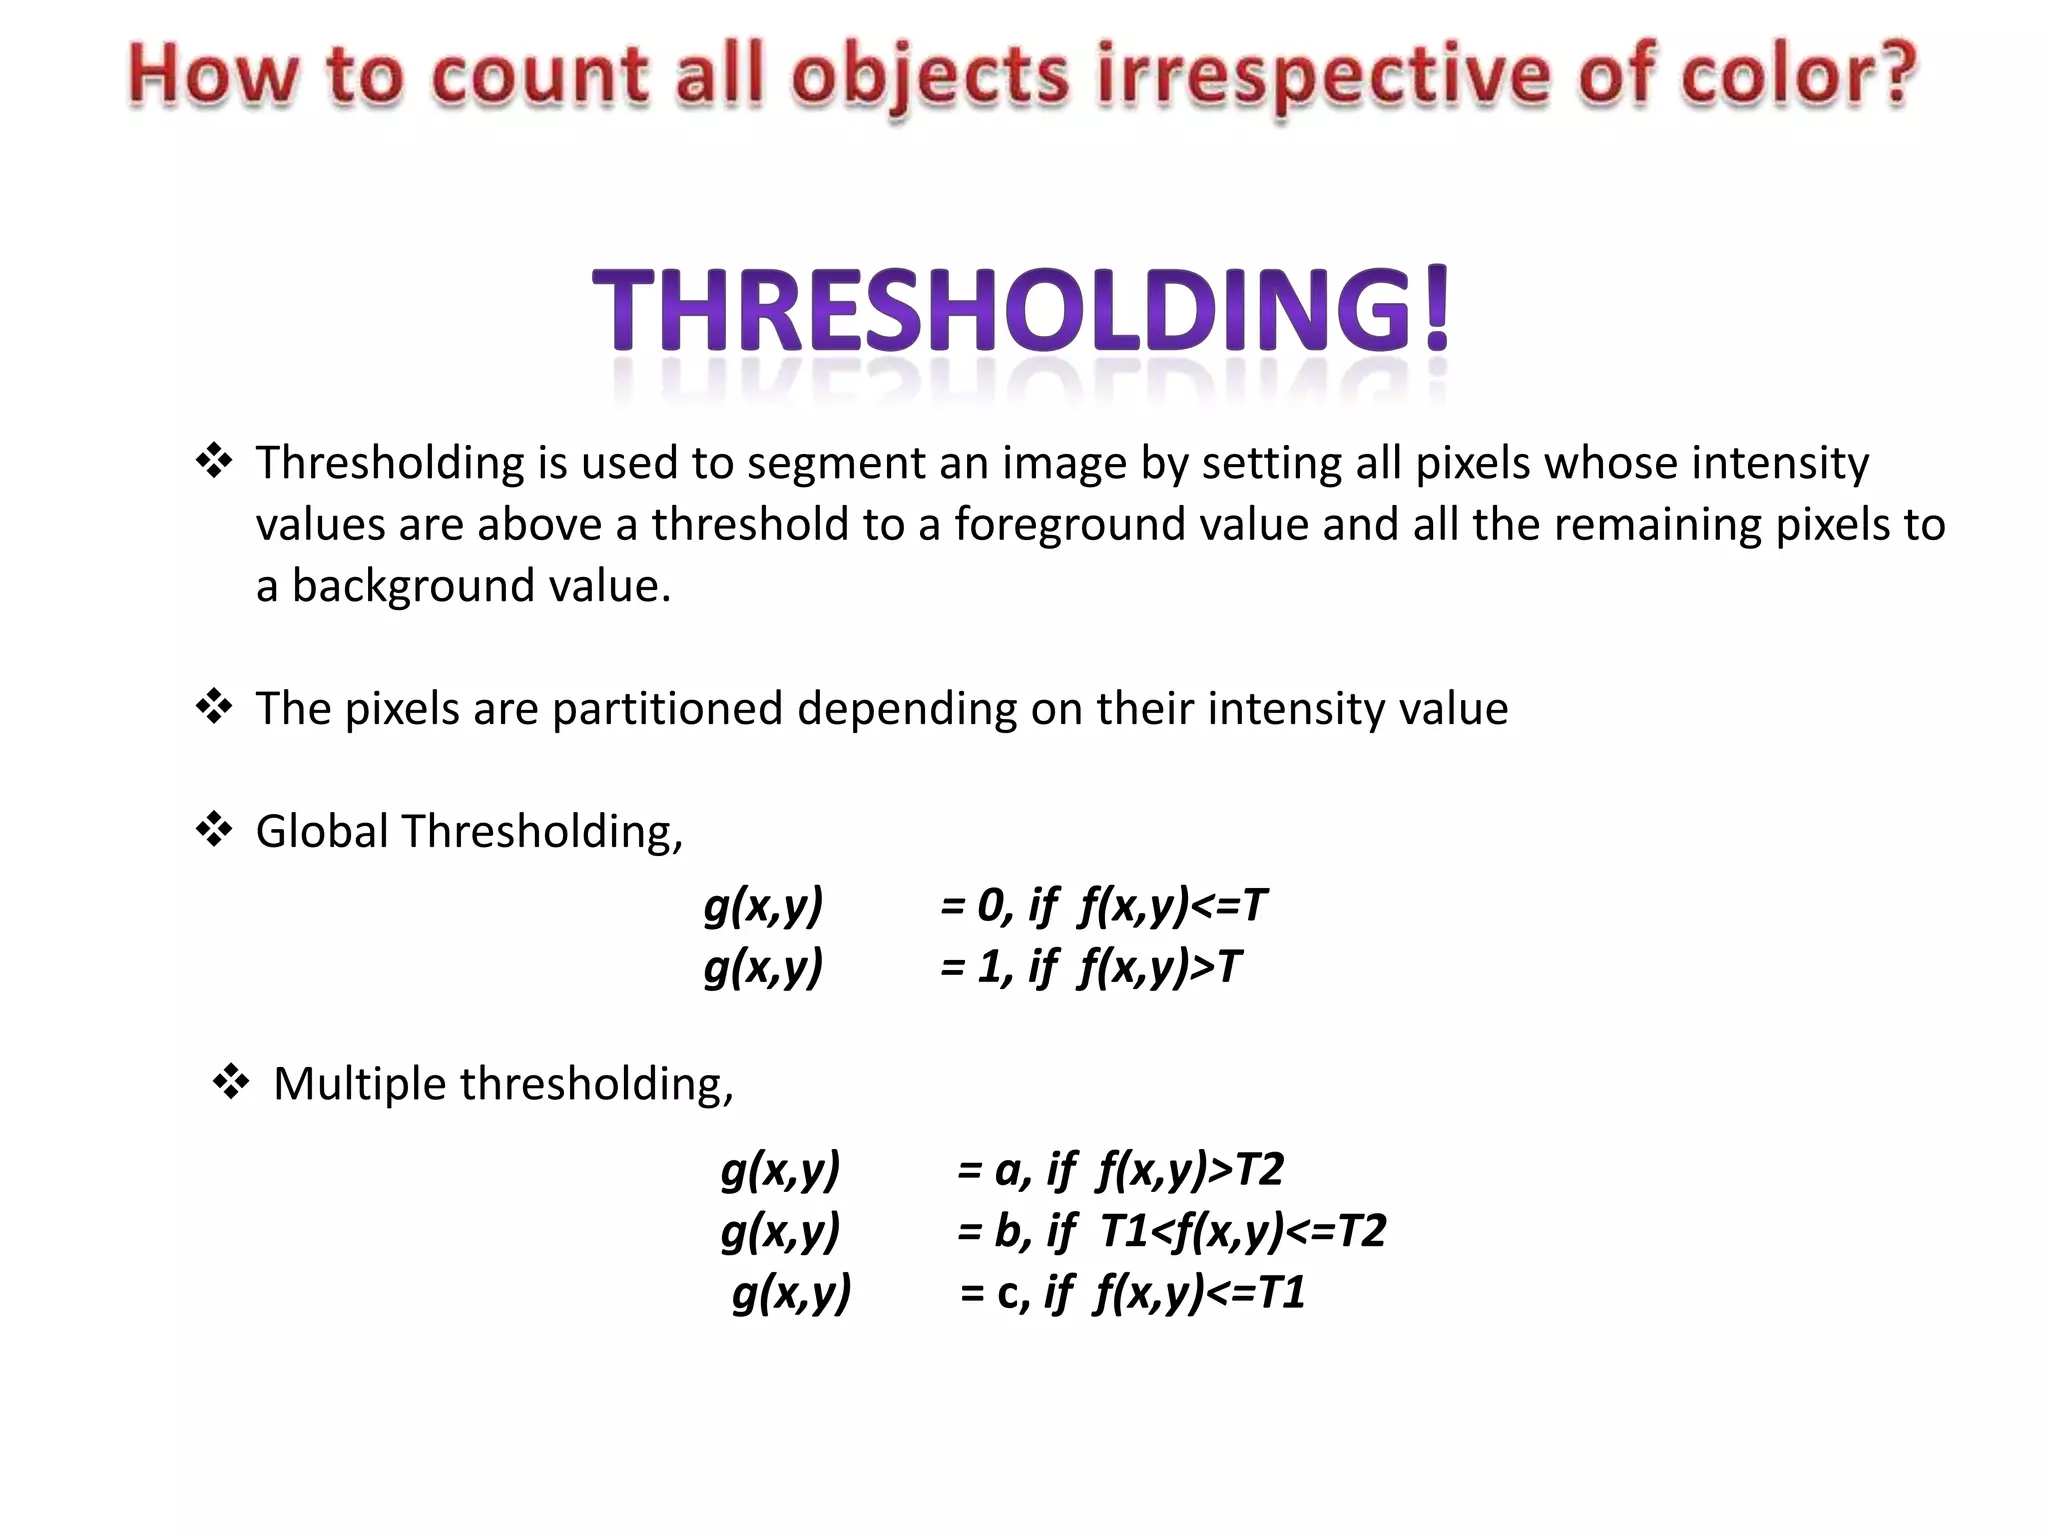
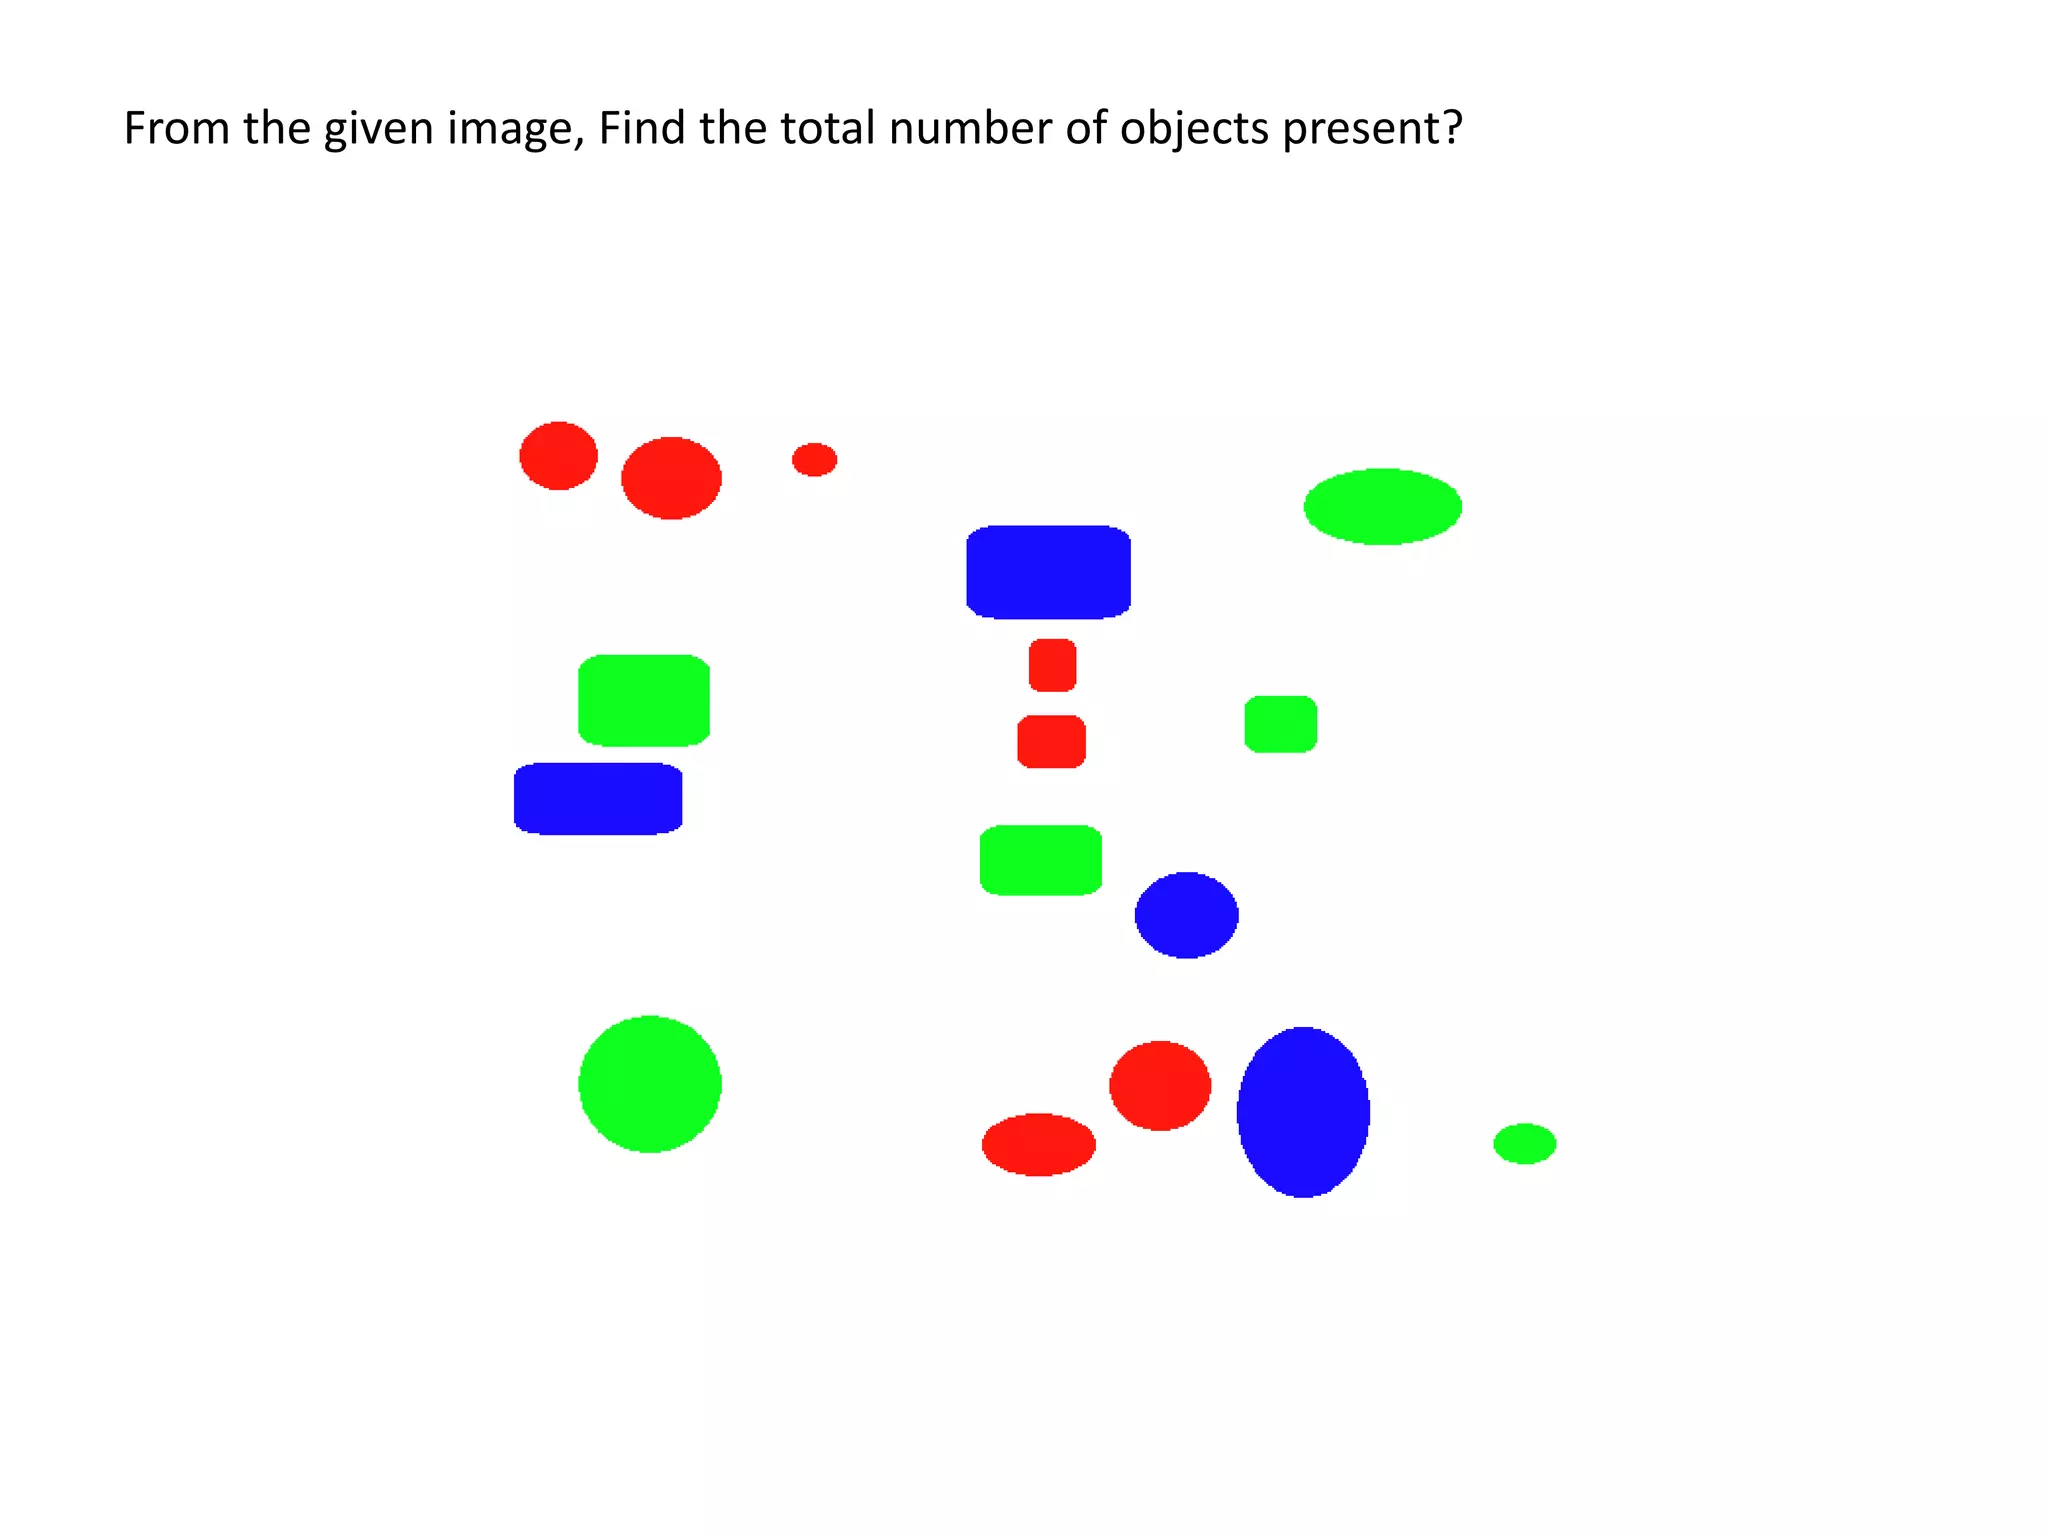
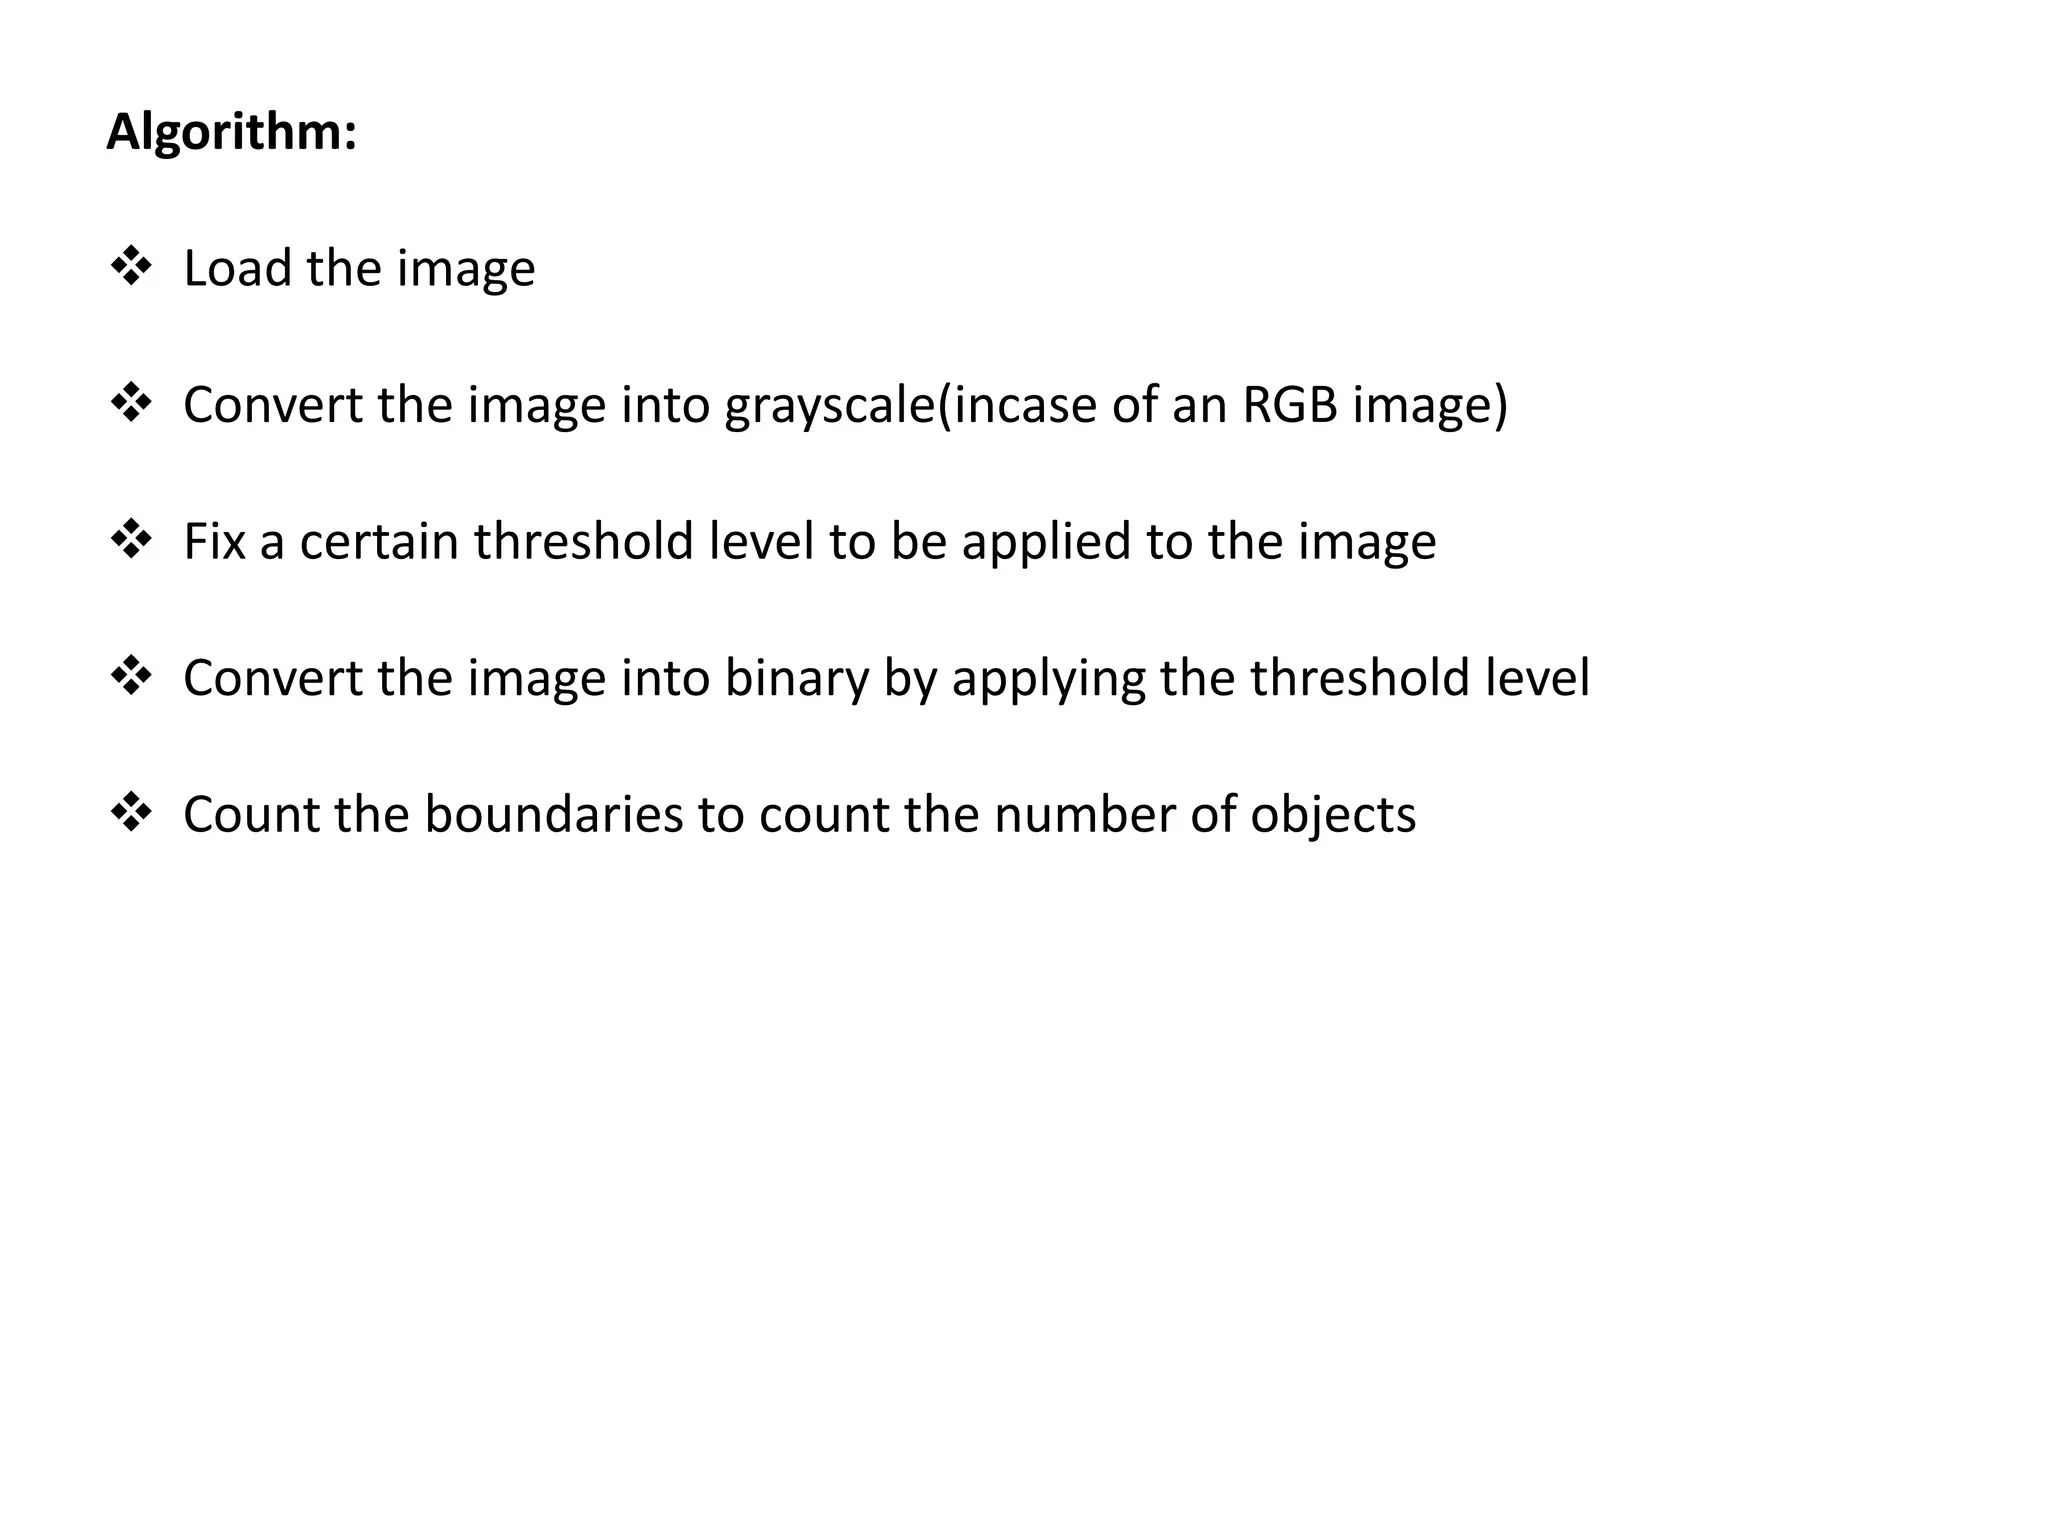
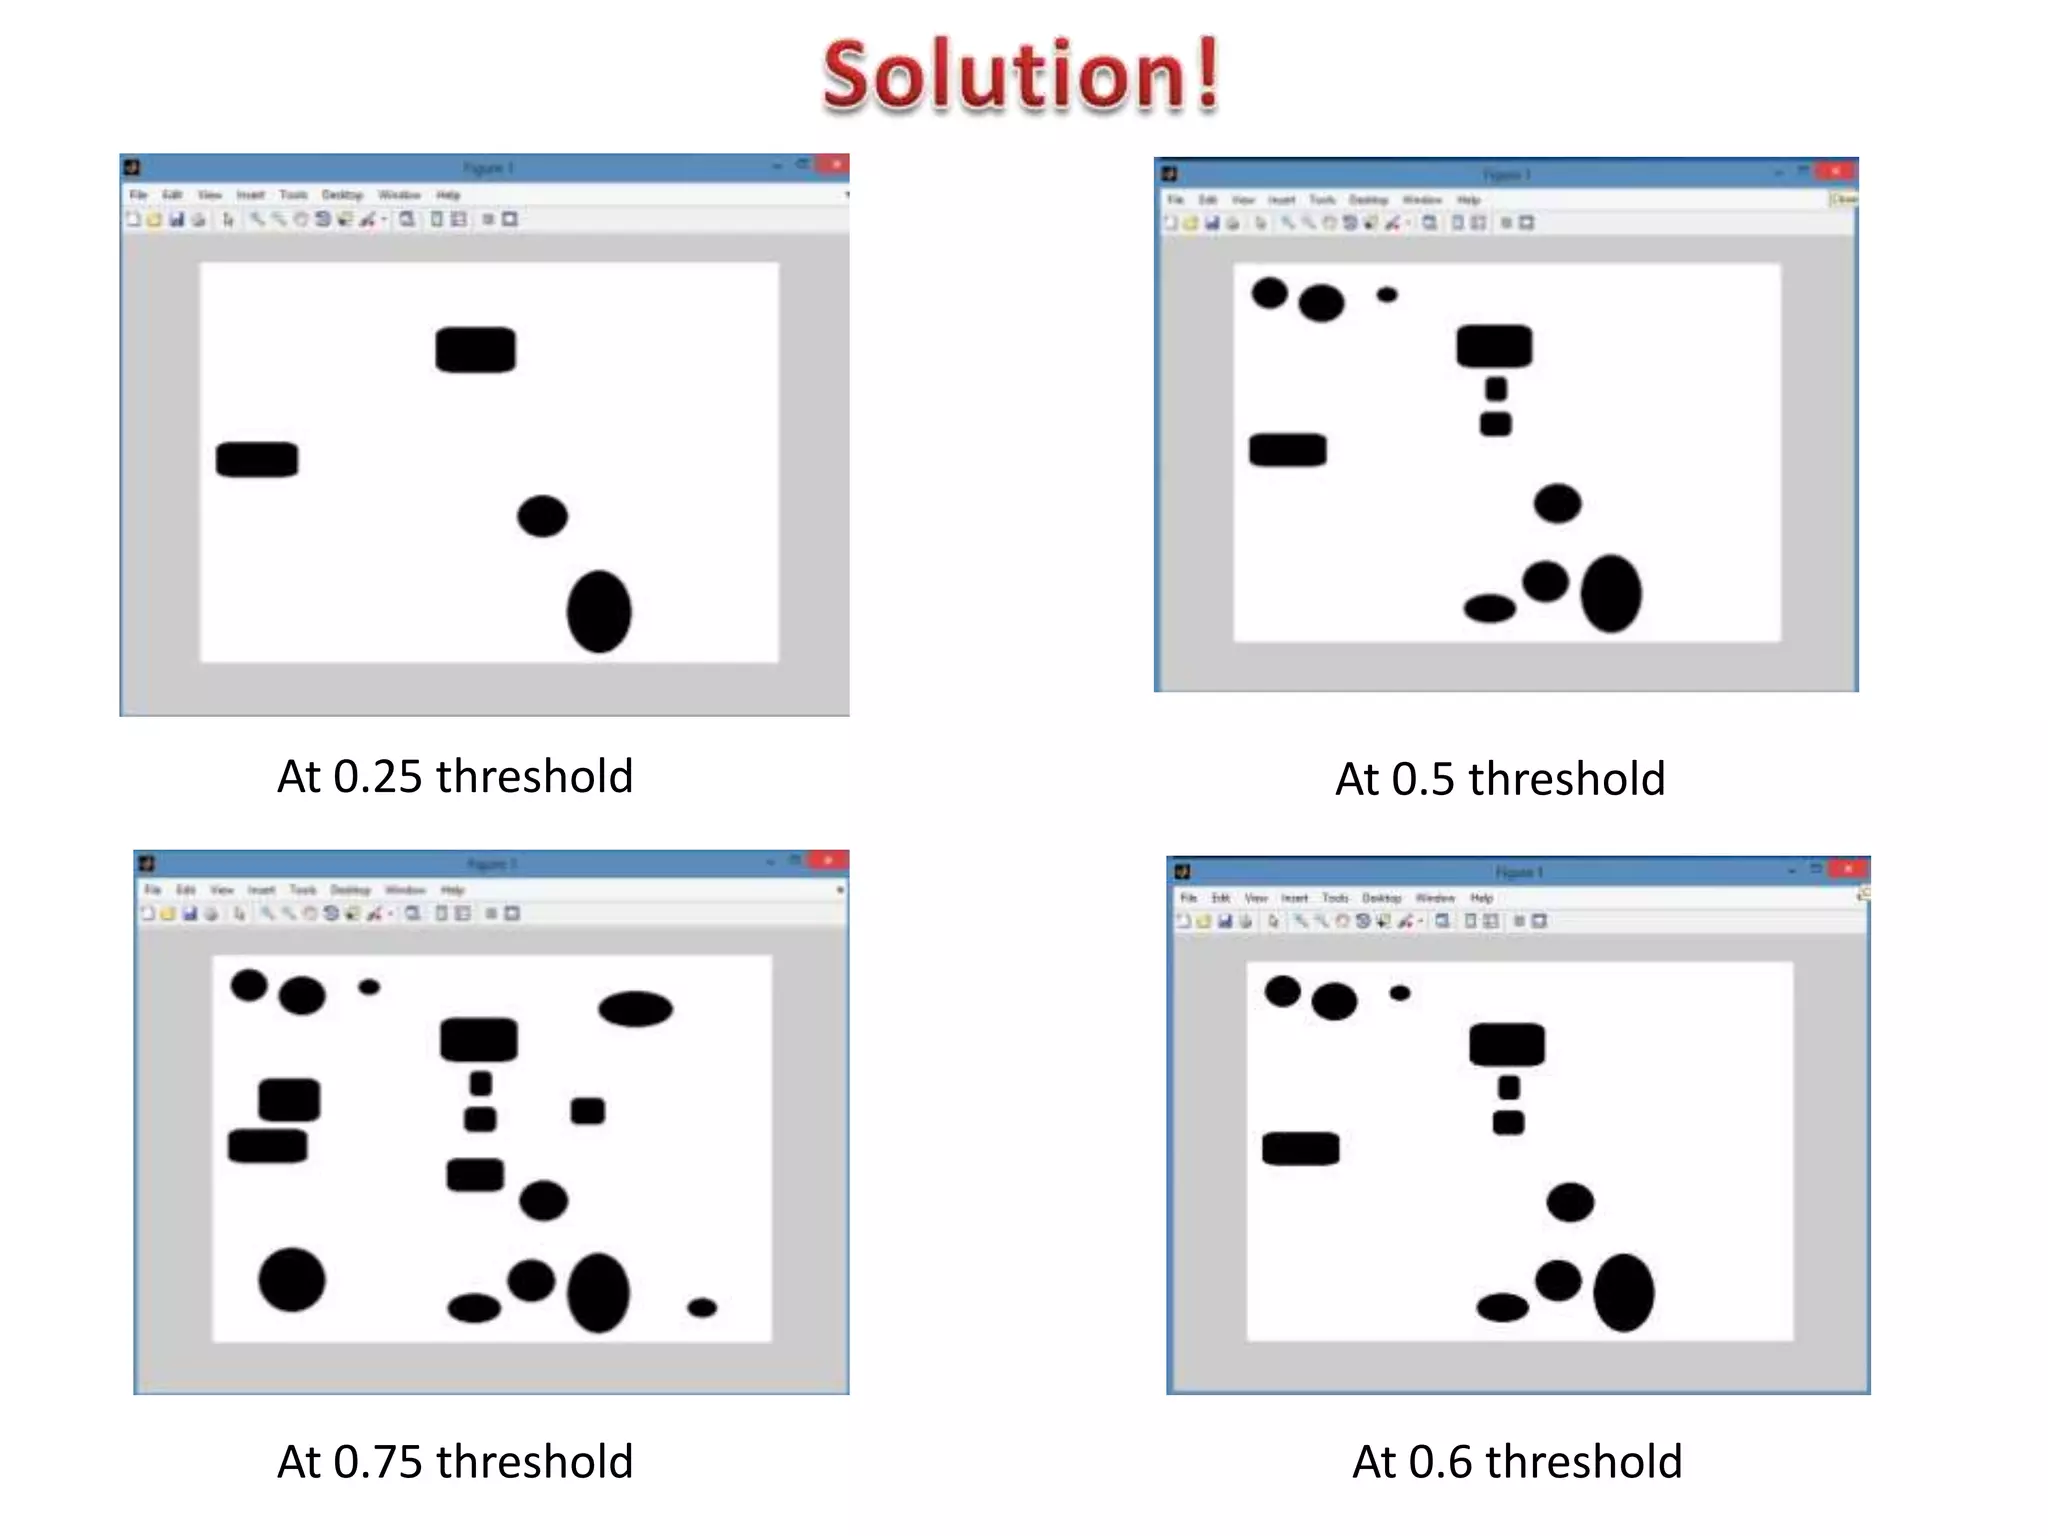
The document discusses various concepts related to computer vision and image processing including: 1. It describes how the human eye works as an optical sensor and the brain acts as a processor to interpret visual signals. 2. It explains different types of images like RGB, grayscale, binary and their pixel representations. 3. It provides algorithms to extract specific colors from an image, count objects, apply thresholding, and perform morphological operations. 4. Concepts of feature detection using kernels and image filtering are also covered along with examples.


